
Submitted:
02 May 2025
Posted:
05 May 2025
You are already at the latest version
Abstract
Objectives: This study aims to examine the relationship between Social Media Use (SMU), Social Media Needs (SMN), and Quality of Life (QoL) among middle-aged and older adults in Nepal, highlighting generational aspects of the digital divide.Study Design: A cross-sectional quantitative study design was employed to assess generational differences in social media usage and perceived quality of life among middle-aged and older adults in an urban Nepali setting.Methods: A purposive sample of 1,000 individuals aged 45 and above, residing in Kathmandu Metropolitan City, was surveyed. Standardized instruments, including the World Health Organization Quality of Life-BREF (WHOQOL-BREF) and the Social Networking Sites Uses and Needs (SNSUN) questionnaire, were administered in Nepali and English. Descriptive and inferential statistics, including regression analysis, were performed using SPSS. Ethical approval was obtained from the Nepal Health Research Council (Ref no. 3039). Results: Among participants, 60% used Facebook and 76.5% used YouTube daily. However, over 60% scored low on diversion, cognitive, affective, personal integrative, and social integrative needs. While 64.4% rated their overall QoL as good, 63% were dissatisfied with physical health, and 51% reported poor psychological well-being. Environmental quality was rated fair or poor by 55%. Weak correlations were found between socio-demographic factors and QoL or SMU/SMN patterns. Conclusions: Despite frequent use of popular social platforms, older adults in Nepal report low social media needs and dissatisfaction in key health domains. Addressing physical, psychological, and environmental deficits alongside digital literacy and tailored content may improve QoL outcomes. Findings suggest targeted interventions across generations.
Keywords:
Social Media
; Quality of Life
; Digital divide
; Generations
; Social Sciences
; Public Health Policies.
1. Introduction
The Department of Statistics Nepal (2021) revealed that the elderly population in Nepal is increasing,¹,² and that older adults are increasingly engaging with social media (SM). It is crucial to improve their quality of life (QoL) and overall well-being (WB).³,⁴ Numerous studies have demonstrated that social media use (SMU) can influence QoL both positively and negatively, depending on usage patterns.⁵⁻⁷ Older adults often face challenges such as aging, illness, retirement, and reduced social contact, which may lead them to use SMU to alleviate loneliness and maintain communication.³,⁸
To better understand the impact of SMU on QoL among senior citizens, this study focuses on generational differences in digital engagement. Although SMU is increasingly recognized as a tool for addressing societal needs and enhancing living standards, research focusing on its effects among older populations remains limited, as most studies emphasize youth.⁴,⁹⁻¹¹
Therefore, aim and scope of this study are to examines patterns of SMU and their relationship with QoL among middle-aged and older adults, offering insights into bridging the digital generation gap and enhancing well-being across age groups.
2. Methods
This study employed a quantitative cross-sectional design to examine the relationship between SMU, SMN, and QoL among middle-aged and older adults. The research was conducted in Ward No. 3, Maharajgunj, within Kathmandu Metropolitan City, Nepal. The inclusion criteria specified individuals aged 45 years and above who were capable of completing a self-administered questionnaire. The sample size was calculated using Cochran’s formula for an unknown population, yielding a total of 1,000 participants. A purposive sampling method was used for data collection. To ensure accessibility and inclusivity, both Nepali and English versions of the questionnaire were administered.
The questionnaire consisted of three sections. The first section collected socio-demographic data, including age, sex, marital status, educational background, and sources of income. The second section measured participants’ QoL using the World Health Organization Quality of Life-BREF (WHOQOL-BREF) instrument. This tool includes 26 items covering four domains: physical health (7 items), psychological well-being (6 items), social relationships (3 items), and environmental conditions (8 items). The first two items assess general QoL and overall health satisfaction on a 5-point Likert scale. Based on scoring guidelines, QoL outcomes were categorized as Very Good (76–100%), Good (51–75%), Medium/Fair (26–50%), or Poor (0–25%).
The third section assessed social media behavior using the validated Social Networking Sites Use and Needs (SNSUN) Scale. This section included 27 items: eight measuring social media use frequency, nine on general needs, and ten items divided among five need domains—diversion, cognitive, affective, personal integrative, and social integrative. Items were rated on a 5-point Likert scale ranging from 1 (strongly disagree) to 5 (strongly agree). Questions 4, 6, and 8 were open-ended and asked in a numeric format. SMU and SMN scores were categorized as low (≤50%) and high (>51%).
The SNSUN Scale demonstrated strong internal consistency with a Cronbach’s alpha of 0.92. The WHOQOL-BREF instrument also showed high reliability across domains, with alpha values of 0.71 for physical health, 0.77 for psychological well-being, 0.80 for social relationships, and 0.89 for environmental conditions. Statistical analyses were performed using SPSS. Descriptive statistics, such as frequencies and percentages, were used to describe the sample. Inferential statistics, including regression analysis, were employed to explore associations between SMU, SMN, and QoL. Ethical approval was obtained from the Nepal Health Research Council (Ref. No. 3039, May 2022). All participants provided informed consent, and confidentiality and autonomy were maintained throughout the study.
Reliability and Validity
The Social Networking Sites Use and Needs (SNSUN) Scale demonstrated high internal consistency, with a Cronbach’s alpha of 0.92 across its five dimensions: diversion, cognitive, affective, personal integrative, and social integrative needs. These dimensions were evaluated to understand the underlying motivations and patterns of social media use among participants.¹⁴,¹⁵
The WHOQOL-BREF instrument showed strong reliability and discriminatory validity. Domain-specific Cronbach’s alpha values were 0.71 for physical health, 0.77 for psychological well-being, 0.80 for social relationships, and 0.89 for environmental quality, indicating good internal consistency.¹²,¹³
Data Analysis
Data were analyzed using IBM SPSS Statistics (version 29.0.2). Descriptive statistics were applied to summarize participant characteristics and distribution patterns. Inferential statistical analyses, including regression models, were employed to explore relationships between social media use, social media needs, and quality of life variables.
Ethical Considerations
The study procedure was reviewed by the IRB or ethics committee of the Nepal Health Research Council (Ref no. 3039, May 2022). Informed consent ensured voluntary participation, confidentiality, and respect for autonomy. All participants provided informed consent prior to data collection. The study ensured participant confidentiality, voluntary participation, and full respect for autonomy in compliance with ethical research standards.
3. Results
This study demonstrated reliability and validity, and conducted data analysis using descriptive and inferential statistics, such as regression, to examine social media needs and use, as well as quality of life, to achieve the study's objectives.
Table 1 shows that 78.1% of participants were aged 45-64, and 58.2% were female. Most were married (92.6%) and had secondary education (33.6%). The primary income source was work (33.6%).
Based on Figure 1, the results demonstrate that the majority of participants use mobile devices for social media.
Table 2: The results indicate that 60% of participants use Facebook daily, while 76.5% use YouTube daily. In contrast, Instagram and Twitter see much lower daily usage, with most participants never using Instagram (88.5%) and Twitter (49.1%).
Figure 2 shows the Participants indicated varying frequencies of notification checks: 75.4% reported doing so 1-9 times, 11.7% more than 9 times, and 3.7% checked on every notification beep.
Table 3 shows that the majority of participants reported low levels of social media needs and use, with more than 50% scoring low across all domains: 68.2% for diversion, 71.0% for cognitive needs, 62.9% for affective needs, 60.9% for personal integrative needs, and 62.1% for social integrative needs. High levels of need were considerably lower, with no domain exceeding 40%, suggesting that most participants engage with social media only minimally for these specific purposes.
Table 4 indicates a generally positive perception of the overall quality of life, with 64.4% of participants rating it as very good or good. However, this contrasts with notable dissatisfaction in health-related domains: 63% rated their physical health and 51% their psychological health as fair or poor. Additionally, 55% of participants assessed their environmental quality as fair or poor, highlighting significant room for improvement in this area.
Table 5 presents the results of the regression analysis, showing that age had a small positive correlation with physical health (r = 0.064) and environmental health (r = 0.052). Gender demonstrated a modest positive correlation with environmental health (r = 0.075), while income source showed a slight positive correlation with physical health (r = 0.032).
4. Discussion
The findings of this study offer valuable insights into the relationship between SMU, SMN, and QoL among middle-aged and older adults in Nepal. Using validated tools and robust statistical methods, this research contributes to the growing body of evidence exploring digital engagement in aging populations. It provides context-specific data relevant to South Asia. The results on SMU, and SMN show that most participants primarily accessed social media through mobile devices, with Facebook (60%) and YouTube (76.5%) being the most frequently used platforms. This pattern aligns with global studies, including those by James and Harville (2018) and Marzo et al. (2024), which identified Facebook and YouTube as the dominant platforms among older adults.¹³,¹⁶ In contrast, Instagram and Twitter were significantly underutilized, with 88.5% and 49.1% of participants, respectively, reporting no use. These differences may stem from age-related preferences, perceived relevance, and usability concerns associated with specific platforms.³,¹⁷,¹⁸
Participants also demonstrated consistently low social media needs across all dimensions: diversion (68.2%), cognitive (71.0%), affective (62.9%), personal integrative (60.9%), and social integrative (62.1%). These findings are consistent with prior research indicating that older adults often engage with social media for specific, limited purposes rather than broad social interaction or entertainment.⁸,¹³,¹⁹ The pattern observed suggests a selective and goal-oriented use of social media, as previously noted in studies of aging populations.⁴,⁵
The perceived overall QoL was relatively positive, with 64.4% of participants rating it as very good or good. However, there was notable dissatisfaction in the domains of physical health (63% rated it as fair or poor) and psychological health (51% rated it as fair or poor). This divergence highlights the complexity of aging: while older adults may express general satisfaction with life, underlying health challenges often diminish specific aspects of well-being. This observation is consistent with prior literature suggesting that subjective well-being may not fully capture latent health issues.⁶,²⁰,²¹
The Environmental Quality shows the results from 55% of participants rated environmental quality as fair or poor, suggesting that many older adults perceive deficiencies in their immediate surroundings. These results align with research from both urban and rural settings in China, where environmental conditions significantly influenced older adults’ QoL.²²,²³ This highlights the need for improved infrastructure, safer neighborhoods, and more age-friendly community services. Regression analysis findings revealed minimal but noteworthy correlations between socio-demographic factors and both SMU and QoL outcomes. Age showed small positive correlations with physical health (r = 0.064) and environmental health (r = 0.052), possibly reflecting the stability and adaptation found in older cohorts with established routines and social support.²² Gender also exhibited a slight positive correlation with environmental health (r = 0.075), echoing previous findings that suggest gender differences in health-related perceptions.²²
Marital status displayed a positive correlation with diversion (r = 0.041) and a negative correlation with personal integrative needs (r = –0.070), implying that married individuals may use social media more for social interaction than for enhancing status or self-promotion.²³,²⁴ These findings are supported by prior research demonstrating that relationship status influences both the frequency and motivation behind social media use.25,26 Research on climate change and extreme weather events with dust transport reveals that airborne particulate matter can exacerbate chronic inflammatory conditions and modulate immune responses, 27, 28 potentially contributing to hematologic malignancies like adverse effects on QoL via indirect pathways. 29 AI-driven assessments of occupational hazards highlight the complex burden faced by at-risk professionals, emphasizing the need to investigate social life as a direct risk factor on public health, especially students and the healthcare workforce. 30 The sensitive population at educational institutions is part of a complex exposure correlated with the link between emotional intelligence, education level, and quality of life. 30, 31
Future research and Suggestions
Social media platforms have the potential to play a significant role in promoting health and wellness among middle-aged and older adults. By developing tailored content, integrating digital health programs, and addressing environmental challenges, these platforms can help improve user engagement and overall quality of life. Such initiatives include virtual exercise classes, mental health resources, and online community support groups. Additionally, educational campaigns can empower older adults to use social media safely and effectively, thereby enhancing their digital participation and access to beneficial content. Policy interventions that promote inclusivity and protect against ageism are also essential for creating a more supportive and equitable online environment for older users.
Limitations of the Study's
This study has several limitations that should be acknowledged. First, the sample was predominantly composed of middle-aged and older adults, which may limit generalizability to younger populations. Second, the study relied on self-reported data, which may introduce response bias. Third, the cross-sectional design precludes any inference of causality between social media use and quality of life. Additionally, the study did not investigate platform-specific features that may influence user satisfaction or engagement. Future research should consider longitudinal designs to explore causal relationships and include comparative analyses across different social media platforms. Cross-cultural studies are also recommended to broaden the understanding of digital behavior and its effects on quality of life in diverse sociocultural contexts.
5. Conclusions
This study examined the relationship between social media use (SMU), social media needs (SMN), and quality of life (QoL) among middle-aged and older adults. Although engagement with platforms such as Facebook and YouTube was high, overall SMN within this demographic remained relatively low. Despite a generally positive perception of QoL, participants reported notable challenges in physical and psychological health as well as environmental quality. The complexity of these associations, particularly in relation to age, gender, and marital status, underscores the need for targeted interventions. These may include age-sensitive social media content, health and wellness programs, environmental improvements, and digital literacy campaigns aimed at enhancing well-being among older adults. Future research should incorporate more diverse populations, utilize objective assessment tools, and employ longitudinal designs to explore further how social media engagement can support QoL in aging communities.
Author Contributions
PT, AV, PS, RB, AC, RK, SKS, GB, PTS, and IA screened the titles, abstracts, and full texts and extracted data. Assessment and statistical analysis and wrote the initial draft of the manuscript PT, AV, PS, RB, AC, RK, SKS, GB, PTS, and IA contributed to the revision of the manuscript, provided critical feedback. Conceptualization and writing of the first draft edited and reviewed the manuscript, designed the research question and analytical approach from PT, AV, PS, RB, AC, RK, SKS, GB, PTS, and IA. Supervision PP, and IA. Project Administration IA. All authors had full access to all the data in the study and approved the final version, reviewed, edited, and approved the final manuscript.
Funding
This study did not get any funding.
Acknowledgement
We express our gratitude to the Heal-Link for their direct support to cover the APC for Open Gold Access of this article if published the article under agreement with Elsevier Publisher Additionally, we would like to express our appreciation to the, Editor-in-Chief, Editors, and reviewers for their valuable feedback and insightful suggestions for improving this article.
Conflicts of Interest
The authors declare no conflicts of interest.
References
- Sorrel, AL. Nepal population and housing census 2011. Cent Bur Stat. 2012;1(3):1–270.
- Rai S, Chalaune A. A Bibliography on Nepal’s Population and Housing Census and Demography. 1–21.
- Teng CE, Joo TM. Analyzing the usage of social media: A study on elderly in Malaysia. J Humanit Soc Sci. 2017;11(3):737–43.
- Haris N, Majid RA, Abdullah N, Osman R. The role of social media in supporting elderly quality daily life. Proc - 2014 3rd Int Conf User Sci Eng Exp Eng Engag i-USEr 2014. 2015;253–7.
- Karim F, Oyewande A, Abdalla LF, Chaudhry Ehsanullah R, Khan S. Social Media Use and Its Connection to Mental Health: A Systematic Review. Cureus. 2020;12(6).
- Ostic D, Qalati SA, Barbosa B, Shah SMM, Galvan Vela E, Herzallah AM, et al. Effects of Social Media Use on Psychological Well-Being: A Mediated Model. Front Psychol. 2021;12(June).
- Beyens I, Pouwels JL, van Driel II, Keijsers L, Valkenburg PM. The effect of social media on well-being differs from adolescent to adolescent. Sci Rep [Internet]. 2020;10(1):1–11.
- Lin YY, Huang CS. Aging in Taiwan: Building a society for active aging and aging in place. Gerontologist. 2016;56(2):176–83.
- Sharma M, Kautish S. Social Networking Sites and Their Impact on Life Satisfaction: A Case Study of Kathmandu. 2021;3(1):32–44.
- Saini N, Sangwan G, Verma M, Kohli A, Kaur M, Lakshmi PVM. Effect of Social Networking Sites on the Quality of Life of College Students: A Cross-Sectional Study from a City in North India. Sci World J. 2020;2020.
- GoN. Ministry of Communication and Information Technology. 2019 Digital Nepal Framework : Unlocking Nepal’s Growth Potential. 2019 Digit Nepal Framew Unlocking Nepal’s Growth Potential [Internet]. 2019;360. Available from: https://mocit.gov.np/application/resources/admin/uploads/source/EConsultation/EN Digital Nepal Framework V8.4 15 July 2019.
- Nakane Y, Tazaki M, Miyaoka E. Whoqol. Iryo To Shakai. 1999;9(1):123–31.
- Marzo RR, Jun Chen HW, Ahmad A, Thew HZ, Choy JS, Ng CH, et al. The evolving role of social media in enhancing quality of life: a global perspective across 10 countries. Arch Public Heal. 2024;82(1).
- Gupta S, Bashir L. Social networking usage questionnaire: Development and validation. Turkish Online J Distance Educ. 2018;19(4):214–27.
- Ali I, Danaee M, Firdaus A. Social networking sites usage & needs scale (Snsun): A new instrument for measuring social networking sites’ usage patterns and needs. J Inf Telecommun [Internet]. 2020;4(2):151–74. Available from. [CrossRef]
- Schemer C, Masur PK, Geiß S, Müller P, Schäfer S. The Impact of Internet and Social Media Use on Well-Being: A Longitudinal Analysis of Adolescents Across Nine Years. J Comput Commun. 2021;26(1):1–21.
- James DCS, Harville C. Smartphone Usage, Social Media Engagement, and Willingness to Participate in mHealth Weight Management Research Among African American Women. Heal Educ Behav. 2018;45(3):315–22. [CrossRef]
- Zhang, M. Older people’s attitudes towards emerging technologies: A systematic literature review. Public Underst Sci. 2023;32(8):948–68.
- Lee L, Maher M Lou. Factors affecting the initial engagement of older adults in the use of interactive technology. Int J Environ Res Public Health. 2021;18(6):1–22. [CrossRef]
- Bhatiasevi, V. The uses and gratifications of social media and their impact on social relationships and psychological well-being. Front Psychiatry. 2024;15(March):1–13. 10.3389/fpsyt.2024.1260565.
- Risal A, Manandhar S, Manandhar K, Manandhar N, Kunwar D, Holen A. Quality of life and its predictors among aging people in urban and rural Nepal. Qual Life Res [Internet]. 2020;29(12):3201–12. [CrossRef]
- Ganesh Kumar S, Majumdar A, Pavithra G. Quality of life and its associated factors using WHOQOL- BREF among elderly in Urban Puducherry, India. J Clin Diagnostic Res. 2014;8(1):54–7. [CrossRef]
- Riad A, Lu J, Del Olmo García F, Li D, Shen T, Hu Z, et al. OPEN ACCESS EDITED BY The impact of social support on the quality of life among older adults in China: An empirical study based on the eeee CFPS. 2020;1–12. [CrossRef]
- Liu D, Xi J, Hall BJ, Fu M, Zhang B, Guo J, et al. Attitudes toward aging, social support and depression among older adults: Difference by urban and rural areas in China. J Affect Disord [Internet]. 2020;274:85–92. [CrossRef]
- Lee ZWY, Cheung CMK, Thadani DR. An investigation into the problematic use of Facebook. Proc Annu Hawaii Int Conf Syst Sci. 2012;1768–76. [CrossRef]
- Christensen, SP. Social media use and its impact on relationships and emotions. All Theses Diss [Internet]. 2018;1–73. Available from: https://scholarsarchive.byu.edu/etd.
- Adamopoulos IP, Syrou NF, Mijwil M, Thapa P, Ali G, Dávid LD. Quality of indoor air in educational institutions and adverse public health in Europe: A scoping review. ELECTRON J GEN MED. 2025;22(2):em632. [CrossRef]
- Adamopoulos, I.; Syrou, N.; Vito, D. Climate Change Risks and Impacts on Public Health Correlated with Air Pollution—African Dust in South Europe. Med. Sci. Forum 2025, 33, 1. [Google Scholar] [CrossRef]
- Adamopoulos, I.; Valamontes, A.; Tsirkas, P.; Dounias, G. Predicting Workplace Hazard, Stress and Burnout Among Public Health Inspectors: An AI-Driven Analysis in the Context of Climate Change. Eur. J. Investig. Health Psychol. Educ. 2025, 15, 65. [Google Scholar] [CrossRef]
- Karageorgaki E, Adamopoulos IP, Valamontes A. Organizational behavior in the healthcare environment: A study of psychiatric services. ELECTRON J GEN MED. 2025;22(4):em652. [CrossRef]
- Thapa PP, Thapa A, Ekrem EC, Bista AT, Lamichhane N, Adamopoulos IP. Analyzing the link between emotional intelligence, education level, and quality of life in women of reproductive age. ELECTR J MED ED TE. 2024;17(3):em2406. [CrossRef]
Figure 1.
The Device you use for social media.
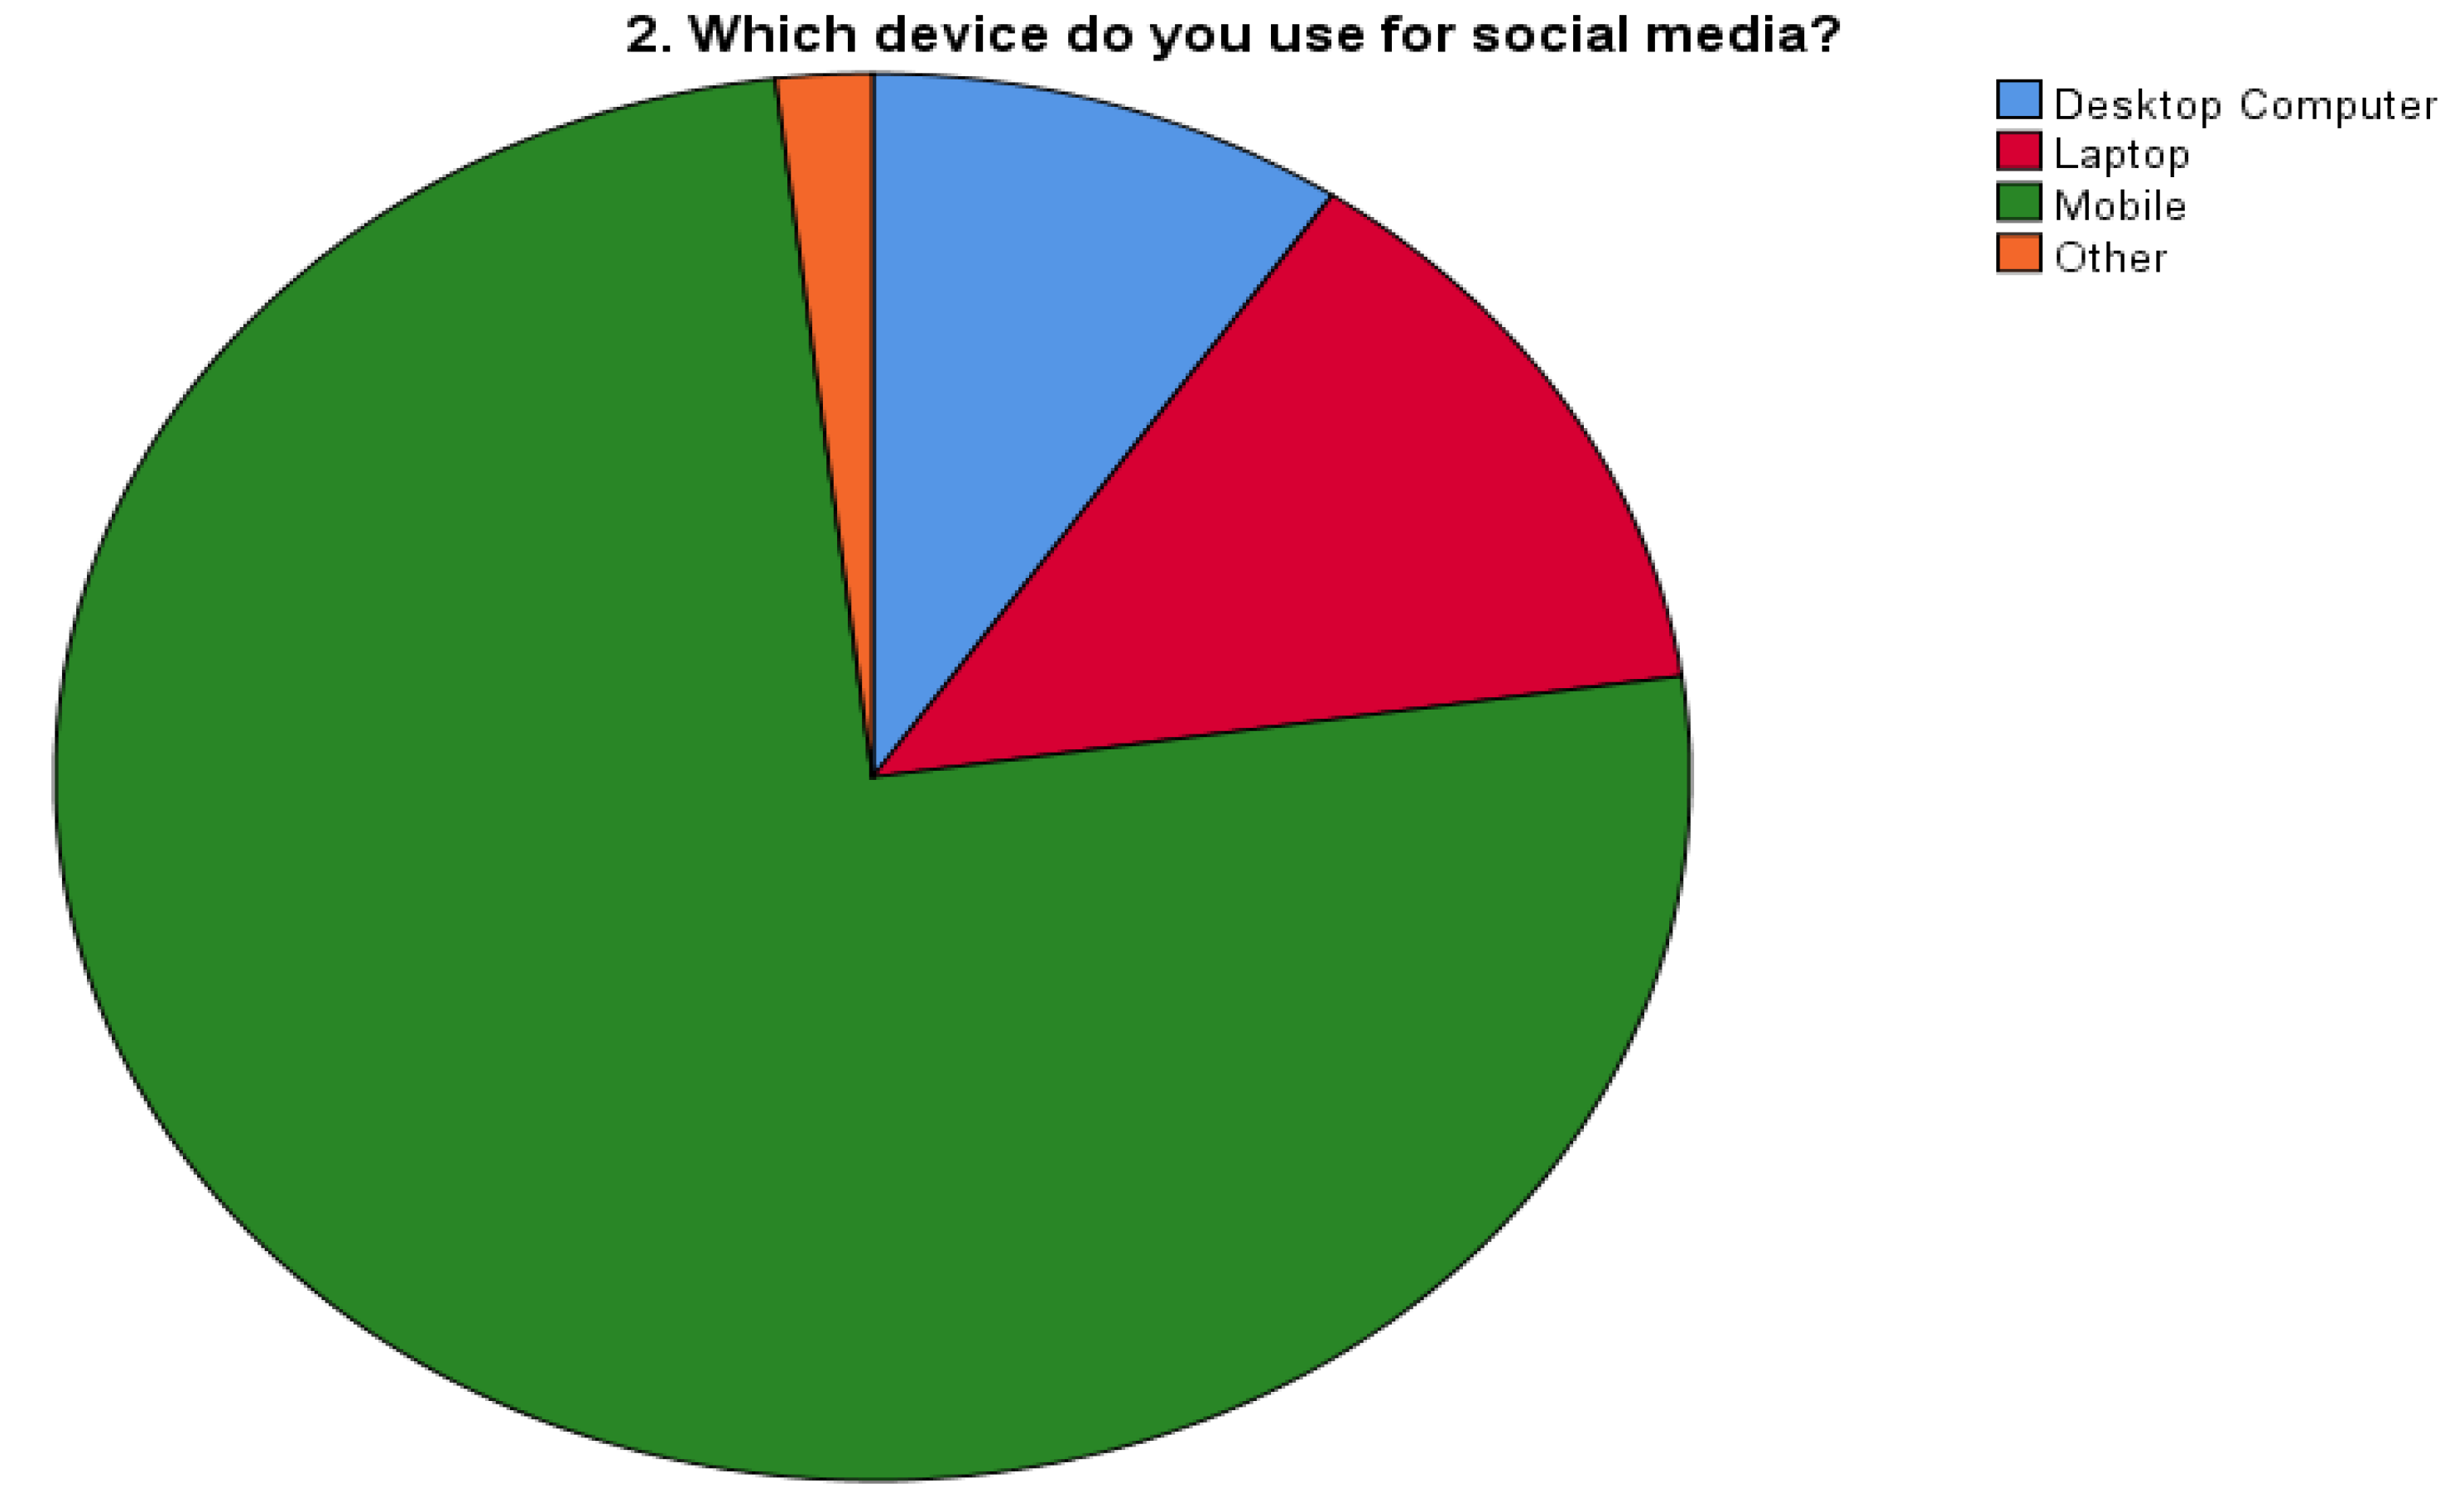
Figure 2.
Participants indicated varying frequencies of notification checks.
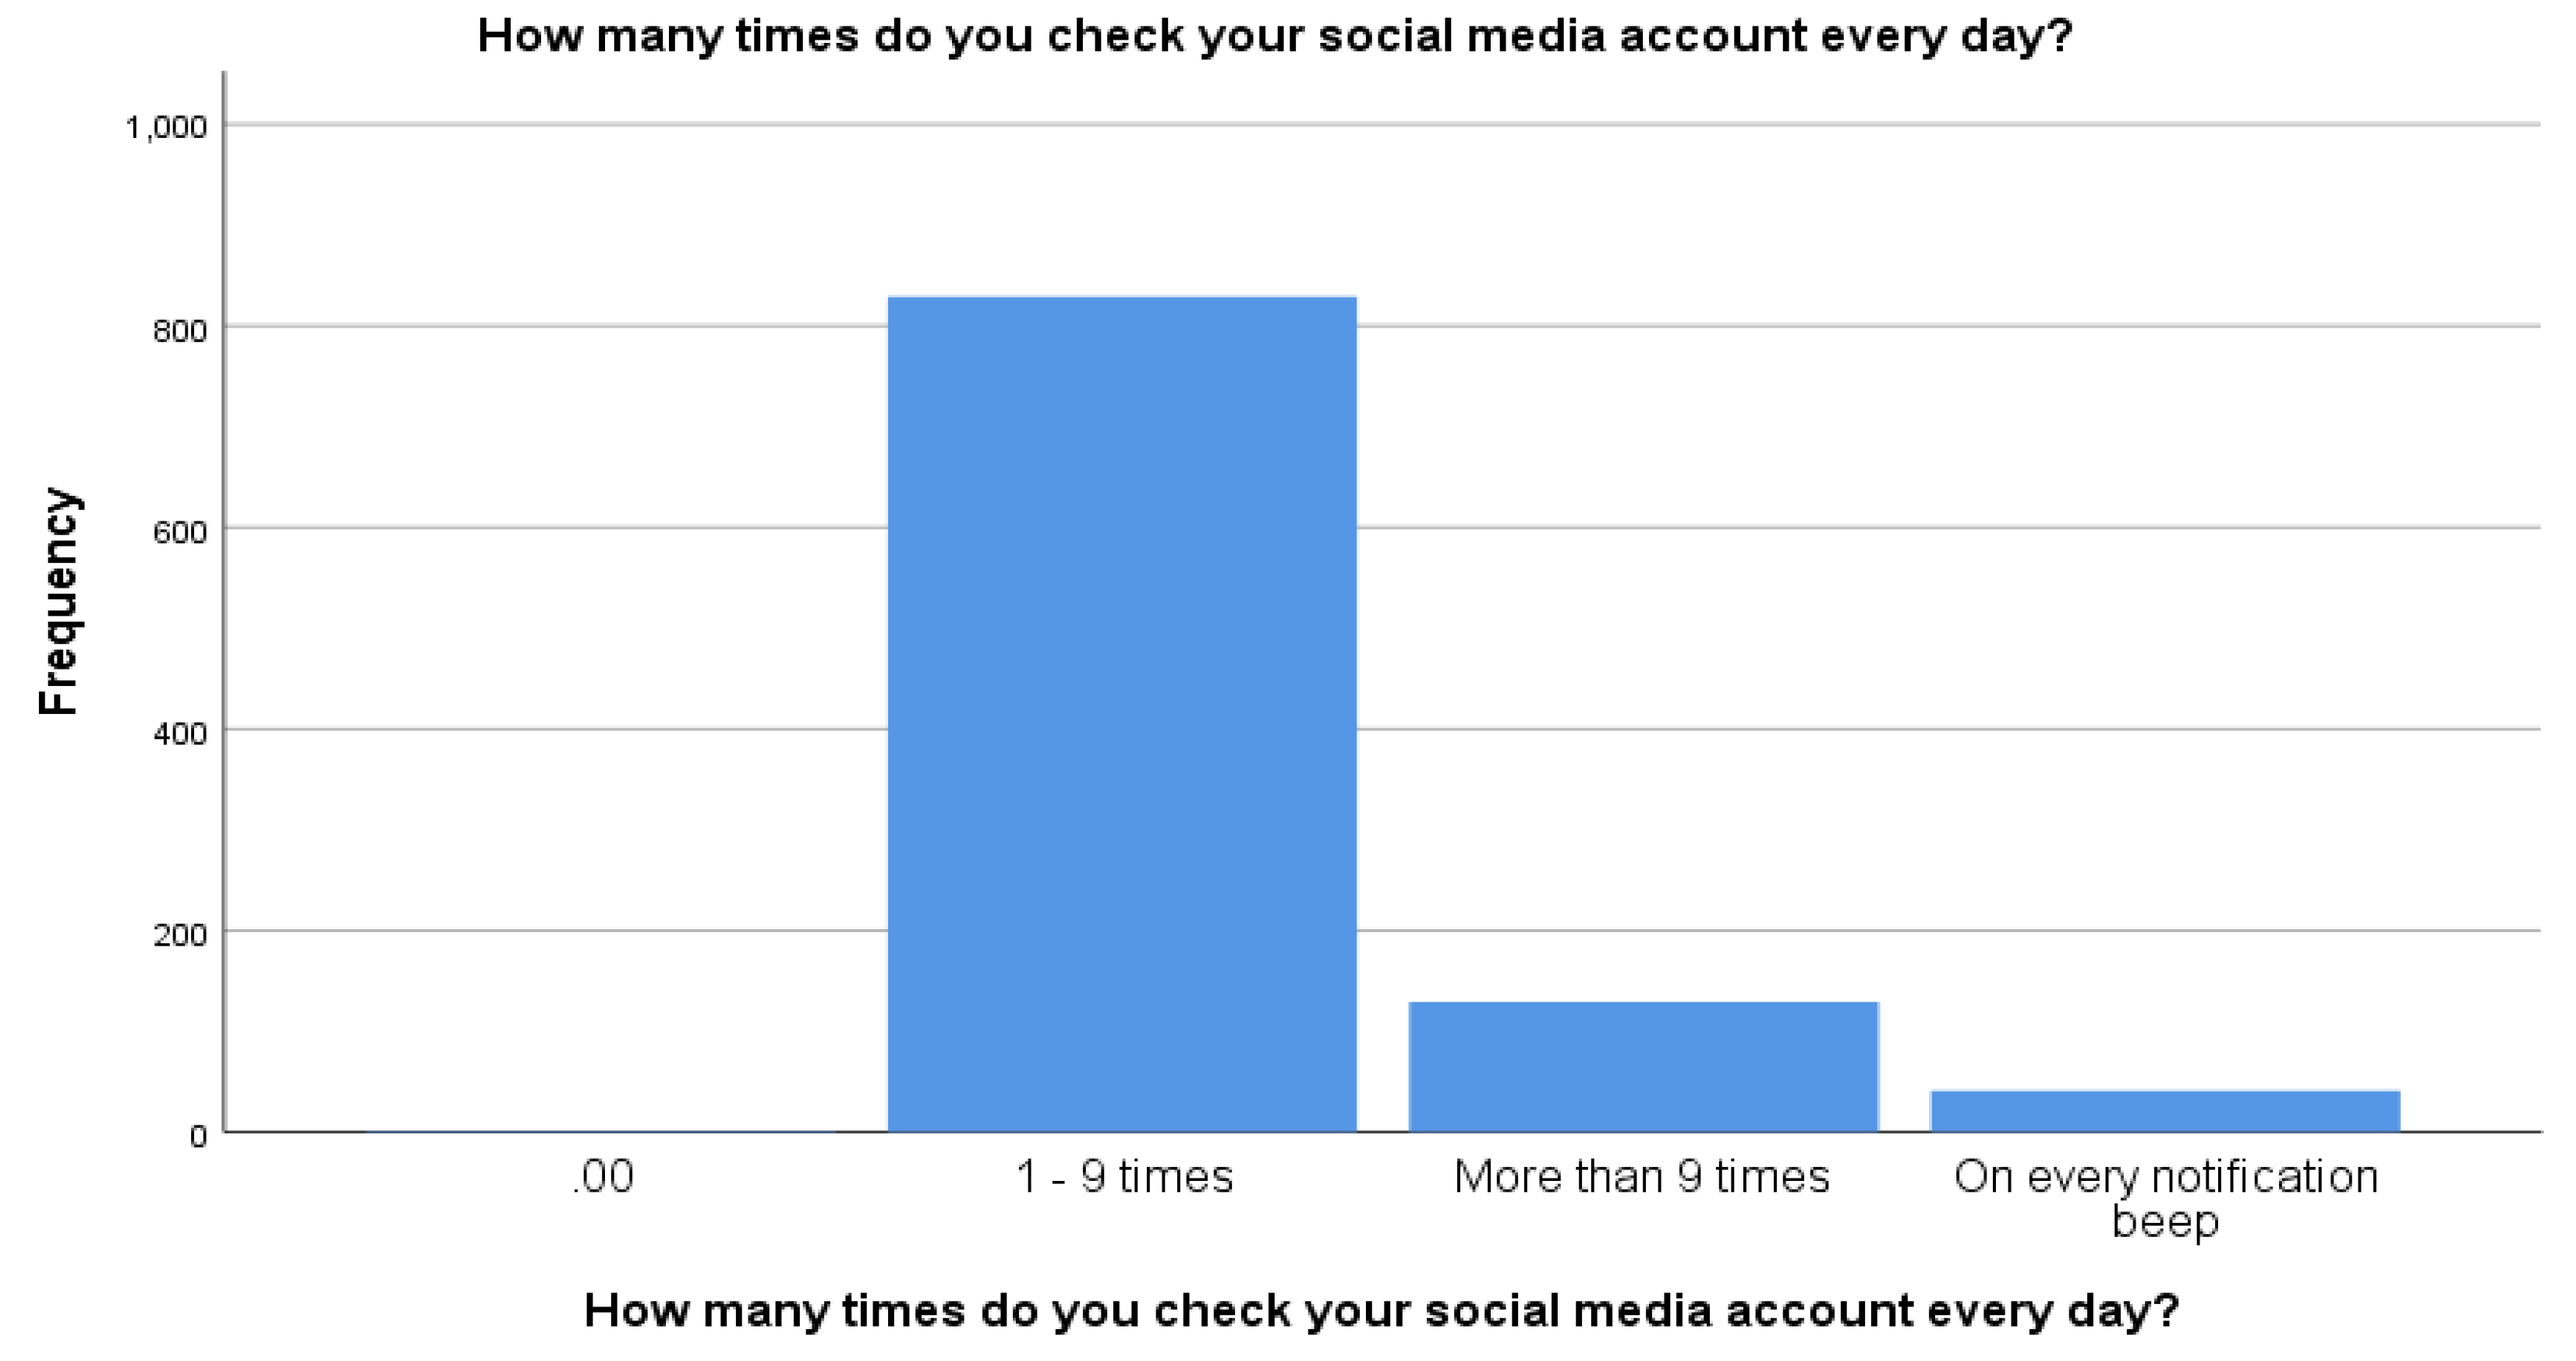

Table 1.
Socio-demographic characteristics of the study participants.
| Variables | Number | Percentage |
|---|---|---|
| Age | ||
| 45- 64 | 781 | 78.1 |
| >65 (older adulthood) | 219 | 21.9 |
| Sex | ||
| Male | 417 | 41.7 |
| Female | 582 | 58.2 |
| Marital Status | ||
| Single | 2 | 0.2 |
| Married | 926 | 92.6 |
| Divorced | 7 | 0.7 |
| Widowed | 62 | 6.2 |
| Educational Status | ||
| Informal education | 85 | 8.5 |
| Primary | 161 | 16.1 |
| Secondary | 336 | 33.6 |
| Higher secondary | 156 | 15.6 |
| Graduation and above | 262 | 26.1 |
| Income Source | ||
| Work | 519 | 33.6 |
| Business / Investment | 298 | 29.8 |
| Foreign employment | 53 | 5.3 |
| Agriculture | 35 | 5.3 |
| Others | 93 | 9.3 |
Table 2.
Illustration of Social Networking Sites Used by Participants.
| Never | Rarely (a few times in a year | Occasionally (a few times in a month | 3 to 5 times a week | Everyday | |
|---|---|---|---|---|---|
| 51 | 84 | 89 | 176 | 600 | |
| 491 | 127 | 120 | 155 | 107 | |
| 885 | 26 | 25 | 39 | 25 | |
| YouTube | 29 | 47 | 53 | 106 | 765 |
| 490 | 127 | 121 | 155 | 107 | |
| Google+ | 49 | 246 | 645 | 28 | 32 |
| 25 | 65 | 99 | 63 | 748 |
Table 3.
Social Media Needs and Uses.
| Social Media Use/Needs | Number | Percentage |
|---|---|---|
| Diversions: (Escapism and Tension Release) | ||
| Low | 682 | 68.2 |
| High | 318 | 31.8 |
| Cognitive Needs (Acquire Information & Knowledge) | ||
| Low | 710 | 71.0 |
| High | 290 | 29.0 |
| Affective Needs (Emotions, Pleasure & Feelings) | ||
| Low | 629 | 62.9 |
| High | 371 | 37.1 |
| Personal Integrative (Enhance credibility, status) | ||
| Low | 609 | 60.9 |
| High | 391 | 39.1 |
| Social Integrative Needs (Interaction with Friends / Family) (n=994) | ||
| Low | 617 | 62.1 |
| High | 377 | 37.9 |
Table 4.
Participant Perspectives on Quality of Life Variations.
| Quality of Life | Number | Percentage |
|---|---|---|
| Overall quality of life | ||
| Very good | 43 | 4.3 |
| Good | 551 | 55.1 |
| Neither poor nor good | 93 | 9.3 |
| Poor | 198 | 19.8 |
| Very poor | 115 | 11.5 |
| General health quality | ||
| Very Satisfied | 31 | 3.1 |
| Satisfied | 584 | 58.4 |
| Neither Satisfied/dissatisfied | 89 | 8.9 |
| Dissatisfied | 229 | 22.9 |
| Very Dissatisfied | 67 | 6.7 |
| Physical health quality | ||
| Very good (76-100) | 131 | 13 |
| Good (51-75) | 239 | 24 |
| Medium/ Fair (26-50) | 297 | 30 |
| Poor (0-25) | 333 | 33 |
| Psychological health quality | ||
| Very good (76-100) | 214 | 21 |
| Good (51-75) | 275 | 28 |
| Medium /Fair (26-50) | 151 | 15 |
| Poor (0-25) | 360 | 36 |
| Environment quality | ||
| Very good (76-100) | 232 | 23 |
| Good (51-75) | 217 | 22 |
| Medium/ Fair (26-50) | 232 | 23 |
| Poor (0-25) | 319 | 32 |
Table 5.
Correlation of Socio-demographic Factors with Quality of Life.
| Variables | Physical health | Psychological health | Environmental health |
|---|---|---|---|
| Age | 0.064 | 0.041 | 0.052 |
| Gender | 0.059 | 0.020 | 0.075 |
| Marital status | -0.033 | 0.009 | 0.036 |
| Qualification level | -0.009 | -0.013 | -0.075 |
| Income Source | 0.032 | -0.014 | 0.010 |
Notes: (p<0.05) Abbreviations: WHOQOL-BREF, World Health Organization QOL Questionnaire- BREF.
Disclaimer/Publisher’s Note: The statements, opinions and data contained in all publications are solely those of the individual author(s) and contributor(s) and not of MDPI and/or the editor(s). MDPI and/or the editor(s) disclaim responsibility for any injury to people or property resulting from any ideas, methods, instructions or products referred to in the content. |
© 2025 by the authors. Licensee MDPI, Basel, Switzerland. This article is an open access article distributed under the terms and conditions of the Creative Commons Attribution (CC BY) license (http://creativecommons.org/licenses/by/4.0/).
Copyright: This open access article is published under a Creative Commons CC BY 4.0 license, which permit the free download, distribution, and reuse, provided that the author and preprint are cited in any reuse.


