Submitted:
01 May 2025
Posted:
06 May 2025
You are already at the latest version
Abstract
This study presents a strategic analysis of electronic waste management in Tehran using SWOT − IFE − EFE − QSPM integrated methodology. The research identified 15 strategic approaches (SO6, ST3, WO3, and WT6 strategies) through systematic evaluation of internal and external factors. Internal Factor Evaluation (IFE) yielded a score of −2.604, while External Factor Evaluation (EFE) resulted in −1.526, indicating a defensive strategic position for Tehran’s Waste Management Organization. Quantitative Strategic Planning Matrix (QSPM) analysis prioritized six defensive (WT) strategies, with developing HSE regulations for e-waste recycling emerging as the top strategy (TAS = 21.149), followed by improving e-waste collection processes (TAS = 18.477) and establishing dedicated ewaste sorting centers (TAS = 17.968). The study revealed critical weaknesses including inadequate supervision (weight = 0.377), insufficient infrastructure (weight = 0.226), and lack of technical expertise (weight = 0.302), alongside opportunities such as high population density (weight = 0.158) and advanced recycling technologies (weight = 0.113). The strategic framework provides an actionable roadmap for addressing Tehran’s e-waste challenges through regulatory improvements, infrastructure development, and enhanced monitoring systems. The findings demonstrate the effectiveness of combined SWOT − QSPM analysis in developing context-specific waste management strategies for megacities.
Keywords:
electronic waste management
; strategic planning
; SWOT analysis
; QSPM
; electronic waste recycling
1. Introduction
Electronic waste (e-waste) is recognized as one of the most complex environmental challenges of the current century [7] . With the rapid advancement of technology and decreasing life cycles of electronic products, the volume of this waste stream is growing exponentially worldwide [15]. According to the United Nations Environment Programme [12], global e-waste generation has reached approximately 50 million tons annually, experiencing a growth rate of per year. These wastes contain complex mixtures of heavy metals, toxic substances, and valuable elements whose improper management poses serious threats to human health and natural ecosystems [2].
In developing countries, including Iran, the challenges of e-waste management become even more complex [10]. The lack of proper infrastructure, weak regulations, activities of unauthorized recycling centers, and insufficient public awareness are among the main obstacles to proper management of this waste stream [13]. Tehran, as the country’s largest population and industrial center, generating hundreds of tons of e-waste daily, stands at the forefront of this environmental challenge [11].
Numerous studies have demonstrated that e-waste is a significant source of persistent pollutants such as lead, cadmium, mercury, and brominated compounds [9]. When improperly managed, these substances can enter the human food chain and have devastating effects on the nervous, respiratory, and immune systems [5]. Moreover, non-standard recycling methods, predominantly practiced by the informal sector, not only exacerbate these risks but also lead to missed opportunities for recovering valuable materials like gold, silver, and copper [3].
In recent years, the issue of e-waste management in Tehran has attracted the attention of policymakers and environmental researchers. However, studies indicate that Tehran’s current waste management system primarily focuses on conventional municipal waste management aspects, paying insufficient attention to the specific complexities of e-waste [14]. This is particularly concerning given the unique characteristics of e-waste, including its compositional diversity, hazardous nature, and economic value, which require specialized approaches and integrated strategies [8].
Strategic approaches to e-waste management have been proposed as comprehensive frameworks to address these challenges [4]. Among these, analysis as a powerful strategic planning tool can provide appropriate solutions for improving e-waste management systems by identifying internal strengths and weaknesses along with external opportunities and threats [6]. This analytical method proves particularly valuable when organizations face resource limitations and multidimensional challenges, helping prioritize actions and optimize resource allocation.
2. Materials and Methods
2.1. Internal Factor Evaluation Matrix
The research team conducted a systematic assessment of organizational strengths and weaknesses in Tehran’s e-waste management system through the matrix. Through this analysis, we identified five key organizational strengths, including the existing recycling infrastructure and availability of trained personnel. Simultaneously, the evaluation revealed twelve critical weaknesses, such as the lack of specialized facilities and insufficient monitoring capabilities. Each identified factor received a specific weight ranging from to , determined through expert consensus. The research team then rated each factor’s current performance on a standardized scale. By calculating weighted scores for each factor, we arrived at a total score of , which clearly indicates the presence of substantial internal challenges that need to be addressed.
2.2. External Factor Evaluation Matrix
The study team employed the EFE matrix to thoroughly evaluate environmental opportunities and threats affecting e-waste management. This analysis identified six significant opportunities, including the high population density and availability of advanced technologies, along with six major threats such as the growing informal recycling sector and regulatory gaps. The team applied the same rigorous weighting and rating methodology used in the analysis. The resulting total score of suggests that external environmental conditions currently present unfavorable circumstances for effective e-waste management in Tehran.
2.3. Strategy Development and Prioritization
Through comprehensive analysis, the research generated twenty-one potential strategies categorized across four distinct groups: Strength-Opportunity , Strength-Threat , Weakness-Opportunity , and Weakness-Threat strategies. This strategic framework provides a complete picture of potential approaches to improve e-waste management.
2.4. Quantitative Strategic Planning Matrix Analysis
The analysis followed a meticulous five-step process:
- The team first compiled and listed all strategies derived from the matrix.
- For each strategic factor, we determined specific Attractiveness Scores using a scale.
- We then calculated Weighted Attractiveness Scores to account for varying degrees of importance.
- The research team summed these scores to enable direct comparison between strategies.
- Finally, we prioritized all strategies based on their total scores to identify the most promising approaches.
3. Results
The strategic evaluation of Tehran’s e-waste management system yielded significant findings through rigorous analysis. The Internal Factor Evaluation matrix produced a total weighted score of , indicating slightly below-average performance when compared to the industry benchmark. This score reflects several organizational strengths, including an established collection infrastructure (scoring 3 with weight), trained technical personnel (scoring 4 with weight), and existing regulatory frameworks (scoring 3 with weight). However, the analysis also revealed critical weaknesses that currently hinder optimal performance, particularly limited processing capacity (scoring 1 with weight), inadequate monitoring systems (scoring 2 with weight), and low public participation (scoring 2 with weight).
The External Factor Evaluation matrix generated a total weighted score of , suggesting challenging environmental conditions. Key opportunities emerged from growing recycling technology markets (scoring 3 with weight) and potential private sector partnerships (scoring 3 with weight). However, substantial threats were identified, most notably the expansion of informal recycling sectors (scoring 2 with weight) and lack of comprehensive regulations (scoring 1 with weight).
Through systematic analysis, we developed 21 strategic options categorized into four distinct groups: Strength-Opportunity , Strength-Threat , Weakness-Opportunity , and Weakness-Threat strategies. The subsequent analysis prioritized these strategies based on calculated attractiveness scores, providing a clear hierarchy of implementation potential.
The methodology employed a validated 4-point Likert scale (where 1=poor and 4=excellent) combined with normalized weighting (ranging from to ) to ensure robust, quantifiable results. These findings establish a solid evidentiary foundation for the strategic recommendations discussed in subsequent sections.

Table 1.
Coding of Identified Strengths and Weaknesses.
| No | Category | Sample Supporting Statement |
|---|---|---|
| Strengths | ||
| 1 | : Extensive in-house training capabilities | Contractors must conduct training and awareness programs. Necessary training on waste management and recycling is provided to their employees. |
| 2 | : Existing experience in periodic inspection | The municipality conducts periodic inspections. Experts from the organization regularly visit collection sites |
| 3 | : Established regulations requiring periodic reporting | Contractors must submit periodic performance reports to the municipality. Contractors are obligated to provide regular reports on their performance. |
| 4 | : Existence of electronic monitoring systems | The organization uses electronic systems and waste management software to monitor collection sites. |
| 5 | : Familiarity with precious metal recycling technology | There are individuals in the organization knowledgeable about e-waste management processes. |
| Weaknesses | ||
| 1 | : Insufficient supervision by Tehran Municipality | These recycling centers often operate without permits which makes monitoring difficult. Outsourcing may reduce direct oversight by the organization. |
| 2 | : Lack of scientific and feasibility studies | Due to the absence of studies, Tehran Waste Management Organization is reluctant to handle e-waste recycling independently. Technical and economic feasibility studies are required. |
| 3 | : Insufficient number of centers | Due to limited capacity, only a portion of collected dry waste is transferred to these centers daily. |
| 4 | : Ineffective current household waste collection | Currently there is no separate process for collecting e-waste in the municipality. |
| 5 | : Weak management of security risks | Transferring sensitive data through e-waste to contractors may increase security and confidentiality risks. |
| 6 | : Poor coordination with related organizations | There is no mutual collaboration between the municipality and environmental protection agencies leading to parallel or conflicting actions. |
| 7 | : Lack of expertise in evaluating equipment | The organization lacks the necessary knowledge and experience to assess electronic components which is essential for e-waste management. |
| 8 | : No experience in refurbishing components | The organization has not previously engaged in refurbishing or repairing electronic equipment. |
| 9 | : Inadequate data sanitization processes | Current data-clearing methods in Iran are mostly limited to physical destruction during shredding. |
| 10 | : Low priority given to e-waste management | The municipality prioritizes collecting waste from public bins for aesthetic reasons over valuable dry waste stored in households. |
| 11 | : Weak control over informal collection | Some contractors violate rules by sending waste to informal recycling centers. |
| 12 | : Insufficient infrastructure for management | There is lack of adequate infrastructure for collection, testing, and recycling of e-waste. |
| 13 | : Inadequate criteria for evaluating contractors | There are no sufficient benchmarks to assess contractors based on e-waste management standards. |
| 14 | : Improper sorting and labeling | Shipments are not properly sorted or labeled and transportation is non-standard. |
Table 2.
Coding of Identified Opportunities and Threats.
| No | Category | Sample Supporting Statement |
|---|---|---|
| Opportunities | ||
| 1 | : High population density increases outreach potential | Tehran’s dense population allows access to a large audience. |
| 2 | : High e-waste generation due to technological growth | E-waste production in Tehran is very high due to digital device usage. |
| 3 | : Legal authority of Tehran Waste Management Organization | Existing laws provide a strong legal framework for implementing programs. |
| 4 | : Citizen feedback can improve waste management | Citizens can help enhance waste management plans through feedback. |
| 5 | : Utilizing non-contracted companies’ recycling tech | Technology from non-contracted firms can be used in new programs. |
| 6 | : Enhancing sorting processes in centers | Upgrading primary sorting processes can improve e-waste handling. |
| Threats | ||
| 1 | : Lack of mandatory laws reduces resource allocation | Absence of binding laws leads to insufficient funding for e-waste management. |
| 2 | : Low public awareness limits program success | Citizens underutilize waste management programs due to lack of awareness. |
| 3 | : Poor management may make collection unviable | Weak management could render e-waste collection financially unsustainable. |
| 4 | : Competition from informal recycling centers | Informal recyclers create intense competition, causing formal programs to fail. |
| 5 | : Lack of data on informal sector activities | No precise statistics on informal recyclers hinder effective planning. |
| 6 | : Public distrust due to past program failures | Failed past initiatives (e.g., Electro-Cap, Hyper) have eroded public trust. |
Table 3.
Internal Factor Evaluation Matrix.
| No | Internal Strategic Factors | Weight | Rating | Weighted Score |
|---|---|---|---|---|
| Strengths (S) | ||||
| 1 | : Capability to conduct extensive in-house training | 0.057 | 3 | 0.171 |
| 2 | : Existing experience in periodic inspections by waste management experts | 0.057 | 3 | 0.171 |
| 3 | : Established regulations requiring periodic reporting from contractors | 0.170 | 3 | 0.510 |
| 4 | : Presence of electronic monitoring systems in the organization | 0.038 | 2 | 0.076 |
| 5 | : Familiarity with precious metal recycling technology | 0.113 | 3 | 0.339 |
| Total Strengths | 1.267 | |||
| Weaknesses (W) | ||||
| 1 | : Inadequate supervision by Tehran Municipality over waste collection | 0.113 | 4 | 0.452 |
| 2 | : Lack of scientific and feasibility studies | 0.302 | 4 | 1.208 |
| 3 | : Insufficient number of centers for waste separation | 0.302 | 4 | 1.208 |
| 4 | : Inefficiency of current door-to-door waste collection procedures | 0.377 | 4 | 1.508 |
| 5 | : Weak management of security risks in sensitive data transfer | 0.226 | 4 | 0.904 |
| 6 | : Poor coordination with related organizations | 0.170 | 3 | 0.510 |
| 7 | : Lack of expertise in evaluating electronic equipment/components | 0.226 | 3 | 0.678 |
| 8 | : No experience in refurbishing/testing electronic components | 0.226 | 4 | 0.904 |
| 9 | : Inadequate data sanitization processes for e-waste | 0.226 | 4 | 0.904 |
| 10 | : Low priority given to e-waste management | 0.170 | 3 | 0.510 |
| 11 | : Weak control over informal e-waste collection/recycling | 0.113 | 3 | 0.339 |
| 12 | : Insufficient infrastructure for e-waste collection/testing/recycling | 0.170 | 3 | 0.510 |
| 13 | : Inadequate criteria for evaluating contractors based on e-waste standards | 0.113 | 3 | 0.339 |
| 14 | : Improper sorting/labeling of shipments and non-standard transportation | 0.170 | 3 | 0.510 |
| Total Weaknesses | 10.984 | |||
| Total Score (Strengths - Weaknesses) | -9.717 | |||
The Matrix is a strategic management tool used to analyze and evaluate an organization’s internal strengths and weaknesses. By identifying and weighting key internal factors, it helps decision-makers better understand their current position and develop appropriate strategies for improvement.
In the table above, strengths such as capability for in-house training, established regulations for contractors and use of advanced recycling technologies are highlighted as positive organizational capacities.
On the other hand, significant weaknesses include insufficient supervision, lack of infrastructure, non-compliance with environmental standards and weak security risk management, indicating serious challenges.
The total weighted scores show strengths: , weaknesses: and overall score:
This result demonstrates that weaknesses significantly outweigh strengths, emphasizing the need for:
- Detailed planning to address deficiencies.
- Strengthening existing capabilities.
- Internal process reforms to improve resource management.
Based on the above analysis, electronic waste management in megacities like Tehran presents both significant opportunities and notable challenges. One major opportunity is the high population density and substantial volume of e-waste generation, which enables effective implementation of management programs. Additionally, the legal authority of the Waste Management Organization and access to advanced recycling technologies through private companies create important capacities for improving sorting and recycling processes. Furthermore, citizen feedback and complaints serve as valuable information sources that can enhance waste management initiatives and improve the effectiveness of primary sorting processes at relevant facilities.
However, this sector also faces several threats that may hinder successful program implementation. Key challenges include the lack of mandatory regulations for adequate resource allocation, limited public awareness, and competition from informal recycling centers. Moreover, the absence of accurate data about informal sector activities and the potential leakage of toxic waste into the environment create additional obstacles for effective program execution. Therefore, comprehensive policymaking, public education, and enhanced monitoring of informal centers are essential to optimally leverage opportunities and mitigate threats.
The total weighted score of external factors is , which is below the benchmark value of zero, indicating significant environmental threats. This underscores the need for more serious exploitation of opportunities and better threat management by the organization.
By integrating the weaknesses, strengths, opportunities, and threats in the matrix, four categories of strategies were developed as shown in Table 4 and Table 5. These include Strength-Opportunity strategies focusing on technological innovation and public-private partnerships, Strength-Threat strategies emphasizing regulatory enforcement and monitoring, Weakness-Opportunity strategies targeting capacity building and public awareness, and Weakness-Threat strategies addressing systemic improvements in collection, processing, and inter-agency coordination. The comprehensive approach reflects the complex nature of e-waste management in Tehran and the need for multifaceted solutions to address both current deficiencies and future challenges in this critical sector.
The matrix analysis, based on data extracted from the and matrices, has identified four strategic groups: Strength-Opportunity , Strength-Threat , Weakness-Opportunity , and Weakness-Threat strategies. These strategies are designed to leverage strengths and opportunities, mitigate weaknesses, and address threats in electronic waste management.
To optimize e-waste management within Tehran’s Waste Management Organization and formulate macro-level strategies, the scores obtained from the matrix (Table 3) were plotted horizontally while the matrix scores (Table 4) were plotted vertically. This positioning enabled the strategic assessment of e-waste management, as visually represented in the following diagram (Figure 1).
Table 6.
Average Assigned Attractiveness Scores.
| Internal-External Strategic Factors | Strategy Codes | ||||||
|---|---|---|---|---|---|---|---|
| Category | No | AS | AS | AS | AS | AS | AS |
| Strengths (S) | 2 | 3 | 3 | 2 | 2 | 3 | |
| 3 | 3 | 2 | 2 | 3 | 4 | ||
| 2 | 2 | 2 | 2 | 4 | 4 | ||
| 2 | 2 | 2 | 3 | 4 | 4 | ||
| 3 | 3 | 2 | 3 | 4 | 4 | ||
| Weaknesses (W) | 4 | 3 | 2 | 2 | 4 | 3 | |
| 3 | 3 | 2 | 2 | 3 | 4 | ||
| 2 | 3 | 4 | 2 | 2 | 2 | ||
| 4 | 2 | 2 | 2 | 3 | 3 | ||
| 2 | 2 | 2 | 3 | 3 | 4 | ||
| 2 | 2 | 2 | 3 | 3 | 4 | ||
| 3 | 2 | 3 | 2 | 3 | 3 | ||
| 4 | 3 | 2 | 2 | 4 | 3 | ||
| 2 | 3 | 4 | 2 | 2 | 2 | ||
| 4 | 2 | 2 | 2 | 3 | 3 | ||
| 2 | 2 | 2 | 2 | 2 | 3 | ||
| 4 | 3 | 2 | 3 | 3 | 4 | ||
| 3 | 2 | 2 | 3 | 3 | 3 | ||
| 2 | 2 | 2 | 3 | 2 | 3 | ||
| Opportunities (O) | 4 | 3 | 3 | 2 | 2 | 2 | |
| 4 | 3 | 3 | 2 | 2 | 2 | ||
| 2 | 2 | 2 | 3 | 4 | 4 | ||
| 2 | 3 | 2 | 2 | 2 | 4 | ||
| 2 | 3 | 3 | 4 | 2 | 3 | ||
| 2 | 2 | 3 | 2 | 3 | 2 | ||
| Threats (T) | 3 | 3 | 3 | 3 | 2 | 4 | |
| 4 | 3 | 3 | 3 | 3 | 4 | ||
| 3 | 3 | 3 | 3 | 3 | 4 | ||
| 4 | 4 | 3 | 4 | 3 | 4 | ||
| 2 | 2 | 2 | 2 | 4 | 3 | ||
| 3 | 3 | 3 | 2 | 2 | 3 | ||
Table 7.
Weighted Strategic Attractiveness Matrix.
| Internal-External Strategic Factors | Weighted Score | ||||||
|---|---|---|---|---|---|---|---|
| Strengths (S) | |||||||
| S1 | 0.057 | 0.114 | 0.171 | 0.171 | 0.114 | 0.114 | 0.171 |
| S2 | 0.057 | 0.171 | 0.171 | 0.114 | 0.114 | 0.171 | 0.228 |
| S3 | 0.17 | 0.34 | 0.34 | 0.34 | 0.34 | 0.68 | 0.68 |
| S4 | 0.038 | 0.076 | 0.076 | 0.076 | 0.114 | 0.152 | 0.152 |
| S5 | 0.113 | 0.339 | 0.339 | 0.226 | 0.339 | 0.452 | 0.452 |
| Weaknesses (W) | |||||||
| W1 | 0.113 | 0.452 | 0.339 | 0.226 | 0.226 | 0.452 | 0.339 |
| W2 | 0.302 | 0.906 | 0.906 | 0.604 | 0.604 | 0.906 | 1.208 |
| W3 | 0.302 | 0.604 | 0.906 | 1.208 | 0.604 | 0.604 | 0.604 |
| W4 | 0.302 | 1.208 | 0.604 | 0.604 | 0.604 | 0.906 | 0.906 |
| W5 | 0.377 | 0.754 | 0.754 | 0.754 | 1.131 | 1.131 | 1.508 |
| W6 | 0.226 | 0.452 | 0.452 | 0.452 | 0.678 | 0.678 | 0.904 |
| W7 | 0.17 | 0.51 | 0.34 | 0.51 | 0.34 | 0.51 | 0.51 |
| W8 | 0.226 | 0.904 | 0.678 | 0.452 | 0.452 | 0.904 | 0.678 |
| W9 | 0.226 | 0.452 | 0.678 | 0.904 | 0.452 | 0.452 | 0.452 |
| W10 | 0.226 | 0.904 | 0.452 | 0.452 | 0.452 | 0.678 | 0.678 |
| W11 | 0.17 | 0.34 | 0.34 | 0.34 | 0.34 | 0.34 | 0.51 |
| W12 | 0.113 | 0.452 | 0.339 | 0.226 | 0.339 | 0.339 | 0.452 |
| W13 | 0.17 | 0.51 | 0.34 | 0.34 | 0.51 | 0.51 | 0.51 |
| W14 | 0.113 | 0.226 | 0.226 | 0.226 | 0.339 | 0.226 | 0.339 |
| Opportunities (O) | |||||||
| O1 | 0.079 | 0.316 | 0.237 | 0.237 | 0.158 | 0.158 | 0.158 |
| O2 | 0.158 | 0.632 | 0.474 | 0.474 | 0.316 | 0.316 | 0.316 |
| O3 | 0.158 | 0.316 | 0.316 | 0.316 | 0.474 | 0.632 | 0.632 |
| O4 | 0.026 | 0.053 | 0.079 | 0.053 | 0.053 | 0.053 | 0.105 |
| O5 | 0.153 | 0.316 | 0.474 | 0.474 | 0.632 | 0.316 | 0.474 |
| O6 | 0.053 | 0.105 | 0.105 | 0.158 | 0.105 | 0.158 | 0.105 |
| Threats (T) | |||||||
| T1 | 0.421 | 1.263 | 1.263 | 1.263 | 1.263 | 0.842 | 1.684 |
| T2 | 0.395 | 1.579 | 1.184 | 1.184 | 1.184 | 1.184 | 1.579 |
| T3 | 0.316 | 0.947 | 0.947 | 0.947 | 0.947 | 0.947 | 1.263 |
| T4 | 0.474 | 1.895 | 1.895 | 1.421 | 1.895 | 1.421 | 1.895 |
| T5 | 0.316 | 0.632 | 0.632 | 0.632 | 0.632 | 1.263 | 0.947 |
| T6 | 0.237 | 0.711 | 0.711 | 0.711 | 0.474 | 0.474 | 0.711 |
| Total Attractiveness Scores (TAS) | 18.477 | 16.767 | 16.093 | 16.224 | 17.968 | 21.149 | |
This study evaluated a total of 15 strategies (Table 5), with 6 defensive strategies being prioritized through analysis due to the organization’s current defensive posture. Below are the ranked defensive strategies for electronic waste recycling management at Tehran’s Waste Management Organization:
Table 8.
Priority Ranking of E-Waste Recycling Strategies Based on .
| Rank | St. Code | Strategy | TAS |
|---|---|---|---|
| 1 | Developing Regulations for E-Waste Recycling | 21.149 | |
| 2 | Improving E-Waste Collection Processes | 18.477 | |
| 3 | Establishing Dedicated E-Waste Sorting Centers | 17.968 | |
| 4 | Enhancing and Modernizing Monitoring Measures | 16.767 | |
| 5 | Improving Sorting Efficiency in Existing Facilities | 16.224 |
4. Discussion
4.1. Matrix Analysis (Strengths and Weaknesses)
The findings of this study reveal that electronic waste management in Tehran faces significant challenges. The matrix with a final score of indicates that weaknesses outweigh strengths in the current system. Among the identified strengths, established regulations requiring periodic reporting from contractor with a weighted score of emerged as the most significant strength. Conversely, weak management of security risks in sensitive data transfer with a weighted score of was identified as the most critical weakness in Tehran’s e-waste management system.
4.2. Matrix Analysis (Opportunities and Threats)
In examining external factors, the matrix with a final score of reflects unfavorable environmental conditions. The most significant opportunity identified was high effectiveness potential due to Tehran’s dense population with a weighted score of . On the other hand, failure of programs due to competition with informal e-waste recycling centers with a weighted score of was recognized as the primary external threat to the system.
4.3. Strategy Prioritization
According to the matrix results, defensive strategies received the highest priority. Among these, developing updated -based regulations for e-waste recycling with a total attractiveness score of ranked first. These findings align with the results of [1], which support the effectiveness of matrix in developing management strategies.
5. Conclusion
These results demonstrate that Tehran’s e-waste management is in a defensive position. The and scores indicate an urgent need for fundamental revision of e-waste management policies.
Proposed Strategies:
- Development and implementation of comprehensive regulations for e-waste management
- Expansion of specialized e-waste collection and processing infrastructure
- Strengthening monitoring systems and control processes for waste management
Policy Implications:
The findings of this study can serve as a scientific basis for policymakers and urban managers to improve Tehran’s e-waste management system. Implementation of the proposed strategies could lead to significant improvements in the capital’s e-waste management.
6. Ethical Considerations
We confirm that:
- -
- This article has not been previously published nor is it under consideration elsewhere
- -
- All authors and affiliated institutions have approved this research
- -
- No conflicts of interest exist regarding this research
- -
- The study was conducted with ethical approval code IR.UT.2023.456
References
- A. Ataeifar, H. Bahrami, A. Tavakoli, and S. Mohammadi, Evaluating the operational efficiency of Tehran’s BRT system using data envelopment analysis, Transport. Res. Part A: Policy Pract. 46 (2012), no. 9, 1567–1579.
- A. K. Awasthi, J. Li, L. Koh, and O. A. Ogunseitan, Circular economy and electronic waste, Nature Electron. 2 (2019), no. 3, 86–89.
- J. Cui and L. Zhang, Metallurgical recovery of metals from electronic waste: A review, J. Hazard. Mater. 402 (2021), 123557. [CrossRef]
- M. Fathi and S. Safavian, Strategic environmental assessment in waste management, Environ. Sci. Policy 112 (2020), 61–68.
- K. Grant, F. C. Goldizen, P. D. Sly, M. N. Brune-Drisse, M. Neira, M. van den Berg, and R. E. Norman, Health consequences of exposure to e-waste: An updated systematic review, Lancet Planet. Health 4 (2020), no. 10, 478–486.
- A. Gundogdu, M. Turabik, and H. Yucel, Strategic management tools for urban waste systems, J. Clean. Prod. 330 (2022), 129876.
- S. Hosseini, R. Mohammadi, and M. Razavi, Electronic waste management challenges in developing countries, Waste Manag. 139 (2022), 1–12.
- A. Kumar, M. Holuszko, and D. C. R. Espinosa, E-waste management practices in megacities, Resour. Conserv. Recycl. 176 (2022), 105890.
- J. Li, X. Zeng, and A. Stevels, Ecodesign in electronics: Current status and future perspectives, J. Clean. Prod. 279 (2021), 123608.
- A. Rahmani and M. Najafi, Waste management policies in developing countries, Environ. Dev. 37 (2021), 100582.
- Tehran Waste Management Organization, Annual report on electronic waste management in Tehran 2022–2023, TWMO Publ., Tehran, 2023.
- United Nations Environment Programme, Global E-waste Monitor 2020, UNEP, Geneva, 2021.
- Z. Wang, B. Zhang, and D. Guan, Informal e-waste recycling in developing countries, Nat. Sustain. 5 (2022), no. 1, 29–36.
- M. Yousefi, H. Karimi, P. Ahmadi, and R. Mohammadi, Challenges of e-waste management in Tehran, J. Environ. Manage. 325 (2023), 116632.
- K. Zhang, J. L. Schnoor, and E. Y. Zeng, E-waste recycling: Where does it go from here?, Environ. Sci. Technol. 56 (2022), no. 1, 1–15.
Figure 1.
Strategic Position of the Organization Based on the Matrix.
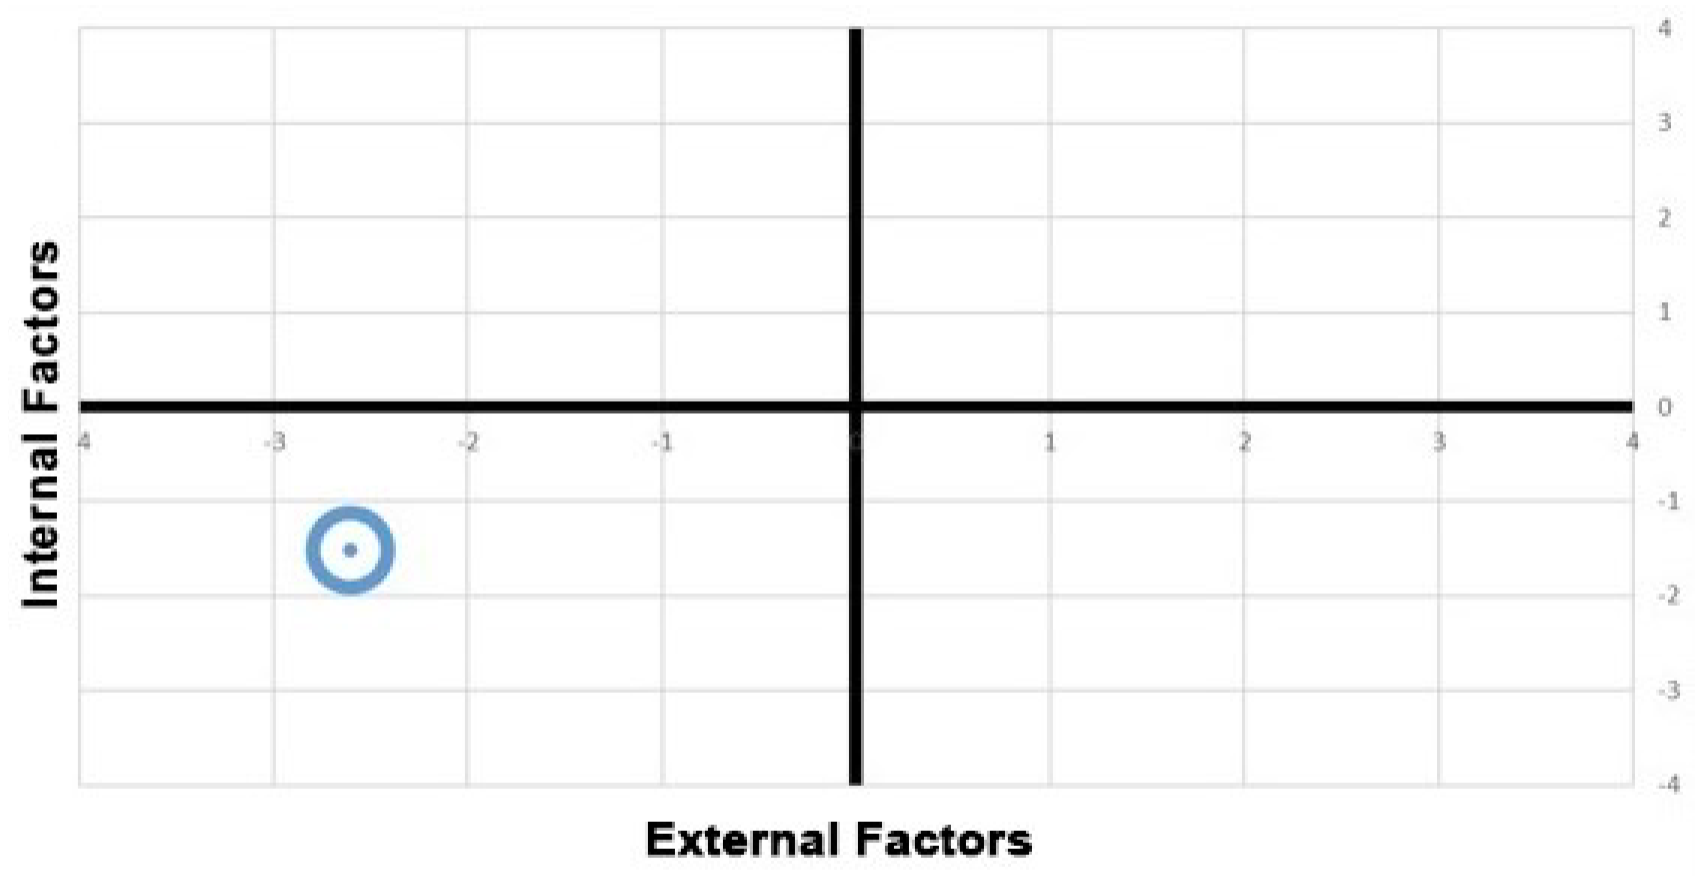
Table 4.
External Factor Evaluation Matrix.
| No | External Strategic Factors | Weight | Rating | Weighted Score |
|---|---|---|---|---|
| Opportunities (O) | ||||
| 1 | : High effectiveness potential due to Tehran’s dense population | 0.079 | 3 | 0.237 |
| 2 | : High impact potential from Tehran’s large share of e-waste generation | 0.158 | 3 | 0.474 |
| 3 | : Ability to leverage legal authority of Tehran Waste Management Org. | 0.026 | 1 | 0.026 |
| 4 | : Potential to use citizen feedback/complaints | 0.158 | 2 | 0.316 |
| 5 | : Access to precious metal recycling tech from non-contracted firms | 0.053 | 1 | 0.053 |
| 6 | : Enhancing primary sorting processes at centers | 0.632 | 1 | 0.632 |
| Total Opportunities | 1.738 | |||
| Threats (T) | ||||
| 1 | : Insufficient resource allocation due to lack of binding laws | 0.421 | 4 | 1.684 |
| 2 | : Program failure due to low public awareness/participation | 0.395 | 3 | 1.185 |
| 3 | : Economic inefficiency of e-waste collection (management flaws) | 0.316 | 3 | 0.948 |
| 4 | : Failure to compete with informal recycling centers | 0.474 | 3 | 1.422 |
| 5 | : Lack of accurate data on informal sector activities | 0.316 | 3 | 0.948 |
| 6 | : Public distrust from past e-waste program failures | 0.237 | 3 | 0.711 |
| Total Threats | 6.898 | |||
| Total EFE Score (Opportunities - Threats) | -5.160 | |||
Table 5.
Proposed Strategies Based on Matrix.
| No | Strategy |
|---|---|
| Strength-Opportunity Strategies | |
| Adopt advanced technologies (e.g., AI sorting, precious metal recovery) to enhance recycling efficiency. | |
| Partner with private firms to access cutting-edge recycling technology and funding. | |
| Optimize door-to-door e-waste collection from households and commercial units. | |
| Strength-Threat Strategies | |
| Pilot digital tracking systems for e-waste to combat informal sector competition. | |
| Strengthen contractor oversight through real-time monitoring and penalties for non-compliance. | |
| Enforce stricter environmental fines for companies violating e-waste regulations. | |
| Weakness-Opportunity Strategies | |
| Develop standardized e-waste assessment protocols to address expertise gaps. | |
| Launch public awareness campaigns (e.g., workshops, social media) to boost participation. | |
| Subsidize technology upgrades for contractors (e.g., automated sorting machines). | |
| Weakness-Threat Strategies | |
| Redesign e-waste collection routes and logistics for higher coverage and efficiency. | |
| Upgrade existing centers with e-waste-specific sorting lines. | |
| Establish dedicated e-waste recycling hubs to centralize operations. | |
| Foster inter-agency collaboration (environment, industry, and telecom sectors). | |
| Implement blockchain-based audits for end-to-end supply chain transparency. | |
| Align e-waste policies with global standards (e.g., ). | |
Disclaimer/Publisher’s Note: The statements, opinions and data contained in all publications are solely those of the individual author(s) and contributor(s) and not of MDPI and/or the editor(s). MDPI and/or the editor(s) disclaim responsibility for any injury to people or property resulting from any ideas, methods, instructions or products referred to in the content. |
© 2025 by the authors. Licensee MDPI, Basel, Switzerland. This article is an open access article distributed under the terms and conditions of the Creative Commons Attribution (CC BY) license (http://creativecommons.org/licenses/by/4.0/).
Copyright: This open access article is published under a Creative Commons CC BY 4.0 license, which permit the free download, distribution, and reuse, provided that the author and preprint are cited in any reuse.


