
Submitted:
01 May 2025
Posted:
06 May 2025
You are already at the latest version
Abstract
This research explores visual and non-visual (circadian) perception of light on humans and their brain responses in the urban space of two contrasted cities: Madrid and Toledo, in Spain. Lighting has been demonstrated, to induce the synthesis of neurotransmitters, which can function as regulators or disruptors of our biological system, causing diseases due to alteration of our circadian rhythms; these responses are contingent upon the technical properties of the lighting (type of incidence, intensity, colour temperature and mostly wavelength) and the time and duration of exposure. In Madrid, we analyse Gran Vía, an iconic and busy avenue with high commercial and touristic activity. This has resulted in an excess of illumination, that has a notable impact on the night environment and, in particular, on the biology of the human beings who transit and inhabit these areas. Unlike Toledo, a small, protected city (a UNESCO World heritage site since 1986) that has remained with a low population density, controlled commercial areas and a low level of urban lighting at night, is presented as an opposite situation. In Madrid measurements of both lux and light spectrum were taken to demonstrate the excessive light incidence, along with the high emission of short-wavelength light produced by LED screens, which at night disrupt our circadian cycle. This paper demonstrates how ALAN affects the human circadian rhythms. Furthermore, this research suggests directions for urban lighting design, considering the human circadian rhythms.
Keywords:
lighting
; urban lighting
; circadian rhythms disruptions
; neurolighting
; circadian neurolighting
1. Introduction
There is a growing interest in analysing the relationship between light and human biological responses and its impact on health: Light acts as a regulatory element in the circadian rhythms of living organisms.
Light is perceived by the human eye, specifically in the retina. There, it is processed and synthesized into an electrical signal through phototransduction. This signal is then transmitted via the optic nerve to the brain, specifically to the hypothalamus, where circadian rhythm regulation occurs.[1] These electrical signals, received in the suprachiasmatic nucleus (SCN) within the hypothalamus, are then conducted to the endocrine and nervous systems.
Previously, two types of photoreceptors were known to exist in the eye: cones and rods. Later, around the 1920s, the first observations and evidence of the influence of light on circadian rhythms emerged. Almost a century later, in 2002, David Berson described the intrinsically photosensitive retinal ganglion cells (ipRGCs) as another type of photoreceptor in the eye, in addition to the already known cones and rods, and discovered that these cells are involved in the regulation of the circadian cycle. Light controls our circadian rhythm through the ipRGCs (which contain melanopsin, the photoreceptor protein whose function is to identify the appropriate light intensity and wavelength (450 to 500nm, with the highest efficiency occurring at 480nm) to produce melatonin, This is known as the melanopic effect of light. The discovery of ipRGCs as a photoreceptor neuron and to recognize its primary function in our bioregulation is crucial in the understanding and control of our circadian rhythm. An experimental sample was taken to prove the perception of light related to the circadian rhythms, in blind individuals, in which the non-visual effect of light was demonstrated.[2] There is also “evidence that exposure to light-emitting devices from luminaires and screens before bed time can impact on sleep onset latency, sleep duration, and sleep quality during the subsequent night.”[3]
Photosynchronization, mentioned before, is the process of regulating circadian rhythms in living organisms, activating cortisol during the day and melatonin at night. The presence of daylight triggers the production of cortisol, which increases the heart and respiratory rates, gradually altering biological functions during the day, and when night falls, the organism begins to produce melatonin and inhibit cortisol, thus achieving the regenerative functions of the organism, lowering the heart and respiratory rates, leading to deep sleep.
It is a fact the relation between lighting and brain responses, then we denominate “neurolighting” as a concept for the specific analysis of the perception of light (visual and non-visual) and how it generates responses in our brain, specifically in the SCN based on light intensities, wavelength, transitions, which will directly influence:
- Nervous system
- Circadian rhythm
Therefore, as we focus our research on the lighting and the circadian rhythms, we denominate “circadian neurolighting” to the analysis of the lighting and the brain responses that affect our circadian rhythms.
Large cities, as their demographics and associated urban functions grow, increase
night-time activities, increase travel distances between different areas, and subsequently increase light intensities and exposure times, leaving fewer and fewer areas with a dark night sky.
Based on the night-time lighting (known as ALAN, artificial lighting at night) conditions in the city of Madrid, a metropolis whose population growth, services and shops increase the amount of light at night, an analysis is made of the sensory reactions produced by visitors and residents in the most illuminated areas of this city, contrasting it with an analysis of the lighting conditions in the city of Toledo and its inhabitants, whose urban characteristics are completely antagonistic.
In this analysis, we recognize the importance of lighting at night for safety while transiting the streets (wayfinding) and sense of security, as it is possible to identify the elements around and to get facial recognition of other pedestrians.[4]. Therefore, we explore ways to use lighting in the most appropriate levels to get their benefits in a less disruptive way.
The importance of recognizing the effects of electrical lighting by night as the trigger of cortisol in a negative way, attempts to identify with more precision the possible disorder and even diseases in our organism. Already, there are documentation about the relation between ALAN and different type of cancer, breast and prostate cancer [5] and pediatric papillary thyroid cancer. [6]
The main objective of this research is to demonstrate the negative impact caused by ALAN, through the comparison of two contrasting cities: Madrid and Toledo and the negative repercussion on their inhabitants, to prove the excessive and unnecessary high levels of light intensity and short-wavelength (blue light) in some areas, to analyse in more detail the non-visual effects of lighting and how they influence the human organism, moods and health in general as well as create awareness on how we can prevent the disruptive effects, with the goal of controlling and reducing the negative effects and improving the quality of life of residents and visitors.
2. Materials and Methods
First stage – Conduct documentary research: compiling and analysing the state of the art: case studies on urban lighting, works on the impact of lighting on human beings.
Second stage - Field research: “In situ” lighting measurements with a luxmeter and photo-spectrometer to identify light intensities and wavelength levels, and also made interviews with inhabitants. After analysing the content collected during the documentary research phase, and having the empirical observations that motivated this study, it was possible to define and specify the elaboration of the questions for the interviews, questionnaires and surveys.
Groups of people classified by their location in the cities of study (Madrid and Toledo), by gender (male and female) and by three age ranges (less than 25, between 25 and 55 and more than 55 years old) were analysed.
On the questionnaires, we explored the perception of the light at night in terms of wellbeing.
On the other hand, we analysed both cities and the light intensities that each of them cast on urban public spaces during night-time hours, as well as measurements were taken at the same times of the year and similar hours for both cities (between February and March 2025). Light measurements were taken at a height of 1.00m above the ground, as this was an intermediate height between the ground and the visual field.
In Madrid, our place of study was one of the busiest and most principal avenues, known as “Gran Vía” which is a major hub for retail, gastronomic and other touristic activities. Along Gran Vía avenue, we took point of measurements at 20-metre intervals; on each point of measurement, we took it three times to ensure the accuracy. In Toledo, our place of study were the main square and small streets with low levels of lighting. The criteria for the cities and area selection were to intensify the contrast for a better appreciation of the results.
3. Results
For the cities analysis, we placed the specific area image along the lighting calculations made with luxmeter and photo-spectrometer, showing the image with the total lighting levels and the wavelength spectrum distribution. Based in the data collection, we prepared one chart per city with the obtained values on lighting levels, to stablish a better comparison. The values considered are:
- Illuminance - measured in Luxes (Lx) and Foot candle (Fc).
- Wavelength – measured in nanometres (nm).
- Correlative colour temperature – measured in Kelvin (K)
Additionally, we present some of the questions done during the survey with the most relevant ones, supported by the pie chart indicating the percentage of answers obtained on each question.
3.1. Madrid Analysis
Taking Madrid as the first city of observation, we studied some shops entrances of the Gran Vía, some of them have screen vitrines. Also, we studied two squares along the Gran Vía: Plaza Callao and Plaza Gran Vía. These two squares are very strategic connection points. Both connect with “Puerta del Sol” the main centre and point of origin of Madrid.
In the following plan, we indicate the sections of Gran Vía to be analysed. For easier orientation, we indicate two significant landmarks in white: “Puerta del Sol” and “Cibeles”.
Figure 1.
Madrid plan with the area of analysis (Gran Vía) marked in turquoise colour. Other landmarks, as Puerta del Sol and Cibeles Fountain, marked as reference, in white colour. Original plan obtained from Cadmapper, modified in Photoshop by Authors.
Figure 1.
Madrid plan with the area of analysis (Gran Vía) marked in turquoise colour. Other landmarks, as Puerta del Sol and Cibeles Fountain, marked as reference, in white colour. Original plan obtained from Cadmapper, modified in Photoshop by Authors.
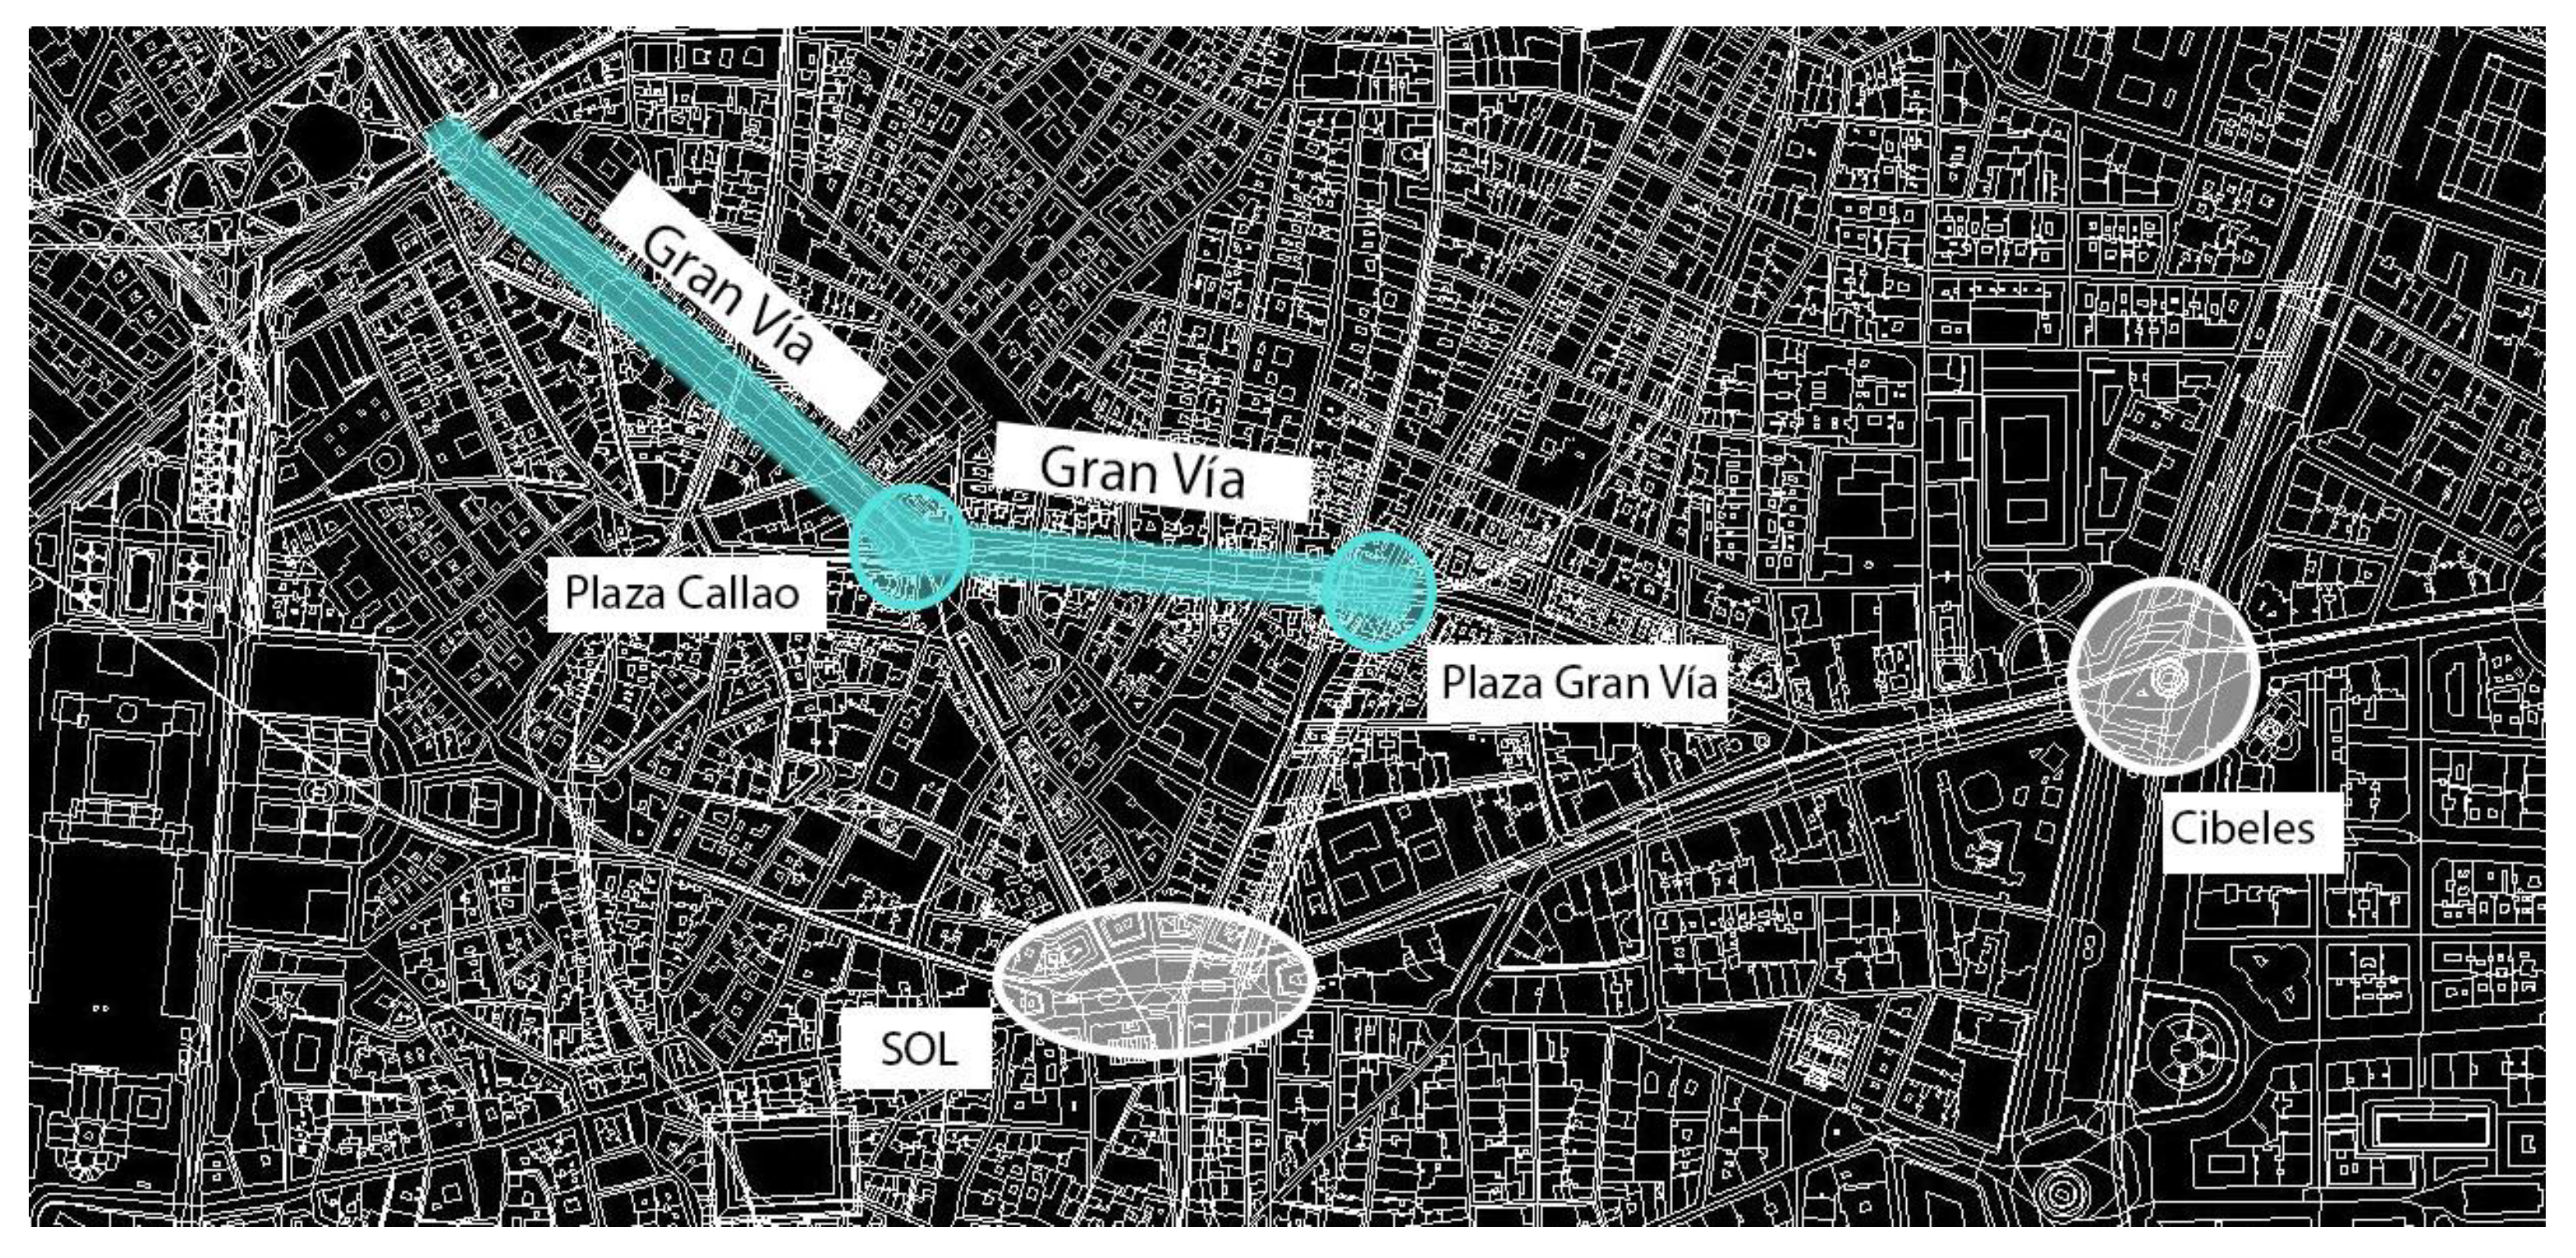
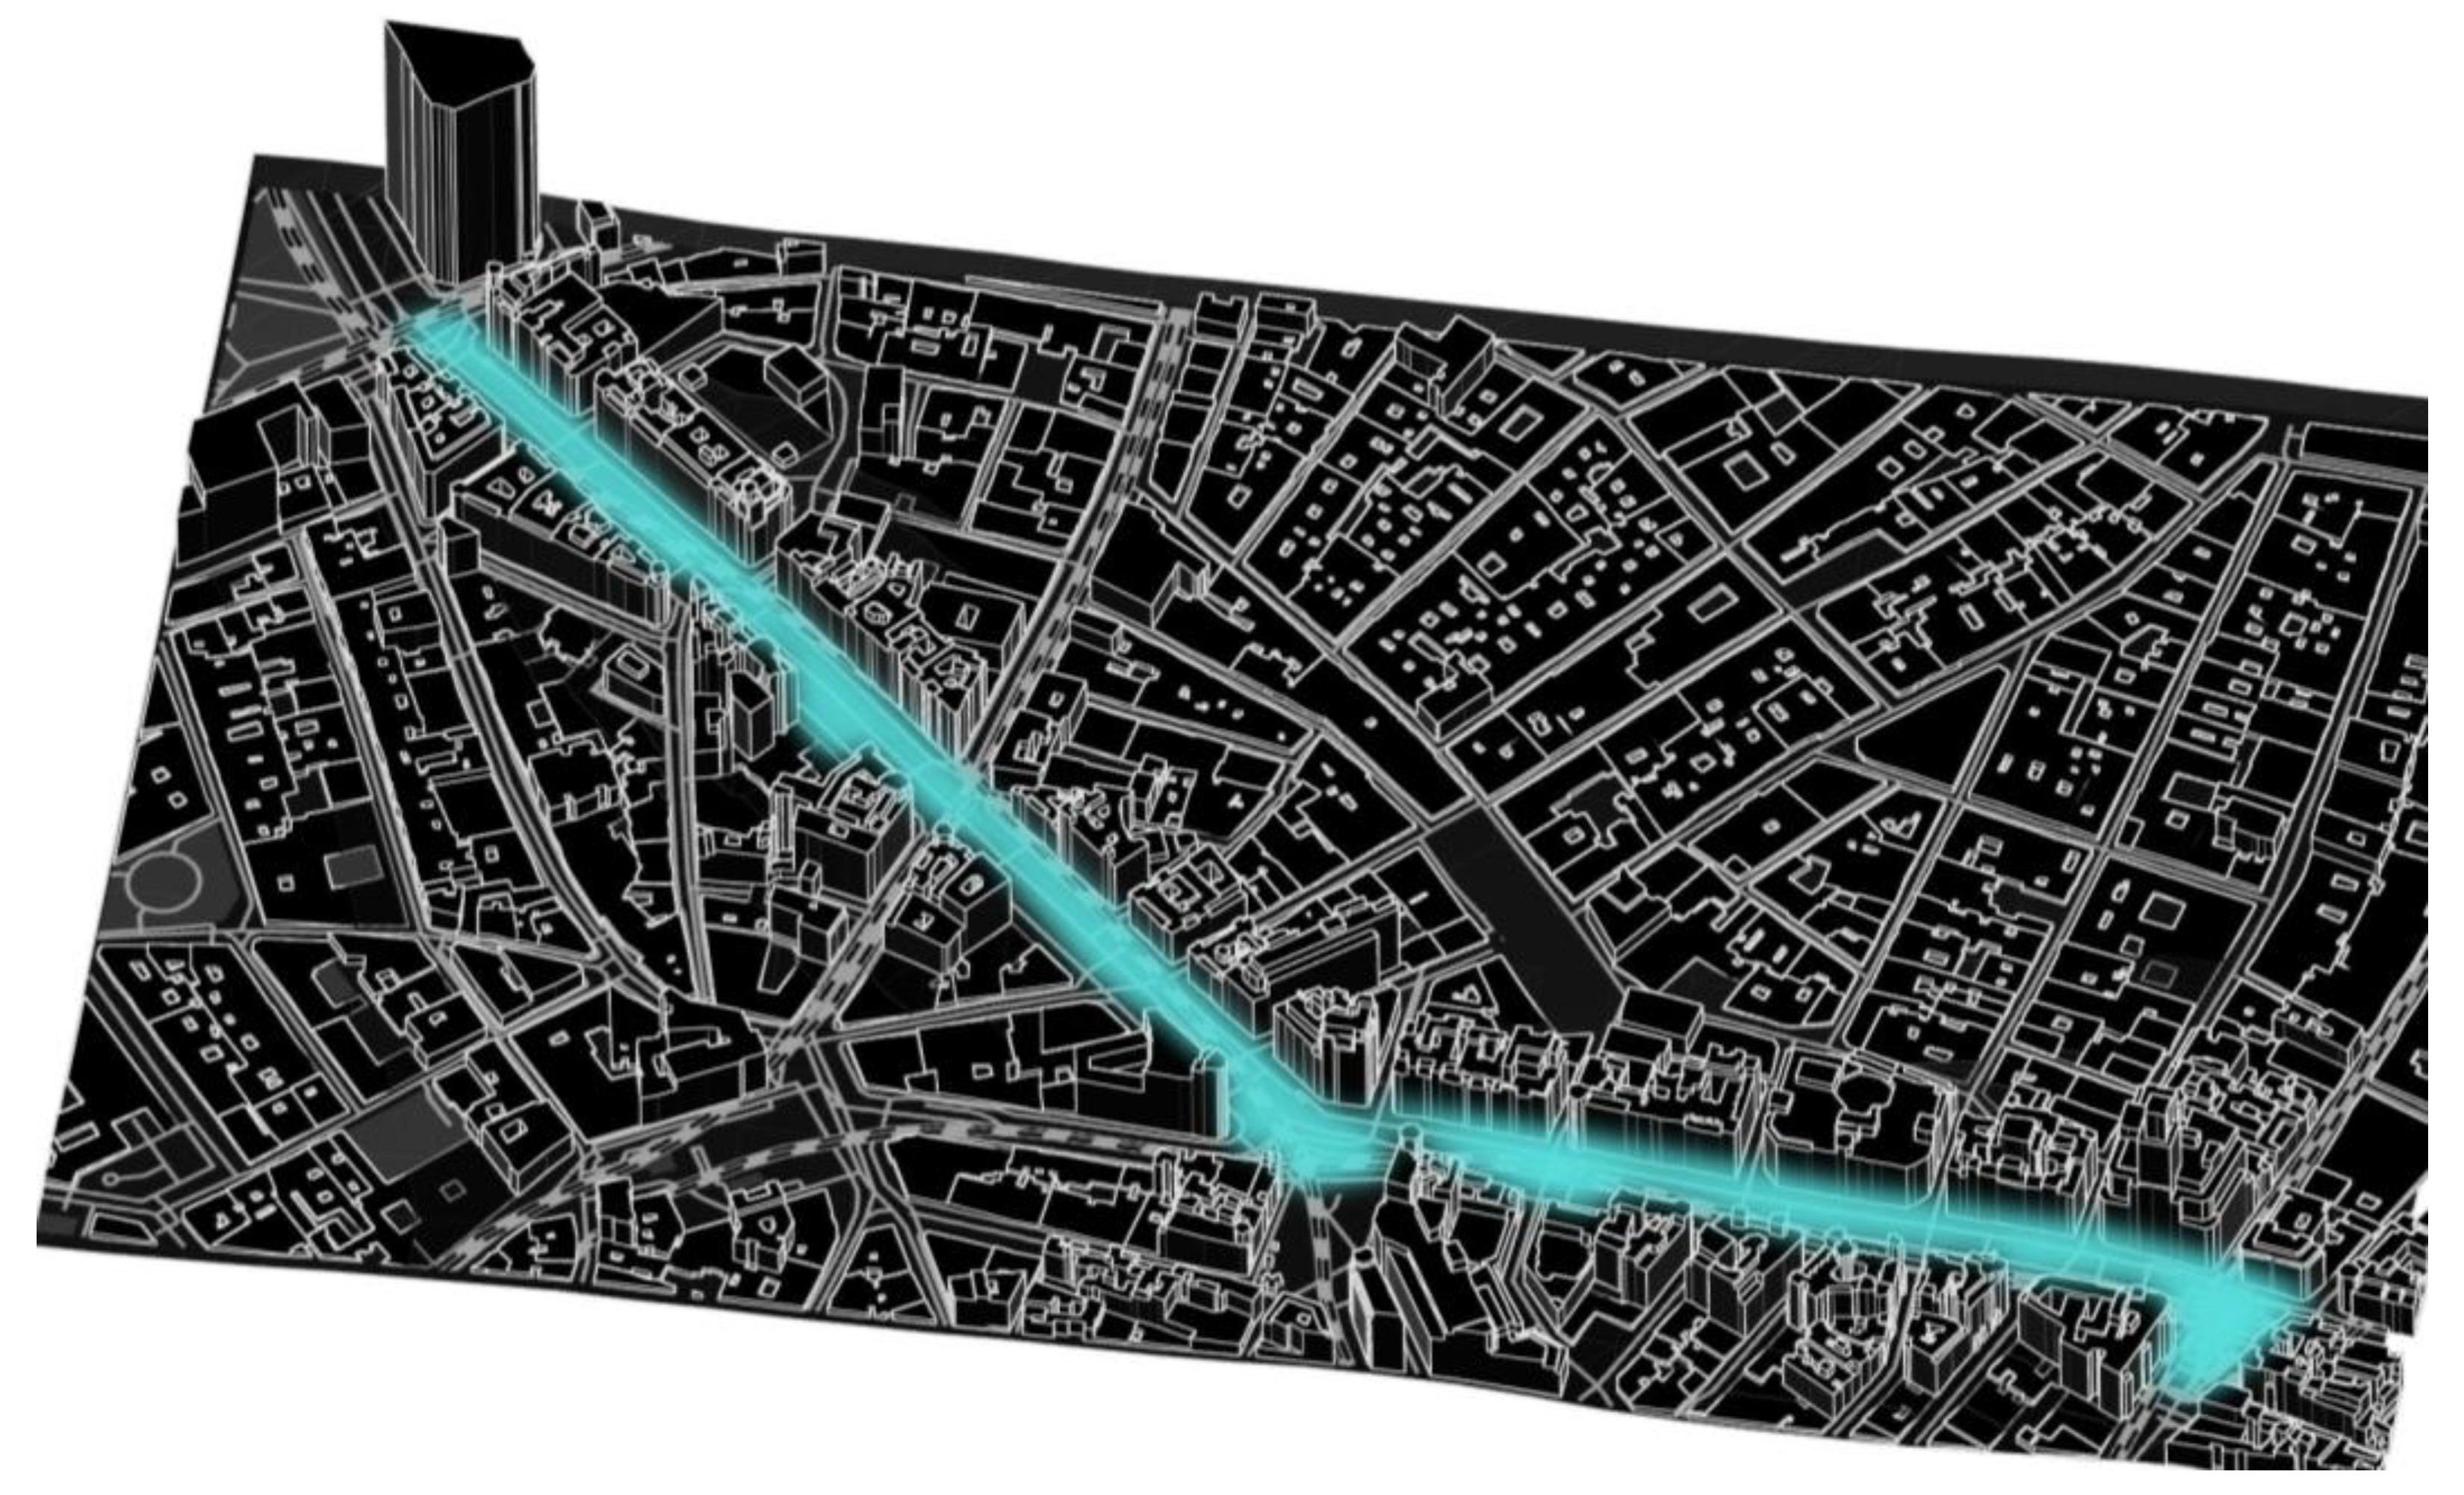
Figure 2.
Gran Vía plan enlargement, 3D. Area of analysis indicated in turquoise colour. Original plan obtained from Cadmapper, modified in Photoshop by Authors.
Figure 2.
Gran Vía plan enlargement, 3D. Area of analysis indicated in turquoise colour. Original plan obtained from Cadmapper, modified in Photoshop by Authors.
Gran Vía, due to all touristic and commercial activity developed in this avenue, has significant much higher lighting levels than the surrounding areas, as it can be appreciated on the Figure 3.
Analysing in detail, shown in the Figure 5, the image (a) shows the area used for lighting calculations. It is a shop in Gran Vía, a principal avenue for commercial activities. The image (b) shows the lighting level recorded with an average of 2996 K and 388 lx. The wavelength spectrum is distributed with higher levels on the medium and wide wavelengths, around 600 nm and reduced short wavelengths. Considering, this is the street, the light intensity is much higher than required, turning into lighting pollution.
In the Figure 6, we analyse the lighting and wavelength values of the screen displayed on the shop window. The image (a) shows the area used for lighting calculations. It is the same shop used on previous Figure 5, indicated above. The image (b) shows the lighting level recorded with a colour temperature average of 4879 K and intensity of 251 lx. The wavelength spectrum is distributed in two peaks: on the medium and wide waves, around 600 nm as well as on the short wavelengths, at 450 nm. This demonstrates the direct relation between the screens and the short wavelengths emissions. Therefore, pedestrians who visit that place are receiving those emissions, triggering cortisol levels on their organisms.
As a similar situation, shown in Figure 7, another screen on a vitrine. After measured with the photo-spectrometer, we observed a high peak on the short wavelengths at 420 nm. We observed only one peak of short wavelengths, as there is no other type of light immediately to it. This means that there is not dissipation of the high peak, then the incidence is harder. Also, the blue scale increases to 28.6%, almost double that the previous image (Figure 6).
In the Figure 8, there is only the main entrance of the shop, which have extremely high levels of intensities, 2692 lx, as indicated in the image (b). This level of intensities is much higher than the surrounding shops and create huge discomfort due to the contrast. Regarding the wavelength, it presents two peaks, one around 450 nm and the other on the wider wavelength, around 620 nm.
In the main center of Plaza Callao (Callao Square) Figure 9, the lighting levels shown in the photo-spectrometer, indicate lower in comparison with the shops of Gran Vía, although there is lot of indirect light reflexions from screen and other luminous advertisement around. In the main center there is an intensity of 20 lx and no direct incidence of short wavelengths, as per the wavelength distribution, shown in the graphic (b), and the predominant warm light, CCT: 2294 K
The other square, Gran Vía Plaza, presents similar conditions to Callao Plaza. As show in Figure 10, the CCT below is 3000K and has low levels of short wavelengths, with predominance of long wavelengths, around 600 nm; regarding the lighting intensity it is 134 lx.

Table 1.
Comparison of lighting levels at different points of Gran Vía. Measurements taken at 1m of high from the floor.
Table 1.
Comparison of lighting levels at different points of Gran Vía. Measurements taken at 1m of high from the floor.
| Location | illuminance | CCT | Wavelength peaks nm |
Blue level % | ||
|---|---|---|---|---|---|---|
| Lx-Luxes | Fc-Foot candle | |||||
| 1 | Plaza Gran Vía | 134 | 12 | 2989 | 650 | 7.53 |
| 2 | GV 27 | 308 | 28 | 8489 | 470 | 28.60 |
| 3 | GV 33 | 251 | 23 | 4879 | 470 and 650 | 15.79 |
| 4 | GV 49 | 2692 | 250 | 6274 | 470 and 650 | 18.58 |
| 5 | Plaza Callao | 20 | 1 | 2294 | 650 | 0.00 |
3.1. Toledo Analysis
As Toledo is a World heritage, the urban growing is controlled, the commercial activities are limited as well and their lighting intensities at night remains low, ensuring a dark atmosphere at night and the protection of the dark night sky.
The areas of analysis were two types: the main centre, where most of the tourists use to visits, Plaza Zocodover and Cuesta Fernando V, and another street with very low illumination. In the image below, Figure 11, is indicated in yellow the areas to analyse and in white, some landmarks as a reference.
In the image below, Figure 12, is indicated the four points selected to analyse the lighting. Each of those points is indicated with a number and the angle where the picture was taken:
Point 1. Tornerías street
Point 2. Cuesta de Fernando V
Point 3. Plaza Zocodover, view to Zocodover #6. (Figure 13).
Point 4. Plaza Zocodover, view to Zocodover #13. (Figure 14).
Below, in the Figure 15, we appreciate the lighting levels minimum for pedestrians use while it maintains darkness for the residential use.
Figure 15.
Toledo street. Calle Tornerías, #23. The image (a) shows the analysed area. The image (b) shows the lighting measurements and wavelength levels recorded on the image (a).
Figure 15.
Toledo street. Calle Tornerías, #23. The image (a) shows the analysed area. The image (b) shows the lighting measurements and wavelength levels recorded on the image (a).
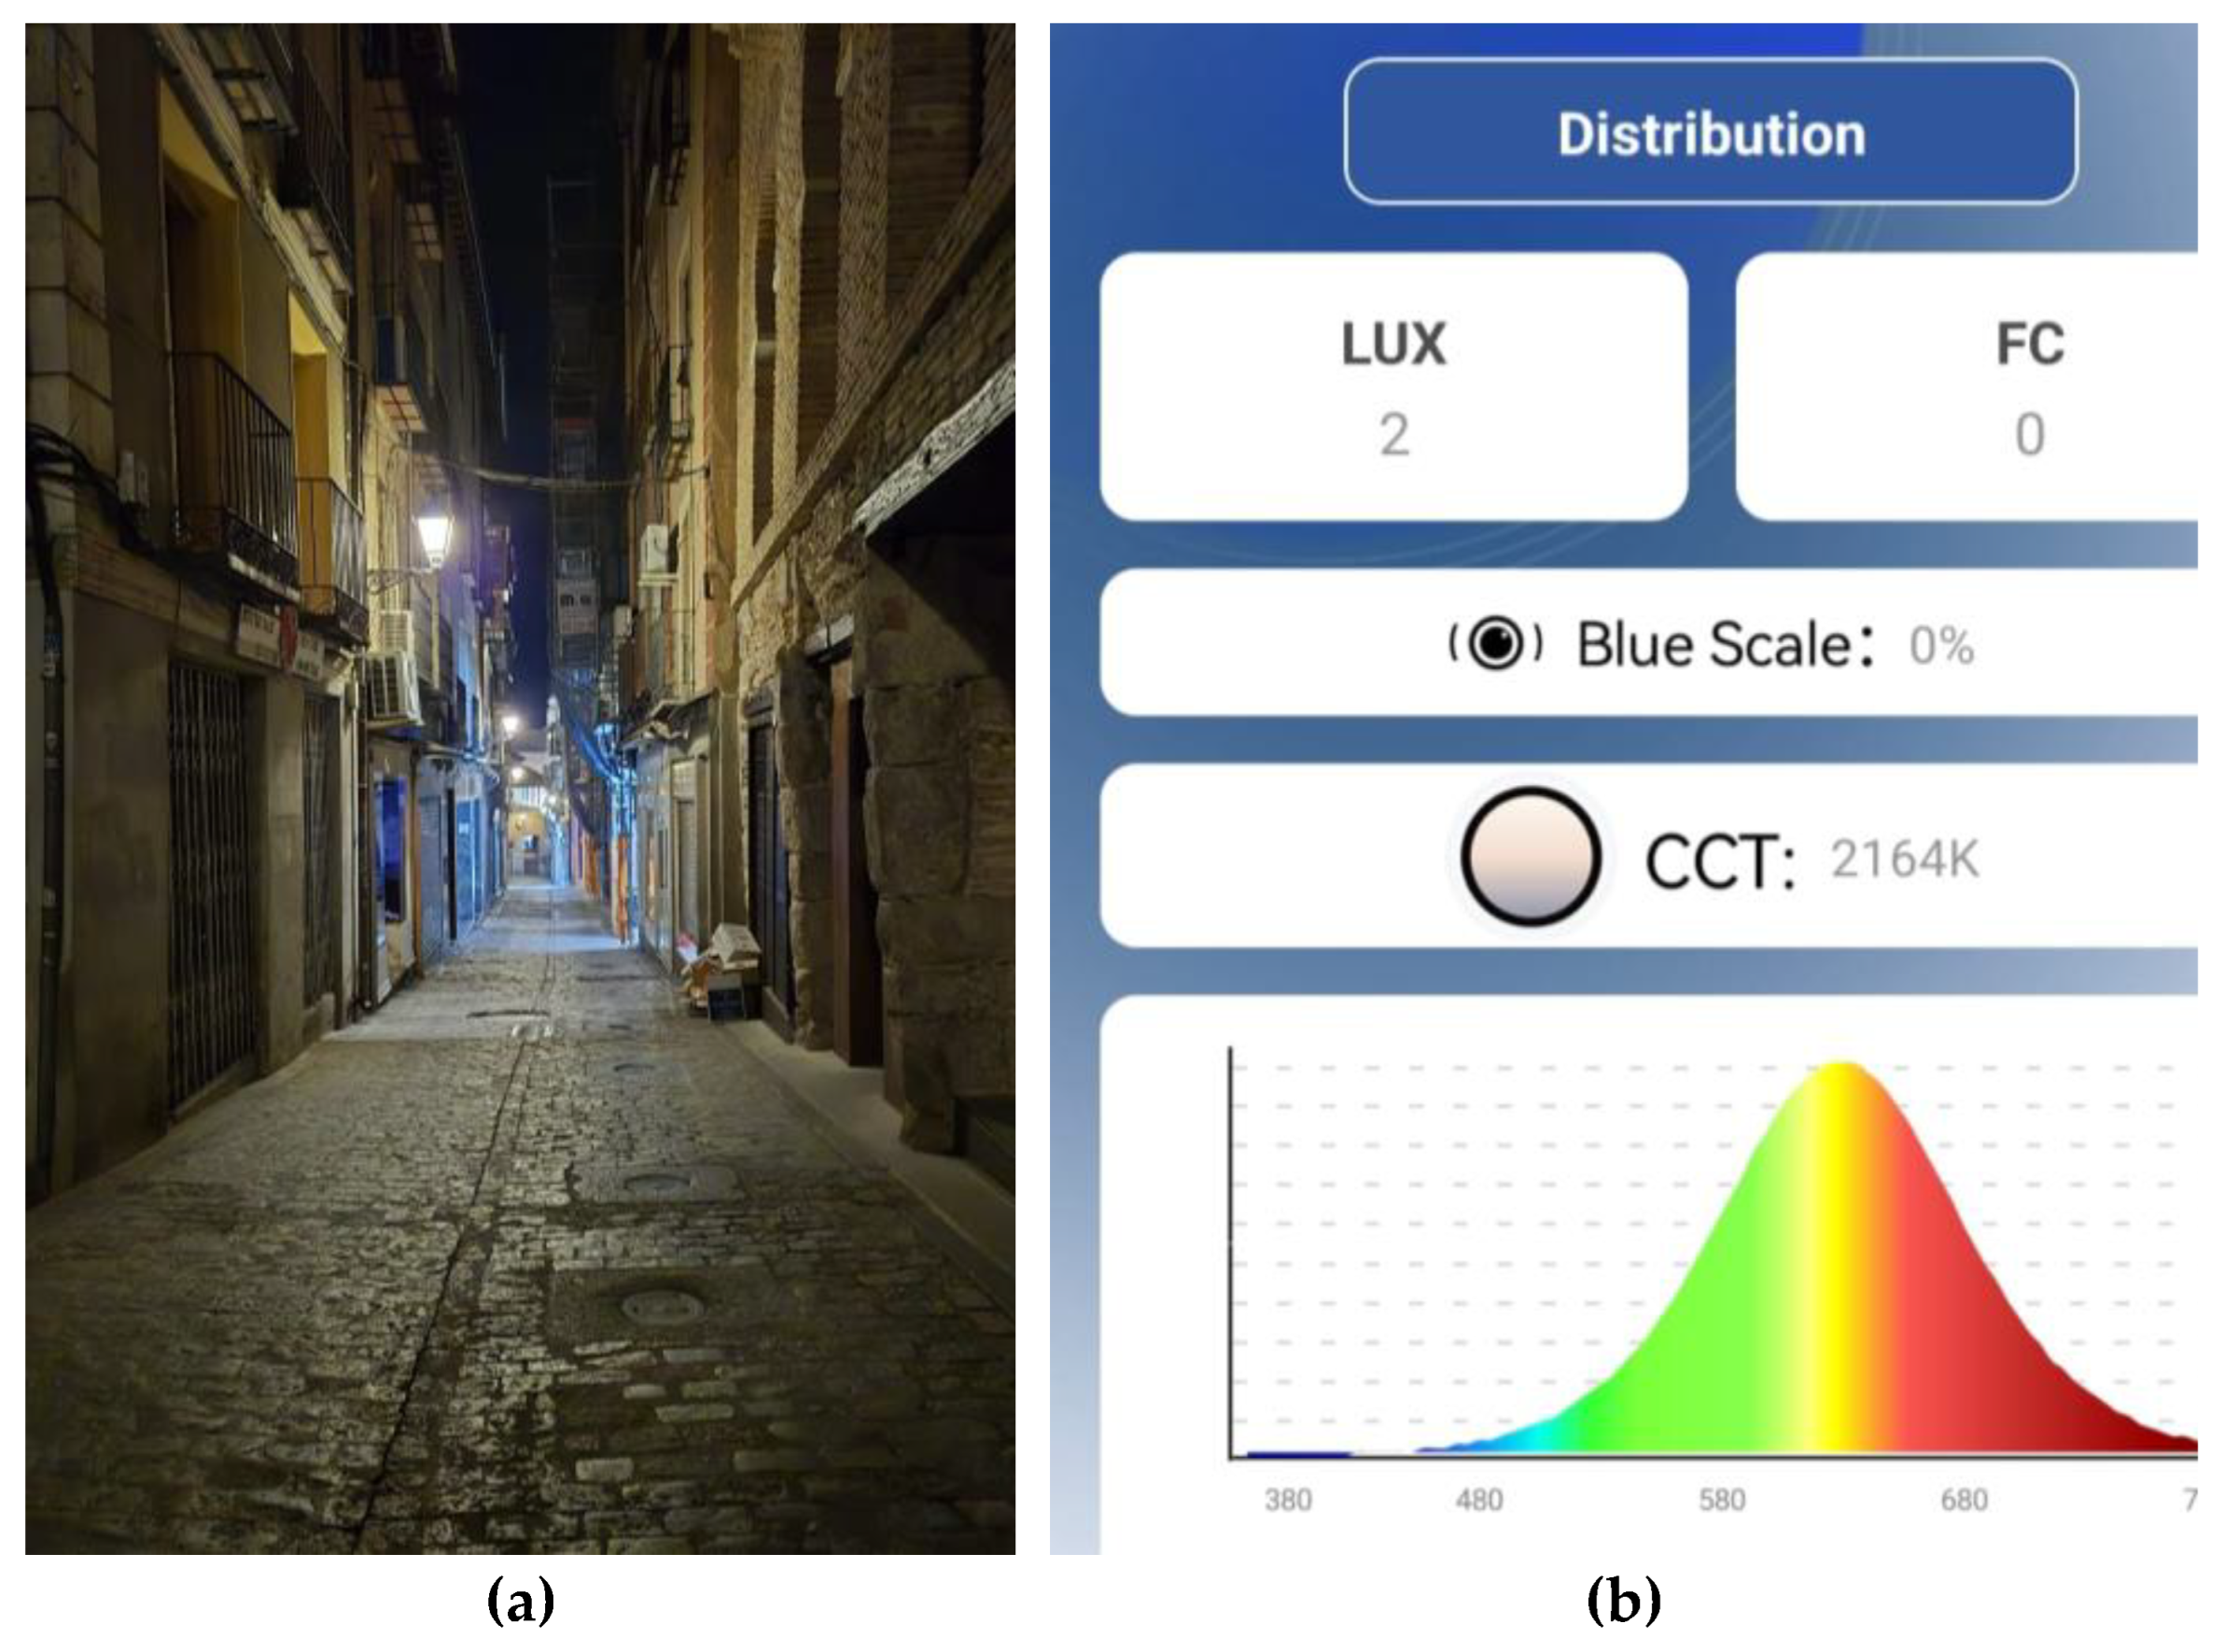
Figure 16.
Toledo street. Cuesta de Carlos V, #9, view to Calle Armas. The image (a) shows the analysed area. The image (b) shows the lighting measurements and wavelength levels recorded on the image (a).
Figure 16.
Toledo street. Cuesta de Carlos V, #9, view to Calle Armas. The image (a) shows the analysed area. The image (b) shows the lighting measurements and wavelength levels recorded on the image (a).
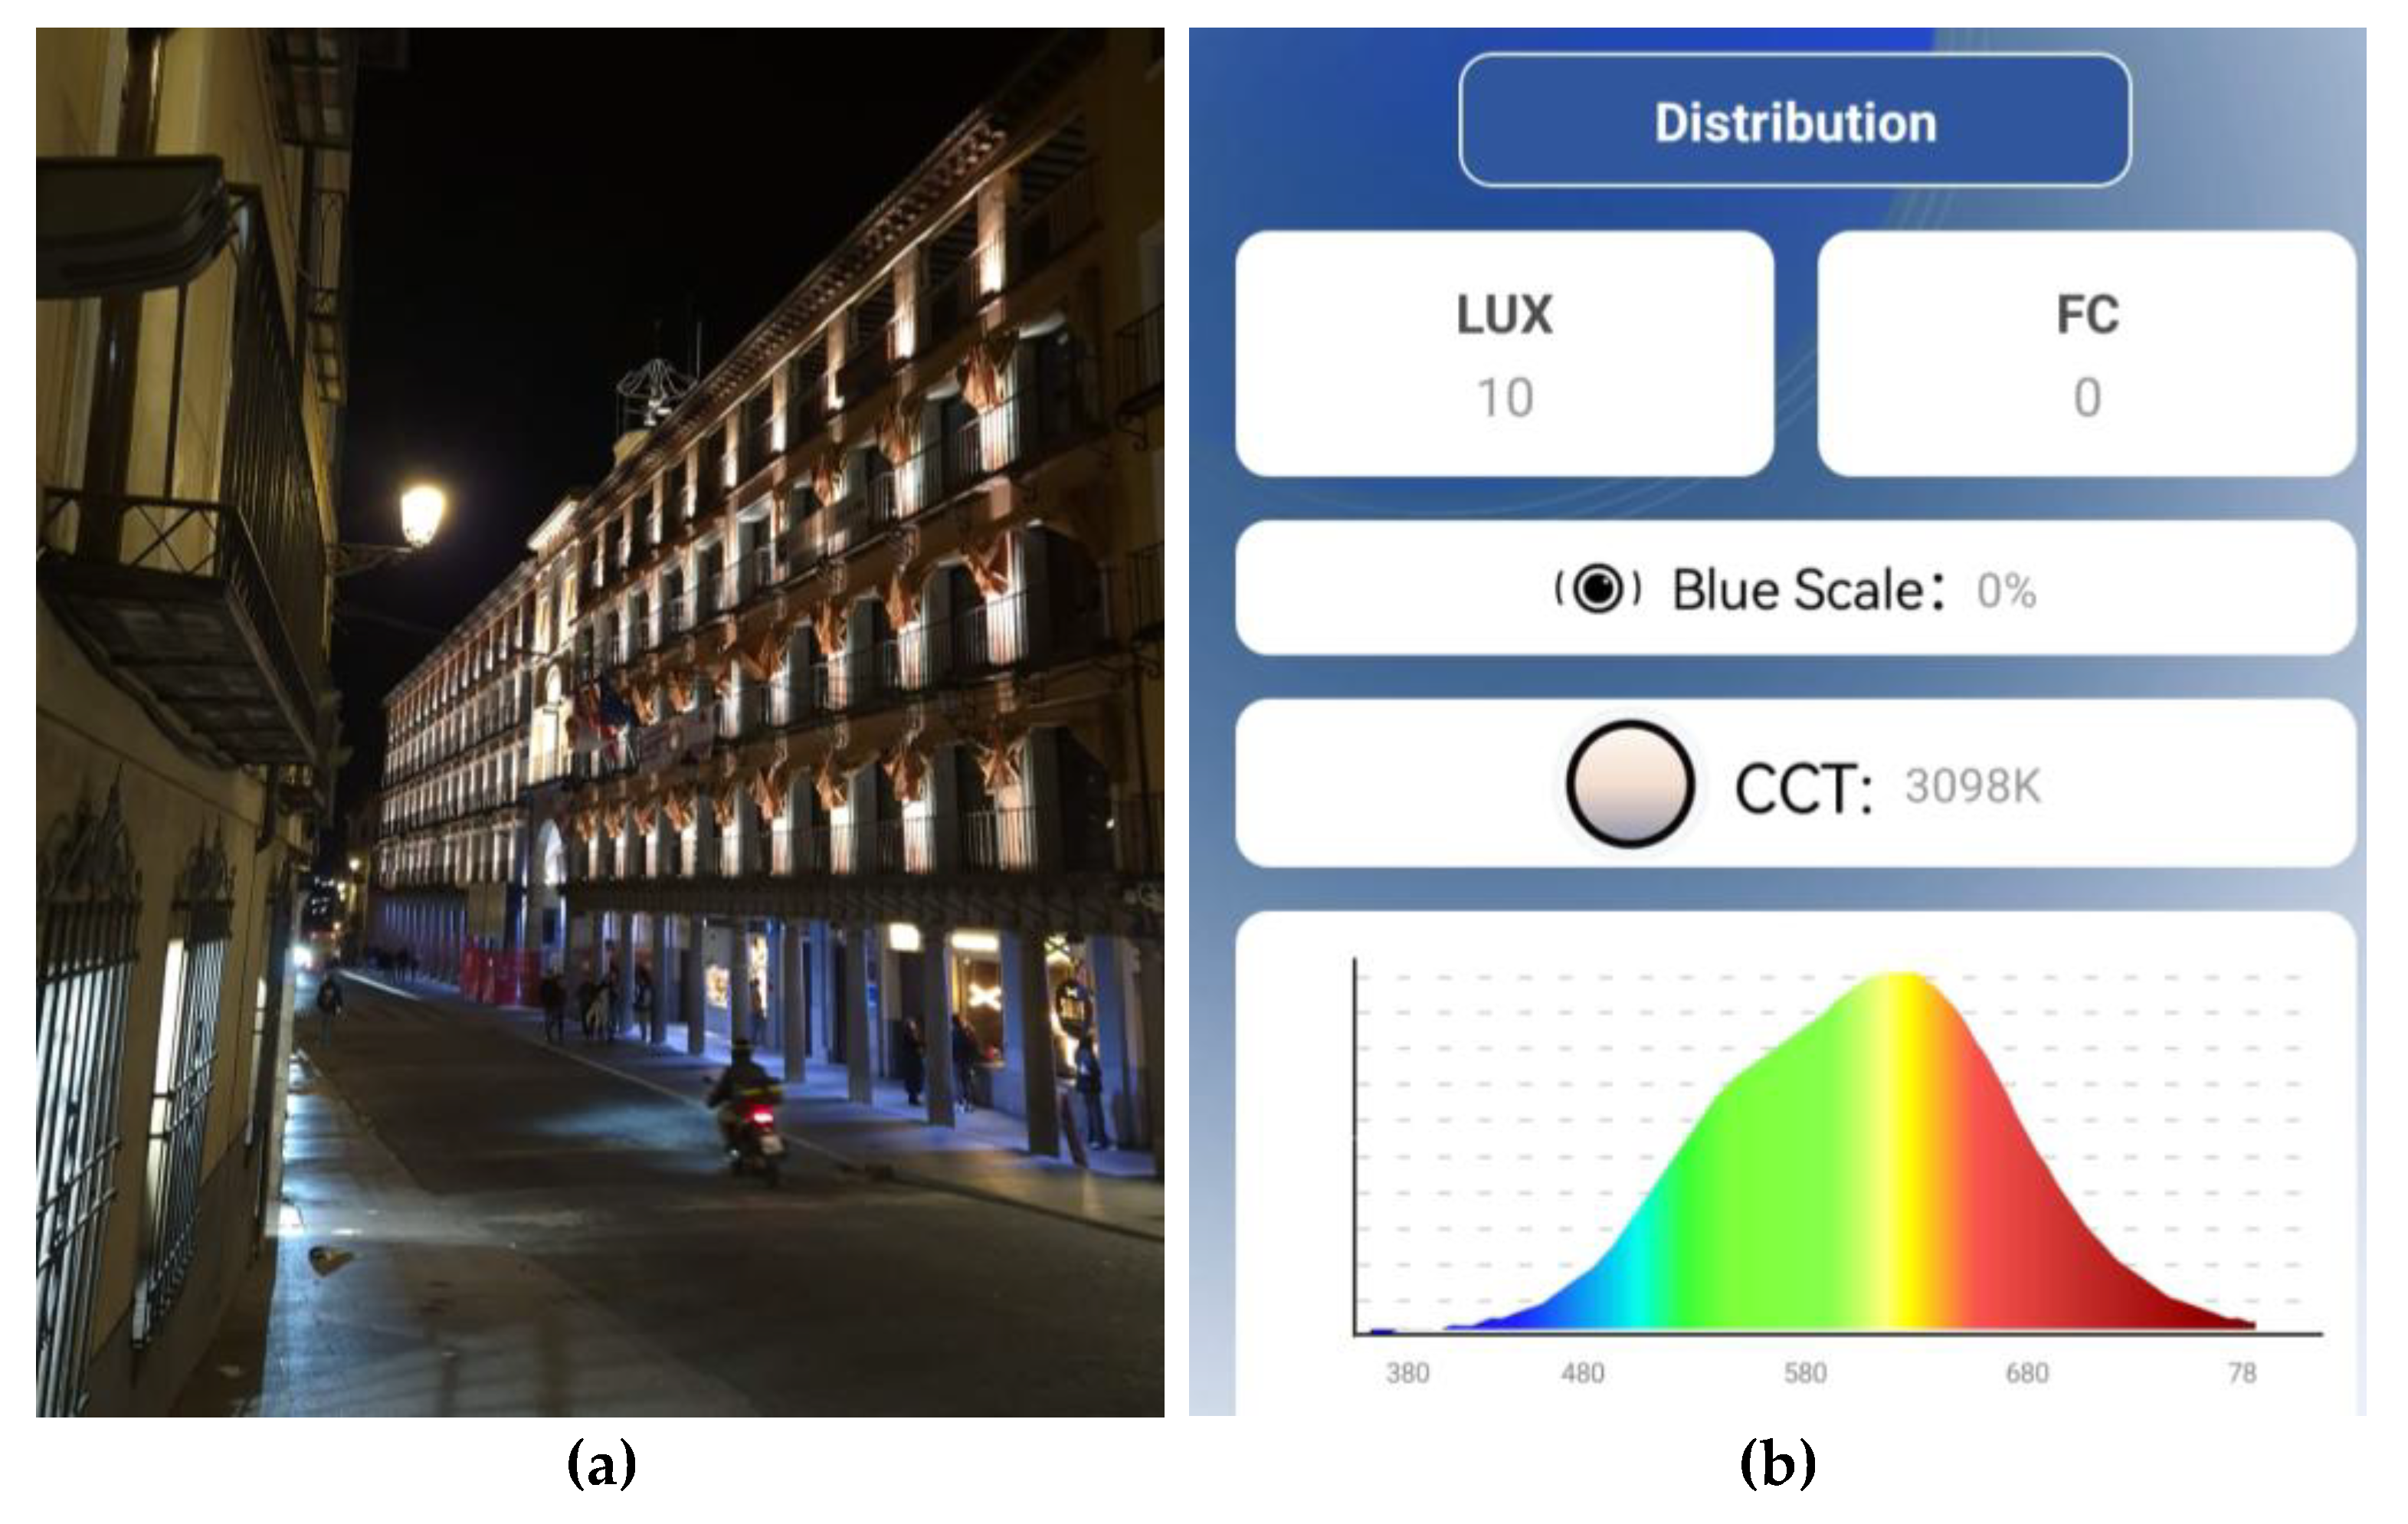
Figure 17.
Toledo square. Plaza Zocodover. The image (a) shows the analysed area. The image (b) shows the lighting measurements and wavelength levels recorded on the image (a).
Figure 17.
Toledo square. Plaza Zocodover. The image (a) shows the analysed area. The image (b) shows the lighting measurements and wavelength levels recorded on the image (a).

Figure 18.
Toledo square. Plaza Zocodover. The image (a) shows the analysed area. The image (b) shows the lighting measurements and wavelength levels recorded on the image (a).
Figure 18.
Toledo square. Plaza Zocodover. The image (a) shows the analysed area. The image (b) shows the lighting measurements and wavelength levels recorded on the image (a).
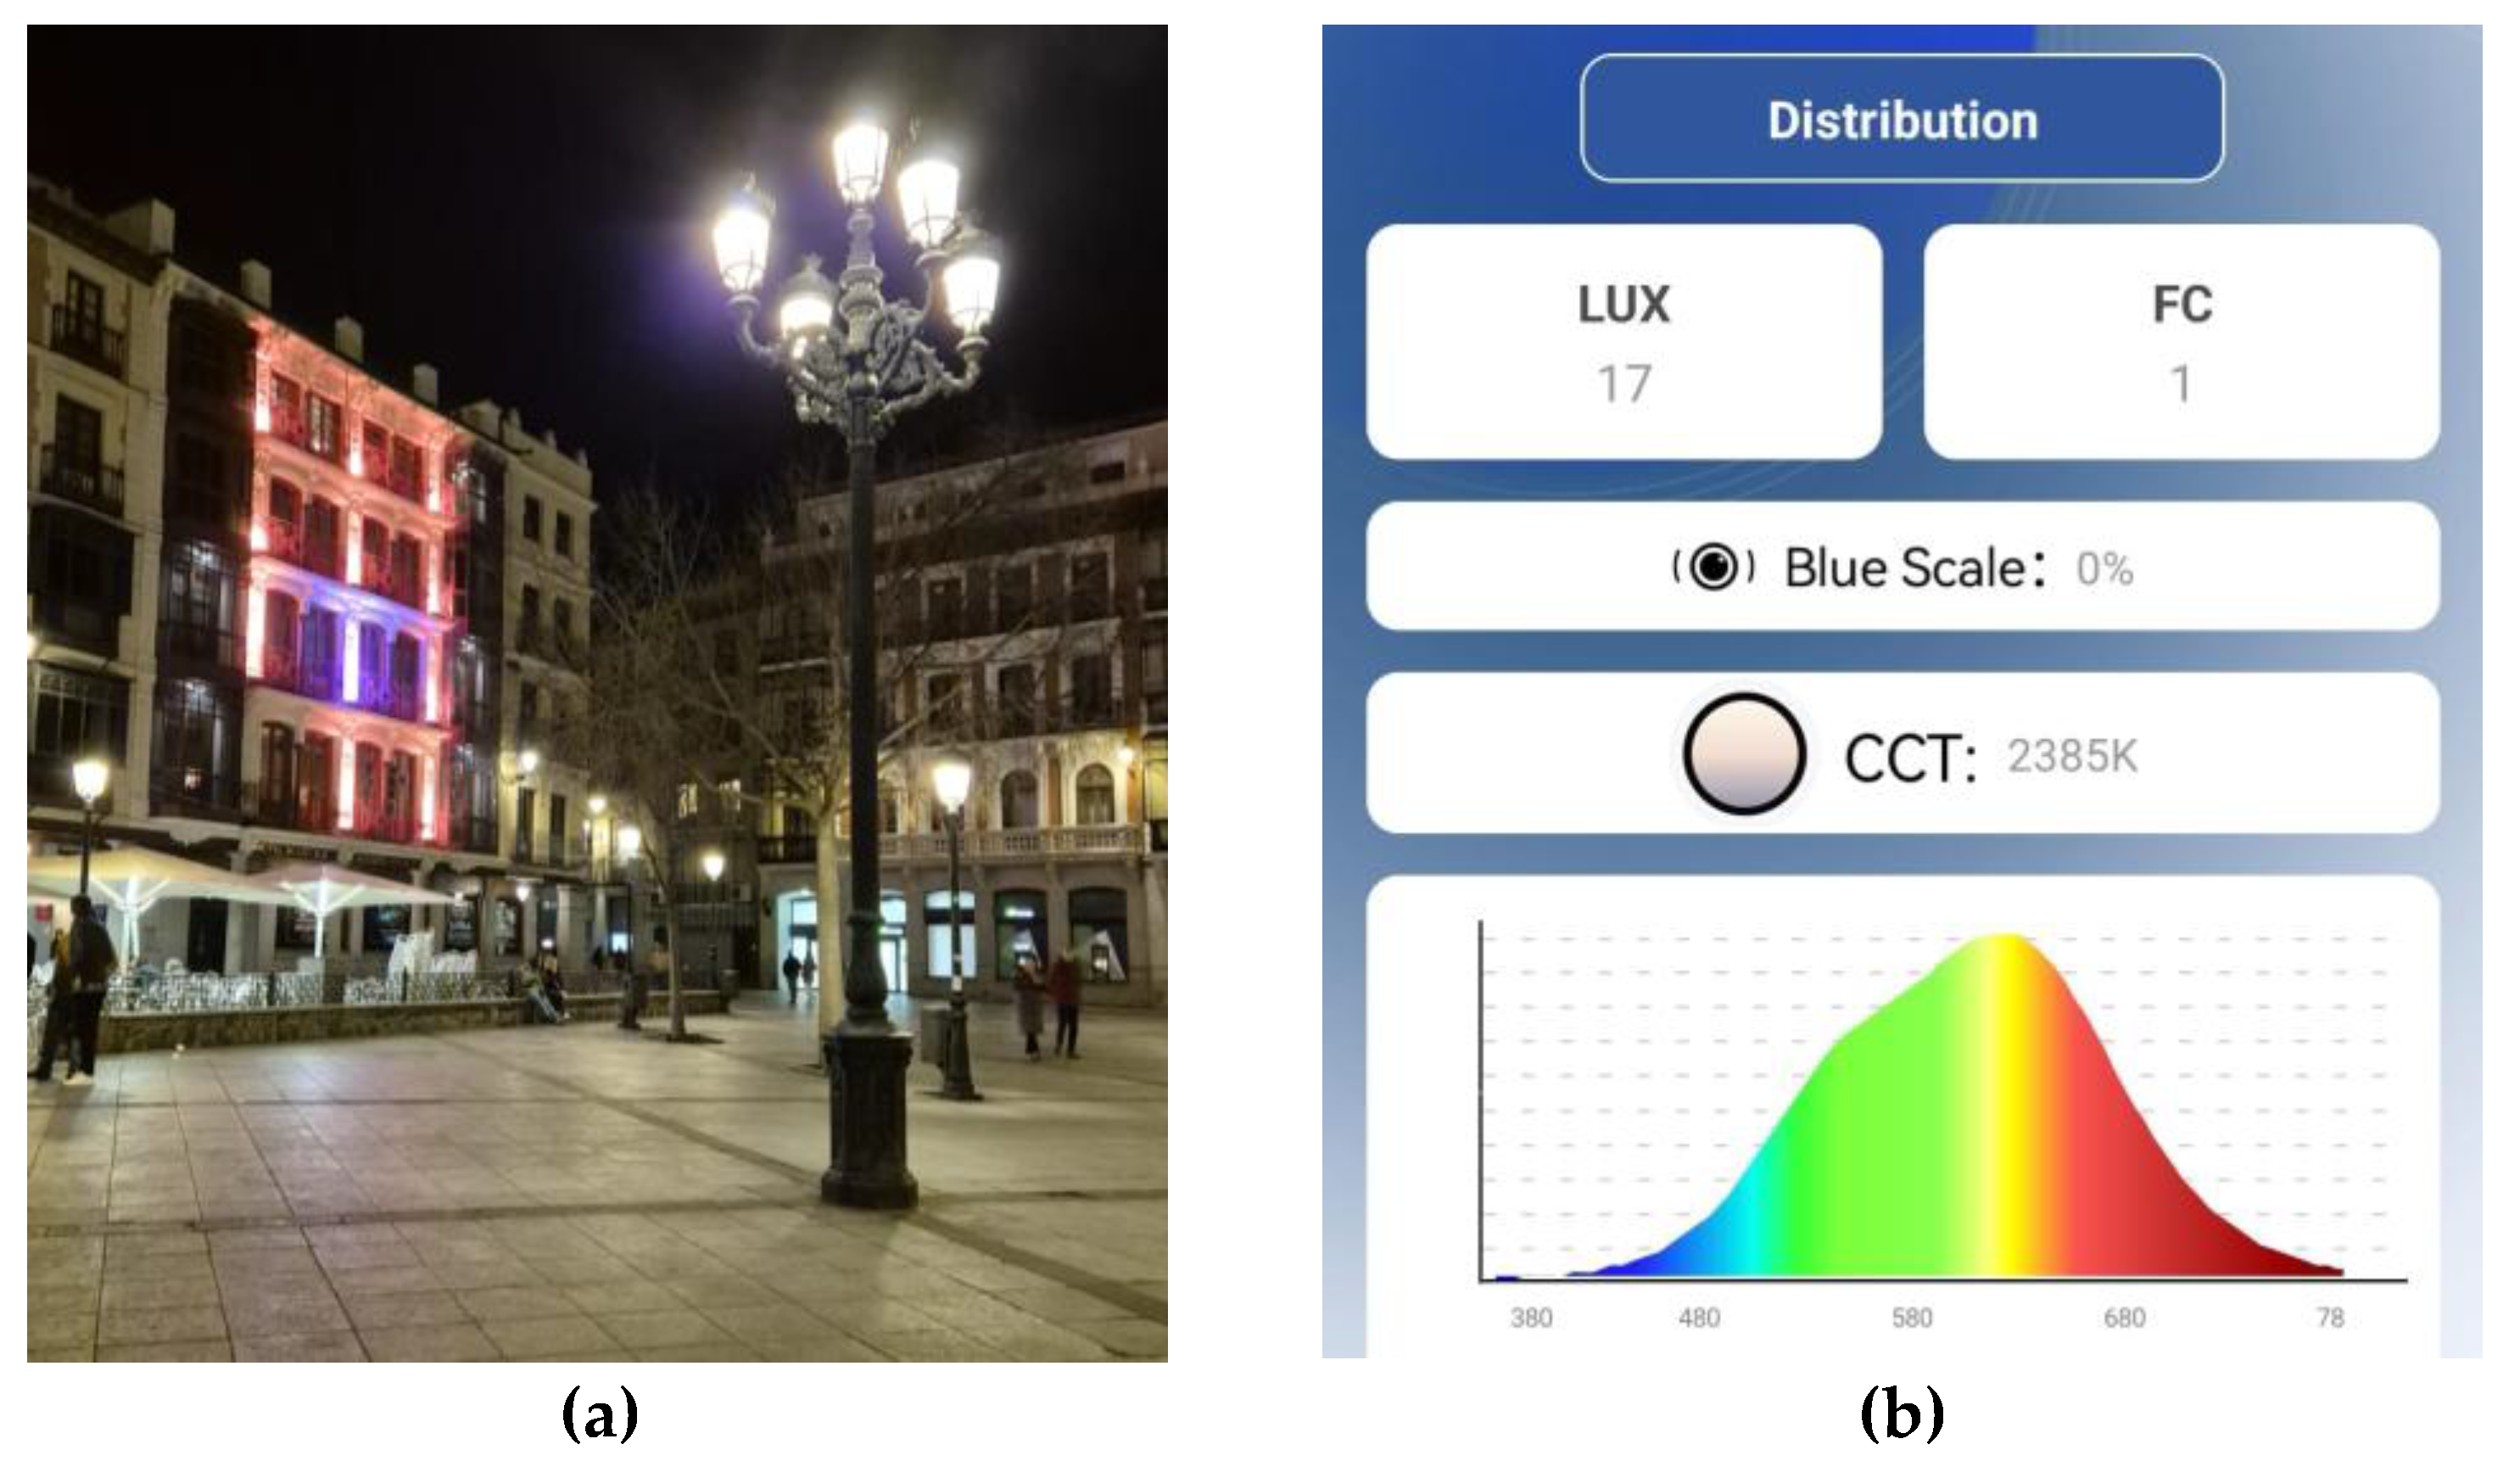
Table 2.
This is a table. Tables should be placed in the main text near to the first time they are cited.
Table 2.
This is a table. Tables should be placed in the main text near to the first time they are cited.
| Location | illuminance | CCT K |
Wavelength peaks nm |
Blue level % | ||
|---|---|---|---|---|---|---|
| Lx-Luxes | Fc-Foot candle | |||||
| 1 | Tornería street #23 | 2 | 0 | 2164 | 630 | 0 |
| 2 | Cuesta de Fernando V #9 | 10 | 0 | 3098 | 630 | 0 |
| 3 | Plaza Zocodover view to Z#6 | 9 | 0 | 3451 | 630 | 0 |
| 4 | Plaza Zocodover view to Comercio street | 17 | 1 | 2385 | 630 | 0 |
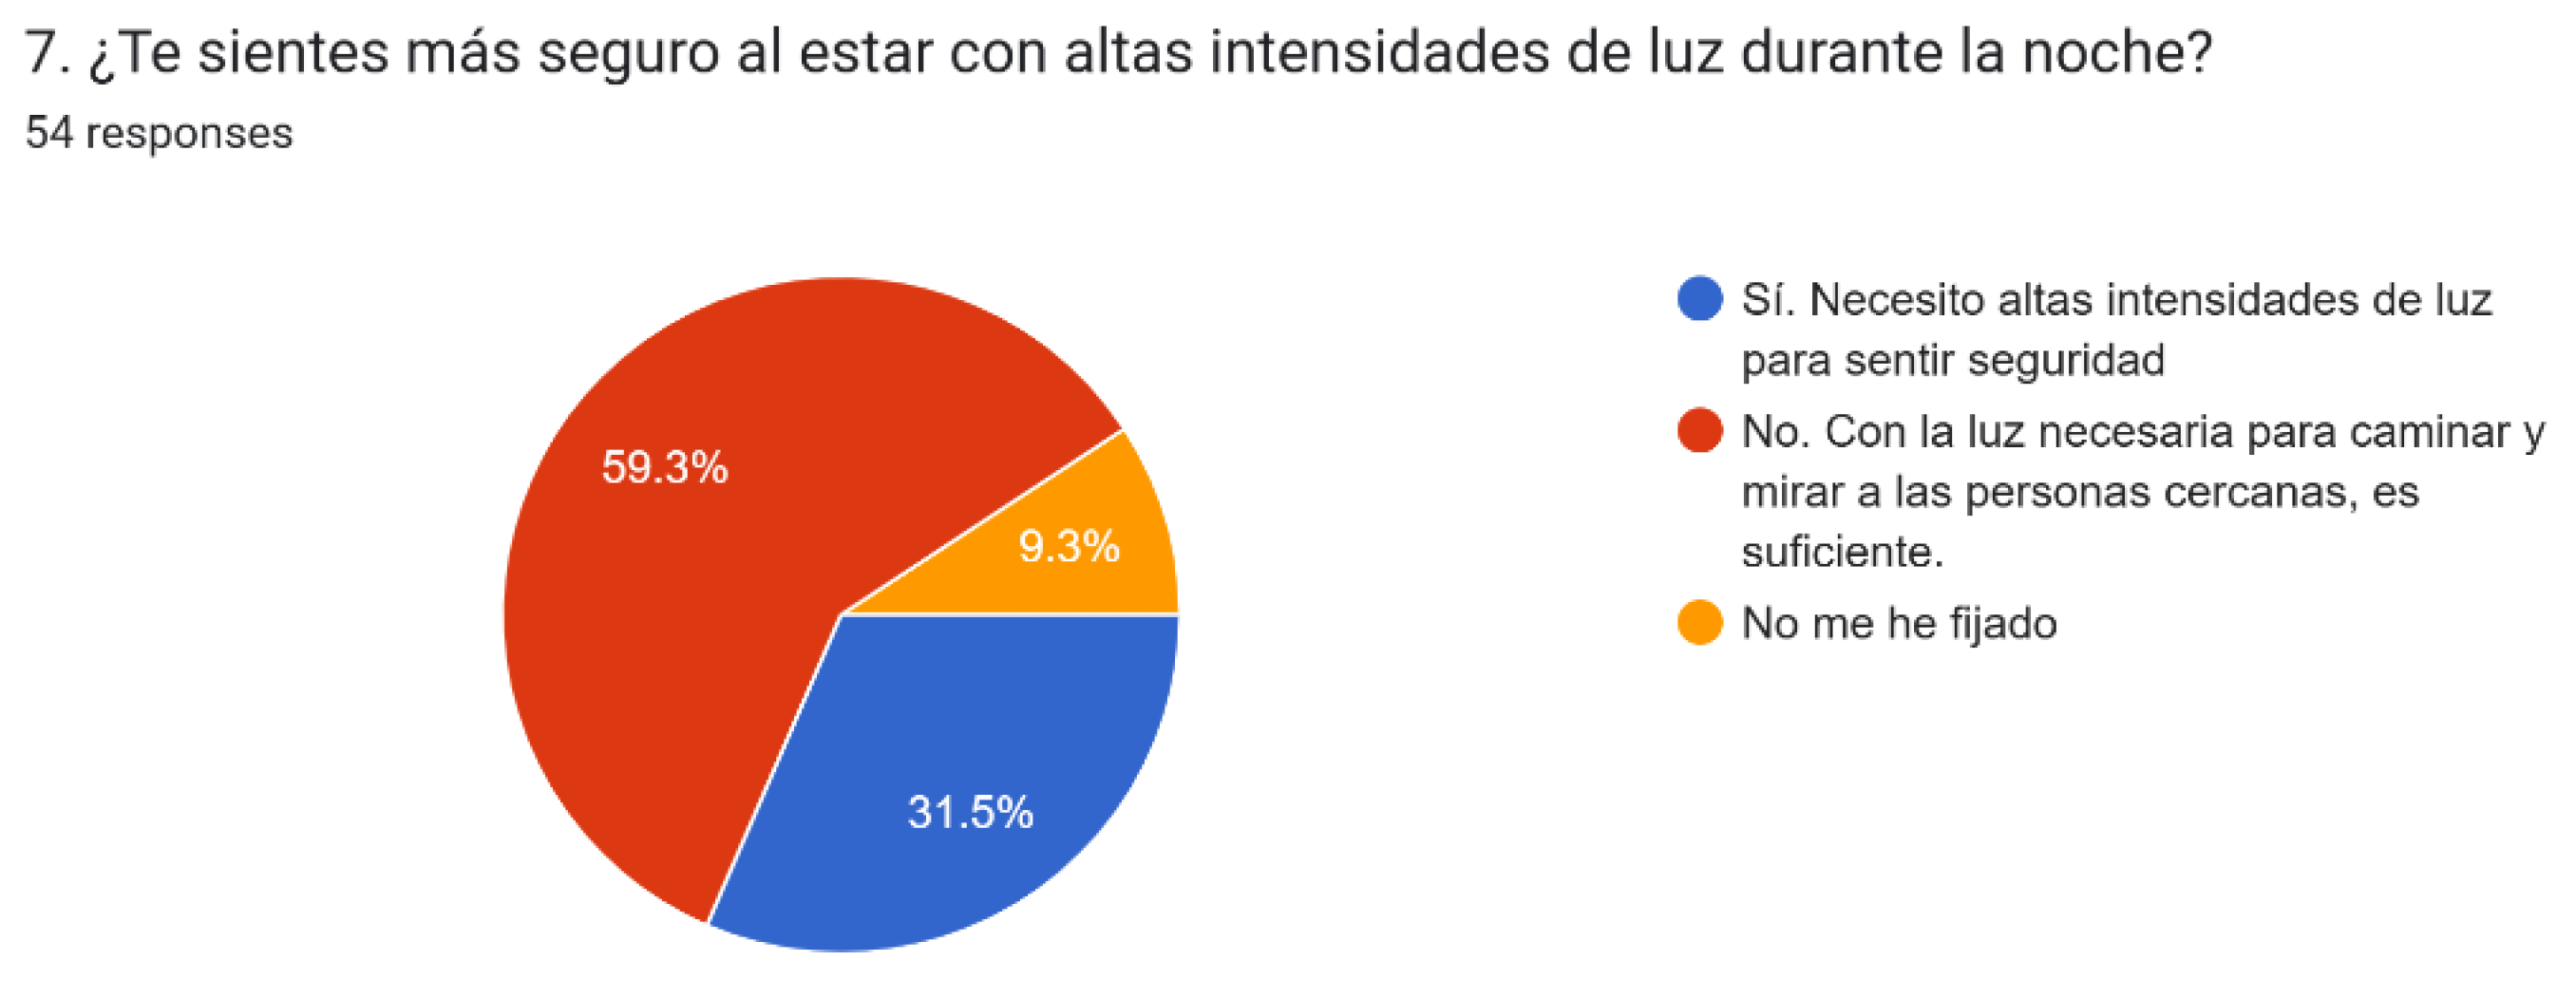
Regarding the surveys done to the inhabitants of Madrid and Toledo, one question was: Do you feel safer with high intensity lighting during the night? And 59.3% expressed that they don’t need high intensities at night to feel safe and secure; with the necessary lighting to walk and to have facial recognition is enough.
Table 3.
Results of the survey. Question #7.
| Do you feel safer being at high intensity lighting during the night? | |
|---|---|
| No. It is enough only the necessary light for walking and facial recognition | 59.3% |
| Yes. I need high intensity lighting at night to feel safe and secure | 31.5% |
| I haven’t noticed the difference | 9.3% |
Figure 19.
Pie chart. Survey results from question #8. Author: Nubi León Martínez.
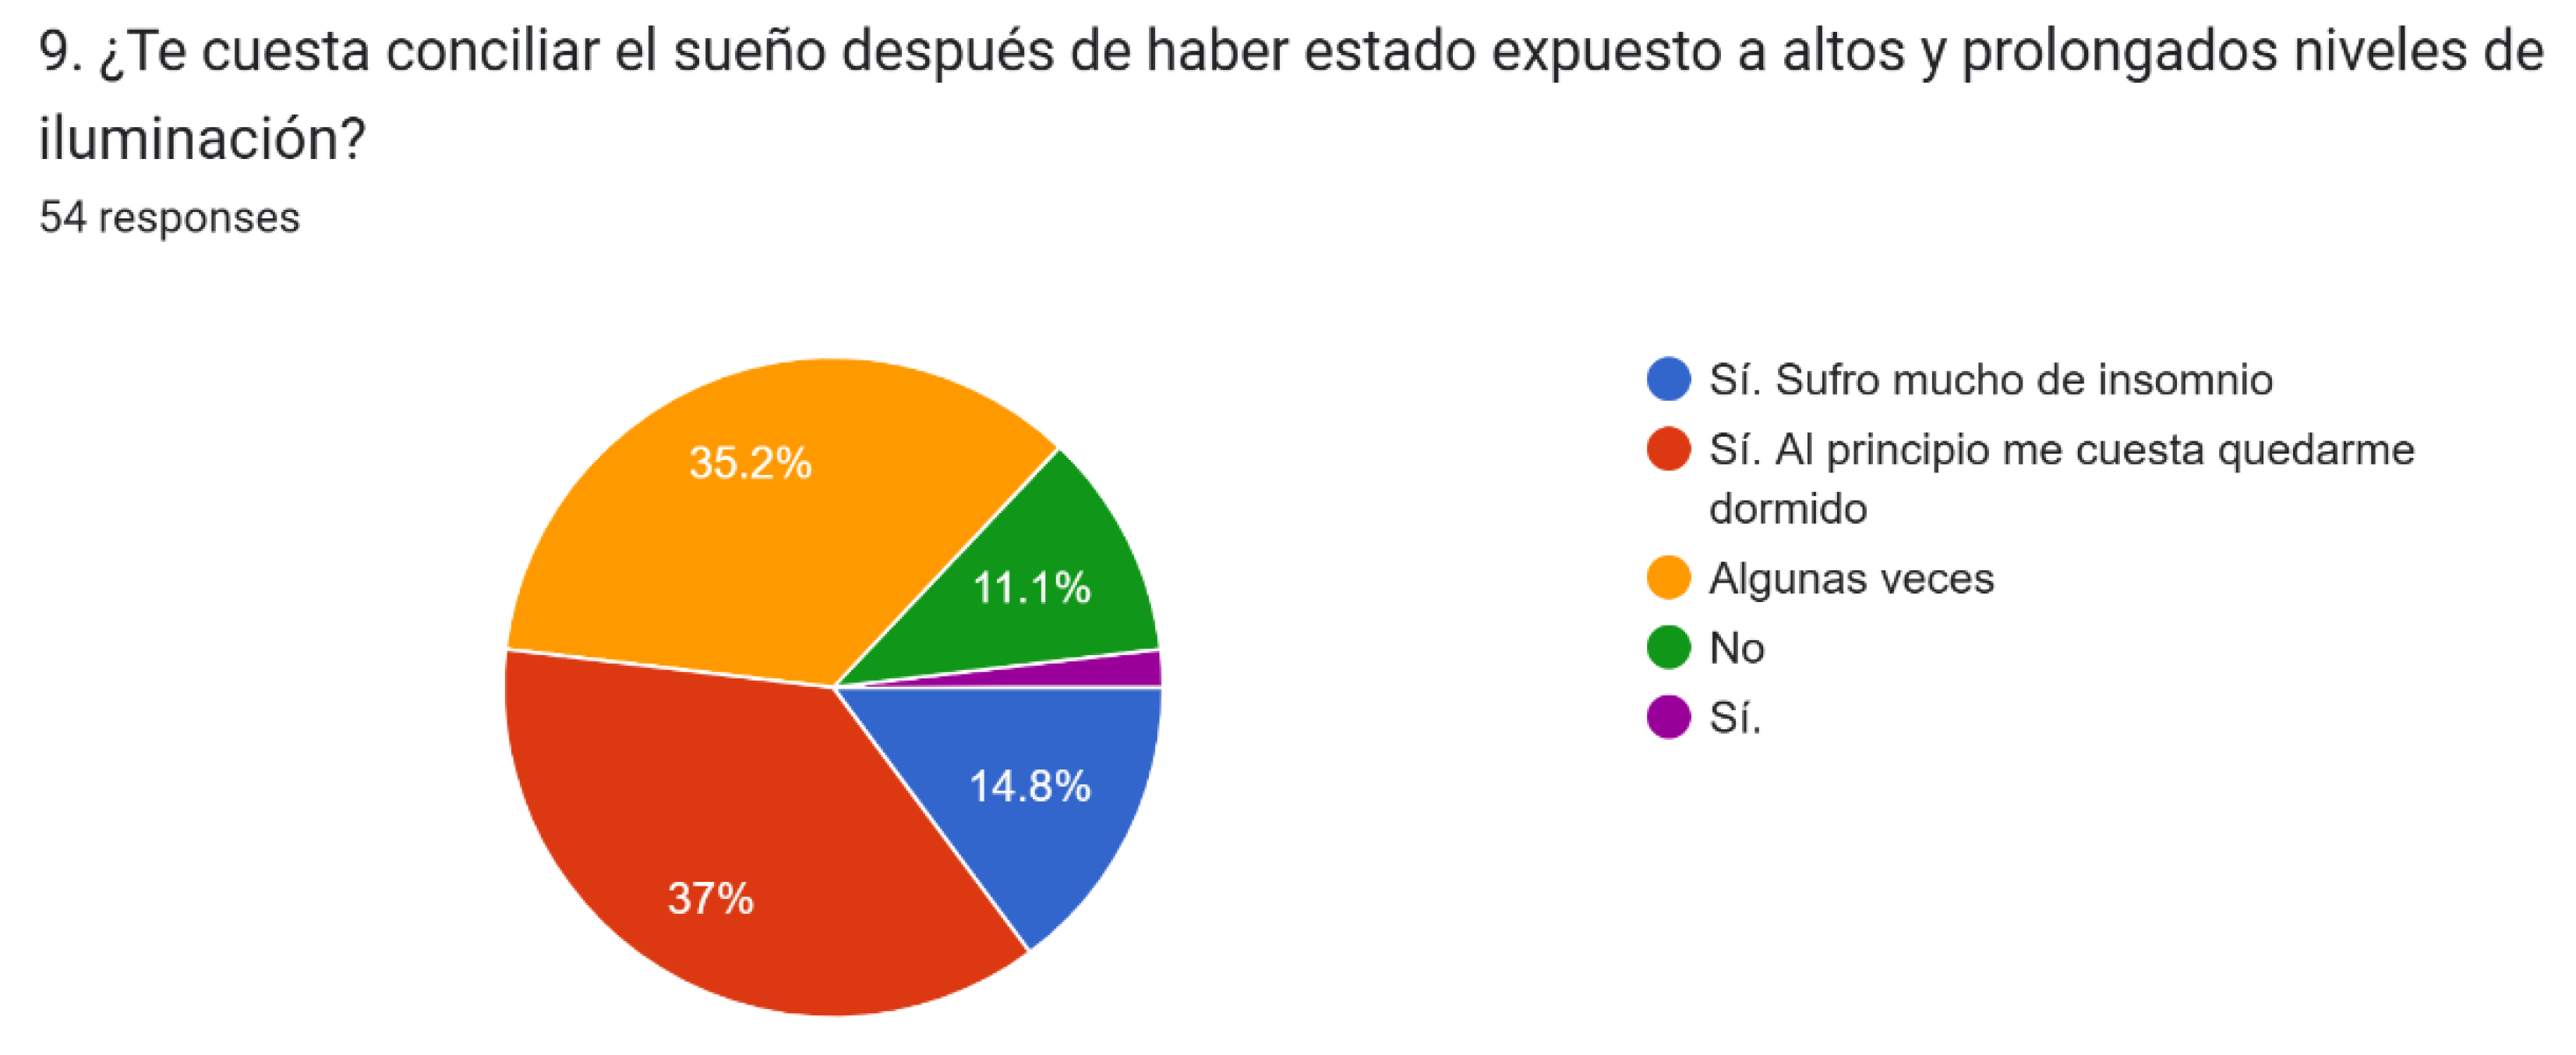
Another relevant question that gave us interesting results was our question#8 of the suvey, in which we noticed that 88.9% had difficulties to fall asleep, whereas only 11.1% could fall asleep with no problems.
Table 4.
Results of the survey. Question #9.
| Do you find it difficult to fall asleep after being exposed to prolonged high lighting levels? | ||
|---|---|---|
| Yes. I find it hard to fall asleep | 37% | |
| Sometimes | 35.2% | |
| Yes. I use to suffer from insomnia | 14.8% | |
| No | 11.1% | |
Figure 20.
Pie chart. Survey results from question #9. Author: Nubi León Martínez.
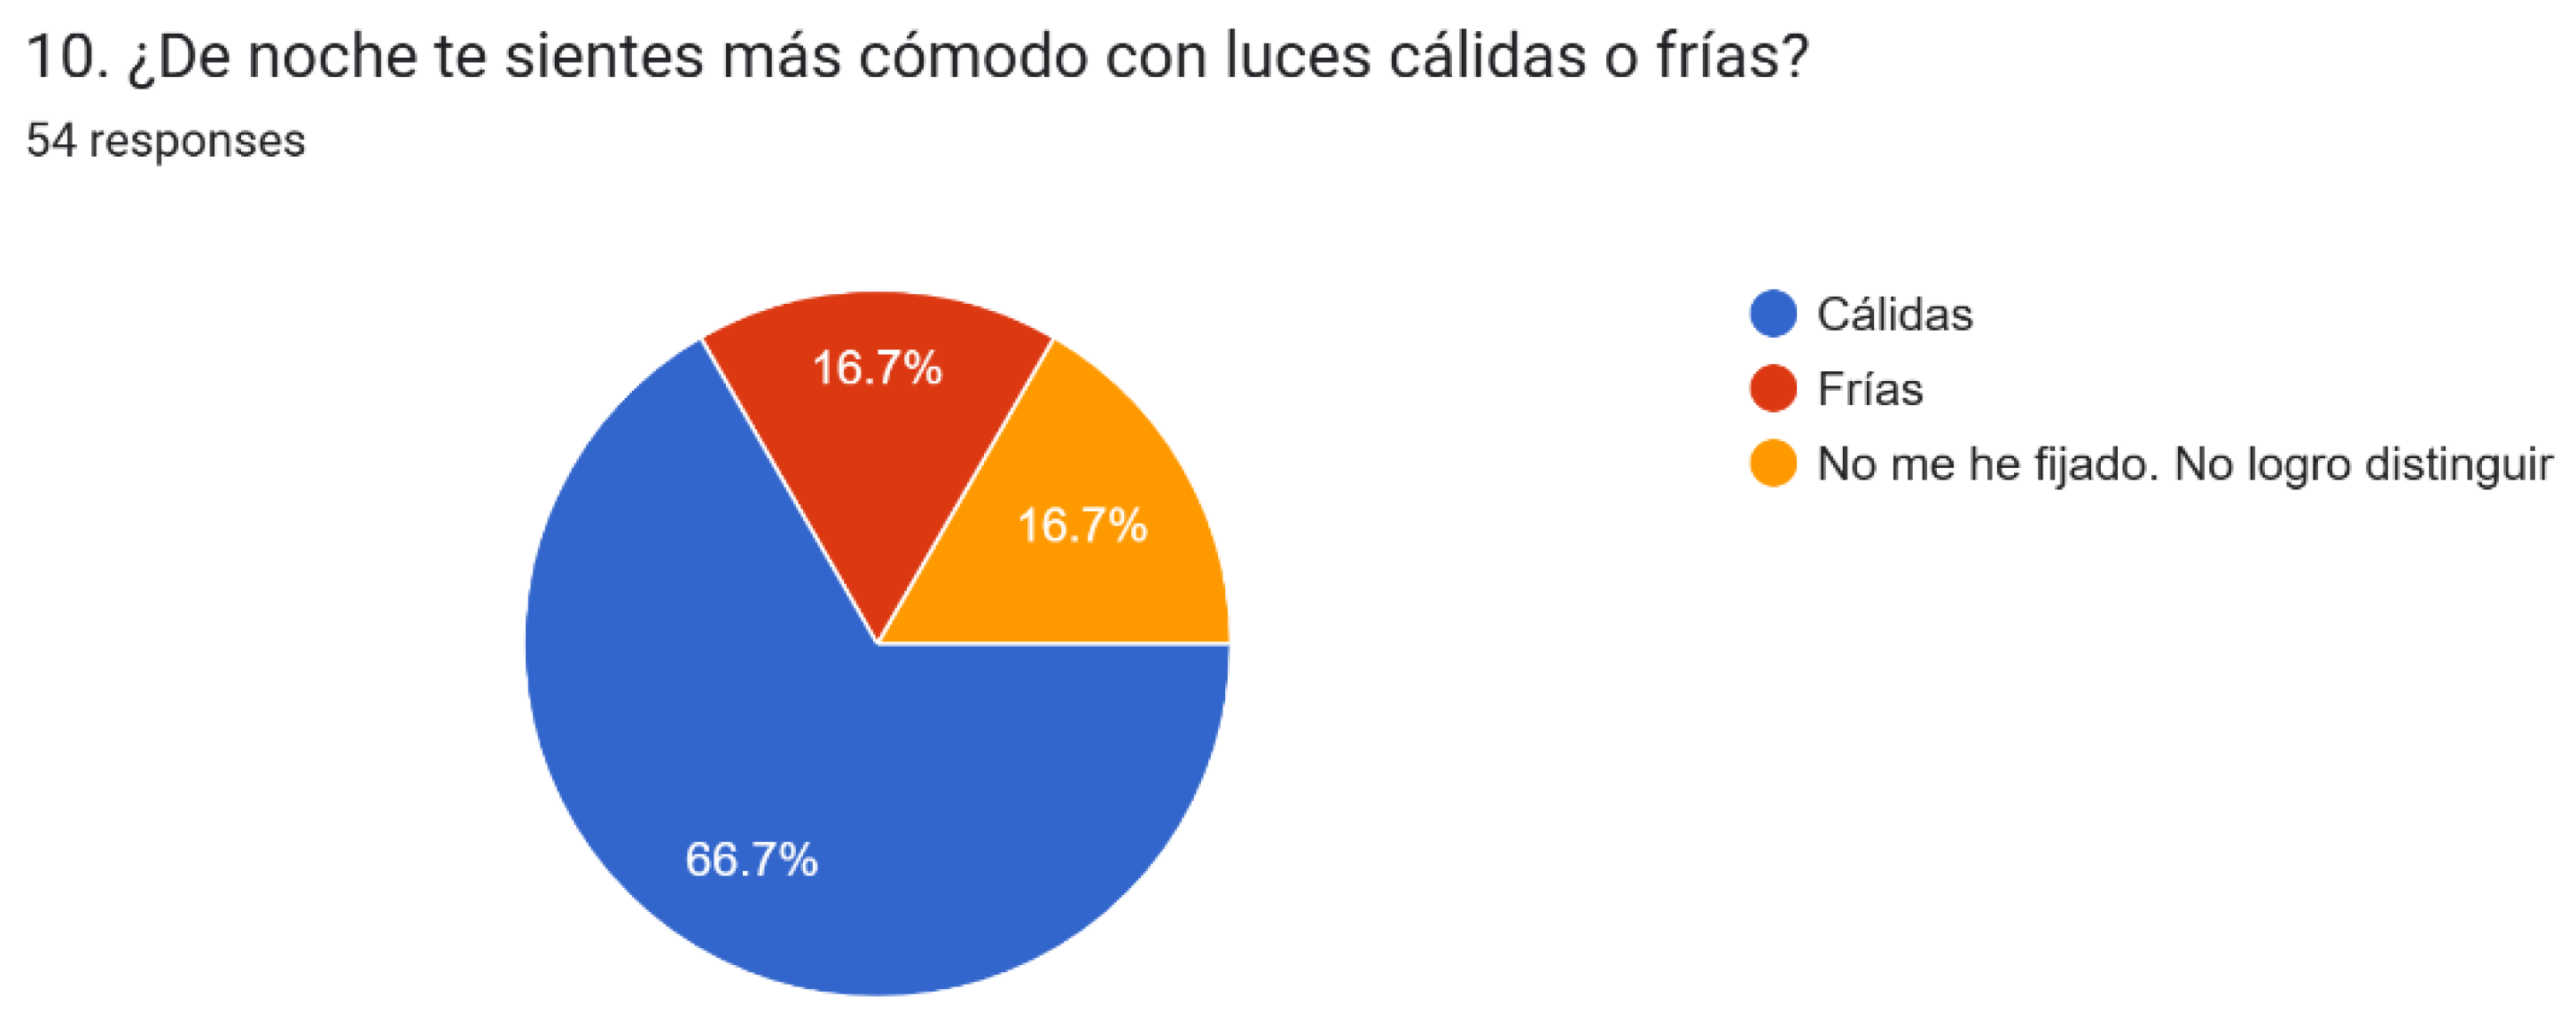
Additionally, based on question 10, most of our interviewees (66.7%) answered they feel more comfortable with warm lights at night. Only 16.7% preferred cold lights, whereas the same percentage, 16.7%, couldn’t distinguish it or didn’t notice the difference.
Table 5.
Results of the survey. Question #10.
| At night, do you feel more comfortable with warm or cold lights? | ||
|---|---|---|
| Warm lights | 66.7% | |
| Cold lights | 16.7% | |
| I haven’t noticed. I can`t distinguish | 16.7% | |
Figure 21.
Pie chart. Survey results from question #10. Author: Nubi León Martínez.
4. Discussion
After doing the data collection of the selected streets and plazas in Madrid and Toledo, we could observe the high contrast in the results obtained between both scenarios: the higher level in Madrid is 2692 lx (marked in turquoise, in Table 6), whereas the lowest level in Toledo was 2 lx (marked in yellow, in Table 6), a difference of 2688 lx, a percentage of 134,600%
Once doing the surveys with inhabitants of each city, the results show: Inhabitants from Madrid had more problems falling asleep in comparison with inhabitants from Toledo, as they expressed to be exposed to high levels of lighting intensities. They mentioned, they feel more comfortable with warm lighting at night. Moreover, the interviewees expressed they don’t need high intensity lighting at night on the streets, only the necessary lighting for path identification and facial recognition.
5. Conclusions
The impact of ALAN in our biology, is a substantially important as it is a disruptor in our body regulations. The performed survey demonstrates the negative effects on the inhabitants of the analysed cities. Therefore, it is necessary to take immediate actions in controlling lighting levels and incidences on the public urban space.
Once analysed the results obtained from photo-spectrometer on the discussion phase, it is important to consider not only the lux levels when planning a lighting design, but the wavelength spectrum as well, as they have major impact on triggering the cortisol levels, which are disruptors in our organism at night.
Regarding the zonification and the type uses of each zone, it is recommended not to mix the residential areas with touristic and commercial of high impact as the lighting levels are completely different per the type of use. The results obtained reinforce the need to separate zoning uses, as the residential use and tourist-commercial use (especially at night) present many clashes in terms of the dynamics of activities and uses in the area. Touristic and commercial activity, especially in large cities, tend to use contrasting lighting and led screens to attract the attention of visitors.
We recommend to create an urban regulation on the lighting considerations for the public urban space and in coordination with commercial areas to mitigate the high contrast and make easier the graduation in the human eye from one place to another with different lighting intensities.
As demonstrated by the photo-spectrometer results, led screens produce high peaks of short-wavelengths, then these non-visual effects, are demonstrated it causes disruptive reactions on the circadian cycle and therefore to our organism.
Although we consider sometimes and eventually the need of use of light at night, it is important to take the correct design decisions in terms of:
- Intensities: Use only the necessary light intensity. Avoid light intrusion and excessive bright light.
- Colour temperature: Avoid cold colour temperature at night. The colder the light, the greater tendency to secrete cortisol. Use warm colour lighting
- Avoid lighting pollution: Avoid glare and lighting upward. Light should be dimmed down or turned off when not required.
- Avoid peaks of short wavelengths (blue light).
- Avoid direct lighting emission. Consider using indirect lighting when possible. Light should address the surface, not the person.
- Consider transitions between short distances between one point to another, to let the brain to adapt to the different conditions and minimize the negative effects of ALAN in our organism.
Following these recommendations and research guidelines, will be an initial step to help on regulations in our circadian rhythms.
Funding
This research received no external funding.
Data Availability Statement
Data material will be available upon request.
Acknowledgments
The authors express their appreciation to Dr. Vanessa Ingraham for providing her valuable medical knowledge about photo-neuroendocrinology and Prof. Dr. Mauel Álvarez Dorado for his support during the revision of this paper. Authors also express their appreciation to all participants on the survey. For the data collection on surveys, the authors used “Forms” from Google, taking the pie chart representation from this source. The authors have reviewed the output and take full responsibility for the content of this publication.
Conflicts of Interest
The authors declare no conflicts of interest.
Abbreviations
The following abbreviations are used in this manuscript:
| ALAN | Artificial light at night |
| CCT | Correlative colour temperature |
| Lx | Luxes (unit for lighting measurement in m²) |
| Fc | Foot candle (unit for lighting measurement in ft²) |
| GV | Gran Vía |
| nm | nanometre |
| Z | Zocodover |
References
- Hurley JB. Phototransduction. Encyclopedia of Neuroscience. 2009 Jan 1;687–92.
- Aubin S, Kupers R, Ptito M, Jennum P. Melatonin and cortisol profiles in the absence of light perception. Behavioural Brain Research 2017, 317, 515–21. [Google Scholar] [CrossRef] [PubMed]
- Blume C, Münch M. Effects of light on biological functions and human sleep. Handb Clin Neurol [Internet]. 2025 Jan 1 [cited 2025 Apr 9];206:3–16. Available from: https://pubmed.ncbi.nlm.nih.gov/39864930/.
- Boyce PR. The benefits of light at night. Build Environ. 2019, 151, 356–67. [Google Scholar] [CrossRef]
- Garcia-Saenz A, de Miguel AS, Espinosa A, Valentin A, Aragonés N, Llorca J, et al. Evaluating the association between artificial light-at-night exposure and breast and prostate cancer risk in Spain (Mcc-spain study). Environ Health Perspect. 2018 Apr 1;126(4).
- Deziel NC, Wang R, Warren JL, Dinauer C, Ogilvie J, Clark CJ, et al. Perinatal Exposures to Ambient Fine Particulate Matter and Outdoor Artificial Light at Night and Risk of Pediatric Papillary Thyroid Cancer. Environ Health Perspect [Internet]. 2025 Apr 10 [cited 2025 Apr 24]; Available from: /doi/pdf/10.1289/EHP14849?download=true.
- Tomasovits M, Zerefos S, Tsangrassoulis A, Th B, Vital R, Madias END, et al. The impact of facade lighting on environmental sustainability: Investigation methods. Renewable and Sustainable Energy Reviews 2025, 210, 115246. [Google Scholar] [CrossRef]
- Zhang X, Ma L, Chen J, Fu J, Wang J, Wang Y, et al. A theoretical model for evaluation of non-visual effects of lighting based on human performance: Comprehensive research ideas. Vol. 88, Displays. Elsevier B.V.; 2025.
- Galaz-Guajardo VA, Quintanilla-Ahumada D, Quijón PA, Navarrete-Meneses J, Jahnsen-Guzmán N, Miranda-Benabarre C, et al. Artificial Light at Night (ALAN) alters the behavior and physiology of a sandy beach isopod. Are these effects reversible? Mar Environ Res [Internet]. 2025 Jun [cited 2025 Apr 9];208:107130. Available from: https://linkinghub.elsevier.com/retrieve/pii/S0141113625001874.
- Blume C, Münch M. Effects of light on biological functions and human sleep. Handb Clin Neurol. 2025, 206, 3–16. [Google Scholar]
- Petrowski K, Schmalbach B, Niedling M, Stalder T. The effects of post-awakening light exposure on the cortisol awakening response in healthy male individuals. Psychoneuroendocrinology 2019, 108, 28–34. [Google Scholar] [CrossRef] [PubMed]
- Li X, He Y, Wang D, Momeni MR. Chronobiological disruptions: unravelling the interplay of shift work, circadian rhythms, and vascular health in the context of stroke risk. Vol. 25, Clinical and Experimental Medicine. Springer Science and Business Media Deutschland GmbH; 2025.
- Intrinsically Photosensitive Retinal Ganglion Cells - an overview | ScienceDirect Topics [Internet]. [cited 2025 Apr 11]. Available from: https://www.sciencedirect.com/topics/biochemistry-genetics-and-molecular-biology/intrinsically-photosensitive-retinal-ganglion-cells.
- Karatsoreos IN, Silver R. Body Clocks in Health and Disease. Conn’s Translational Neuroscience. 2017;599–615.
- Wong, KY. Non-photoreceptor photoreception. Encyclopedia of Neuroscience. 2009;1205–11.
- Gamlin PDR, McDougal DH. Pupil. Encyclopedia of the Eye. 2010 Jan 1;549–55.
- McDougal DH, Gamlin PDR. Pupillary Control Pathways. The Senses: A Comprehensive Reference. 2008;1:521–36.
- Mouland JW, Brown TM. Beyond irradiance: Visual signals influencing mammalian circadian function. Prog Brain Res. 2022, 273, 145–69. [Google Scholar]
- Provencio I, Rodriguez IR, Jiang G, Hayes WP, Moreira EF, Rollag MD. A novel human opsin in the inner retina. J Neurosci [Internet]. 2000 Jan 15 [cited 2025 Apr 11];20(2):600–5. Available from: https://pubmed.ncbi.nlm.nih.gov/10632589/.
- Karatsoreos IN, Silver R. Body Clocks in Health and Disease. Conn’s Translational Neuroscience. 2017;599–615.
- Melmed, S. Hypothalamic-Pituitary Regulation. Conn’s Translational Neuroscience. 2017;317–31.
- Chien JH, Cheng JJ, Lenz FA. The Thalamus. Conn’s Translational Neuroscience. 2017;289–97.
- Conn, PM. Conn’s Translational Neuroscience. Conn’s Translational Neuroscience. 2016 Oct 11;1–761.
- Hankins MW, Peirson SN, Foster RG. Melanopsin: an exciting photopigment. Trends Neurosci. 2008 Jan;31(1):27–36.
- Zaidi FH, Hull JT, Peirson SNN, Wulff K, Aeschbach D, Gooley JJ, et al. Short-Wavelength Light Sensitivity of Circadian, Pupillary, and Visual Awareness in Humans Lacking an Outer Retina. Current Biology. 2007 Dec 18;17(24):2122–8.
- Foster RG, Peirson SN, Wulff K, Winnebeck E, Vetter C, Roenneberg T. Sleep and circadian rhythm disruption in social jetlag and mental illness. Prog Mol Biol Transl Sci. 2013;119:325–46.
- Jagannath A, Peirson SN, Foster RG. Sleep and circadian rhythm disruption in neuropsychiatric illness. Curr Opin Neurobiol. 2013 Oct;23(5):888–94.
- Foster RG. Sleep, circadian rhythms and health. Interface Focus [Internet]. 2020 Jun 6 [cited 2025 Apr 21];10(3). Available from: https://royalsocietypublishing.org/doi/10.1098/rsfs.2019.0098.
- Spivey, A. Light at night and breast cancer risk worldwide. Environ Health Perspect. 2010 Dec;118(12).
- Campbell I, Sharifpour R, Aizpurua JFB, Beckers E, Paparella I, Berger A, et al. Regional response to light illuminance across the human hypothalamus. Elife [Internet]. 2024 Apr 23 [cited 2025 Apr 25];13. Available from: https://elifesciences.org/reviewed-preprints/96576.
- Lledó R. Human centric lighting, a new reality in healthcare environments. Advances in Intelligent Systems and Computing [Internet]. 2019 [cited 2025 Apr 25];1012:23–6. Available from: https://www.researchgate.net/publication/334018392_Human_Centric_Lighting_a_New_Reality_in_Healthcare_Environments.
- Youtube. Dr. Vanessa Ingraham channel. https://www.youtube.com/watch?v=uLwao9-oOAg&ab_channel=DrVanessaIngra ham. (accessed 25/04/2025).
- Dark Sky https://darksky.org/news/responsible-outdoor-lighting-at-night-rolan-manifesto-for-lighting/ (accessed 25/04/2025).
Figure 3.
Picture of the Gran Vía, taken from Gran Vía #84 terrace, direction Plaza Callao. Picture taken by Nubi León Martínez.
Figure 3.
Picture of the Gran Vía, taken from Gran Vía #84 terrace, direction Plaza Callao. Picture taken by Nubi León Martínez.
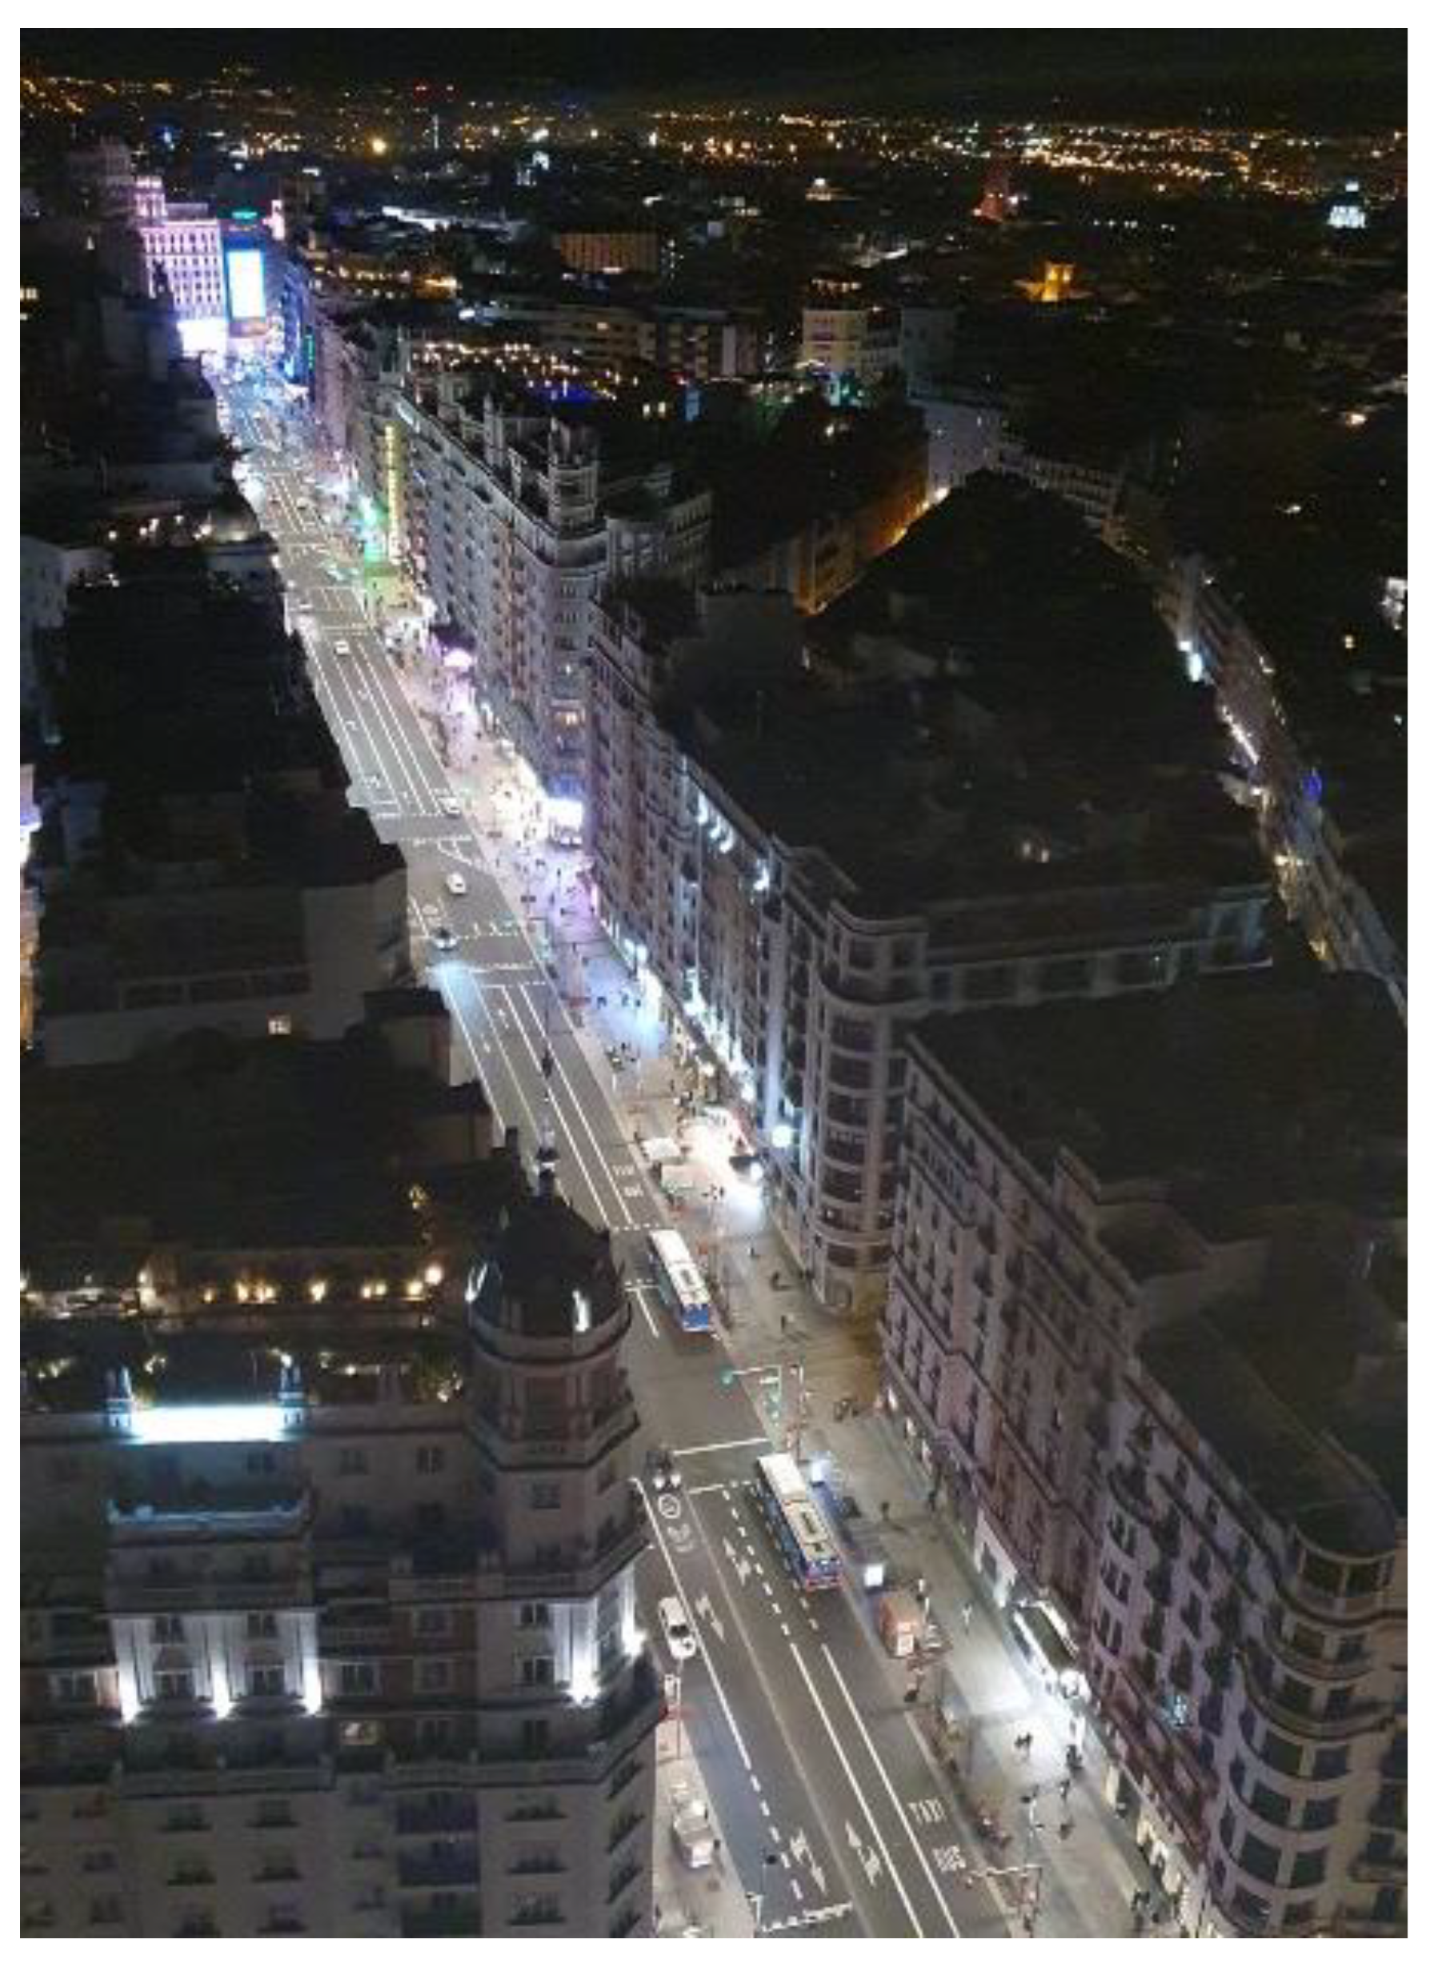
Figure 4.
Picture of the Gran Vía, taken from Gran Vía #31 terrace, direction Plaza España. Picture taken by Nubi León Martínez.
Figure 4.
Picture of the Gran Vía, taken from Gran Vía #31 terrace, direction Plaza España. Picture taken by Nubi León Martínez.
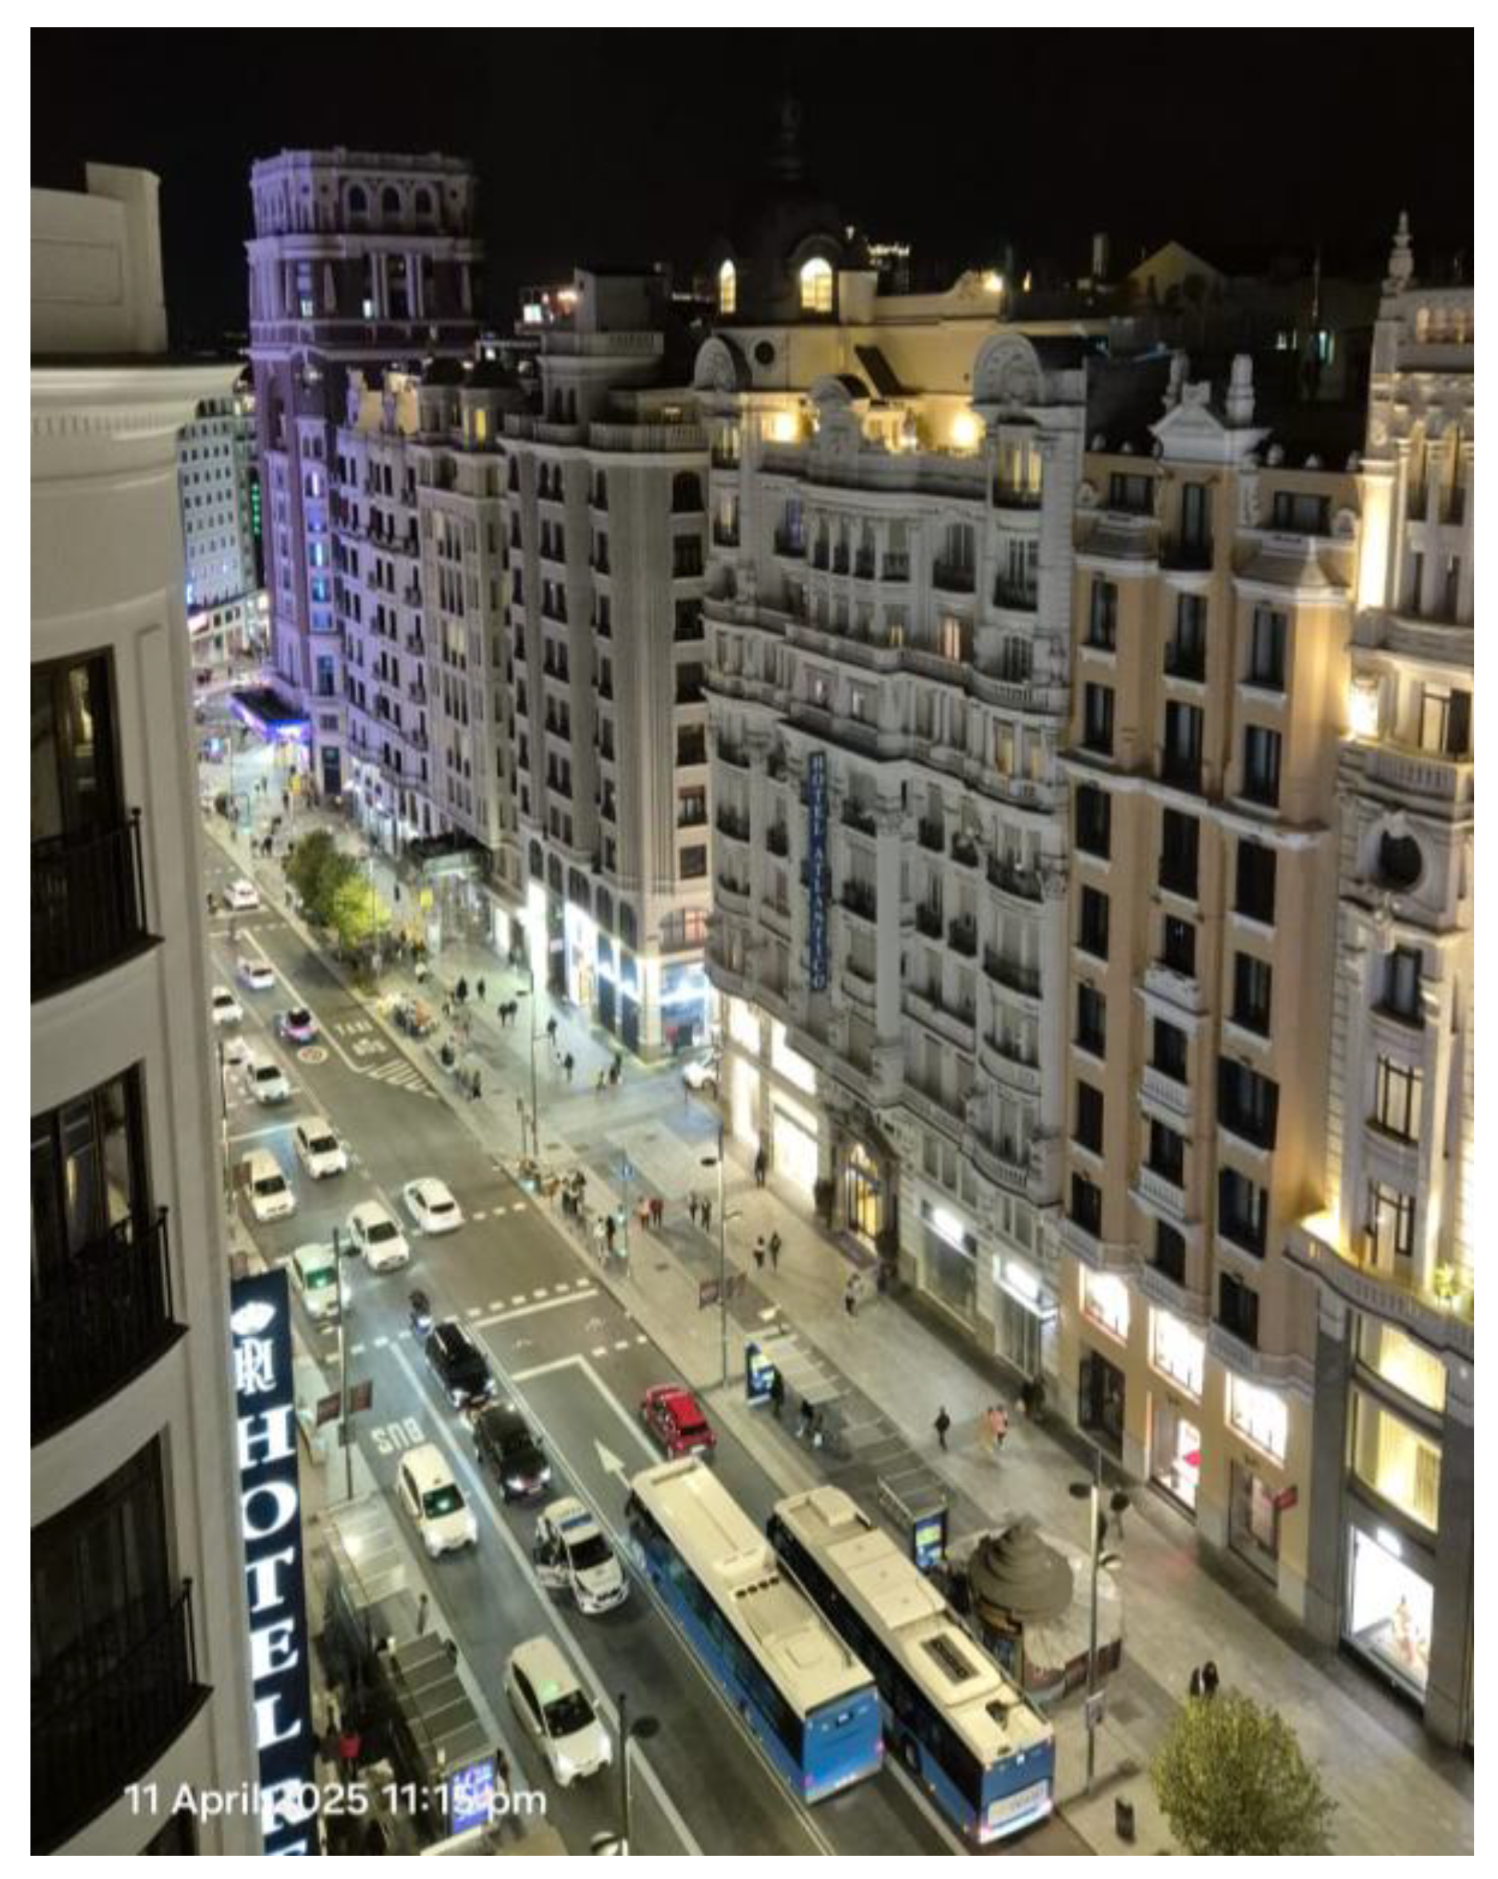
Figure 5.
Shop entrance and led screen vitrine. The image (a) shows the area used for lighting calculations. The image (b) shows the lighting level recorded on the image (a) area.
Figure 5.
Shop entrance and led screen vitrine. The image (a) shows the area used for lighting calculations. The image (b) shows the lighting level recorded on the image (a) area.
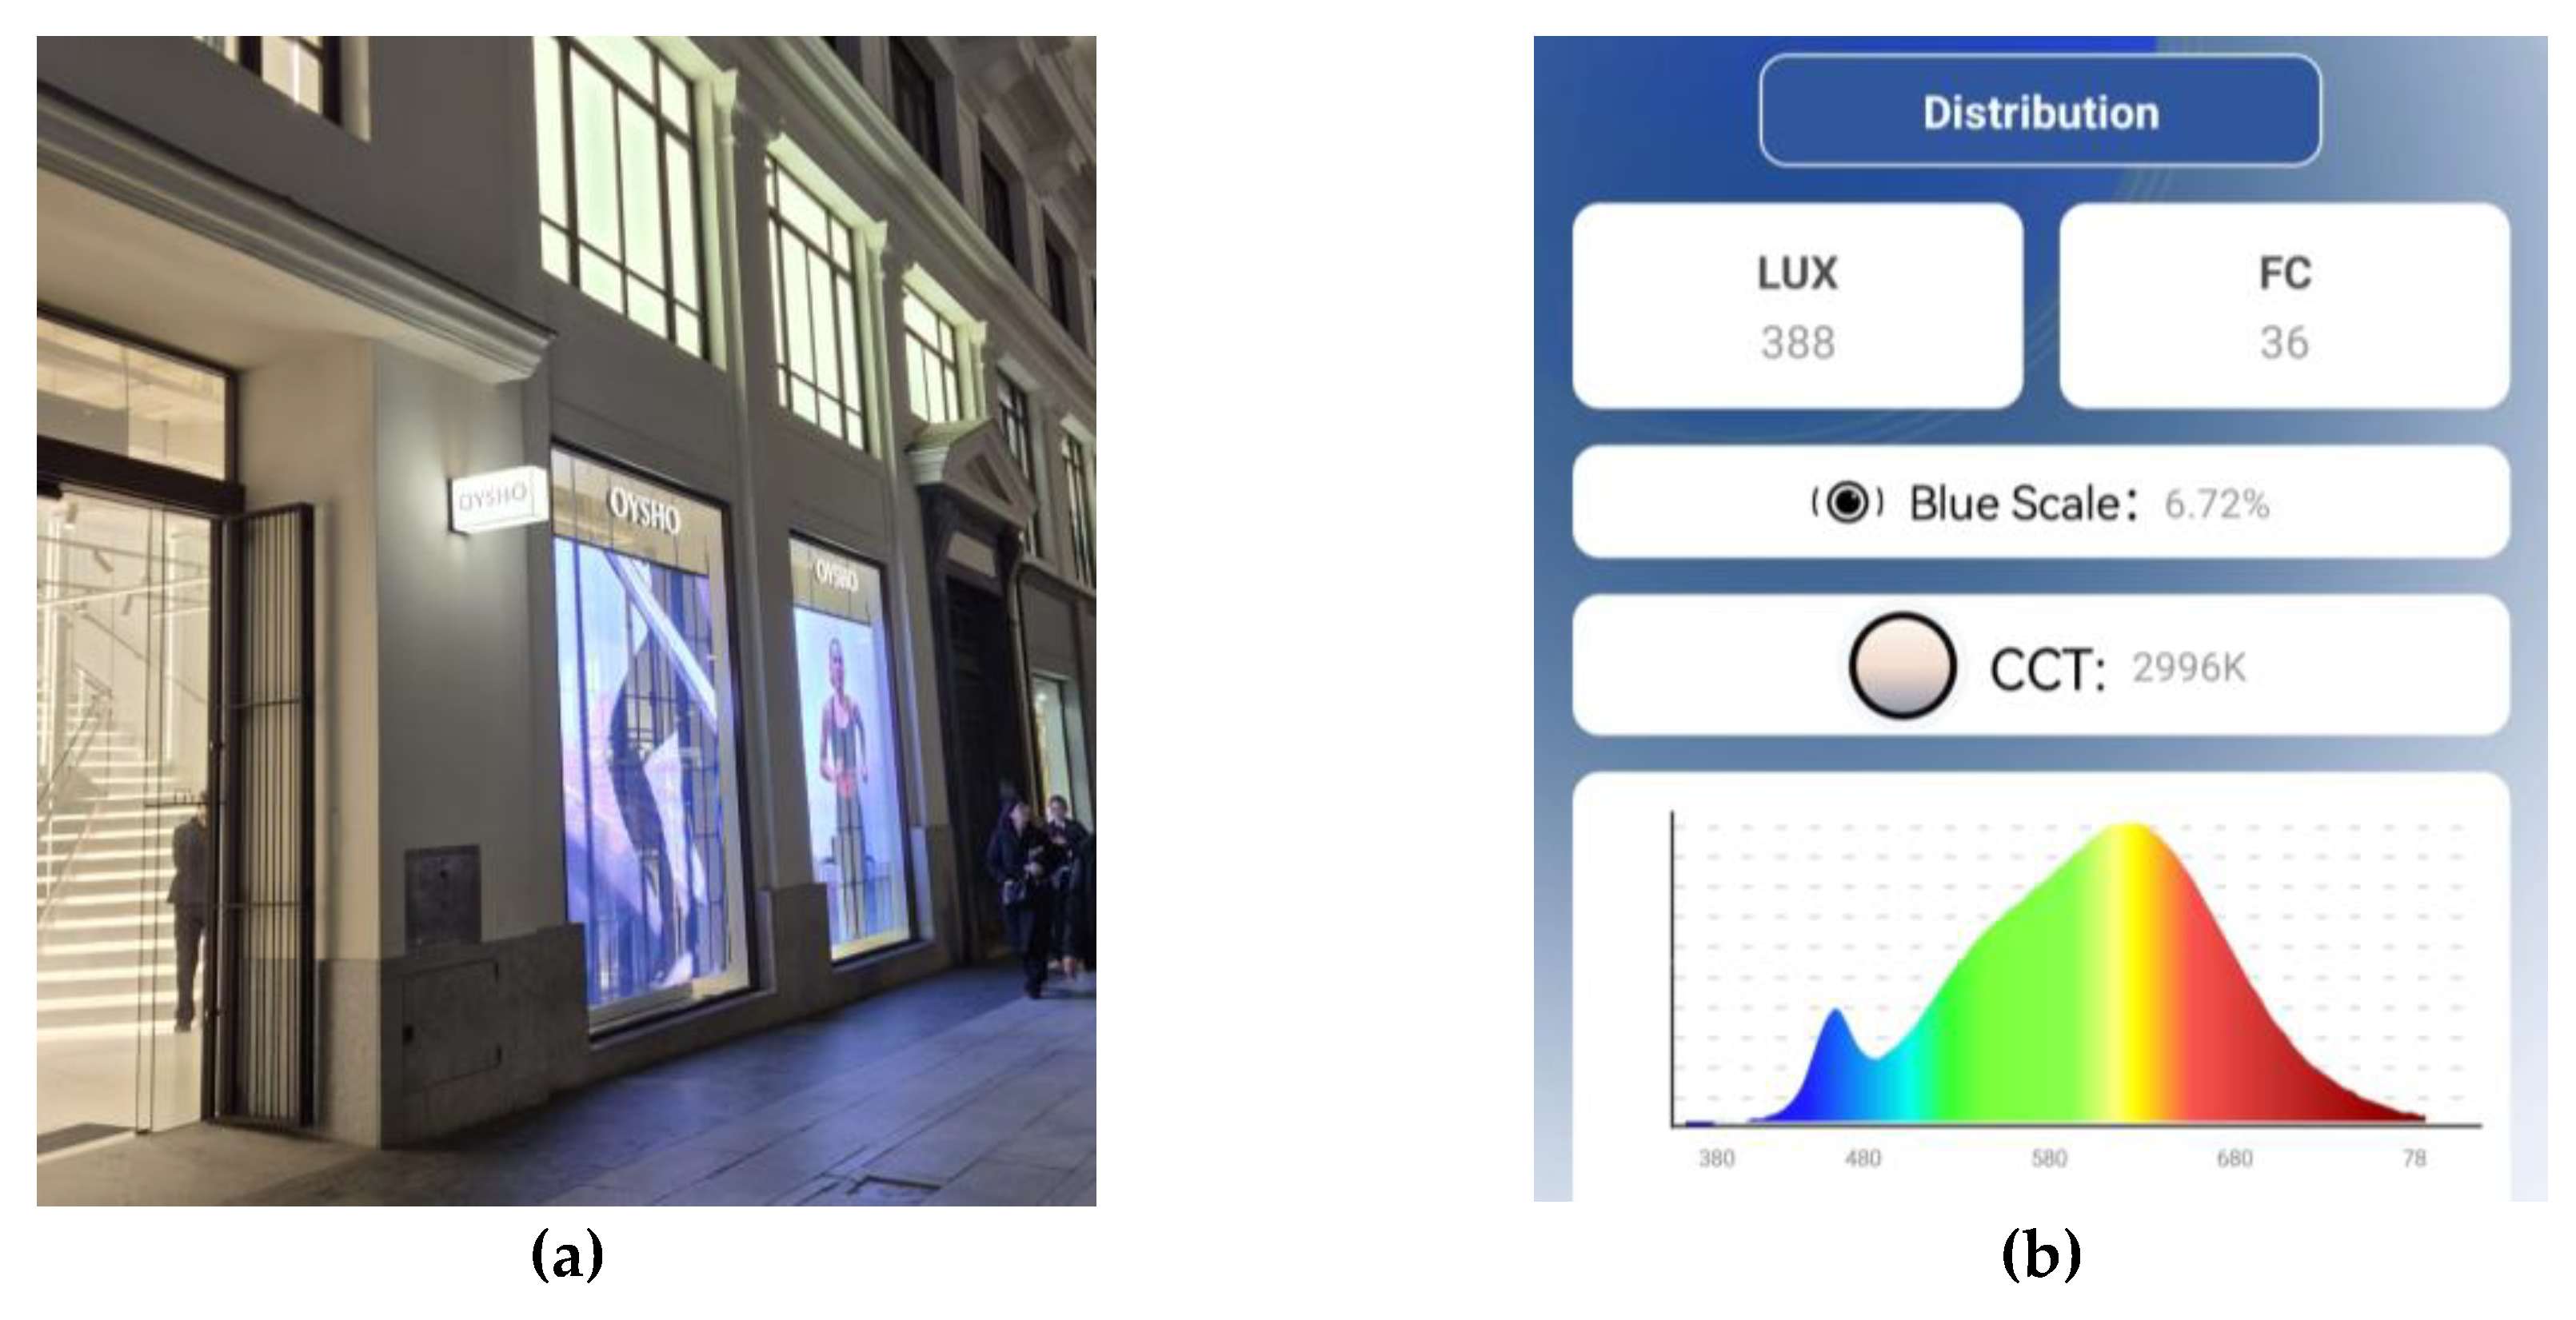
Figure 6.
Retail screen vitrine. The image (a) shows the analysed area. It is the same shop used in Figure 5, indicated above. The image (b) shows the lighting and wavelength level recorded on the image (a).
Figure 6.
Retail screen vitrine. The image (a) shows the analysed area. It is the same shop used in Figure 5, indicated above. The image (b) shows the lighting and wavelength level recorded on the image (a).
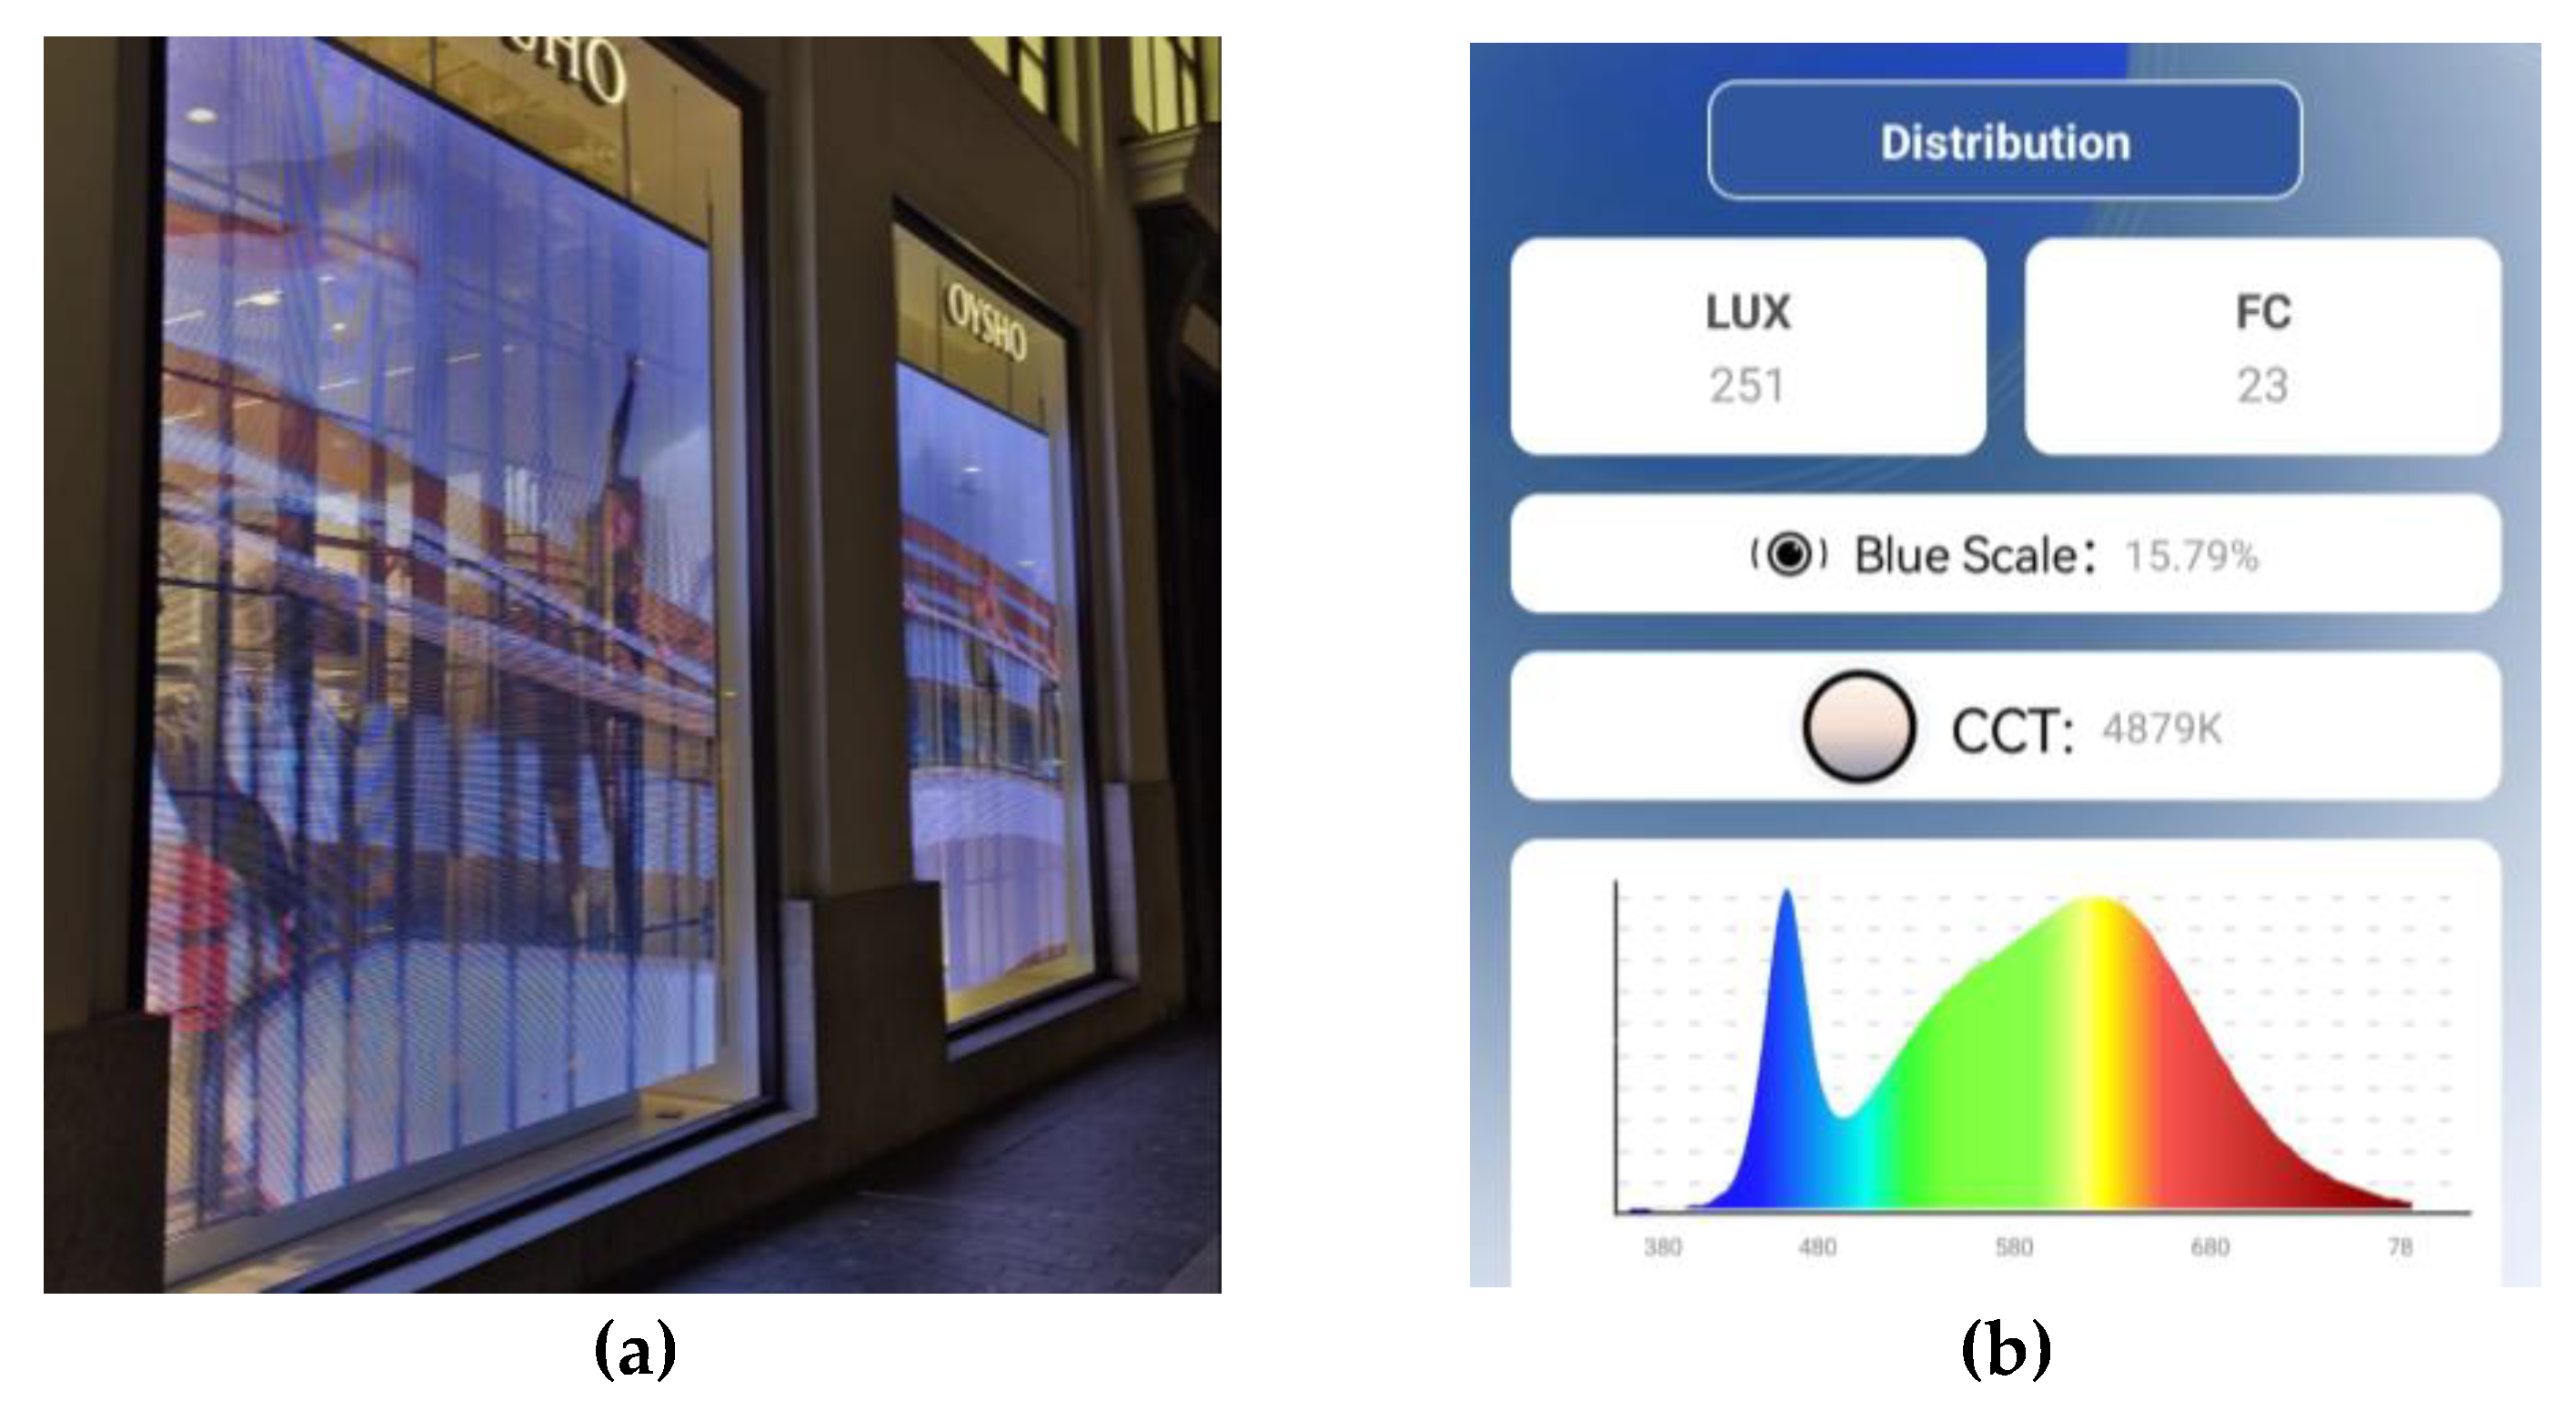
Figure 7.
Retail screen vitrine. Gran Vía #27. The image (a) shows the analysed area. The image (b) shows the lighting and wavelength level recorded on the image (a).
Figure 7.
Retail screen vitrine. Gran Vía #27. The image (a) shows the analysed area. The image (b) shows the lighting and wavelength level recorded on the image (a).
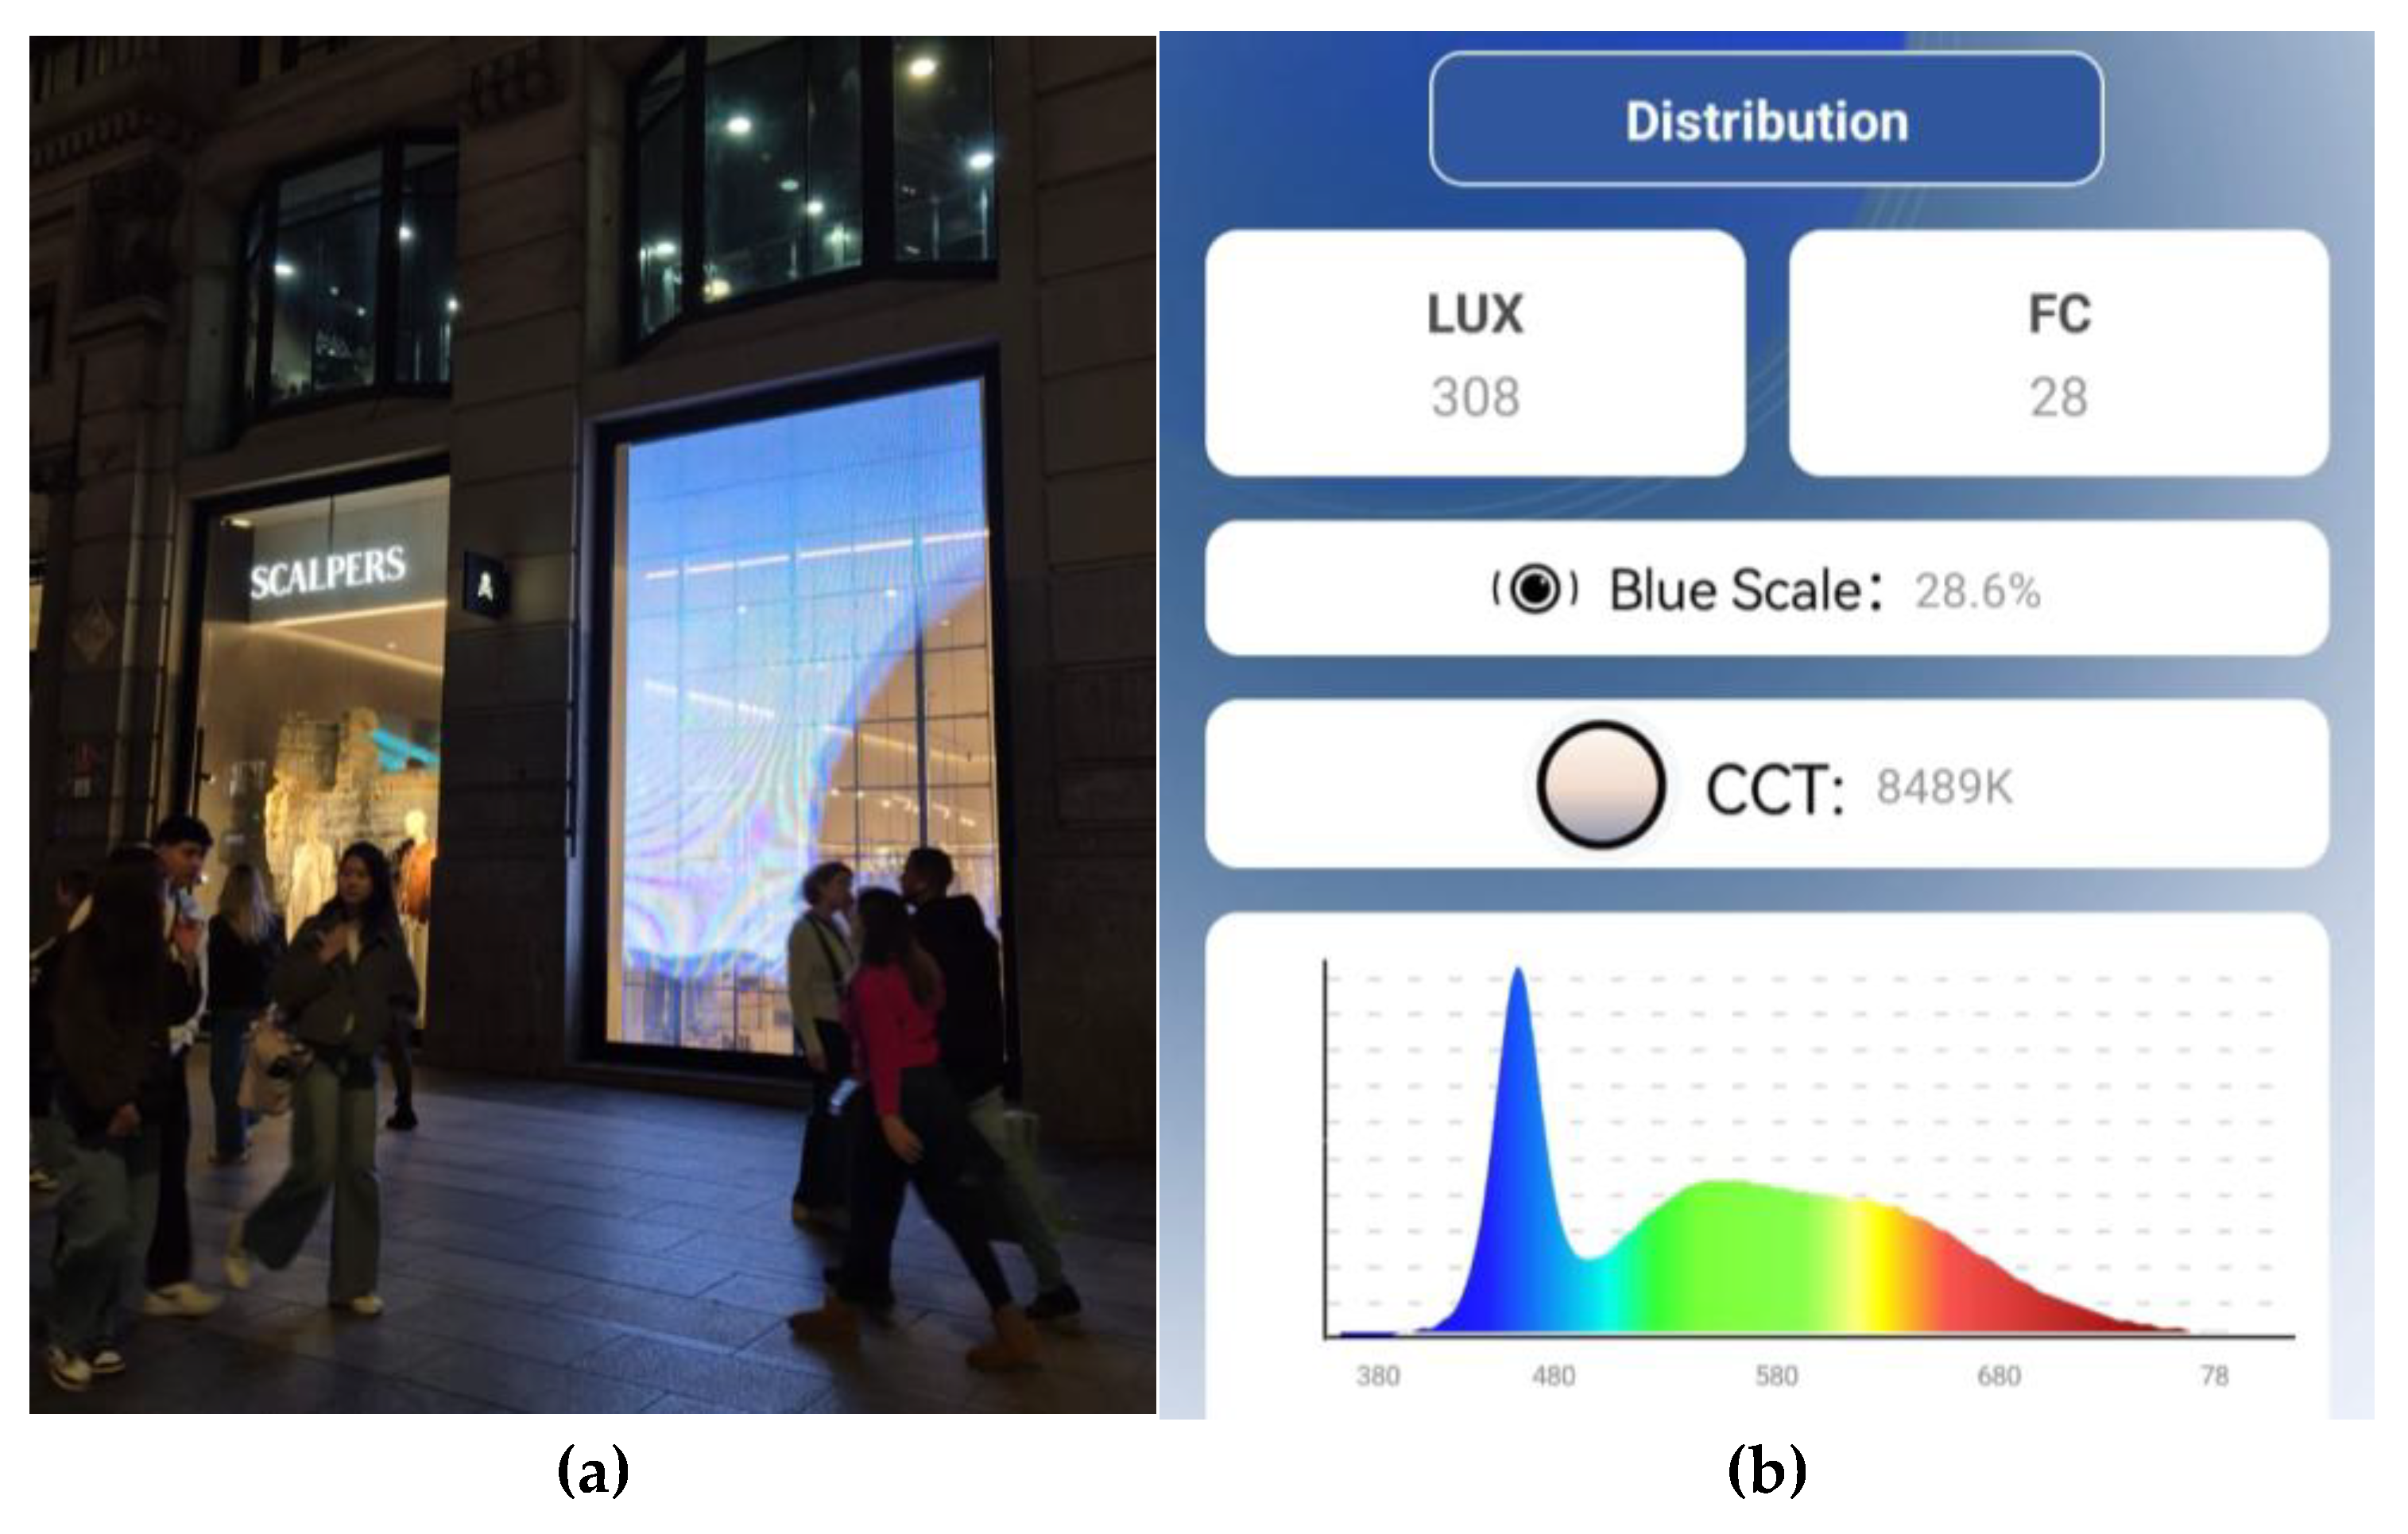
Figure 8.
Main entrance of a shop. Gran Vía #49, The image (a) shows the analysed area. The image (b) shows the lighting and wavelength level recorded on the image (a).
Figure 8.
Main entrance of a shop. Gran Vía #49, The image (a) shows the analysed area. The image (b) shows the lighting and wavelength level recorded on the image (a).
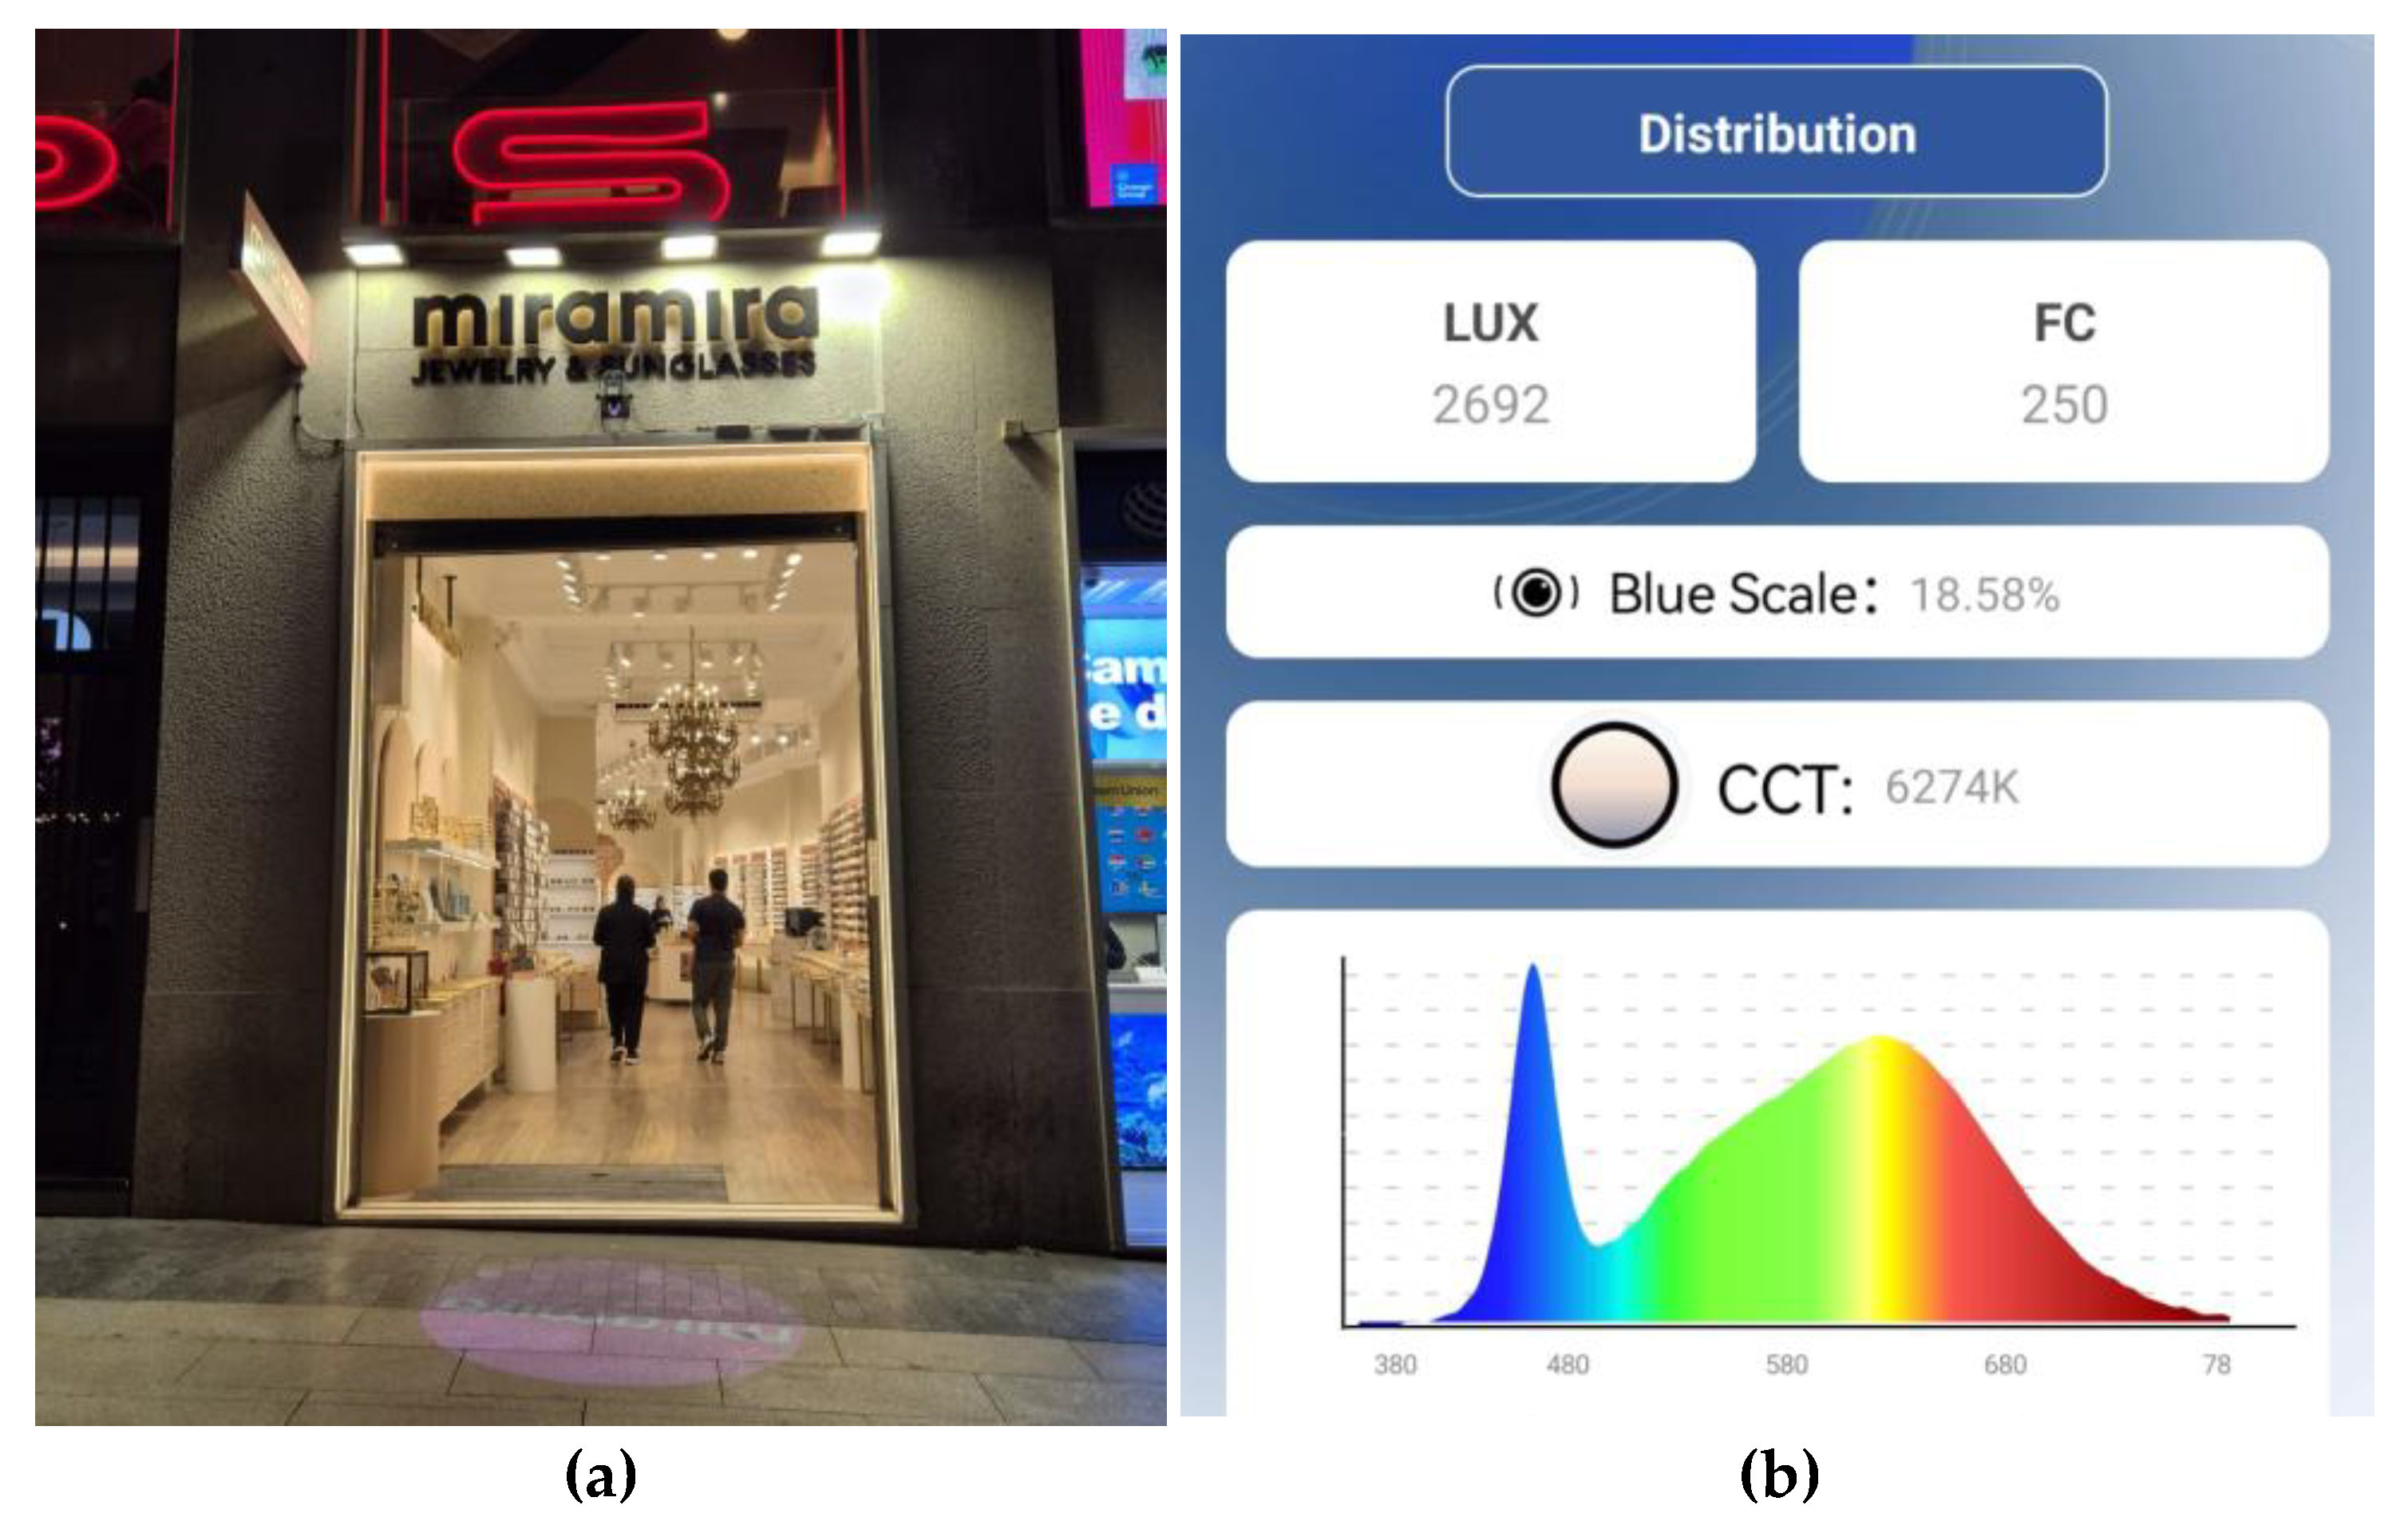
Figure 9.
Retail screen vitrine. The image (a) shows the analysed area. The image (b) shows the lighting and wavelength level recorded on the image (a).
Figure 9.
Retail screen vitrine. The image (a) shows the analysed area. The image (b) shows the lighting and wavelength level recorded on the image (a).
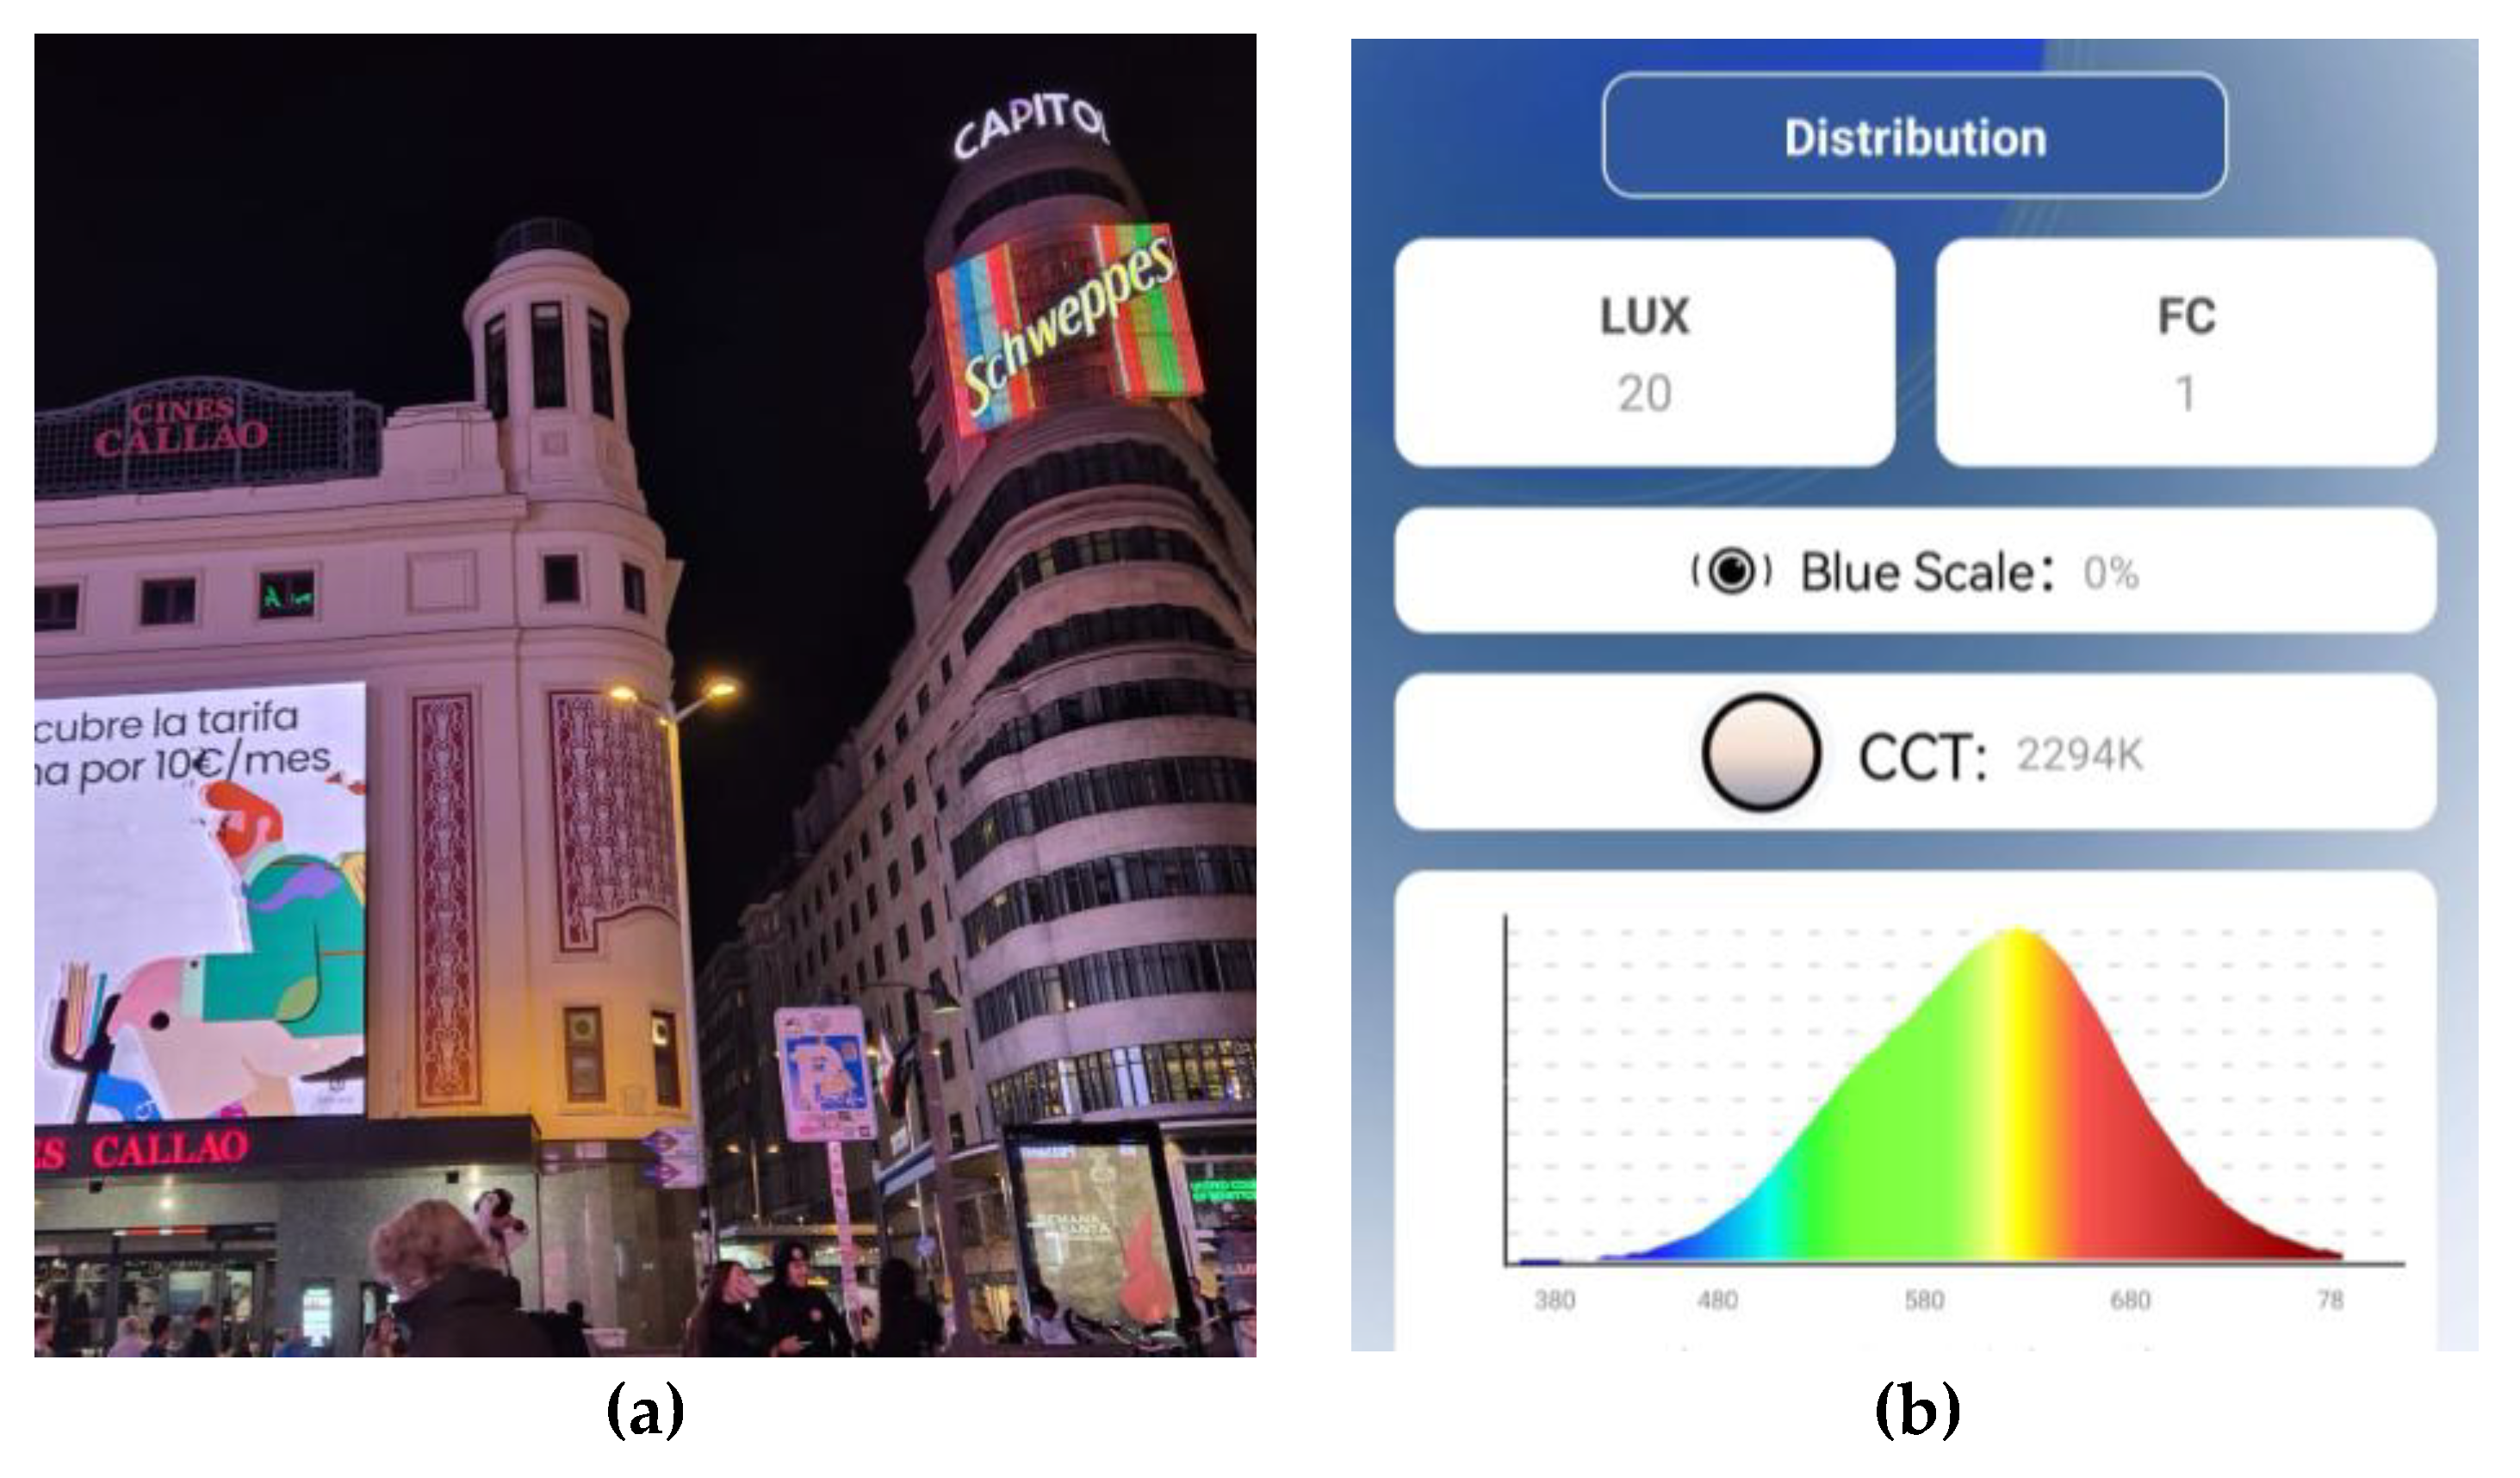
Figure 10.
Retail screen vitrine. The image (a) shows the analysed area. The image (b) shows the lighting and wavelength level recorded on the image (a).
Figure 10.
Retail screen vitrine. The image (a) shows the analysed area. The image (b) shows the lighting and wavelength level recorded on the image (a).
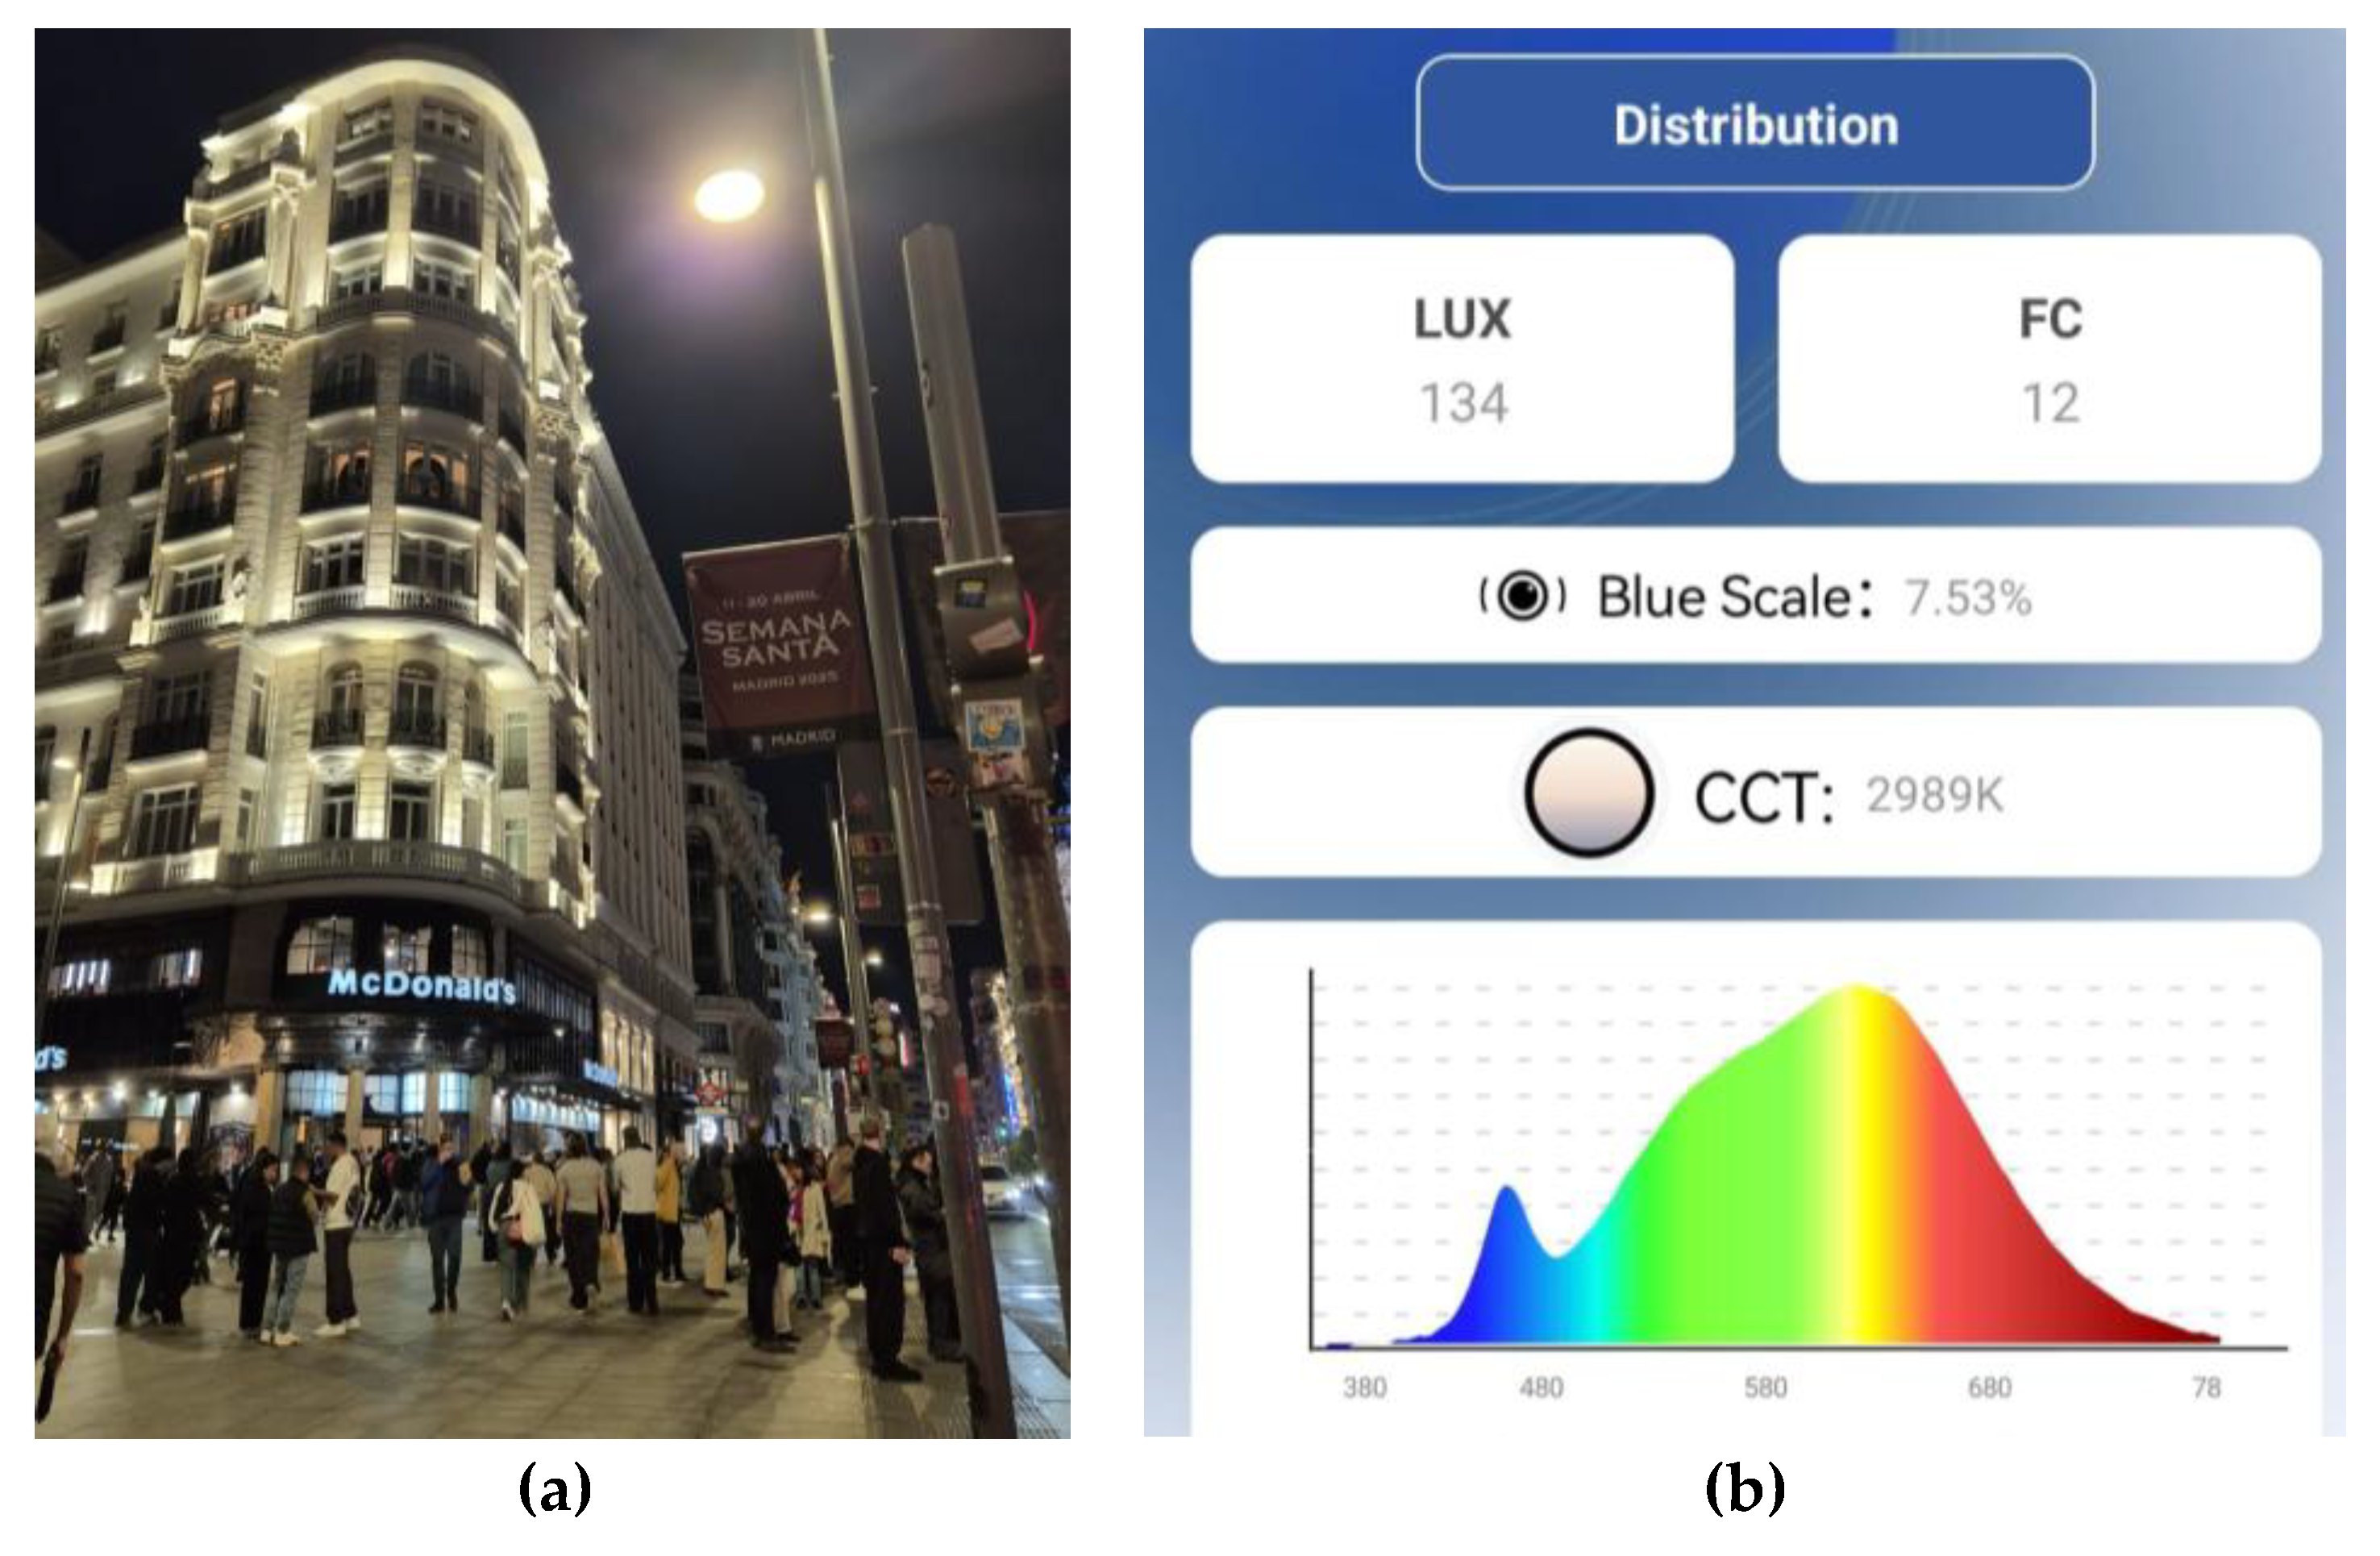
Figure 11.
Toledo general plan. Original plan obtained from Cadmapper, modified in Photoshop by Authors.
Figure 11.
Toledo general plan. Original plan obtained from Cadmapper, modified in Photoshop by Authors.
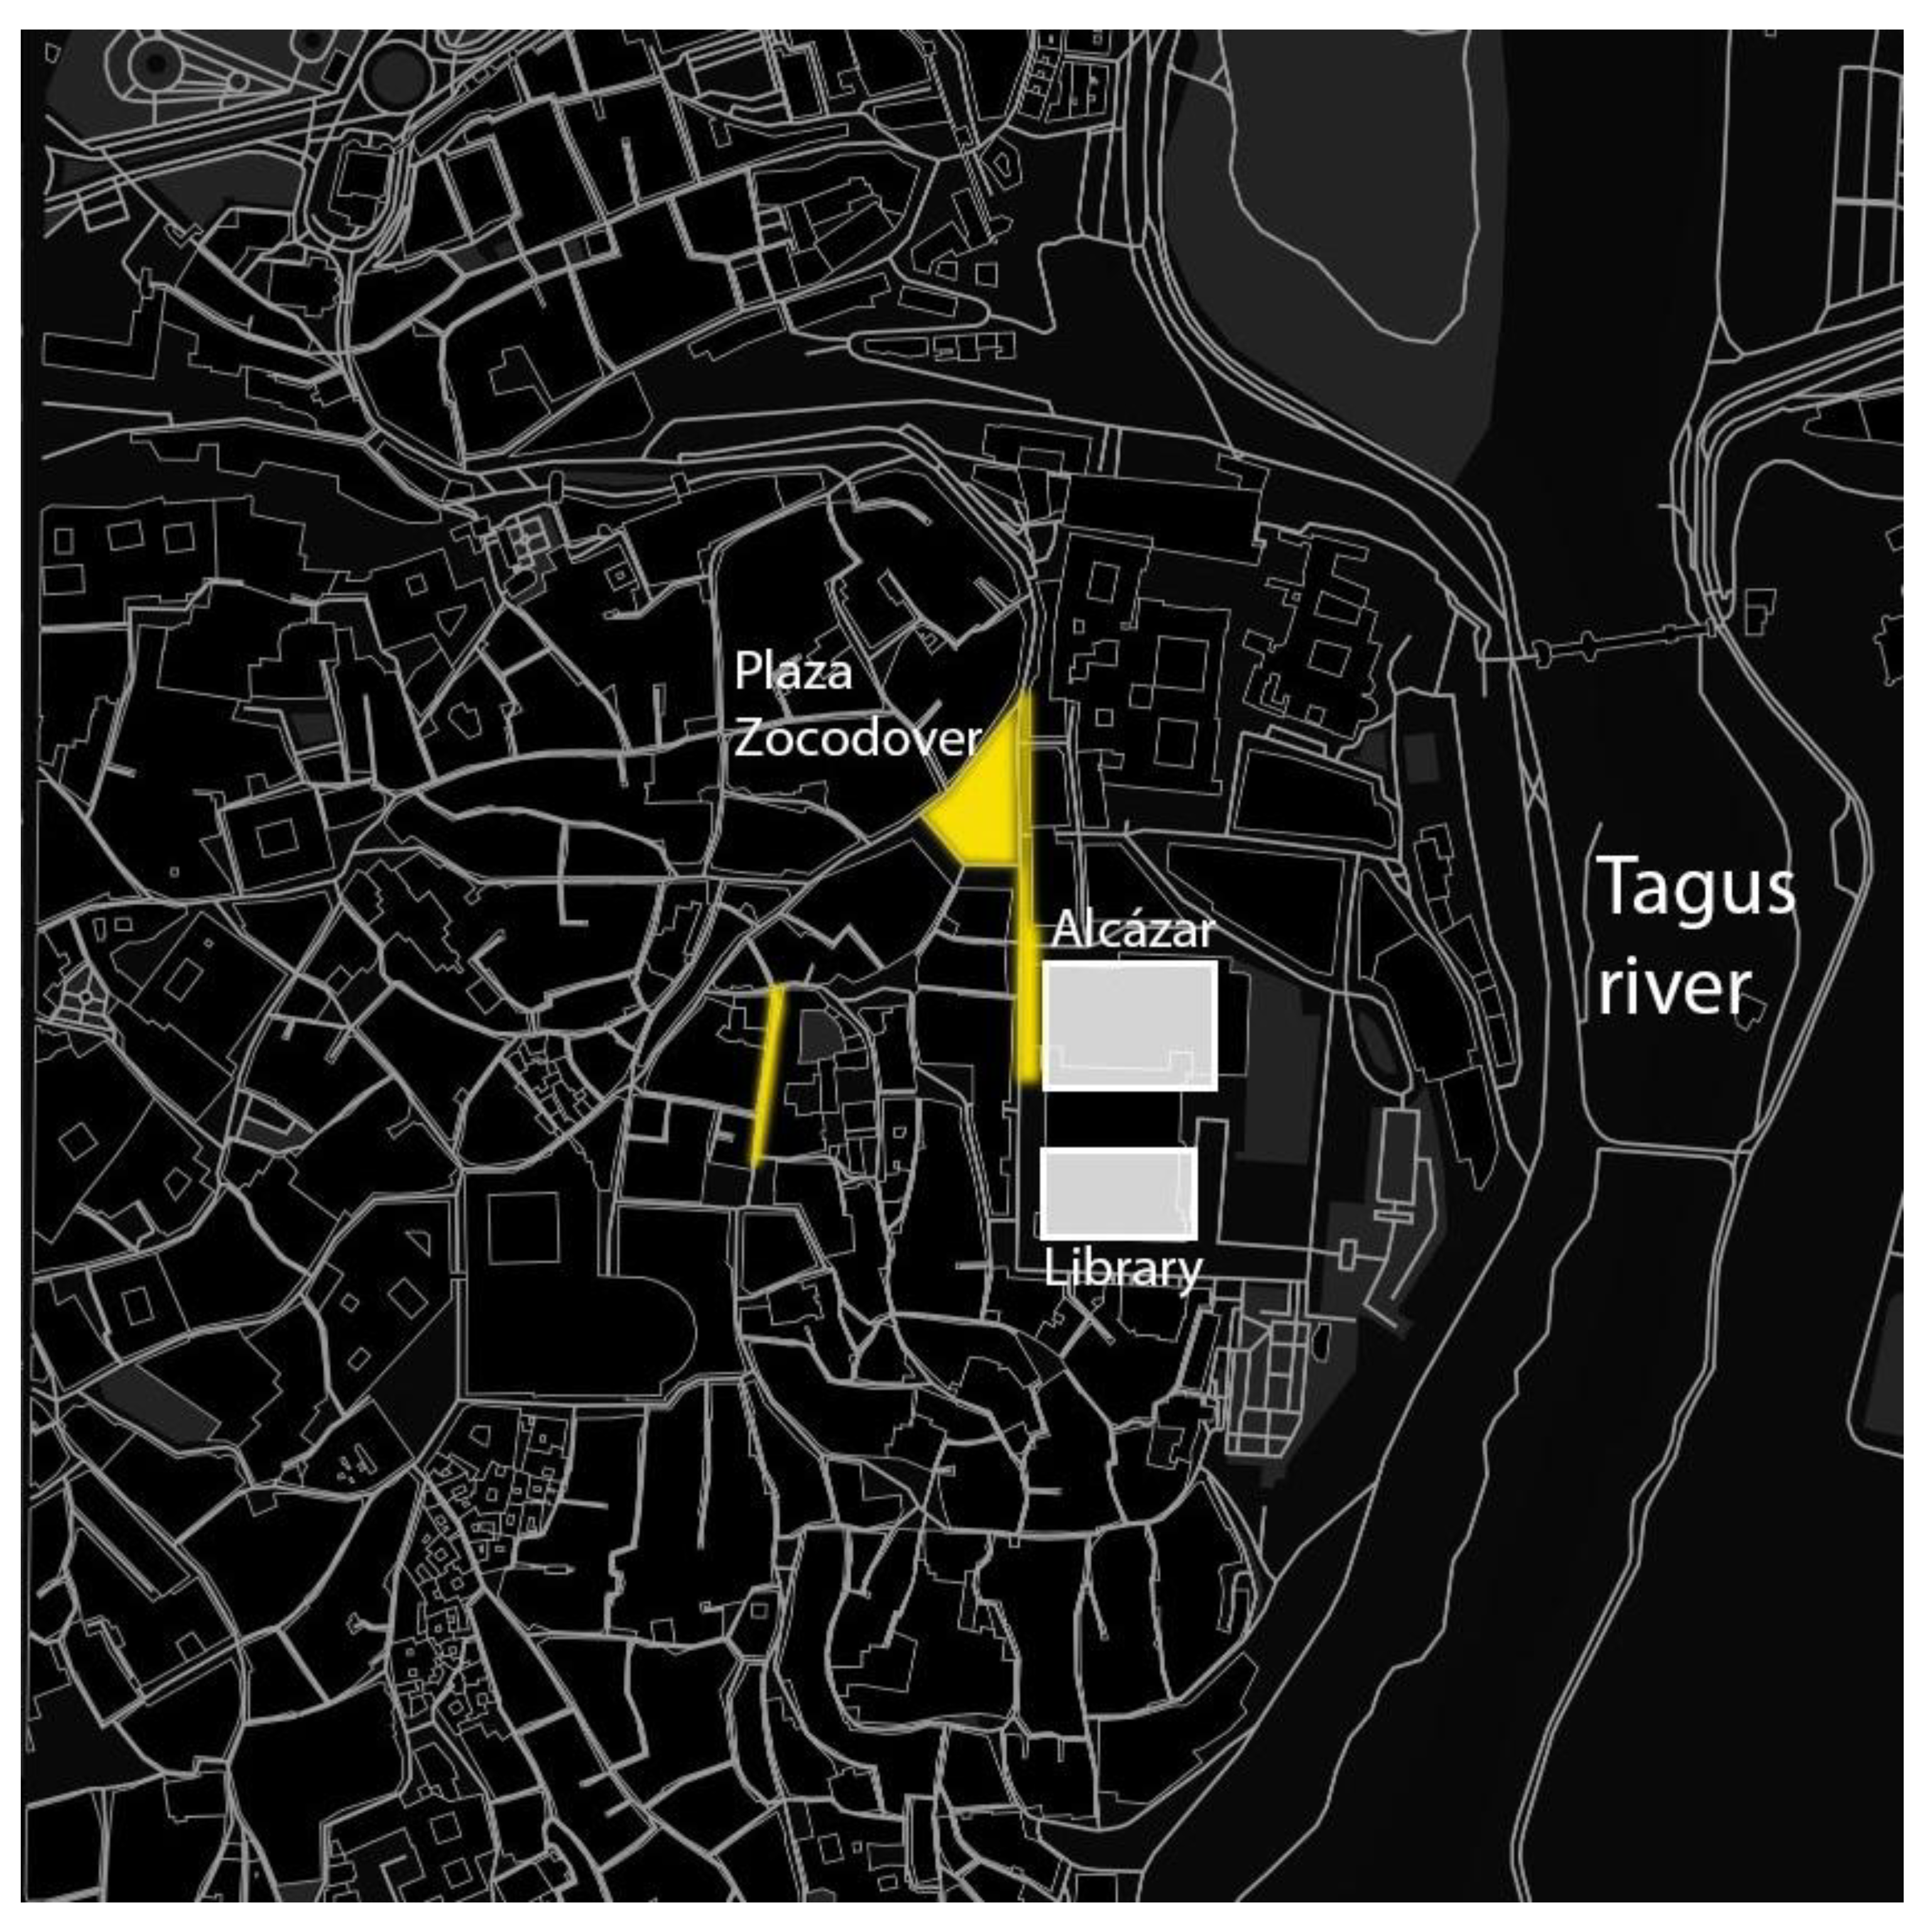
Figure 12.
Toledo plan, 3D enlargement. Original plan obtained from Cadmapper, modified in Photoshop by Authors.
Figure 12.
Toledo plan, 3D enlargement. Original plan obtained from Cadmapper, modified in Photoshop by Authors.
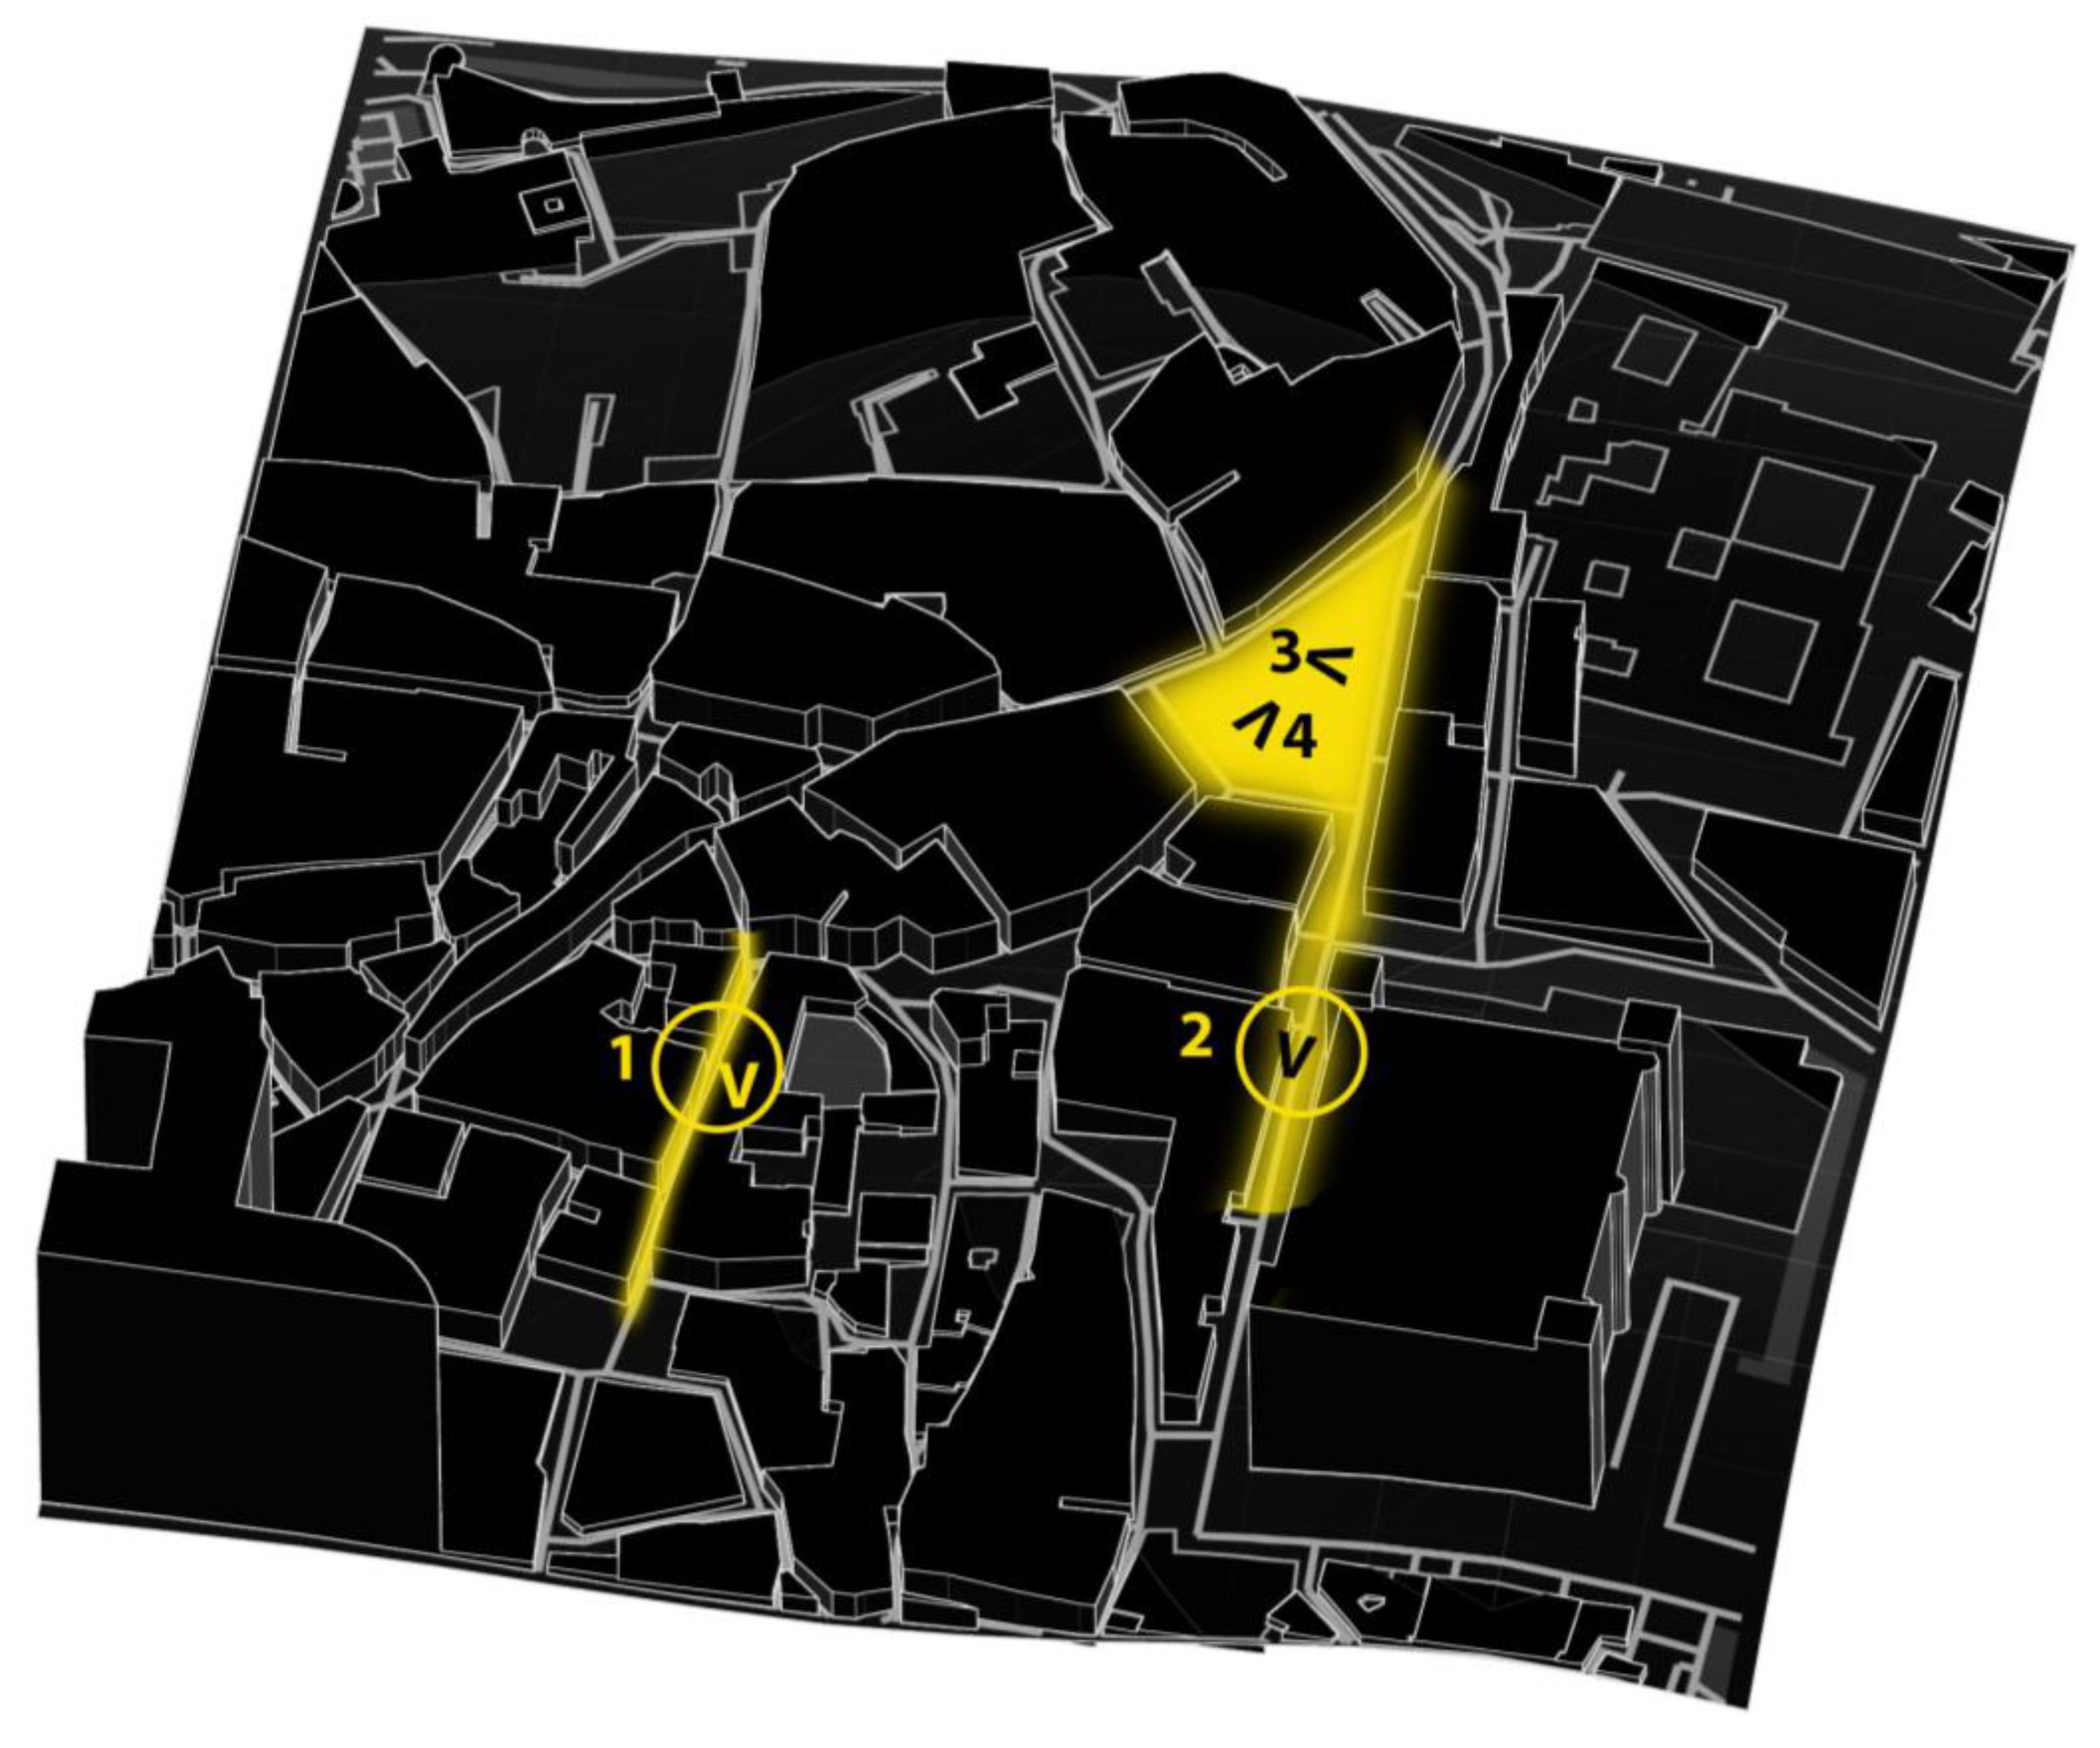
Figure 13.
Toledo square. Plaza Zocodover, view to Zocodover #13. Photo by Nubi Leon Martinez.
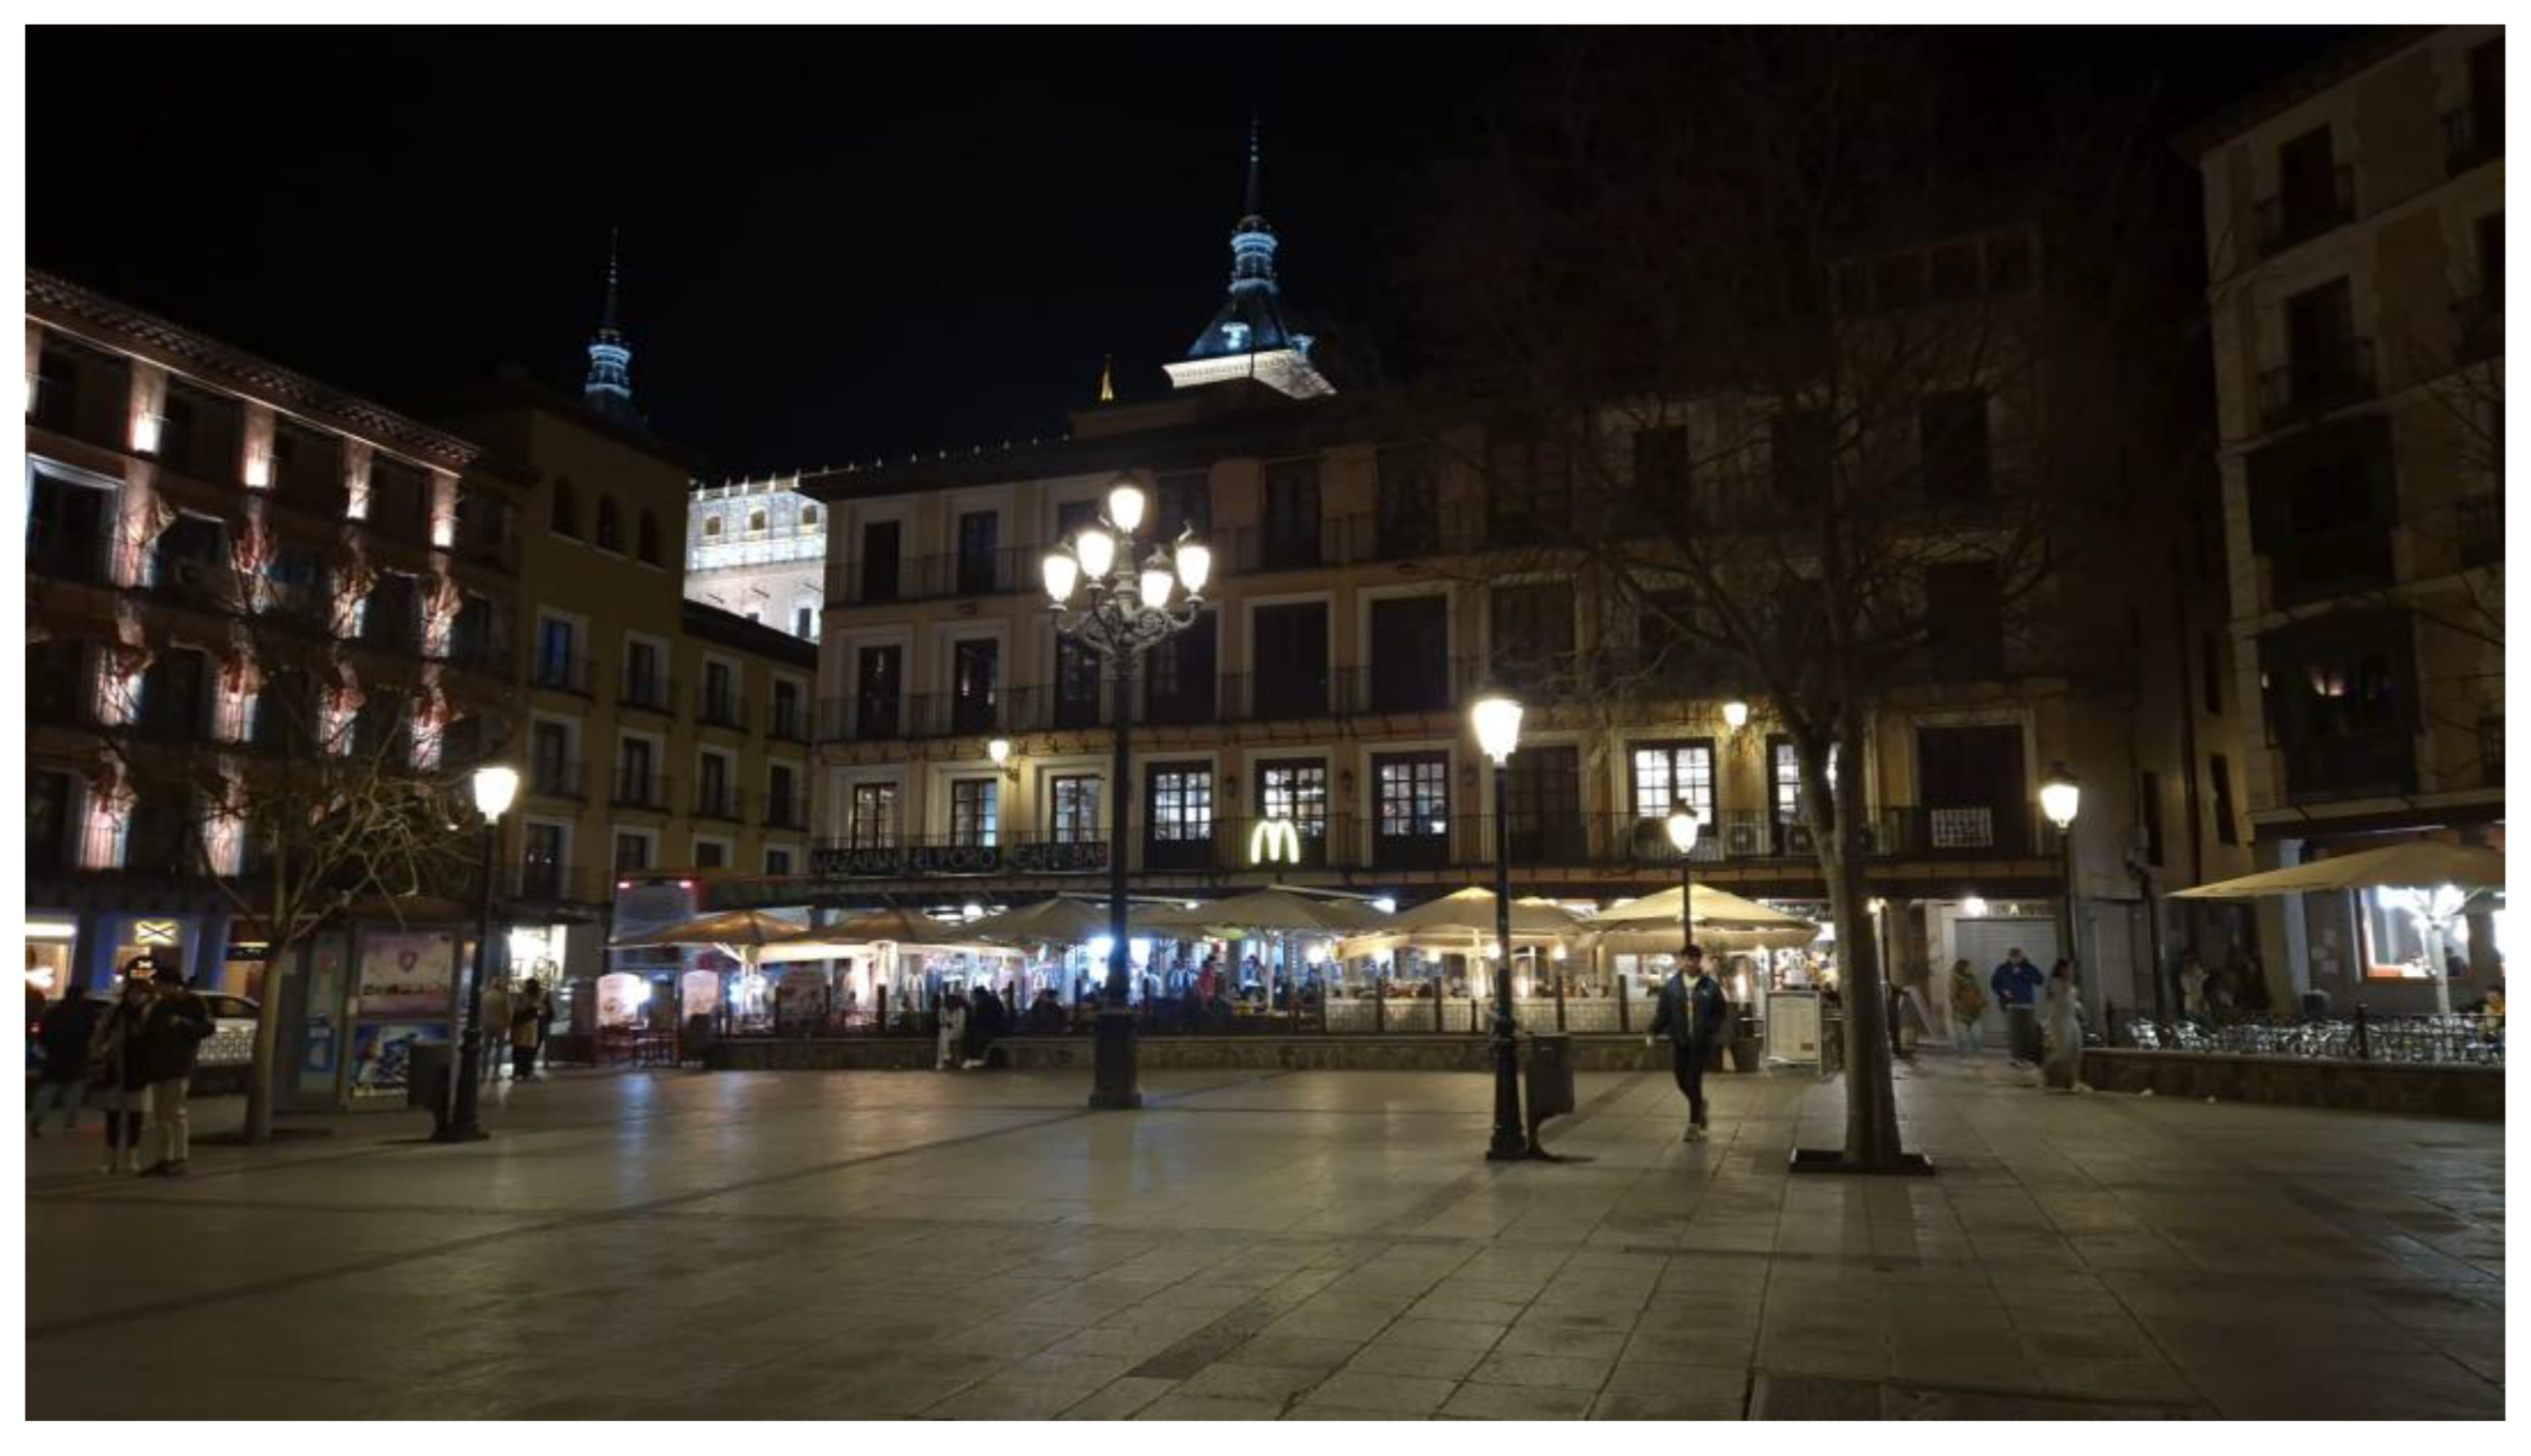
Figure 14.
Toledo square. Plaza Zocodover, view to Zocodover #6. Photo by Nubi Leon Martinez.
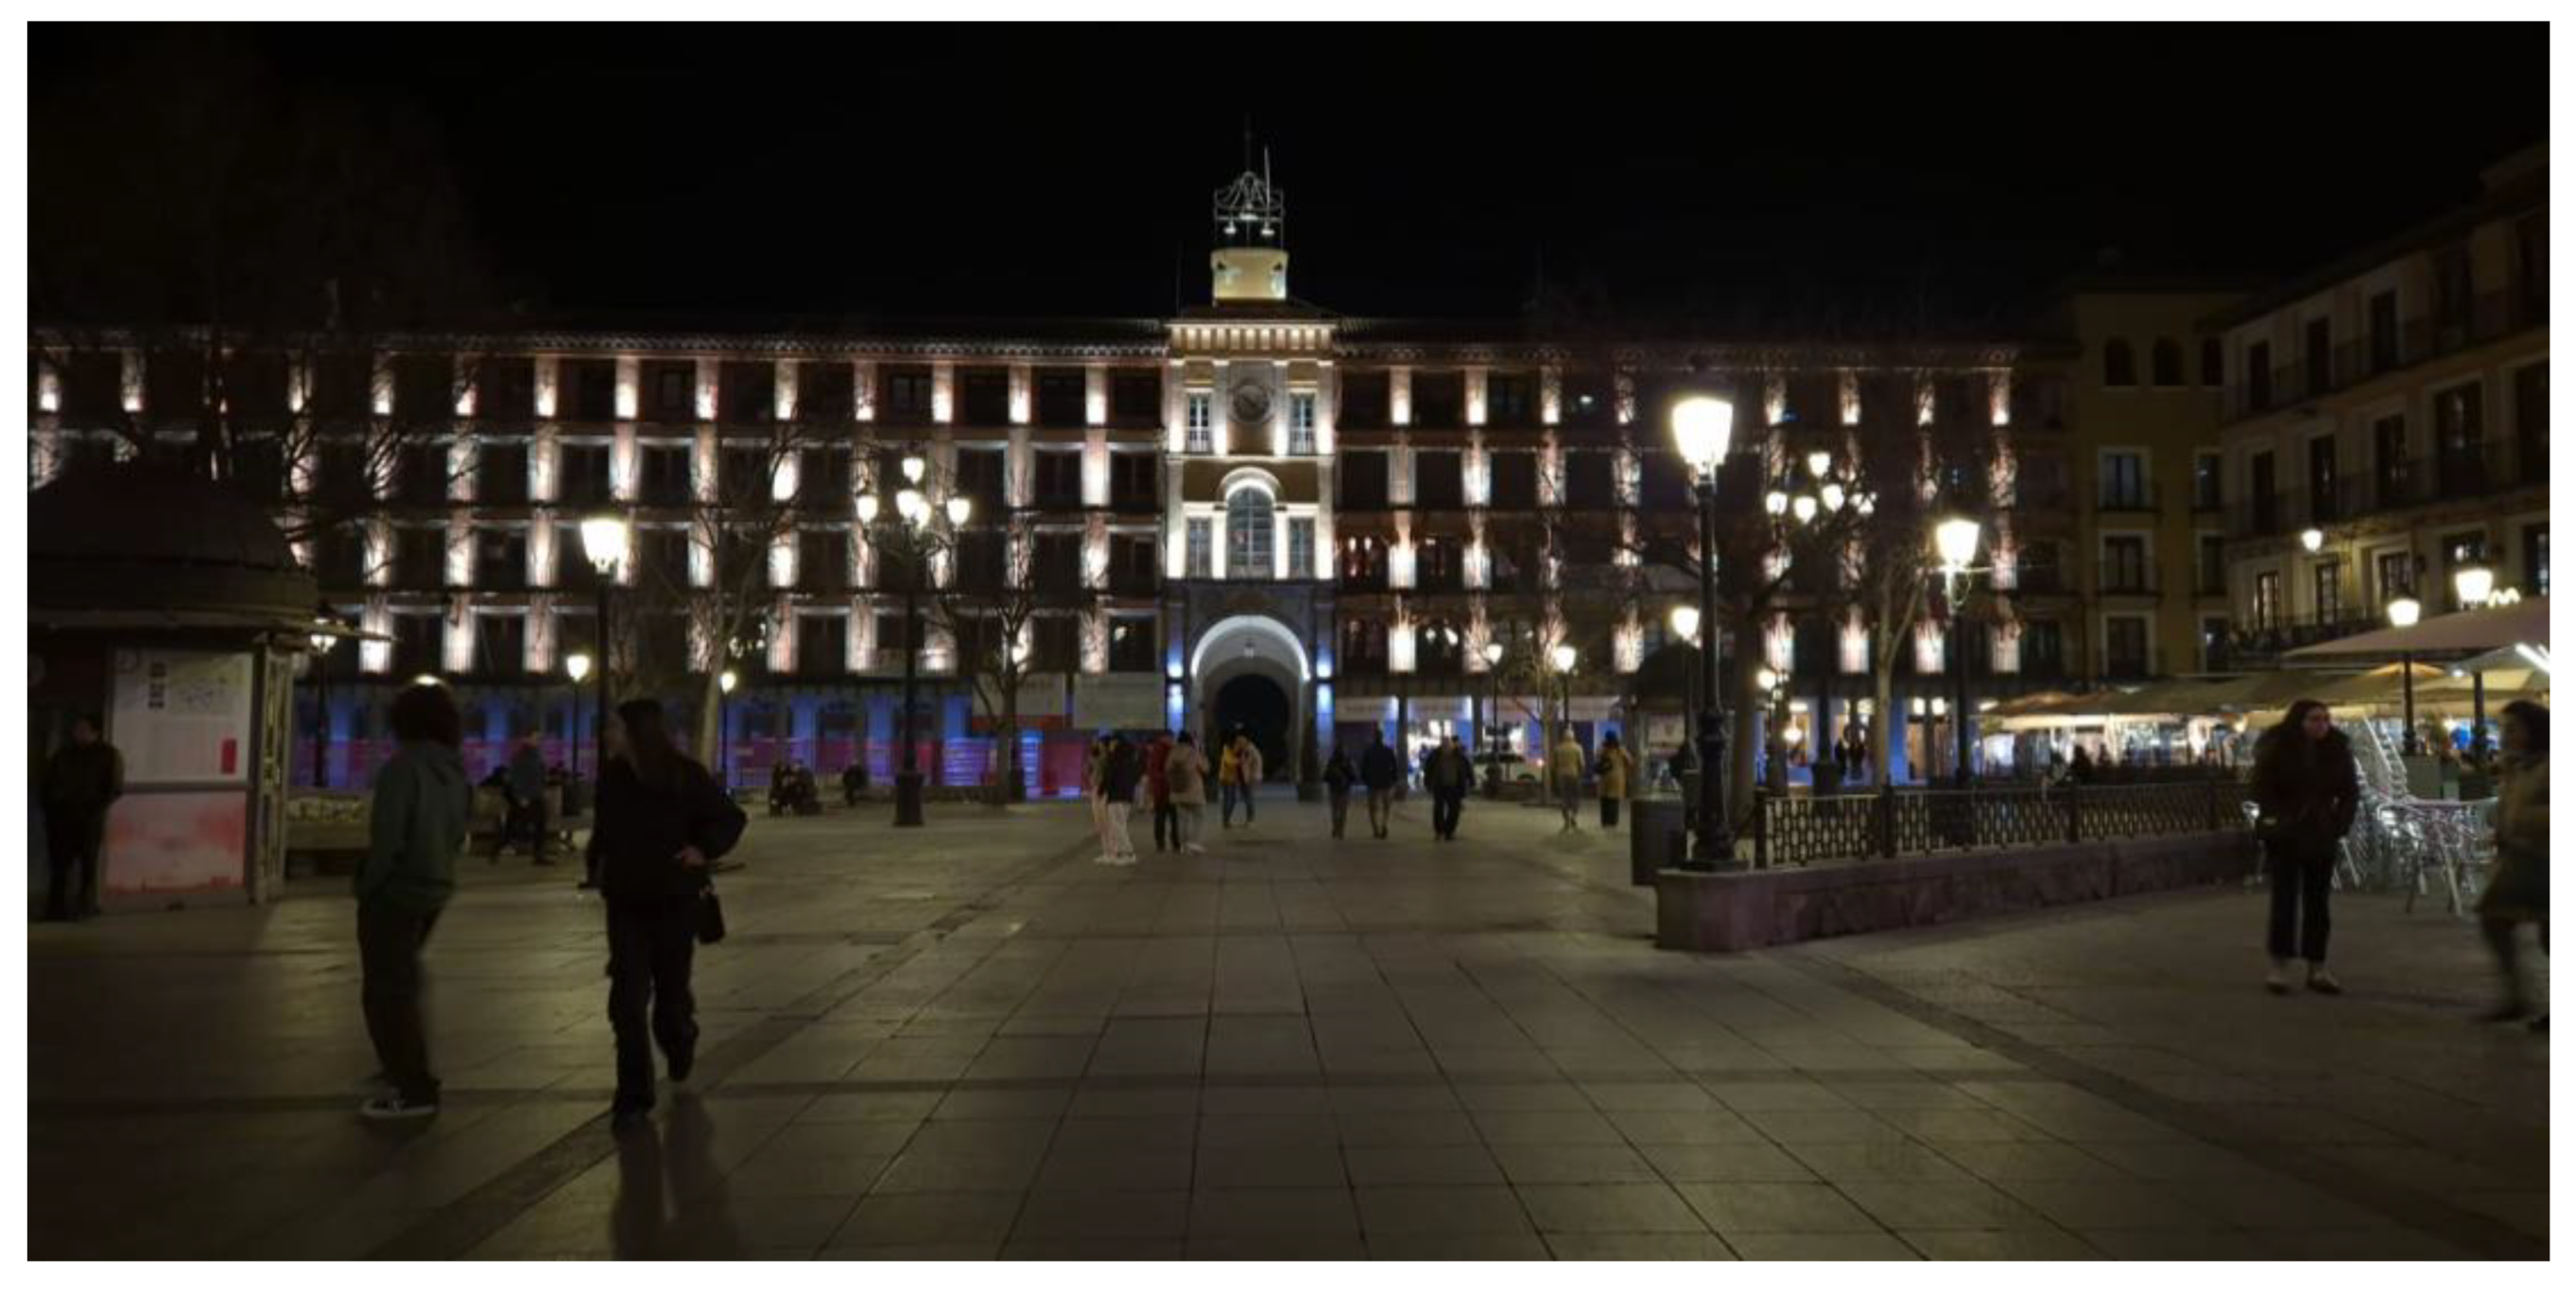
Table 6.
Comparison of lighting levels between Gran Vía (Madrid) and Toledo. Measurements taken at 1 m of high from the floor.
Table 6.
Comparison of lighting levels between Gran Vía (Madrid) and Toledo. Measurements taken at 1 m of high from the floor.
| Madrid | Location | illuminance |
CCT K |
Wavelength peaks nm |
Blue level % | |
| Lx | Fc | |||||
| 1 | Plaza Gran Vía | 134 | 12 | 2989 | 650 | 7.53 |
| 2 | GV 27 | 308 | 28 | 8489 | 470 | 28.60 |
| 3 | GV 33 | 251 | 23 | 4879 | 470 and 650 | 15.79 |
| 4 | GV 49 | 2692 | 250 | 6274 | 470 and 650 | 18.58 |
| 5 | Plaza Callao | 20 | 1 | 2294 | 650 | 0.00 |
| Toledo | Location | illuminance |
CCT K |
Wavelength peaks nm |
Blue level % | |
| Lx | Fc | |||||
| 1 | Tornería street #23 | 2 | 0 | 2164 | 630 | 0 |
| 2 | Cuesta de Fernando V #9 | 10 | 0 | 3098 | 630 | 0 |
| 3 | Plaza Z view to Z#6 | 9 | 0 | 3451 | 630 | 0 |
| 4 | Plaza Z view to Comercio st. | 17 | 1 | 2385 | 630 | 0 |
Disclaimer/Publisher’s Note: The statements, opinions and data contained in all publications are solely those of the individual author(s) and contributor(s) and not of MDPI and/or the editor(s). MDPI and/or the editor(s) disclaim responsibility for any injury to people or property resulting from any ideas, methods, instructions or products referred to in the content. |
© 2025 by the authors. Licensee MDPI, Basel, Switzerland. This article is an open access article distributed under the terms and conditions of the Creative Commons Attribution (CC BY) license (http://creativecommons.org/licenses/by/4.0/).
Copyright: This open access article is published under a Creative Commons CC BY 4.0 license, which permit the free download, distribution, and reuse, provided that the author and preprint are cited in any reuse.


