
Submitted:
30 April 2025
Posted:
02 May 2025
You are already at the latest version
Abstract
The magnitude of pollution generated by public transport is significant and poses a major obstacle to the advancement of the Paris Climate Agreement. Therefore, it is crucial to adopt clean energy sources to drive bus vehicle, with fuel cells being an eco-friendlier option. Merely examining the fuel cell stack in isolation does not provide a viable solution to the problem. It is imperative to study the complete system, encompassing the Proton Exchange Membrane Fuel Cell (PEMFC) integrated with the load, specifically in the context of public transports. The aim of this paper is to design a control system model for a Proton Exchange Membrane Fuel Cell (PEMFC) within MATLAB Simulink environment. The model is designed to simulate the operating state of PEMFC under the conditions of urban road vehicle loads, which can reach up to 60kW. The key feature of PEMFC control system comprises the gas supply system and temperature regulator. For gas supply system, a PID control method is employed to regulate the anode pressure and maintain an acceptable pressure difference with the Cathode. For temperature regulator, water is used as a coolant to maintain the temperature level within the reactor. The fuel cell temperature is then kept within an acceptable range through feedback linearization control, further enhancing the stability of the system. The gas supply system and temperature regulator is incorporated into a system coordinator, which ensure stability of power output, capable of providing for up to 60kW.
Keywords:
PEMFC
; gas supply system
; temperature management system
; PID control
; feedback linearization control
1. Introduction
The global economy has experienced substantial growth, resulting in a significant rise in automobile sales.The production of automobiles will reach approximately 80.15 million in 2021, reflecting a 3% increase from the previous year [1]. The severity of environmental pollution caused by automobiles is increasingly alarming, and the pollution caused by bus.A crucial component of public transportation, cannot be ignored. It is motivated to adopt fuel cell as a source of cleaner energy to power bus [2].
With the implementation of the Paris Climate Agreement, hydrogen energy has increasingly become the focus of the global energy community [3,4,5]. The primary application domain of hydrogen energy is the Proton Exchange Membrane Fuel Cell (PEMFC) [6,7]. To align the clean energy strategies, numerous counties, including Europe, America, Japan, and South Korea, have incorporated their commercial utilization of fuel cells into their national strategic plans [8].
Ferira et al. used the fluid volume method to study the numerical value of the anode gas two-phase flow of the proton exchange membrane fuel cell [9]. Zhao et al. measured the distribution of cathode water using micro-sensors, and analyzed the in-situ measurement of humidity distribution and its impact on the performance of proton exchange membrane fuel cells [10]. Yuehua Li et al. (2018) studied methods to mitigate water flooding in proton exchange membrane fuel cells by examining pressure drop techniques [11]. Lei Xing et al. (2016) investigated the non-uniformity of temperature distribution in the membrane electrode and channel under different stoichiometric flow rates and relative humidity [12]. S.M. Rahgoshay et al. (2017) simulated the PEMFC and cooling flow field simultaneously, comparing two traditional cooling plate flow fields—serpentine and parallel—with the typical isothermal model used in Ansys Fluent software [13]. Hang Su et al. examined the impact of air shortage on proton exchange membrane fuel cell performance, finding that the hydrogen pump phenomenon caused by cathode anoxia could enhance fuel cell performance, aiding in rapid activation or performance recovery [14]. Using the forward-backward energy flow balance method on the Matlab/Simulink platform, the fuel cell bus power system model was established. Comparing the simulation results of the power system model with the 2010 World Expo FCB real vehicle test data, it is concluded that the simulation results of the power system are in good agreement with the real vehicle data, the power system model is in line with the actual situation [15]. Mohammad Salah, A scaled down version of the vehicle powertrain test bench was designed and constructed to explore the operating modes of system components under different road conditions. It was verified that the combination of fuel cell response and battery energy can achieve effective energy management and control when fuel cell response is slow [16]. Jili Tao,A fuzzy energy management strategy based on improved Q-learning and genetic algorithm is proposed for real-time power allocation between fuel cells and supercapacitors in hybrid electric vehicles. The simulation results show that compared with the two adaptive energy management strategies, current fluctuations and hydrogen consumption are reduced, while the charging state of the supercapacitor remains within the required safe range [17].
Although the performance of PEMFC has been studied in detail, the focus has not been on integrating PEMFC with public transport. As a result, there is a lack of understanding on how PEMFC can be effectively employed to power bus vehicles. This paper aims to develop models for the air supply system, hydrogen supply system, and temperature control system. It will then study the overall response of the fuel cell system to load variations.
2. Overview of PEMFC Control System
The PEMFC system is a very complex system, with various other auxiliary systems to assist in addition to the chimney. The auxiliary system mainly includes gas supply system, hydrogen supply system, water and heat management system, and control system that can coordinate the work of the above systems. The main system functions are as follows:
Hydrogen supply system: The function of the hydrogen supply system is to provide a hydrogen flow rate for the fuel cell stack. Hydrogen is reduced to a certain pressure from the high-pressure hydrogen tank through an electric pressure reducing valve, humidified by a humidifier, and flows into the fuel cell stack to participate in the reaction.
Air supply system: PEMFC usually uses oxygen in the air as the oxidant, but the outside air cannot provide the reaction pressure and humidity to meet the reaction requirements. Therefore, the main function of the air supply system is to pressurize and humidify the filtered air through the air compressor and humidifier successively, and send it to the stack after reaching a certain pressure and humidity to meet the normal working requirements of the fuel cell [18].
Thermal Management Subsystem: The thermal management subsystem includes monitoring and control elements for the fuel cell stack and reaction temperature system [19]. The thermal management subsystem is responsible for keeping the operating temperature of the system within acceptable limits.
System coordinator: Proton exchange membrane fuel cell is a complex system. The control system needs to coordinate the interactions between various subsystems to ensure the safe, efficient, and stable output of the fuel cell. Typically, the functions of a control system are:
- (1)
- Control air and fuel flow to meet power output while preventing damage to proton exchange membrane due to reactant pressure differential;
- (2)
- Control the temperature management system to provide the proper temperature for the fuel cell;
- (3)
- Control the output power of the fuel cell to maintain a relatively stable power output.
In a typical hydrogen oxygen fuel cell system. The air in the system is pressurized by the air compressor and enters the humidifier. The humidified humid air enters the cathode through the intake manifold, and oxygen participates in the electrochemical reaction of the cathode of the fuel cell stack. The remaining exhaust gas from the reaction is then discharged through the reflux manifold and back pressure valve. Hydrogen is stored in a high-pressure hydrogen tank, and the pressure reducing valve reduces the pressure before flowing into the humidifier. The humidified hydrogen in the humidifier enters the anode of the fuel cell stack to participate in the reaction; If the anode outlet is sealed, the anode water will continue to increase and it will be difficult to discharge. Regularly release a small amount of anode gas by establishing an anode exhaust valve. The usual practice is to periodically release anode gas by establishing an anode exhaust valve and purging it with high-pressure hydrogen gas. The temperature of the fuel cell stack is regulated by a cooling pump, and the heat generated by the reaction is carried away by the coolant. The temperature of the fuel cell stack can be controlled by controlling the coolant flow rate. The fuel cell system requires control of the air compressor, pressure reducing valve, release valve, back pressure valve, and coolant pump to maintain various operating parameters of the fuel cell within appropriate ranges.
3. PEMFC Control System
Due to significant interactions between different subsystems, designing a control system to achieve high-efficiency PEM fuel cell performance is challenging. For the gas supply system, it is expected to swiftly respond to varying power demands at the fuel cell load end and provide accurate gas flow to avoid excess gas or “starvation.” Additionally, during the flow response process, the gas pressure in the stack is required to be minimized to ensure the stability of the fuel cell output [20]. For both sides of the proton exchange membrane of the fuel cell, the anode pressure needs to be kept at a similar value to the cathode pressure. If the pressure difference between the anode and the cathode is too large, the proton exchange membrane may be damaged. This paper employs the PID control method to manage several aspects of the fuel cell system. The flow of the air compressor at the cathode inlet is controlled to supply the required oxygen for the fuel cell. The back pressure valve at the cathode outlet is adjusted to maintain the desired pressure on the cathode side of the stack. Additionally, the hydrogen inlet pressure reducing valve on the anode side is regulated to ensure the anode pressure closely follows the cathode pressure, thereby maintaining a small pressure difference [21]. For temperature control, it is the most common technique to control the temperature of the fuel cell stack by installing a cooling system around the fuel cell stack. The temperature system in this paper uses water as the coolant to maintain the temperature in the stack constant, and maintains the fuel cell temperature within a reasonable range through a feedback linear control method.
3.1. Flow and Pressure Control of Gas Supply System
In order to improve the dynamic characteristics of the air supply system and ensure the normal operation of the fuel cell system, it is necessary to adjust the output air flow of the air compressor. In this paper, according to the peroxygen ratio required for the reaction, the PI controller based on the peroxygen ratio is used to control the air inlet flow [22]. Eroxygen ratio is the excess coefficient of oxygen, which refers to the ratio between the amount of oxygen provided by the air compressor and the amount of oxygen demanded by the fuel cell reaction. If the peroxygen ratio is small, it is easy to cause insufficient oxygen partial pressure at the cathode, resulting in a slowdown of the reaction rate of the fuel cell; Excessive peroxygen ratio will increase the load of the air compressor, resulting in a substantial increase in the parasitic power of the fuel cell and a reduction in the net power of the fuel cell. In this paper, based on the existing research results, a peroxygen ratio of 2 is selected to control the air flow required by the air compressor to supply the stack [23].
The controller takes the difference between the expected flow and the actual flow as the input of the PI controller, the voltage of the air compressor as the output of the controller, and the current as the disturbance signal. The expected flow rate is calculated according to the oxygen ratio, the measured air compressor flow rate is taken as the actual value, the actual value is compared with the expected value, and the deviation of the two is used to correct the response of the system, so as to adjust and control the voltage of the air compressor, The change of the air compressor voltage will affect the change of the air compressor speed and the air compressor air flow .
The PI controller of the air compressor is given by:
In the formula: and are the proportional gain and integral gain of the controller, respectively, and is the flow error of the air compressor.
In the formula: is the desired flow rate, calculated according to the peroxygen ratio and the oxygen consumption rate :
In the formula: is the mass fraction of oxygen in the air.
The cathode outlet gas flow restricts the gas flow through a back pressure valve, The control goal of the back pressure valve is to ensure the stability of the internal pressure of the fuel cell cathode and to remove the exhaust gas in time. Therefore, it is necessary to make the opening area of the back pressure valve change correspondingly with the change of the cathode pressure. The change process of the opening area of the back pressure valve can be regarded as a first-order inertia link, as follows:
In the formula: is the control signal of the back pressure valve; is the opening area of the back pressure valve; is the gain; is the time constant.
The cathode pressure is controlled by designing a PI controller, as shown in equation (5), the pressure difference between the actual cathode pressure and the target pressure is used as the input signal of the PI controller, and the back pressure valve control signal is used as the output.
In the formula: and are the proportional gain and integral gain of the PI controller.
3.2. Flow and Pressure Control of Hydrogen Supply System
The hydrogen on the anode side flows out from the hydrogen tank through an electric pressure reducing valve. The control goal of the electric pressure reducing valve is to realize that the pressure on the anode side of the fuel cell quickly follows the cathode side, and prevent the proton exchange membrane from being damaged due to excessive pressure difference.
The relationship between the opening of the electric pressure reducing valve and the control signal is shown in formula (6):
The control amount of the control voltage signal is the pressure difference between the anode and the cathode, as shown in formula (7):
and are the proportional gain and integral gain of the PI controller gain, respectively.
The anode outlet of the fuel cell typically remains closed, offering a simpler structural design compared to recirculation configurations. However, this setup poses a risk of water accumulation, potentially leading to blockages in the hydrogen channel. Therefore, it is necessary to periodically open the vent valve to purge excess water. In this paper, the air release valve is set to open every 5s and the duration is 10ms.
3.3. Research on Temperature System Control
The temperature management system controls the temperature of the fuel cell system through the coolant mass flow, the coolant flow is related to the output performance of the pump. It can be considered that the process of providing coolant flow by the pump has first-order dynamics, and the transfer function between the output mass flow and the input voltage is:
In the formula: time constant of the water pump; is the pump gain.
The temperature control of the fuel cell stack in this paper uses water as the coolant, For temperature control systems, The required flow of coolant is calculated through feedback linear control, which takes the difference between the target temperature and the actual temperature of the stack as the input [24], and obtains the coolant flow of the pump according to equation (9). After that, the PI controller is used to correct the response of the system with the deviation between the required coolant flow and the actual coolant flow, thereby controlling the stack temperature.
The required coolant flow can be calculated using equation (9):
In the formula: K is the feedback linearization coefficient, which is taken as 0.9; is the target temperature, which is set to 348.15K in this paper.
The cooling water pump control voltage signal is obtained by designing a PI controller, as in formula (10):
In the formula, and are the PI controller gains.
4. Dynamic Simulation Analysis of PEMFC System Model
Image 1 shows the Simulink simulation model of the established 60kW PEMFC system. Table 1 shows the required parameter parameters (provided as an attachment due to the large size of the image in Figure 1).
4.1. Dynamic Simulation Analysis of 60kW PEMFC System Model
Since the output performance of the fuel cell is affected by multiple factors, in this paper, the stack temperature is kept constant at 348.15K, the target cathode pressure is , and the relative humidity of the cathode and anode humidifiers is set to 0.7, multiple load currents The step change is used to simulate and analyze the 60kW PEMFC system model, and the simulation time is 50s. As shown in Figure 2, the initial value of the load current is set to 80A, which will step up to 150A and 200A at 8s and 20s respectively, drop to 100A at 32s, and rise to 160A at 40s. When the proportional coefficient of the air compressor PI controller is 0.0525, the integral coefficient is 0.094; The proportional coefficient of the back pressure valve is , and the integral coefficient is ; The proportional coefficient of the anode electric pressure reducing valve is , and the integral coefficient is . The simulation res ults are as follows:
As shown in Figure 3, When the load current is 80A, the output voltage of the fuel cell is 270.4V. When the load current rises to 150A, the fuel cell voltage rapidly decreases and the power rapidly increases due to the increase of activation overvoltage, ohmic overvoltage, and concentration overvoltage. Afterwards, due to the influence of the partial pressure of the cathode and anode reactants, the output voltage and power of the fuel cell continued to decrease to a low point. As the partial pressure of the reactants becomes stable, the output voltage and output power of the fuel cell also become stable.
The change in cathode pressure is influenced by the control effect of the air compressor and back pressure valve, while the change in anode pressure is controlled by the pressure reducing valve and exhaust valve. From Figure 4, it can be seen that the cathode and anode pressures remain relatively stable during the step process. As the load current increases, the cathode pressure of the fuel cell initially decreases due to oxygen consumption, and then gradually increases with the increase of the air compressor delivery flow rate. Due to the adjustment of the back pressure valve, the effect of the increase in cathode pressure caused by the air compressor gradually weakens, and ultimately the cathode pressure stabilizes at the target value.When the exhaust valve is cleaned every 5 seconds, there will be a significant decrease in anode pressure. When the anode pressure is lower than the cathode pressure, the pressure reducing valve responds quickly, increases the hydrogen flow supply, and reduces the pressure difference. Figure 4 shows the change in pressure difference between the cathode and anode under a step change in load current. It can be seen that the control effect of the anode pressure reducing valve can better reduce the pressure difference, which is less than 3kPa, thereby protecting the proton exchange membrane.
As shown in Figure 5, the air compressor with cathode inlet oxygen ratio can quickly achieve the expected value of the actual airflow delivered by the air compressor. Due to the inertia of the motor and rotor, the airflow cannot be instantly changed, resulting in an increase in current and a short-term decrease in fuel cell voltage. When the load current gradually changes, the back pressure valve responds quickly to maintain stable cathode pressure. As the load current gradually increases, the opening area of the back pressure valve first rapidly decreases to cope with the decrease in cathode pressure, and then follows the cathode pressure. Increased pressure; During the pressure reduction process, the open area first increases rapidly and then decreases with the decrease of cathode pressure.
As shown in Figure 6, it is the gas flow rate of the anode pressure reducing valve and the bleed valve. The anode pressure reducing valve transports high-pressure dry hydrogen into the anode channel, and enters the anode after humidification. The pressure reducing valve reduces the pressure difference between the anode and the cathode by controlling the change of the hydrogen flow rate. When the current step changes, the pressure reducing valve can respond quickly. Since the response speed of the cathode air compressor is relatively slow, after the load current is changed stepwise, the hydrogen flow rate will be excessive and then retraced. The vent valve was opened every 5s for 10ms, and the anode water was swept out by the anode high-pressure wet hydrogen.
As shown in Figure 7, it is the gas partial pressure of each cathode gas under the step change of the load current. When the oxygen consumption increases, the cathode oxygen partial pressure will decrease with the increase of the current. After that, it tends to be stable under the adjustment of the air compressor and the back pressure valve. Since nitrogen is not consumed, its partial pressure state is opposite to that of oxygen. Since the water flowing into the cathode of the humidifier and the water generated by the electrochemical reaction provide more water for the cathode of the stack, the water pressure of the cathode will be equal to the saturated vapor pressure at this time. Since the stack temperature is set to a constant value, the water pressure will remain unchanged. When the current step decreases, the water generated by the electrochemical reaction decreases rapidly, and the water pressure decreases rapidly. With the entry of moist air and the reduction of the phase change, the water pressure gradually rises and returns to stability.
The humidified hydrogen enters the flow channel through the anode pressure reducing valve, and as the load current increases, the intake and gaseous water increase. Part of the water migrates to the cathode through membrane electrolysis and diffuses towards the anode due to the water pressure difference. Excess water from the anode is discharged through the exhaust valve, causing fluctuations in anode water pressure. When the load current changes step by step, the membrane moisture content, anode partial pressure, and transmembrane water transport flow rate change. As shown in Figure 7, When the relative humidity of the humidifier is 0.7, the anode water pressure can be maintained close to the saturated vapor pressure, and the water content of the proton exchange membrane is close to 14, which is similar to the cathode water pressure. Therefore, the flow of anodic water to the cathode caused by electromigration becomes the main factor for water transmembrane transport. When the load current increases, the water flowing from the anode to the cathode also increases, reducing the anode water pressure and affecting the water content of the proton exchange membrane. As the load current gradually decreases, due to the significant decrease in cathode water pressure, the anode water pressure is greater than the cathode water pressure, and the water flowing from the anode to the cathode increases. The water pressure on the cathode side rapidly increases due to the combined action of the humidifier and the water generated by the electrochemical reaction, and soon exceeds the water pressure on the anode side. The water flow on the cathode side will diffuse to the anode. As the load current stabilizes, the transmembrane water transport ultimately stabilizes, and the water content of the proton exchange membrane also decreases due to the decrease in water pressure on both sides. Every time the vent valve operates, the anode water pressure rapidly decreases, affecting the water pressure, proton exchange membrane moisture content, and transmembrane water flow.
In this paper, 600s simulation time is used to simulate and analyze the temperature system. The load current step change is shown in Figure 8, The initial value of the load current is 80A, and the step changes to 150A, 200A, and 110A at 100s, 300s, and 150s, respectively. Set the pump proportional coefficient to 0.511, and the integral coefficient to 0.254.
Figure 9 shows the variation curves of the stack temperature and the temperature and flow rate of the coolant entering the stack when the load current changes step by step. The actual coolant temperature is not constant. This article sets the coolant temperature as a sine curve of 333.15K reference temperature, with an amplitude of 3K and an angular velocity of 0.1rad/s. When the load current remains constant, the flow rate of coolant entering the stack shows an opposite trend to the sinusoidal variation of the inlet temperature. When the load current increases, the output voltage of the fuel cell decreases, heat loss increases, and more heat is generated. Therefore, the coolant flow rate rapidly increases to take away excess heat; When the load current decreases, the generated heat decreases and the coolant flow rate correspondingly decreases. When the load current increases step by step, the highest temperatures of the stack are 348.57K and 348.51K, respectively, and the lowest temperature when the step decreases is 347.58K. The temperature fluctuation of the fuel cell stack is relatively small, generally maintaining around 348.15K.
5. Conclusions
By analyzing typical PEMFC systems and electrochemical reaction models, this study established models for fuel cell reactors, gas supply systems, and temperature control systems, and explored control methods for PEMFC systems. The simulation results show that under the control of the built system, the fuel cell can generate up to 55kW of power, approaching its maximum capacity of 60kW, reflecting the potential application of fuel cells in the field of public transportation. The maximum pressure difference between the anode and cathode of a fuel cell is 3kPa, and the additional stress generated by the pressure difference on the proton exchange membrane is minimal, which helps to extend its service life. The simulation also shows that when the load current step increases, the highest temperatures of the fuel cell stack are 348.57K and 348.51K, respectively. When the step decreases, the lowest temperature is 347.58K, and the overall temperature fluctuation of the fuel cell stack is small, maintaining around 348.15K. This indicates that the established PEMFC system model can accurately reflect the operating status of the system. By controlling the air compressor, cathode back pressure valve, electric pressure reducing valve, anode exhaust valve, and cooling water pump, the partial pressure of reactants, system temperature, anode cathode pressure, and membrane water content are maintained within a reasonable range, and the fuel cell exhibits good dynamic output performance.
Acknowledgments
This study is supported by: Major Science and Technology Projects in Henan Province (221100240200); National Foreign Expert Program (G2023026005L); The Key R&D and Promotion of Special Scientific and Technological Research Projects of Henan Province [242102240108].
Declaration of Conflicting Interests
The Authors declare that there is no conflict of interest
References
- Wei Huili, Chang Guofeng, Shi Rongqun, Xu Sichuan, Liu Jinling. Preparation and properties of graphite/polypropylene composite material reinforced by chopped carbon fibers for proton-exchange membrane fuel cell bipolar plates[J]. Fuel Cells, 2023, 23(1).
- United Nations Environment Programme. Healthy environment, healthy people[R]. Geneva: United Nations Environment Programme, 2016.
- Qian Fanyue, Gao Weijun, Yu Dan, Yang Yongwen, Ruan Yingjun. An Analysis of the Potential of Hydrogen Energy Technology on Demand Side Based on a Carbon Tax: A Case Study in Japan[J]. Energies, 2022, 16(1).
- Zhang Yuemeng, Wang Jia, Yao Zhanhui. Recent Development of Fuel Cell Core Components and Key Materials: A Review[J]. Energies, 2023, 16(5).
- Salimi Mohsen, Hosseinpour Morteza, N.Borhani Tohid. The Role of Clean Hydrogen Value Chain in a Successful Energy Transition of Japan[J]. Energies, 2022, 15(16).
- Zhang Yuemeng, Wang Jia, Yao Zhanhui. Recent Development of Fuel Cell Core Components and Key Materials: A Review[J]. Energies, 2023, 16(5).
- Chen Xin, Zhang Ying, Xu Sheng, Dong Fei. Bibliometric analysis for research trends and hotspots in heat and mass transfer and its management of proton exchange membrane fuel cells[J]. Applied Energy, 2023, 333.
- Gilmore Nicholas, Koskinen Ilpo, van Gennip Domenique, Paget Greta, Burr Patrick A, Obbard Edward G, Daiyan Rahman, Sproul Alistair, Kay Merlinde, Lennon Alison, Konstantinou Georgios, Hemer Mark, Gui Emi Minghui, Gurieff Nicholas. Clean energy futures: An Australian based foresight study[J]. Energy, 2022, 260.
- Rui B. Ferreira, D.S. Falcão, V.B. Oliveira, A.M.F.R. Pinto. Numerical simulations of two-phase flow in an anode gas channel of a proton exchange membrane fuel cell[J]. Energy, 2015, 82. [CrossRef]
- Zhao Junjie, Tu Zhengkai, Chan Siew Hwa. In-situ measurement of humidity distribution and its effect on the performance of a proton exchange membrane fuel cell[J]. Energy, 2022, 239(PD).
- Yuehua Li, Pucheng Pei, Ziyao Wu, Peng Ren, Xiaoning Jia, Dongfang Chen, Shangwei Huang. Approaches to avoid flooding in association with pressure drop in proton exchange membrane fuel cells[J]. Applied Energy, 2018, 224. [CrossRef]
- Lei Xing, Qiong Cai, Xiaoteng Liu, Chunbo Liu, Keith Scott, Yongsheng Yan. Anode partial flooding modelling of proton exchange membrane fuel cells: Optimisation of electrode properties and channel geometries[J]. Chemical Engineering Science, 2016, 146. [CrossRef]
- S.M. Rahgoshay, A.A. Ranjbar, A. Ramiar, E. Alizadeh. Thermal investigation of a PEM fuel cell with cooling flow field[J]. Energy, 2017, 134. [CrossRef]
- Su Hang, Ye Donghao, Cai Yuanqi, Guo Wei. Air starvation of proton exchange membrane fuel cells and its beneficial effects on performance[J]. Applied Energy, 2022, 323.
- Chen X, Zhong J, Wei J. Research on Modeling and Simulation of Fuel Cell Bus Power System Based on Forward-Backward energy flow balance method. Science Progress. 2022; 105(1). [CrossRef]
- Salah M, Abu Mallouh M, Youssef M, Abdelhafez E, Hamdan M, Surgenor B. Hybrid vehicular fuel cell/battery powertrain test bench: design, construction, and performance testing. Transactions of the Institute of Measurement and Control. 2017; 39(9): 1431-1440. [CrossRef]
- Tao J, Zhang R, Qiao Z, Ma L. Q-Learning-based fuzzy energy management for fuel cell/supercapacitor HEV. Transactions of the Institute of Measurement and Control. 2022; 44(10): 1939-1949. [CrossRef]
- Deng Zhihua, Chen Qihong, Zhang Liyan, Zhou Keliang, Zong Yi, Fu Zhichao, Liu Hao. Data-driven reconstruction of interpretable model for air supply system of proton exchange membrane fuel cell[J]. Applied Energy, 2021, 299.
- Li Hong peng. Research and Implementation of Modeling and Control Methods for Proton Exchange Membrane Fuel Cell Systems [D]. Tianjin University of Technology, 2017.
- Zheng Xianna, Lin Ruiquan. Review of Control Strategies for Proton Exchange Membrane Fuel Cells [J]. Electrical Technology, 2017(11): 1-6.
- Jia Zhaodong. Research on Air Supply Control Technology for Fuel Cells [D]. Tongji University, 2014.
- Pukrushpan, J.T. A.G. Stefanopoulou, and H. Peng. 2004a. Control of fuel cell power systems: Principles, modeling, analysis, and feedback design. London, New York: Springer.
- Hu Mei. Research on modeling and control methods for fuel cell systems [D]. Sichuan: Southwest Jiaotong University, 2013.
- Kolodziej, J.R. 2007. Thermal dynamic modeling and nonlinear control of a proton exchange membrane fuel cell stack. Journal of Fuel Cell Science and Technology. [CrossRef]
Figure 1.
60kW PEMFC System simulink Simulation Model.
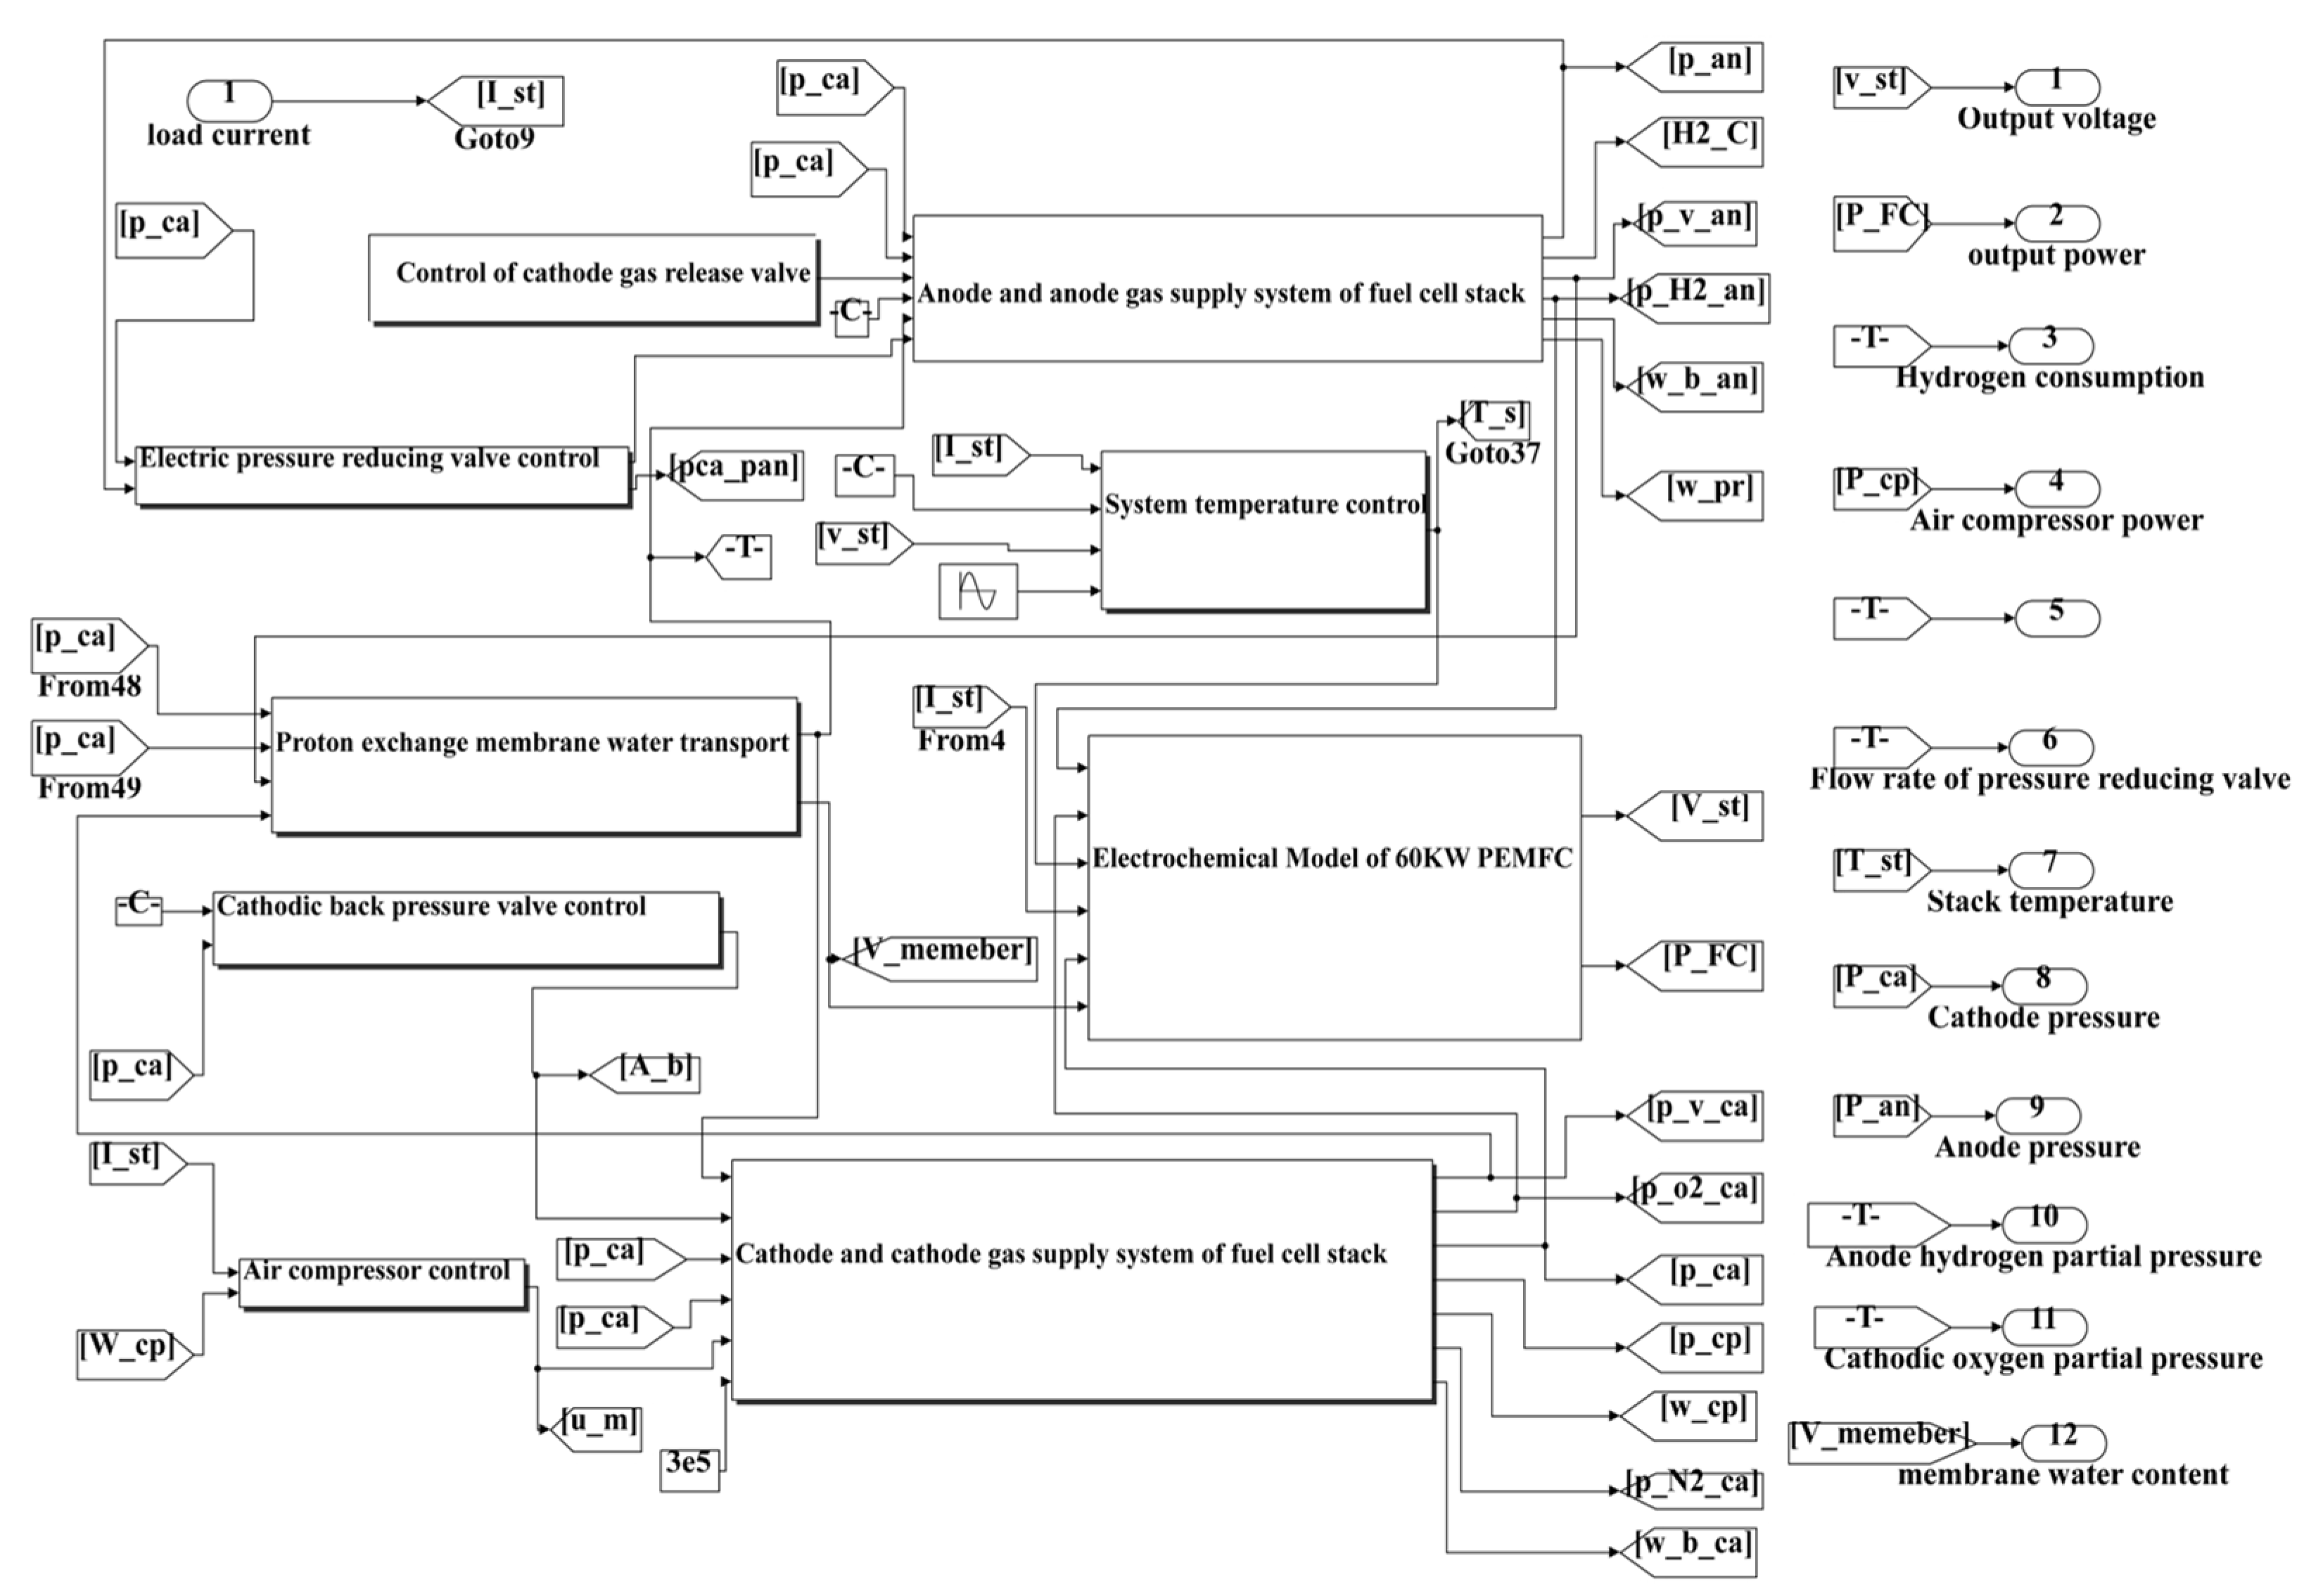
Figure 2.
Load current step change simulation signal.
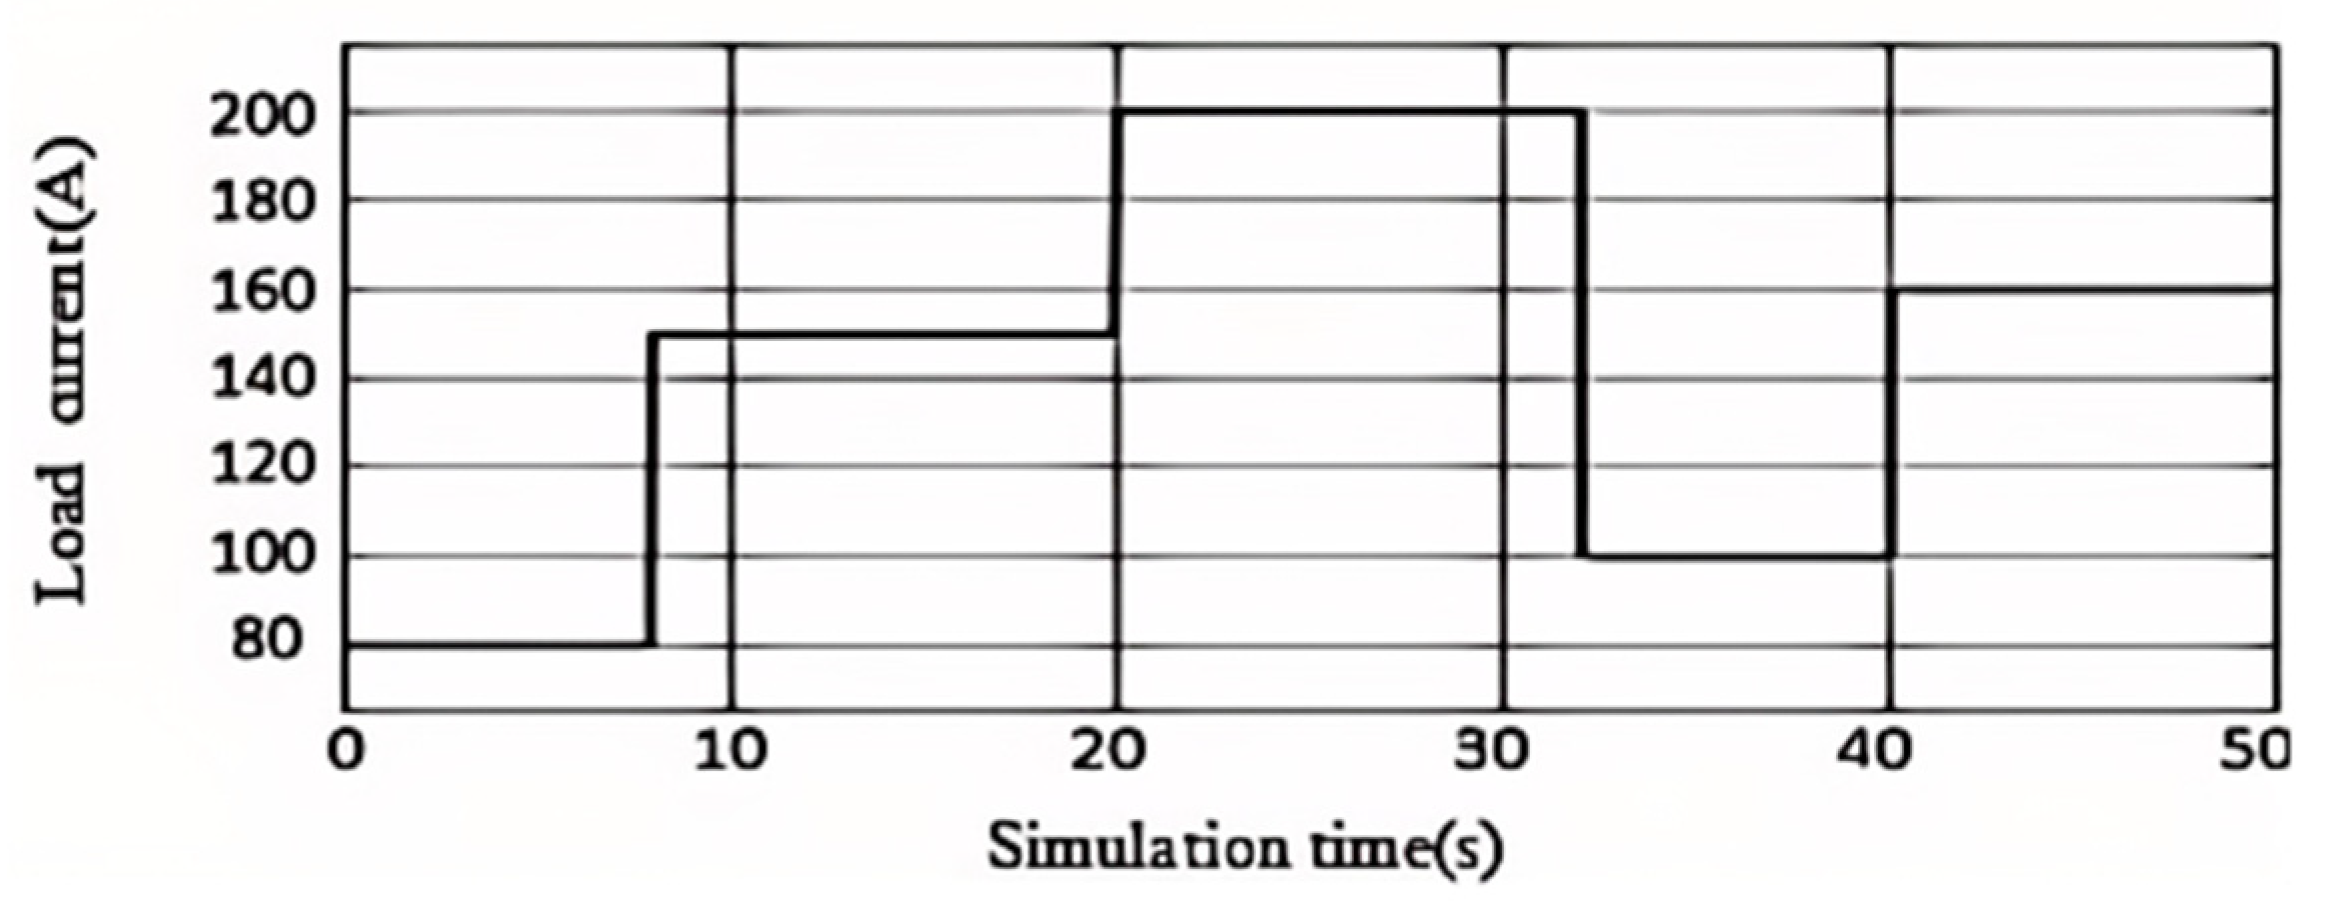
Figure 3.
Output voltage output power curve with step change of load current.
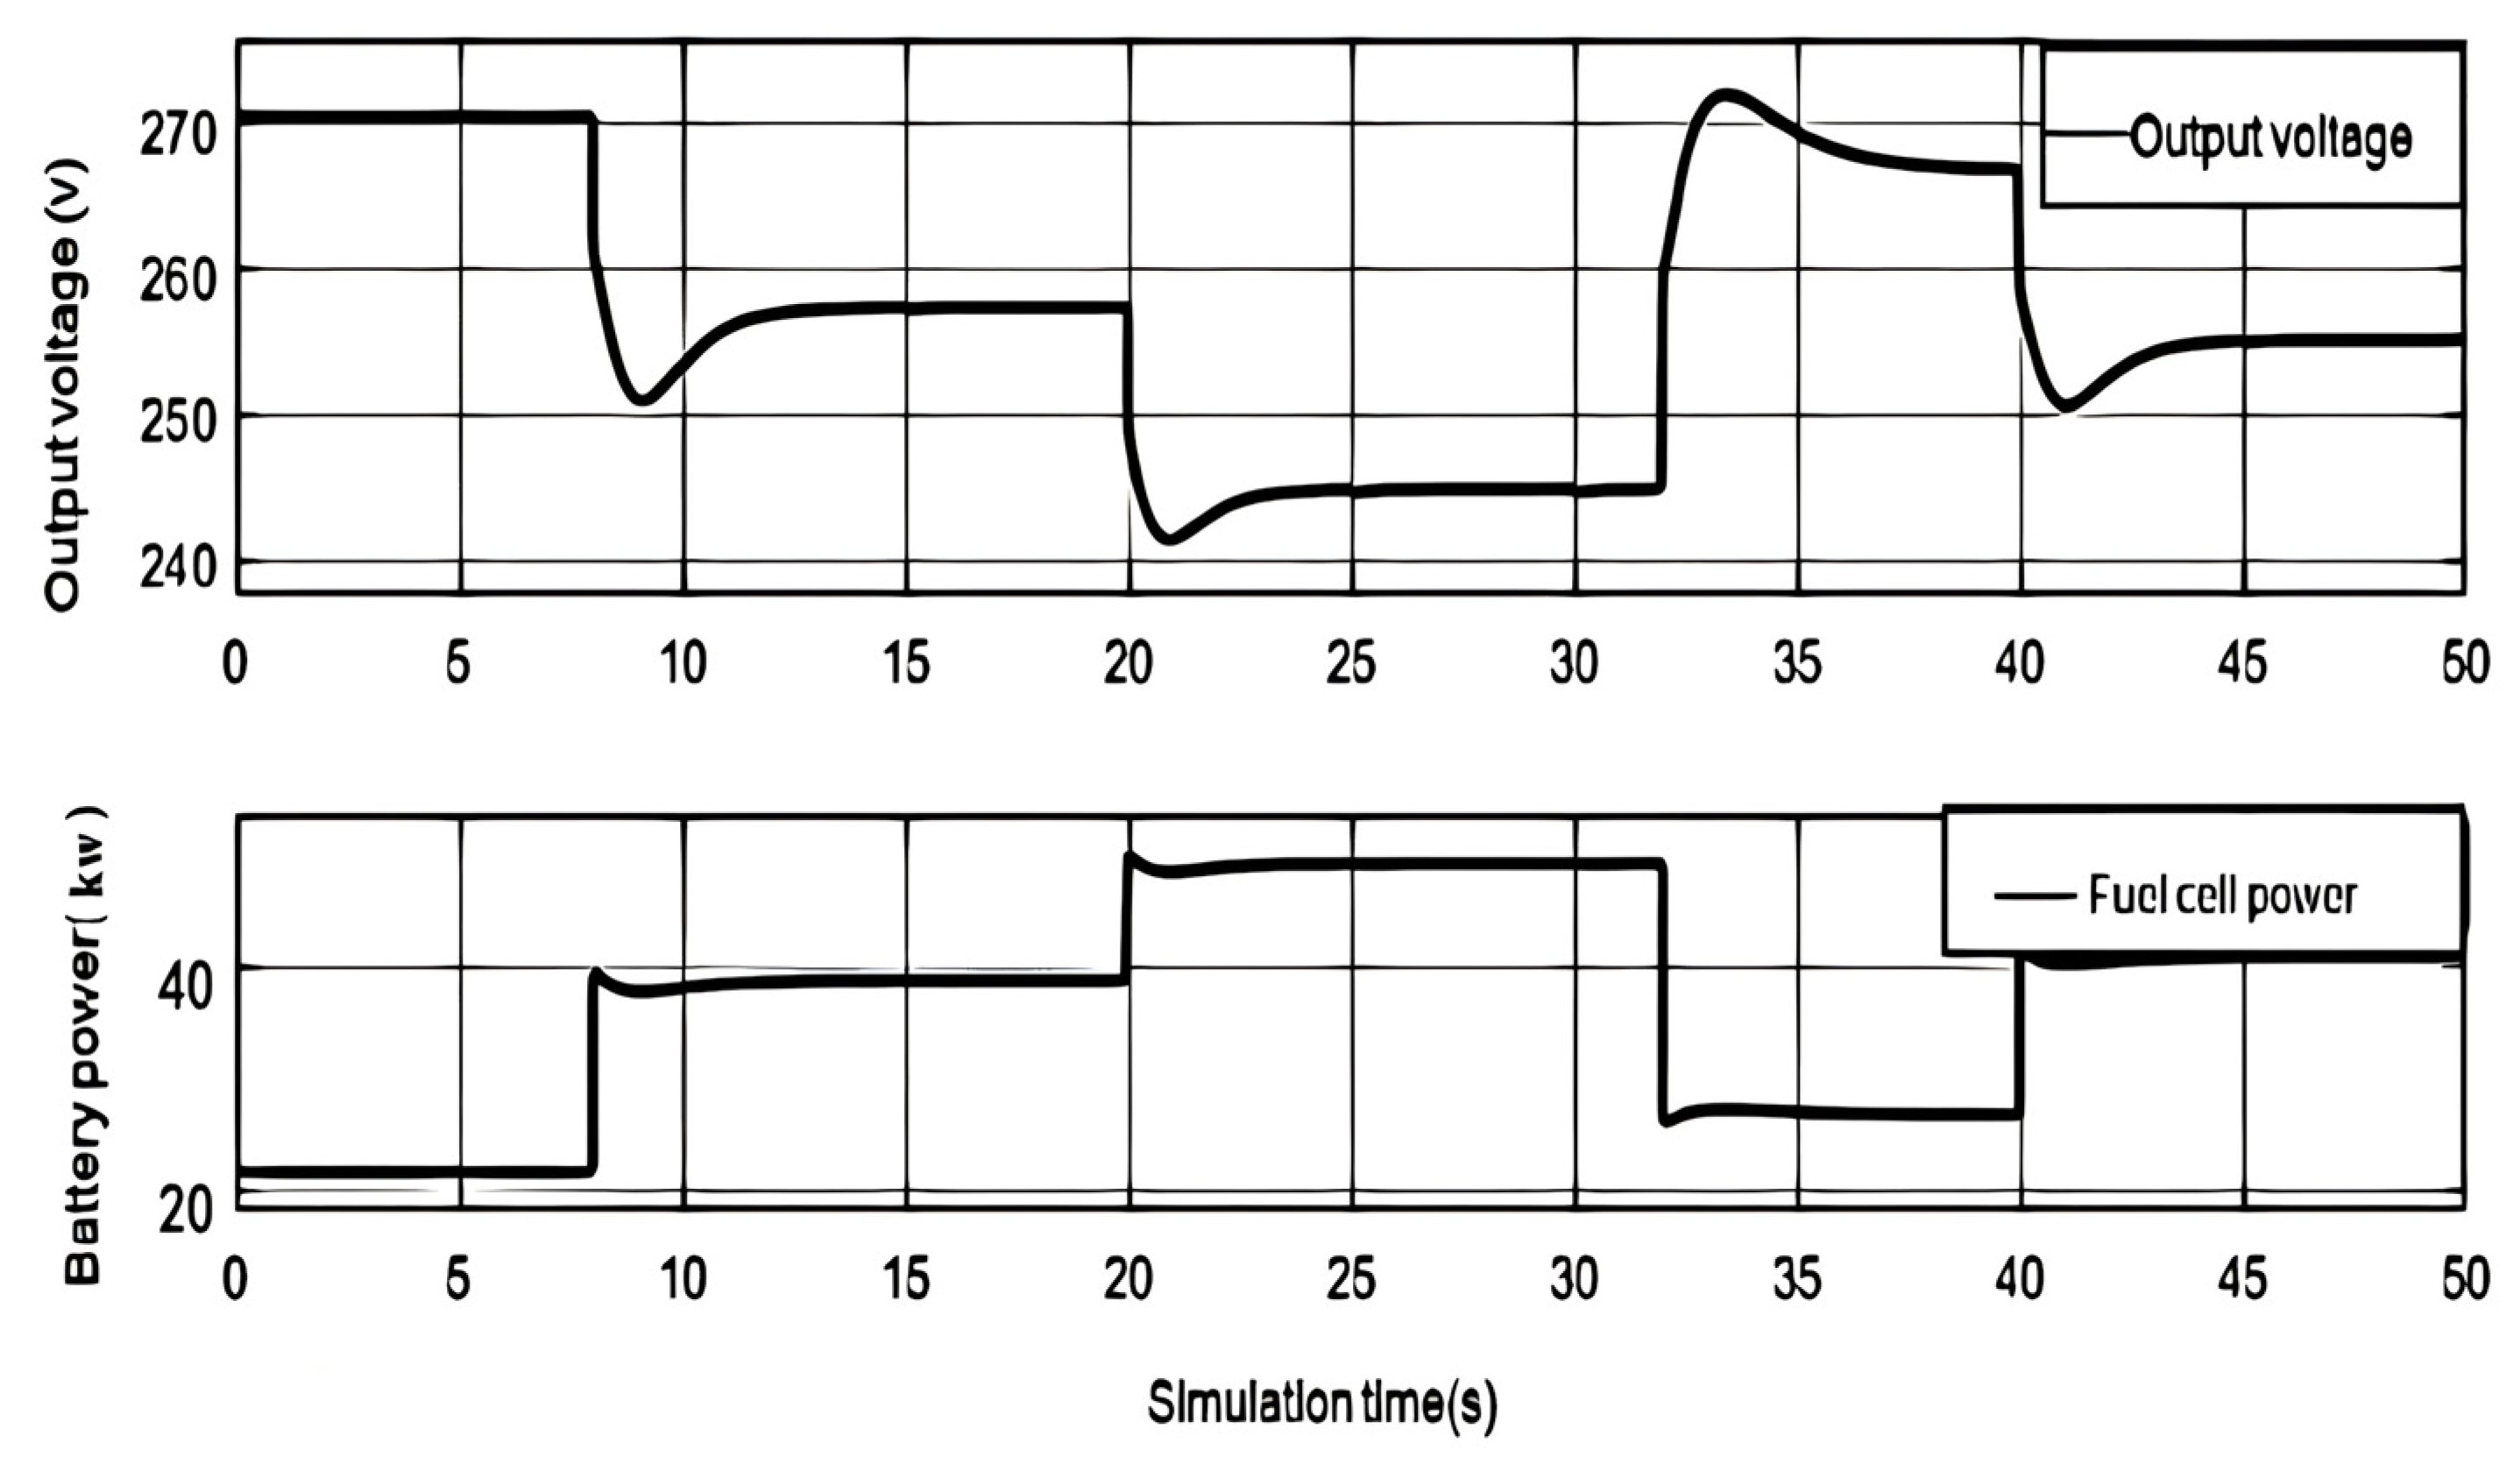
Figure 4.
Cathode and anode pressure with step change in load current.
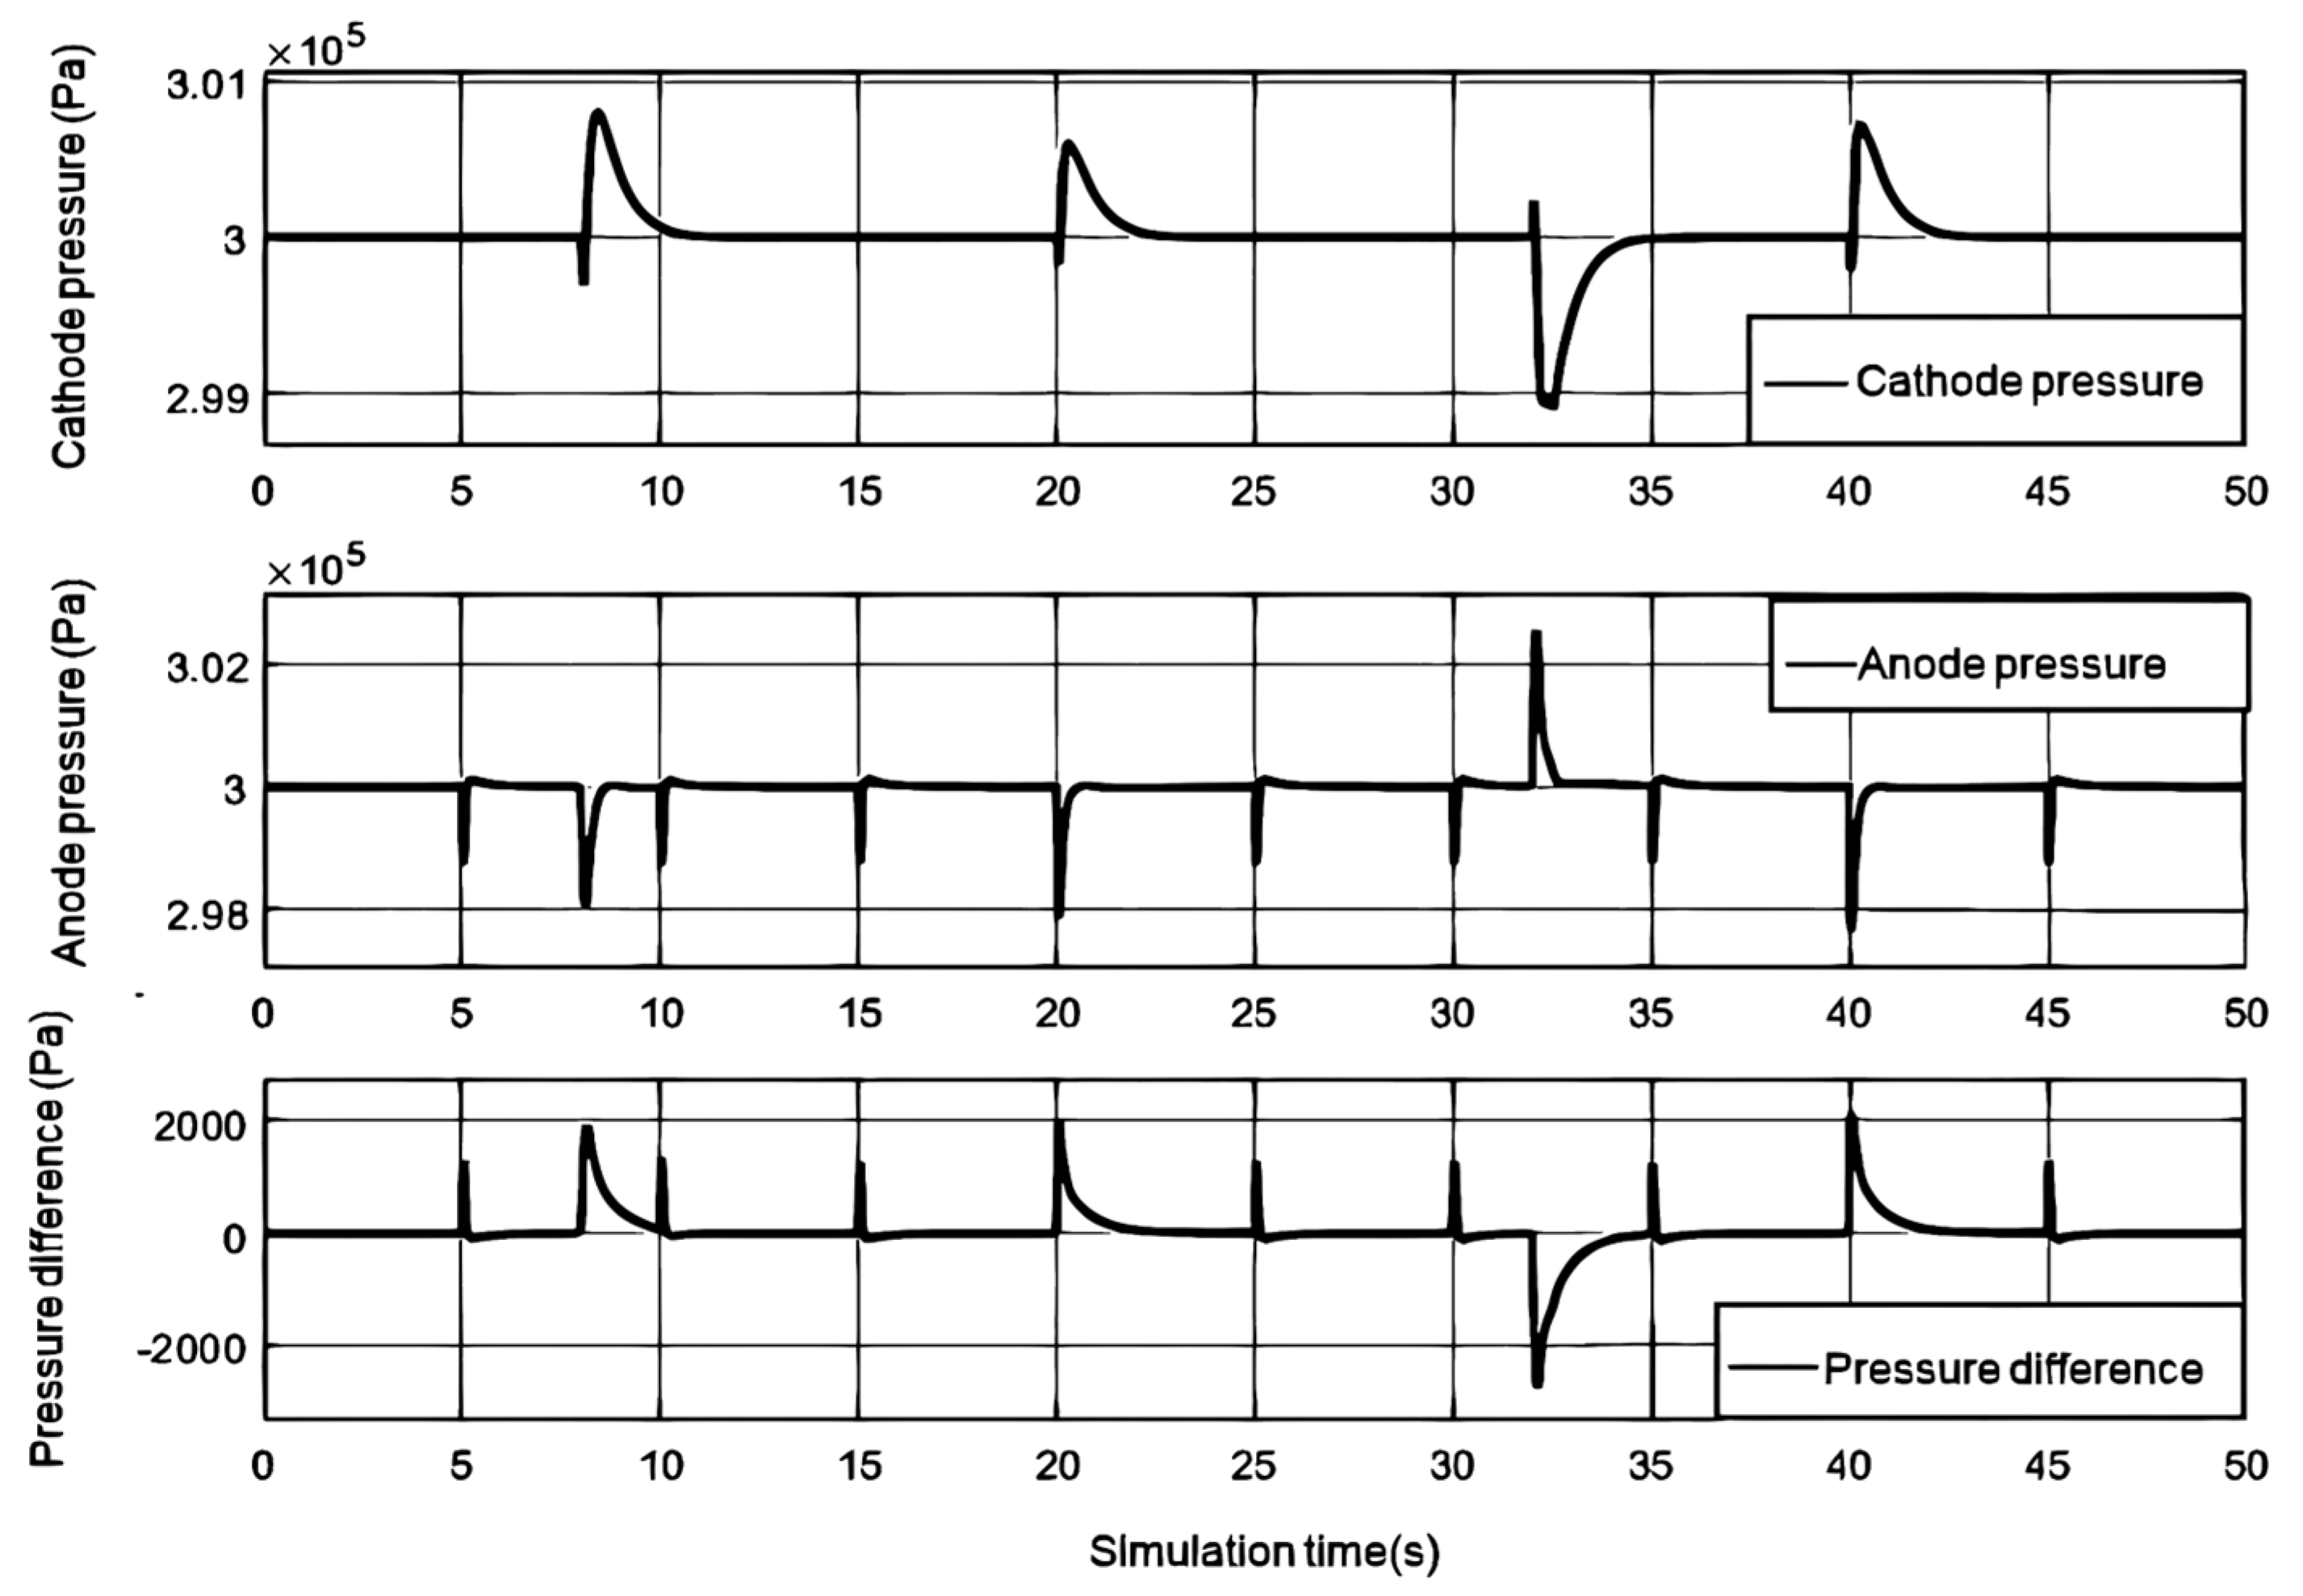
Figure 5.
The voltage and flow rate of the air compressor change step by step with the load current, as well as the opening area and flow rate of the back pressure valve change step by step with the load current.
Figure 5.
The voltage and flow rate of the air compressor change step by step with the load current, as well as the opening area and flow rate of the back pressure valve change step by step with the load current.
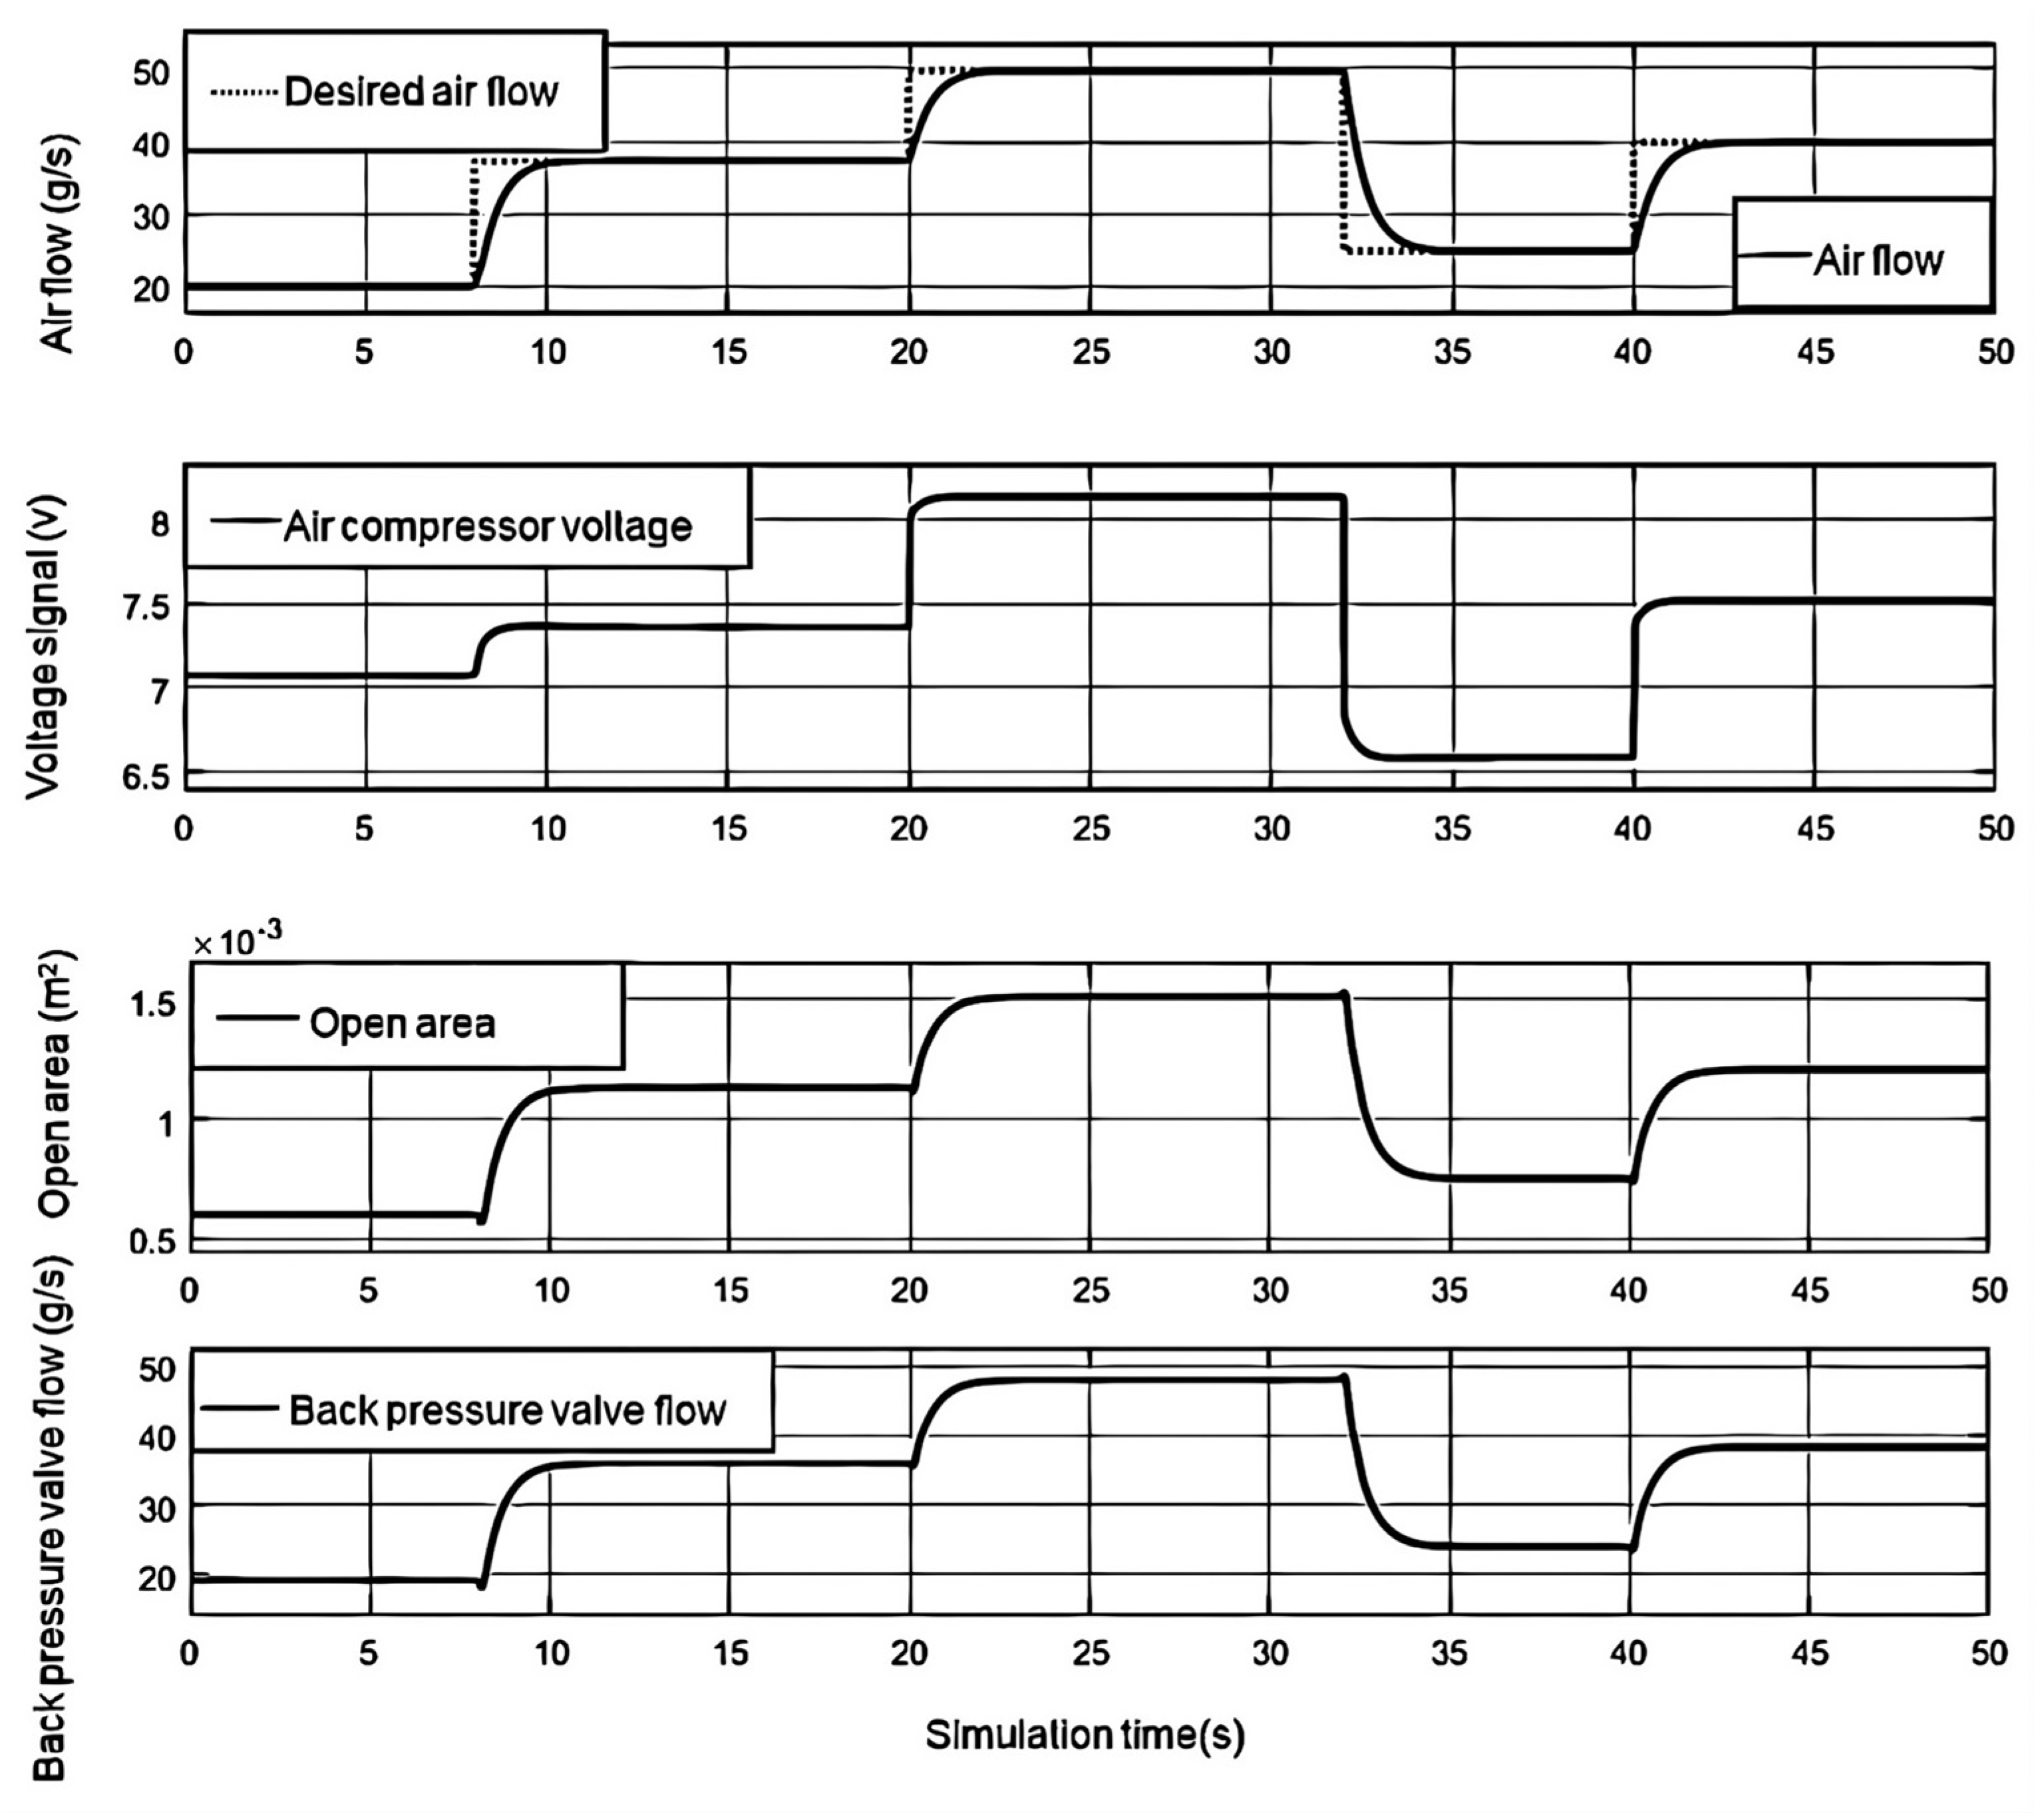
Figure 6.
Anode pressure reducing valve and bleed valve gas flow with step change of load current.
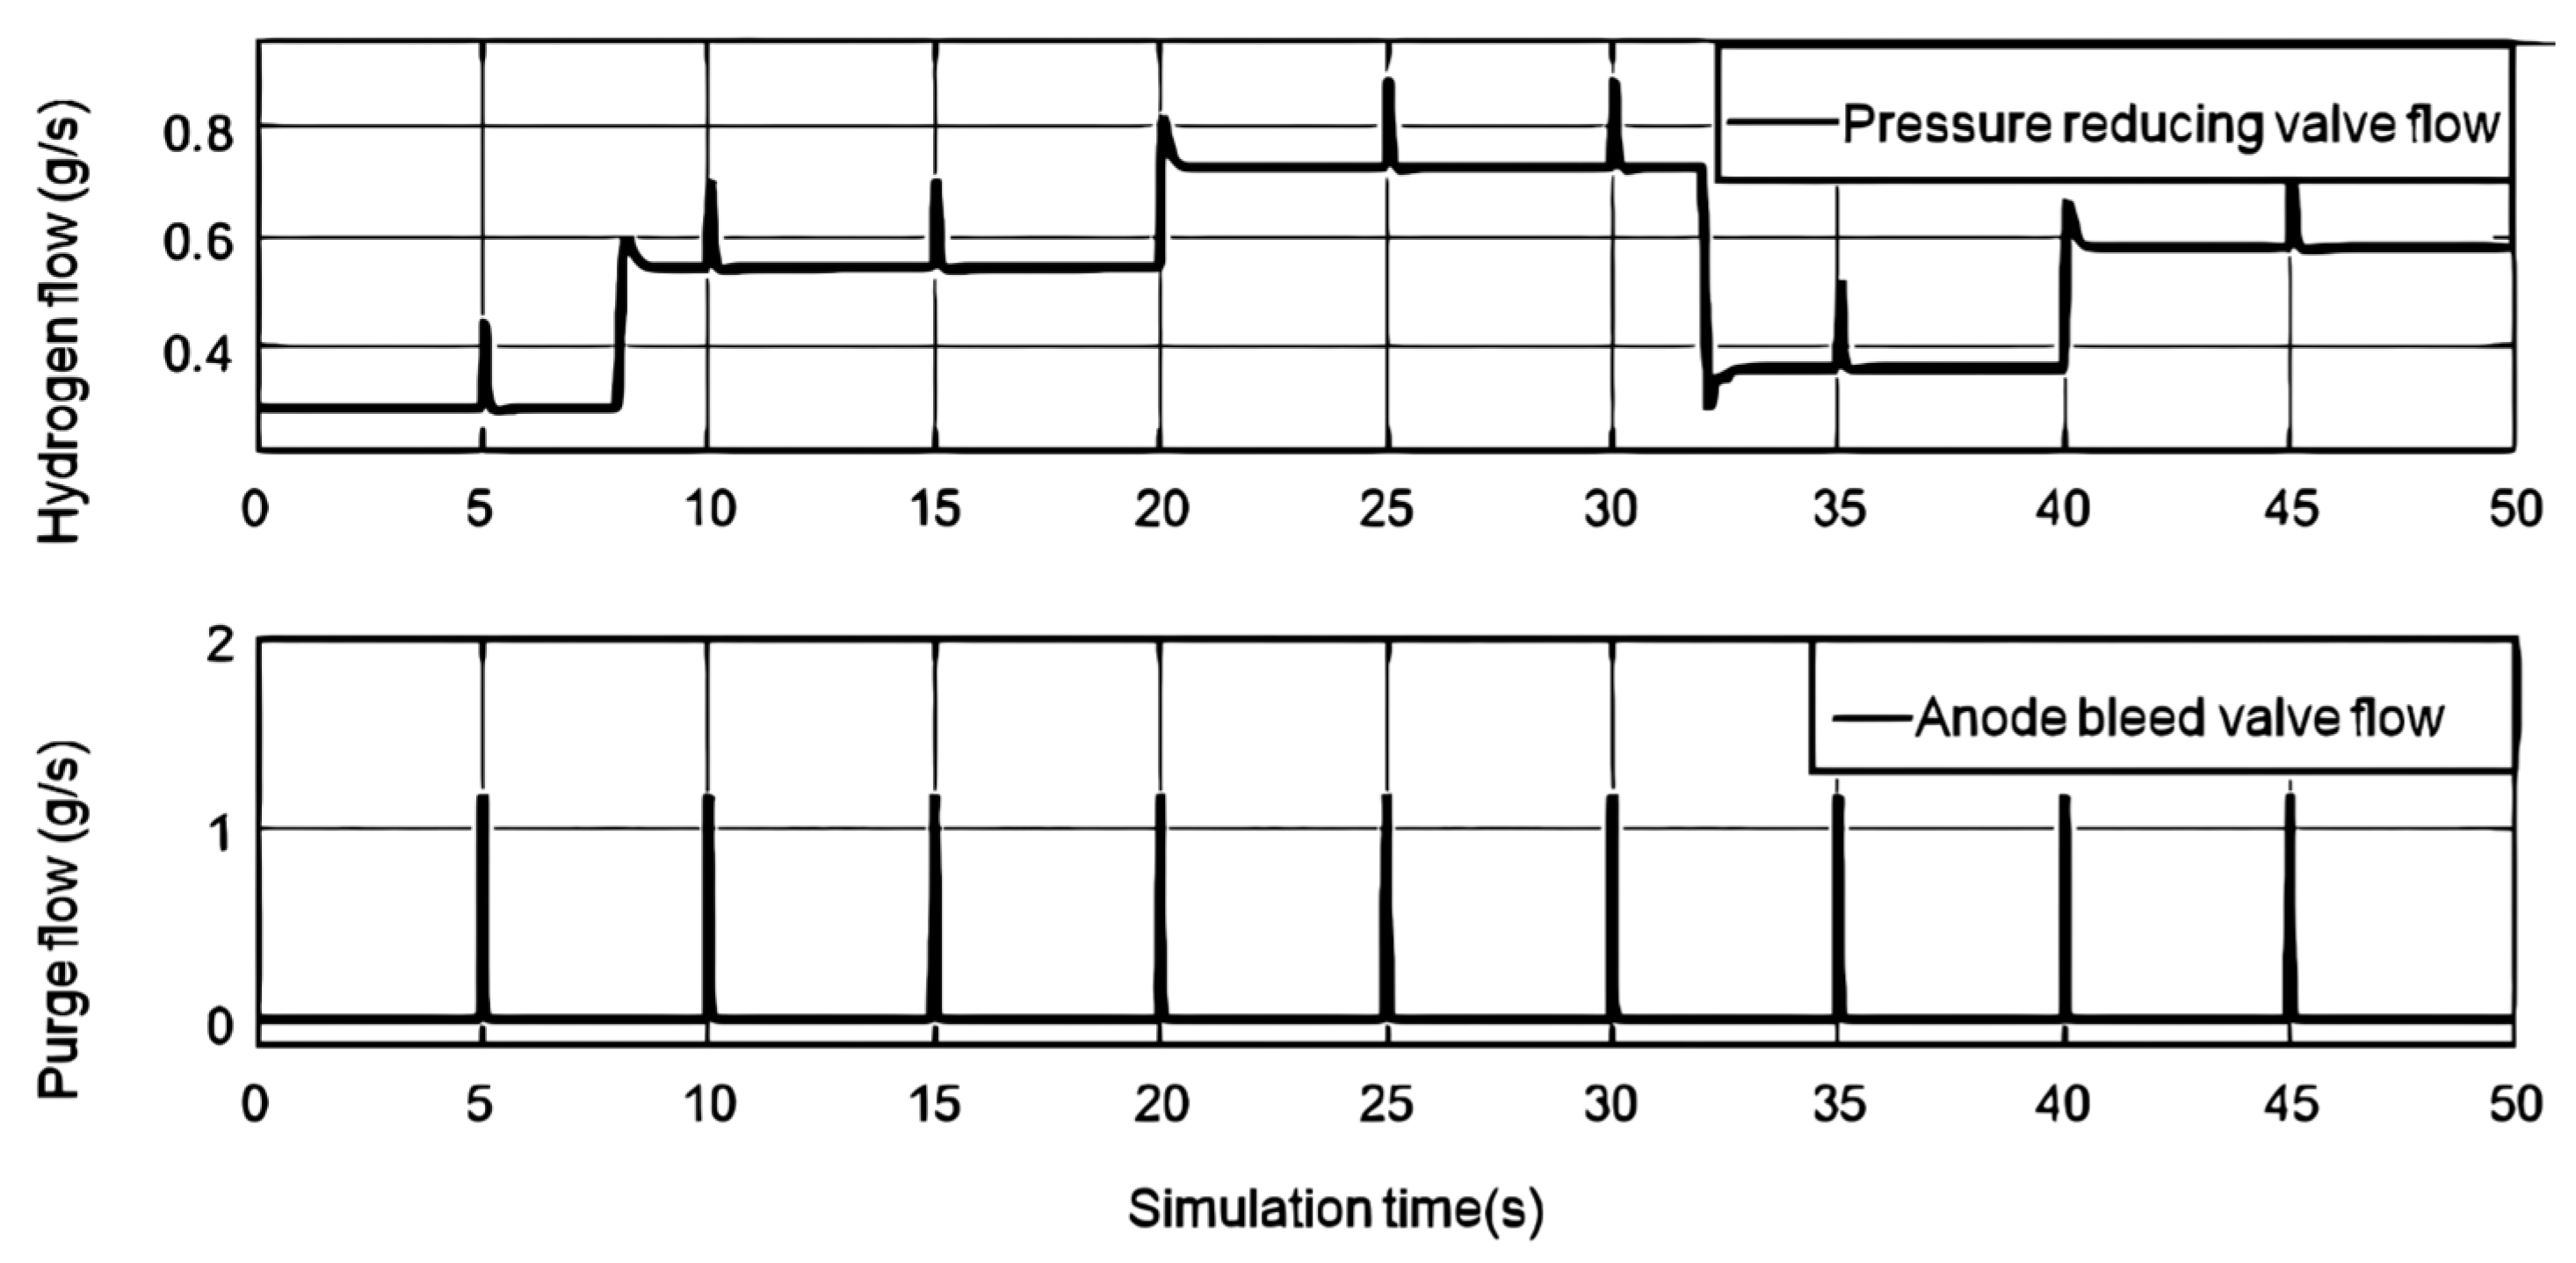
Figure 7.
Partial pressure of each gas in the cathode with step change of load current.
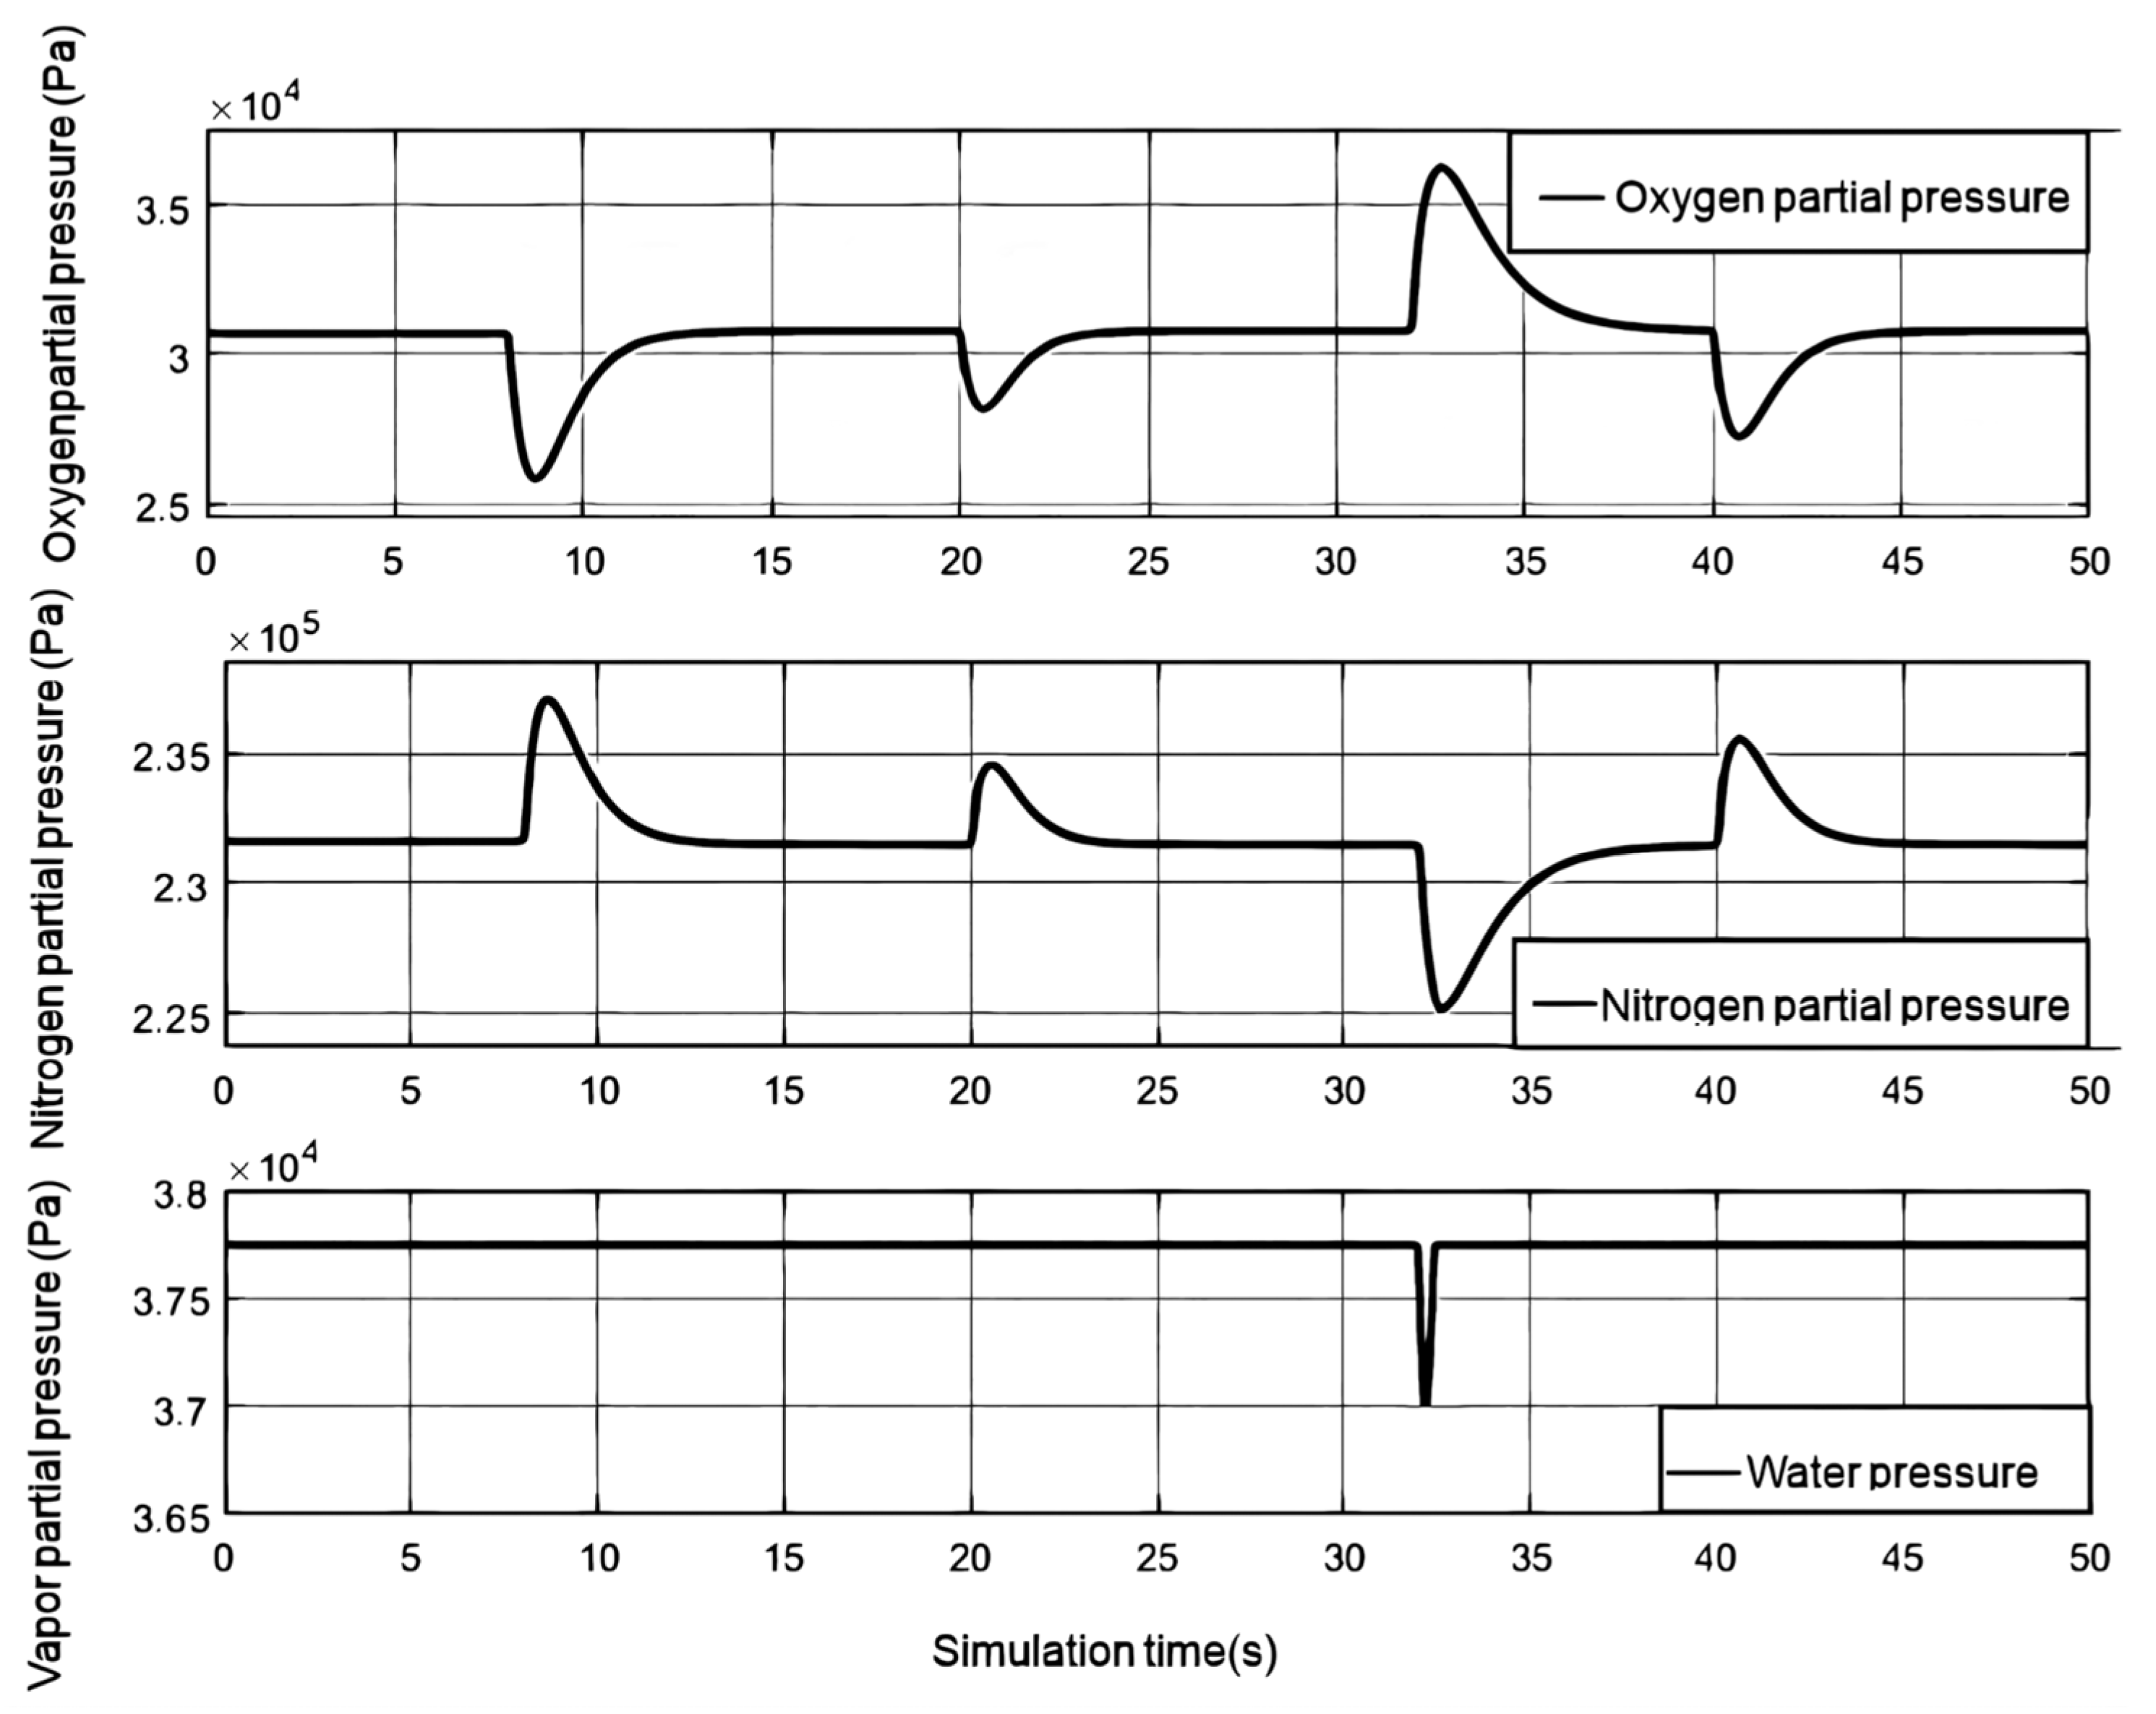
Figure 8.
Curve of membrane water content, anode partial pressure, and transmembrane water transfer flow rate with load current step change.
Figure 8.
Curve of membrane water content, anode partial pressure, and transmembrane water transfer flow rate with load current step change.
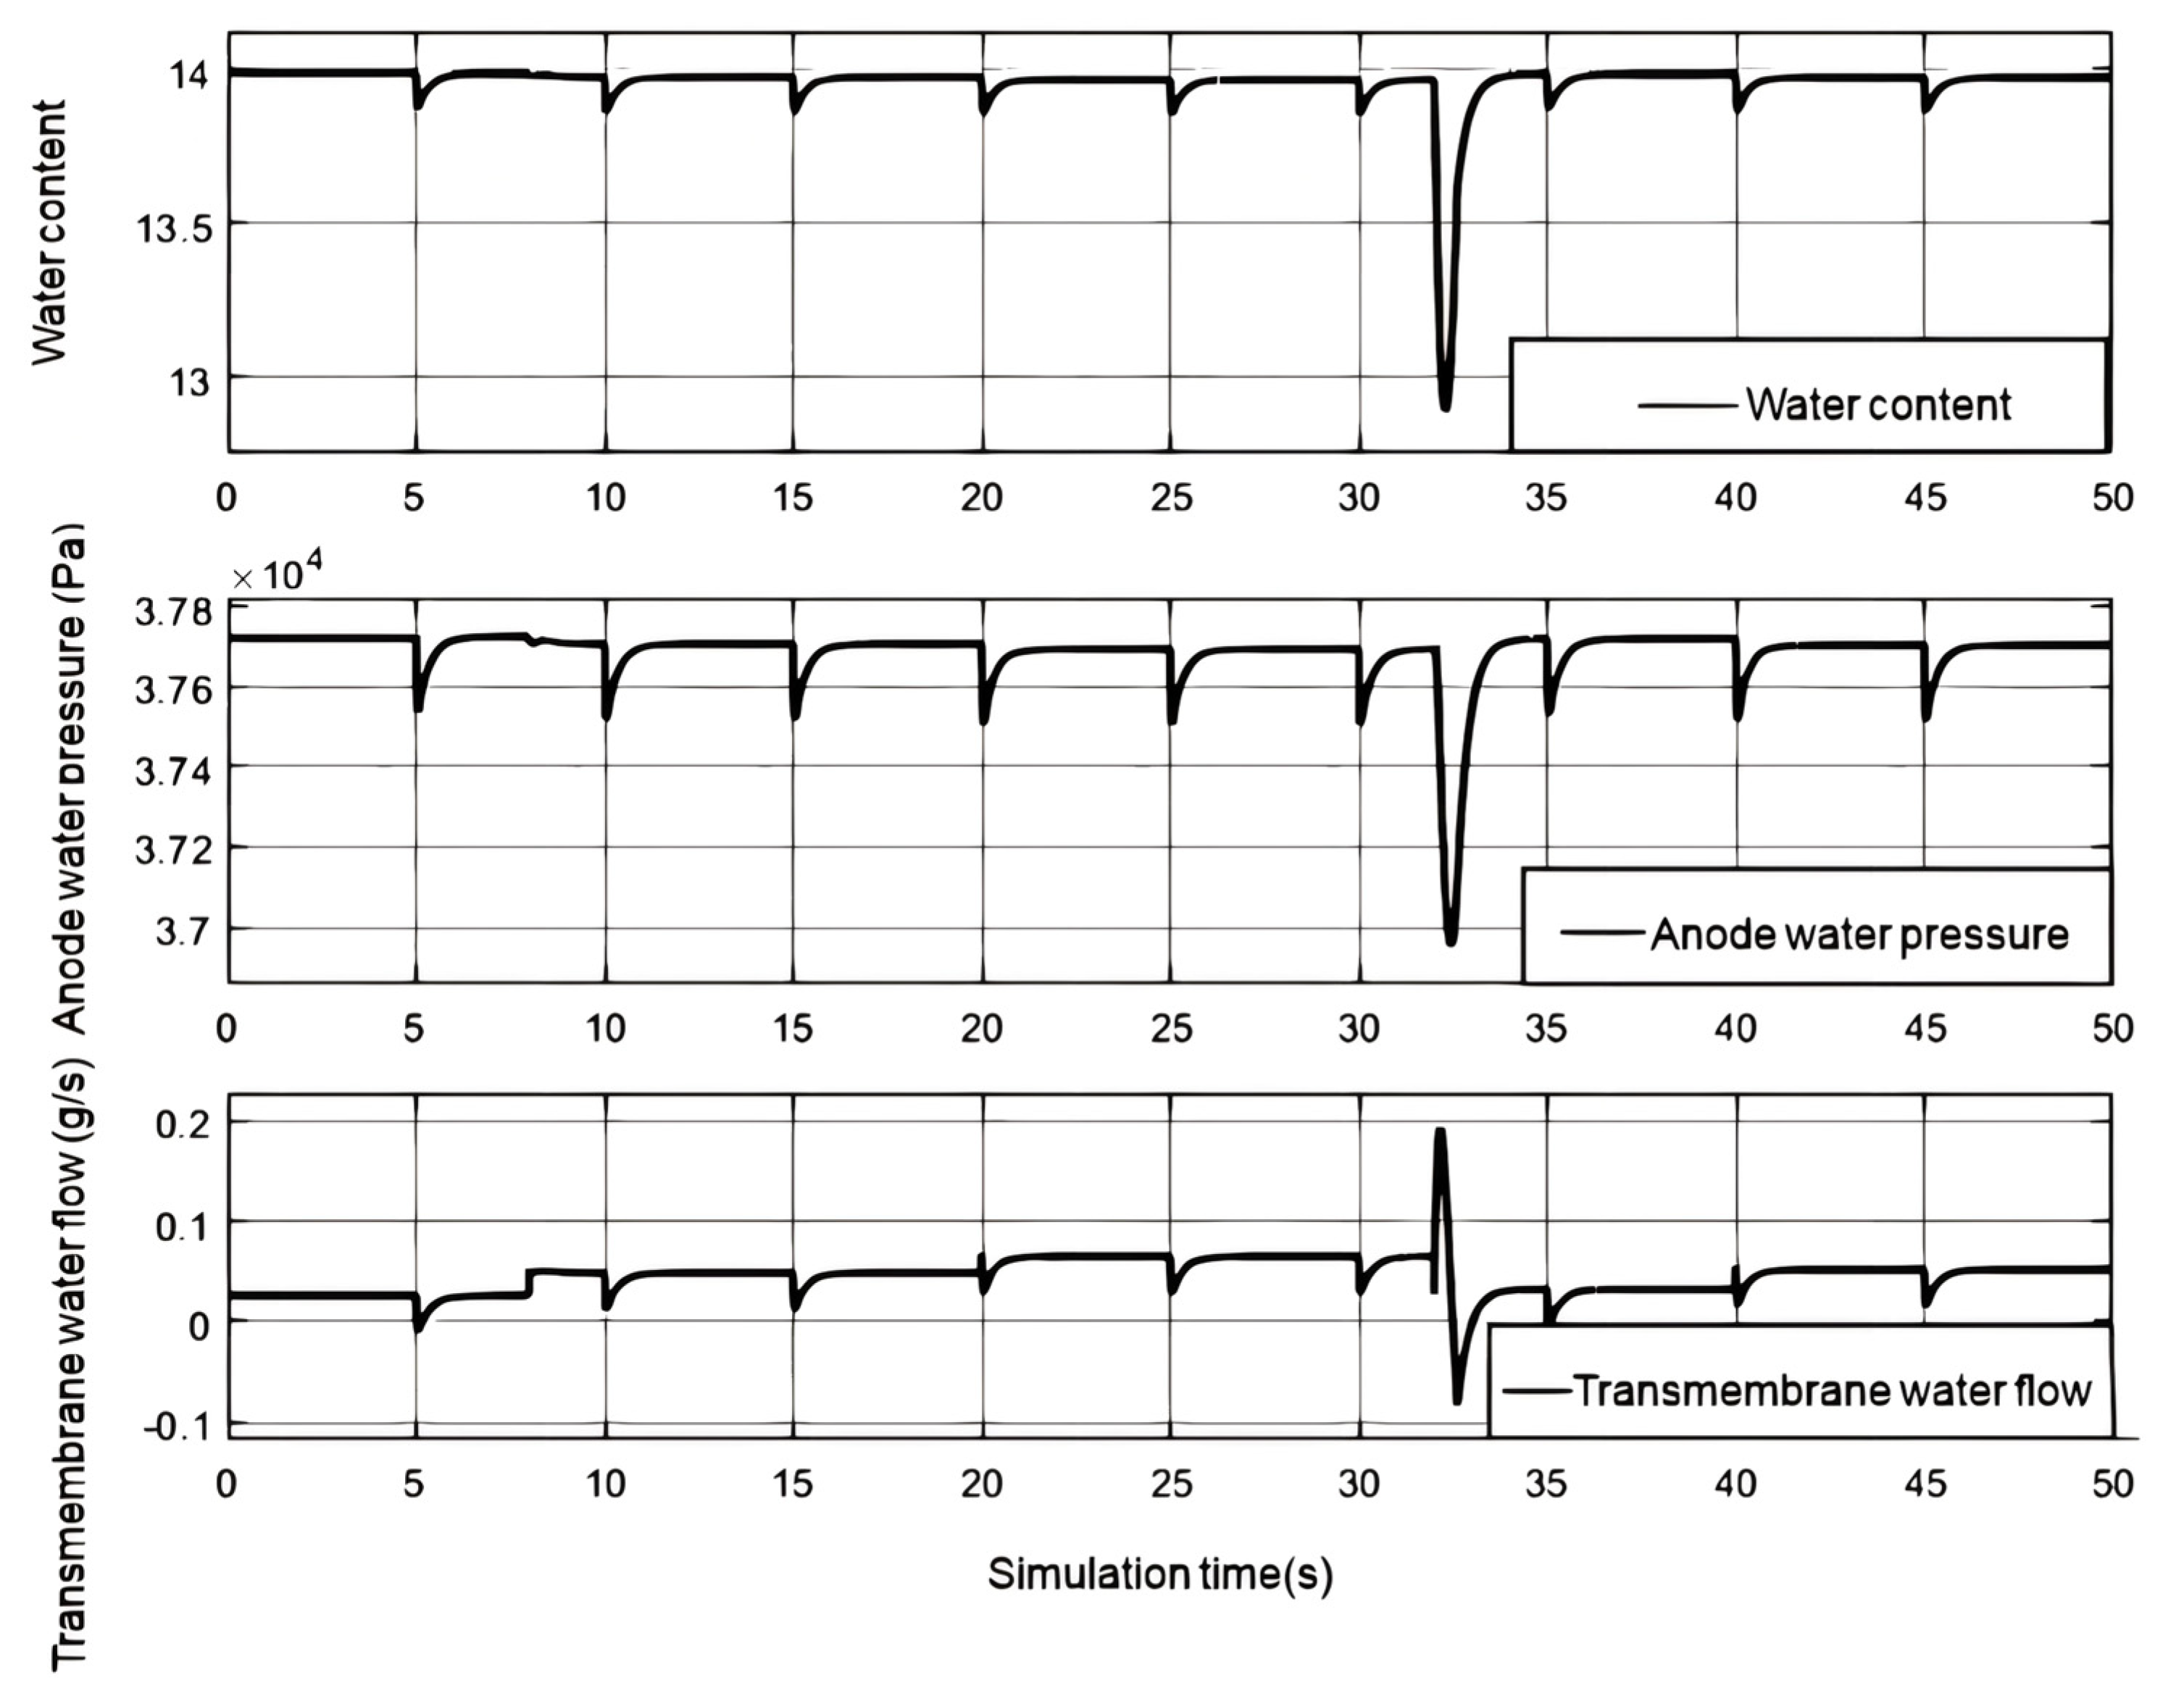
Figure 9.
Temperature change of reactor with load current step change and coolant inlet temperature and flow.
Figure 9.
Temperature change of reactor with load current step change and coolant inlet temperature and flow.
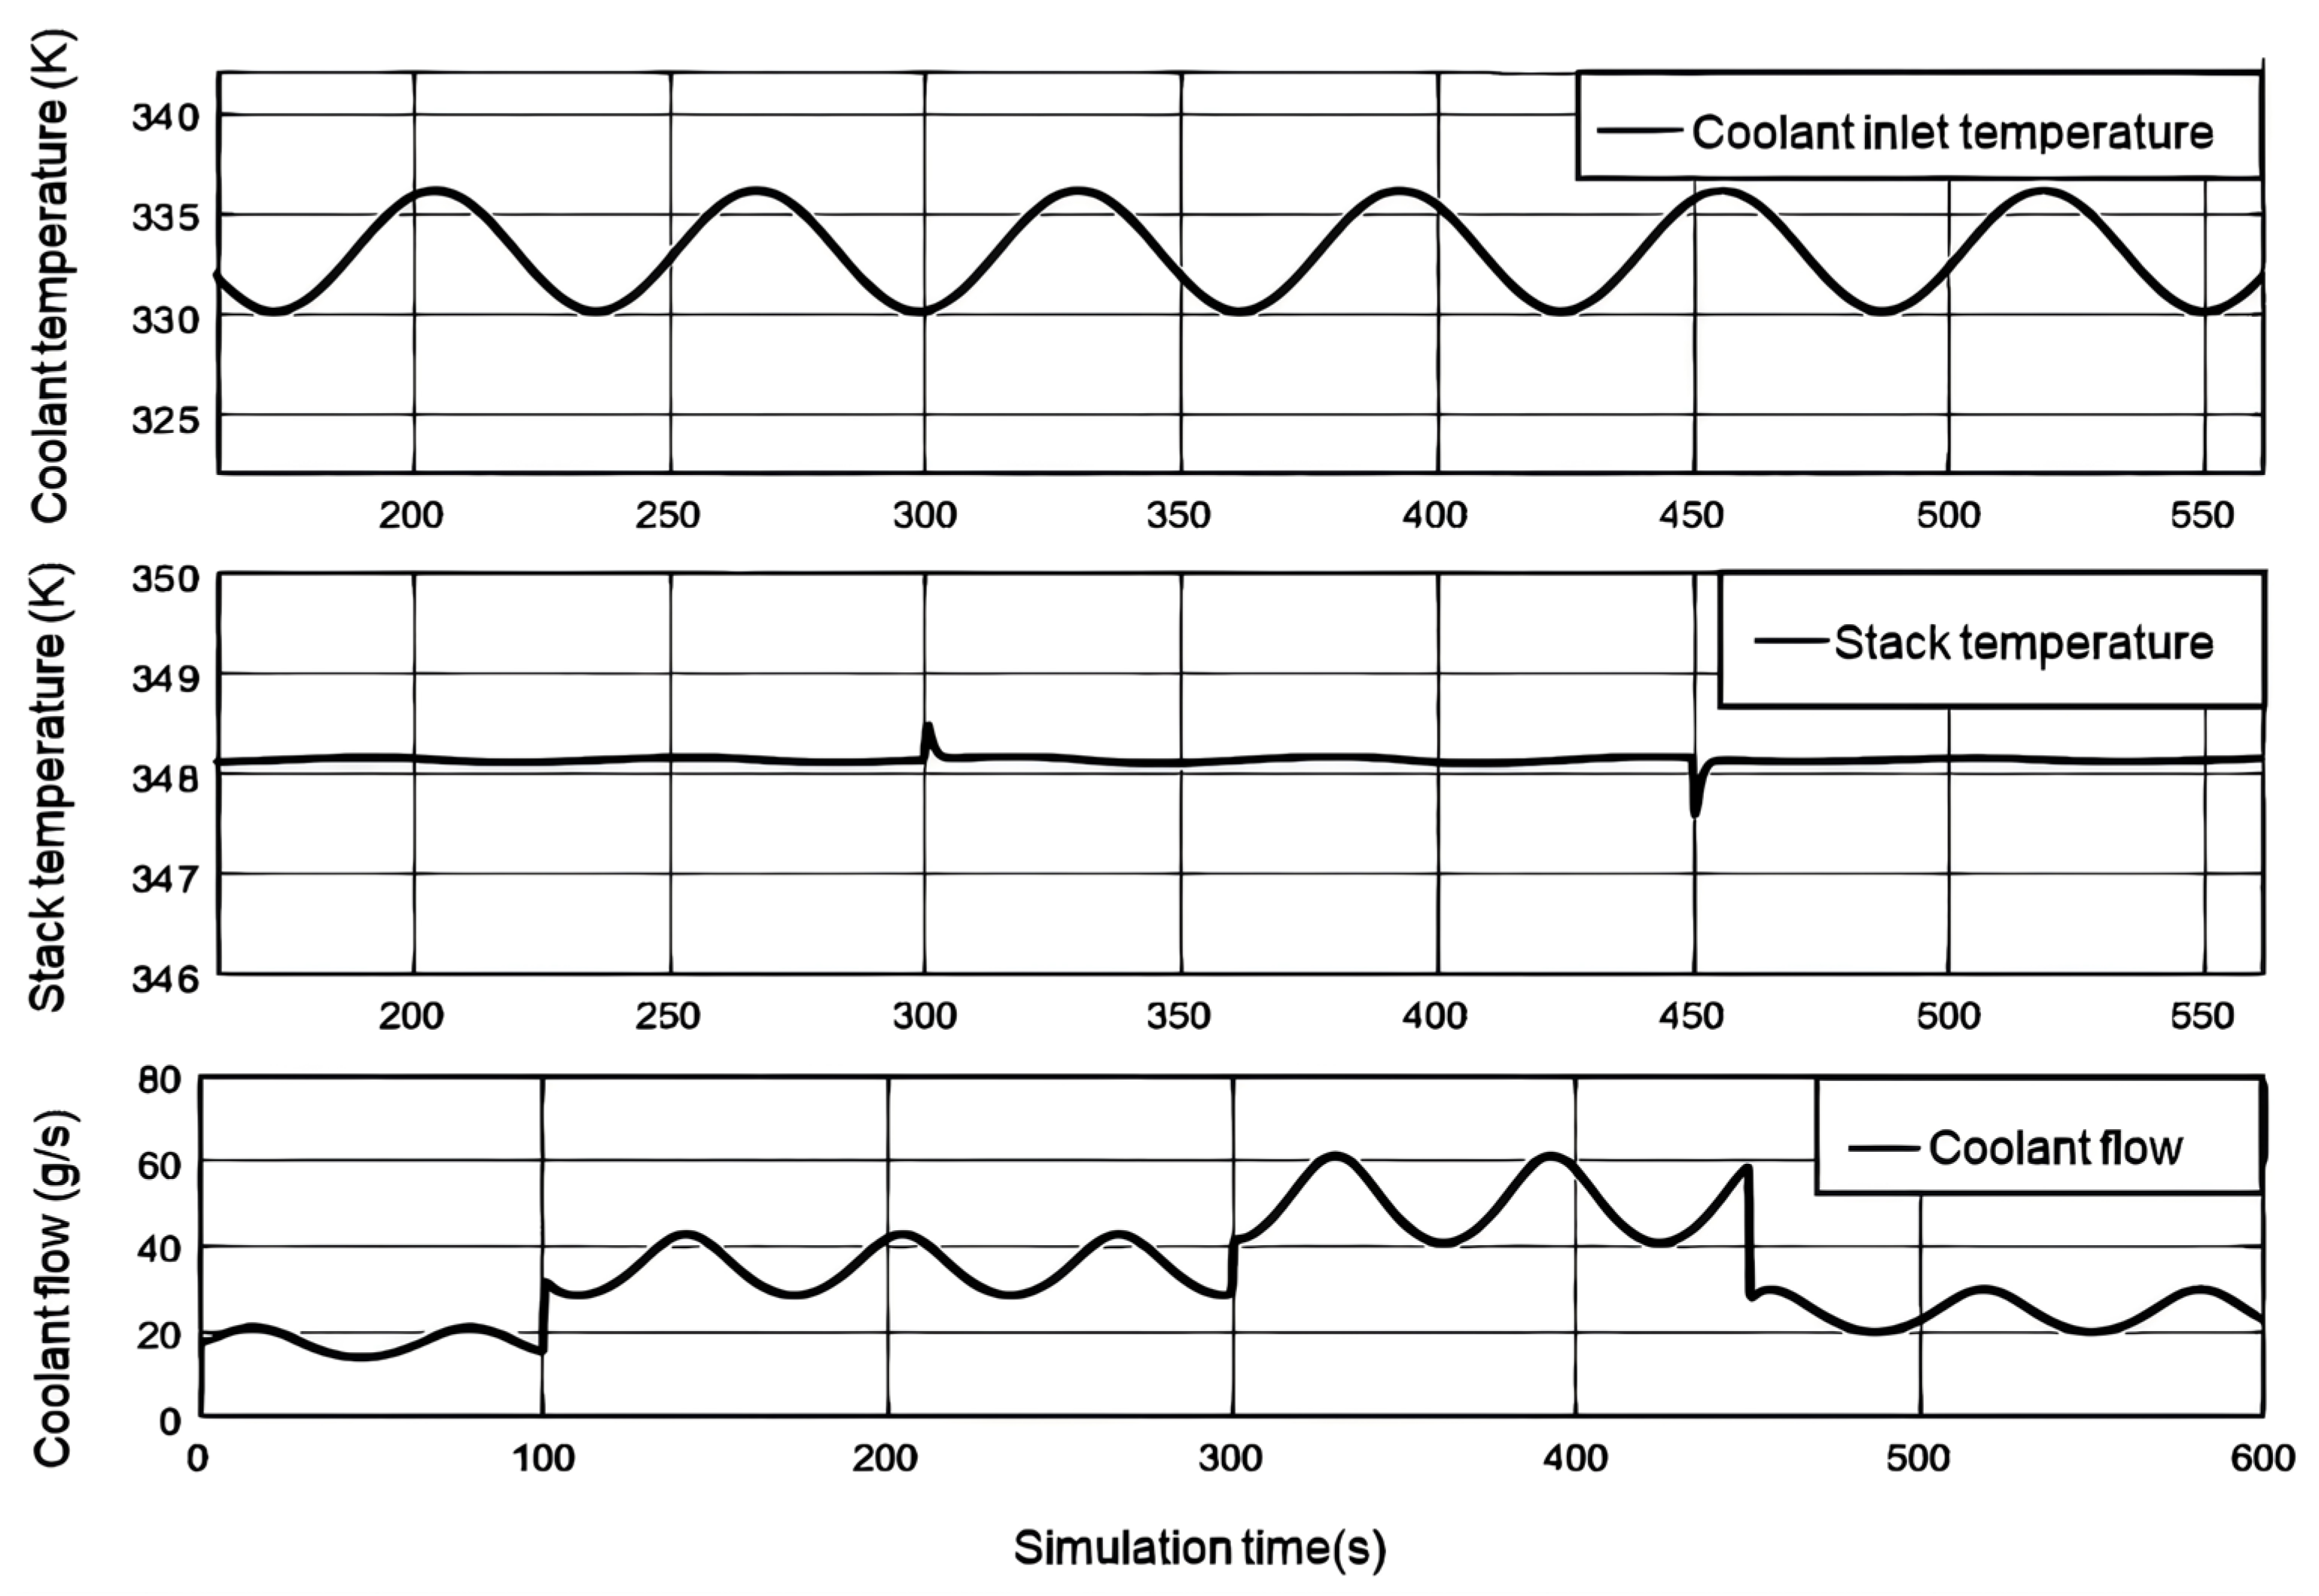

Table 1.
Simulation parameters of 60kW PEMFC system.
| Parameter | Description | Number | Unit |
|---|---|---|---|
| Stack temperature | 348.15 | K | |
| A | Single cell activation area | 220 | |
| F | Faraday constant | 96485 | C/mol |
| Atmospheric temperature | 298.15 | K | |
| Proton exchange membrane thickness | 125 | ||
| Empirical parameter | 10 | ||
| Empirical parameter | 2 | ||
| Dry film density | 0.002 | kg | |
| Molar mass of dry film | 1.1 | kg/mol | |
| Effective area of proton exchange membrane | 220 | ||
| Compressor motor constant | 0.62 | ||
| Motor constant of air compressor | 0.159 | ||
| Motor constant of air compressor | 30 | ||
| Motor constant of air compressor | |||
| Combined Inertia | 2 | ||
| R | Universal gas constant | 8.3145 | |
| Air compressor efficiency | 72.35 | % | |
| Tooth Ratio of Motor to Compressor Gear | 5 | ||
| Air specific heat capacity | 1004 | ||
| Specific heat ratio | 1.4 | ||
| Target temperature | 348.15 | K | |
| Cathode inlet flow coefficient | |||
| Cathode outlet flow coefficient | |||
| Back pressure valve flow coefficient | |||
| Cathode and Anode Humidifier Temperature | 303.15 | K | |
| Volume of anode | |||
| Volume of cathode intake manifold | |||
| Volume of cathode | |||
| Volume of cathode return manifold | |||
| Pump time constant | 2 | s | |
| Pump Gain | 30 | ||
| Single cell nominal voltage | 1.299 | V | |
| Time constant of electric pressure relief valve | 0.5 | s | |
| Gain of electric pressure relief valve | |||
| Back pressure valve time constant | 0.3 | s | |
| Back pressure valve gain | |||
| Pump time constant | 2 | s |
Disclaimer/Publisher’s Note: The statements, opinions and data contained in all publications are solely those of the individual author(s) and contributor(s) and not of MDPI and/or the editor(s). MDPI and/or the editor(s) disclaim responsibility for any injury to people or property resulting from any ideas, methods, instructions or products referred to in the content. |
© 2025 by the authors. Licensee MDPI, Basel, Switzerland. This article is an open access article distributed under the terms and conditions of the Creative Commons Attribution (CC BY) license (http://creativecommons.org/licenses/by/4.0/).
Copyright: This open access article is published under a Creative Commons CC BY 4.0 license, which permit the free download, distribution, and reuse, provided that the author and preprint are cited in any reuse.


