Submitted:
30 April 2025
Posted:
02 May 2025
You are already at the latest version
Abstract
Reports of individual differences in vividness of visual mental imagery (VVI) scores raise complex questions: Are VVIQ vividness differences “real”, what functions do these differences serve, and what is their neurological foundation? A new analysis examined visual short-term memory (VSTM) and volumes of the hippocampi, primary visual cortices and other cortical regions among vivid and non-vivid visual imagers. In a sample of 53 volunteers aged 54 to 80 with MRI scans, the performance of ten Low VVIQ scorers was compared to that of ten High VVIQ scorers. The groups included an aphantasic with a minimum VVIQ score and a hyperphantasic with a maximum VVIQ score. The study examined volumes for 12 hippocampus subfields, 11 fields implicated in visual mental imagery including area V1 and the fusiform gyrus, and 7 motor regions. In comparison to the Low VVIQ group, High VVIQ group yielded: (i) significantly more accurate VSTM performance; (ii) significantly larger volumes of the hippocampi and primary visual cortex. Across 47 brain subfields, the average volume for the High VVIQ group exceeded that of the Low VVIQ group by 11 percent. For 44 subfields, the volumes of the hphant exceeded those of the aphant by an average of 57 percent. Females had more accurate short-term memory than males and younger people were more accurate than older people. The larger visual memory capacity of females was unmatched by larger regional volume differences, which suggests the sex difference in visual memory is caused by factors other than cortical regional size. The study confirms the existence of robust empirical associations between VVI, short-term memory, regional volume of hippocampal subfields and area V1 in the left hemisphere.
Keywords:
VVIQ
; visual mental imagery
; short-term memory
; hippocampus
; cortex
; individual differences
; aphantasia
; hyperphantasia
1. Introduction
In this Special Issue we are interested in the role of visual and mental imagery in cognition, imagination and action, directed towards the present or anticipated states of the external world. Here our focus is individual differences. Beginning with the research by the pioneering German psychophysicist, Gustav Fechner (1860) [1], individual capacity differences in mental visual imagery vividness (VVI) have been actively investigated in psychology. As a low-capacity visual imager himself, Fechner reported: “I am not able to obtain clear, sharp outlines even on the most familiar memory images of the objects that are daily before my eyes… (Memory images)…generally give me a weaker impression than the black itself” (Fechner, 1860 [1]; English translation [2]). For the opposite extreme of VVI capacity, Fechner quoted Goethe who allegedly reported:
“I have the gift, when I close my eyes and, with my head bowed down, think of a flower in the center of my visual organ, it does not remain for a moment in its first form, but it spreads out and from within it unfolds again new flowers of colored, even green, leaves; they are not natural flowers, but fantastic, but regular, like the rosettes of the sculptors. It is impossible to foresee the sprouting creation, but it lasts as long as I like, does not tire and does not intensify. I can produce the same if I think of the ornament of a colorfully painted disk, which then also changes continuously from the center to the periphery, completely like the kaleidoscopes.” [1] (Fechner, 1860).
Inspired by this wonderful description, this paper investigates the voluntary form of visual mental imagery (VMI) that occurs in the majority of healthy people throughout their waking life. Here we consider waking, voluntary VMI, not the mental imagery that occurs in our dreams as we sleep. The wide-ranging and well-documented variations in waking VVI capacity raise fundamental questions about mind-brain connections. The differences may be dramatic, but are they “real”, what functions do they serve, and what is their neurological foundation? With some exceptions, a large body of research is consistent with the tenet that imagery is functionally equivalent to, but not identical to, perception with similar anatomical patterning of neural activity in the cerebral cortex and subcortical regions. As in perception, the readiness for action with feeling and volition are key components of mental imagery experience [3]. The vividness of an image is a combination of clarity, colourfulness and liveliness, where clarity is defined by brightness and sharpness, colourfulness by image saturation, and liveliness by vivacity, animation, feeling, solidity, projection and metamorphosis [4,5]. While not all elements are available on call at any moment, they provide a menu of the potential described so eloquently by Goethe. Mental imagery in any modality conveys intentionality – mental images are laden with vigour and feelings such as attraction, calm, tranquility, disgust, fear, anger, anticipation. Not forgetting the vivid imagery of the sleep-state that occurs in dreams, a study within this special issue suggests that dreams contain a vividness of emotional and visual imagery that are at significantly higher levels than for voluntary mental imagery (Bilzer and Monzel, 2025) [6]. In contrast, Bilzer and Monzel found that vividness of auditory, olfactory, gustatory, and tactile imagery tends to be higher in waking mental imagery than in dreams. In everyday life, the enactive and affective attributes of mental imagery move readers of literary works to experience fictional events and characters as if they are “real”. Thus, VVI is closely associated with aesthetic appreciation of poetry, haiku or sonnets and enhances one’s appreciation of music [7]. Recent theorizing on mental imagery in a General Theory of Behaviour emphasizes its role as a catalyst of motivation [8]. The following questions are the focus of this paper:
- (i)
- Are the VVI differences in self-reports “real”, i.e., do they enable rich, precise, falsifiable predictions?
- (ii)
- Do the phenomenological features of VVI correspond to measurable functional advantages in memory or thinking?
- (iii)
- Does VVI have any corresponding structural, neurological foundation?
I present an investigation of the role of VVI in visual short-term memory (VSTM) performance and the foundation of VVI in brain systems including the subfields of the hippocampi and other brain regions that differ in volume between vivid and non-vivid visual mental imagers. Brain areas thought to participate in episodic memory and VMI are compared to motor regions that, ordinarily, are not implicated in these functions. This study continues a research programme begun a half-century ago when I found that high VVIQ scorers have superior picture recall compared to low VVIQ scorers [2,9]. In the same tests, females showed superior picture recall to males. The superior memory of vivid visual imagers has been independently replicated using a variety of VVI indicators [10,11,12,13,14,15,16,17,18]. Rodway, Gillies and Schepman (2006) [19] found high vividness participants more accurate in detecting salient changes to pictures compared to low vividness participants. An aphantasic reportedly performed significantly worse than controls on visual working memory trials requiring the highest degree of precision [20].
Some researchers who did not find a positive relationship between VMI and memory suggested the VVIQ-performance association is an artefact, a false alarm, caused by vivid imagers making false attributions about their ability [21,22,23]. Yet, this explanation cannot possibly apply to hundreds of experiments using the VVIQ that have revealed robust, replicable differences between high and low VVIQ scorers across different ages, sexes and cultures. A recent paper reviews age and sex differences in VVIQ scores among Chinese people [24] and another reviews fMRI studies with the VVIQ [3]. The Greek label “aphantasic” offered by Zeman [25] for people with low capacity for visual imagery vividness and “hyperphantasic” [26] for high VMI capacity have given the field renewed impetus. However, the labeling of a normal individual difference as a special condition and the imprecise definition have created a mild degree of stigma and confusion [27]. A systematic review in this special issue emphasizes the need to “refine the definition and diagnosis of aphantasia” [28].
Wide differences in voluntary imagery capacity are a normal and healthy feature of mental life. The causes of vividness and other mental imagery differences are a topic of active investigation. It has been previously suggested that the normal distribution of VMI vividness may involve a subclinical form of “disconnection” [29,30,31]. This view received support from the author’s electroencephalographic (EEG) studies that indicated a left hemisphere focus for VMI in subjects having vivid visual imagery with higher brain activation in the left parieto-occipital cortex, which was found to be lacking in matched, non-vivid imagers [32,33,34]. These findings were consistent with reports of patients with brain lesions in a subfield of the posterior left hemisphere who appeared to lack the capacity of VMI generation [31]. [31,35] describe a 64-year-old male with acquired aphantasia (RM) following a left posterior cerebral artery infarction and possible anoxic episode.
Activation of the primary visual cortex predicts imagery vividness in healthy individuals [36,37,38,39,40]. Counter to this finding, early visual cortex was found to be unnecessary for VMI in one clinical study which suggested the left fusiform gyrus is crucial to VMI [41]. This difference of opinion appears unresolved, although Dikstra [42], in this special issue, suggests a solution. An fMRI study by Bergmann, Genç, Kohler, et al. (2015) [43] found a negative relationship between primary visual cortex (V1) surface area and sensory imagery strength, but positive relationships between V1 and imagery precision (spatial location and orientation). Fulford, Milton, Salas, et al. (2018) [44] found VMI activation in several cortical regions showing a positive correlation with imagery vividness: fusiform gyrus, posterior cingulate, and parahippocampal gyri, anterior cingulate cortex and inferior frontal gyrus, the insula, auditory cortex, while early visual cortices show negative correlations. Duan, Li, Yang, et al. (2025) [45] found the left precuneus becomes activated in both static and dynamic imagery tasks. Left precuneus activation was positively correlated with VVIQ score while greater activation occurred in the right precuneus during dynamic than static imagery. Right precuneus activation also significantly correlated with individual VVIQ scores.
Connectivity in networks between areas acting as nodes is clearly crucial. Area V1 connects directly with the visual areas V2, V4, and inferior temporal (IT) region that connect with the perirhinal and parahippocampal cortex and directly onwards via the perforant path to the posterior and anterior hippocampus. Tullo et al. (2022) [46] found the occipito-medial region has an inhibitory influence on temporal regions, and an excitatory influence of more anterior on more medial and posterior brain regions. VMI vividness was found to be associated with the connection strength from an occipital area to a parahipoccampal area, especially in the left hemisphere. Kvanne et al. (2024) [47] also report increased efficiency and clustering in left inferior temporal regions in individuals with more vivid visual imagery. Thus, area V1, the left IT region and the anterior and posterior hippocampus all appear crucial to VMI vividness. For a review of the role of the hippocampus in VMI, see Blomkvist [48].
The superior visual memory of females, noted in 1894 by Ellis [49], has been replicated in several contexts, e.g., faces [50], locations [51,52,53,54,55,56], person-related details and own-gender bias [57] and verbal episodic memory [58,59], while other tasks involving visuospatial memory favour males [60]. Relative to brain size, findings are mixed, but in some studies women were reported as having larger hippocampal volumes [61], caudate nucleus [62,63], anterior cingulate gyrus [64], dorsolateral prefrontal cortex [65] and planum temporale [66]. However, the volumes of the amygdala [67] and paracingulate gyrus [68,69] were reported to be larger in men. Persson, Spreng, Turner, et al. (2014) [70] suggest that the sex difference observed on the structural level does not directly relate to sex differences in cognition, which likely depend less on how the brain is structured but on how this structure works on a functional level. They point to different functions and connectivity for the posterior and anterior hippocampus. Dalton, Zeidman, McCormick and Maguire (2018) [71] found that different parts of the hippocampus, together with distinct cortical regions, are recruited for scene construction or non-scene-evoking associative processing. Their study suggests separable processing streams within the hippocampus for different kinds of task. Connections between different parts of the hippocampus and the visual-perceptual cortex appear particularly significant to the generation of VVI. Superior memory at different ages is strongly related to hippocampal structure and function. Common observation and clinical testing indicates that aging generally brings memory into decline but, again, wide individual differences occur. For example, 80-plus “SuperAgers” have an episodic memory capability similar to that of 50- to 65-year-olds and they also manifest a significantly thicker cerebral cortex than age-matched peers [72].
As noted, aphantasia refers to reduced or complete absence of voluntary VVI, while hyperphantasia refers to extremely high VVI [25,26]. As a consequence of the ambiguity of the definition of aphantasia, subjects may be selected by different investigators in different ways with total VVIQ scores anywhere within the range from 16 points (complete absence of visual imagery) to 32 points (“vague and dim” visual imagery, incomplete absence) e.g., [70,73]. This unfortunate lack of precise VVIQ cut-off points for aphantasia has led to inconsistent findings. Because brain activity in different regions is correlated with VVI, it remains possible to test predictions about VVI in individuals who experience either absolute or reduced VVI. In an fMRI study, Monzel et al. (2024) [74] investigated whether the connectivity of the hippocampus in aphantasia differs from that of control subjects. They investigated autobiographical memory (AM) of 14 congenital aphantasics and 16 controls to see how the hippocampus and visual-perceptual cortices interact during AM re-experiencing. Their findings suggested that aphantasics show almost no functional connectivity between the hippocampus and the visual-perceptual areas. In comparison to controls, during AM retrieval, aphants displayed decreased hippocampal activation and increased visual-perceptual cortical activation.
Blomkvist (2023) [75] proposes a top-down hierarchy for episodic simulation in which the hippocampus initiates retrieval processes in the V1 area of visual cortex to retrieve visual-perceptual details associated with specific AMs. When an aphant is unable to voluntarily generate mental imagery, a top-down command fails to trigger the relevant retrieval process so that no elements can be retrieved, and there is nothing to recombine and no experience of visual imagery. Monzel et al. (2024) [74] proposes that “vmPFC initiates and oversees the scene construction process in the hippocampus while the visual-perceptual cortex provides the visual details of constructed scenes making the connection between the hippocampus and the visual-perceptual cortex crucial”. Having reliable connectivity between the hippocampus and the visual-perceptual cortices certainly appears necessary for vivid and detail-rich AM retrieval. These overlapping points of view overlap again with the results of the study to be presented.
The impetus for the present study was a publication by Tabi et al. (2022) [76] which examined, in two studies, the association between VVI, short term memory (STM) and hippocampal and primary visual cortical volumes using a correlational approach. In Study 1, Tabi et al. tested a sample of 229 healthy people spread across a wide age range. In Study 2 they employed MRI scans with a group of older, control participants and patients with Alzheimer’s disease (AD) and Parkinson’s disease (PD), allocating 19 people to each group. In the healthy sample of Study 1, Tabi et al. found no evidence of a relationship between VVI and STM performance. However, a series of significant positive correlations occurred between VVIQ scores, hippocampal subfield volumes and volumes of primary visual cortex. As expected, VSTM performance was significantly impaired in patients with AD but the AD patients’ VVI scores were comparable to those of age-matched elderly controls and patients with HD. Although hippocampal volumes were reduced in AD patients, there appeared to be no reduction in their VVIQ scores. The researchers concluded that vividness was correlated with hippocampal and visual cortex volume in healthy people but not with VSTM [76].
For the present study, the dataset provided by Tabi et al.’s [76] was re-analyzed using an alternative protocol that places a predetermined number of extreme scoring subjects into high and low VVIQ scoring groups. In this instance that number was 10. Previous studies of VVIQ differences in cognitive performance [4,9,18] suggested that the ‘extreme groups’ approach is more sensitive in detecting vividness effects than correlational analyses conducted on an entirely unselected sample. The present study tested 16 hypotheses:
H1:
People with vivid visual imagery have greater VSTM than people with non-vivid visual imagery.
H2:
Females have greater VSTM than males.
H3:
Younger people have greater VSTM than older people.
H4:
In brain areas related to VMI functioning (i.e., hippocampi, V1, fusiform gyrus) the High VVIQ group have larger volumes than the Low VVIQ group.
H5:
In brain areas related to VMI functioning, females have larger volumes than males.
H6:
In brain areas related to VMI functioning, younger people have larger volumes than older people.
H7:
In brain areas unrelated to VMI functioning (i.e., amygdala, Brodmann area 4), regional volume does not vary with VVIQ group.
H8:
In brain areas unrelated to VMI functioning, regional volume does not vary with gender.
H9:
In brain areas unrelated to VMI functioning, regional volume does not vary with age.
H10:
An aphant has worse than average VSTM.
H11:
An hphant has better than average VSTM.
H12:
An hphant has better VSTM than an aphant.
H13:
An aphant has smaller than average VMI functioning volumes.
H14:
An hphant has larger than average VMI functioning volumes.
H15:
An hphant has larger VMI functioning volumes than an aphant.
H16:
Volume sizes across groups and individuals follow a predictable sequence: hphant score highest, high VVIQ group mean, entire sample mean, low VVIQ group mean, aphant score lowest.
2. Materials and Methods
The materials and methods are described in detail in another article [76]. 1 The following is a condensed description.
2.1. Short-Term Memory Task
A “What was where?” object-location VSTM task (Figure 1) was used to measure VSTM [77]. At a viewing distance of approximately 30 cm, the task was performed on a touch-sensitive screen (iPad version 9.3.5 (13G36), model MGTX2B/A) with a 1536 × 2048-pixel matrix [78]. Stimuli were drawn from a library of foils and presented on a black background, randomly selected without repetition.
Participants were presented with either one or three random shapes in the form of fractals. If one fractal was presented, it appeared for 1 sec; if three fractals were presented, they appeared for 3 sec. The mean duration for encoding was always 1 sec per item. After a delay lasting 1 or 4 sec, participants were asked to select the shape they had previously seen from two shapes presented at the centre of the screen, one of which was a never-seen foil. To select the correct shape, they were required to touch it, which provided discrete measures of Identification Accuracy and Response Time. Then they were requested to drag the selected item across the screen to its remembered location, which allowed measurement of Localisation Performance on an analogue scale: the distance between the actual location where the fractal had appeared, and the location remembered by the participant.
When the person stopped dragging the chosen shape, a “Done” button appeared at the bottom centre of the screen. If participants started dragging the shape again, this disappeared and then reappeared upon release of the shape. The final position was Supported by them pressing the ‘Done’ button. To continue with the next trial, they simply pressed a “Next” button.
After 19 practice trials, the volunteers performed 120 trials over three blocks, 30 trials per condition equally distributed across blocks. The following parameters are available:
- Identification Accuracy: Trials in which the correct shape was identified out of two divided by the total number of trials of each condition. Trials in which participants did not identify the correct item were excluded from further analysis.
- Response Time: Time taken to point to the correct shape.
- Localisation Performance: Distance between the response and the original target’s location.
- Mis-binding; The probability that a participant can correctly remember the appearances and locations of the shapes at test but confuses or “misbinds” these locations and appearances resulting in the report of another shape’s location for a correctly identified shape.
- Guessing, Guessing indicates a random response likely given when the viewer has forgotten any precise information about the target.
For each trial, the distances between the response and i) the target, ii) the closest non-target and iii) another random trial’s non-target were compared with one another. If the distance to the target was closest, this was counted as a target response. If the distance to the non-target was closest, this was counted as a mis-binding. If the distance to the random trial’s non-target was closest, this was counted as a guessing. For each trial, this procedure was repeated 5000 times with a random trial’s non-target each time. Thus, probabilities for each trial for misbinding and guessing could be calculated.
2.2. Vividness of Visual Imagery
All participants were tested on the Vividness of Visual Imagery Questionnaire (VVIQ) [9,79]. The questionnaire consists of 16 items which participants score between 1 and 5 according to how vividly they can imagine a familiar person, a shop, the sky or a countryside scene, leading to a total score between 16 and 80.
2.3. MRI Analysis
A 3T Siemens Magnetom Verio syngo scanner was used to acquire T1-weighted volumetric images through a magnetisation prepared rapid gradient echo protocol (MPRAGE) in sagittal orientation (TR = 2000 msec, TE = 1.94 msec, TI = 880 msec, Flip angle = 8°, FOV read = 256 mm, Voxel size = 1.0 × 1.0 × 1.0 mm). The same machine was used to record T2-FLAIR images.
FSL FIRST [80] was used to generate hippocampal and amygdala volume for both hemispheres from the T1 anatomical images. These volumes were corrected for age and total intracranial volume calculated using FSL SIENAX, which estimates total brain tissue volume from a single image, normalized for skull size [81]. It strips non-brain tissue and uses the brain and skull images to estimate the scaling between the subject’s image and standard space. It then runs tissue segmentation to estimate the volume of brain tissue, and multiplies this by the estimated scaling factor, to reduce head-size-related variability between subjects.
Grey matter volume of BA4 and V1 was calculated through the standard Freesurfer pipeline (cortical reconstruction and volumetric segmentation: http://surfer.nmr.mgh.harvard.edu/ corrected for age and total intracranial volume. In addition, hippocampal subfields were decomposed using the software’s subfield pipeline based on T1 and T2 image inputs.
2.4. Availability of Data
All data are provided at: https://osf.io/q37vn/
2.5. Participants
Participants had given their informed consent to be involved in the study, which was approved by the local ethics committee [72]. The sample consisted of 53 healthy, middle- to older-aged participants who completed an MRI scan, the VSTM task and VVIQ. In following the extreme-groups protocol, it had been decided in advance to select and compare sub-groups consisting of the ten highest VVIQ and ten lowest VVIQ scorers. A gap of 21 points separated the Low VVIQ (16-52) and the High VVIQ (73-80) groups. The High VVIQ group contained six females, one of whom scored 80 (an hyperphantasic or “Hphant” who rated all 16 VVIQ items at level five – “Perfectly clear and as vivid as normal vision”). The Low VVIQ group included five females, one having a minimum score of 16 (an aphantasic or “aphant” who rated all 16 VVIQ items at level one – “No image at all, you only “know” that you are thinking of an object”). Figure 2 shows the probability distributions of the samples.
For analysis of the effect of age, the 11 oldest participants (aged 76 to 80 years) and the 10 youngest participants (aged 54 to 62) were selected leaving an age gap of 14 years in between (Figure 3). The reason for the Figure 11 was the inclusion of three individuals tied at age 76 which required that the N for the older group had to be 11 instead of 10. The mean ages of the younger and older groups were 57.9 (SD = 2.6013) and 78.0 (SD = 1.6997) respectively (Figure 3).
3. Results
The results for all group and individual comparisons are presented in Table 1 (Supplementary file).
3.1. VVIQ Scores
Table 1 (Supplementary file) presents the mean age and VVIQ scores with standard deviations and outcomes for the members of the main sample, the High and Low VVIQ subgroups, and the aphant and hphant individuals. The mean score difference between the Low VVIQ (41.9; SD 11.99) and High VVIQ (75.5; SD 2.72) groups was highly significant: t(18) = -8.6454, p = <.00001, 95% confidence interval [-42.2691, -24.9309].
For the effect of gender, the sample of 53 individuals was employed. The effect of gender on VVIQ scores was slight (effect size d = 0.0034). A two tailed t-test for independent samples showed no statistical difference with t close to zero, t(51) = 0.0123, p = .99, 95%, confidence interval [-6.9707, 7.0569]. The effect size d was 0.0034 indicating a very small effect.
A two tailed t-test for independent samples showed that the difference in mean VVIQ scores between the two age groups was not statistically significant, t(18) = -1.0619, p = .302, 95%, confidence interval [-17.2756, 5.6756]. The effect size d of 0.4749 indicated a small effect.
3.2. Visual Short-Term Visual Memory (VSTM)
3.2.1. Absolute Error Scores
A two-way mixed model ANOVA showed that the difference between the four experimental conditions was statistically significant (F(3, 54) = 65.6892, p = <.001). (Table 2, Supplementary file) (Figure 4). In all conditions, the Low VVIQ group produced a significantly higher absolute error score than the High VVIQ group: (F(1, 18) = 7.8919, p = .012). The interaction between VVIQ group and Condition was not significant (F(3, 54) = 1.9245, p = .137). However, the absolute error scores indicated a 38 percent lower error score for the high vividness group. The significant main effect for VVIQ group supports H1.
A two-way mixed model ANOVA with SIENAX scaling factor as a covariate showed a significant difference between females and males, F(1, 15) = 6.225, p = .025, with no interaction between gender and experimental condition, F(3, 45) = 2.457, p = .075 (Table 3, Supplementary file). This outcome supports H2.
A two-way ANOVA showed that age was significant F(1, 18) =6.4309, p = .021, with no interaction between condition and age, F(3, 54) =0.0814, p = .97 (Table 4, Supplementary file). This outcome supports H3.
3.2.2. Mean Guessing Rates
Guessing indicates weaker memory. The High VVIQ group had lower guessing rates (M = 0.123, SD = 0.0462) than the Low VVIQ group (M = 0.18, SD = 0.0506). supporting hypothesis H1. (Table 5, Supplementary file). The high vividness group had a guessing rate that was 43 percent lower than the low vividness group. A mixed model ANOVA showed the VVIQ group difference was highly significant: F(1,18) = 11.9845, p = .003. The interaction with Condition was not significant: F(3,54) = 1.7251, p = .173. This finding supports hypothesis H1.
A mixed model ANOVA showed no significant main effect between females and males, F(1, 51) = 0.7, p = .407, but there was a significant interaction, F(3, 153) =3.2616, p = .023. In the two 3-second conditions, males had higher guessing rates than females, supporting H2. (Table 6, Supplementary file).
The younger group had lower guessing rates than the older group. A mixed model ANOVA showed that there was a significant difference between younger and older groups, F(1, 18) = 7.2431, p = .015 and a significant interaction, F(3, 54) =4.3263, p = .008, supporting hypothesis H3.
3.2.3. Mean Misbinding Rates
The two misbinding conditions that produced scores (misb_3item1sec, misb_3items4sec) were analysed in a two-way ANOVA with VVIQ group as the second factor. The High VVIQ group had significantly lower misbinding scores (M = 0.171, SD = 0.058) than the Low VVIQ group (M = 0.239, SD = 0.0816): F(1,18) = 4.5083, p = .048. There was a high-low vividness group difference on the misbinding rate of 40 percent. The interaction with Condition was not significant: F(1,18) = 3.2599. p = .088. The results support H1. (Table 7, Supplementary file).
Combining the VSTM outcomes for average error (p=.012), guessing rate (p=.003) and misbinding (p=.048) into a single p value using Fisher’s method gives a p value of 2.38x10⁻⁵.
Males made significantly more misbinding errors than females, F(1, 51) = 4.0133, p = .05, with no interaction between gender and condition, F(1, 51) = 0.0083, p = .928, supporting H2.
There was no significant difference between younger and older groups, F(1, 18) = 1.8398, p = .192, and no significant interaction between age and condition, F(1, 18) = 0.0674, p = .798, offering no support H3.
3.2.4. Mean Response Times and Proportions Correct
Neither measure produced a significant effect. Gender and age also were not significant factors for either measure; there were no significant interactions.
3.2.5. Aphant and hphant VSTM Results
Point and interval estimates of effect sizes for the aphant and hphant individuals were calculated using a Bayesian approach [81] (SingleBayes_ES.EXE: Crawford, Garthwaite and Porter, 2010). The results for the aphant and hphant were compared to those of the main sample and the two VVIQ groups (Table 1, Supplementary file). For 9/18 memory measures, the aphant showed a signifworse memory than the average of the remaining 52 sample members. Contrary to H10, the aphant performed more strongly than the Low VVIQ group, although not significantly so. The hphant’s performance fell in line with the High VVIQ group, and was not superior to the main sample mean, contrary to H11. Although in the predicted direction, the aphant and hphant VSTM scores were not significantly different, so did not support H12.
3.3. MRI Volume Scores
The 57 brain areas were divided into four Sets:
Set A consisted of 11 volume measures of four relatively large areas (at least 3000 mm3): left, right, bilateral hippocampus; left and right whole hippocampus; left, right, bilateral V1; left, right and bilateral fusiform gyrus.
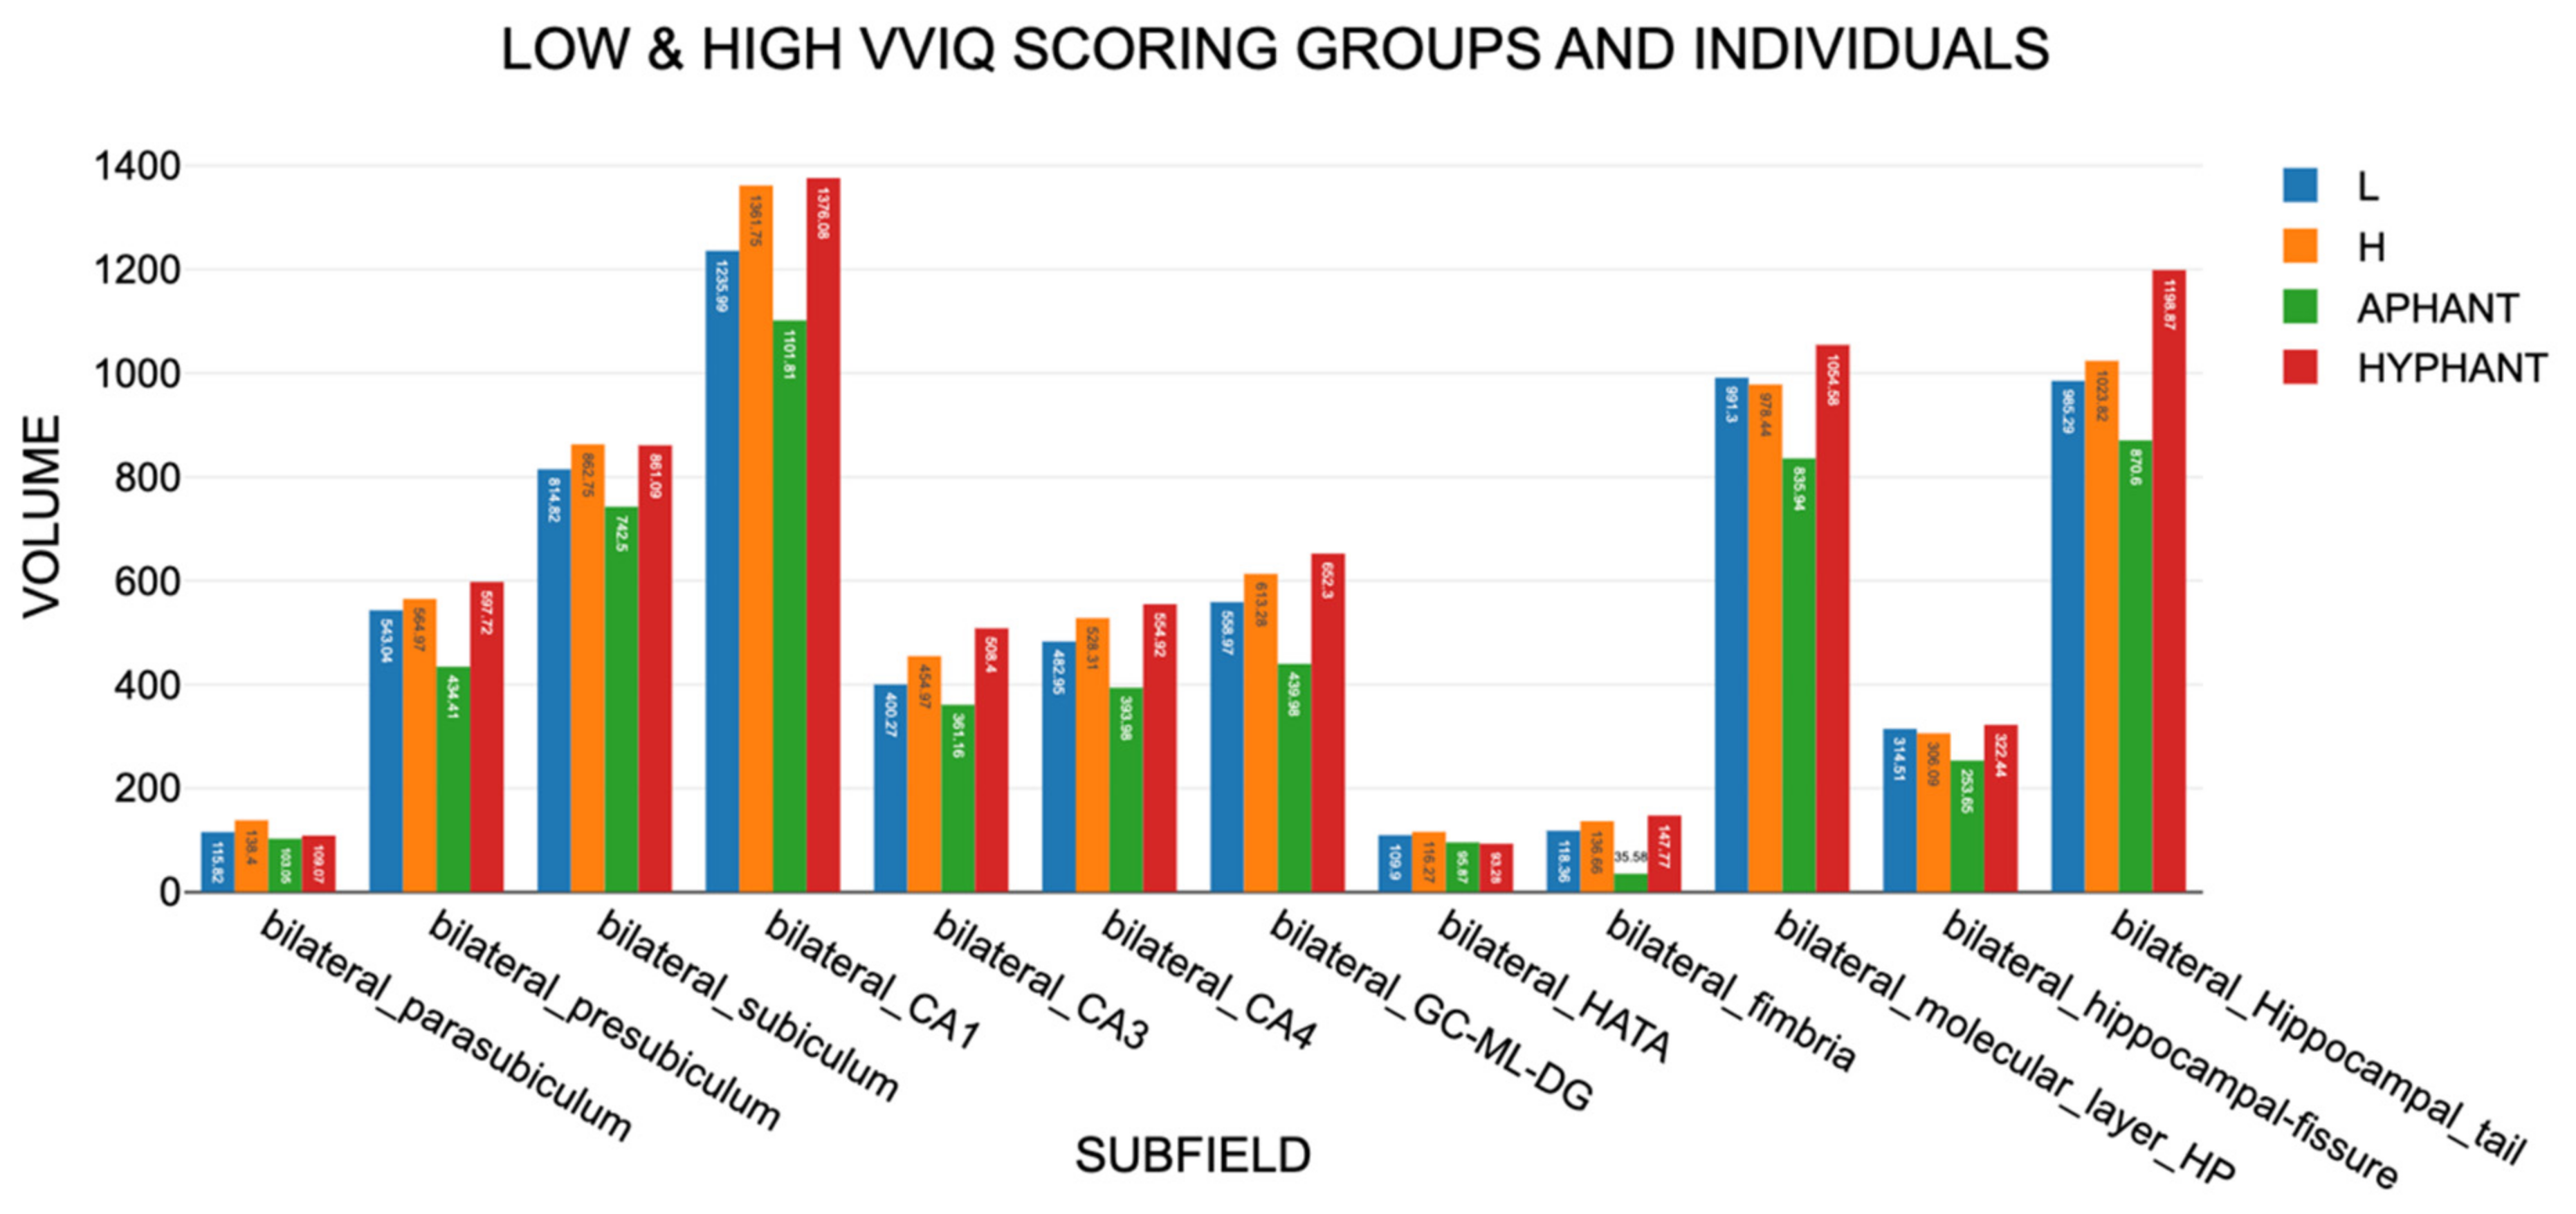
Set B consisted of the left, right and bilateral volumes of 12 hippocampal subfields, 36 volumes in total: left, right, bilateral parasubiculum; left, right, bilateral presubiculum; left, right, bilateral subiculum; left, right, bilateral CA1; left, right, bilateral CA3; left, right, bilateral CA4; left, right, bilateral GC-ML-DG; left, right, bilateral HATA; left, right, bilateral fimbria; left, right, bilateral molecular layer; left, right, bilateral hippocampal fissure; left, right, bilateral hippocampal tail.
Set C consisted of 3 volumes for the left, right, and bilateral amygdala.
Set D consisted of 7 volumes for the motor areas: left, right BA4a; left, right BA4p; left, right, bilateral B4.
Sets A, B and D were each subjected to a mixed model four-way ANOVA (IBM SPSS Version 30, Type III sum of squares) with repeated measures on Side (left, right, bilateral) and Region (12 subfields) and two independent groups factors: High vs Low VVIQ groups, and Gender. For Set C, consisting of the amygdala alone, a mixed model three-way ANOVA was conducted with repeated measures on Side (left, right, bilateral) and two independent groups factors: High vs Low VVIQ groups, and Gender.
For all four sets, the Age factor involved different samples than the VVIQ group factor and was tested in separate analyses.
3.3.1. Findings for Set A Areas
Cortical regional volumes were significantly higher for the High VVIQ group than for the Low VVIQ group by an average of 9.3 percent (Figure 5). An ANOVA (Supplementary file, Table 8) showed that VVIQ group was significant: F(1,16) = 7.977, p = .012, and also Gender: F(1,16) = 5.980, p = .026. VVIQ Group*Gender was not significant: F(1,16) = 0.219, p = .646. Region was significant: F(2, 32) = 237.546, p<.001, as was Side: F(2,32) = 1823.167, p<.001, and also Side*Region: F(4,64) = 169.946, p <.001. The only significant interaction between VVIQ group or Gender with Region or Side was Side*VVIQ group: F(2,32)=4.769, p = .015. These results support H4 but not H5.
A mixed model two-way ANOVA for Set A regions with Age and Regions as factors found that neither Age, F(1, 18) = 0.1726, p = .683, nor Age*Region were significant, F(10, 180) = 0.1726, p = .683, offering no support to H6.
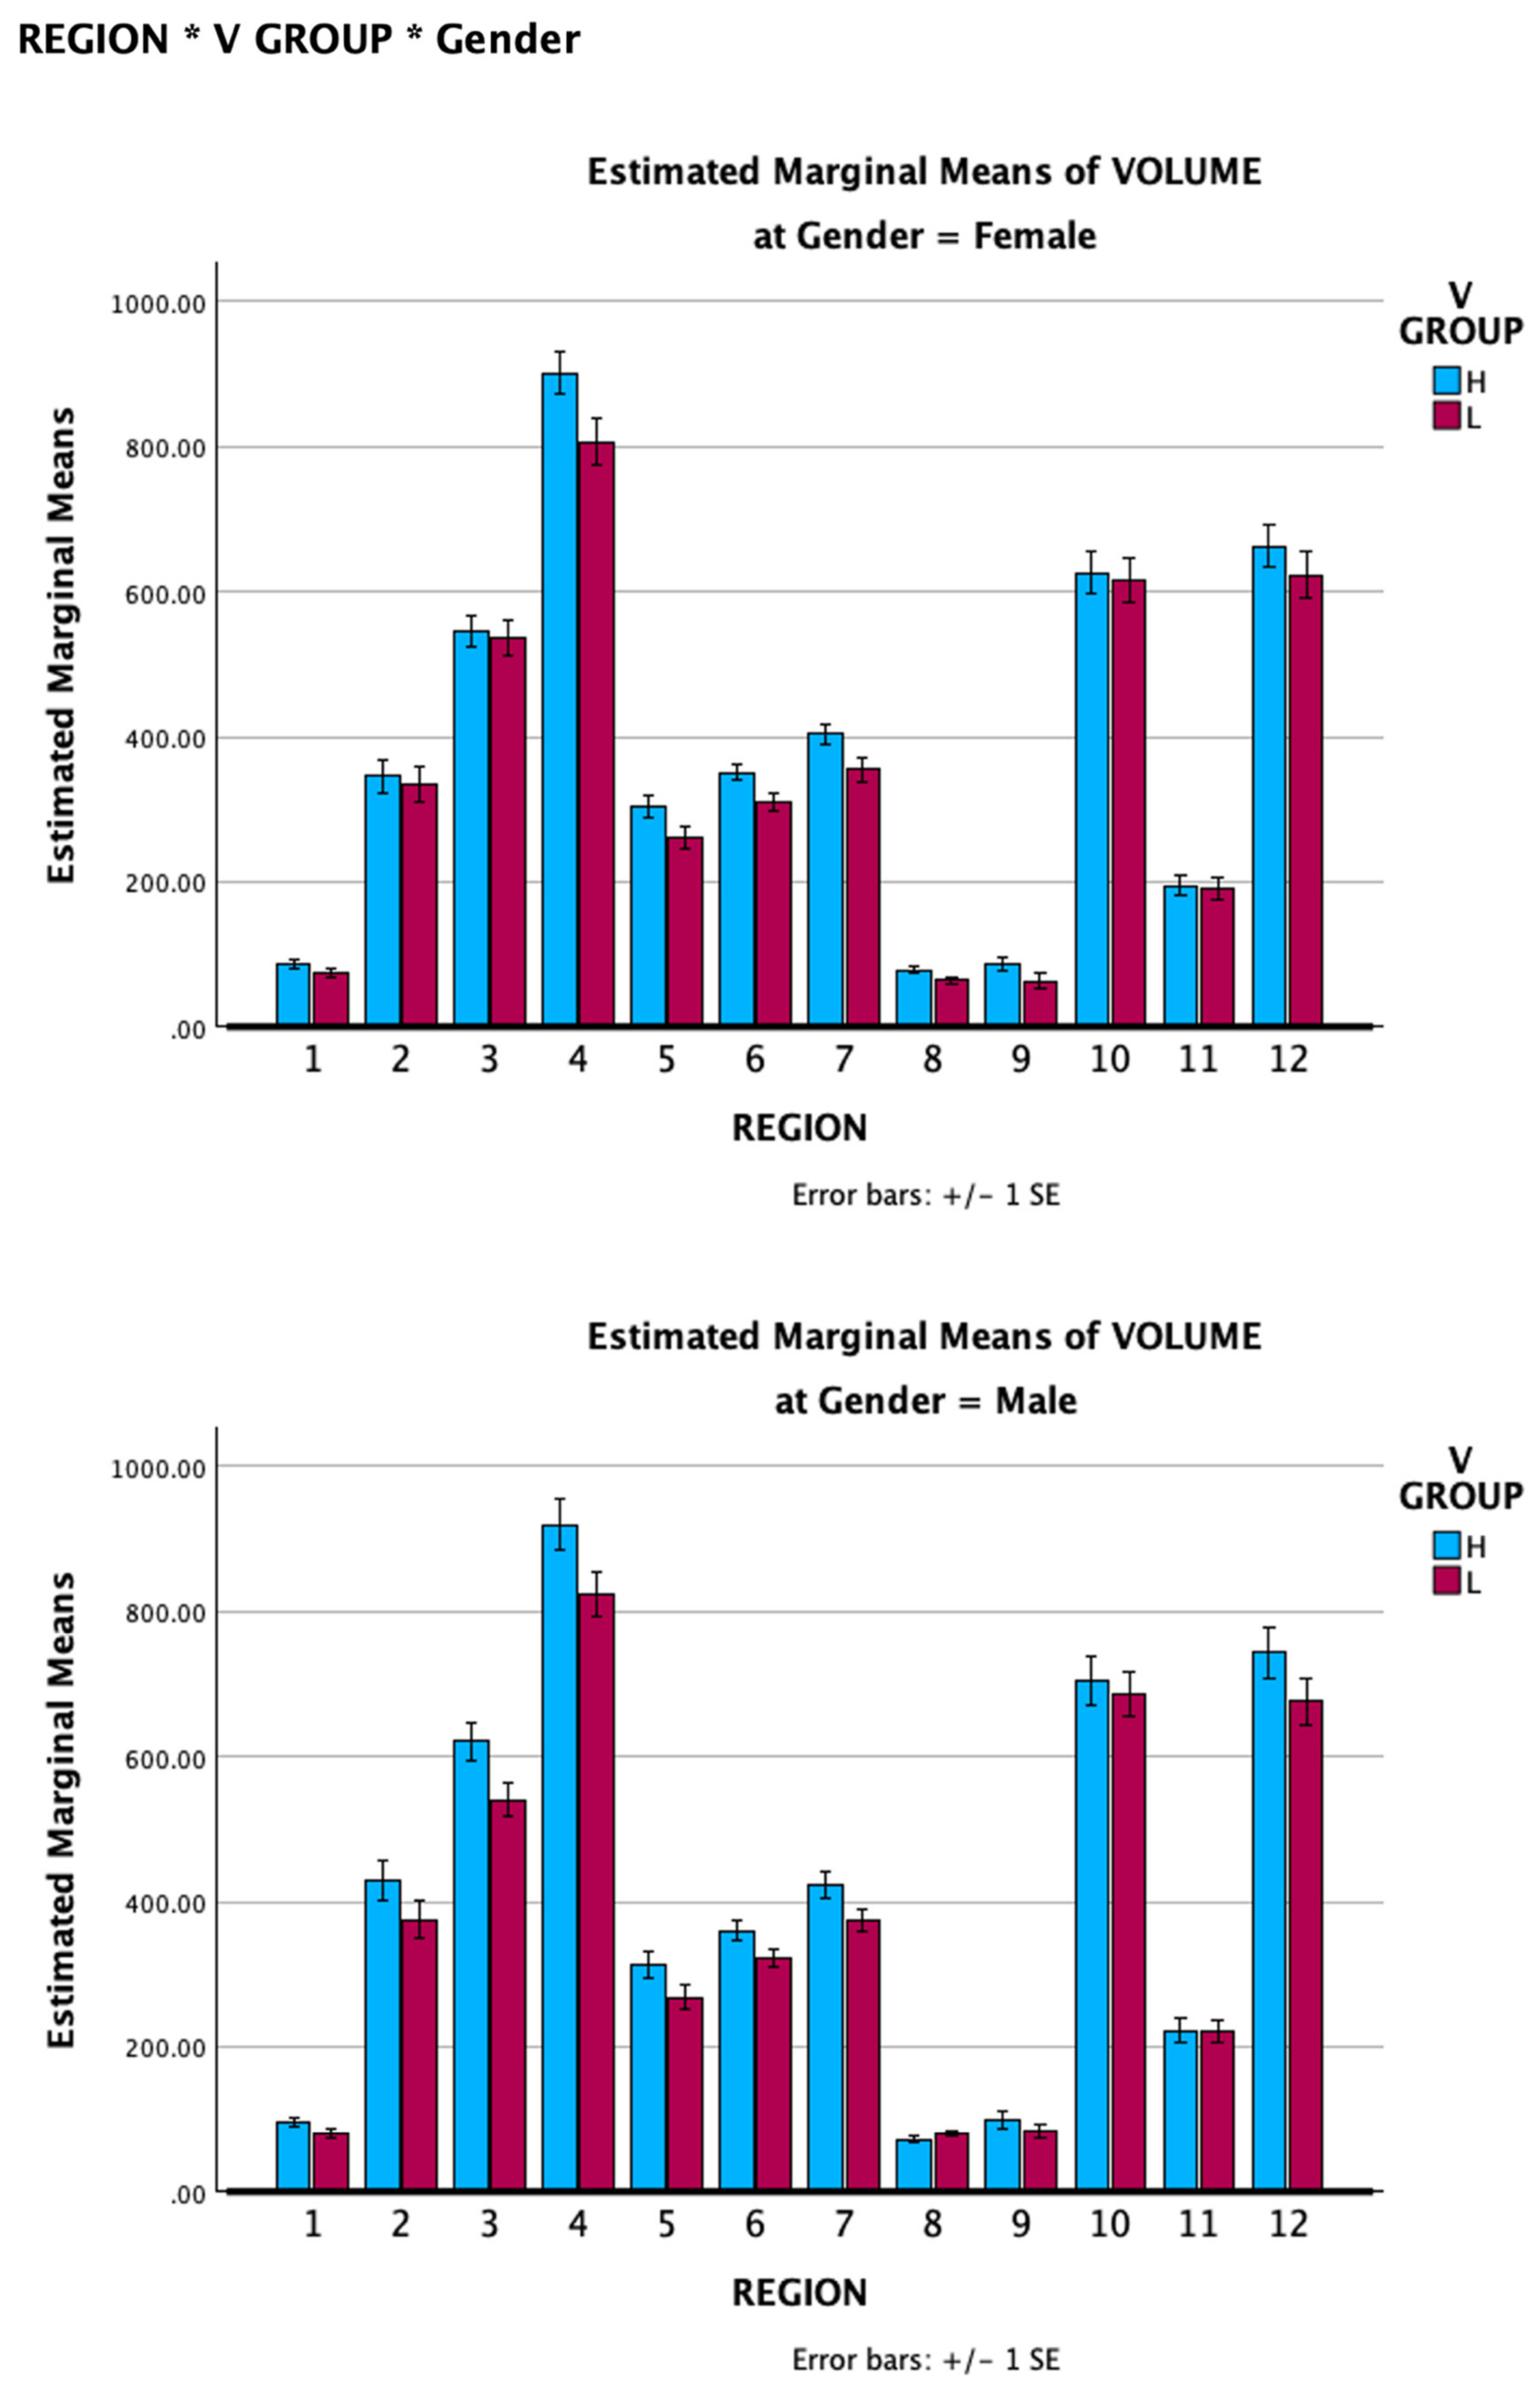
3.3.2. Findings for Set B Subfields
A four-way mixed model ANOVA was conducted with VVIQ group and Gender as between groups factors, and Region and Side as within-subjects factors (Supplementary file, Table 9). VVIQ group was significant: F(1, 16) =8.233, p = .011 (Partial Eta Squared .340) as was Gender: F(1,16) = 6.252, p =.024 (Partial Eta Squared .281) but VVIQ group by Gender was not significant: F(1,16) = 0.156, p=.698 (Partial Eta Squared .010). Region was statistically significant: F(11,160) = 834.746, p <.001 (Partial Eta Squared .981) as was Side F(2,32) =3131.597, p<.001 (Partial Eta Squared .995), Region*Side: F (22,352 ) = 464.562, p <.001, and Region*Side*VVIQ group: F(22,352) = 1.622, p = .039. Side*VVIQ group was significant, F(2,32) =6.282, p=.005, as was Side*Gender, F(2,32) =4.807, p =.015, but Side*Gender*VVIQ group was not significant: F(2,32) = .151, p= .861. Region*VVIQ group was significant: F(11,352)= 2.112, p = .022, as was Region*Gender: F(11,352) =1.968, p = .034. The mean volumes for the 12 subfields for both genders are shown in Figure 6. These findings support hypothesis H4.
For Sets A and B in combination, 23 of 47 subfields showed significantly higher volumes in the High than in the Low VVIQ group (Table 1). The most significant were in the left hemisphere: left V1 (p=.0284), left whole hippocampus (p =.0089), left CA1 (p=.0013), left CA3 (p=.008), left CA4 (p=.0078), and the left hippocampal tail (p=.0455), supporting H4.
Contrary to H5, male volumes for Set B exceeded female volumes. A two-way ANOVA with Age between groups and Region as a repeated measures factor showed Region significant, F(32, 18) = 783.606, p = <.001, but not Age, F(1,18 ) = 0.0109, p = .918, or Age*Region, F(32, 576) = 0.1384, p = 1, contrary to H6.
3.3.3. Findings for the Amygdala
No between-subjects effect was significant (Supplementary file, Table 10). The only significant effect was the Side*Gender interaction: F(2,32) = 4.135, p = .025. Females had significantly smaller amygdalae on the left side. A separate ANOVA found no significant Age difference and no Age*Side interaction, supporting hypotheses H7-H9.
3.3.4. Findings for Set D Subfields
Set D data were analysed in a four-way ANOVA with the same independent variables as for Sets A and B with two levels of Side (left and right) as bilateral scores were unavailable for BA4a and BA4p. Region was significant, F(2, 32) = 2611.723, p = <.001, but not Side, F(1,16) = .051, p = .824. However, Region*Side showed significance: F(2,32) = 7.457, p = .002. Neither VVIQ-group nor Gender were significant main effects, nor was the interaction between them (Table 11, Supplementary file). However, there was a significant Region*Gender interaction. In a separate analysis, there was no significant difference between Age groups, F(1, 18) = 0.0035, p = .954 and no interactions with Age, F(5, 90) =0.1373, p = .983. These findings for Set D are supportive of hypotheses H7-H9.
3.3.5. Findings for the aphant and hphant
The aphant was aged 74 and the hphant was 60. For 10 of 47 areas the aphant yielded significantly smaller volumes than the sample average (Table 1, column 9). Also, across 47 regions in Sets A and B, the aphant yielded lower volumes (M =1793, SD = 2281) than the hphant (M =2172, SD = 2983). The hphant’s volumes exceeded those of the aphant by an average of 37 percent. A paired t-test showed that the difference was statistically significant, t(42) = -5.9735, p = <.001, 95% confidence interval [-225.9925, -103.2066] indicating a large effect size (d=1.80). For only one hippocampal subfield – the left parasubiculum – the hphant yielded a smaller volume than the aphant. These findings support H15.
The aphant’s left fimbria volume of 25.23 was 1.73 standard deviations below the group average (66.67), while her right fimbria was even smaller, 10.34, 2.07 standard deviations below the group average (51.55). The aphant also had a small right amygdala of 771.01, 2.04 standard deviations below the group mean of 1310 mm3. The results are supportive of H13 but not at a statistically significant level.
The findings for the hphant were less significant overall. However, for the left hippocampal tail, and the right fusiform gyrus, the hphant’s volume significantly exceeded that of the main sample (p=.032 and p= 0.0197 respectively) supporting H14. Collectively, the observed aphant-hphant differences support H15.
Figure 7.
The results for the 12 bilateral hippocampal subfields, which were mirrored by the profiles for leftward and rightward volumes.
Figure 7.
The results for the 12 bilateral hippocampal subfields, which were mirrored by the profiles for leftward and rightward volumes.
Volumes in Set A, including area V1, showed Aphant/Hphant differences on a similar scale to those in Set B, supporting H15. For the motor areas in Set D, the hphant also had significantly larger volumes than the aphant: t(6)= -3.767, p= 0.009, d = 1.42.
3.3.6. Other Analyses and Observations
For Sets A and B, there was a notable consistency in the volumes for the High and Low VVIQ groups (Table 1, columns 4 and 6). For 46 of 47 subareas, the High VVIQ had larger volumes than the Low VVIQ group, which has a probability effectively of zero, strongly supporting hypothesis H4.
Another striking pattern occurred in Sets A and B (Table 1, Supplementary file, marked *). For 30 of 57 subareas, the mean volumes were in the predicted sequence: Hphant largest, High VVIQ group second largest, entire sample third, Low VVIQ group fourth, aphant smallest. The chance probability of this result was computed using the Binomial Theorem. There are 5! = 120 different orderings of these 5 categories, each occurrence of the specified ordering is a 1-in-120 event (p = .008333). In the binomial distribution, the probability of at least k successes in n trials with a probability p of success in any trial is given by: P(x=k)=(nk)(p)k(1−p)n−k. With n = 57, k = 30, and p = .008333, the probability of obtaining at least 30 successful matches is effectively zero, providing the strong support to H16.
3.4. Summary of findings
| Label | Hypothesis | Outcome |
| H1 | People with vivid visual imagery have greater visual short-term memory capacity than people with non-vivid visual imagery. | Strongly supported p=2.38×10⁻⁵ |
| H2 | Females have greater visual short-term memory capacity than males. | Supported p = .075 |
| H3 | Younger people have greater visual short-term memory than older people. | Supported p=.01 |
| H4 | In VMIF brain regions, the High VVIQ group have larger volumes than the Low VVIQ group. | Strongly supported p=.012, p=.011, p=0 (rank order correct for 46/47 areas) |
| H5 | In VMIF brain regions, females have larger volumes than males. | Unsupported |
| H6 | In VMIF brain areas younger people have larger volumes than older people. | Unsupported |
| H7 | In non-VMIF brain areas, High and Low VVIQ groups have no volume differences. | Supported |
| H8 | In non-VMIF brain areas, females and males have no volume differences. | Supported |
| H9 | In non-VMIF brain areas, younger and older people have no volume differences. | Supported |
| H10 | Aphant has worse than average VSTM | Unsupported NS |
| H11 | Hphant has better than average VSTM | Unsupported NS |
| H12 | Hphant has better VSTM than aphant | Supported but NS |
| H13 | Aphant has smaller than average VMIF volumes | Supported in 10 areas |
| H14 | Hphant has larger than average VMIF volumes | Supported in 2 areas |
| H15 | Hphant has larger VMIF volumes than aphant | Supported p<.001 |
| H16 | Volume sizes will follow a predictable sequence: hphant, high VVIQ group, entire sample mean, low VVIQ group, aphant |
Predicted order correct 30/57 times: p=0 |
4. Discussion
4.1. General Significance of the Findings
4.1.1. VSTM
The highly significant differences between Low and High VVIQ groups on three parameters of VSTM performance support H1. This result shows the substantial benefit in VSTM of high VVI. The between-group difference were 38%, 43% and 40% for absolute error, guessing and misbinding respectively. These three outcomes had a combined p value of 2.38×10⁻⁵. The higher VSTM scores obtained by females and younger participants supported H2 and H3.
4.1.2. Brain Region Differences
The association between VVIQ group and regional volume occurred to varying degrees in different regions. As expected, the finding reported by Tabi et al. [72] on the strong association between VVIQ scores and multiple specific regional brain volumes was corroborated. For the hippocampi and left V1 area, vivid visual imagers had volumes that were 16 percent larger than those for the non-vivid visual imagers. For the right V1 area, a difference of 9% failed to reach significance. The result for the left fusiform gyrus was in the predicted direction with a 7 percent difference, but it missed significance on a one-tailed test (p = 0.099). It is likely that larger samples would have yielded significant effects for the right V1 area and the left fusiform gyrus.
Given the superior VSTM in females, H5 states that females would have larger hippocampal and area V1 volumes but this was not the case – male volumes exceeded female volumes by an average of around 10 percent. This finding could have several explanations. Firstly, H5 is incorrect and males have larger volumes than females. Second, volume is only one measure of cortical subfield size along with, for example, area and thickness. What the females lacked in volume may have been compensated by cortical thickness, not measured in this study. Third, it is understood that interconnectivity between areas is an important determinant of VVI but this was not measured. Fourth, differences in hippocampal volume depend to some degree on the system used to correct volumes for head-size [82]. The SIENAX system in this study may have been imperfect for correcting volumes for gender-based head-size. Fifthly, our sample sizes were small with only 11 females and 9 males, which is a major limitation.
The age differences were not significant in any volume data. The two age samples were already rather old and the age difference between the two age-based samples was relatively low, an age gap of only 14 years (Figure 3). Evidently, the age difference was not large enough to observe brain volume differences, and/or the samples were too small, although the age effect was significant for VSTM performance, nevertheless.
4.1.3. The aphant Profile
The aphant yielded significantly smaller volumes than the entire (N=53) sample average and had many smaller volumes than the hphant. The aphant had particularly small fimbria, especially on the right side. It has been reported [83] that fimbria-fornix volume is associated with spatial memory. For this sample of 53 subjects, Pearson’s r between VVIQ scores and right fimbria volumes was 0.367 (p<.01). If it had been possible, it would have been interesting to check the aphant’s olfactory sensitivity, which is also associated with fornix volume [77]. In spite of her low volumes, the aphant scored rather well on the VSTM task with lower absolute error, guessing and misbinding scores than the overall group means, although missing statistical significance (Table 1, Supplementary file). One may speculate that over a life of 74 years without voluntary VMI this subject likely had developed proficient strategies for encoding memory of locations, colours and shapes usually parts of VVI by using tags, lists, subjective probability estimates and other symbolic processes. One may expect aphants, routinely and without effort, to be able to tag visual locations mnemonically using quick and direct labels such as “far left”, “far left and above”, “middle right, straight head”, “middle right, down a bit”, etc., compensatory verbal abilities and strategies deployed as “verbal scaffolding” [84].
It was notable also that the aphant’s right amygdala was considerably smaller than the group average. Together with her minute hippocampi and fimbria, one wonders whether the differences collectively contributed to her negligible capacity for VMI? Further investigation of the mnemonic signposts of aphantasia among large samples should soon provide answers to this question.
4.1.4. The hphant Profile
The hphant’s short-term memory scores were typical of the High VVIQ group as a whole. Although 37 percent higher than the aphant’s scores, this VSTM difference was not statistically significant. Two subfields – left hippocampal tail and the right fusiform gyrus the – yielded higher volumes than the entire group average. The overall high scores of the High VVIQ sample meant that the entire group was practically hphant; their mean VVIQ score was 75.5 with a narrow SD of 2.72. Again, more in-depth study of a large sample is necessary.
4.2. Strengths and Limitations
4.2.1. Independence and Transparency
The data for this study were collected and curated independently of this author (University of Oxford Medical Sciences Division, Oxford, United Kingdom). The data are openly shared at the Open Science Foundation website. The author had no role in the data collection or the recruitment of subjects, which were carried out entirely independently and transparently. All study data are downloadable from: https://osf.io/q37vn/
4.2.2. Small Group Sizes
It has been stated that the ‘extreme groups’ protocol is more sensitive than correlation in detecting cognitive differences between subjects varying in VVI. The downside of the ‘extreme groups’ protocol is the reduction of sample size, in this case, from 53 to 20. Fifty-three is already not large, but the reduction to 20, is much worse for statistical power. VVIQ differences in volumes could overcome the lack of power of the small group Ns, but apparently gender and age may not have, leaving the study inconclusive in these regards.
5. Conclusions
This article began with three questions and concludes with three answers:
- 1)
- Are VVI differences real? If by “real” we mean that we can make rich, precise, falsifiable predictions using VVI measures, then the answer is affirmative. Vividness differences are “real” because they enable rich, precise and falsifiable predictions which produced here a set of highly significant findings.
- 2)
- What functions do these differences serve? High VVI serves three primary functions: (A) remembering recent and distant-past stimuli, scenarios, episodes and events; (B) anticipating, foreseeing and simulating near and distant future stimuli, scenarios, episodes and events; (C) constructing phantasy for dreams, imaginary stimuli, scenarios, episodes and events. Low or absent VVI requires alternative, non-imagistic mnemonic strategies such as scaffolding, tagging and listing, to perform tasks but, in some cases, less efficiently.
- 3)
- What is their neurological foundation? VVI differences are founded on brain systems that vary functionally and structurally in magnitude, variance, precision, asymmetry and connectedness. To date, we have only scratched the surface, and further reports will follow.
References
- Fechner, G. Elements of Psychophysics 1860.
- Marks, D.F. Gustav Fechner’s observations on his own and others’ visual mental imagery. J. Educ. Psychol. Res. 2023, 5, 651–675. [Google Scholar]
- Marks, D.F. The Action Cycle Theory of Perception and Mental Imagery. Vision 2023, 7, 12. [Google Scholar] [CrossRef] [PubMed]
- Marks, D.F. Individual Differences in the Vividness of Visual Imagery and Their Effect on Function. In The Function and Nature of Imagery; Sheehan, P.W., Ed. Academic Press: New York, NY, USA, 1972; pp. 83–108. [Google Scholar]
- Marks, D.F. Phenomenological Studies of Visual Mental Imagery: A Review and Synthesis of Historical Datasets. Vision 2023, 7, 67. [Google Scholar] [CrossRef] [PubMed]
- Bilzer, M.; Monzel, M. The Phenomenology of Offline Perception: Multisensory Profiles of Voluntary Mental Imagery and Dream Imagery. Vision 2025, 9, 37. [Google Scholar] [CrossRef] [PubMed]
- Belfi, A. M., Vessel, E. A., & Starr, G. G. (2018). Individual ratings of vividness predict aesthetic appeal in poetry. Psychology of Aesthetics, Creativity, and the Arts, 12(3), 341. Belfi, A. M. (2019). Emotional valence and vividness of imagery predict aesthetic appeal in music. Psychomusicology: Music, Mind, and Brain, 29(2-3), 128.
- Marks, D.F. The General Theory of Behaviour: A Sourcebook. Cambridge Scholars Publishing, 2025.
- Marks, D.F. “Visual imagery differences in the recall of pictures.” British journal of Psychology 64.1 (1973): 17-24.
- Baddeley, A.D. and Andrade, J. (2000) Working memory and the vividness of imagery. J. Exp. Psychol. Gen. 129, 126–145.
- Chkhaidze, A., Coulson, S., & Kiyonaga, A. (2023). Individual Differences in Preferred Thought Formats Predict Features of Narrative Recall. In Proceedings of the Annual Meeting of the Cognitive Science Society (Vol. 45, No. 45).
- Keogh, R, & Pearson, J. (2011). Mental imagery and visual working memory. PLoS ONE, 6, e29221.
- Keogh, Rebecca, & Pearson, J. (2014). The sensory strength of voluntary visual imagery predicts visual working memory capacity. Journal of Vision, 14(12), 1427–1431.
- Gur, R. C., & Hilgard, E. R. (1975). Visual imagery and the discrimination of differences between altered pictures simultaneously and successively presented. British Journal of Psychology, 66(3), 341-345.
- McKelvie, S. J., & Demers, E. G. (1979). Individual differences in reported visual imagery and memory performance. British Journal of Psychology, 70(1), 51-57.
- Berger, G. H., & Gaunitz, S. C. (1979). Self-rated imagery and encoding strategies in visual memory. British Journal of Psychology, 70(1), 21-24.
- Slee, J. A. (1980). Individual differences in visual imagery ability and the retrieval of visual appearances. Journal of Mental Imagery, 4(1), 93–113.
- McKelvie, S.J. (1995). The VVIQ as a psychometric test of individual differences in visual imagery vividness: A critical quantitative review and plea for direction. Journal of Mental Imagery, 19(3- 4), 1–106.
- Rodway, P., Gillies, K., & Schepman, A. (2006). Vivid imagers are better at detecting salient changes. Journal of Individual Differences, 27(4), 218–228.
- Jacobs, C., Schwarzkopf, D. S., & Silvanto, J. (2018). Visual working memory performance in aphantasia. Cortex, 105, 61-73.
- Heuer, F., Fischman, D., & Reisberg, D. (1986). Why does vivid imagery hurt colour memory? Canadian Journal of Psychology / Revue canadienne de psychologie, 40(2), 161–175.
- Reisberg, D., Culver, L. C., Heuer, F., & Fischman, D. (1986). Visual memory: When imagery vividness makes a difference. Journal of Mental Imagery, 10(4), 51–74.
- Reisberg, D., & Leak, S. (1987). Visual imagery and memory for appearance: Does Clark Gable or George C. Scott have bushier eyebrows? Canadian Journal of Psychology / Revue canadienne de psychologie, 41(4), 521–526.
- Zhang, Ziao, et al. “Effects of age and gender on the vividness of visual imagery: a study with the Chinese version of the VVIQ (VVIQ-C).” (2024).
- Zeman, A., Dewar, M., & Della Sala, S. (2015). Lives without imagery – Congenital aphantasia. Cortex, 73, 378–380.
- Zeman, A., Milton, F., Della Sala, S., Dewar, M., Frayling, T., Gaddum, J., Hattersley, A., Heuerman-Williamson, B., Jones, K., MacKisack, M., & Winlove, C. (2020). Phantasia–The psychological significance of lifelong visual imagery vividness extremes. Cortex, 130, 426–440.
- Blomkvist, A., & Marks, D. F. (2023). Defining and ‘diagnosing’ aphantasia: Condition or individual difference? Cortex, 169, 220-234.
- Jin, F.; Hsu, S.-M.; Li, Y. A Systematic Review of Aphantasia: Concept, Measurement, Neural Basis, and Theory Development. Vision 2024, 8, 56. [Google Scholar] [CrossRef] [PubMed]
- Geschwind, N. Disconnexion syndromes in animals and man. I. Brain. 1965 Jun;88(2):237-94.
- Farah, M. J., Levine, D. N., & Calvanio, R. (1988). A case study of mental imagery deficit. Brain and cognition, 8(2), 147-164.
- Marks, D.F. (1990). On the relationship between imagery, body and mind. In P J Hampson, D F Marks and John T E Richardson (eds.) Imagery. Current developments. Pp. 1-38.
- Marks, D. F., Uemura, K., Tatsuno, J., Imamura, Y., & Ashida, H. (1985). Topographical analysis of alpha attenuation in mental imagery and calculation. Electroencephalography and Clinical Neurophysiology, 61(3), S142.
- Marks, Uemura, Tatsuno and Imamura, 1985; Marks, D., Uemura, K., Tatsuno, J., & Imamura, Y. (1985). EEG topographical analysis of imagery. Contemporary psychology: Biological processes and theoretical issues, Amsterdam: Elsevier. Pp. 211-223.
- Marks, D. F., & Isaac, A. R. (1995). Topographical distribution of EEG activity accompanying visual and motor imagery in vivid and non-vivid imagers. British Journal of Psychology, 86(2), 271-282.
- Farah, M. J. (1984). The neurological basis of mental imagery: A componential analysis. Cognition, 18(1-3), 245-272.
- Kosslyn, S. M., & Thompson, W. L. (2003). When is early visual cortex activated during visual mental imagery?. Psychological bulletin, 129(5), 723.
- Amedi, A., Malach, R., & Pascual-Leone, A. (2005). Negative BOLD differentiates visual imagery and perception. Neuron, 48(5), 859-872.
- Cui, X., Jeter, C. B., Yang, D., Montague, P. R., & Eagleman, D. M. (2007). Vividness of mental imagery: Individual variability can be measured objectively. Vision research, 47(4), 474-478.
- Dijkstra, N., Bosch, S. E., & van Gerven, M. A. (2019). Shared neural mechanisms of visual perception and imagery. Trends in cognitive sciences, 23(5), 423-434.
- Pearson, J. (2019). The human imagination: the cognitive neuroscience of visual mental imagery. Nature reviews neuroscience, 20(10), 624-634.
- Spagna, Alfredo, et al. “Visual mental imagery engages the left fusiform gyrus, but not the early visual cortex: A meta-analysis of neuroimaging evidence.” Neuroscience & Biobehavioral Reviews 122 (2021): 201-217.
- Dijkstra, N. Uncovering the Role of the Early Visual Cortex in Visual Mental Imagery. Vision 2024, 8, 29.
- Genç, Erhan, et al. “Surface area of early visual cortex predicts individual speed of traveling waves during binocular rivalry.” Cerebral cortex 25.6 (2015): 1499-1508.
- Fulford, J., Milton, F., Salas, D., Smith, A., Simler, A., Winlove, C., & Zeman, A. (2018). The neural correlates of visual imagery vividness–An fMRI study and literature review. Cortex, 105, 26-40.
- Duan, S., Li, Q., Yang, J., Yang, Q., Li, E., Liu, Y., … & Zhao, B. (2025). Precuneus activation correlates with the vividness of dynamic and static imagery: an fMRI study. Frontiers in Human Neuroscience, 19, 1516058.
- Tullo, M. G., Almgren, H., Van de Steen, F., Sulpizio, V., Marinazzo, D., and Galati, G. (2022). Individual differences in mental imagery modulate effective connectivity of scene-selective regions during resting state. Brain Struct. Funct. 227, 1831–1842.
- Kvamme, T. L., Lumaca, M., Zana, B., Paunovic, D., Silvanto, J., & Sandberg, K. (2024). Vividness of Visual Imagery Supported by Intrinsic Structural-Functional Brain Network Dynamics. bioRxiv, 2024-03.
- Blomkvist, A. (2025). Shaping the Space: A Role for the Hippocampus in Mental Imagery Formation. Vision, 9(1), 2. [CrossRef]
- Ellis, H. (1894). Man and Woman: A Study of Secondary Sexual Characters. London Walter Scott, Ltd.
- Horgan, T. G., Mast, M. S., Hall, J. A., & Carter, J. D. (2004). Gender Differences in Memory for the Appearance of Others. Personality and Social Psychology Bulletin, 30(2), 185-196.
- McBurney, D. H., Gaulin, S. J., Devineni, T., & Adams, C. (1997). Superior spatial memory of women: Stronger evidence for the gathering hypothesis. Evolution and Human Behavior, 18(3), 165-174.
- J Choi, I Silverman (1996). Sexual dimorphism in spatial behaviors: Applications to route learning Evolution and Cognition 2, 165-171.
- James, T. W., & Kimura, D. (1997). Sex differences in remembering the locations of objects in an array: Location-shifts versus location-exchanges. Evolution and Human Behavior, 18(3), 155-163.
- McGivern, R. F., Huston, J. P., Byrd, D., King, T., Siegle, G. J., & Reilly, J. (1997). Sex differences in visual recognition memory: support for a sex-related difference in attention in adults and children. Brain and cognition, 34(3), 323-336.
- Levy, L. J., Astur, R. S., & Frick, K. M. (2005). Men and women differ in object memory but not performance of a virtual radial maze. Behavioral neuroscience, 119(4), 853.
- Silverman, Irwin, Jean Choi, and Michael Peters. “The hunter-gatherer theory of sex differences in spatial abilities: Data from 40 countries.” Archives of sexual behavior 36 (2007): 261-268.
- Russell, E. M., Longstaff, M. G., & Winskel, H. (2024). Sex differences in eyewitness memory: A scoping review. Psychonomic bulletin & review, 31(3), 985-999.
- Herlitz, A., & Rehnman, J. (2008). Sex differences in episodic memory. Current directions in psychological science, 17(1), 52-56.
- Asperholm M, Hogman N, Rafi J and Herlitz A (2019). What did you do yesterday? A metaanalysis of sex differences in episodic memory. Psychol. Bull. 145, 785-821.
- Voyer, D., Voyer, S. D., & Saint-Aubin, J. (2017). Sex differences in visual-spatial working memory: A meta-analysis. Psychonomic bulletin & review, 24, 307-334.
- Filipek, P.A., Richelme, C., Kennedy, D.N., Caviness V.S., Jr (1994) The young adult human brain: An MRI-based morphometric analysis. Cereb. Cortex 4:344–360.
- Filipek, Pauline A., et al. “Volumetric MRI analysis comparing subjects having attention-deficit hyperactivity disorder with normal controls.” Neurology 48.3 (1997): 589-601.
- Murphy, D. G., DeCarli, C., Mclntosh, A. R., Daly, E., Mentis, M. J., Pietrini, P., … & Rapoport, S. I. (1996). Sex differences in human brain morphometry and metabolism: an in vivo quantitative magnetic resonance imaging and positron emission tomography study on the effect of aging. Archives of general psychiatry, 53(7), 585-594.
- Paus, T., Otaky, N., Caramanos, Z., Macdonald, D., Zijdenbos, A., d’Avirro, D., … & Evans, A. C. (1996). In vivo morphometry of the intrasulcal gray matter in the human cingulate, paracingulate, and superior-rostral sulci: Hemispheric asymmetries, gender differences and probability maps. Journal of Comparative Neurology, 376(4), 664-673.
- Schlaepfer, T. E., Harris, G. J., Tien, A. Y., Peng, L., Lee, S., & Pearlson, G. D. (1995). Structural differences in the cerebral cortex of healthy female and male subjects: a magnetic resonance imaging study. Psychiatry Research: Neuroimaging, 61(3), 129-135.
- Guadalupe, Tulio, et al. “Asymmetry within and around the human planum temporale is sexually dimorphic and influenced by genes involved in steroid hormone receptor activity.” Cortex 62 (2015): 41-55.
- Witelson, S.F., Glezer, I.I., Kigar, D.L. (1995) Women have greater density of neurons in posterior temporal cortex. J. Neurosci. 15:3418–3428.
- Giedd, Jay N., et al. “Quantitative magnetic resonance imaging of human brain development: ages 4–18.” Cerebral cortex 6.4 (1996): 551-559.
- Paus, Tomáš, et al. “In vivo morphometry of the intrasulcal gray matter in the human cingulate, paracingulate, and superior-rostral sulci: Hemispheric asymmetries, gender differences and probability maps.” Journal of Comparative Neurology 376.4 (1996): 664-673.
- Persson, Jonas, et al. “Sex differences in volume and structural covariance of the anterior and posterior hippocampus.” Neuroimage 99 (2014): 215-225.
- Dalton, M. A., Zeidman, P., McCormick, C., & Maguire, E. A. (2018). Differentiable processing of objects, associations, and scenes within the hippocampus. Journal of Neuroscience, 38(38), 8146-8159.
- Fjell, A. M., Sneve, M. H., Amlien, I. K., Grydeland, H., Mowinckel, A. M., Vidal-Piñeiro, D., … & Walhovd, K. B. (2025). Stable hippocampal correlates of high episodic memory function across adulthood. Scientific Reports, 15(1), 8816.
- Harrison, Theresa M., et al. “Superior memory and higher cortical volumes in unusually successful cognitive aging.” Journal of the International Neuropsychological Society 18.6 (2012): 1081-1085.
- Dawes AJ, Keogh R, Robuck S, Pearson J. 2022. Memories with a blind mind: Remembering the past and imagining the future with aphantasia. Cognition 227:105192.
- Monzel, M., Leelaarporn, P., Lutz, T., Schultz, J., Brunheim, S., Reuter, M., & McCormick, C. (2024). Hippocampal-occipital connectivity reflects autobiographical memory deficits in aphantasia. Elife, 13, RP94916.
- Blomkvist, A. (2023). Aphantasia: In search of a theory. Mind & Language, 38(3), 866-888.
- Tabi, Y. A., Maio, M. R., Attaallah, B., Dickson, S., Drew, D., Idris, M. I., … & Husain, M. (2022). Vividness of visual imagery questionnaire scores and their relationship to visual short-term memory performance. Cortex, 146, 186-199.
- Pertzov Y., Miller T.D., Gorgoraptis N., Caine D., Schott J.M., Butler C., et al. Binding deficits in memory following medial temporal lobe damage in patients with voltage-gated potassium channel complex antibody-associated limbic encephalitis. Brain. 2013;136(8):2474–2485.
- Zokaei N., Grogan J., Fallon S.J., Slavkova E., Hadida J., Manohar S., et al. Short-term memory advantage for brief durations in human APOE ε4 carriers. Scientific Reports. 2020;10(1):1–10.
- Patenaude B., Smith S.M., Kennedy D.N., Jenkinson M. A Bayesian model of shape and appearance for subcortical brain segmentation. Neuroimage. 2011;56(3):907–922.
- Crawford, J.R & Garthwaite, P.H. (2007). Comparison of a single case to a control or normative sample in neuropsychology: Development of a Bayesian approach. Cognitive Neuropsychology, 24, 343-372.
- Perlaki, Gabor, et al. “Are there any gender differences in the hippocampus volume after head-size correction? A volumetric and voxel-based morphometric study.” Neuroscience letters 570 (2014): 119-123.
- Dahmani, Louisa, et al. “Fimbria-fornix volume is associated with spatial memory and olfactory identification in humans.” Frontiers in Systems Neuroscience 13 (2020): 87.
- Bainbridge, Wilma A., et al. “Quantifying aphantasia through drawing: Those without visual imagery show deficits in object but not spatial memory.” Cortex 135 (2021): 159-172.
Figure 1.
Task schematic of the visual short-term memory task. Participants saw one or three fractal designs for a period of 1 sec per fractal. After a blank interval of 1 or 4 sec, one of the original fractals reappeared together with a distractor fractal. Participants had to select the fractal which they thought had been previously presented (Identification accuracy) and drag it to where they recalled it had previously appeared (Localisation performance).
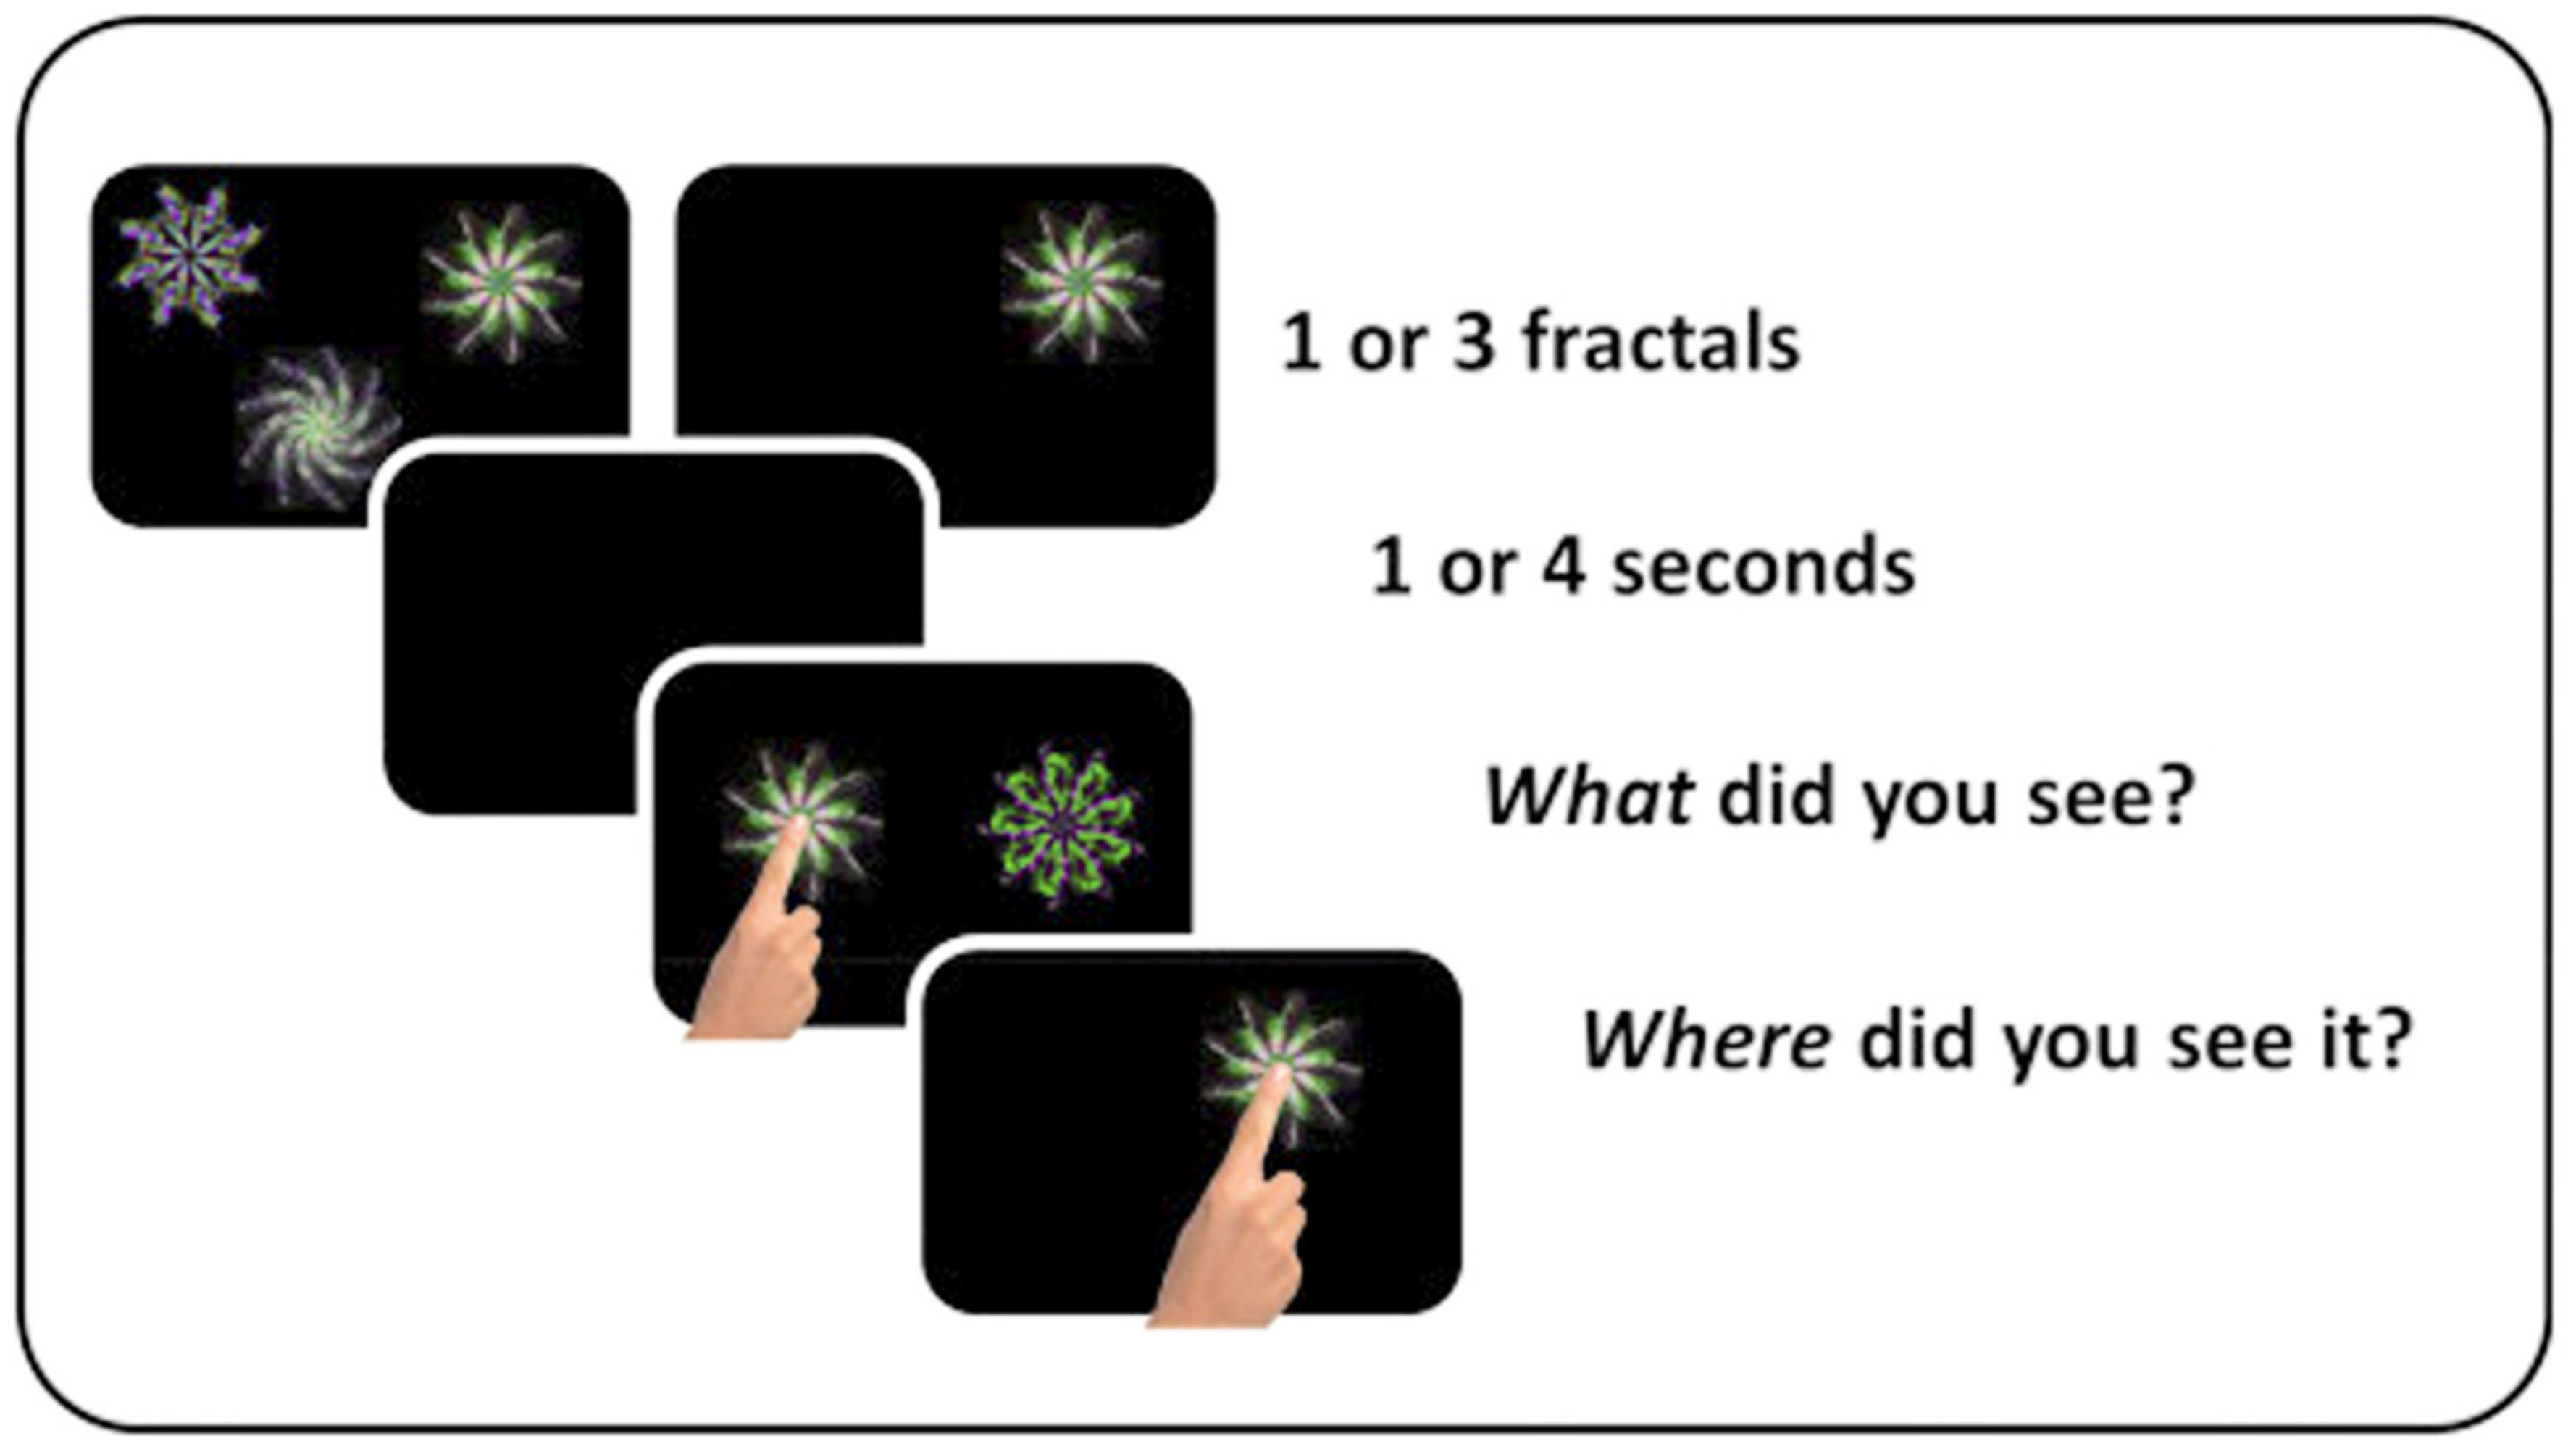
Figure 2.
Probability distributions of the sample (left side) and the High VVIQ and Low VVIQ groups.
Figure 2.
Probability distributions of the sample (left side) and the High VVIQ and Low VVIQ groups.
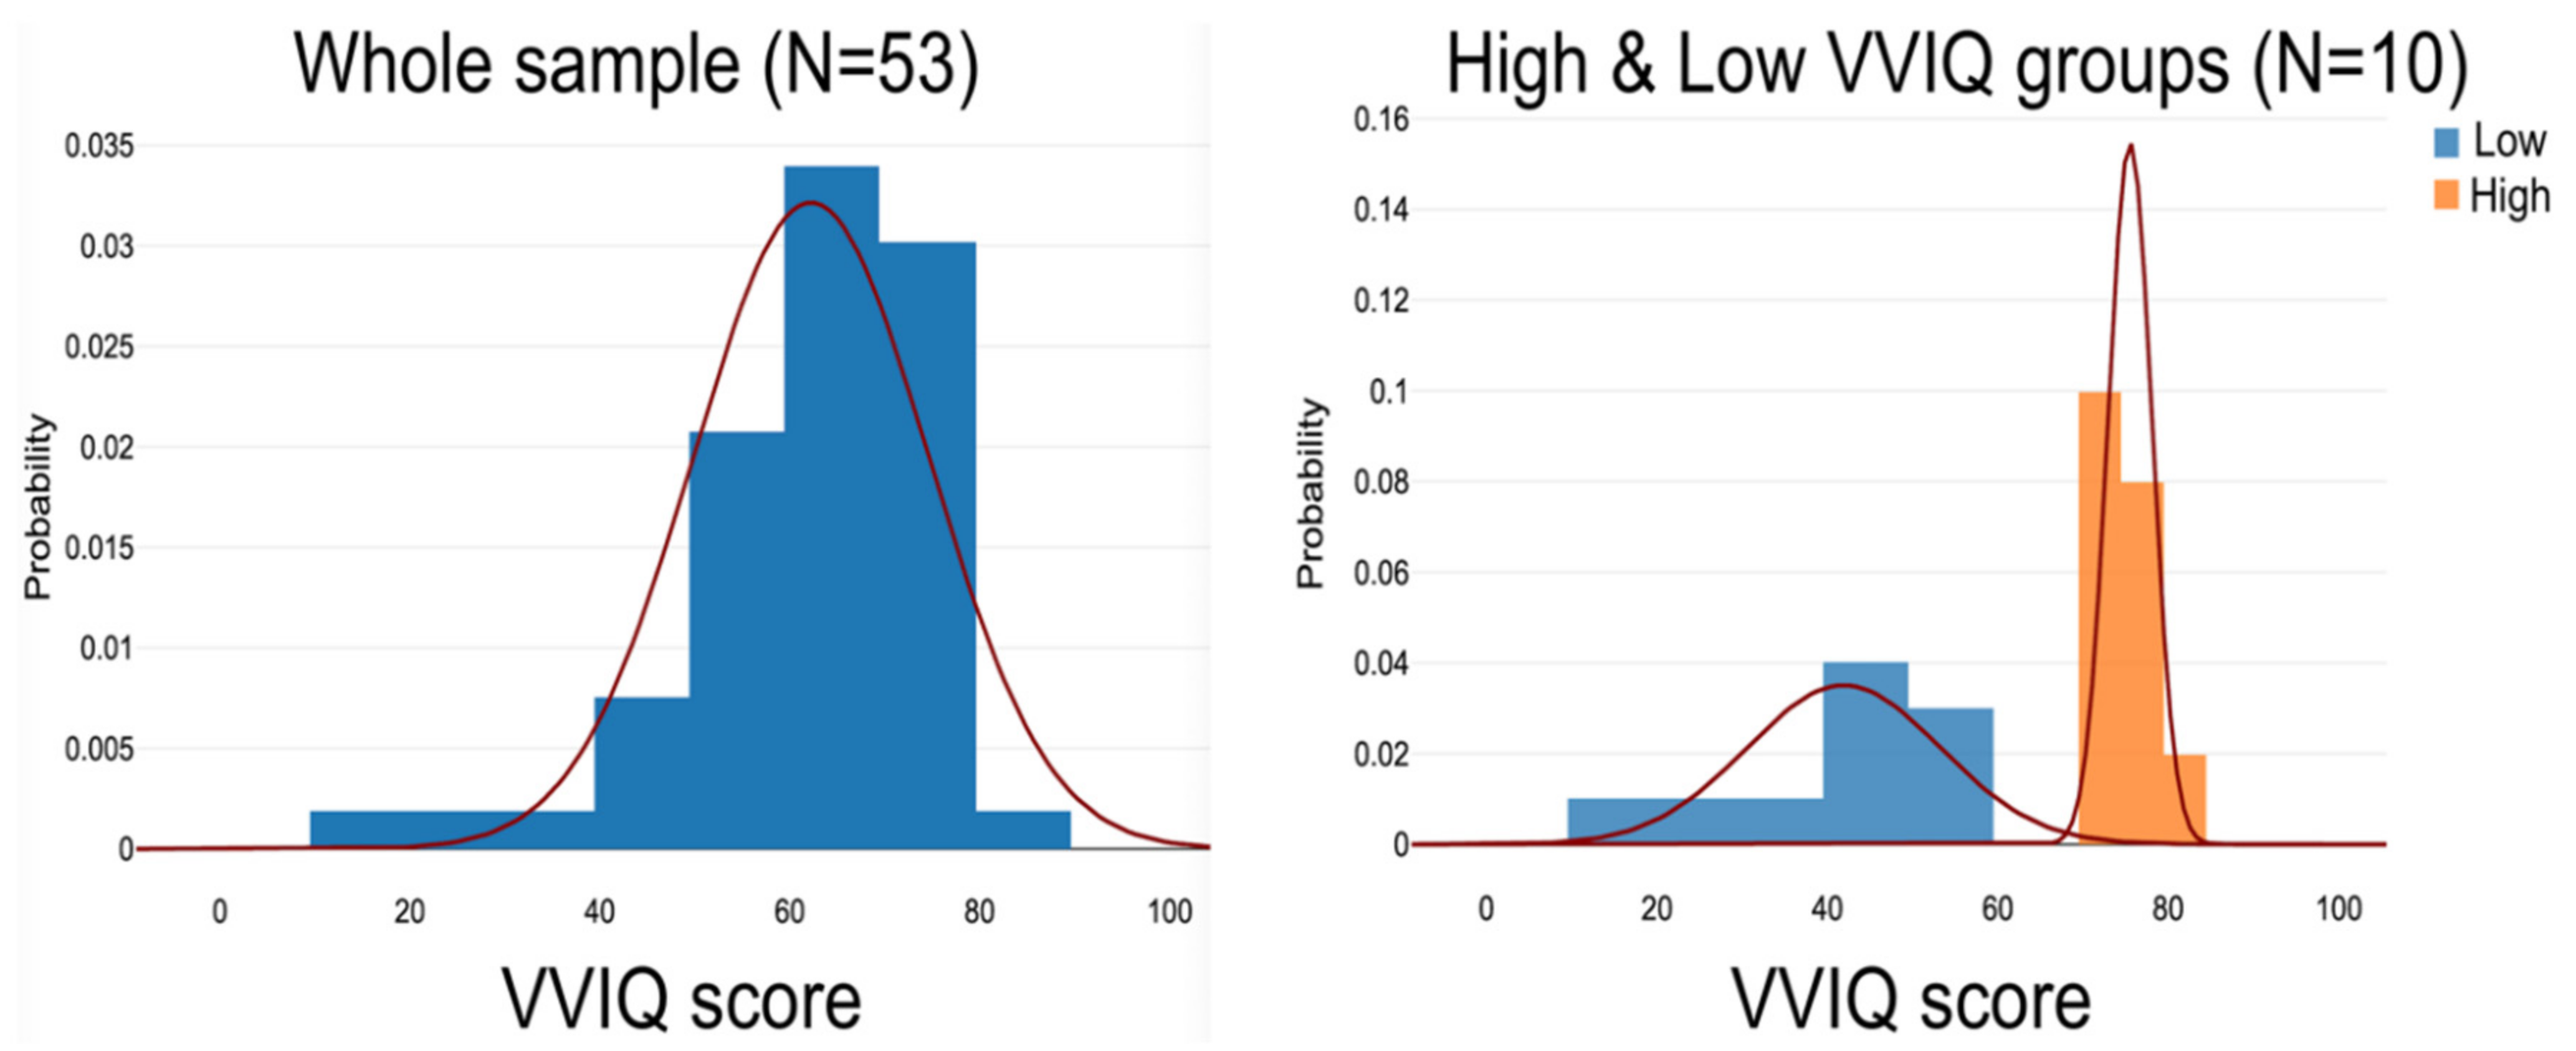
Figure 3.
Probability distributions of the whole sample (left side) and the younger and older subgroups.
Figure 3.
Probability distributions of the whole sample (left side) and the younger and older subgroups.
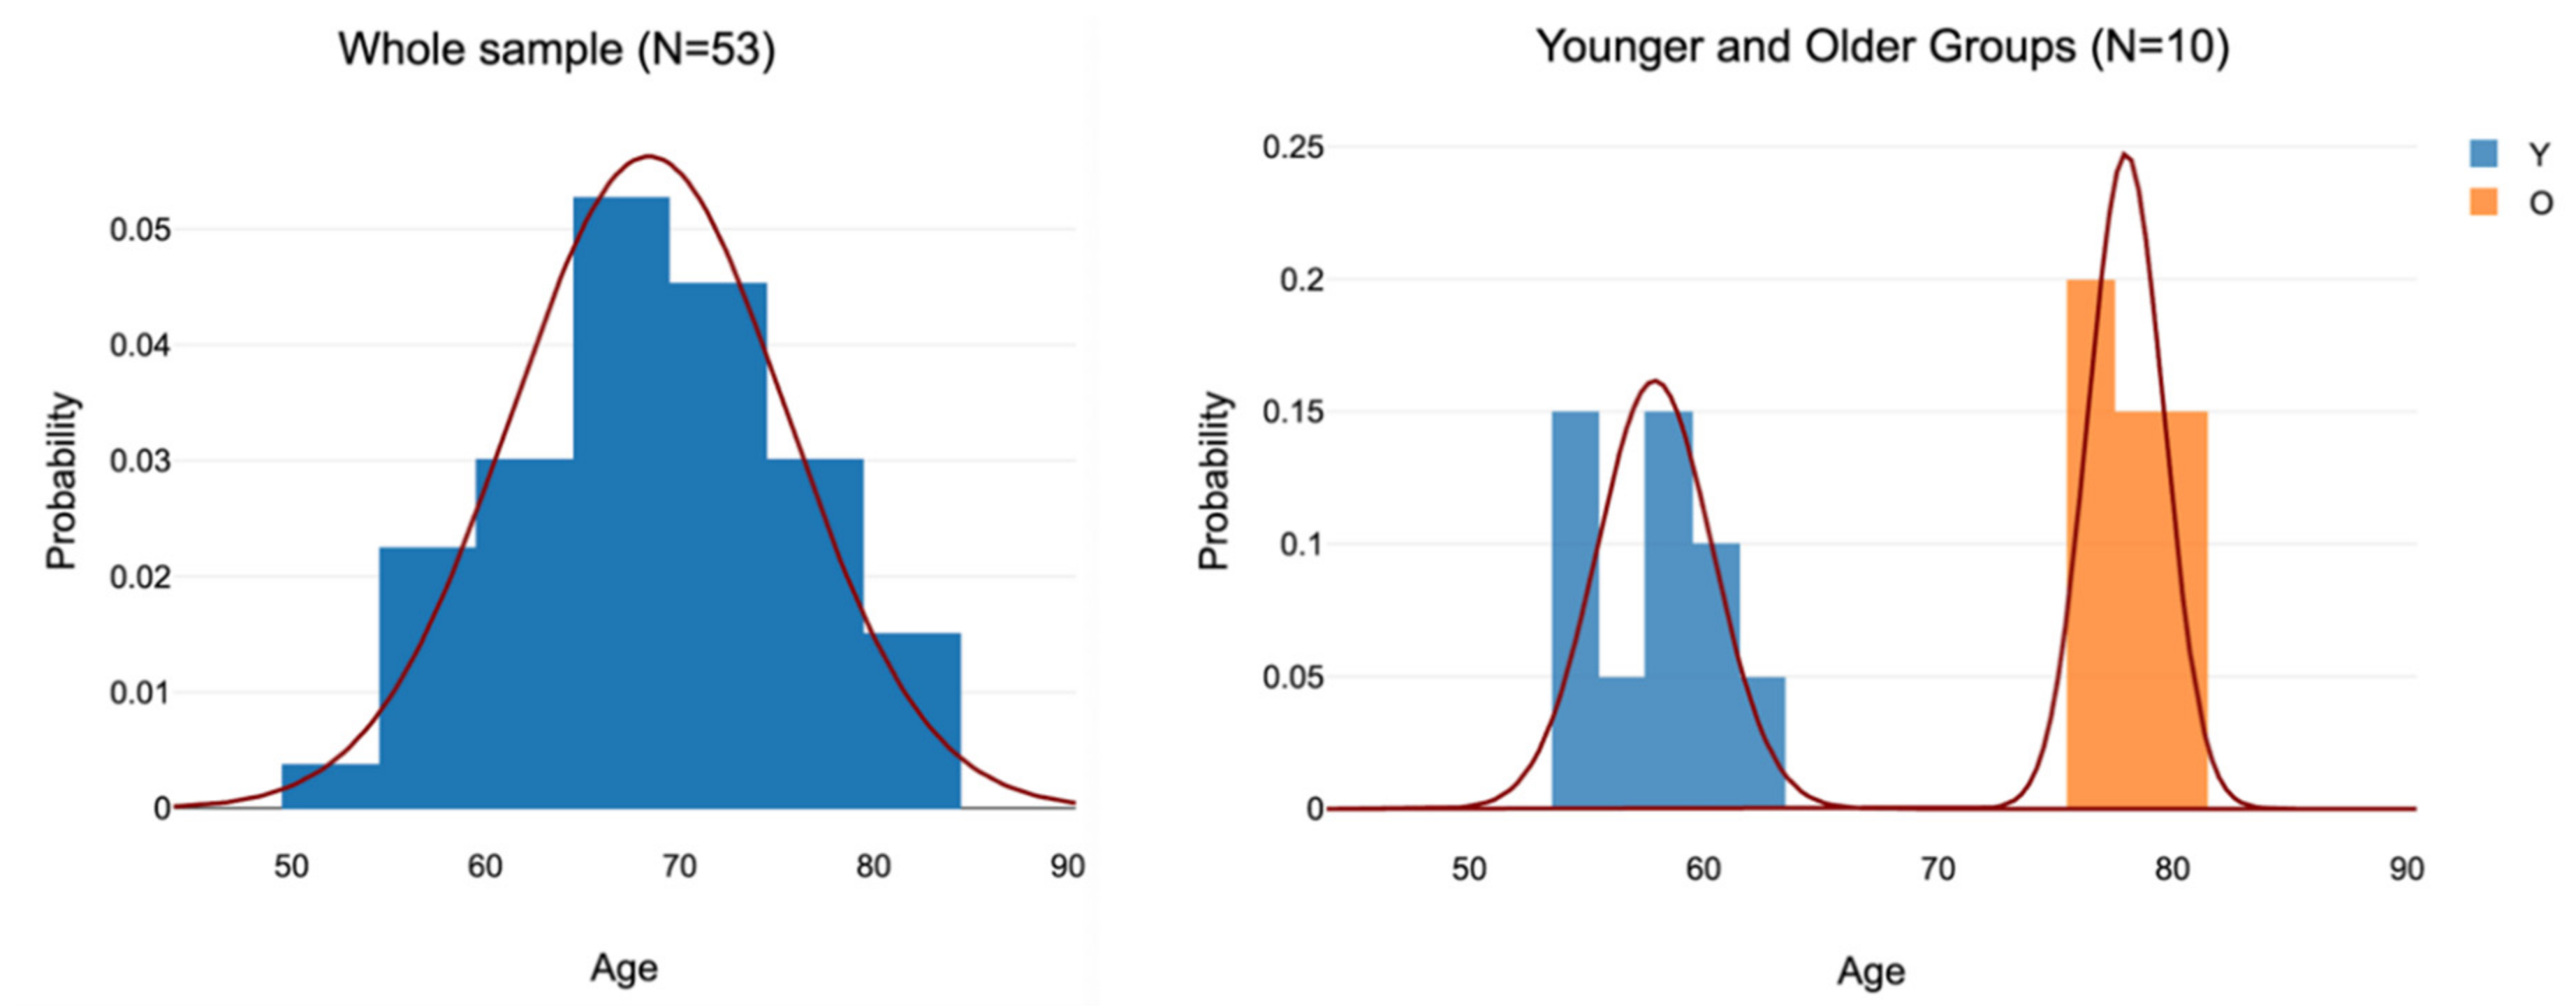
Figure 4.
Average error scores for the Low and High VVIQ groups across the four experimental conditions. Vertical bars show one standard error.
Figure 4.
Average error scores for the Low and High VVIQ groups across the four experimental conditions. Vertical bars show one standard error.

Figure 5.
Mean volumes in Set A for the Low and High VVIQ groups. Vertical bars show one standard error.
Figure 5.
Mean volumes in Set A for the Low and High VVIQ groups. Vertical bars show one standard error.
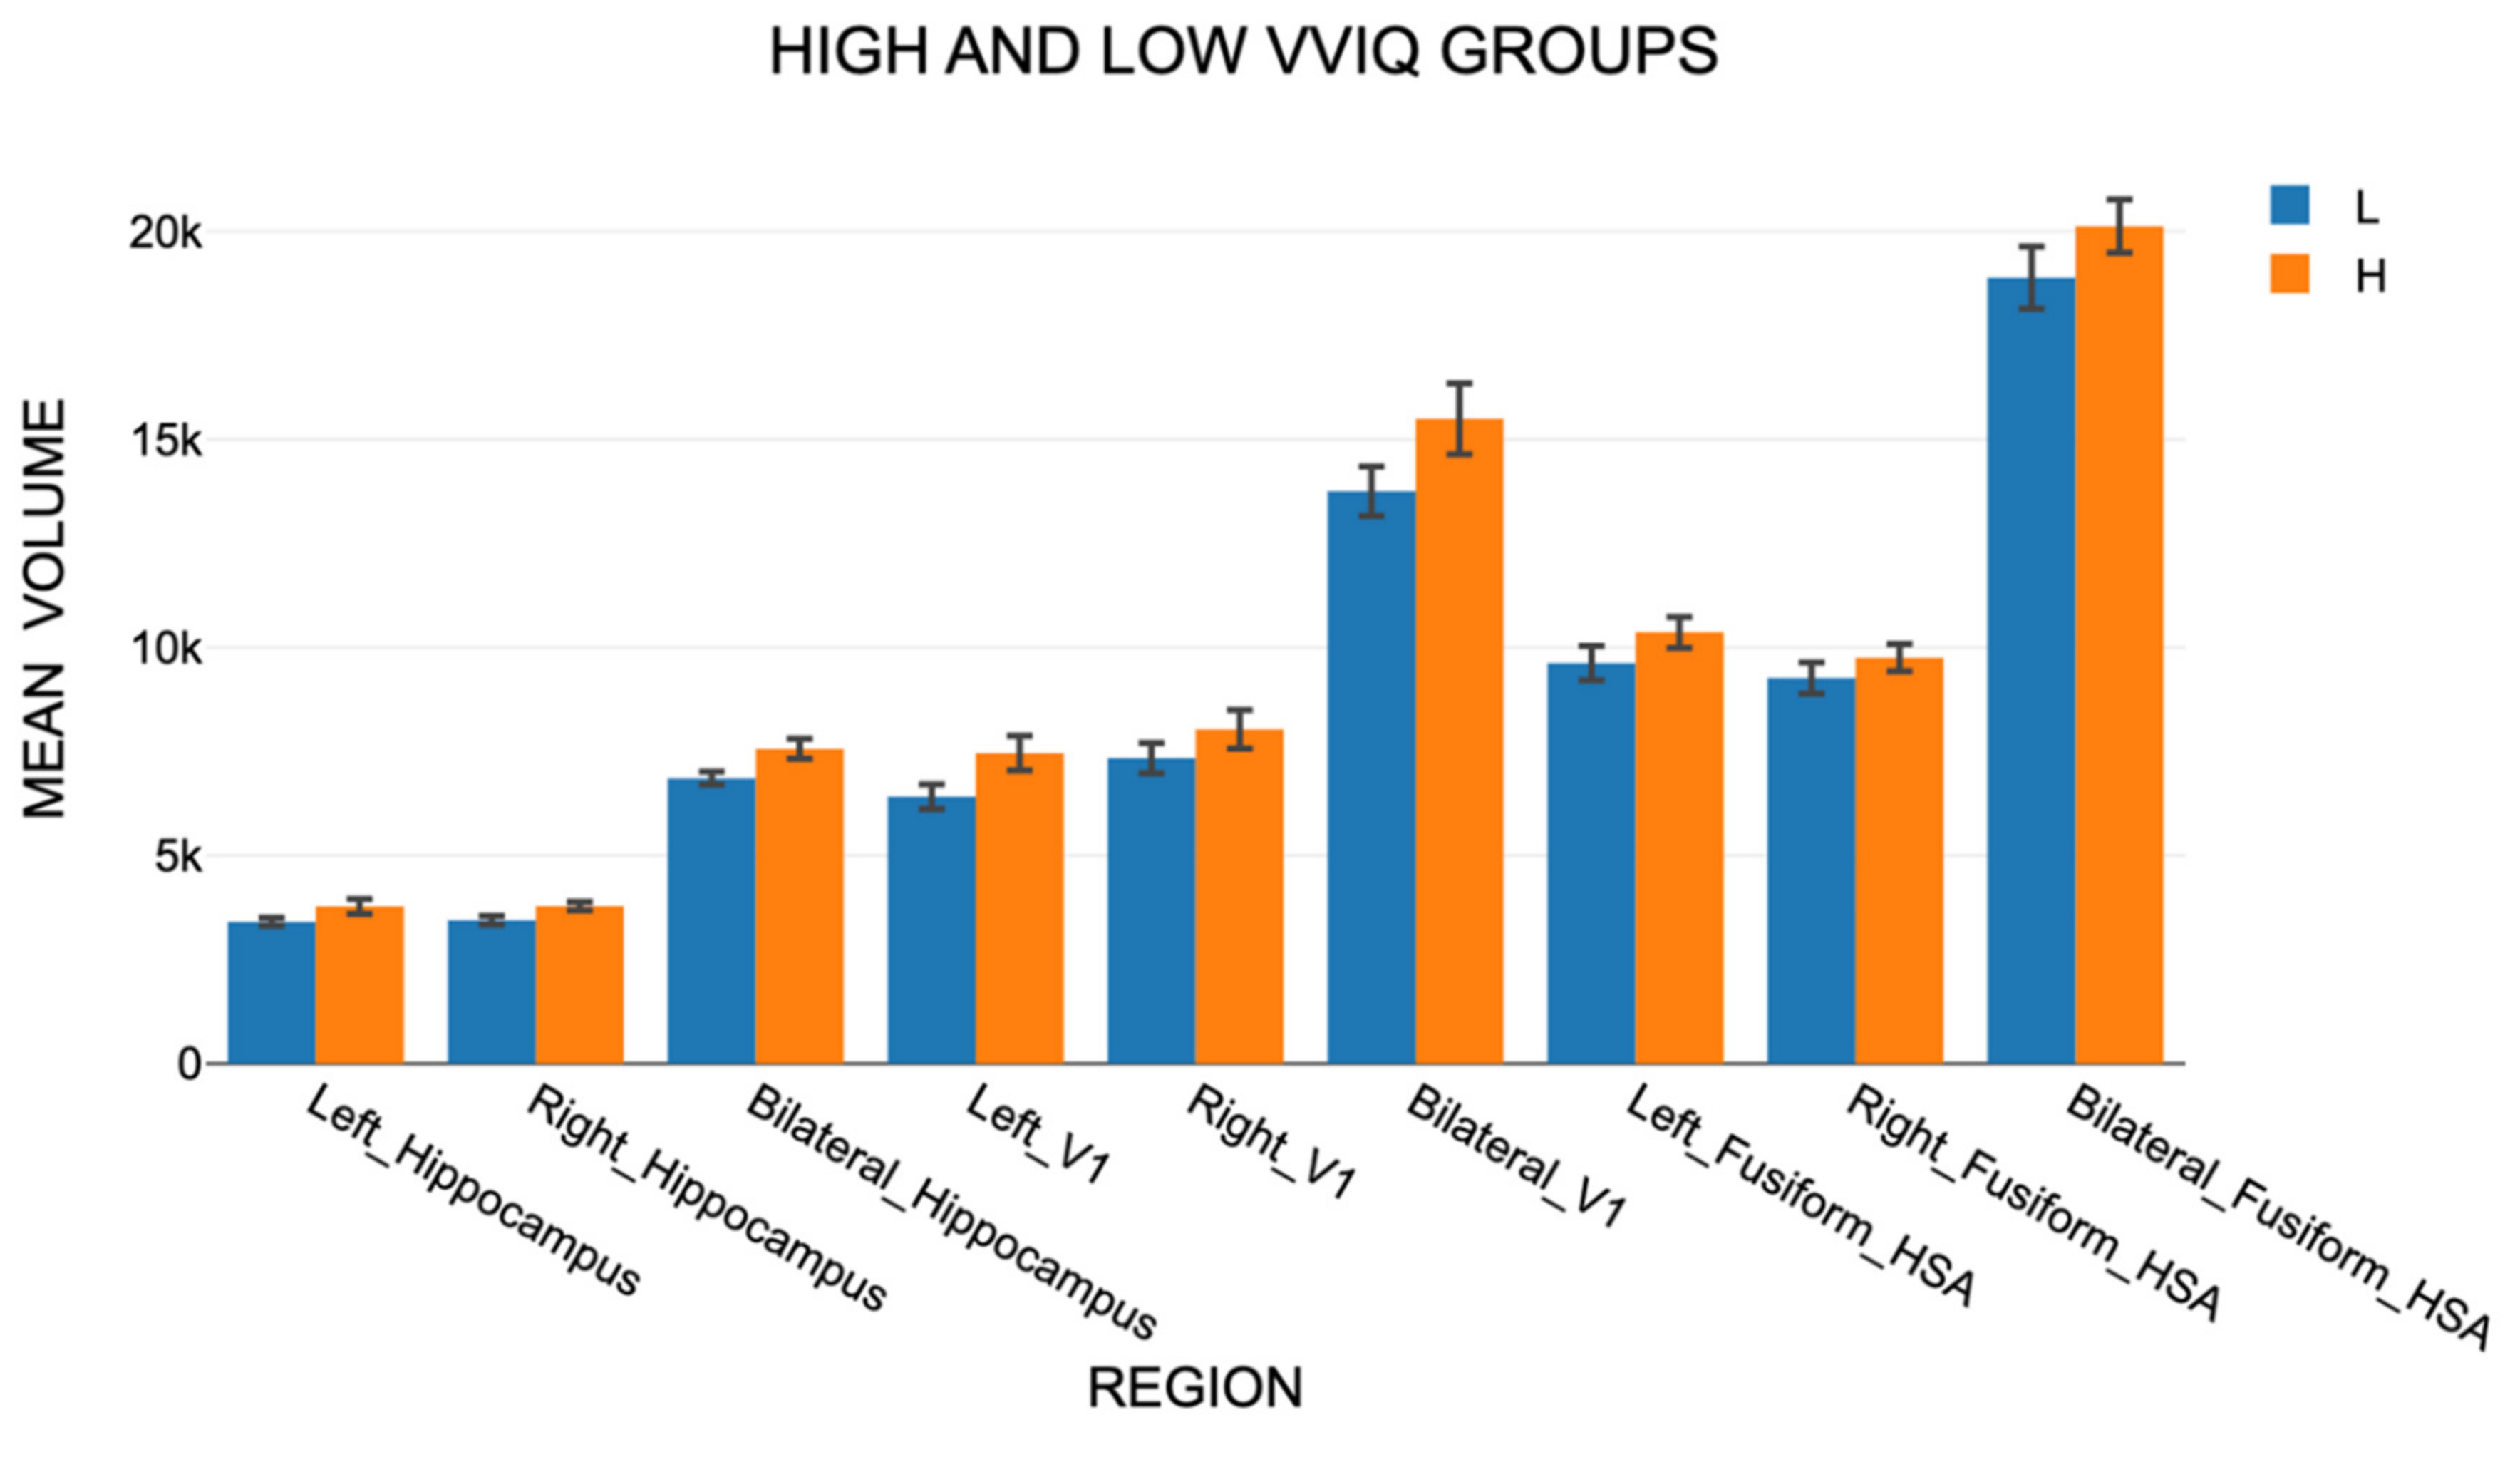
Figure 6.
Mean hippocampal subfield volumes for the Low and High VVIQ groups: Upper chart, females; Lower chart, males. Subfields 1-12 are as follows: 1, parasubiculum; 2, presubiculum; 3, subiculum; 4, CA1; 5, CA3; 6, CA4; 7, GC-ML-DG; 8, HATA; 9, fimbria; 10, molecular layer; 11, hippocampal fissure; 12, hippocampal tail. Vertical bars show one standard error.
| 1 | The methods, participants, data collection and curation used in the preparation of this article were contributed by Tabi et al. (2022) at the University of Oxford and are available at: https://osf.io/q37vn/ Full details are available at: https://www.sciencedirect.com/science/article/pii/S0010945221003488. Younes Adam Tabi kindly gave permission for this re-analysis but did not participate in the analyses or writing of this article. |
Disclaimer/Publisher’s Note: The statements, opinions and data contained in all publications are solely those of the individual author(s) and contributor(s) and not of MDPI and/or the editor(s). MDPI and/or the editor(s) disclaim responsibility for any injury to people or property resulting from any ideas, methods, instructions or products referred to in the content. |
© 2025 by the author. Licensee MDPI, Basel, Switzerland. This article is an open access article distributed under the terms and conditions of the Creative Commons Attribution (CC BY) license (http://creativecommons.org/licenses/by/4.0/).
Copyright: This open access article is published under a Creative Commons CC BY 4.0 license, which permit the free download, distribution, and reuse, provided that the author and preprint are cited in any reuse.


