
Submitted:
30 April 2025
Posted:
02 May 2025
You are already at the latest version
Abstract
Background: Occupational therapists are allied health professionals with educational training and capacity to address mental health (MH) needs and reduce MH workforce shortages worldwide. However, occupational therapists working in MH are often underrepresented within the MH and occupational therapy workforce.Aim: Using the perspective of occupational therapists with MH practice, the study aimed to: identify barriers/facilitators for occupational therapy practice in MH, and analyze whether responses vary by respondent- or country-level characteristics.Methods: Secondary ecological analysis of survey responses. The survey was developed and disseminated by the World Federation of Occupational Therapists, through its worldwide network. Ordinal logistic regressions analyzed whether individual- and country-level variables (e.g., demographic, socio-economic factors) affected the response pattern.Results: Survey responses (n= 1102) were obtained from 67 countries or territories. Of the surveyed factors, 66% were rated more often as current barriers for practice, such as: “waiting times”; “services funding”; “intervention costs”; and “therapists availability”. “Screening & referral” and having “training/preparation for MH” were practice facilitators. Response patterns did not substantially vary by respondent or country-related factors. A notable exception was for the Socio-Demographic Index which substantially and significantly affected the response pattern for “safety concerns”: estimate: 11.08; 95% CI:7.09-15.07; p<.0001.Conclusion: This paper reports on a large worldwide survey of occupational therapists on the facilitators/barriers for practice in MH; results can help inform how to strengthen practice in this field. While referral & screening mechanisms should be reinforced to facilitate access to occupational therapy, such actions need to be complemented with adequate service funding, career attractiveness, and therapist availability; otherwise, increased service demands may result in unmet needs and service constraints. Further research is needed to investigate why “safety concerns” was a reported barrier particularly for countries with a lower Socio Demographic Index.
Keywords:
occupational therapy
; occupational therapists
; mental health
; medically underserved area
; supply and distribution
; health services needs and demand
Introduction
Occupational therapists are allied health professionals who promote functional performance and occupational engagement for individuals or communities experiencing, or at risk of experiencing, physical, mental, and other impairments and disabilities [1]. Despite their key role, a global shortage of occupational therapists has been well-documented, particularly in low- and middle-income countries (LMICs) where the workforce is either underrepresented or absent [2,3]. Even in countries with better supply, there are significant inequities in the distribution of occupational therapists, including across practice areas. Mental health (MH) is one area where occupational therapy is often underrepresented [3,4]. For example, in the United States, only 2.2% of occupational therapists work in MH, making up just 0.2% of the total MH workforce, excluding physicians [5,6]. This proportion stands in stark contrast to the 59.3 million adults (23.1% of the population) in the U.S. who experience MH conditions [7]. Furthermore, approximately 122 million U.S. residents — about half of the population — live in areas with a shortage of MH professionals [8].
Globally, mental disorders continue to be among the top ten leading causes of disease burden, with no evidence of a decreasing trend [9]. In turn, MH workforce shortages continue to abound worldwide, requiring capacity building programs [10,11]. Despite this, occupational therapists dedicated to providing MH services remain scarce in many countries, when they are mapped at all [2,3,5]. For instance, although the World Health Organization's Global Health Observatory includes the indicator number of occupational therapists in the mental health sector (per 100,000 population) — acknowledging the role of the profession in the MH field, this indicator provides no data for any country. This contrasts sharply with the available data for psychiatric nurses, psychologists, and social workers [12].
Occupational therapists have a long history of working in MH contexts [13,14]. Their aims are to promote positive MH, prevent mental illness, and recover from MH challenges in order to lead to fulfilling lives [15]. People with mental health conditions often experience disruptions in their daily occupations [16]. Furthermore, MH is not merely the absence of mental illness; it includes positive psychological attributes, social functioning, and the ability to adapt to or cope with life’s challenges [16,17]. In their practice, occupational therapists focus on enhancing meaningful participation in daily activities—such as education, leisure, and work—particularly in real-world environments, when these are impacted by health conditions, including MH issues [18].
Overall, occupational therapists can be part of the solution to address MH workforce shortages worldwide [15,19,20,21], provided that structural barriers affecting demand, access, and practice are identified and addressed. Several reports have identified key barriers to the development, practice, and allocation of occupational therapists to MH care, including issues related to workforce supply, training, health systems, legal concerns, and financial constraints [15,19,20,22]. In the related health and rehabilitation field, similar types of barriers have been identified [23,24,25,26]. However, to our knowledge, there is no global, large-scale survey on the voices from the field (i.e., occupational therapists with experience working with people with MH conditions) regarding factors that positively or negatively influence the practice of occupational therapy in MH.
The World Federation of Occupational Therapists (WFOT) is committed to advancing the occupational therapy workforce worldwide. For example, WFOT has undertaken a multistage research, consultation, and development process to launch the first global strategy for this workforce [27,28]. One of the resulting strategies emphasizes the equitable distribution of occupational therapists, including for underserved practice areas such as in MH [28]. Aligned with this, the WFOT has also recently released a position statement on the need to strengthening occupational therapy in MH [20].
To further inform strategic initiatives aimed at strengthening occupational therapy practice in this underserved practice area, the WFOT conducted a global survey to explore factors that may be current barriers or facilitators for practice of occupational therapy in MH. Using the responses to that survey, the objectives of this study are:
1. To identify which factors are rated as more positively or negatively affecting the practice of occupational therapy with people with MH needs worldwide.
2. To analyze whether those responses vary significantly across individual-respondent characteristics and across country-level ecological variables, such as demographic, socio-economic, population health needs, and health spending indicators.
Methods
Overview
This study refers to a secondary ecological analysis of cross-sectional survey responses. The survey was conducted by the WFOT, as part of their program development activities, and distributed to their global contact list, including associated members and other network contacts. Participants provided consent for the analysis and public use of information they provided. After being de-identified by WFOT, survey responses were sent externally for secondary analysis, where they were combined with public-domain country-level factors; these were potential ecological predictors of country-level variability in the survey responses. A data-sharing agreement was established, a priori, between the WFOT and the Ohio State University: Agreement ID: A2024-2516.
Survey Design
Table 1 provides the nine factors of the survey rated as either positively or negatively affecting the practice of occupational therapy in MH. For each factor, the survey respondents provided one of the possible answers along a Likert-based scale (see table 1, last column). Altogether, the selected response outlined both the direction and magnitude of the impact of each surveyed item. Respondents provided “unknown” or “not applicable” answers if unable to appraise a given factor or if that factor was not applicable to their context.
The nine factors in table 1 (middle column) were collectively developed and selected by the WFOT team, based on their knowledge of occupational therapy practice and literature worldwide, including scoping reviews and stakeholder consultations for developing the first global strategy for this workforce [3,27,28,29]. Factors addressed such as funding or workforce availability were also prevalent in the occupational therapy and rehabilitation literature related to MH [15,19,20,22,23,24,25,26].
The survey, initially developed in English, was translated and disseminated by the WFOT in three additional languages (French, German, and Spanish). The respondents selected their language of choice, inputted their country or territory, and responded to socio-demographic questions (e.g., years of practice experience) before addressing the main survey questions.
Survey Procedures
In November of 2023, the WFOT used the Survey Monkey platform to send the survey to occupational therapists through a multi-pronged approach. Specifically, the survey link was sent to over 100 member organizations (e.g., countries or territories) who were asked to circulate it to their members. WFOT also circulated the link and information about the survey directly to occupational therapists using the WFOT e-newsletter (about 14,100 recipients) and their social media. The survey link was also posted on the home page of the WFOT website for the duration of the 6-week survey.
As explicit in the survey’s introduction, the survey targeted occupational therapists who were actively “involved with occupational therapy practice, education or research relating to people with mental health needs or conditions”, with a definition of those needs and conditions also provided [30]. We wanted voices from those who had at least a level of experience in this practice field versus occupational therapists only with experience with other practice fields. Those who self-identified on the online survey as occupational therapy researchers or educators were directed to different survey questions related to research and education, with responses not included in this analysis; here, the focus was on the factors affecting the “practice” as appraised by those in practice roles. Each participant was given six weeks to complete the survey, with notices regarding the survey sent in WFOT e-newsletters twice during this period.
Statistical Analysis
For the first study question, the researchers developed descriptive statistics and graphics of the Likert-based responses for each of the nine survey items. Data transformation involved assigning positive and negative weights to the responses: i.e., two points assigned to “high positive impact”; one to “low positive impact”; zero to “no impact”; one negative point to “low positive impact”; and two negative points to “high negative impact”.
For the second study question, we used inferential statistics: we ran ordinal logistic regression models, one for each of the nine survey items as the single dependent variable. For the initial models, the potential predictors (i.e., exploratory independent variables) were both individual-respondent and ecological variables. Table 3 identifies those variables, and their organization. Of note, the ecological data was obtained from various public domain global datasets, as derived from the country of each individual respondent. That public domain data was obtained by the external analysts during October 2024, and their selection was informed by a prior ecological study of the factors affecting the rehabilitation workforce supply and demand.[31] Supplementary table 1 reports which and how a minority of missing values for the ecological variables were handled (e.g., indicators not available for territories such as Hong Kong).

Table 2.
Variables potentially predicting variation in survey responses, organized by individual- and country-derived variables.
Table 2.
Variables potentially predicting variation in survey responses, organized by individual- and country-derived variables.
| Country-Lever Ecological Variables | ||
| Domain & Variable(s) | Year | Data Source |
| Geographies | ||
| REGION: World Regions | 2024 | World Bank. [32] |
| Demography | ||
| LAND SIZE: Territory Size (SqKm) | 2021 | Food and Agriculture Organization, electronic files and web site. [33] |
| POPULATION: Population Size (n) | 2023 | United Nations Population Division; Eurostat: Demographic Statistics. [34] |
| RURAL: Rural Population Percentage (%) | 2023 | World Bank.[35] |
| Socio-development and democracy | ||
| DEMOCRACY INDEX: Democracy Index | 2022 | Economist Intelligence Unit (2006-2023) – processed by Our World in Data [36] |
| SDI: Socio-Demographic Index | 2021 | Global Burden of Disease Study 2021 (GBD 2021) Socio-Demographic Index (SDI) 1950–2021. [37] |
| Economics (Income Level Indicators) | ||
| INCOME LEVEL: Income Level | 2024 | World Bank. [32] |
| GNI: Gross National Income (US$/capita) | 2022 | World Bank national accounts data, and OECD National Accounts data files. [38] |
| Health-Economic Indicators | ||
| GOVERNMENT FUNDED: Domestic General Government Health Expenditure (%) | 2021 | World Health Organization Global Health Expenditure database. [39] |
| EXPENDITURES: Current Health Expenditure Per Capita (US$/capita) | 2021 | World Health Organization Global Health Expenditure database. [40] |
| Population Needs | ||
| YLDs RATE: Years Lived with Disability Rate for Mental Disorders and Substance Disorders | 2021 | Global Burden of Disease. [41] |
| YLDs PERCENT: Years Lived with Disability Percent for Mental Disorders and Substance Disorders | 2021 | Global Burden of Disease. [41] |
| INDIVIDUAL-RESPONDENT socio-demographic variables: available from the survey | ||
| Years of work: Years of Experience Working in Occupational Therapy | ||
| MH service load: Volume of Work that Addresses People with Specific Mental Health Needs | ||
| Self-rated competency: Level of Preparation/Training to Work with People with Mental Health Heeds | ||
| Fieldwork in MH: Fieldwork/practice placement in mental health during education | ||
All the ordinal logistic regressions were run in the SAS Studio on Demand for Academics software, initially using all the potential predictors as possible explanatory variables. After retaining the results of those full models (supplementary table 2), we ran reduced models using only relevant subsets of the possible predictors to obtain more parsimonious models, with lower levels of multicollinearity. For the reduced models, we selected the explanatory variables that cumulatively had p< 0.10 and Variance Inflation Factor (VIF) < 5 (i.e., acceptable multicollinearity) in its preceding full model, in addition to any variables that were outright significant predictors (p< 0.05) in the full model - irrespective of VIF values. Then, using the reduced model (first version), we re-introduced, one by one, the outstanding variables into more comprehensive reduced models, until a “best fit” was achieved, i.e., our stopping rule. The best fit here was determined by the Akaike Information Criterion (AIC) value of the evolving models, which weights both prediction capacity and added complexity. Whenever a higher AIC value (i.e. worse fit) was found in an evolving reduced model, we would stop adding predictor variables at that point and retain the previous version and variables of the reduced model. We consider p< 0.05 as statistically significant but also as Bonferroni-corrected.
Results
We obtained responses from 1102 participants worldwide, all reporting some experience of working with people with MH needs. Most participants (56%) had >10 years of practice experience. Many responses (85%) came from high-income nations. A total of 58% of the responses came from Europe & Central Asia as a World Bank’s world region. However, responses were from 67 different countries or territories of seven world regions, which included 43 responses from a total of nine Sub-Saharan African countries. Regarding the language of the survey, most participants (57%) responded in English, whereas 22% completed the Spanish version.
1. Factors Rated as Positively or Negatively Affecting the Practice in MH
Figure 1 provides the non-weighted survey results, including the “no impact” answers, for each of the nine surveyed factors. “Screening & referral” was the factor more often rated with a “high positive impact” (37% of the respondents), while “service funding” was more frequently rated with “high negative impact” (29%). “Safety concerns” was more frequently rated as having “no impact” (42%), while “therapist availability” was rated has having “no impact” for only 11% of the respondents.
In turn, Figure 2 shows the weighted direction of these findings, after removing the “no impact” answers and providing a weight for the magnitude (i.e., ‘high impact’ counting twice vs ‘low impact’). For easier comparison, the figure also translates the findings into 100% stacked bars for each factor.
Figure 2 illustrates that most factors (66.6%; six out of nine) were rated more negatively than positively, with “waiting times” (63%), “service funding” (62%) and “intervention costs” (58%) respectively as those more frequently seen in negative light. On the other end, “screening & referral” and “training/preparation for MH” stood out as factors that positively influence the practice in MH. For instance, “screening & referral” had a positive weighted ratio of nearly 3:1 (74% vs 26%), followed by “training/preparation for MH” with nearly a 3:2 ratio (66% vs 34%).
Legend: Factors were weighted, ranked, and translated into 100% stacked bars. The values reflect a differential weight for the magnitude of the response direction (i.e., high negative’ impact answers counting 2x more than the ‘low negative’ responses for the red bar; ‘high positive’ impact counting 2x more than the ‘low positive’ responses for the green bar). The weighted results were then ranked, from the most positive to the most negative influence. Finally, the weighted, ranked results were translated into 100%-stack bars (i.e. sum of the red and green bar for the same item = 100%) for easier interpretation of whether each factor was seen as having a more positive (green bars with >50%) or negative influence (red bars with >50%).
2. How the Rated Factors Vary Across Respondent Contexts
Table 3 shows the best fit, reduced ordinal logistic regression models for how the responses to each rated factor varied according to respondent context, either individual- or country-level.
Among these models, only “screening & referral” had no explanatory value (p value of the whole model > 0.05). For the seven remaining, the whole models and some of possible predictors had significant, independent explanatory value – i.e., affected the response pattern. At the 95% confidence level, up to five possible predictors influenced the participant responses for the models on: “intervention costs” and “safety concerns”, dropping to up to three predictors for “safety concerns”. However, the magnitude of any of those significant associations were frequently low: the 95% confidence intervals contained values between -1 and 1.
One notable exception was identified. The socio-demographic index (SDI), a composite indicator of country development status, had a strong positive association with the direction of “safety concerns” responses (estimate: 11.08; 95% CI: 7.09-15.07, p <.0001) with the result that respondents from countries with lower SDI were more likely to report safety concerns as a barrier, and vice versa.
Discussion
This global survey study is the first to use voices from the field to identify factors that positively or negatively affect the practice of occupational therapy in MH. Screening & referral mechanisms and training/preparation for addressing MH needs stood out as practice facilitators. In turn, current waiting times, service funding, therapist availability, and intervention costs were more frequently rated as barriers. Importantly, these response trends were often similar across individual-respondent characteristics and country-level ecological variables. The notable exception was for the composite country development indicator SDI, highly affecting participants’ responses on the “safety concerns” item. All these findings are worth discussing.
Screening & referral mechanisms can positively affect a needs-based demand for occupational therapy by facilitating the role of other health professionals for making appropriate occupational therapy referrals [42,43,44,45]. Across countries, the history of MH as a practice field for occupational therapy widely varies, likewise the frequency of occupational therapists working in MH [3,4,13,15,19]. For contexts where established practices exist, greater awareness of the specific role of occupational therapy in MH may emerge among referral practitioners [22]. These can use formal or informal referral mechanisms, resulting in increased value, recognition, and demand for the profession. In contexts where occupational therapists do not have a widespread or historical practice in MH, formal rather than informal referral mechanisms will likely be needed to generate an initial needs-based demand.
Increases in service demand must be balanced with simultaneous measures for assuring response capacity. Factors like waiting times, service funding, therapist availability, intervention costs, and intervention time were all more often rated as negatively influencing the practice of occupational therapy in MH. If better screening & referral mechanisms lead to an expected and desirable increase in needs-based referrals for service, the resulting demand must be met by an improved supply and funding of occupational therapy in MH. With failure to do so, increases in referrals can result in service restraints such as decreased intervention time and longer waiting periods. In addition, occupational therapists may be left feeling busy, stressed and under pressure, without capacity to continuously provide quality service [46]. Such working conditions may, in turn, lead to job dissatisfaction, hampering MH workforce retention. For these reasons, strategies to strengthen the occupational therapy practice in MH need to be systems-based to address demand and supply workforce concerns simultaneously [27,47,48].
For improving occupational therapy supply in the MH field, the literature points to the need to promote legislation, advocacy, and funding changes to develop or reinforce the jurisdictional status of occupational therapists as qualified, recognized, and reimbursed MH providers [19,22]. Such activities should be complemented by strategies that add attractiveness of MH practice for occupational therapists. The existing occupational therapy workforce in MH may benefit from targeted recruitment or retention strategies and programs to improve engagement and job satisfaction, as well as development programs for early career MH occupational therapists [49,50,51]. For students as future workforce practitioners, enhanced educational content and greater exposure to MH content or fieldwork practice during entry-level education may also improve the likelihood of a future practice in this field [4,52,53,54]. Congruent with this recommendation, “training/preparation for MH practice” was one of the factors survey respondents viewed as often positively influencing the practice of occupational therapy in MH.
We observed that the pattern of the survey responses was often either not significantly or not substantially changed by respondent- or country-level characteristics. That reinforces the idea of being feasible to develop common, strategic directions for strengthening the occupational therapy practice in MH worldwide, if even then its specific implementation needs be context-sensitive and responsive to local situational assessment [3,28,55]. The results of this survey can be used for a stakeholder-engaged design and refinement of such strategic directions. For example, to address personal “safety concerns”, strategic recommendations should particularly target countries with a low SDI. In our descriptive results, the worldwide trend appeared to indicate this factor had a neutral impact, being neither facilitator nor barrier. However, through inferential analysis, it was determined that respondents from countries with lower SDI more often rated this factor as negatively affecting the practice of occupational therapy in MH, whereas those from countries with greater SDI tended to rate this factor in a more neutral or positive light. This finding suggests the need for further research to study how and why this factor negatively affects occupational therapy practice in MH in countries with lower SDI. For example, if findings are due to the interaction of compromised working, safety, and care conditions (within the context of cultural, stigma, educational, and other socio-ecological determinants [56,57,58,59]), tailored strategies can be designed accordingly to address the identified issues.
Of note, the SDI has been developed and used by the Global Burden of Disease study as an alternative to the traditional World Bank’s four income levels [60]. As this indicator combines information on the economy, education, and fertility rates of countries around the world, it has been more closely tied to health outcomes and used to stratify the Global Burden of Disease results per level of country development [60]. Here, we used several socio-economic and development indicators (e.g. gross national income, World Bank’s income levels) as possible predictors of response variations. However, only the SDI was a significant as well as substantive predictor of responses for one of the survey items. This finding can inform others about selecting (composite) indicators that can be most sensitive to detect country-level variations in responses to global surveys.
Limitations
This survey study has the following limitations. First, participants’ responses to the survey items addressed perceived barriers or facilitators and did not reflect objective measures of whether the rated factors were actual barriers or facilitators for occupational therapy practice in MH. Second, most survey responses came from high-income countries; yet, beyond a skewed sampling, that unbalance might reflect the global status and under-development of the profession in many LMICs – many with just a few or no occupational therapists [2,3]. Third, the lower representation of LMICs may have limited the statistical power to detect more significant differences for the ecological-level factors. Fourth, the inferential analysis involved country-level ecological variables, hence it was limited to participants that reported their country: a minority of the respondents (n= 3) did not identify their location; hence these three responses were excluded from the inferential analysis. Fifth, we had respondents from specific territories (e.g., Hong Kong) that had no territory-based values for some extracted ecological variables; those missing values were replaced by proxy estimates derived from countries or territories in the given world region with similar income level (supplementary table 1).
Conclusion
This paper reports on a large worldwide survey of occupational therapists regarding the factors that affect their practice in MH. The results identified barriers or facilitators that were rated in a similar pattern worldwide. Screening & referral mechanisms as well as training/preparation in MH were often rated as facilitators. Factors such as waiting times, therapist availability, intervention time, and funding were rated more often as barriers. Overall, activities that create demand for occupational therapy in MH, for example, developing screening and referral tools, should be introduced concurrently with measures that improve the workforce accessibility and supply to avoid unmet needs and service constraints. Personal safety issues were reported as a barrier for the practice of occupational therapy in MH but primarily only in countries with low SDI. This finding might be addressed by further research. Altogether, these findings inform the development of future global guidance on how to strengthen the practice of occupational therapy in MH worldwide.
Funding
No funding to declare.
Consent for publication
Not applicable.
Ethics approval and consent to participate
The internal data collection was run by the WFOT as part of and to inform their program development or quality improvement, not as a research activity. Nonetheless, informed consent was obtained in the following manner: all participants responded “Yes” to the following initial survey questions: “I understand that by sharing my personal data with WFOT, it will be used in accordance with the WFOT Privacy Policy: https://www.wfot.org/privacy-cookies”, and to “I consent to taking part in this survey and that my anonymized responses will be included in the aggregated dataset published by WFOT and publicly accessible.” Participants responded with their professional perspectives about the profession and although were ‘human’ respondents, their participation in the survey was not ‘human subjects’ research requiring ethical approval. Nonetheless, the above consent was taken, and the data was de-identified (e.g., removing email contact) before being shared with The Ohio State University. The country of the respondent was not removed to enable the ecological data extraction and analysis. A data-sharing agreement was established, a priori, between the WFOT and the Ohio State University: Agreement ID: A2024-2516.
Competing interests
None declared
Author Contributions Statement
TJ: Wrote the main manuscript text; conceptualized the analytical approach; co-developed the data-sharing agreement; PM: Extracted the ecological data and conducted the statistical analysis; RL: Conceptualized and conducted the data collection, co-developed the data-sharing agreement; CvZ: Conceptualized and conducted the data collection, co-developed the data-sharing agreement; All authors: reviewed the manuscript.
Availability of data and materials
The datasets supporting the conclusions of this article are included within the article (and its additional files). The supplementary file 3 contains a spreadsheet of the database used for the descriptive statistics and another one used for the inferential statistics which excluded three respondents with no country assigned. The supplementary file 4 provides the survey questions.
Acknowledgements
None
Abbreviations
| AIC | Akaike Information Criterion |
| MH | Mental Health |
| WFOT | World Federation of Occupational Therapists |
| SDI | Socio-Demographic Index |
References
- World Federation of Occupational Therapists. Defintions of occupational therapy from member organizations Online: 2013.
- World Federation of Occupational Therapists. Occupational Therapy Human Resources. Geneva: 2021.
- Jesus TS, Mani K, Bhattacharjya S, Kamalakannan S, von Zweck C, Ledgerd R. Situational analysis for informing the global strengthening of the occupational therapy workforce. Int J Health Plann Manage. 2023;38(2):527-35. Epub 20221220. [CrossRef] [PubMed]
- Jesus TS, Mani K, von Zweck C, Kamalakannan S, Bhattacharjya S, Ledgerd R, et al. Type of Findings Generated by the Occupational Therapy Workforce Research Worldwide: Scoping Review and Content Analysis. Int J Environ Res Public Health. 2022;19(9). Epub 20220427. [CrossRef] [PubMed]
- American Occupational Therapy Association. Workforce and salary survey Bethesda: AOTA; 2019.
- US Bureau of Labor Statistics. Occupational employment and wage statistics Washinghton, DC2023. Available from: https://www.bls.gov/oes/2022/may/naics5_621330.htm.
- National Institute of Mental Health. Mental Illness: NIH; 2024. Available from: https://www.nimh.nih.gov/health/statistics/mental-illness.
- Kaiser Family Foundation. Mental Health Care Health Professional Shortage Areas (HPSAs) 2024. Available from: https://www.kff.org/other/state-indicator/mental-health-care-health-professional-shortage-areas-hpsas/?currentTimeframe=0&sortModel=%7B%22colId%22:%22Percent%20of%20Need%20Met%22,%22sort%22:%22asc%22%7D.
- GBD 2019 Mental Disorders Collaborators. Global, regional, and national burden of 12 mental disorders in 204 countries and territories, 1990-2019: a systematic analysis for the Global Burden of Disease Study 2019. Lancet Psychiatry. 2022;9(2):137-50. Epub 20220110. [CrossRef] [PubMed]
- Endale T, Qureshi O, Ryan GK, Esponda GM, Verhey R, Eaton J, et al. Barriers and drivers to capacity-building in global mental health projects. Int J Ment Health Syst. 2020;14(1):89. Epub 20201203. [CrossRef] [PubMed]
- Kakuma R, Minas H, van Ginneken N, Dal Poz MR, Desiraju K, Morris JE, et al. Human resources for mental health care: current situation and strategies for action. Lancet. 2011;378(9803):1654-63. Epub 20111016. [CrossRef] [PubMed]
- The Global Health Observatory. Occupational therapists in mental health sector (per 100,000) 2019. Available from: https://www.who.int/data/gho/data/indicators/indicator-details/GHO/occupational-therapists-in-mental-health-sector-(per-100-000).
- Sedgwick A, Cockburn L, Trentham B. Exploring the mental health roots of occupational therapy in Canada: a historical review of primary texts from 1925-1950. Can J Occup Ther. 2007;74(5):407-17. [PubMed]
- Shepherd HA, Jesus TS, Nalder E, Dabbagh A, Colquhoun H. Occupational Therapy Research Publications From 2001 to 2020 in PubMed: Trends and Comparative Analysis with Physiotherapy and Rehabilitation. OTJR (Thorofare N J). 2024:15394492241292438. Epub 20241106. [CrossRef] [PubMed]
- Read H, Zagorac S, Neumann N, Kramer I, Walker L, Thomas E. Occupational Therapy: A Potential Solution to the Behavioral Health Workforce Shortage. Psychiatr Serv. 2024;75(7):703-5. Epub 20240207. [CrossRef] [PubMed]
- Krupa T, Fossey E, Anthony WA, Brown C, Pitts DB. Doing daily life: how occupational therapy can inform psychiatric rehabilitation practice. Psychiatr Rehabil J. 2009;32(3):155-61. [CrossRef] [PubMed]
- Galderisi S, Heinz A, Kastrup M, Beezhold J, Sartorius N. Toward a new definition of mental health. World Psychiatry. 2015;14(2):231-3. [CrossRef] [PubMed]
- American Occupational Therapy Association. Occupational Therapy Practice Framework: Domain and Process-Fourth Edition. Am J Occup Ther. 2020;74(Supplement_2):7412410010p1-p87. [CrossRef] [PubMed]
- Keptner K, Lambdin-Pattavina C, Jalaba T, Nawotniak S, Cozzolino M. Preparing for and Responding to the Current Mental Health Tsunami: Embracing Mary Reilly's Call to Action. Am J Occup Ther. 2024;78(1). [CrossRef] [PubMed]
- World Federation Of Occupational, T. POSITION STATEMENT: Occupational Therapy and Mental Health. 2019.
- Jesus TS, Landry MD, Dussault G, Fronteira I. Classifying and Measuring Human Resources for Health and Rehabilitation: Concept Design of a Practices- and Competency-Based International Classification. Phys Ther. 2019;99(4):396-405. [CrossRef] [PubMed]
- Wilburn VG, Hoss A, Pudeler M, Beukema E, Rothenbuhler C, Stoll HB. Receiving Recognition: A Case for Occupational Therapy Practitioners as Mental and Behavioral Health Providers. Am J Occup Ther. 2021;75(5). [CrossRef] [PubMed]
- Gréaux M, Moro MF, Kamenov K, Russell AM, Barrett D, Cieza A. Health equity for persons with disabilities: a global scoping review on barriers and interventions in healthcare services. Int J Equity Health. 2023;22(1):236. Epub 20231113. [CrossRef] [PubMed]
- Butura AM, Ryan GK, Shakespeare T, Ogunmola O, Omobowale O, Greenley R, et al. Community-based rehabilitation for people with psychosocial disabilities in low- and middle-income countries: a systematic review of the grey literature. Int J Ment Health Syst. 2024;18(1):13. Epub 20240314. [CrossRef] [PubMed]
- To Dutka J, Gans BM, Bracciano A, Bharadwaj S, Akinwuntan A, Mauk K, et al. Delivering Rehabilitation Care Around the World: Voices From the Field. Archives of Physical Medicine and Rehabilitation. 2023;104(9):1385-93. [CrossRef]
- Naicker AS, Htwe O, Tannor AY, De Groote W, Yuliawiratman BS, Naicker MS. Facilitators and Barriers to the Rehabilitation Workforce Capacity Building in Low- to Middle-Income Countries. Phys Med Rehabil Clin N Am. 2019;30(4):867-77. Epub 20190824. [CrossRef] [PubMed]
- Bhattacharjya S, Curtis S, Kueakomoldej S, von Zweck C, Russo G, Mani K, et al. Developing a Global Strategy for strengthening the occupational therapy workforce: a two-phased mixed-methods consultation of country representatives shows the need for clarifying task-sharing strategies. Hum Resour Health. 2024;22(1):62. Epub 20240905. [CrossRef] [PubMed]
- Jesus TS vZC, Bhattacharjya S, Mani K, Kamalakannan S, Ledgerd R. WFOT Global Strategy for the Occupational Therapy Workforce. Geneva: WFOT, 2024.
- Jesus TS, Mani K, von Zweck C, Bhattacharjya S, Kamalakannan S, Ledgerd R. The Global Status of Occupational Therapy Workforce Research Worldwide: A Scoping Review. Am J Occup Ther. 2023;77(3). [CrossRef] [PubMed]
- World Health Organization. Mental Health Atlas. Available from: https://www.who.int/publications/i/item/9789240036703.
- Jesus TS, Landry MD, Hoenig H, Dussault G, Koh GC, Fronteira I. Is Physical Rehabilitation Need Associated With the Rehabilitation Workforce Supply? An Ecological Study Across 35 High-Income Countries. Int J Health Policy Manag. 2022;11(4):434-42. Epub 20220401. [CrossRef] [PubMed]
- World Bank. World Bank Country and Lending Groups 2024 [October 25, 2024]. Available from: https://datahelpdesk.worldbank.org/knowledgebase/articles/906519-world-bank-country-and-lending-groups.
- World Bank. Land area (sq. km) 2021 [October 25, 2024]. Available from: https://data.worldbank.org/indicator/AG.LND.TOTL.K2.
- World Bank. Population, total 2023 [October 25, 2024]. Available from: https://data.worldbank.org/indicator/SP.POP.TOTL.
- World Bank. Rural population (% of total population) 2023 [October 25, 2024]. Available from: https://data.worldbank.org/indicator/SP.RUR.TOTL.ZS?end=2023&start=1960&view=chart.
- Our World in Data. Democracy index 2023 [October 25, 2024]. Available from: https://ourworldindata.org/grapher/democracy-index-eiu?tab=table#sources-and-processing.
- Institute for Health Metrics and Evaluation (IHME). Global Burden of Disease Study 2021 (GBD 2021) Socio-Demographic Index (SDI) 1950–2021 2021 [October 25, 2024]. Available from: https://ghdx.healthdata.org/record/global-burden-disease-study-2021-gbd-2021-socio-demographic-index-sdi-1950%E2%80%932021.
- World Bank. GNI per capita, Atlas method (current US$) 2023 [October 25, 2024]. Available from: https://data.worldbank.org/indicator/NY.GNP.PCAP.CD.
- World Bank. Domestic general government health expenditure (% of current health expenditure) 2021 [October 25, 2024]. Available from: https://data.worldbank.org/indicator/SH.XPD.GHED.CH.ZS.
- World Bank. Current health expenditure per capita (current US$) 2021 [October 25, 2024]. Available from: https://data.worldbank.org/indicator/SH.XPD.CHEX.PC.CD?view=chart.
- Institute for Health Metrics and Evaluation (IHME). Global Burden of Disease 2021 [October 25, 2024]. Available from: https://www.healthdata.org/research-analysis/gbd.
- Mao HF, Chang LH, Tsai AY, Huang WN, Wang J. Developing a Referral Protocol for Community-Based Occupational Therapy Services in Taiwan: A Logistic Regression Analysis. PLoS One. 2016;11(2):e0148414. Epub 20160210. [CrossRef] [PubMed]
- Heasman D, Morley M. Introducing Prioritisation Protocols to Promote Efficient and Effective Allocation of Mental Health Occupational Therapy Resources. British Journal of Occupational Therapy. 2012;75(11):522-6. [CrossRef]
- Ige JJ, Hunt DF. Quality improvement project to improve the standardisation and efficiency of occupational therapy initial contact and assessment within a mental health inpatient service. BMJ Open Quality. 2022;11(4):e001932. [CrossRef]
- Loubani K, Polo KM, Baxter MF, Rand D. Identifying Facilitators of and Barriers to Referrals to Occupational Therapy Services by Israeli Cancer Health Care Professionals: A Qualitative Study. Am J Occup Ther. 2024;78(1). [CrossRef] [PubMed]
- Royal College of Occupational Therapists. Occupational therapy under pressure: Workforce survey findings 2022–2023. Report, Royal College of Occupational Therapy UK; 2023.
- Carey G, Malbon E, Carey N, Joyce A, Crammond B, Carey A. Systems science and systems thinking for public health: a systematic review of the field. BMJ Open. 2015;5(12):e009002. Epub 20151230. [CrossRef] [PubMed]
- Jesus TS, Landry MD, Dussault G, Fronteira I. Human resources for health (and rehabilitation): Six Rehab-Workforce Challenges for the century. Hum Resour Health. 2017;15(1):8. Epub 20170123. [CrossRef] [PubMed]
- Mertala SM, Kanste O, Keskitalo-Leskinen S, Juntunen J, Kaakinen P. Job Satisfaction among Occupational Therapy Practitioners: A Systematic Review of Quantitative Studies. Occup Ther Health Care. 2022;36(1):1-28. Epub 20210819. [CrossRef] [PubMed]
- Scanlan JN, Meredith P, Poulsen AA. Enhancing retention of occupational therapists working in mental health: relationships between wellbeing at work and turnover intention. Aust Occup Ther J. 2013;60(6):395-403. Epub 20130901. [CrossRef] [PubMed]
- Foster F, Palexas S, Hitch D. Early career programs for mental health occupational therapists: A survey of current practice. Aust Occup Ther J. 2022;69(3):255-64. Epub 20220104. [CrossRef] [PubMed]
- Scanlan JN, Pépin G, Haracz K, Ennals P, Webster JS, Meredith PJ, et al. Identifying educational priorities for occupational therapy students to prepare for mental health practice in Australia and New Zealand: Opinions of practising occupational therapists. Aust Occup Ther J. 2015;62(5):286-98. Epub 20150507. [CrossRef] [PubMed]
- Scanlan JN, Meredith PJ, Haracz K, Ennals P, Pépin G, Webster JS, et al. Mental health education in occupational therapy professional preparation programs: Alignment between clinician priorities and coverage in university curricula. Aust Occup Ther J. 2017;64(6):436-47. Epub 20170629. [CrossRef] [PubMed]
- Dillon MB, Dillon TH, King RM, Chamberlin JL. Interfacing with Community Mental Health Services: Opportunities for Occupational Therapy and Level II Fieldwork Education. Occup Ther Health Care. 2007;21(1-2):91-104. [CrossRef] [PubMed]
- Al Imam MH, Jahan I, Das MC, Muhit M, Akbar D, Badawi N, et al. Situation analysis of rehabilitation services for persons with disabilities in Bangladesh: identifying service gaps and scopes for improvement. Disabil Rehabil. 2022;44(19):5571-84. Epub 20210627. [CrossRef] [PubMed]
- Heim E, Henderson C, Kohrt BA, Koschorke M, Milenova M, Thornicroft G. Reducing mental health-related stigma among medical and nursing students in low- and middle-income countries: a systematic review. Epidemiol Psychiatr Sci. 2019;29:e28. Epub 20190401. [CrossRef] [PubMed]
- Javed A, Lee C, Zakaria H, Buenaventura RD, Cetkovich-Bakmas M, Duailibi K, et al. Reducing the stigma of mental health disorders with a focus on low- and middle-income countries. Asian J Psychiatr. 2021;58:102601. Epub 20210213. [CrossRef] [PubMed]
- Murray LK, Skavenski S, Bass J, Wilcox H, Bolton P, Imasiku M, et al. Implementing Evidence-Based Mental Health Care in Low-Resource Settings: A Focus on Safety Planning Procedures. J Cogn Psychother. 2014;28(3):168-85. [CrossRef] [PubMed]
- Russo G, Jesus TS, Deane K, Osman AY, McCoy D. Epidemics, Lockdown Measures and Vulnerable Populations: A Mixed-Methods Systematic Review of the Evidence of Impacts on Mother and Child Health in Low-and Lower-Middle-Income Countries. Int J Health Policy Manag. 2022;11(10):2003-21. Epub 20211107. [CrossRef] [PubMed]
- GBD 2021 Diseases and Injuries Collaborators. Global incidence, prevalence, years lived with disability (YLDs), disability-adjusted life-years (DALYs), and healthy life expectancy (HALE) for 371 diseases and injuries in 204 countries and territories and 811 subnational locations, 1990-2021: a systematic analysis for the Global Burden of Disease Study 2021. Lancet. 2024;403(10440):2133-61. Epub 20240417. [CrossRef] [PubMed]
Figure 1.
Non-weighted results, including the “no impact” answers, of factors affecting the practice in mental health.
Figure 1.
Non-weighted results, including the “no impact” answers, of factors affecting the practice in mental health.
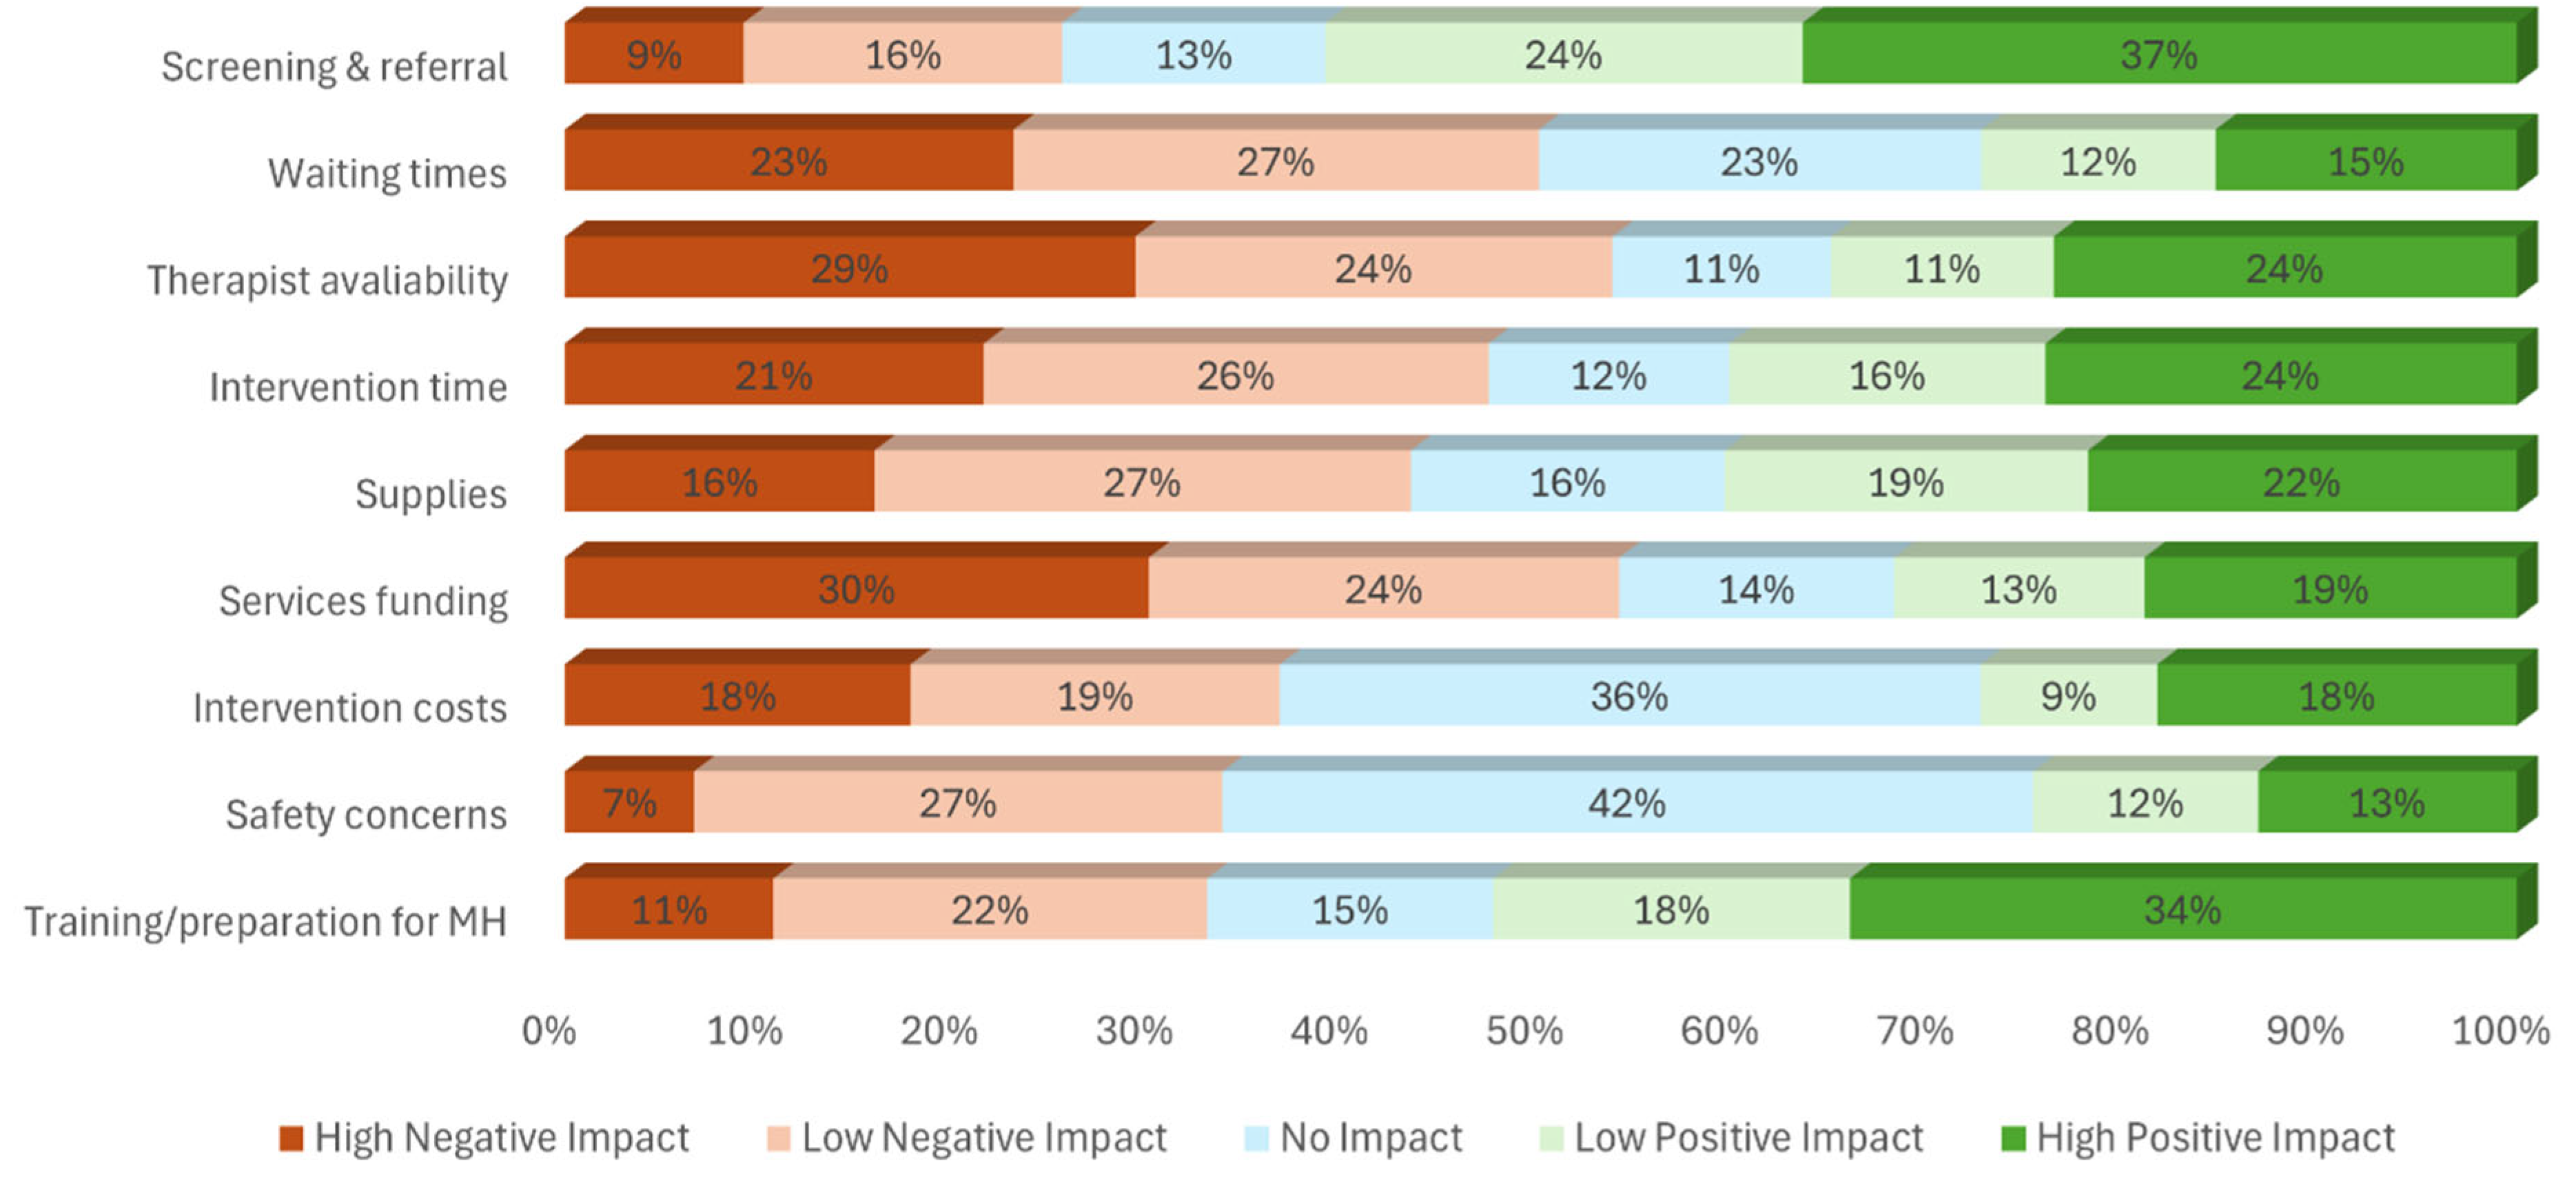
Figure 2.
How each factor had more positive and negative influence for the practice in mental health.
Figure 2.
How each factor had more positive and negative influence for the practice in mental health.
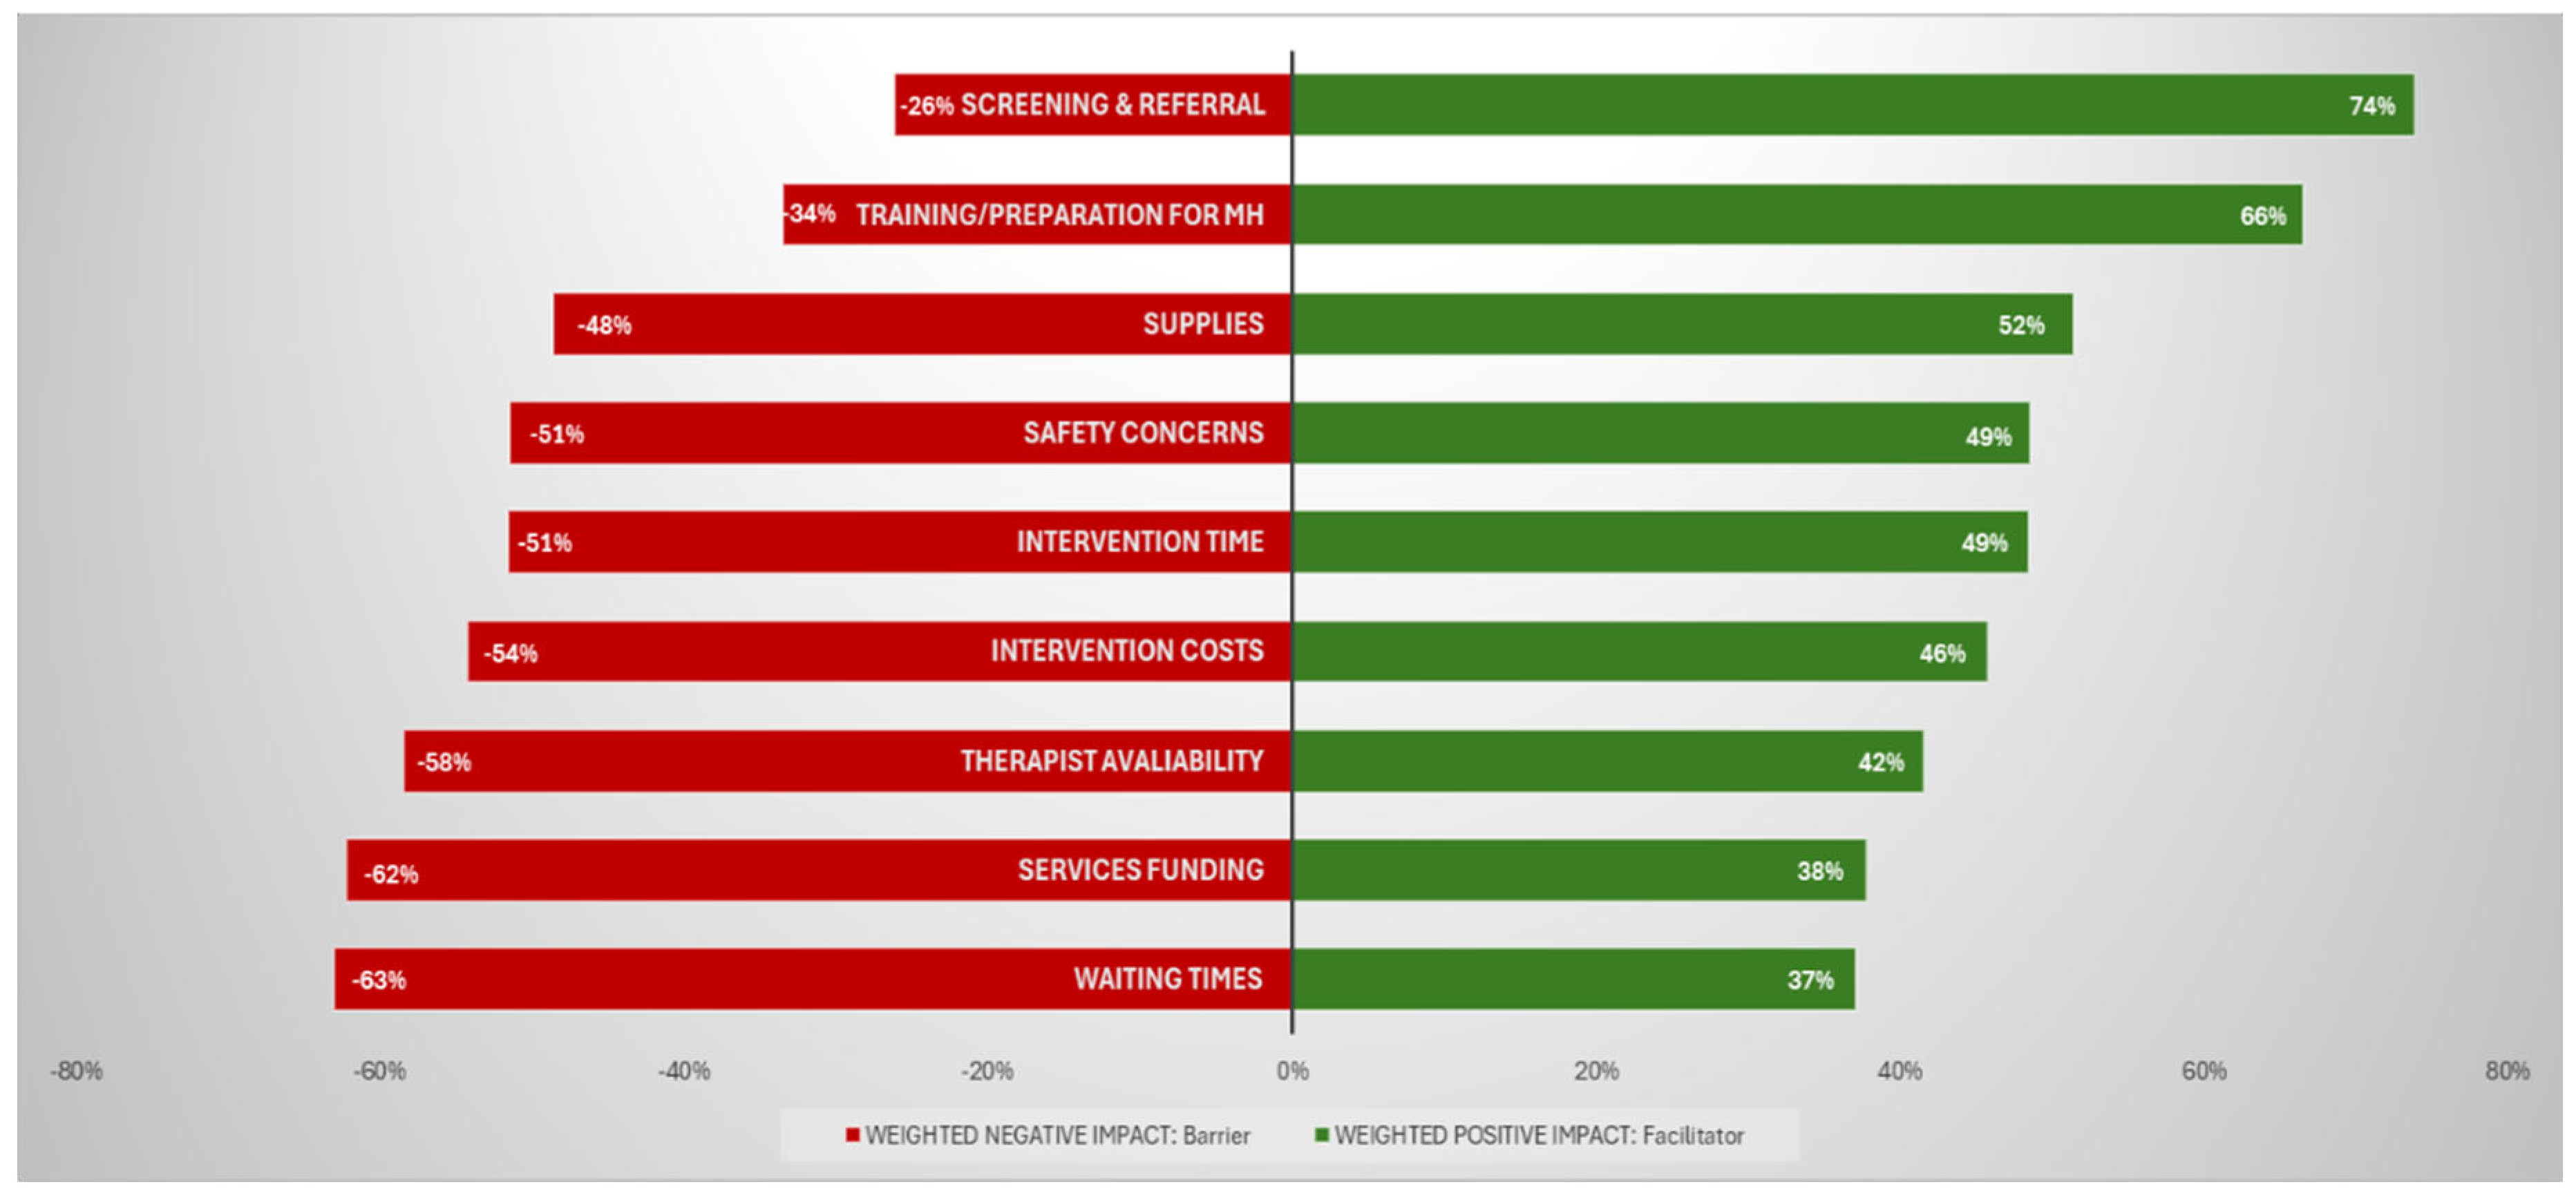
Table 1.
Survey questions and Likert-type of answers for the factors affecting the practice in mental health.
Table 1.
Survey questions and Likert-type of answers for the factors affecting the practice in mental health.
| Question (common trunk) | Survey items: List of factors affecting the practice in mental health to be rates | Possible Rates |
| Please rate the degree to which the following factors affect your ability to provide quality occupational therapy services for people with mental health needs: | Screening & referral: Screening and referral mechanisms to identify people needing occupational therapy | - “High Negative Impact” - “Low Negative Impact” - “No Impact” “Low Positive Impact” - “High Positive Impact” OR - “Unknown” - “Not applicable” |
| Waiting times: Wait time for occupational therapy intervention | ||
| Therapist availability: Availability of occupational therapists | ||
| Intervention time: Availability of time to provide needed intervention | ||
| Supplies: Availability and suitability of equipment / supplies | ||
| Services funding: Funding for occupational therapy services | ||
| Intervention costs: costs of occupational therapy intervention for the user | ||
| Safety concerns: Personal safety concerns | ||
| Training/preparation for MH: Training/preparation to provide occupational therapy for people with mental health needs |
Table 3.
Best fit reduced ordinal logistic regression models for each of the eight survey items as single independent variables.
Table 3.
Best fit reduced ordinal logistic regression models for each of the eight survey items as single independent variables.
|
Survey Item (whole-model p value) |
Predictor | VIF | Estimate | 95% CI | P value | |
| Screening & referral (0.0607) |
Years of work | 1.00 | 0.0742 | -0.0029 | 0.1513 | 0.0594 |
| Waiting times (0.0021*) |
POPULATION | 1.11 | -3.76E-10 | -1E-09 | 2.46E-10 | 0.2357 |
| SDI | 1.88 | -3.2539 | -5.0493 | -1.4584 | 0.0004** | |
| DEMOCRACY | 2.02 | 0.1424 | -0.0085 | 0.2934 | 0.0644 | |
| YLDs PERCENT | 1.05 | -4.4543 | -9.6735 | 0.7648 | 0.0944 | |
| MH service load | 1.02 | -0.1244 | -0.2557 | 0.0070 | 0.0634 | |
| Therapist availability (0.0002*) |
INCOME | 1.00 | -0.0638 | -0.2650 | 0.1374 | 0.5343 |
| LAND | 1.00 | 6.54E-08 | 3.12E-08 | 9.95E-08 | 0.0002** | |
| Years of work | 1.00 | 0.0859 | 0.0132 | 0.1586 | 0.0205* | |
| Intervention time (0.0004*) |
LAND | 1.04 | 6.27E-08 | 2.87E-08 | 9.66E-08 | 0.0003** |
| GOVERNMENT | 1.04 | 0.0093 | 0.0010 | 0.0177 | 0.0291* | |
| Services funding (0.0002*) |
REGION | 1.64 | 0.0630 | -0.0321 | 0.1582 | 0.1943 |
| POPULATION | 1.32 | -8.53E-10 | -1.5E-09 | -1.6E-10 | 0.0158* | |
| LAND | 1.49 | 7.11E-08 | 2.95E-08 | 1.13E-07 | 0.0008** | |
| SDI | 1.78 | -2.0354 | -3.7459 | -0.3250 | 0.0197* | |
| GOVERNMENT | 1.87 | 0.0119 | 0.0004 | 0.0234 | 0.0417* | |
| MH service load | 1.01 | -0.0991 | -0.2284 | 0.0303 | 0.1334 | |
| Fieldwork in MH | 1.05 | 0.1573 | -0.0381 | 0.3526 | 0.1146 | |
| Intervention Costs (<.0001*) |
INCOME | 2.31 | -0.4692 | -0.7867 | -0.1516 | 0.0038** |
| POPULATION | 1.38 | -5.87E-10 | -1.3E-09 | 1.13E-10 | 0.1003 | |
| LAND | 1.47 | 5.21E-08 | 7.65E-09 | 9.66E-08 | 0.0216* | |
| DEMOCRACY | 1.88 | -0.1010 | -0.2500 | 0.0481 | 0.1845 | |
| YLDs RATE | 1.86 | 0.0005 | 0.0002 | 0.0008 | 0.0039** | |
| MH service load | 1.01 | -0.1510 | -0.2917 | -0.0102 | 0.0355* | |
| Fieldwork in MH | 1.03 | 0.2397 | 0.0302 | 0.4493 | 0.0249* | |
| Safety concerns (<.0001*) |
INCOME | 6.47 | -1.3219 | -1.8594 | -0.7845 | <.0001** |
| SDI | 8.64 | 11.0802 | 7.0913 | 15.0692 | <.0001** | |
| DEMOCRACY | 1.93 | -0.1249 | -0.2754 | 0.0256 | 0.1038 | |
| EXPENDITURES | 4.05 | -0.0001 | -0.0002 | 0.0000 | 0.0098* | |
| GOVERNMENT | 2.37 | 0.0120 | -0.0013 | 0.0254 | 0.0773 | |
| YLDs RATE | 2.45 | 0.0009 | 0.0005 | 0.0012 | <.0001** | |
| Years of work | 1.02 | -0.0911 | -0.1695 | -0.0127 | 0.0227* | |
| Fieldwork in MH | 1.06 | 0.1845 | -0.0199 | 0.3889 | 0.0768 | |
| Training/preparation for MH (<.0001*) | INCOME | 1.79 | -0.1004 | -0.3673 | 0.1665 | 0.4610 |
| GOVERNMENT | 1.78 | -0.0096 | -0.0207 | 0.0015 | 0.0911 | |
| Years of work | 1.07 | 0.1032 | 0.0275 | 0.1790 | 0.0075** | |
| Preparation | 1.06 | 0.1542 | -0.0096 | 0.3179 | 0.0650 | |
| Fieldwork in MH | 1.03 | -0.2778 | -0.4670 | -0.0885 | 0.004** | |
Legend: *Statistically significant with 95% confidence** Statistically significant also after Bonferroni correction. VIF= Variance Inflation Factor. Variables in italic refer to individual-level variables while those in CAPS are country-level. Note: A reduced model for a ninth factor (“supplies”) is not reported here; no single possible predictor was significant or eligible to be included into a reduced model: see full regression models (supplementary table 2).
Disclaimer/Publisher’s Note: The statements, opinions and data contained in all publications are solely those of the individual author(s) and contributor(s) and not of MDPI and/or the editor(s). MDPI and/or the editor(s) disclaim responsibility for any injury to people or property resulting from any ideas, methods, instructions or products referred to in the content. |
© 2025 by the authors. Licensee MDPI, Basel, Switzerland. This article is an open access article distributed under the terms and conditions of the Creative Commons Attribution (CC BY) license (http://creativecommons.org/licenses/by/4.0/).
Copyright: This open access article is published under a Creative Commons CC BY 4.0 license, which permit the free download, distribution, and reuse, provided that the author and preprint are cited in any reuse.


