Submitted:
30 April 2025
Posted:
30 April 2025
You are already at the latest version
Abstract
We present the creation of an alignment layer for liquid crystal molecules based on DNA from fish waste and a selected cationic surfactant. The implemented biodegradable DNA-based surface offers excellent optical and physical properties, cost-effectiveness, and environmental benefits compared to conventional polymers. Our findings demonstrate that the biopolymer DNA-DODA effectively induces homeotropic alignment of nematic liquid crystals, which was confirmed by topography visualization using atomic force microscopy, macroscopy and polarizing optical microscopy observations. Anchoring energy and response time studies in the well-known electro-optical effect show that DNA-DODA exhibits molecular interaction strengths comparable to those of commercial polyimide. The successful implementation of DNA-DODA as an alignment layer highlights its promise for next-generation technologies, including flexible, sustainable, and biocompatible optical devices.
Keywords:
liquid crystal
; biointerface
; biopolymer
; anchoring energy
; DNA
1. Introduction
Aquatic food is a crucial source of protein for human consumption. Depending on the species and processing methods, about 20 to 80% of the total fish body can be considered fish waste [1]. Food and Agriculture Organization (FAO) reported in 2022 that total fisheries and aquaculture production will reach 15% by 2030 [2]. Mainly farmed Atlantic salmon has been one of the significant contributors to growth in the global trade of fisheries and aquaculture products in recent decades. Additionally, FAO is committed to the Blue Transformation strategy as a vision for sustainably transforming aquatic food systems, a recognised solution for food and nutrition security and the environment by preserving aquatic ecosystem health, reducing pollution, protecting biodiversity, and promoting social equality [2]. Fish waste is out of the reutilization process but landfilled, incinerated, and discharged into the sea. Those disposal methods can create secondary pollution, like an environmental burden and a severe economic crisis. There is a real need to find environmentally acceptable ways of reusing fish waste [3].
One of the possibilities for utilising fish waste by-products is related to synthesising biopolymers, which can be functionalised for specific photonic applications [4]. Advances in producing biopolymers through chemical, microbial, or enzymatic processes increase their acceptability for commercial usability. The utilisation of fish waste as a bio-based polymer has remarkable potential due to its non-toxic, biocompatibility, and biodegradable nature. It has gained a wide audience as a sustainable alternative to petroleum-based polymers. The global production of biopolymers from various organic wastes is expected to rise to 7.5 million tonnes in 2026, and by 2050, global production is predicted to triplicate [5,6,7].
Commercial polymers are high-functional materials used in specific technological areas, particularly microelectronics applications, semiconductors, and displays. The manufacturing technology of many optical devices is based on the thin polymer alignment layer for organic molecules. The alignment layer is considered thin film, but the global quantity of produced electronic displays is crucial in that technology. Further, the increasing demand for commercial displays across a wide range of sectors is driving the growth of the retail display market. Infrastructure development, industrialisation, and urbanisation are key factors governing the growth of the global commercial display market, which is expected to be around USD 297 billion by 2030 and expand by 7.35% from 2022 [8]. Polyimides (PI) comprising highly polarised moieties and electron-withdrawing groups show a high refractive index and good transparency with a high potential for such optoelectronic devices but not produced by environmentally friendly methods [9]. Therefore, it is essential to obtain polyimide based on non-toxic, bio-renewable raw materials and less toxic conditions for synthesising this type of polymer.
The excellent candidates for substituting PI layers are biopolymers, such as deoxyribonucleic acid (DNA) [10,11]. This specific biopolymer is under intensive research for many applications, especially outside the biological field of interest [12,13,14,15]. Some of the research is concentrated on the form of DNA-cationic surfactant complexes [16,17,18]. The structure consists of a single or double strand of DNA and different surfactants attaching, through electrostatic interactions, to a negatively charged phosphate residue. DNA complexes are considered essential materials for numerous applications in photonics and organic molecular electronics [19], including devices based on nonlinear optical effects [20], organic lasers [21], and promising materials in organic light emitting devices (OLEDs) as electron blocking layers [22]. In our investigations, we have already demonstrated that the raw DNA and DNA complex can stabilise the alignment of mesogenic molecules [12,23,24]. From our perspective, the crucial point was to find an appropriate surfactant and obtain the DNA-based biopolymer alignment layer with the same aligning properties as commercial polyimides. Therefore, the new biopolymer based on DNA and dioctadecyl dimethylammonium (DODA) was studied as a homeotropic alignment layer for liquid crystal devices.
The biopolymer complex was synthesized using a straightforward procedure, and its structural and surface properties were analyzed using multiple experimental techniques including atomic force microscopy (AFM), Fourier-transform infrared (FTIR) spectroscopy, Raman spectroscopy, contact angle and surface energy measurements, as well polarizing optical microscopy. The alignment properties of the DNA-DODA layer were evaluated through electro-optical studies by measuring threshold voltages, anchoring energy, and response times, and its performance was compared to that of a commercial polyimide alignment layer (SE-1211). The presented results demonstrate that the DNA-DODA complex provides effective homeotropic alignment of LC molecules, with anchoring energy and response times comparable to those of traditional polyimides. The material stability and effectiveness in directing light propagation confirmed that the biopolymer is suitable for photonic devices including waveguides, displays, and biosensors.
2. Materials and Methods
2.1. DNA and Surfactant
DNA is considered a linear and unbranched biopolymer whose monomers are deoxyribonucleotides. It consists of biopolymer strands of sugar and phosphate molecules coiled around each other to form a helix linked by hydrogen-bonded base pairs. DNA sodium salt – fabricated from the waste product of the salmon fishing industry, was chosen as a biopolymer source. The claimed molecular weight of DNA sodium salt from Acros Organics was MW = 50.000 – 100.000 Daltons (Da) with purity higher than 96%. The DNA sodium salt layer is too sensitive to water, shows insufficient mechanical strength resistance, and is incompatible with LC devices’ typical fabrication processes. Therefore, we modified the DNA structure using a selected surfactant to make the biopolymer layer more suitable for the production of optoelectronic devices.
The cationic surfactant - dimethyldioctadecylammonium chloride (CAS Number: 107-64-2, molecular weight of 586.5 g/mol) named DODA, with purity higher than 97%, purchased from Sigma-Aldrich Co., was chosen to modify DNA sodium salt. This surfactant was chosen because of a characteristic amphiphilic structure crucial for the synthesis process with DNA sodium salt. DNA forms a complex with a cationic surfactant, such as DODA, using electrostatic interactions between the negatively charged phosphoric acid residue in DNA and the positively charged nitrogen atom in the surfactant. The sodium salt of DNA in an aqueous solution has a negative charge and quickly forms a complex with the cationic surfactant. Both the sodium salt of DNA and the cationic surfactant are soluble in water. In the first step, the surfactant molecule binds via electrostatic interactions with the phosphate residues of the DNA structure, and then the surfactant groups are aligned along the DNA structure due to the strong hydrophobic interactions between the surfactant groups as presented in Figure 1. The resulting DNA-surfactant complex is not soluble in water.
2.2. Synthesis of Biopolymer
The synthesis of the biopolymer DNA-DODA was done on the procedure described earlier [25]. DNA sodium salt and the DODA surfactant were dissolved in equal amounts (by weight) in deionised water. Then, the DODA solution was added to the DNA sodium salt solution drop-by-drop on a magnetic stirrer. The precipitated DNA-DODA complex was filtered from solutions, dried at room temperature, and dissolved in butanol (3%).
2.3. Liquid Crystal
The created biodegradable DNA-DODA polymer was used to align liquid crystal molecules. The liquid crystals (LCs) are self-organised compounds that were used in this research as the optically active medium [26]. LC as a type of soft matter combines crystalline-like solid ordering with fluid-like behaviour and is attracted to many display and photonic devices technology [27].
A nematic liquid crystal is a specific compound with an achiral phase representing a purely orientational order of elongated molecules desired for homeotropic or planar aligning. To verify a proper alignment layer of biopolymer complex, an 1832 nematic mixture (synthesized at the Military University of Technology) with negative dielectric anisotropy of Δε = -1.1 at frequency 1 kHz, was used. This mixture exhibits good properties beneficial for photonic with optical anisotropy Δn = 0.23 (at 589 nm, 20°C) and short switching times in the order of milliseconds. The mixture consists of 1-alkoxy-4-[(4-alkyl phenyl)ethynyl] benzene and 2,3-difluoro-1-alkoxy-4-[(4-alkyl phenyl)ethynyl] benzene with a different alkoxy- and alkyl chain lengths. Those compounds are represented by the general formulas presented in Figure 2.
2.4. Preparation of the Alignment Layer
A typical testing cell for alignment layer properties comprises two sandwiched glass plates covered by an indium tin oxide (ITO) conductive layer and a thin polymer aligning layer. The properties of the polymer layer surface dictate the LC molecules preferred orientation at the interface by some specific agent: dipolar interactions, chemical bonding, Van der Waals interactions, steric factors, and surface topographies [28]. To obtain a durable biopolymer alignment layer, the same fabrication procedure was used for cells with the commercial polyimide alignment layer as for DNA-DODA. The DNA-DODA complex was spin-coated onto a glass/ITO substrate at a speed of 3500 rpm for 30 seconds. The coating was then annealed to evaporate the solvent at a temperature of 135°C for 90 minutes. In the next step, two substrates were glued together. To control the cell thickness 5µm glass spacers were used. Nematic liquid crystal at the isotropic phase was injected into the cell by capillary forces.
2.5. Atomic Force Microscopy
The Atomic Force Microscopy (AFM) technique was implemented to visualise the topography of three types of materials: DNA sodium salt, DODA, and DNA-DODA. The research was done using Bruker’s Dimension Icon AFM system. Before the investigation, a silicon AC200TS scanning probe (Olympus) was installed, and its drive frequency (ca. 139 kHz) was calibrated using the Auto-Tune built-in function. The probe operated in Tapping Mode at room temperature (21°C) and a relative air humidity of approximately 38%. Topographical images were recorded over three randomly selected areas for each sample. These images were used for a qualitative description of the tested surfaces, and subsequently, based on these images, a quantitative analysis of the average roughness parameter Ra was performed using Gwyddion software (ver. 2.56).
2.6. Spectroscopy
The Attenuated Total Reflectance Fourier Transform Infrared Spectroscopy (ATR FT-IR, ALPHA FT-IR Spectrometer, Bruker Optics, Germany) was used to characterise DNA sodium salt, DODA, and DNA-DODA. The spectra were recorded using a diamond crystal within a wavenumber range of 400-4000 cm−1 with a resolution of 2 cm−1 from 24 scans. The spectra are average spectra from 5 random points on the surface of each sample. The spectra were imported via OPUS software (Bruker, Germany).
The Raman spectra of DNA sodium salt, DODA, and DNA-DODA were acquired using a Renishaw inVia Reflex Raman microscope (Renishaw Plc) equipped with an EMCCD detector (Andor Technology Ltd.). The measurements were carried out using laser radiation with a wavelength of 532 nm, laser power of ca. 10 mW, and Leica objective lens 100x. The other measurement parameters were the acquisition time of 1 second and 20 accumulations at each point. The Raman spectra were acquired from at least 100 points. The spectrometer was calibrated using an internal silicon wafer. All collected spectra were processed in WiRE 5.5 software and then averaged using CasaXPS software.
2.7. Contact Angle Measurements
Contact angle (CA) measurements were made using a Mobile Surface Analyzer (MSA) from Krüss company. The static sessile drop method was used for two liquids water (polar liquid) and diiodomethane CH2I2 (non-polar liquid). The volume of each drop was 2 µL. In addition, the surface free energy (SFE) was determined using the Owens, Wendt, Rabel, and Kaelble (OWRK) model [29]. The OWRK model divides SFE into two components: dispersive and polar. Wettability and surface free energy parameters were collected from at least 12 points.
2.8. Electro-Optics
Electrooptical measurements were carried out to confirm that the fabricated biopolymer film can be used with success in photonic devices as an alignment layer. In the experiment, the LC cells were placed between the crossed analyser and polariser of the polarizing optical microscope (POM). To investigate the change in the intensity of light passing through the cell white light with an optical filter of 589 nm as the incident light source was used. An AC electric field (0-20 V, 1 kHz, sinusoidal wave) was applied to the cells by a function generator (Hewlett-Packard 33120A) and monitored by an oscilloscope (Hewlett-Packard 346013). The light intensity was recorded using a linear optical detector. The capacitance of the cells was measured using the impedance analyser (Hewlett-Packard 4284A) at a constant frequency of 1.5 kHz. All electrooptical measurements were conducted at room temperature (23°C).
3. Results
The FTIR spectrum of DNA, DODA, and DNA-DODA layers is depicted in Figure 3 showing several distinct vibration bands. The bands visible in the pure DNA spectrum have been reported in the literature as characteristic features [30]. Notably, a broad absorption band spanning 3000–3400 cm−1 can be attributed to various molecular vibrations, including N-H stretching modes, C=N vibrations, and O-H symmetric and antisymmetric stretching modes. Compared to the pure DNA spectrum, the following absorption bands appear in the DNA-DODA spectrum: 2915 and 2850 cm−1. These bands correspond to symmetric and asymmetric stretching C-H vibrations of the -CH2 and -CH3 groups, which is in complete agreement with the band present in the spectrum of pure surfactant (DODA). It should also be noted that the visible bands at 3371 and 3446 cm−1 (O-H stretching modes) in the DODA spectrum are evidence of the presence of water remaining after the layer formation process.
Raman spectra of DNA, DODA, and DNA-DODA complex are presented in Figure 4. The green areas indicate characteristic bands from the DODA surfactant. The peaks observed at ca. 2840-2970, 2730, 1450, 1300, 1090, and 475 cm-1 correspond to symmetric CH2 and CH3 groups stretching, symmetric CH3 stretching, CH deformation vibration, (CH2)n deformation vibration, C-N deformation vibration, and -C-C- skeletal vibration, respectively. These peaks completely agree with the bands observed in the FT-IR spectrum, which is a complementary method for studying molecular oscillations. The presence of these peaks in both the DODA and the DODA-DNA spectra confirms that the DODA surfactant has indeed bound to the DNA in the DNA-DODA sample.
The topography visualisation of the biopolymer alignment layer, by the AFM microscope, is presented in Figure 5. The pristine DODA sample is composed of terrace-like topography with subsequent flat layers lying on each other (Figure 5A). However, the DNA and DNA-DODA samples (Figure 5B, C) were generally characterised by similar, homogenous topography without specific attributes. Qualitative analysis was further justified with roughness estimation based on recorded AFM images. The DODA sample was described as the roughest among all tested materials, with a Ra parameter of 3.87 ± 0.73 nm. DNA sample and composite DNA-DODA were characterised by much smoother surfaces with Ra parameters of 0.21 ± 0.01 nm and 0.42 ± 0.01 nm. It should be underlined that the DNA-DODA surface was approximately twice as rough as the pristine DNA surface. Increased roughness of the DNA-DODA surface reduces the wettability of the alignment layer. This in turn will increase the contact angle and modify the surface energy of the studied layers.
Figure 6 and Figure 7 show the contact angle measurements for water and diiodomethane, respectively. In each case, the highest contact angle was obtained for the DNA-DODA complex. While the lowest CA was calculated for the hydrophilic DODA surfactant layer. The addition of DODA surfactant increased the hydrophobic properties of DNA and significantly reduced the surface free energy value of the DNA-DODA complex. The dominance of the dispersive component in the surface energy value over the polar component indicates that the investigated biopolymer is hydrophobic. The detailed results are presented in Table 1.
The usefulness of the biopolymer DNA-DODA as an alignment layer was tested in the electronically controlled birefringence effect (ECB) [31]. In the ECB effect, the liquid crystal director n, which describes the average molecular direction, is oriented homeotropically in the absence of the electric field. The director is perpendicular to the glass substrates. The dark state under the polarizing optical microscope is visible because the effective refractive index of LC is the same for all incident polarization components. Applying the electric field to the liquid crystal material with negative dielectric anisotropy (Δε < 0) causes changing the orientation of the optical axis to the planar structure. The bright state is observed under crossed polarizers. The birefringence Δn change of the LC medium leads to phase retardation, causing interference effects that selectively allow certain wavelengths to pass, creating voltage-dependent colour variations.
Figure 8 shows the macroscope images of the homeotropically aligned liquid crystal cell by using the DNA-DODA alignment layer at different applied voltages. The director is homeotropically aligned since it shows a perfect dark state at 0 V (even after rotating the cell). The application of relatively small electric voltages (2-8 V) causes the appearance of a colored texture, typical of the ECB effect.
The quality of liquid crystal ordering was confirmed using the orthoscopic and conoscopic modes of POM. Conoscopic observations confirm perfect homeotropic ordering by observing the classical “Maltese cross” due to symmetrical interference (Figure 9A) [32]. After applying voltage, non-uniform textures can be observed in Figure 9B-F. The presented textures are typical for the nematic phase and show that liquid crystal molecules arrange themselves in a random direction under the influence of an electric field.
In the next step, we checked whether the cells prepared using the biopolymer and conventional polyimide would switch equally under the influence of the applied voltage and whether they would be equally susceptible to the action of an electric field. The phenomenon of director switching is called a Frederick transition and it takes place when the value of the external electric voltage exceeds a minimum so-called threshold voltage Vth [33]. From the light transmittance measurement of the liquid crystal cell under the applied voltage V, the phase retardation R can be obtained from the following formula [34]:
where I0 is the incident light intensity and I is the intensity of light coming out of the cell between crossed polarizers. In the experiment, the optical axis of the homeotropically aligned cell with negative dielectric anisotropy liquid crystal is oriented at 45° with respect to the polarizer. Figure 9 shows the voltage-dependent retardation change at λ = 589 nm and T = 23°C. The behaviour of the electrooptical response is similar for the cells made with the commercial polyimide SE-1211 (Figure 10a) and the biopolymer DNA-DODA (Figure 10b) and as ordering alignment layers. At voltages below the threshold voltage value Vth, the molecular orientation of LC becomes undistributed, and no phase retardation is observed. The change of molecular orientation starts at the Vth. The threshold voltage value was determined from the extrapolation method [35]. From Figures 10A and 10B, Vth is found to be 1.96 V and 2.01 V for SE-1211 and DNA-DODA, respectively. The results confirm that biopolymer DNA-DODA does not cause a significant increase of Vth. The small difference between the values is at the level of measurement error. We observed a slight deviation from the perfect homentropic alignment in the case of the commercial alignment layer because the transition threshold is not very sharp. In the case of DNA-DODA material, the pretilt angle is close to 90°. The slight voltage differences in the electrooptical characteristics for both alignment layers are probably due to differences in the anchoring energies of the LC molecules on both orientation layers.
To further analyze the electro-optical properties of the studied materials, we calculated the polar anchoring energy W of homeotropic cells using biopolymer DNA-DODA and polyimide SE-1211. The anchoring energy is a crucial parameter for liquid crystal-based photonics devices. It influences not only the orientation of molecules on the surface but, above all, the threshold voltage and the on and off response times. Based on the voltage V-dependent capacity C and retardation R of light passing through the liquid crystal cell we precisely determined W.
The anchoring energy can be determined from the slope of a plot (R/R0 -1)CV as a function of CV, where R0 is maximum phase retardation. Figure 11A and 11B present the linear slope fitting method obtained for the DNA-DODA and SE-1211 cells, respectively. The results indicate a good linear fit. The plot is the linear function in a specific voltage regime from around 7 to 13 V. Calculation of the slope coefficient of straight lines allowed to determine the W parameter, taking into account the bend elastic constant K33 = 8.6 pN of 1832 and thickness of the measuring cell d [36]. For the 5 μm thick cell prepared using the commercial rubbed polyimide SE-1211, W is calculated to be 1.22∙10-5 J/m2. The obtained anchoring strength for the biopolymer DNA-DODA is W=1.47∙10-5 J/m2, in 4.6 μm thick cell. Comparing these two values, it can be seen that the anchoring energy for both investigated materials is very similar. From the point of view of the molecular interactions between the studied surfactants and the polar molecules of the liquid crystal, there is no significant difference between DNA-DODA and SE-1211.
The anchoring energy is a critical factor in determining the time response of liquid crystals. Therefore, LC switching times were measured in the next step of the study. Figure 12 shows the electro-optical characteristics of LC cells with DNA-DODA and a commercial SE-1211 alignment layer. These characteristics determined the turn-off times (i.e., the time during which the LC cell transmission changes from 90% to 10% after the electric field pulse disappears). The turn-off times were measured at the first transmission peak (i.e., δ=π), V= 2.5V (1 kHz, square signal). The switching on time is the same (ton = 1 ms) for all investigated cells because the switching mechanism in the ECB effect depends mainly on the applied electric field [27]. While the turn-off mechanism is related to the liquid crystal medium and alignment layer properties. Based on the time’s response measurements, it can be concluded that the turn-off times were toff = 10 ms for the cell with DODA-DNA layers and toff = 13 ms for the cell with SE-1211 layers, respectively. The experiments show that the liquid crystal cell with the DNA-DODA alignment layer possesses a comparable response time to the commercially available cell. Therefore, based on the presented studies we proved that the DNA-DODA complex can be successfully used in liquid crystal transducers.
4. Conclusions
The proposed biopolymer complex from fish waste was simply synthesized and showed availability as an alignment surface promotes for alignment of LC molecules. The DNA-DODA complex as an alignment surface promotes a vertical alignment of LC molecules, which are perpendicular to the surface and maintain the stable orientation of neighbouring molecules. Our research has proven that a DNA-based complex could be a good alternative for LC materials as a non-conventional alignment layer for developing photonic devices. Additionally, such biopolymers show environmentally required properties such as biodegradability and biocompatibility. The results open the way to further research on using biological materials in liquid crystal devices that can be used in advanced photonics.
Author Contributions
R. Węgłowski: writing, visualization, data curation, investigation; M. Mrukiewicz: writing, visualization, data curation, investigation; D. Węgłowska: investigation, resources, visualization; A. Chlanda methodology, data curation; M. Liszewska - methodology, investigation, data curation; B. Bartosewicz – methodology, data curation; A. Spadło: conceptualisation, supervision, writing, - original draft;
Funding
This research was funded by the Military University of Technology, grant numbers UGB 22-026 (LC and biopolymer investigation – 70%) and UGB 531-000030-W900-22 (electro-optical performance – 30%). The APC was funded by the Military University of Technology.
Informed Consent Statement
Not applicable.
Data Availability Statement
Data supporting reported results are available from the corresponding author upon reasonable request.
Acknowledgments
The authors acknowledge the contribution of Natalia Szostek, a student at the Military University of Technology, Warsaw, Poland, for her assistance during the research.
Conflicts of Interest
The authors declare that they have no known competing financial interests or personal relationships that could have appeared to influence the work reported in this paper.
Abbreviations
The following abbreviations are used in this manuscript:
AFM – Atomic Force Microscopy
ATR FT-IR – Attenuated Total Reflectance Fourier Transform Infrared Spectroscopy
CA – Contact Angle
DODA – Dimethyldioctadecylammonium Chloride
DNA – Deoxyribonucleic Acid
ECB – Electrically Controlled Birefringence
FTIR – Fourier Transform Infrared Spectroscopy
ITO – Indium Tin Oxide
LC – Liquid Crystal
OLED – Organic Light Emitting Device
POM – Polarizing Optical Microscopy
Ra – Average Surface Roughness
SFE – Surface Free Energy
Vth – Threshold Voltage
References
- Ivanovs, K.; Spalvins, K.; Blumberga, D. Approach for modelling anaerobic digestion processes of fish waste. Energy Procedia 2018, 147, 390–396. [Google Scholar] [CrossRef]
- FAO. The State of World Fisheries and Aquaculture 2022. Food and Agriculture Organization of the United Nations 2022. [Google Scholar] [CrossRef]
- Arun, K.B.; Madhavan, A.; Sindhu, R.; Binod, P.; Pandey, A.; R, R.; Sirohi, R. Remodeling agro-industrial and food wastes into value-added bioactives and biopolymers. Industrial Crops and Products 2020, 154, 112621. [Google Scholar] [CrossRef]
- Vogler-Neuling, V.V.; Saba, M.; Gunkel, I.; Zoppe, J.O.; Steiner, U.; Wilts, B.D.; Dodero, A. Biopolymer Photonics: From Nature to Nanotechnology. Advanced Functional Materials 2024, 34, 2306528. [Google Scholar] [CrossRef]
- European Bioplastics, e.V.; European Bioplastics e.V. n.d. Available online: https://www.european-bioplastics.org/ (accessed on 11 February 2025).
- Gautam, K.; Vishvakarma, R.; Sharma, P.; Singh, A.; Kumar Gaur, V.; Varjani, S.; Kumar Srivastava, J. Production of biopolymers from food waste: Constrains and perspectives. Bioresource Technology 2022, 361, 127650. [Google Scholar] [CrossRef] [PubMed]
- Sharmila, G.; Muthukumaran, C.; Kumar, N.M.; Sivakumar, V.M.; Thirumarimurugan, M. Food waste valorization for biopolymer production. In Current Developments in Biotechnology and Bioengineering; Elsevier: Amsterdam, The Netherlands, 2020; pp. 233–249. [Google Scholar] [CrossRef]
- Precedence Research. Semiconductor and Electronic Report Code:1981. Precedence Research 2023. Available online: https://www.precedenceresearch.com/displays-market (accessed on 28 April 2025).
- Rusu, R.D.; Abadie, M.J.M. New High-Performance Materials: Bio-Based, Eco-Friendly Polyimides. In Polyimide for Electronic and Electrical Engineering Applications; Diaham, S., Ed.; IntechOpen: London, UK, 2021. [Google Scholar] [CrossRef]
- Steckl, A.J. DNA—A new material for photonics? Nature Photonics 2007, 1, 3–5. [Google Scholar] [CrossRef]
- Steckl, A.J.; Spaeth, H.; You, H.; Gomez, E.; Grote, J. DNA as an Optical Material. Optics & Photonics News 2011, 22, 34–39. [Google Scholar] [CrossRef]
- Węgłowski, R.; Spadło, A.; Węgłowska, D. Banana DNA derivatives as homeotropic alignment layers in optical devices. Soft Matter 2024, 20, 8561–8569. [Google Scholar] [CrossRef]
- Stasiewicz, K.A.; Bereski, W.; Jakubowska, I.; Kowerdziej, R.; Węgłowska, D.; Spadło, A. The Biopolymer Active Surface for Optical Fibre Sensors. Polymers 2024, 16, 2114. [Google Scholar] [CrossRef]
- Kuzyk, A.; Jungmann, R.; Acuna, G.P.; Liu, N. DNA Origami Route for Nanophotonics. ACS Photonics 2018, 5, 1151–1163. [Google Scholar] [CrossRef]
- Dunn, K.E.; Elfick, A. Harnessing DNA Nanotechnology and Chemistry for Applications in Photonics and Electronics. Bioconjugate Chemistry 2023, 34, 97–104. [Google Scholar] [CrossRef] [PubMed]
- Nowak, E.; Wisła-Świder, A.; Khachatryan, G.; Fiedorowicz, M.; Danel, K. Possible sensor applications of selected DNA–surfactant complexes. European Biophysics Journal 2019, 48, 371–381. [Google Scholar] [CrossRef]
- Eskilsson, K.; Leal, C.; Lindman, B.; Miguel, M.; Nylander, T. DNA–Surfactant Complexes at Solid Surfaces. Langmuir 2001, 17, 1666–1669. [Google Scholar] [CrossRef]
- Liu, K.; Zheng, L.; Ma, C.; Göstl, R.; Herrmann, A. DNA–surfactant complexes: self-assembly properties and applications. Chemical Society Reviews 2017, 46, 5147–5172. [Google Scholar] [CrossRef]
- Rau, I.; Grote, J.G.; Kajzar, F.; Pawlicka, A. DNA—novel nanomaterial for applications in photonics and in electronics. Comptes Rendus Physique 2012, 13, 853–864. [Google Scholar] [CrossRef]
- Mircea, M.; Manea, A.; Kajzar, F.; Rau, I. Tuning NLO Susceptibility in Functionalized DNA. Advanced Optical Materials 2016, 4, 271–275. [Google Scholar] [CrossRef]
- Kawabe, Y. DNA-based dye lasers: progress in this half a decade. Proceedings of SPIE DNA Photonics, San Diego, CA, USA; 2016; p. 992806. [Google Scholar] [CrossRef]
- Islam, A.; Shah, S.H.U.; Haider, Z.; Imran, M.; Amin, A.; Haider, S.K.; Li, M.-D. Biological Interfacial Materials for Organic Light-Emitting Diodes. Micromachines 2023, 14, 1171. [Google Scholar] [CrossRef] [PubMed]
- Spadło, A.; Bennis, N.; Węgłowski, R.; Węgłowska, D.; Czuprynski, K.; Otón, J.M. Biopolymer as alignment layer for liquid crystal mixtures. Molecular Crystals and Liquid Crystals 2017, 657, 56–65. [Google Scholar] [CrossRef]
- Marć, P.; Bennis, N.; Spadło, A.; Kalbarczyk, A.; Węgłowski, R.; Garbat, K.; Jaroszewicz, L.R. Monochromatic Depolarizer Based on Liquid Crystal. Crystals 2019, 9, 387. [Google Scholar] [CrossRef]
- Grote, J.G.; Diggs, D.E.; Nelson, R.L.; Zetts, J.S.; Hopkins, F.K.; Ogata, N.; Hagen, J.A.; Heckman, E.; Yaney, P.P.; Stone, M.O.; Dalton, L.R. DNA Photonics [Deoxyribonucleic Acid]. Molecular Crystals and Liquid Crystals 2005, 426, 3–17. [Google Scholar] [CrossRef]
- Dunmur, D.; Toriyama, K.; Demus, D.; Goodby, J.; Gray, G.W.; Spiess, H.-W.; Vill, V. Optical Properties. In Handbook of Liquid Crystals; Wiley-VCH Verlag GmbH: Weinheim, Germany, 1998; pp. 215–230. Available online: http://onlinelibrary.wiley.com/doi/10.1002/9783527619276.ch7ca/summary (accessed on 8 February 2016).
- Hirschmann, H.; Reiffenrath, V.; Demus, D.; Goodby, J.; Gray, G.W.; Spiess, H.-W.; Vill, V. Applications, TN, STN Displays. In Handbook of Liquid Crystals; Wiley-VCH Verlag GmbH: Weinheim, Germany, 1998; pp. 199–229. Available online: http://onlinelibrary.wiley.com/doi/10.1002/9783527619276.ch3hb/summary (accessed on 8 February 2016).
- Kahn, F.J.; Taylor, G.N.; Schonhorn, H. Surface-produced alignment of liquid crystals. Proceedings of the IEEE 1973, 61, 823–828. [Google Scholar] [CrossRef]
- Owens, D.K.; Wendt, R.C. Estimation of the surface free energy of polymers. Journal of Applied Polymer Science 1969, 13, 1741–1747. [Google Scholar] [CrossRef]
- Taillandier, E.; Liquier, J. Infrared spectroscopy of DNA. In Methods in Enzymology; Elsevier: Amsterdam, The Netherlands, 1992; Volume 16, pp. 307–335. [Google Scholar] [CrossRef]
- Clerc, F. Electro-optical limits of the electrically controlled birefringence effect in nematic liquid crystals. Displays 1981, 2, 341–347. [Google Scholar] [CrossRef]
- Ranjini, R.; Matham, M.V.; Nguyen, N.-T. Conoscopic analysis of electric field driven planar aligned nematic liquid crystal. Applied Optics 2014, 53, 2773. [Google Scholar] [CrossRef]
- Di Pietro, V.M.; Jullien, A.; Bortolozzo, U.; Forget, N.; Residori, S. Dynamical optical response of nematic liquid crystal cells through electrically driven Fréedericksz transition: influence of the nematic layer thickness. Optics Express 2018, 26, 10716. [Google Scholar] [CrossRef]
- Wu, S.-T. Phase retardation dependent optical response time of parallel-aligned liquid crystals. Journal of Applied Physics 1986, 60, 1836–1838. [Google Scholar] [CrossRef]
- Khoo, I.-C.; Wu, S.-T. Optics and Nonlinear Optics of Liquid Crystals; World Scientific: Singapore, 1993. [Google Scholar] [CrossRef]
- Nie, X.; Lin, Y.-H.; Wu, T.X.; Wang, H.; Ge, Z.; Wu, S.-T. Polar anchoring energy measurement of vertically aligned liquid-crystal cells. Journal of Applied Physics 2005, 98, 013516. [Google Scholar] [CrossRef]
Figure 1.
The schematic drawing for the reaction of DNA sodium salt with DODA surfactant. The final product of the reaction is the biodegradable polymer DNA-DODA used as an alignment layer in photonic devices.
Figure 1.
The schematic drawing for the reaction of DNA sodium salt with DODA surfactant. The final product of the reaction is the biodegradable polymer DNA-DODA used as an alignment layer in photonic devices.
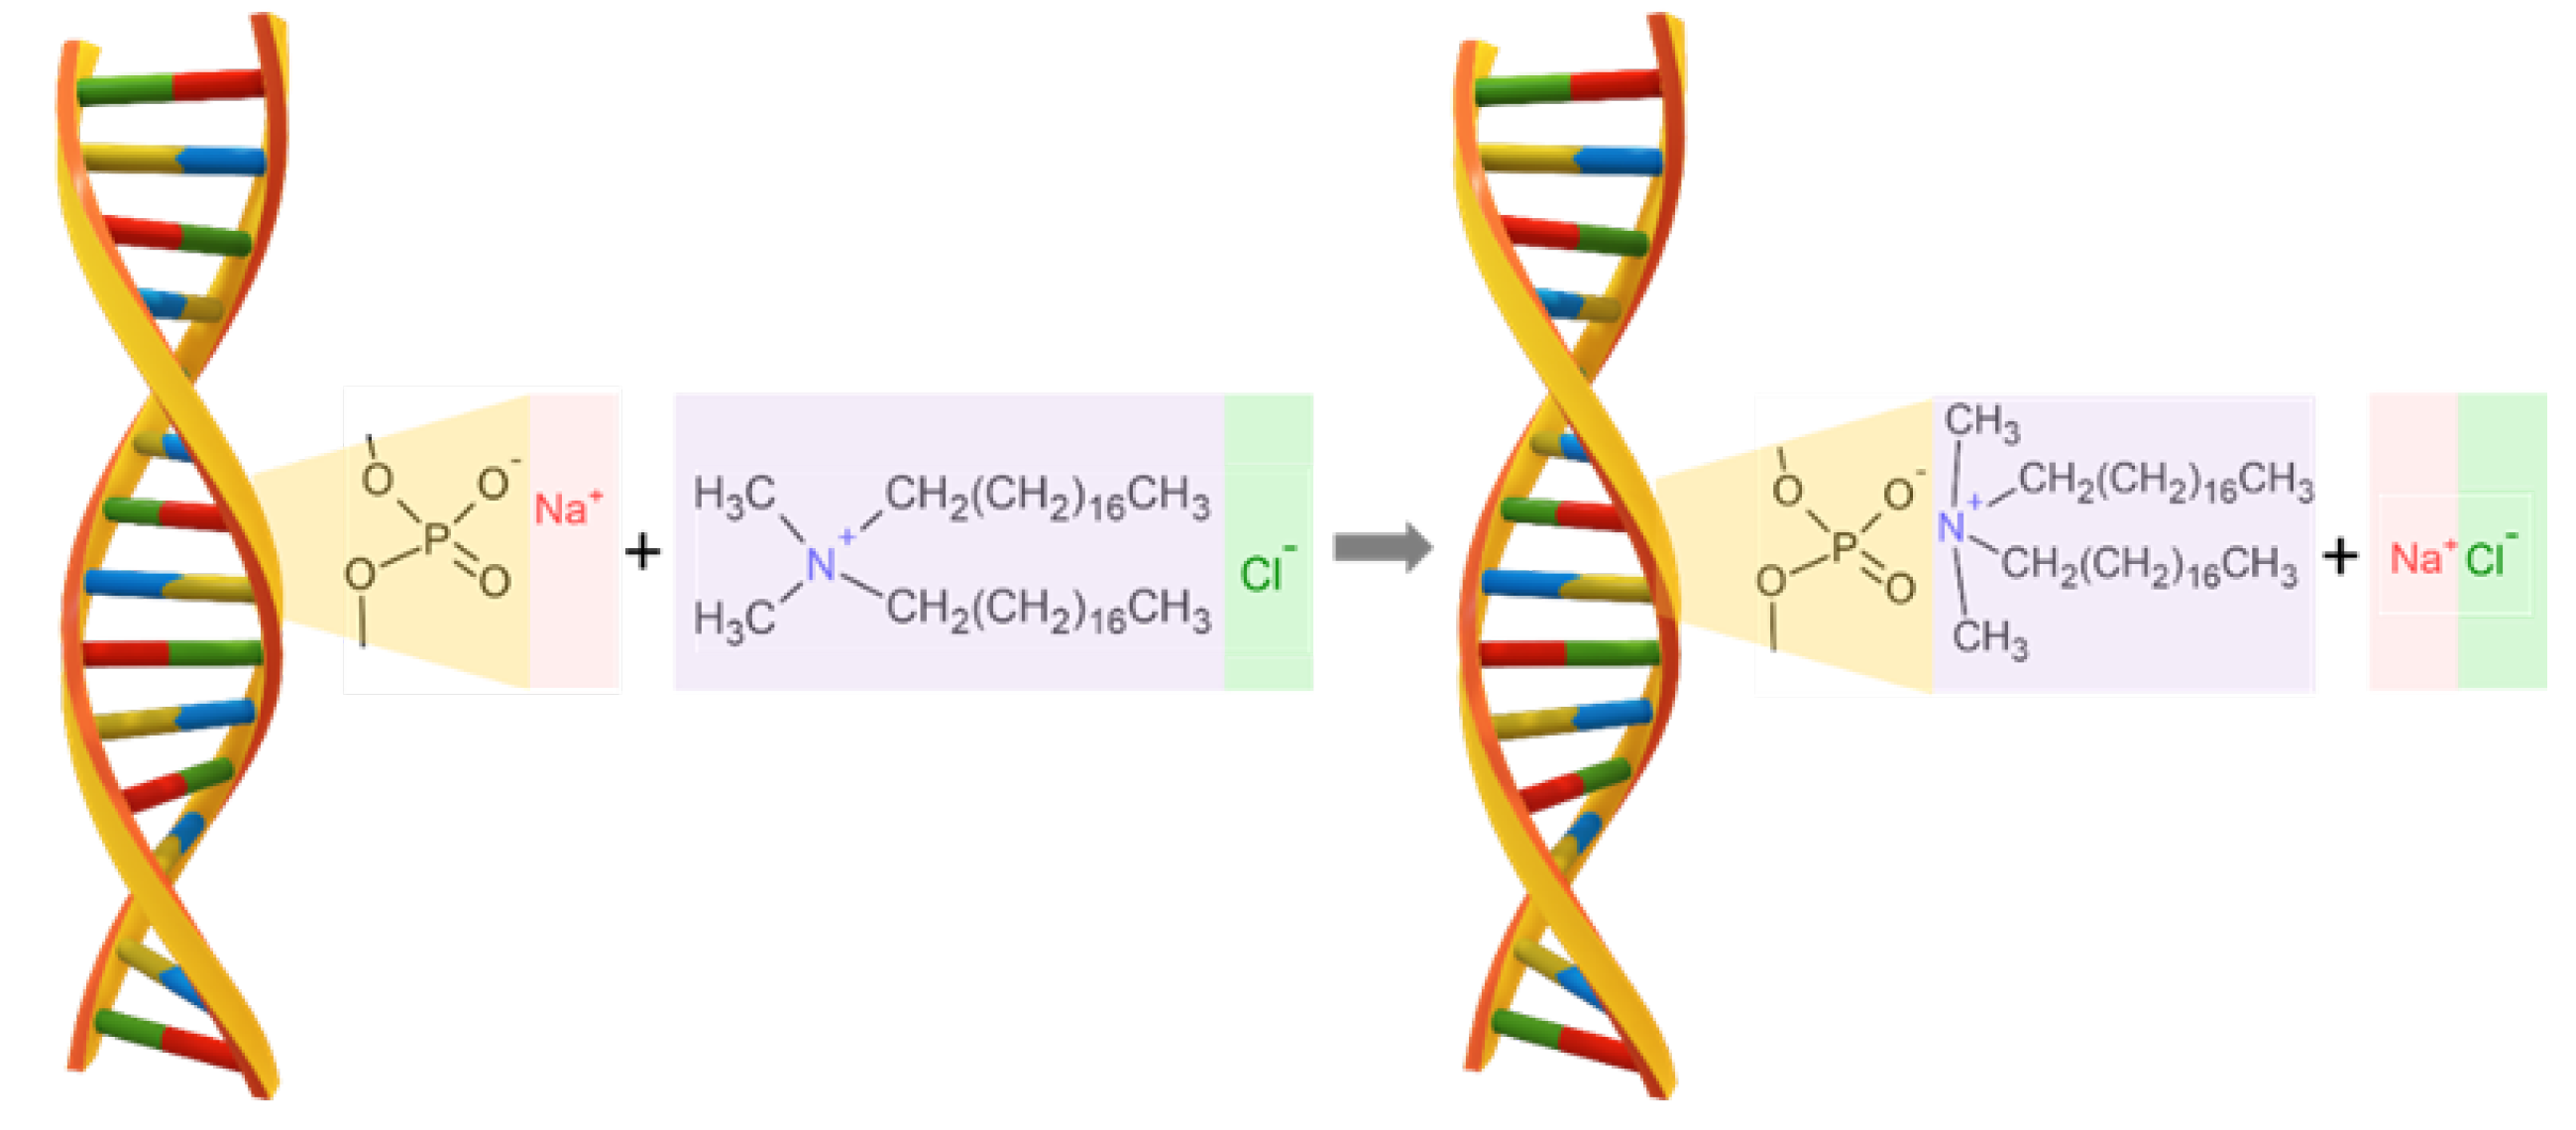
Figure 2.
The chemical structure of organic compounds used in the 1832 nematic mixture. X = -H or -F, n = 3-6 and m = 1-4.
Figure 2.
The chemical structure of organic compounds used in the 1832 nematic mixture. X = -H or -F, n = 3-6 and m = 1-4.
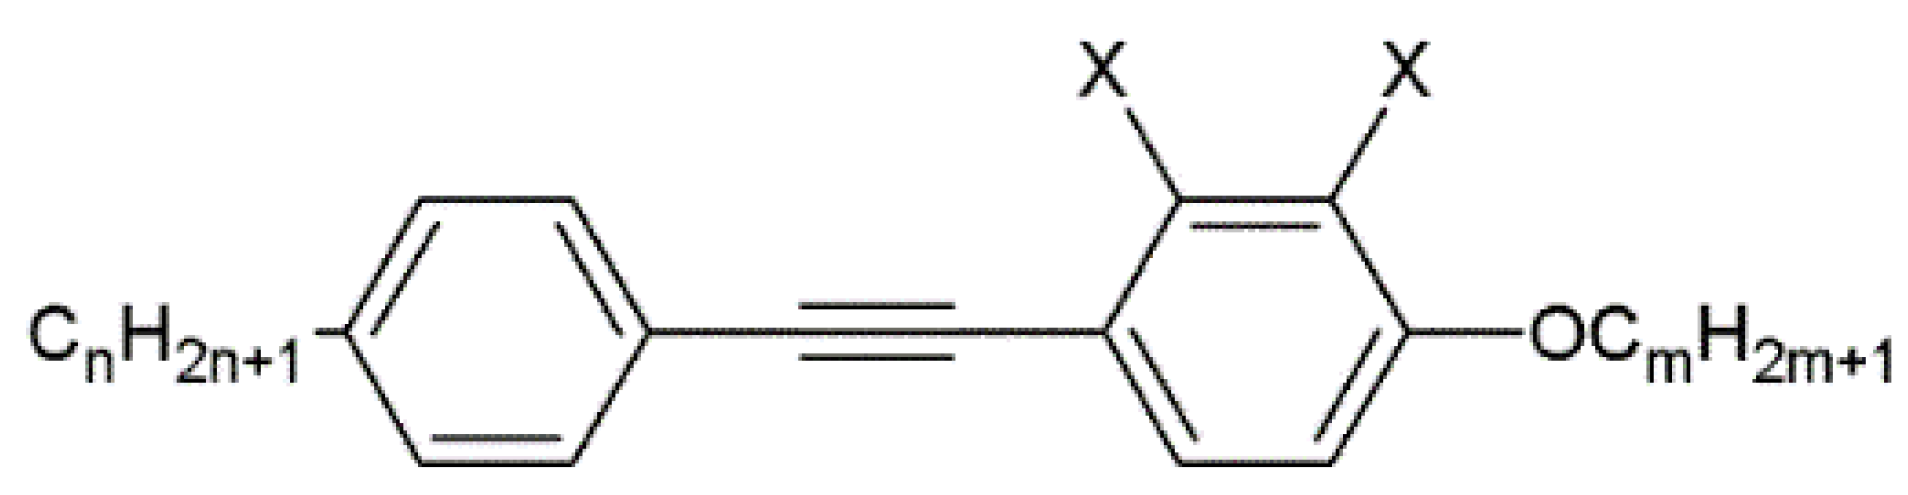
Figure 3.
ATR FT-IR baseline-subtracted spectra of DNA (red line), DODA (blue line), and DNA-DODA (green line). As a baseline, the glass substrate was measured.
Figure 3.
ATR FT-IR baseline-subtracted spectra of DNA (red line), DODA (blue line), and DNA-DODA (green line). As a baseline, the glass substrate was measured.
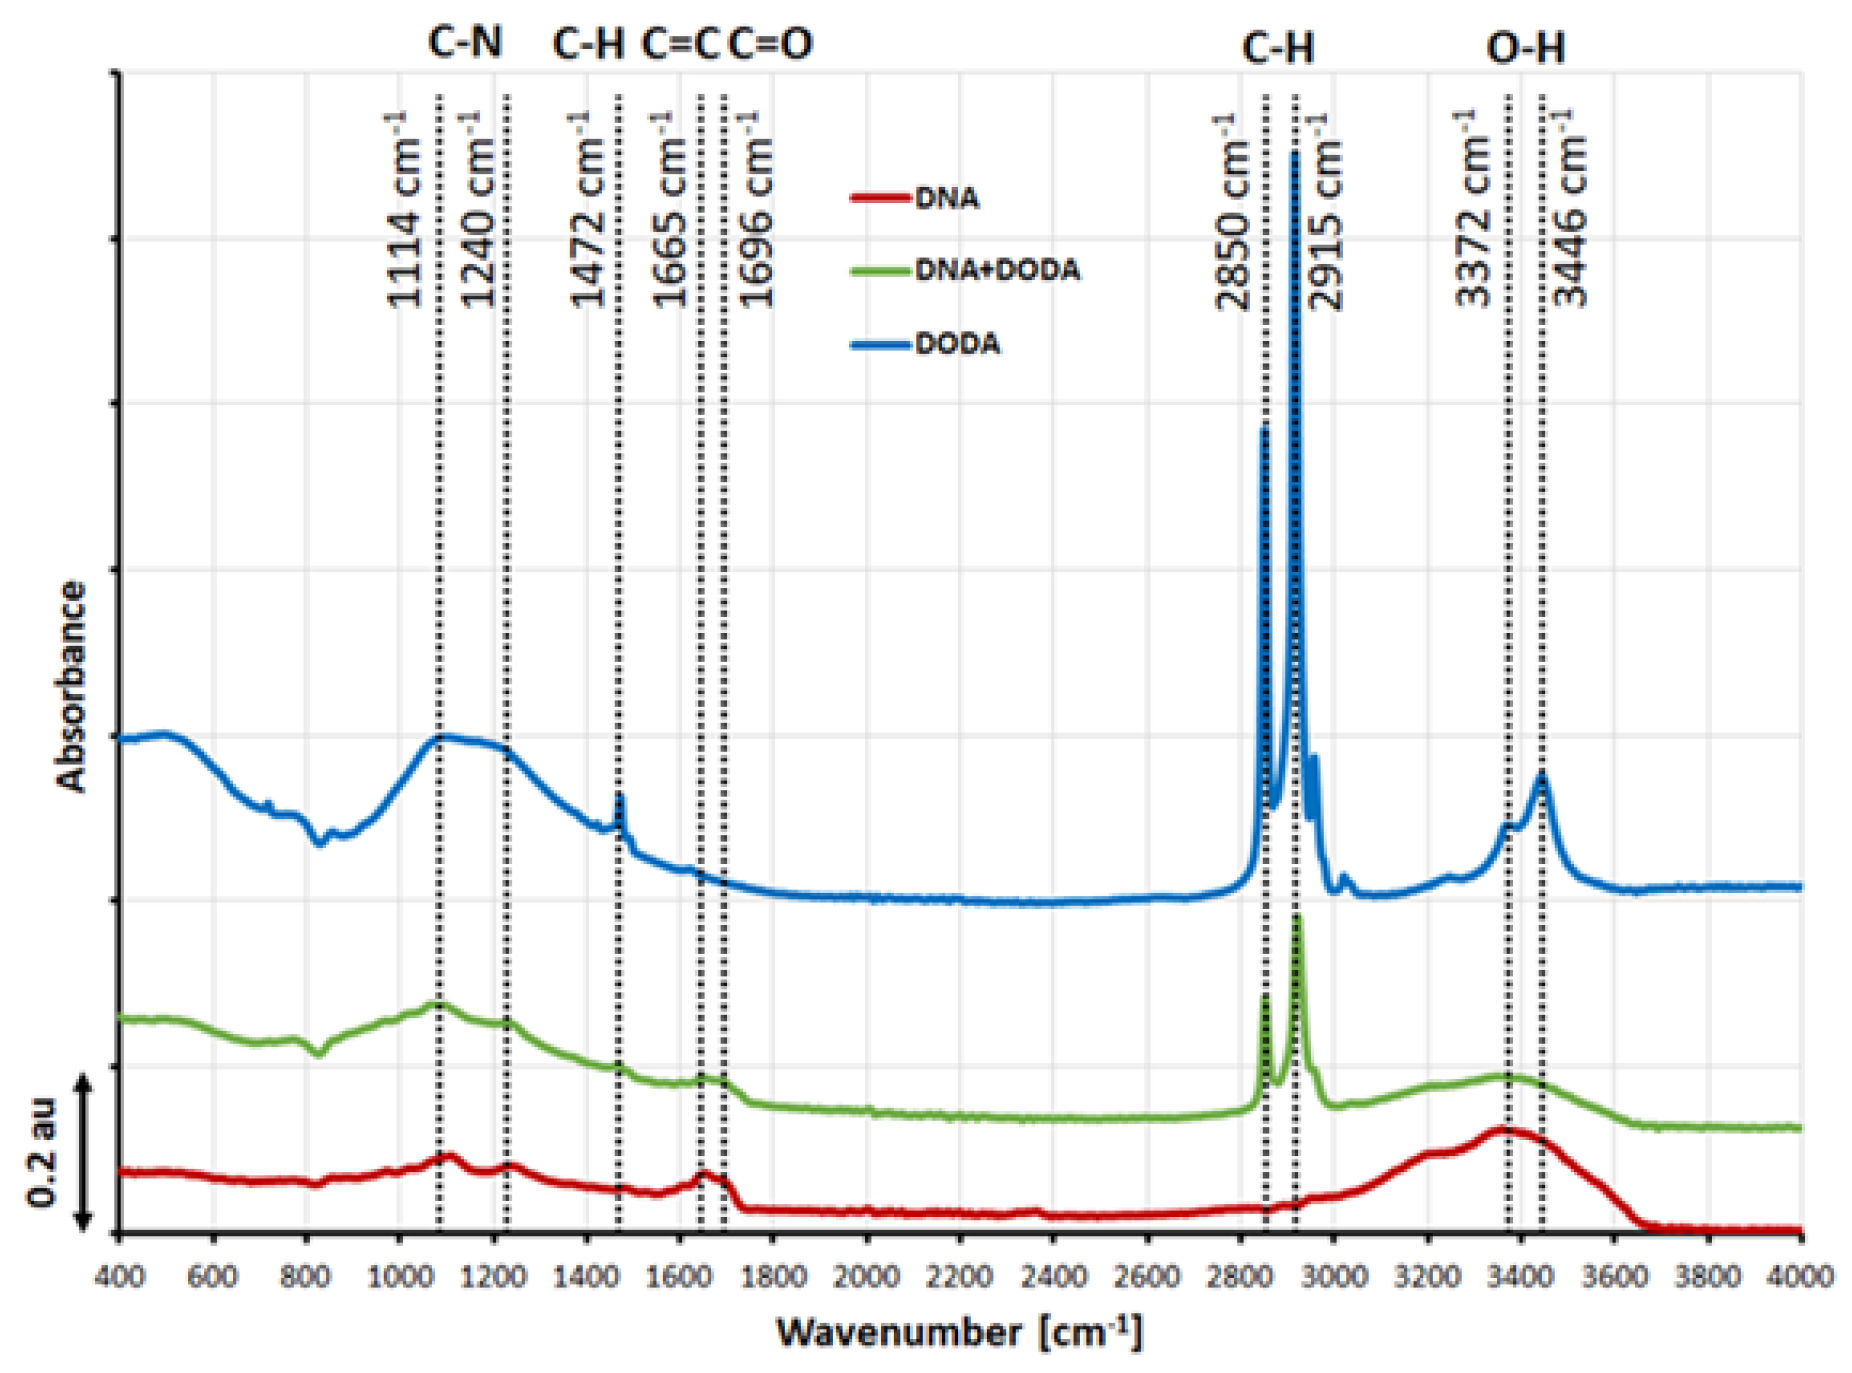
Figure 4.
Raman spectra of DNA (blue line), DODA (green line), and DNA-DODA complex (red line). A grey area in each spectrum shows the standard deviation of the signal.
Figure 4.
Raman spectra of DNA (blue line), DODA (green line), and DNA-DODA complex (red line). A grey area in each spectrum shows the standard deviation of the signal.
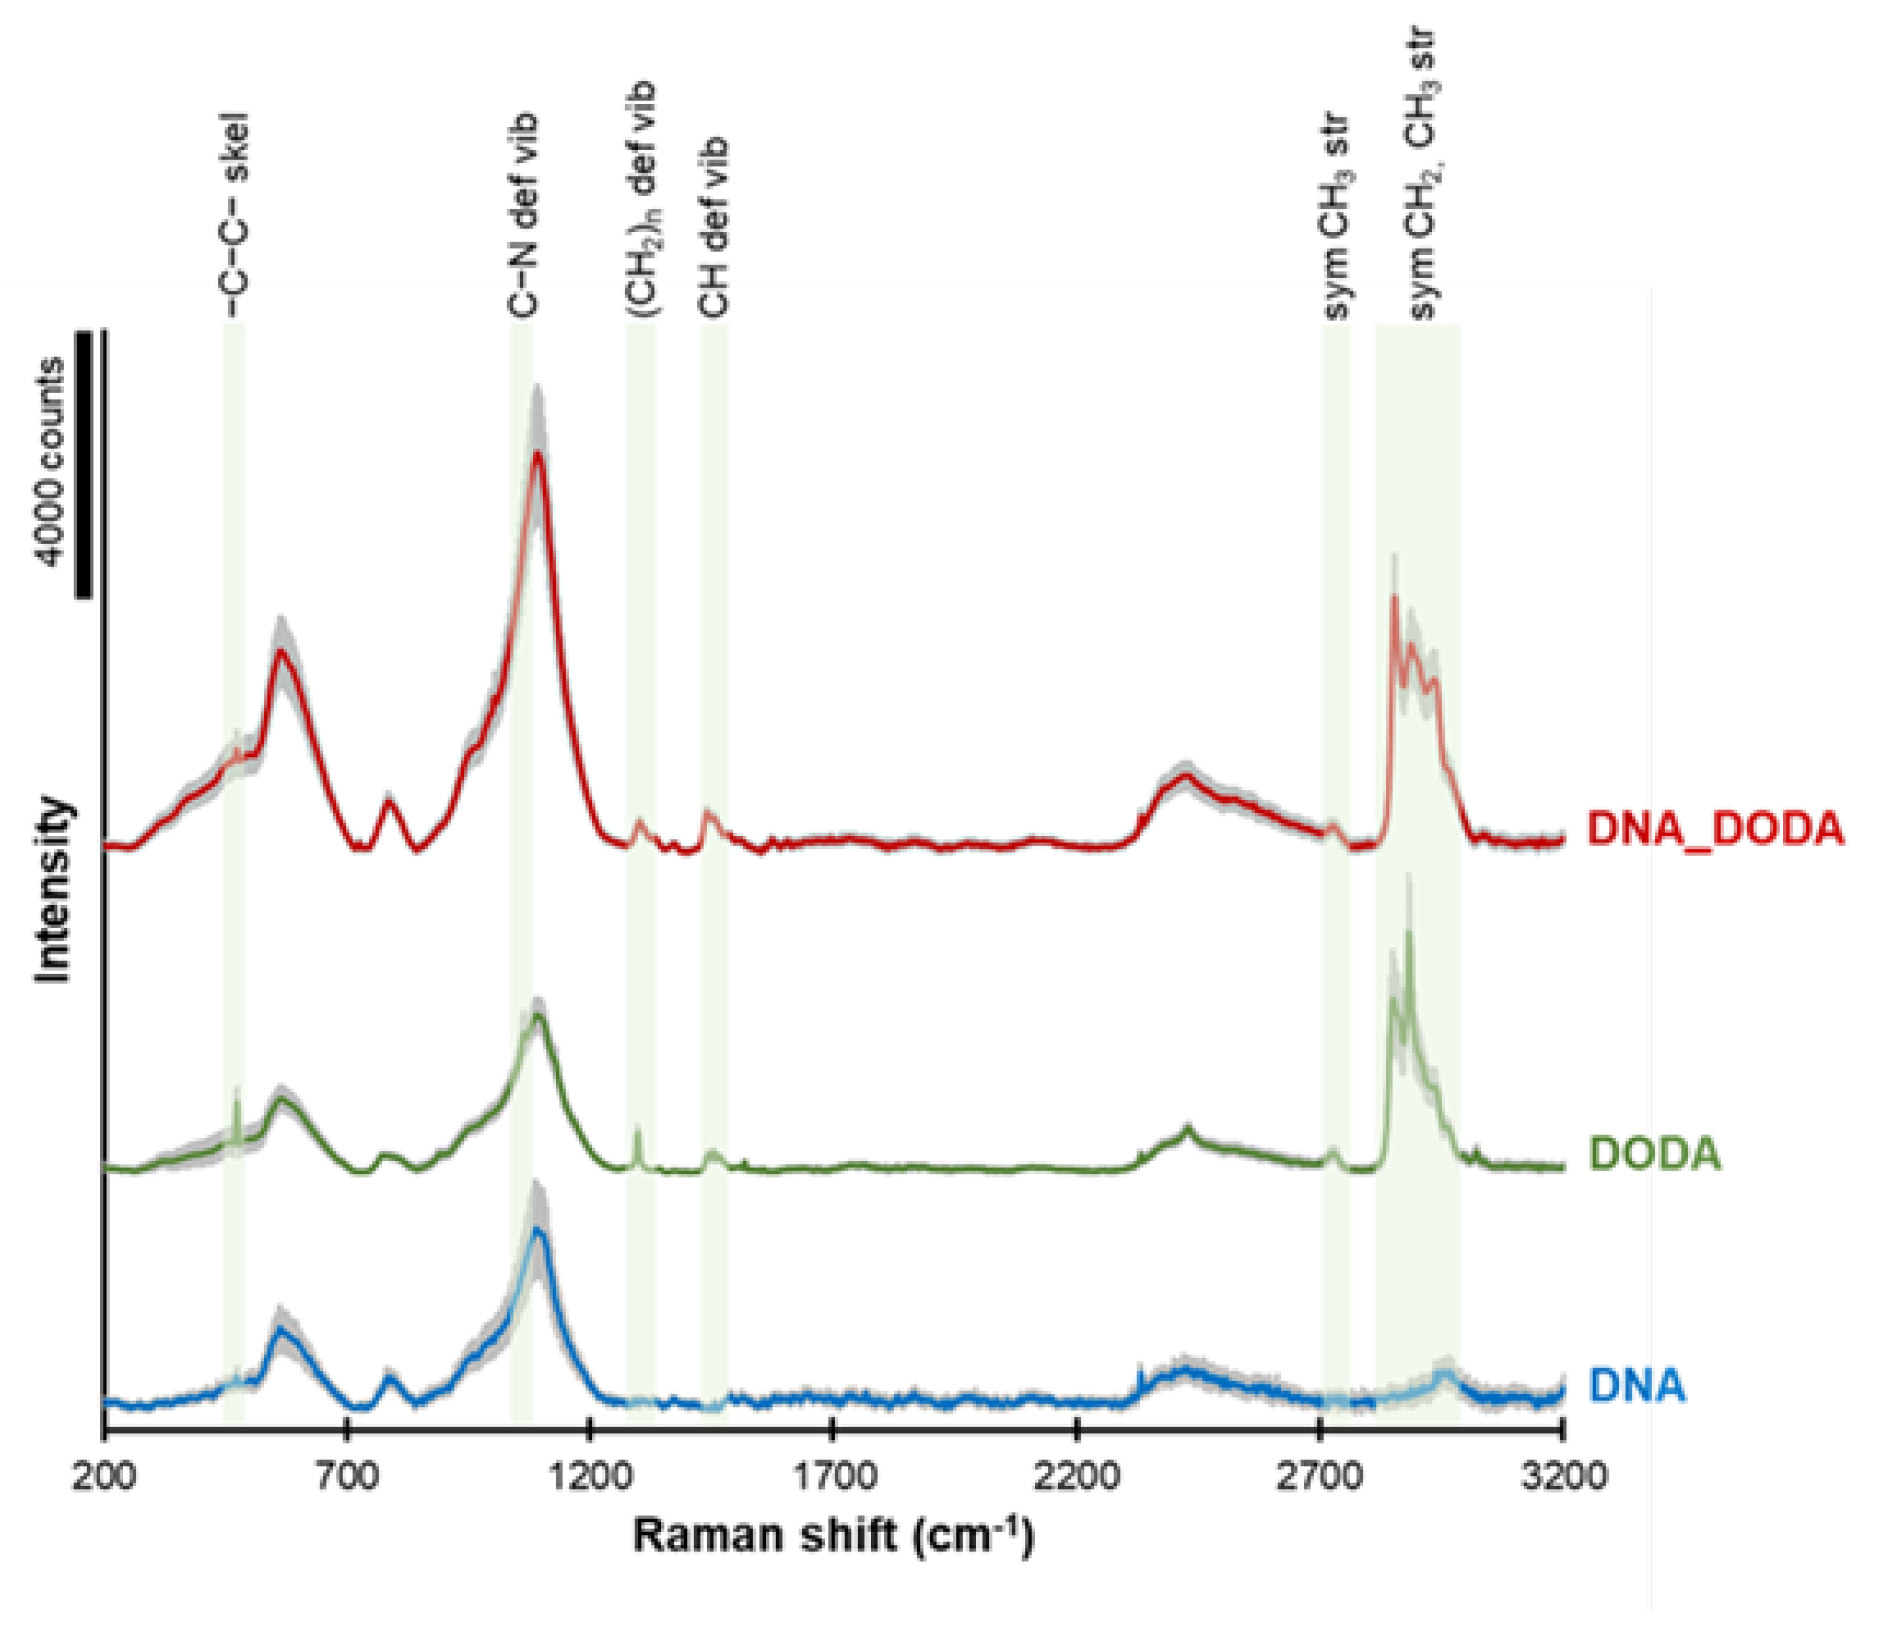
Figure 5.
AFM topographical images of tested samples: A) DODA, B) DNA sodium salt, C) DNA-DODA. The scanning area was 2 x 2 µm.
Figure 5.
AFM topographical images of tested samples: A) DODA, B) DNA sodium salt, C) DNA-DODA. The scanning area was 2 x 2 µm.
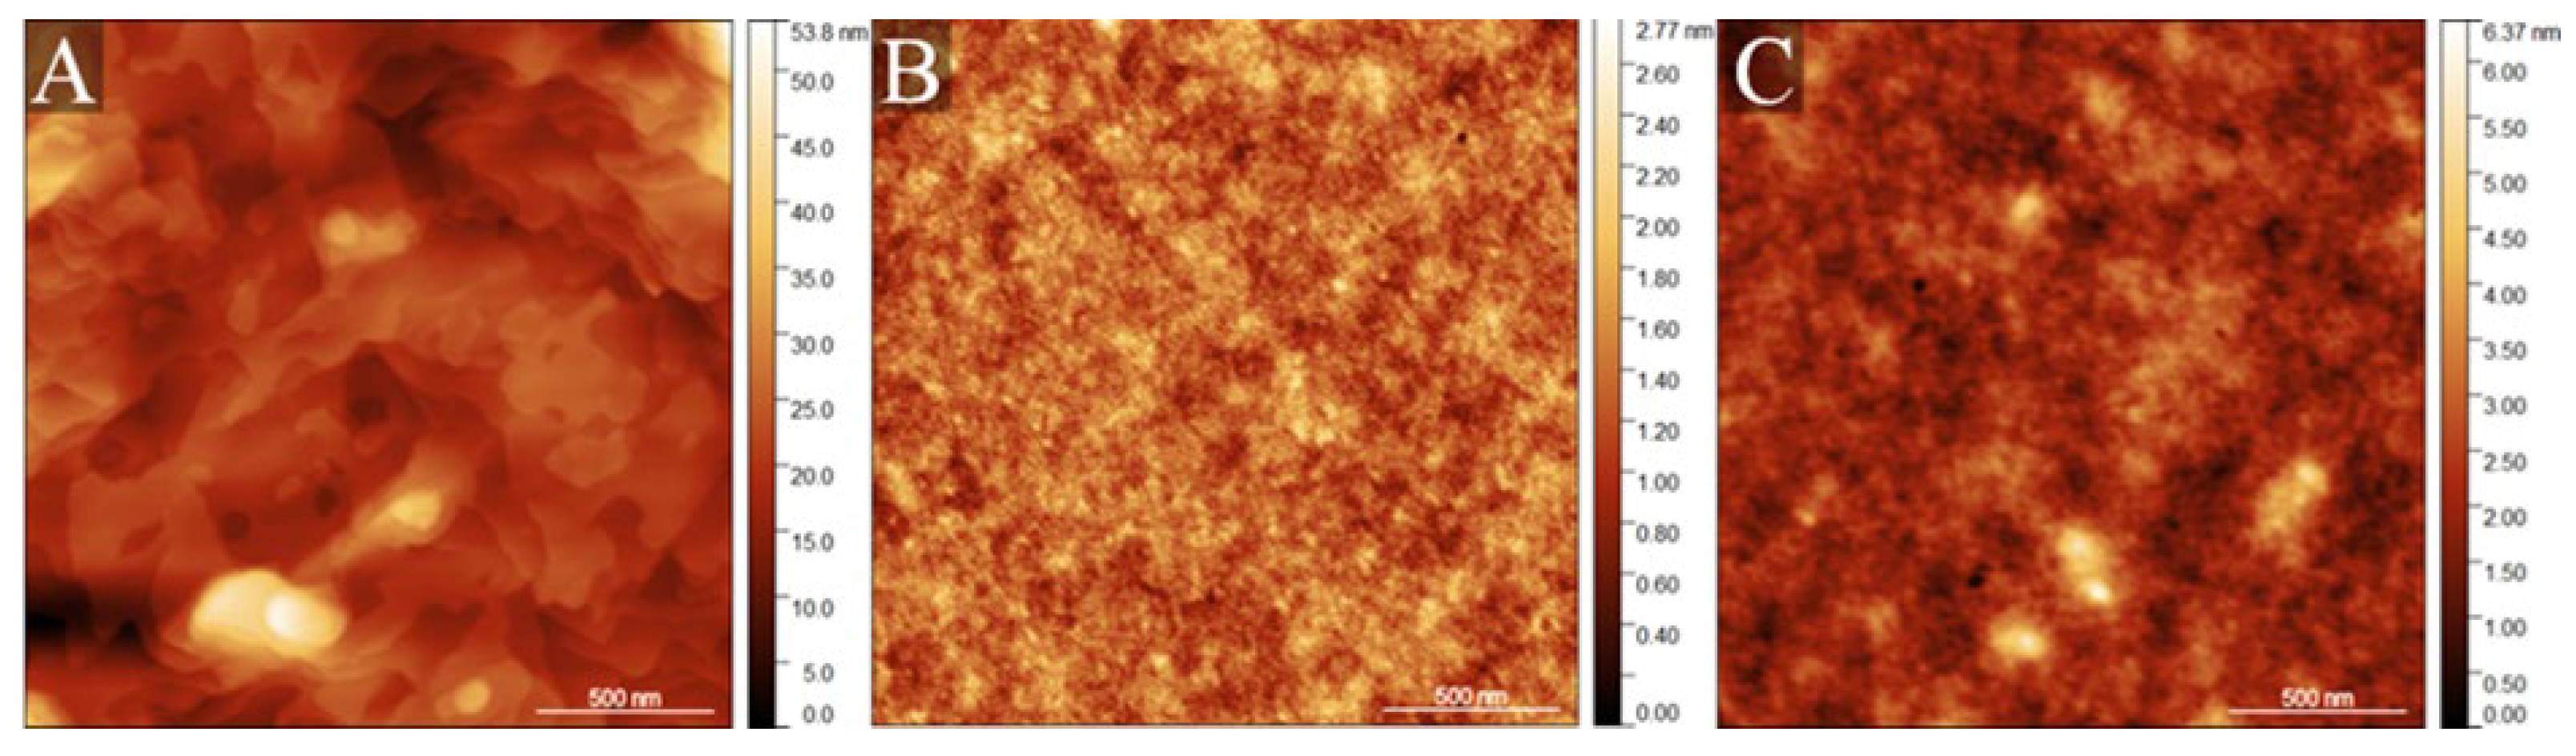
Figure 6.
Contact angle measurement for water on the glass, DNA, DODA, and DNA-DODA complex of surfaces.
Figure 6.
Contact angle measurement for water on the glass, DNA, DODA, and DNA-DODA complex of surfaces.
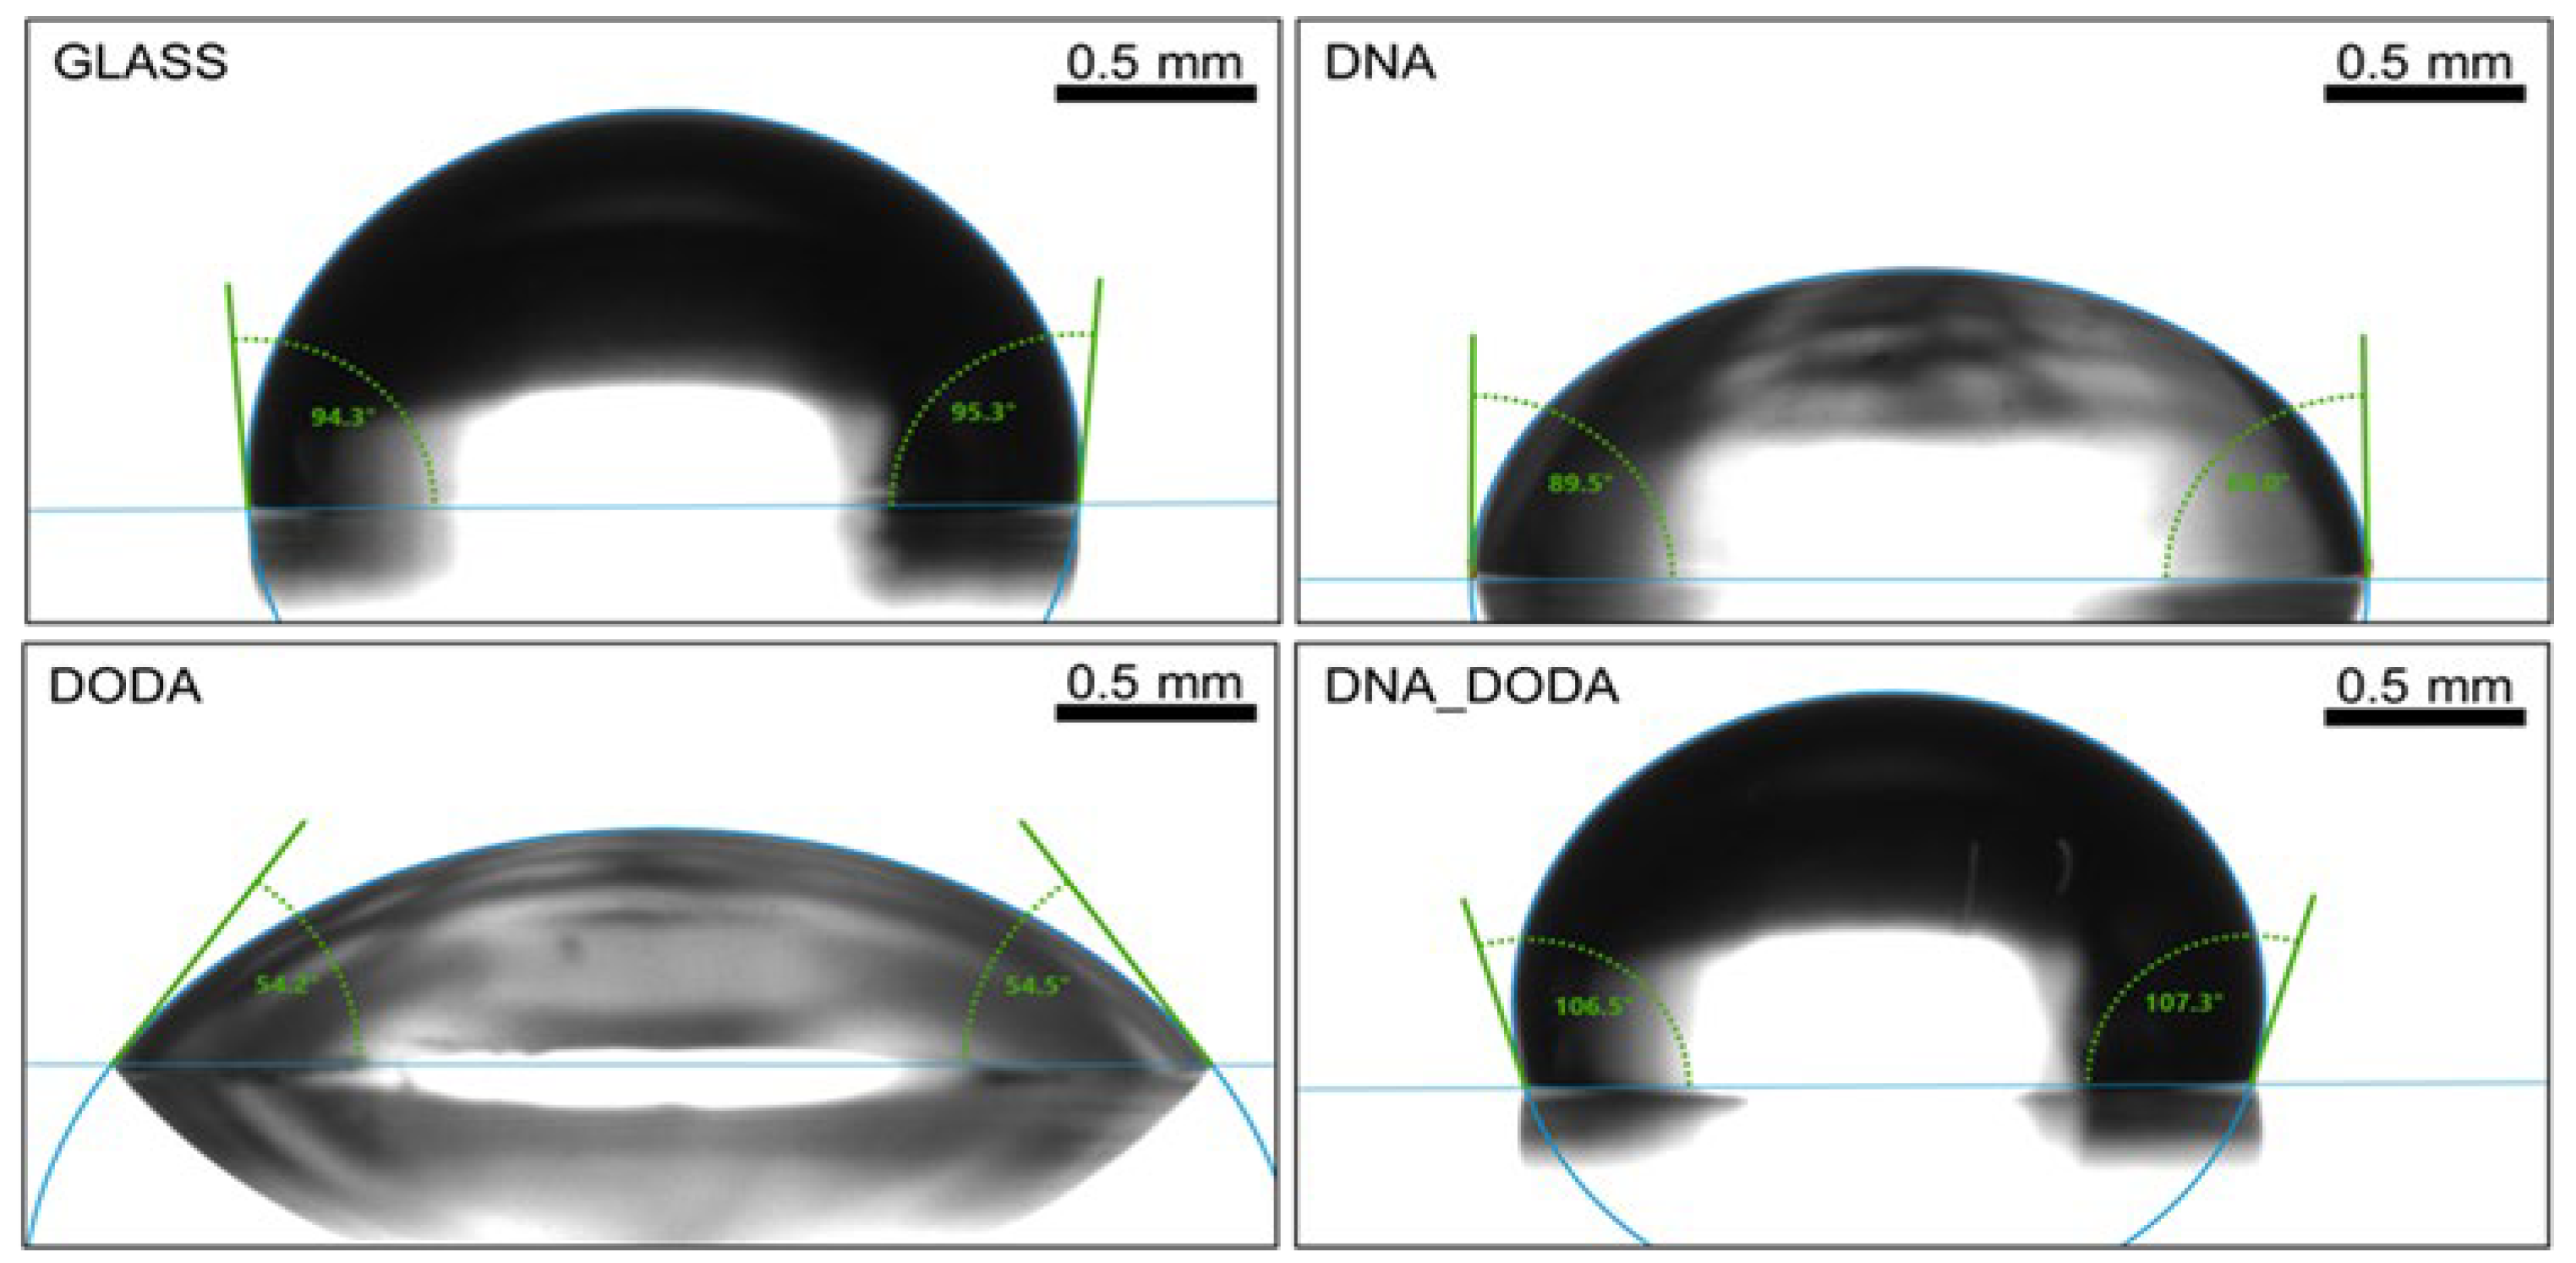
Figure 7.
Contact angle measurement for diiodomethane on glass, DNA, DODA, and DNA-DODA complex of surfaces.
Figure 7.
Contact angle measurement for diiodomethane on glass, DNA, DODA, and DNA-DODA complex of surfaces.
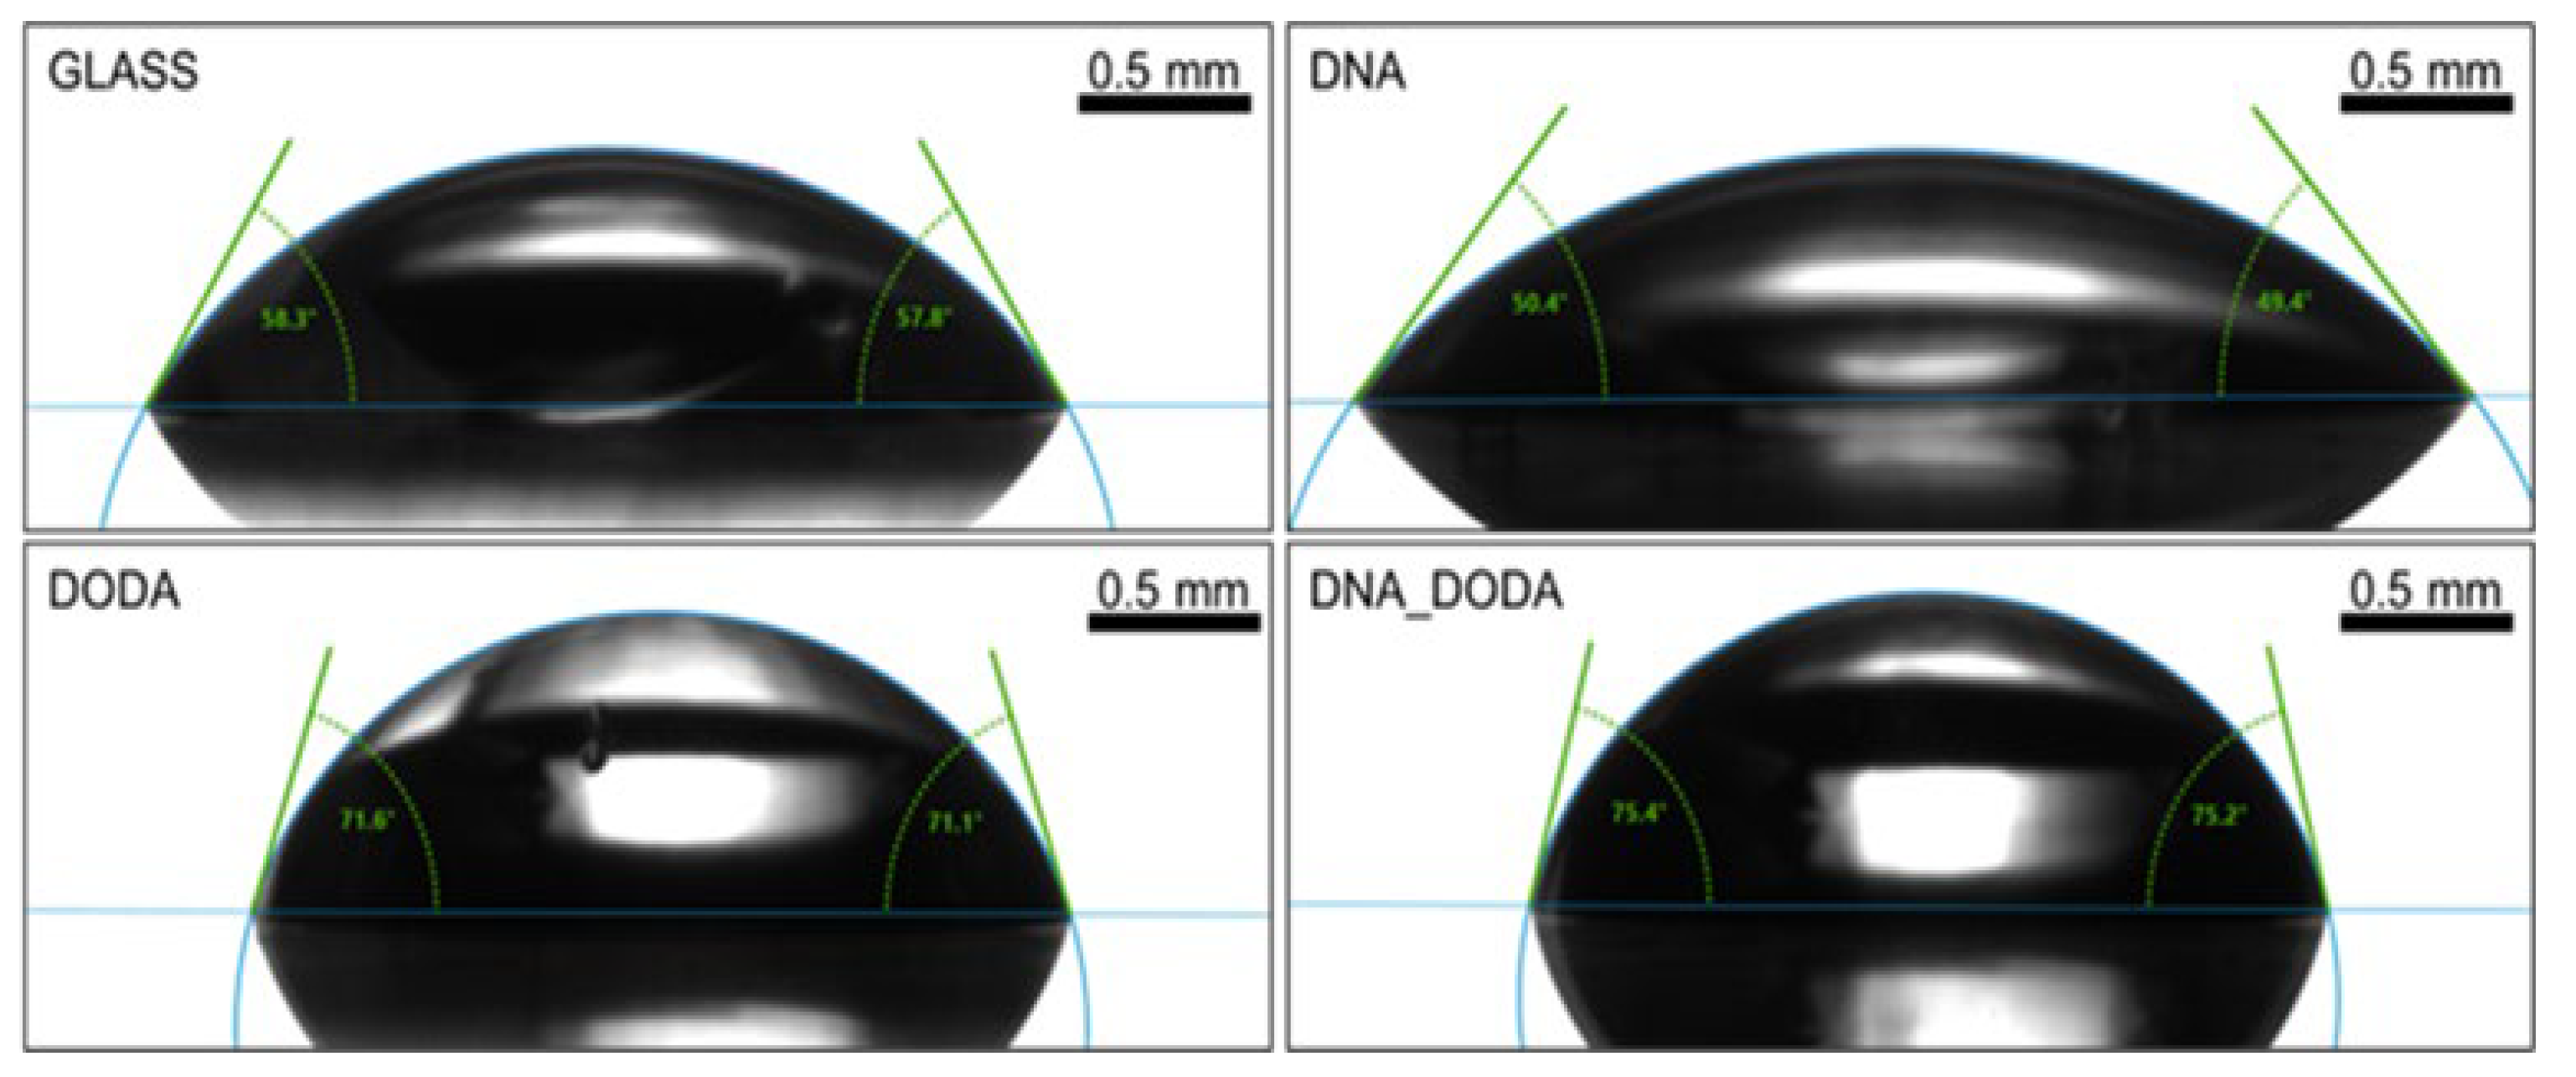
Figure 8.
Optical macroscope images of homeotropically aligned nematic liquid crystal cell with DNA-DODA layer placed between crossed polarizers at 0-8 V.
Figure 8.
Optical macroscope images of homeotropically aligned nematic liquid crystal cell with DNA-DODA layer placed between crossed polarizers at 0-8 V.
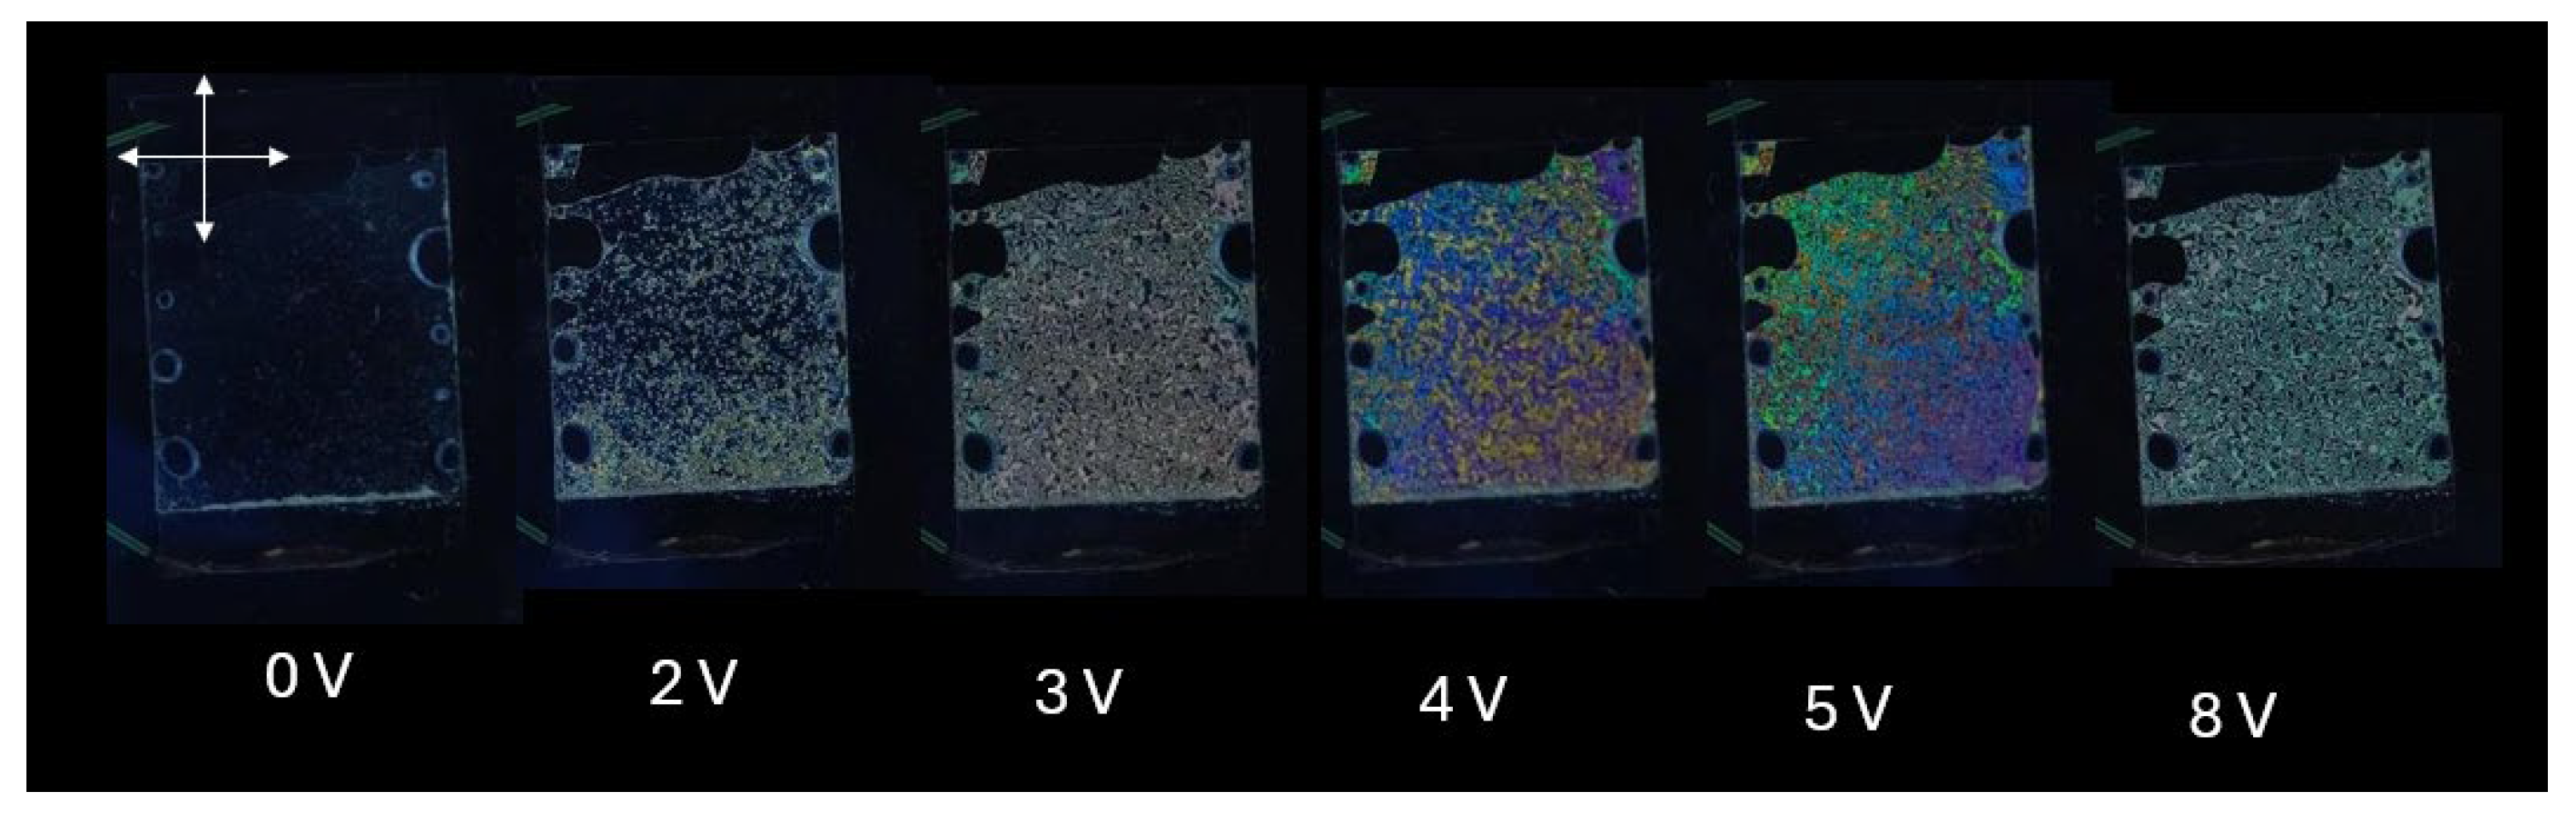
Figure 9.
Orthoscopic and conoscopic optical polarizing microscope images of the LC cell with DNA-DODA alignment layer, placed between crossed polarizers. Photos in the lower left corner show the conoscopic images.
Figure 9.
Orthoscopic and conoscopic optical polarizing microscope images of the LC cell with DNA-DODA alignment layer, placed between crossed polarizers. Photos in the lower left corner show the conoscopic images.
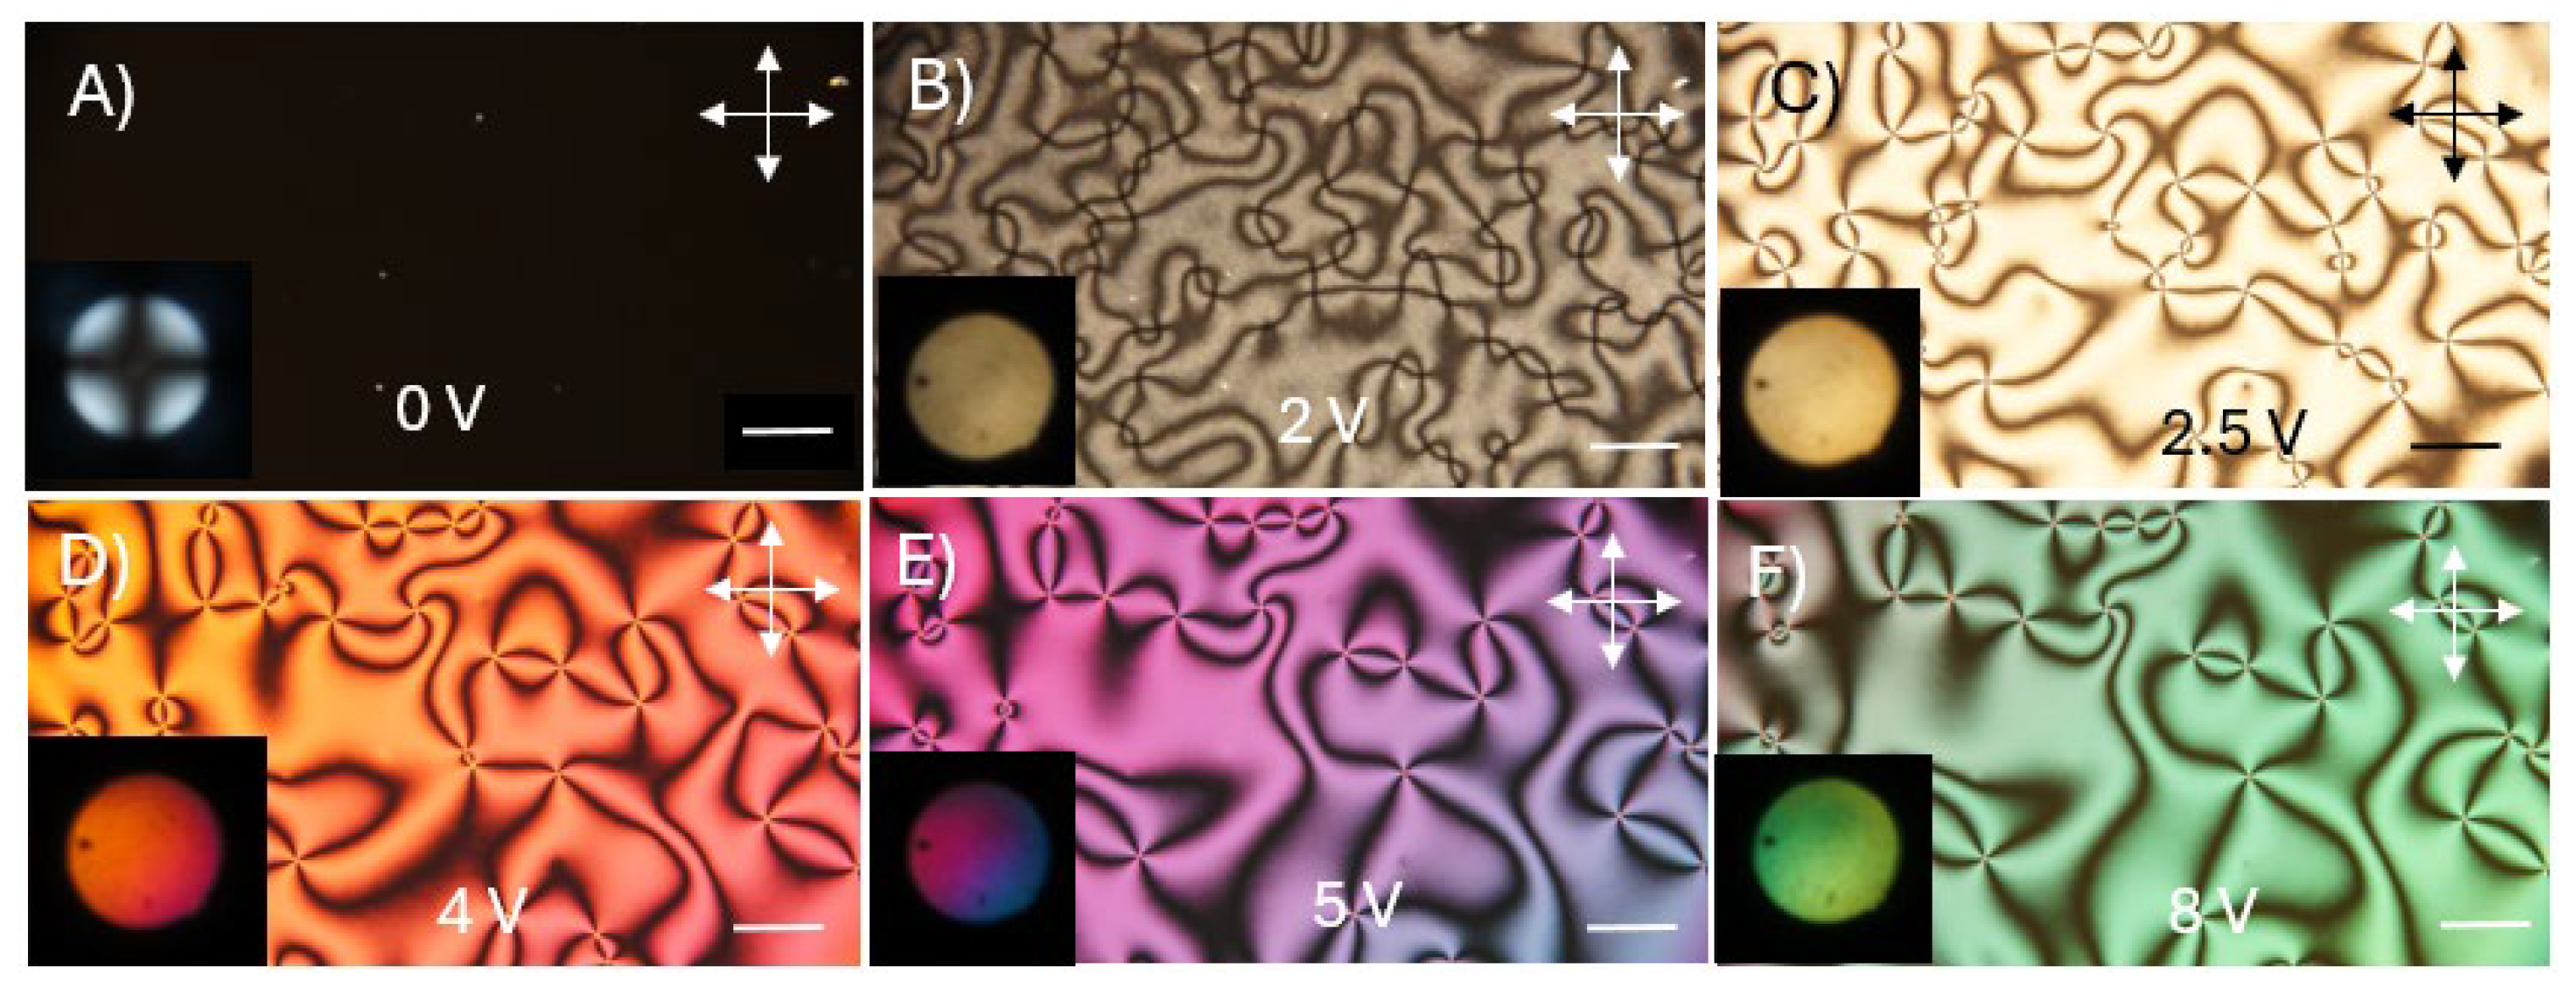
Figure 10.
The voltage-dependent phase retardation R of homeotropically aligned LC cells prepared using two different surfactants: (a) commercial polyimide SE-1211 and (b) biopolymer DNA-DODA. The calculated threshold voltage Vth from the linear extrapolation is 1.96 V and 2.01 V for SE-1211 and DNA-DODA cells, respectively.
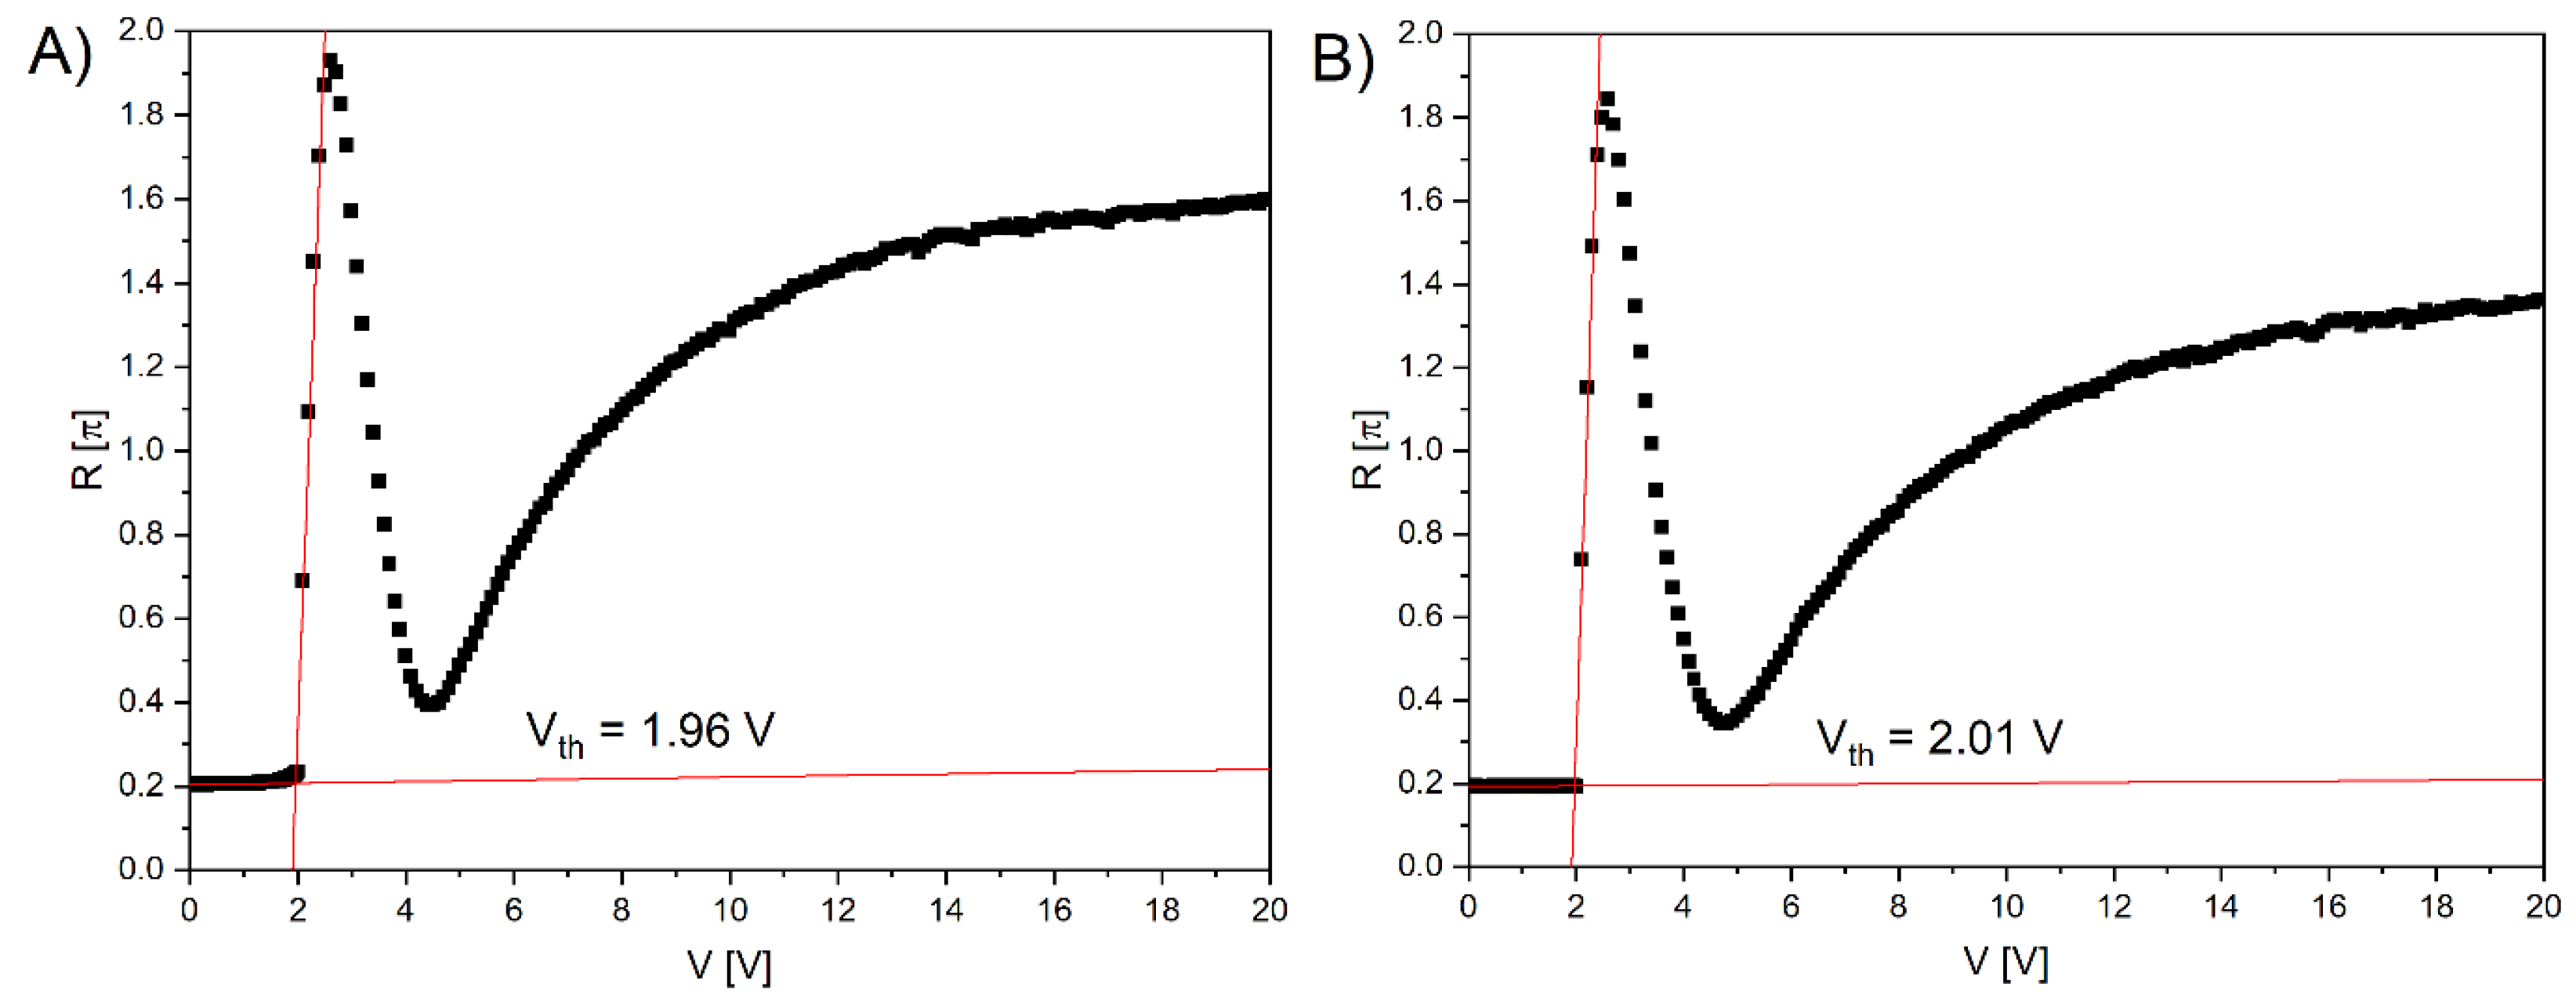
Figure 11.
The determination of anchoring energy W from the slope fitting method, according to [36]. The plots were obtained in the homeotropically aligned cells prepared using commercial polyimide (a) SE-1211 and (b) biopolymer DNA-DODA.
Figure 11.
The determination of anchoring energy W from the slope fitting method, according to [36]. The plots were obtained in the homeotropically aligned cells prepared using commercial polyimide (a) SE-1211 and (b) biopolymer DNA-DODA.
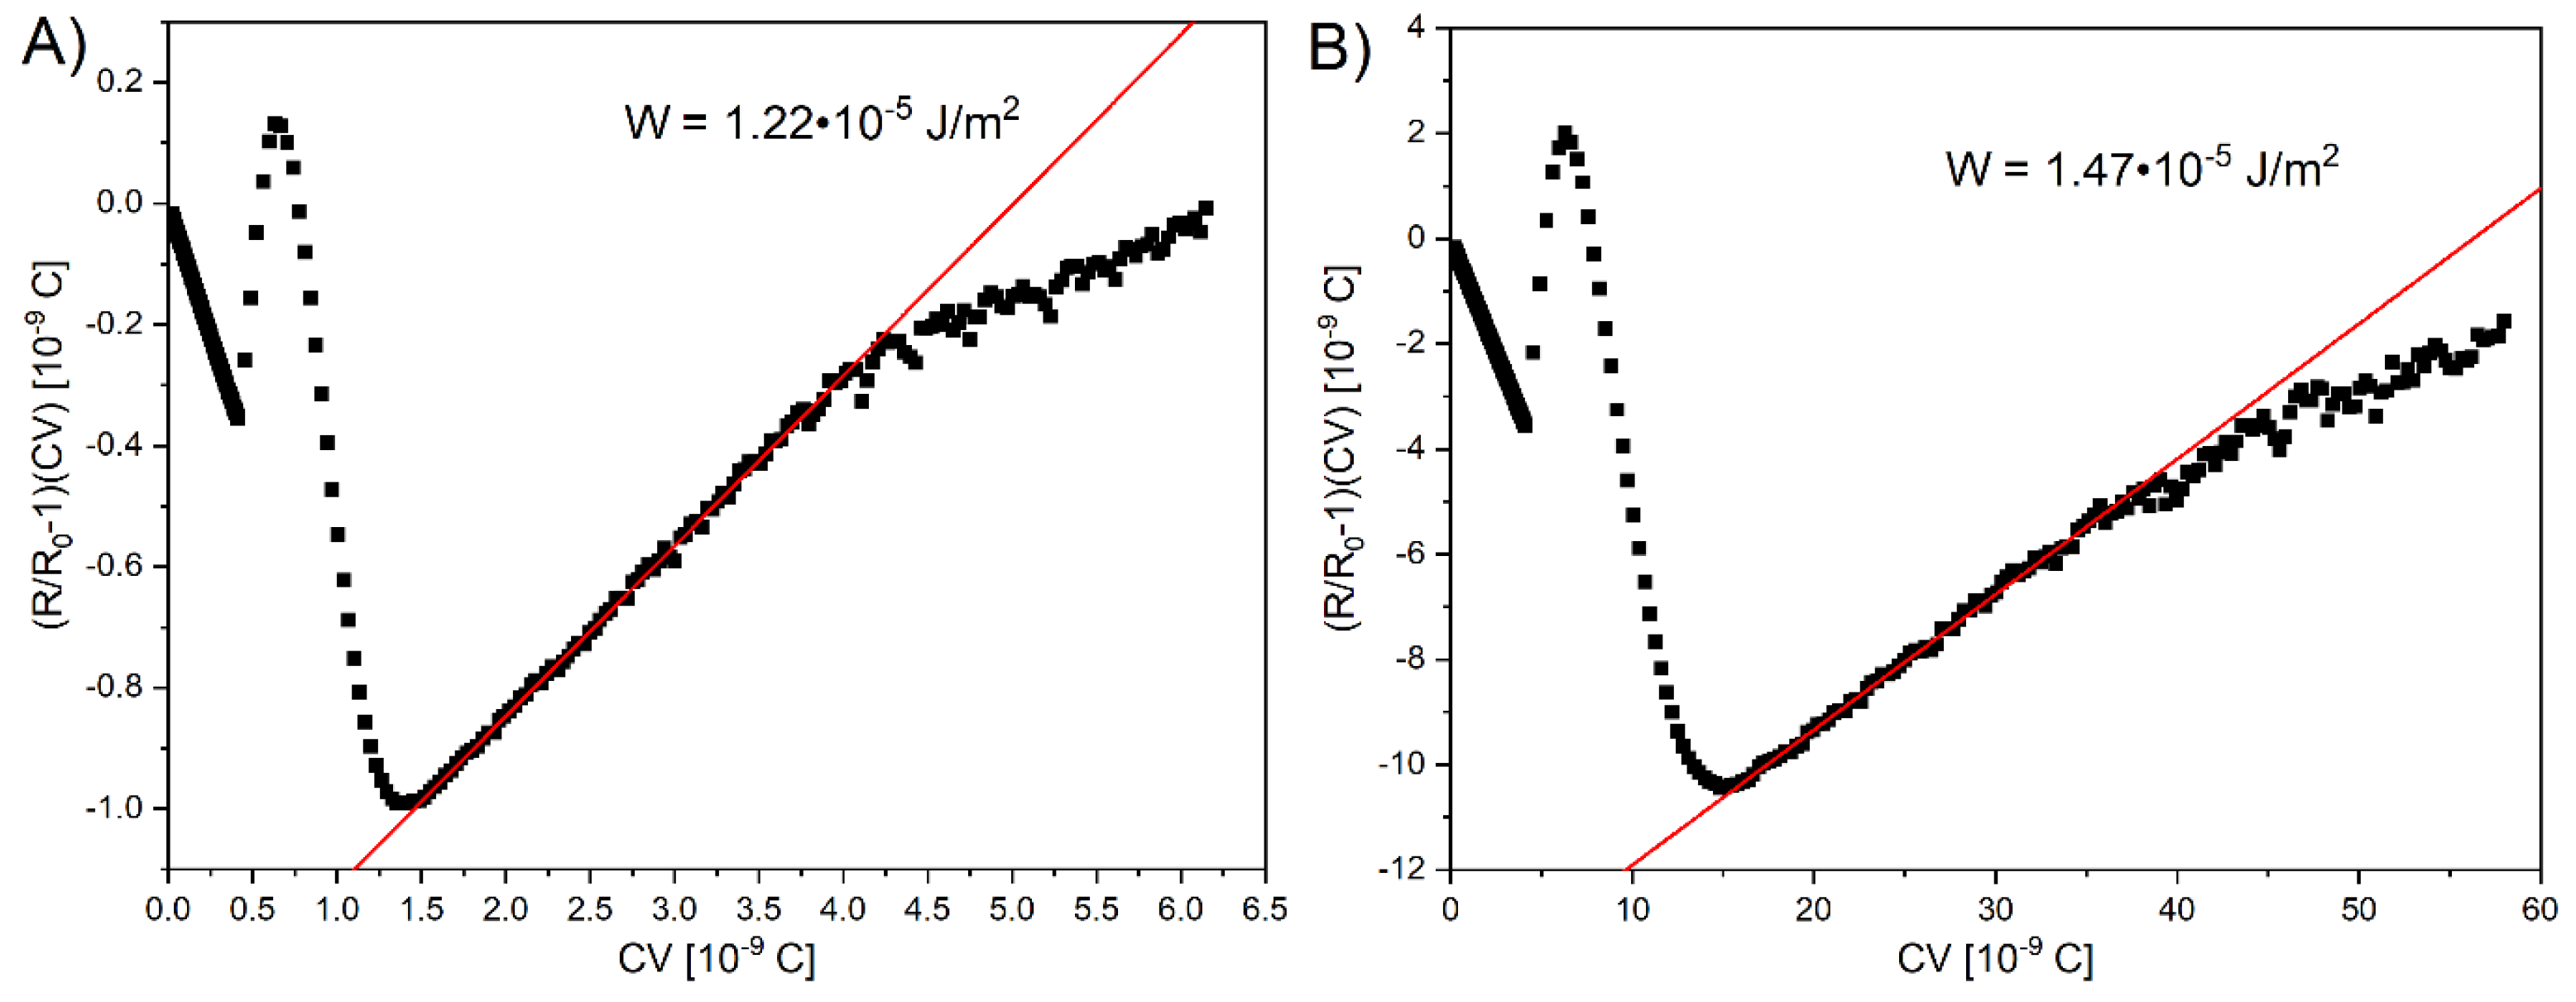
Figure 12.
Switching off-times of liquid crystal cells with DNA-DODA and SE-1211 alignment layers.
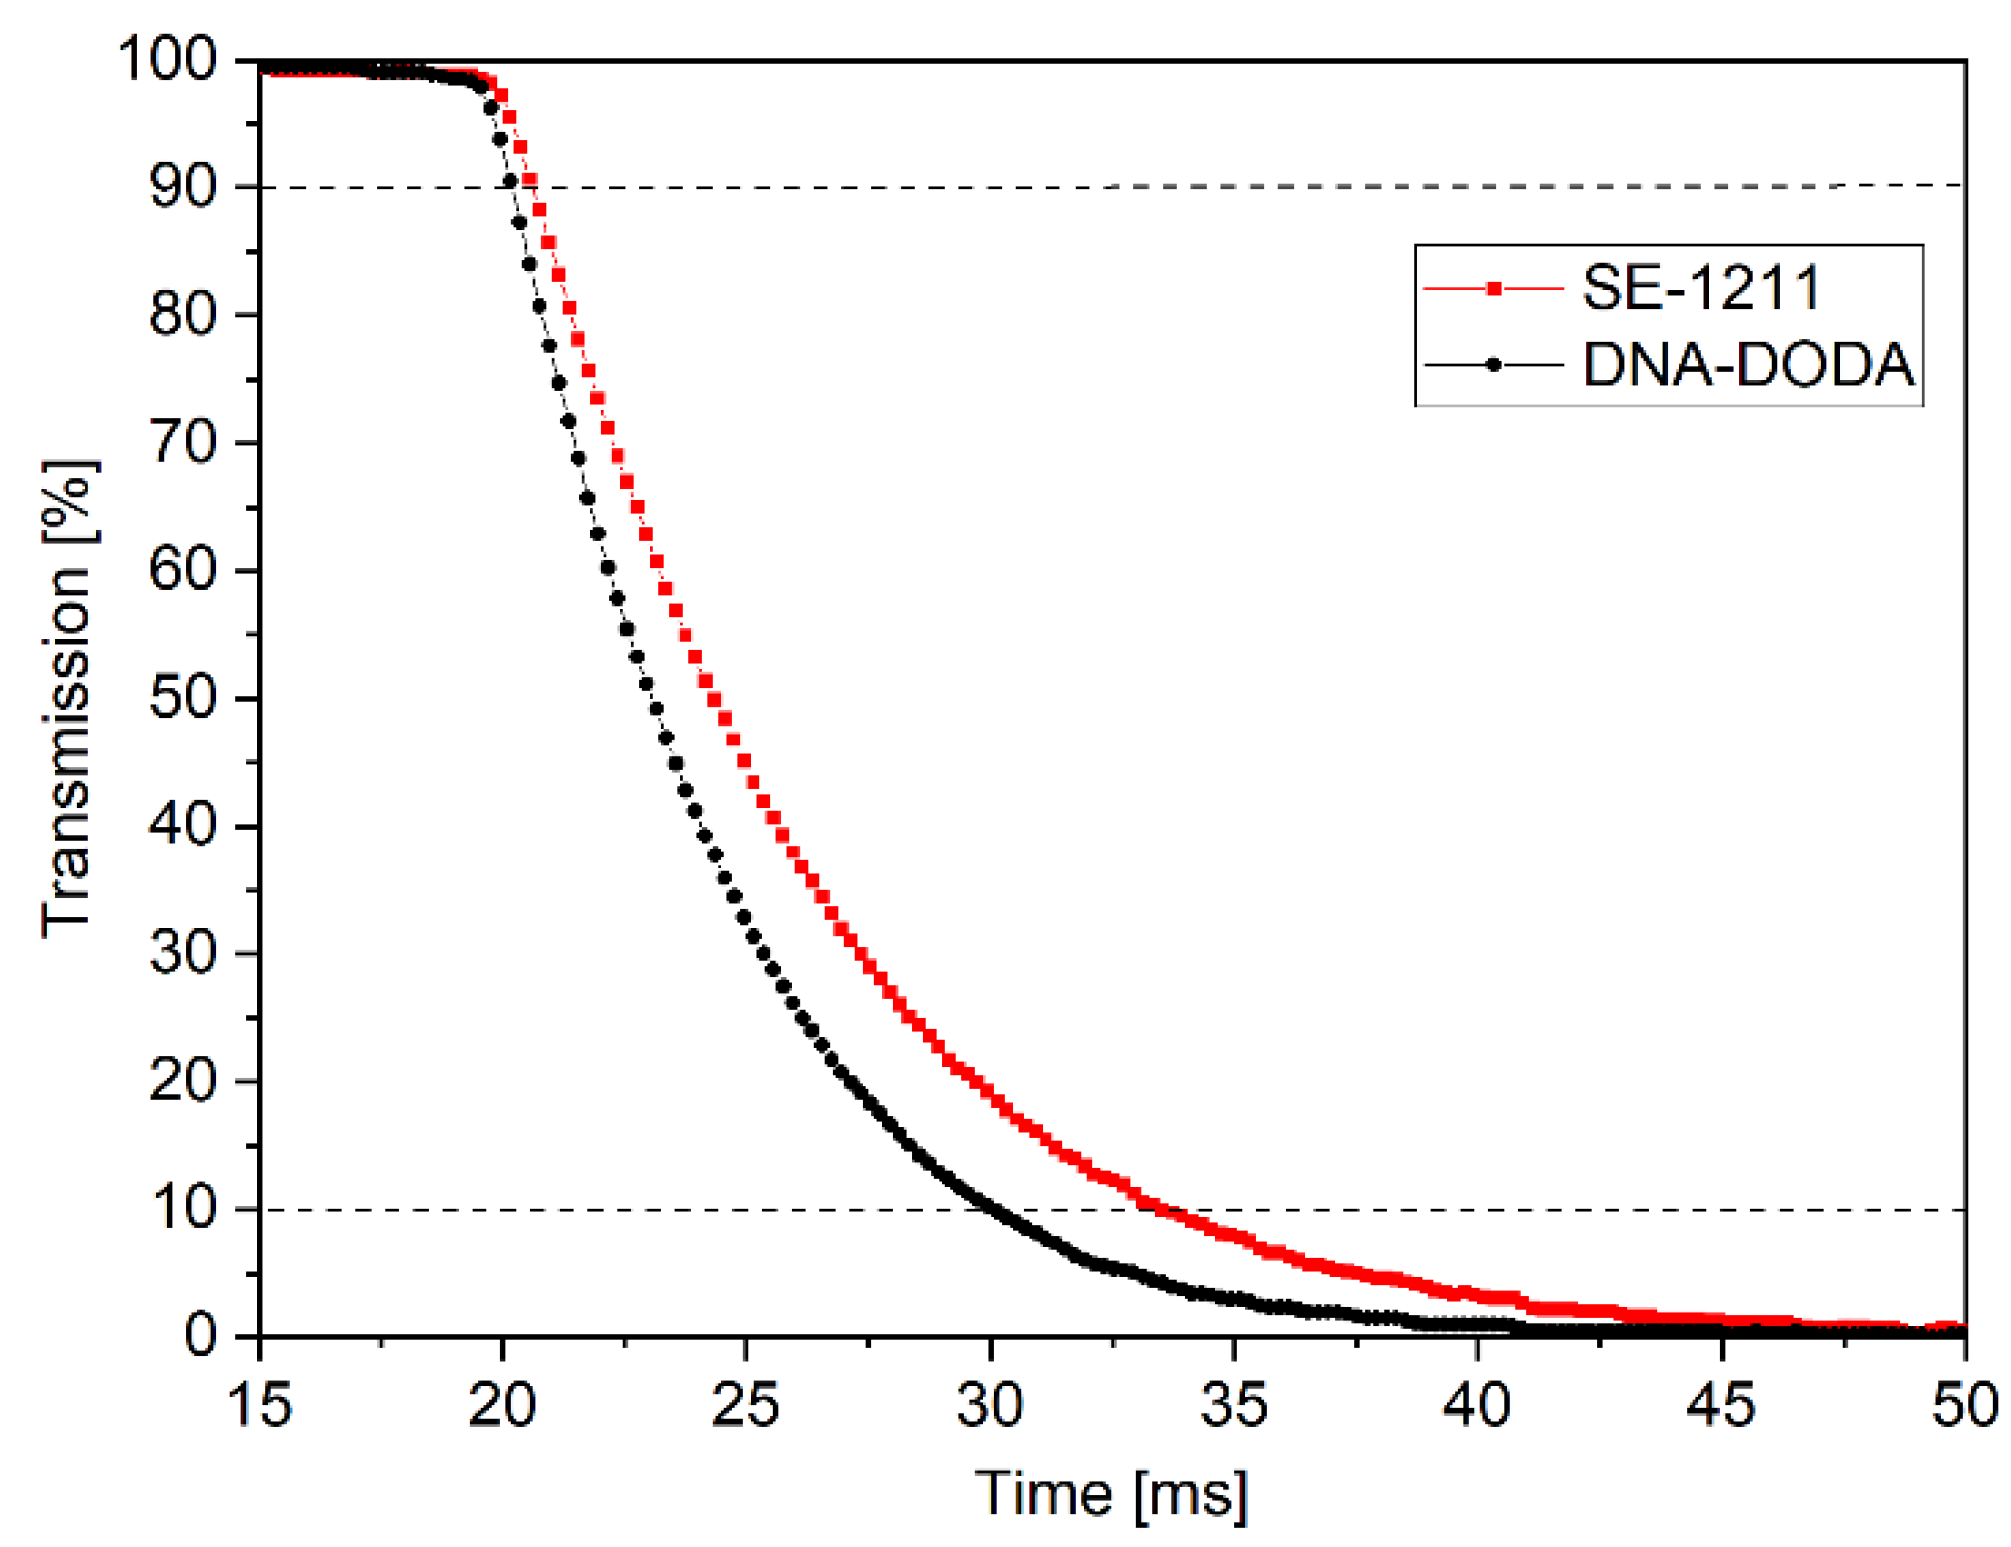

Table 1.
Experimentally determined parameters of layer wettability and surface free energy.
| Sample | SFE [mN/m] | Disperse [mN/m] | Polar [mN/m] | CA H₂O [°] | CA CH₂I₂ [°] |
| GLASS* | 31,00 ± 2,03 | 29,58 ± 2,12 | 1,42 ± 0,61 | 95,02 ± 4,90 | 58,25 ± 3,69 |
| DNA | 36,34 ± 1,78 | 2,06 ± 0,63 | 34,28 ± 1,21 | 89,79 ± 7,16 | 49,98 ± 2,15 |
| DODA | 47,08 ± 1,78 | 22,14 ± 0,31 | 24,94 ± 1,92 | 54,33 ± 2,53 | 71,32 ± 0,56 |
| DNA-DODA | 20,46 ± 0,26 | 19,96 ± 0,23 | 0,51 ± 0,23 | 106,90 ± 1,75 | 75,31 ± 0,43 |
Disclaimer/Publisher’s Note: The statements, opinions and data contained in all publications are solely those of the individual author(s) and contributor(s) and not of MDPI and/or the editor(s). MDPI and/or the editor(s) disclaim responsibility for any injury to people or property resulting from any ideas, methods, instructions or products referred to in the content. |
© 2025 by the authors. Licensee MDPI, Basel, Switzerland. This article is an open access article distributed under the terms and conditions of the Creative Commons Attribution (CC BY) license (http://creativecommons.org/licenses/by/4.0/).
Copyright: This open access article is published under a Creative Commons CC BY 4.0 license, which permit the free download, distribution, and reuse, provided that the author and preprint are cited in any reuse.


