Submitted:
29 April 2025
Posted:
30 April 2025
You are already at the latest version
Abstract
Acute myeloid leukemia is a heterogeneous hematological malignancy associated with a poor prognosis. Activating mutations in the FLT3 gene occur in approximately 30% of AML cases, with internal tandem duplications in the juxtamembrane domain (FLT3-ITD; 75%) and mutations in the tyrosine kinase domain (FLT3-TKD; 25%). FLT3-ITD mutations are linked to poor prognosis and offer significant clinical predictive value, whereas the implications of FLT3-TKD mutations are less understood. The Hedgehog-Gli pathway is an established therapeutic target in AML, and emerging evidence suggests crosstalk between FLT3-ITD signaling and Gli expression regulation via non-canonical mechanisms. Posttranslational modifications involving myristic and palmitic acids regulate various cellular processes, but their role in AML remains poorly defined. In this study, we investigate the role of fatty acid synthase (FASN), which synthesizes myristic and palmitic acids and catalyzes palmitoyl-acyltransferation, in regulating FLT3-ITD-Gli signaling. FASN knockdown using shRNA and the FASN inhibitor TVB-3166 was performed in FLT3-ITD-mutated AML cell lines (MOLM13, MV411) and Baf3-FLT3-ITD cells. The impact of FASN inhibition was assessed through Western blot and kinome profiling, while biological implications were evaluated by measuring cell viability and proliferation. FASN inhibition resulted in reduced levels of phospho-Akt (pAkt), phospho-S6 kinase (pS6), and decreased expression of Hedgehog-Gli1, confirming non-canonical regulation of Gli by FLT3-ITD signaling. Combining TVB-3166 with the Gli inhibitor GANT61 significantly reduced the survival of MOLM13 and MV411 cells.
Keywords:
fatty acid synthase (FASN)
; palmitoylation
; TVB-3166
; AML
; FLT3-ITD mutation
; Akt
; S6 kinase
; MAPK
; Gli1
; Hedgehog signaling
1. Introduction
Acute myeloid leukemia (AML) is a rare and aggressive hematological malignancy driven by various oncogenic mutations, including those affecting growth factor receptors, transcription factors, and chromatin-spliceosome complex modulators. Numerous recurrent chromosomal and molecular aberrations have significant prognostic and predictive implications in clinical practice. FLT3 mutations are the most common, occurring in approximately 30% of newly diagnosed adult AML patients [1,2]. Two major types of FLT3 mutations have been identified: internal tandem duplication (FLT3-ITD) within the juxtamembrane domain (75%) and mutations in the tyrosine kinase domain (FLT3-TKD) (25%). Additionally, FLT3-ITD mutations outside the juxtamembrane domain, such as the FLT3_ITD627E mutation, have been characterized. However, their biological and clinical characteristics are not yet fully understood [3]. Both mutations are constitutively active, leading to the downstream activation of pathways like STAT5, PI3K/Akt, and RAS/ERK [4,5]. FLT3-TKD activates signaling from the plasma membrane (PM), while FLT3-ITD primarily localizes to the endoplasmic reticulum (ER), activating the STAT5 pathway [2,6,7]. Furthermore, these mutations have distinct prognostic implications, with FLT3-TKD mutations typically associated with a better prognosis compared to FLT3-ITD mutations [8,9].
S-palmitoylation is a reversible post-translational modification (PTM) that plays a crucial role in the localization and function of many proteins, including receptor tyrosine kinases (RTKs). This modification is mediated by diverse palmitoyl acyltransferases (PATs), such as ZDHHC-type enzymes (ZDHHCs), as well as by fatty acid synthase (FASN), which is additionally responsible for the biosynthesis of palmitic and myristic acid. FASN activity is regulated by a variety of metabolic and growth factors through signaling pathways such as PI3K-Akt-mTOR and ERK [10,11,12]. Recent studies have highlighted the cysteine residue C563 as essential for the palmitoylation of FLT3-ITD. Mutation of the residue (FLT3-ITD/C563S) disrupts palmitoylation, resulting in the re-localization of FLT3-ITD from the ER through the Golgi to the PM in a manner that is independent of palmitate. This shift alters FLT3-ITD signaling, favoring PI3K/Akt and RAS/ERK pathways while maintaining STAT5 activation, likely through an indirect mechanism. Interestingly, this alteration in signaling promotes AML progression in mice, suggesting that targeting FLT3-ITD depalmitoylation could offer a promising therapeutic strategy, potentially in combination with FLT3 inhibitors. [4,13].
In our study, we investigated the role of FASN in regulating FLT3-ITD and Hedgehog-Gli signaling in human and murine AML cell lines harboring FLT3-ITD mutations, based on the well-established crosstalk between these pathways, with the aim of exploring potential treatment combinations. Through kinome analysis and immunoblotting, we found that inhibiting FASN, either via shRNA or the FASN inhibitor TVB-3166, led to a significant downregulation of phospho-S6 (pS6), suggesting decreased p70-S6 kinase activity. This effect was observed in human AML cell lines (MOLM13, MV411) and Baf3-FLT3-ITD-mutant cells. The reduction in pS6 was accompanied by a decrease in Gli1 expression, consistent with previous reports of non-canonical Gli1 regulation through mTOR/S6 signaling, as observed in esophageal adenocarcinoma cells. Biologically, the downregulation of pS6 and Gli1 correlated with a significant reduction in cell viability following TVB-3166 treatment. These findings suggest that FASN inhibition disrupts key signaling pathways critical for AML cell survival, underscoring the potential for therapeutic strategies combining FASN inhibitors with agents such as PAT, FLT3 inhibitors, or Hedgehog pathway inhibitors.
2. Results
2.1. Establishment of Stable FASN Knockdown in MOLM13 and MV411
We generated stable FASN knockdowns in the AML cell lines MOLM13 and MV411, both of which harbor FLT3-ITD mutations, using two distinct lentiviral vectors kd1 and kd2. In MOLM13 cells, kd1 and kd2 reduced FASN expression by 71% and 63%, respectively, compared to the scrambled control (scr). Similarly, in MV411 cells, kd1 and kd2 significantly decreased FASN expression to 73% and 65%, respectively, compared to scr (Figure 1A,B).
2.2. Reprogramming of FLT3-ITD Mutant Pathways and Downregulation of Gli1 in MOLM13, MV411 and Baf3-FLT3-ITDmut Cells Upon FASN Inhibition
We first identified the regulation of serine/threonine kinases by FASN through functional kinome analysis. To investigate this, FASN expression was reduced using shRNA or the FASN inhibitor TVB-3166. A significant downregulation of S6 and Akt was observed in MOLM13 and MV411 cells following FASN knockdown kd2, compared to scr, as well as upon treatment with 100nM TVB-3166 (Figure 2 and Figure 3).
To reproduce these findings, immunoblotting assays were performed. While pAkt levels could not be reliably assessed, we observed a significant reduction in pS6 levels in MOLM13 cells following kd2, and in MV411 cells following kd1 (Figure 4A,B). Notably, treatment with 100nM TVB-3166 led to a similar reduction in pS6 levels, occurring 24 hours after treatment in MOLM13 cells and 48 hours after treatment in MV411 cells (Supplementary Figure S3A.
To further validate these findings, pS6 levels were measured at 0, 24, and 48 hours in both FLT3-ITD mutant-transduced and wild-type Baf3 cells following treatment with TVB-3166. Transduced Baf3 cells showed a significant increase in FLT3-ITD expression (Figure 5A,C), confirming successful transduction compared to wild-type Baf3 cells. Treatment of Baf3-FLT3-ITD mutant cells with 100 nM TVB-3166 led to a significant reduction in pS6 levels at 24 hours post-treatment. In contrast, no significant change in pS6 levels was observed in untreated Baf3-FLT3-ITD mutant cells relative to wild-type Baf3 cells (Figure 5B,C). Additionally, fluctuations in FLT3 and pS6 expression were observed in untreated cells over the 0-48 hour time period. These variations are likely attributed to changes in metabolic conditions during the two-day incubation period (Figure 5C).
Furthermore, we investigated the potential link between FASN activity and the Hedgehog signaling pathway by analyzing Gli1 expression. FASN knockdown in MOLM13 and MV411 cells resulted in significant downregulation of Gli1, especially with kd2 (Figure 6A,B). Additionally, we confirmed the downregulation of Gli1 by FASN knockdown kd2 in MOLM13 cells through a biologically independent assay (Supplementary Figure S3B).
Additionally, treatment with 100nM TVB-3166 even led to a marginally significant downregulation of pFLT3 in MOLM13 cells over the 0-48h time interval, compared to DMSO treatment during the same period (Figure 9A). However, no significant changes in pFLT3 levels were detected in MV411 cells upon treatment with TVB-3166 (Figure 9B).
2.3. Reduction in the Viability of MOLM13 and MV411 Cells Upon Combined Treatment with the FASN Inhibitor TVB-3166 and Gli 1/2 Inhibitor GANT61
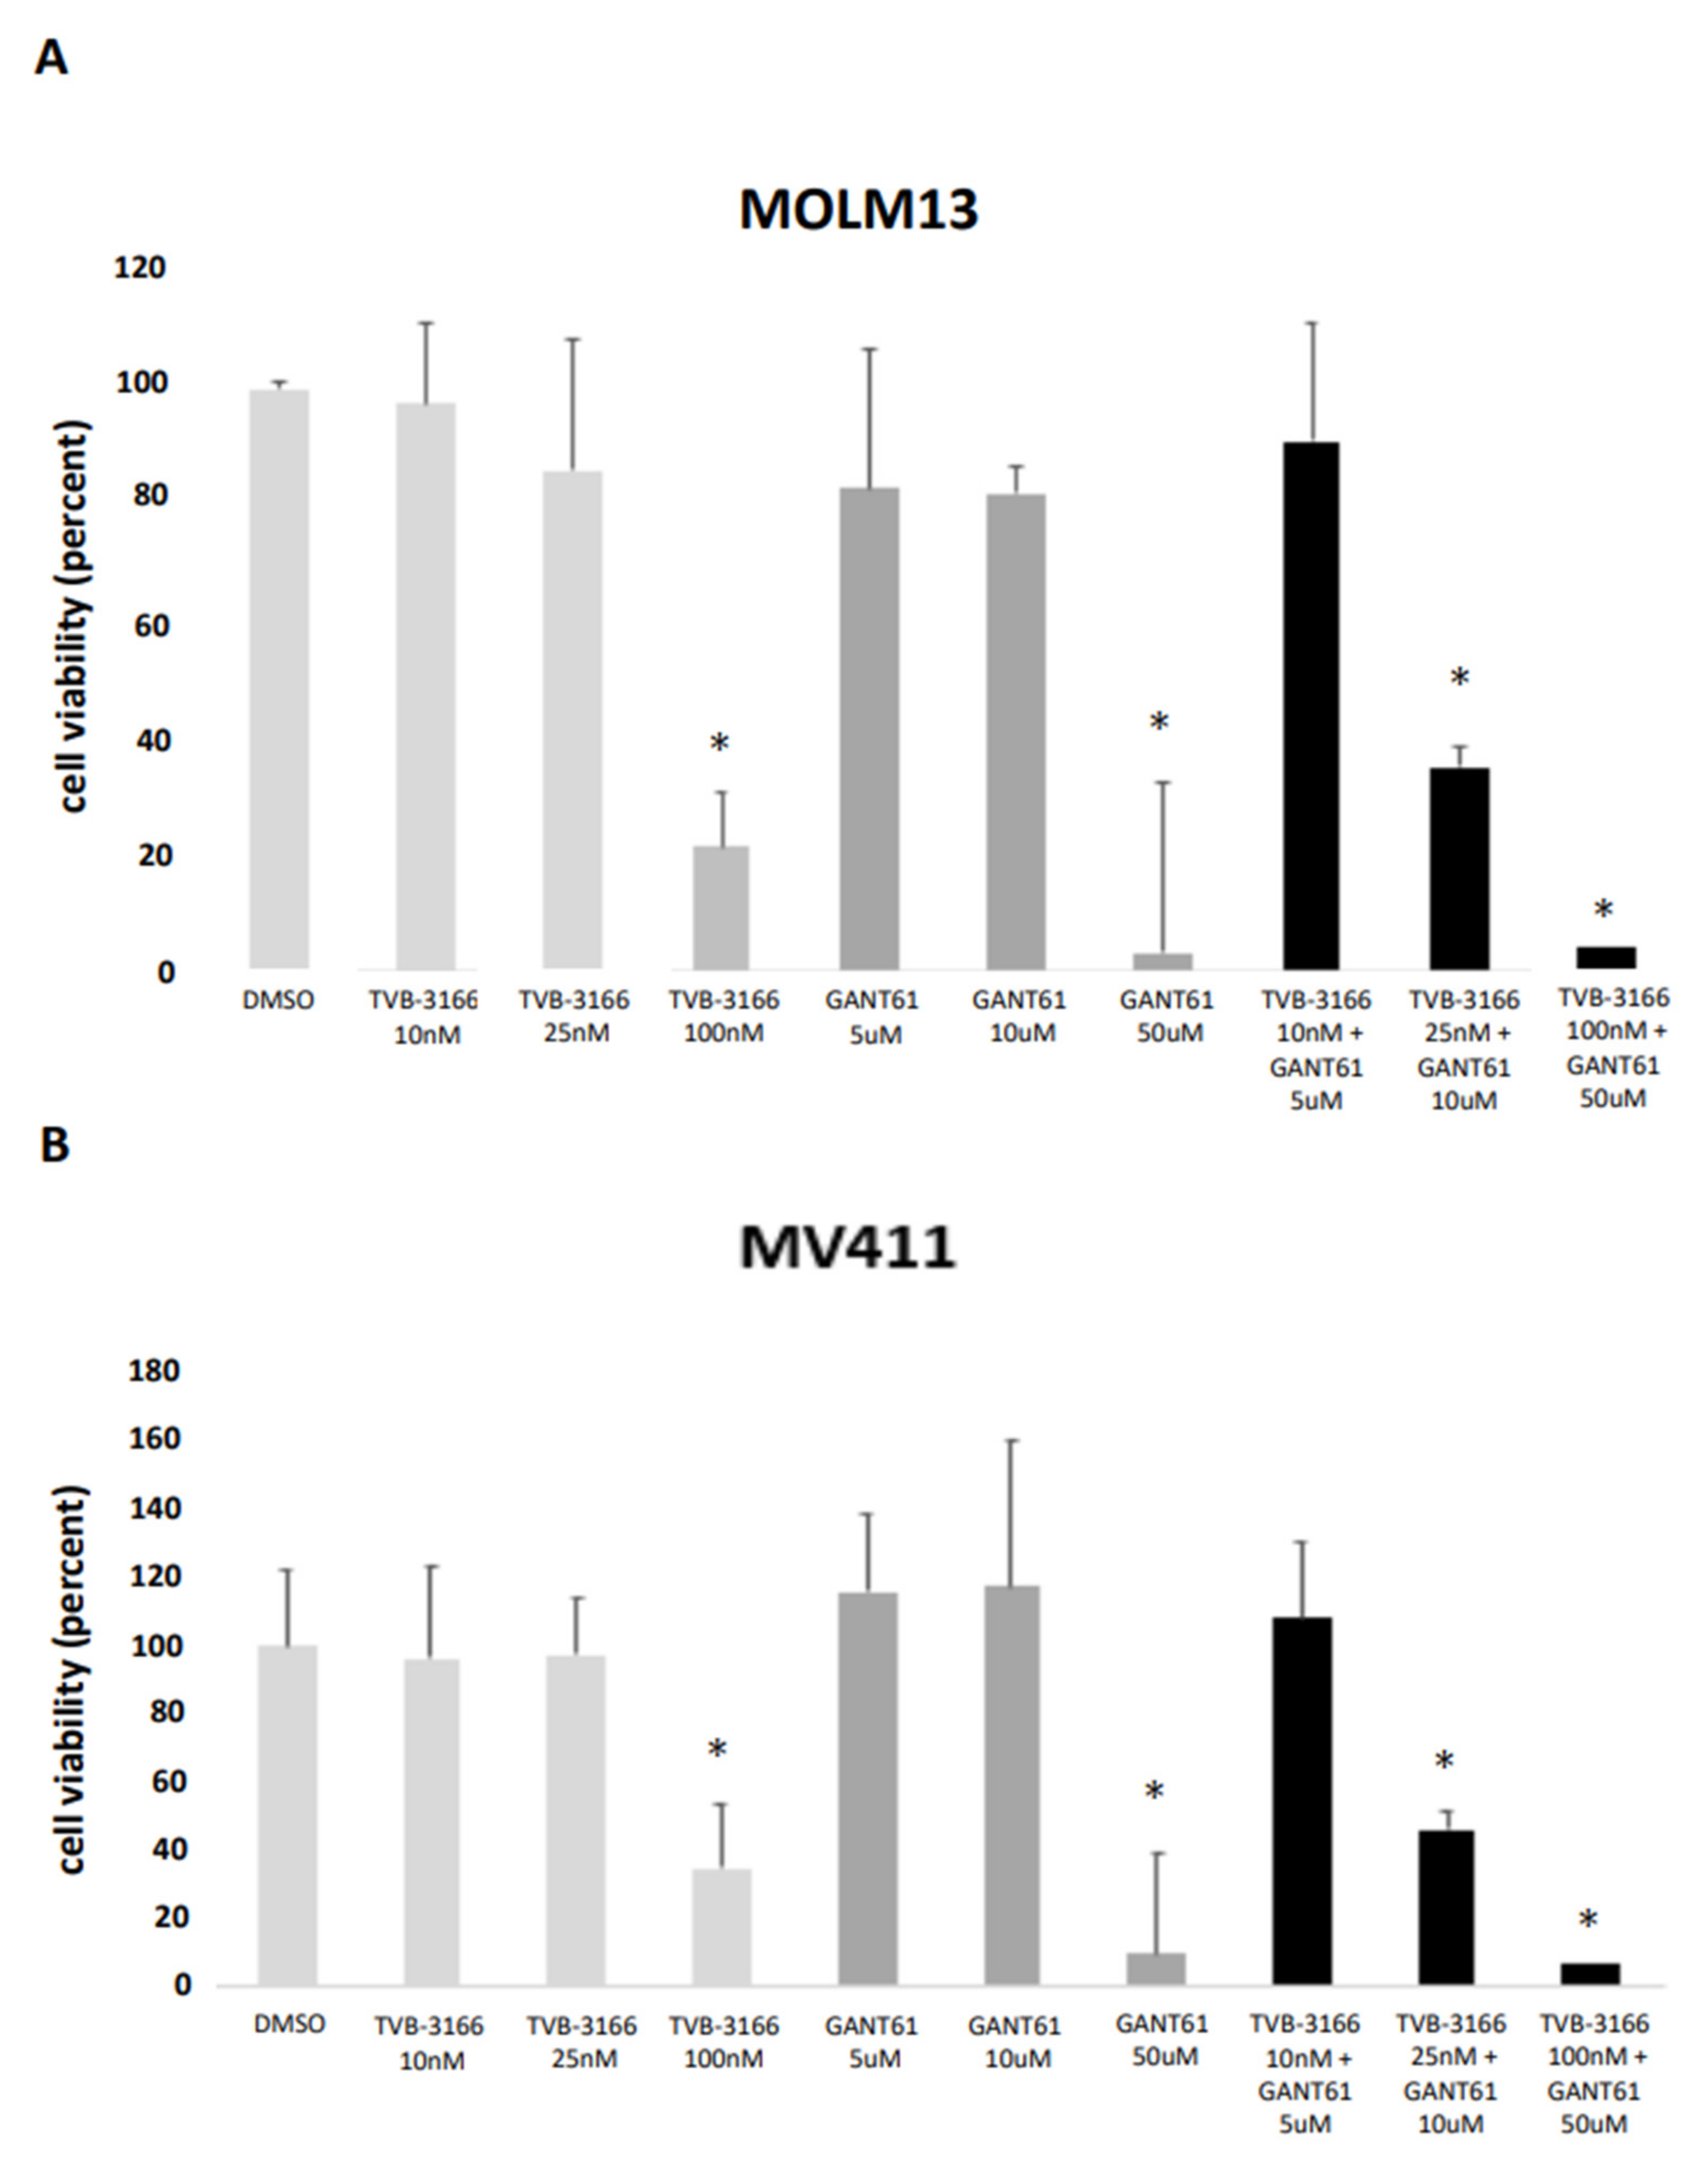
The reported IC₅₀ values for TVB-3166 range from 20nM to 200nM [12], while the known IC₅₀ for GANT61, which prevents DNA binding of Gli1, is approximately 5μM [15]. In our study, TVB-3166 caused a significant decrease in cell viability in both MOLM13 and MV411 cells at concentrations ranging from 100nM to 250nM. However, treatment with lower concentrations of TVB-3166 (10nM and 25nM) did not significantly impact cell viability in either cell line. To confirm the inhibitor’s effect, we also evaluated cell viability in stable FASN knockdown cell lines, kd1 and kd2. No significant changes were observed in either MOLM13 or MV411 cells (Figure 10A,B; Supplementary Figure S4A). Similarly, GANT61 did not significantly affect cell viability in MOLM13 or MV411 cells at concentrations of 5μM and 10μM, respectively. However, the combination of 25nM TVB-3166 and 10μM GANT61 resulted in a marked and significant reduction in cell viability in both cell lines (Figure 10A,B).
We also evaluated cell proliferation in MOLM13 and MV411 cells following FASN inhibition via shRNA or treatment with TVB-3166. Neither genetic nor pharmacological inhibition of FASN resulted in significant changes in proliferative activity in either cell line (Supplementary Figure S4B).
3. Discussion
FLT3 mutations are among the most common in adult AML and are associated with varying clinical outcomes. These mutations predominantly occur as FLT3-ITD (75%) or FLT3-TKD (25%), each driving distinct downstream signaling pathways [1,7]. FLT3-ITD, often associated with the cytoplasmic tyrosine kinase Lyn, preferentially activates STAT5, while FLT3-TKD primarily, and independently of Lyn, activates the PI3K/Akt and Src/JAK/STAT3 pathways [5,16].
Kaosheng Lv et al. demonstrated that S-palmitoylation of FLT3-ITD at cysteine residue C563, mediated by the palmitoyl acyltransferase ZDHHC6, is essential for FLT3-ITD-STAT5 signaling in FLT3-ITD mutated AML. Surprisingly, disruption of palmitoylation reprogrammed cellular signaling by promoting the retention of FLT3-ITD in the ER, followed by its subsequent trafficking through the Golgi to the PM. In this study, the anchoring of FLT3-ITD to the PM occurred after inhibition of a palmitoyl acyltransferase, resulting in palmitate-independent activation of Akt, ERK, and STAT5, thereby driving AML progression in mice [4].
In our study, we first investigated the role of FASN, which, unlike ZDHHCs, is involved in both palmitic acid synthesis and protein palmitoylation, in regulating FLT3-ITD signaling. Stable FASN knockdowns via shRNA were established in two human leukemia cell models, MOLM13 and MV411. FASN knockdown resulted in a corresponding reduction in both palmitic and myristic acid concentrations. Interestingly, despite these changes, FLT3 phosphorylation remained unaffected. This can be explained by the findings of Kaosheng Lv et al. [4], which ultimately suggest a palmitic acid-independent activity of FLT3-ITD on the PM following its re-localization from the ER upon palmitoylation inhibition. Further analysis of signaling pathways revealed a downregulation of pS6 in both MOLM13 and MV411 cells following FASN knockdown via shRNA or inhibition with the FASN inhibitor TVB-3166. Similarly, in Baf3 cells transduced with the FLT3-ITD mutant, we observed comparable downregulation of pS6 upon treatment with TVB-3166. These results are consistent with the findings of Matias Blaustein et al. and Shasha Yin et al., who demonstrated that Akt-mTOR activity directly depends on their palmitoylation state [17,18]. Since S6 kinase is a direct target of the Akt-mTOR-p70S6 pathway, the downregulation of Akt due to reduced FASN activity likely leads to decreased phospho-mTOR and pS6 levels. However, our observation of pAkt and pS6 downregulation contrasts with the upregulation of pAkt reported by Kaosheng Lv et al. One possible explanation is that the authors focused primarily on inhibiting protein palmitoylation without addressing palmitic acid synthesis. Additionally, they did not evaluate the expression levels or activity of other PATs, nor the palmitoylation status of key signaling molecules like Akt, mTOR, ERK, and STAT5 upon ZDHHC6 inhibition. As a result, other PATs, such as FASN or other ZDHHCs, may compensate for the loss of ZDHHC6 activity by preserving or even enhancing the palmitoylation of these molecules, thereby maintaining the phosphorylation state and activity of FLT3-associated downstream signaling pathways. In conclusion, our findings suggest that FASN inhibition regulates RTKs, such as FLT3-ITD, through a distinct mechanism that is separate from the regulation of serine-threonine kinases like Akt, mTOR, and S6 kinase.
Furthermore, we investigated whether FASN activity influences the expression of Gli1, a key downstream effector of the Hedgehog pathway, in our AML cell models. This inquiry is based on the well-established non-canonical activation of Gli downstream of FLT3-ITD signaling in AML, as well as in other malignancies [19,20,21,22]. Additionally, the correlation between elevated Gli expression and poor prognosis in AML, along with the clinical approval of Glasdegib - a Hedgehog-Smoothened (SMO) inhibitor - for AML treatment [23], underscores the rationale for exploring the combined targeting of FLT3, FASN, and Gli. We observed a consistent downregulation of Gli1 in both AML cell models, MOLM13 and MV411, following FASN inhibition via shRNA. This finding aligns with the established direct regulation of Gli expression by S6 kinase, as demonstrated, for example, in esophageal adenocarcinoma [14].
Finally, we tested the functionality of our findings by determining cell viability and proliferation following treatment with TVB-3166 and GANT61, as well as in stable FASN knockdown MOLM13 and MV411 cells. We observed no significant changes in cell viability when either inhibitor was used alone at lower concentrations (10-25nM for TVB-3166, 5-10µM for GANT61). However, the combination of both inhibitors at these concentrations led to a strong and significant reduction in cell viability. Notably, we observed no significant changes in cell viability under FASN knockdown, nor were there substantial differences in proliferation in either cell line following treatment with TVB-3166 or FASN shRNA. In the stable FASN knockdown cells, the lack of effects may be due to a cellular steady state maintained under knockdown conditions, particularly upon prolonged puromycin exposure. The lack of reduced cell proliferation following inhibition of the PI3K/Akt signaling pathway has been observed by several research groups. For instance, treatment of mammary tumor cell lines with the FGFR tyrosine kinase inhibitor TKI258 led to a significant decrease in cell survival by inducing apoptosis. However, no significant changes in proliferation markers were observed [24]. The authors attributed this discrepancy to the insufficient pro-apoptotic activity of TKI258, which was unable to overcome the growth-promoting signals. An alternative explanation for the absence of effects on cell proliferation could be that apoptotic signaling may paradoxically drive tumor proliferation, a phenomenon observed in various tumor models. Consequently, several studies have linked elevated levels of apoptosis with poor prognosis in cancer [25,26,27].
4. Materials and Methods
4.1. Materials and Reagents
4.1.1. Antibodies
The monoclonal antibodies directed against pFLT3 (#3464S), panAkt (#4685S), pAkt S473 (#4060S), S6 (#2217S), pS6 (#2215S), MAPK (#4695S), pMAPK (#4377S) were purchased from Cell Signaling Technology (Beverly, MA, USA) and monoclonal antibodies directed against FASN (#48357), FLT3 (#sc-479) and Gli-1 (#515751) were purchased from Santa Cruz Biotechnology (Heidelberg, Germany). The anti-mouse IgG HRP-linked antibody (#7076) and anti-rabbit IgG HRP-linked antibody (#7074) were from Cell Signaling Technology (Beverly, MA, USA).
4.1.2. Vectors
PLKO.1-puro vectors encoding either FASN or non-targeting (scrambled, scr) shRNA were purchased from Sigma-Aldrich (Taufkirchen, Germany). The human FLT3-ITD gene was transferred from pMys-IG-FLT3-ITD (R1079), a kind gift from Carol Stocking at the Leibniz Institute of Virology, into the third-generation lentiviral vector LeGO-iB2/Zeo via Not I cloning. Sequence identity was confirmed by Sanger sequencing.
4.1.3. Inhibitors
TVB-3166 developed and kindly provided by Sagimet Biosciences/former 3-V-Biosciences (San Mateo, California).
4.2. Methods
4.2.1. Culturing of Cells
The following cell lines, available in the ExPASy Cellosaurus database, were used: MOLM13 (RRID:CVCL_2119), MV411 (RRID:CVCL_0064), HEK293 (RRID:CVCL_0045), and Baf3 (RRID:CVCL_0161). MOLM13, MV411, Baf3, and HEK293T cells (see Supplemental section) were obtained from the German Collection of Microorganisms and Cell Cultures GmbH (DSMZ) and authenticated using the Multipexion test. All experiments were performed with mycoplasma-free cells, as confirmed by routine testing. Cell density was maintained between 3 × 10^5 and 3 × 10^6 viable cells/mL. Cell concentrations were evaluated using the standard trypan blue exclusion assay and a Neubauer chamber. MOLM13 and MV411, two human FLT3-ITD mutant AML cell lines, were cultured in RPMI supplemented with 20% FCS and 1% Penicillin/Streptomycin (P/S). Parental Baf3 cells, as well as empty vector control cells, were cultured in RPMI 1640 medium with 10% FCS, 1% P/S, 1% Glutamine, and 5 ng/mL recombinant murine IL-3. Baf3-FLT3-ITD cells, expressing FLT3-ITD mutant, along with a fusion of mTagBFP and Zeocin resistance (Sh ble) from LeGO-FLT3-ITD-iB2/Zeo, were maintained in the absence of IL-3. HEK-293T cells, a human derivative expressing a mutant version of the SV40 large T antigen, were cultured in DMEM supplemented with 10% FCS and without P/S. Cells were handled in a class II safety cabinet to prevent contamination and were incubated at 37°C with 5% CO2.
4.2.2. Transformation and Plasmid Preparation
100μl Xl1 blue bacteria were incubated with 100ng plasmid DNA following the manufacturer’s instruction. The NucleoBond Xtra plasmid purification Kit (Sigma-Aldrich, Taufkirchen, Germany) was used to purify plasmid DNA (s. Supplemental).
4.2.3. Lentiviral Knockdown of FASN
PLKO.1-puro encoding FASN-shRNA or scr control were purchased from Sigma-Aldrich (Taufkirchen, Germany). Two FASN knockdown clones (kd1 and kd2) were generated to assess the reproducibility of the results. HEK293T cells were plated in DMEM medium at a density of 2 × 10^5 cells per 10 cm dish for each knockdown. On the day of transfection, 2.5 μg of each vector DNA was diluted in 20 μl P3000 reagent, followed by the addition of 8 μg VSVG, gagPol, and an HIV1-Rev encoding plasmid. Transfection was performed using the Lipofectamine kit according to the manufacturer’s instructions. Target cells were seeded at a density of 3 × 10^5 cells per well in 2 ml RPMI medium. The supernatant was harvested and added to the target cells 24 and 48 hours post-transduction. Selection was performed with 4 μg/ml puromycin and considered complete when all cells in the untransfected control wells were dead. All work with lentiviral particles was conducted in an S2 facility with approval according to German law.
4.2.4. Immunoblotting
Protein extracts were prepared using NP40 lysis buffer (BostonBioProducts). Protein concentration was determined using the DC protein assay kit (Munich, Germany). Protein lysates were separated by size on a 4-20% SDS-PAGE gel (Thermo Fisher Scientific), with a voltage range of 120V to 175V. Following electrotransfer to nitrocellulose membranes (Amersham/GE Healthcare, Amersham, England) at 65V for two hours, the membranes were stained with Ponceau solution until protein bands were visible. The membranes were then cut into appropriate sizes or sections based on the proteins of interest. The membranes were incubated overnight at 8°C with primary antibodies diluted 1:1000. Secondary antibodies were applied at a dilution of 1:5000 and incubated at room temperature for one hour. After washing, the membranes were developed using the LAS 4000 imager and the SuperSignal West Dura chemiluminescence substrate kit (Thermo Fisher Scientific).
4.2.5. Fatty Acid Analysis
The fatty acid composition of cell extracts was determined by gas chromatography coupled with mass spectrometry. Cell pellets were resuspended in 50 µl of water, and 100 µl of an internal standard mix (tetradecanoate d27 and heptadecanoate d33, 200 µg/ml each in Methanol/Toluene 4/1) was added, followed by 1000 µl of Methanol/Toluene 4/1. The cells were vortexed, and 100 µl of acetyl chloride was added. The samples were mixed vigorously and heated at 100°C for 1 hour to prepare fatty acid methyl esters. After cooling to room temperature, 3 ml of 6% sodium carbonate was added, and the samples were mixed vigorously again. The mixture was centrifuged (1,800 g for 5 minutes), and the upper layer was transferred to autosampler vials. Gas chromatography analyses were performed using a Trace 1310 gas chromatograph (Thermo Fisher) equipped with a DB-225 stationary phase (30 m × 0.25 mm i.d., film thickness 0.25 µm; Agilent) coupled to an ISQ 7000 GC-MS mass spectrometer (Thermo Fisher Scientific, Dreieich, Germany). Peak identification and quantification were performed by comparing retention times and peak areas to standard chromatograms and internal standards.
4.2.6. Functional Kinome Profiling
Functional kinome profiling of serine/threonine kinases has been described previously [24]. In this study, we used a PamStation®12 (UCCH Kinomics Core Facility, Hamburg) and PTK-PamChip® arrays to profile tyrosine kinases according to the manufacturer’s instructions (PamGene International, ‘s-Hertogenbosch, The Netherlands). Briefly, whole cell lysates were prepared using 100 μl of M-PER Mammalian Extraction Buffer containing Halt Phosphatase Inhibitor and ethylenediaminetetraacetic acid (EDTA)-free Halt Protease Inhibitor Cocktail (1:100 each; Pierce, Waltham, Massachusetts, USA) per 1 × 10^6 cells. The lysed samples were immediately stored at -80°C. Protein quantification was performed using the bicinchoninic acid (BCA) assay according to the manufacturer’s instructions (Merck KGaA, Darmstadt, Germany). For each array, 1 μg of protein and 400 μM ATP were applied. Sequence-specific peptide tyrosine and serine/threonine phosphorylation were detected using the fluorescein-labeled antibody PY20 (Exalpha, Maynard, Massachusetts, USA) and a CCD camera, with data acquisition managed by the Evolve software (PamGene International, ‘s-Hertogenbosch, The Netherlands). Data analysis was conducted using BioNavigator software (PamGene International, ‘s-Hertogenbosch, The Netherlands).
4.2.7. Cell Viability Assay
MOLM13 and MV411 cells with scr or FASN knockdown were counted using the standard trypan blue exclusion assay with a Neubauer chamber. Untransfected MOLM13 and MV411 cells were incubated with the following compounds for 5 days: DMSO (control), TVB3166 at concentrations ranging from 10 nM to 250 nM, or GANT61 at 5 μM to 50 μM, as well as with various individual combinations. After incubation, cell counts were determined using the Vi-CELL™ XR (Beckman Coulter, Germany).
4.2.8. Proliferation Assay
For inhibitor treatment, MOLM13 and MV411 cells were plated in a 96-well plate at a density of 10,000 cells per well and incubated in 100 μl of RPMI with 20% FCS and 1% P/S per well. Cell confluence was measured using the IncuCyte Zoom imaging system (Essen Bioscience). After 24 hours, 100 μl of inhibitor solution was added. MOLM13 and MV411 cells with scr or FASN knockdown were also plated in a 96-well plate (Greiner BioOne, Frickenhausen, Germany) at 10,000 cells per well and incubated in 200 μl of RPMI with 20% FCS, 1% P/S, and 1.5 μg/ml puromycin.
4.3. Statistical Analysis
Western blot data were primarily analyzed as technical triplicates or quadruplicates. Cell viability and proliferation were assessed using biological triplicates. To evaluate statistical significance, an unpaired t-test was performed. Statistical significance is indicated in the graphs as follows: * for p < 0.05, ** for p < 0.005, and *** for p < 0.001. Standard deviation is represented as error bars. The ratio between phosphorylated protein and total protein was calculated to highlight genuine changes in phosphorylation, eliminating the influence of variations in total protein levels that could result from differences in protein expression. For better standardization in western blot quantification, most data analyses were based on total protein quantification using either HSC70 or β-Actin as loading controls.
4.3.1. Software
Microsoft Office 2007
Graphpad Prism: Version 8.2
AIDA Image Analyzer: Version 3.44
Zotero: 6.0.20
5. Conclusions
Inhibition of FASN, which plays a key role in both palmitic acid synthesis and protein palmitoylation, by the FASN inhibitor TVB-3166 led to downregulation of the Akt-S6 axis and Gli1 expression, significantly affecting the survival of AML cells. Given that several FASN inhibitors are currently undergoing oncologic clinical trials, further investigations are needed to explore potential combinatory treatment strategies involving FASN, Hedgehog, or FLT3 inhibitors in AML with FLT3-ITD mutations [28,29].
Supplementary Materials
The following supporting information can be downloaded at the website of this paper posted on Preprints.org.
Author Contributions
M.K. and M.J. planned and supervised the study. R.Z. planned and performed experiments and analyzed the data. M.Kr., K.H., S.H., A. W. performed experiments, wrote and reviewed the manuscript. S.H. kindly provided Baf3 wild type and Baf3-FLT-ITD mutated cell lines. N.v.B., C.K., N.G., S.P.G. kindly provided financial support and reviewed the manuscript. W.F. and C.B. reviewed the manuscript. M. K. wrote the manuscript. All authors have read and agreed to the published version of the manuscript.
Funding
This study was supported by grants from the Deutsche Forschungsgemeinschaft (DFG) (INST 337/15-1, INST 337/16-1, INST 152/837-1 and INST 152/947-1 FUGG).
Conflicts of Interest
All the authors of this article have declared ‘‘no conflict of interest”.
Abbreviations
The following abbreviations are used in this manuscript:
| AML | Acute myeloid leukemia |
| FLT3 | FMS-like tyrosine kinase 3 |
| FLT3-WT | Wild-type FLT3 |
| FLT3-ITD | Internal tandem duplication |
| JM domain | Juxtamembrane domain |
| FLT3-TKD | Tyrosine kinase domain |
| PM | Plasma membrane |
| ERK | RAS/extracellular signal-regulated kinase |
| PIK3 | Phosphoinositide 3-kinase |
| C563 | Cysteine at position 563 |
| MAPK | Mitogen-activated protein kinase |
| SFKs | Src family kinases |
| FASN | Fatty acid synthase |
| RPS6 | Ribosomal Protein S6 |
| CD117 | Cluster of differentiation 117 |
| NPM1 | Nucleophosmin 1 |
| FGFR | Fibroblast growth factor receptor |
References
- Papaemmanuil, E.; Gerstung, M.; Bullinger, L.; Gaidzik, V.I.; Paschka, P.; Roberts, N.D.; Potter, N.E.; Heuser, M.; Thol, F.; Bolli, N.; et al. Genomic Classification and Prognosis in Acute Myeloid Leukemia. N Engl J Med 2016, 374, 2209–2221. [Google Scholar] [CrossRef] [PubMed]
- Gilliland, D.G.; Griffin, J.D. The roles of FLT3 in hematopoiesis and leukemia. Blood 2002, 100, 1532–1542. [Google Scholar] [CrossRef] [PubMed]
- Breitenbuecher, F.; Schnittger, S.; Grundler, R.; Markova, B.; Carius, B.; Brecht, A.; Duyster, J.; Haferlach, T.; Huber, C.; Fischer, T. Identification of a novel type of ITD mutations located in nonjuxtamembrane domains of the FLT3 tyrosine kinase receptor. Blood 2009, 113, 4074–4077. [Google Scholar] [CrossRef] [PubMed]
- Lv, K.; Ren, J.G.; Han, X.; Gui, J.; Gong, C.; Tong, W. Depalmitoylation rewires FLT3-ITD signaling and exacerbates leukemia progression. Blood 2021, 138, 2244–2255. [Google Scholar] [CrossRef]
- Hayakawa, F.; Towatari, M.; Kiyoi, H.; Tanimoto, M.; Kitamura, T.; Saito, H.; Naoe, T. Tandem-duplicated Flt3 constitutively activates STAT5 and MAP kinase and introduces autonomous cell growth in IL-3-dependent cell lines. Oncogene 2000, 19, 624–631. [Google Scholar] [CrossRef]
- Choudhary, C.; Olsen, J.V.; Brandts, C.; Cox, J.; Reddy, P.N.; Bohmer, F.D.; Gerke, V.; Schmidt-Arras, D.E.; Berdel, W.E.; Muller-Tidow, C.; et al. Mislocalized activation of oncogenic RTKs switches downstream signaling outcomes. Mol Cell 2009, 36, 326–339. [Google Scholar] [CrossRef]
- Patnaik, M.M. The importance of FLT3 mutational analysis in acute myeloid leukemia. Leuk Lymphoma 2018, 59, 2273–2286. [Google Scholar] [CrossRef]
- Sakaguchi, M.; Yamaguchi, H.; Kuboyama, M.; Najima, Y.; Usuki, K.; Ueki, T.; Oh, I.; Mori, S.; Kawata, E.; Uoshima, N.; et al. Significance of FLT3-tyrosine kinase domain mutation as a prognostic factor for acute myeloid leukemia. Int J Hematol 2019, 110, 566–574. [Google Scholar] [CrossRef]
- Li, S.; Li, N.; Chen, Y.; Zheng, Z.; Guo, Y. FLT3-TKD in the prognosis of patients with acute myeloid leukemia: A meta-analysis. Front Oncol 2023, 13, 1086846. [Google Scholar] [CrossRef]
- Choi, W.I.; Jeon, B.N.; Park, H.; Yoo, J.Y.; Kim, Y.S.; Koh, D.I.; Kim, M.H.; Kim, Y.R.; Lee, C.E.; Kim, K.S.; et al. Proto-oncogene FBI-1 (Pokemon) and SREBP-1 synergistically activate transcription of fatty-acid synthase gene (FASN). J Biol Chem 2008, 283, 29341–29354. [Google Scholar] [CrossRef]
- Van de Sande, T.; Roskams, T.; Lerut, E.; Joniau, S.; Van Poppel, H.; Verhoeven, G.; Swinnen, J.V. High-level expression of fatty acid synthase in human prostate cancer tissues is linked to activation and nuclear localization of Akt/PKB. J Pathol 2005, 206, 214–219. [Google Scholar] [CrossRef] [PubMed]
- Ventura, R.; Mordec, K.; Waszczuk, J.; Wang, Z.; Lai, J.; Fridlib, M.; Buckley, D.; Kemble, G.; Heuer, T.S. Inhibition of de novo Palmitate Synthesis by Fatty Acid Synthase Induces Apoptosis in Tumor Cells by Remodeling Cell Membranes, Inhibiting Signaling Pathways, and Reprogramming Gene Expression. EBioMedicine 2015, 2, 808–824. [Google Scholar] [CrossRef] [PubMed]
- Yamawaki, K.; Shiina, I.; Murata, T.; Tateyama, S.; Maekawa, Y.; Niwa, M.; Shimonaka, M.; Okamoto, K.; Suzuki, T.; Nishida, T.; et al. FLT3-ITD transduces autonomous growth signals during its biosynthetic trafficking in acute myelogenous leukemia cells. Sci Rep 2021, 11, 22678. [Google Scholar] [CrossRef]
- Lauth, M.; Bergstrom, A.; Shimokawa, T.; Toftgard, R. Inhibition of GLI-mediated transcription and tumor cell growth by small-molecule antagonists. Proc Natl Acad Sci U S A 2007, 104, 8455–8460. [Google Scholar] [CrossRef]
- Lim, S.H.; Dubielecka, P.M.; Raghunathan, V.M. Molecular targeting in acute myeloid leukemia. J Transl Med 2017, 15, 183. [Google Scholar] [CrossRef]
- Blaustein, M.; Piegari, E.; Martinez Calejman, C.; Vila, A.; Amante, A.; Manese, M.V.; Zeida, A.; Abrami, L.; Veggetti, M.; Guertin, D.A.; et al. Akt Is S-Palmitoylated: A New Layer of Regulation for Akt. Front Cell Dev Biol 2021, 9, 626404. [Google Scholar] [CrossRef]
- Abraham, A.; Matsui, W. Hedgehog Signaling in Myeloid Malignancies. Cancers (Basel) 2021, 13. [Google Scholar] [CrossRef]
- Wellbrock, J.; Latuske, E.; Kohler, J.; Wagner, K.; Stamm, H.; Vettorazzi, E.; Vohwinkel, G.; Klokow, M.; Uibeleisen, R.; Ehm, P.; et al. Expression of Hedgehog Pathway Mediator GLI Represents a Negative Prognostic Marker in Human Acute Myeloid Leukemia and Its Inhibition Exerts Antileukemic Effects. Clin Cancer Res 2015, 21, 2388–2398. [Google Scholar] [CrossRef]
- Lim, Y.; Gondek, L.; Li, L.; Wang, Q.; Ma, H.; Chang, E.; Huso, D.L.; Foerster, S.; Marchionni, L.; McGovern, K.; et al. Integration of Hedgehog and mutant FLT3 signaling in myeloid leukemia. Sci Transl Med 2015, 7, 291ra296. [Google Scholar] [CrossRef]
- Freisleben, F.; Modemann, F.; Muschhammer, J.; Stamm, H.; Brauneck, F.; Krispien, A.; Bokemeyer, C.; Kirschner, K.N.; Wellbrock, J.; Fiedler, W. Mebendazole Mediates Proteasomal Degradation of GLI Transcription Factors in Acute Myeloid Leukemia. Int J Mol Sci 2021, 22. [Google Scholar] [CrossRef]
- Cortes, J.E.; Heidel, F.H.; Hellmann, A.; Fiedler, W.; Smith, B.D.; Robak, T.; Montesinos, P.; Pollyea, D.A.; DesJardins, P.; Ottmann, O.; et al. Randomized comparison of low dose cytarabine with or without glasdegib in patients with newly diagnosed acute myeloid leukemia or high-risk myelodysplastic syndrome. Leukemia 2019, 33, 379–389. [Google Scholar] [CrossRef] [PubMed]
- Wang, Y.; Ding, Q.; Yen, C.J.; Xia, W.; Izzo, J.G.; Lang, J.Y.; Li, C.W.; Hsu, J.L.; Miller, S.A.; Wang, X.; et al. The crosstalk of mTOR/S6K1 and Hedgehog pathways. Cancer Cell 2012, 21, 374–387. [Google Scholar] [CrossRef] [PubMed]
- Dey, J.H.; Bianchi, F.; Voshol, J.; Bonenfant, D.; Oakeley, E.J.; Hynes, N.E. Targeting fibroblast growth factor receptors blocks PI3K/AKT signaling, induces apoptosis, and impairs mammary tumor outgrowth and metastasis. Cancer Res 2010, 70, 4151–4162. [Google Scholar] [CrossRef] [PubMed]
- Maeda, S.; Kamata, H.; Luo, J.L.; Leffert, H.; Karin, M. IKKbeta couples hepatocyte death to cytokine-driven compensatory proliferation that promotes chemical hepatocarcinogenesis. Cell 2005, 121, 977–990. [Google Scholar] [CrossRef]
- Kurtova, A.V.; Xiao, J.; Mo, Q.; Pazhanisamy, S.; Krasnow, R.; Lerner, S.P.; Chen, F.; Roh, T.T.; Lay, E.; Ho, P.L.; et al. Blocking PGE2-induced tumour repopulation abrogates bladder cancer chemoresistance. Nature 2015, 517, 209–213. [Google Scholar] [CrossRef]
- Huang, Q.; Li, F.; Liu, X.; Li, W.; Shi, W.; Liu, F.F.; O’Sullivan, B.; He, Z.; Peng, Y.; Tan, A.C.; et al. Caspase 3-mediated stimulation of tumor cell repopulation during cancer radiotherapy. Nat Med 2011, 17, 860–866. [Google Scholar] [CrossRef]
- Falchook, G.; Infante, J.; Arkenau, H.T.; Patel, M.R.; Dean, E.; Borazanci, E.; Brenner, A.; Cook, N.; Lopez, J.; Pant, S.; et al. First-in-human study of the safety, pharmacokinetics, and pharmacodynamics of first-in-class fatty acid synthase inhibitor TVB-2640 alone and with a taxane in advanced tumors. EClinicalMedicine 2021, 34, 100797. [Google Scholar] [CrossRef]
- Kelly, W.; Diaz Duque, A.E.; Michalek, J.; Konkel, B.; Caflisch, L.; Chen, Y.; Pathuri, S.C.; Madhusudanannair-Kunnuparampil, V.; Floyd, J.; Brenner, A. Phase II Investigation of TVB-2640 (Denifanstat) with Bevacizumab in Patients with First Relapse High-Grade Astrocytoma. Clin Cancer Res 2023, 29, 2419–2425. [Google Scholar] [CrossRef]
Figure 1.
FASN knockdown by kd1 and kd2 was further confirmed in both cell lines through a biologically independent assay (Supplementary Figure S1A,B). To evaluate the biological effects of FASN knockdown, we conducted fatty acid analysis using gas chromatography-mass spectrometry (GC-MS) with technical duplicates. In MOLM13 cells, FASN kd2 resulted in a reduction of palmitic acid levels from 100% to 90%, while in MV411 cells, kd1 and kd2 decreased myristic acid levels from 100% to 92% and 86%, respectively (Supplementary Figure S2A,B).
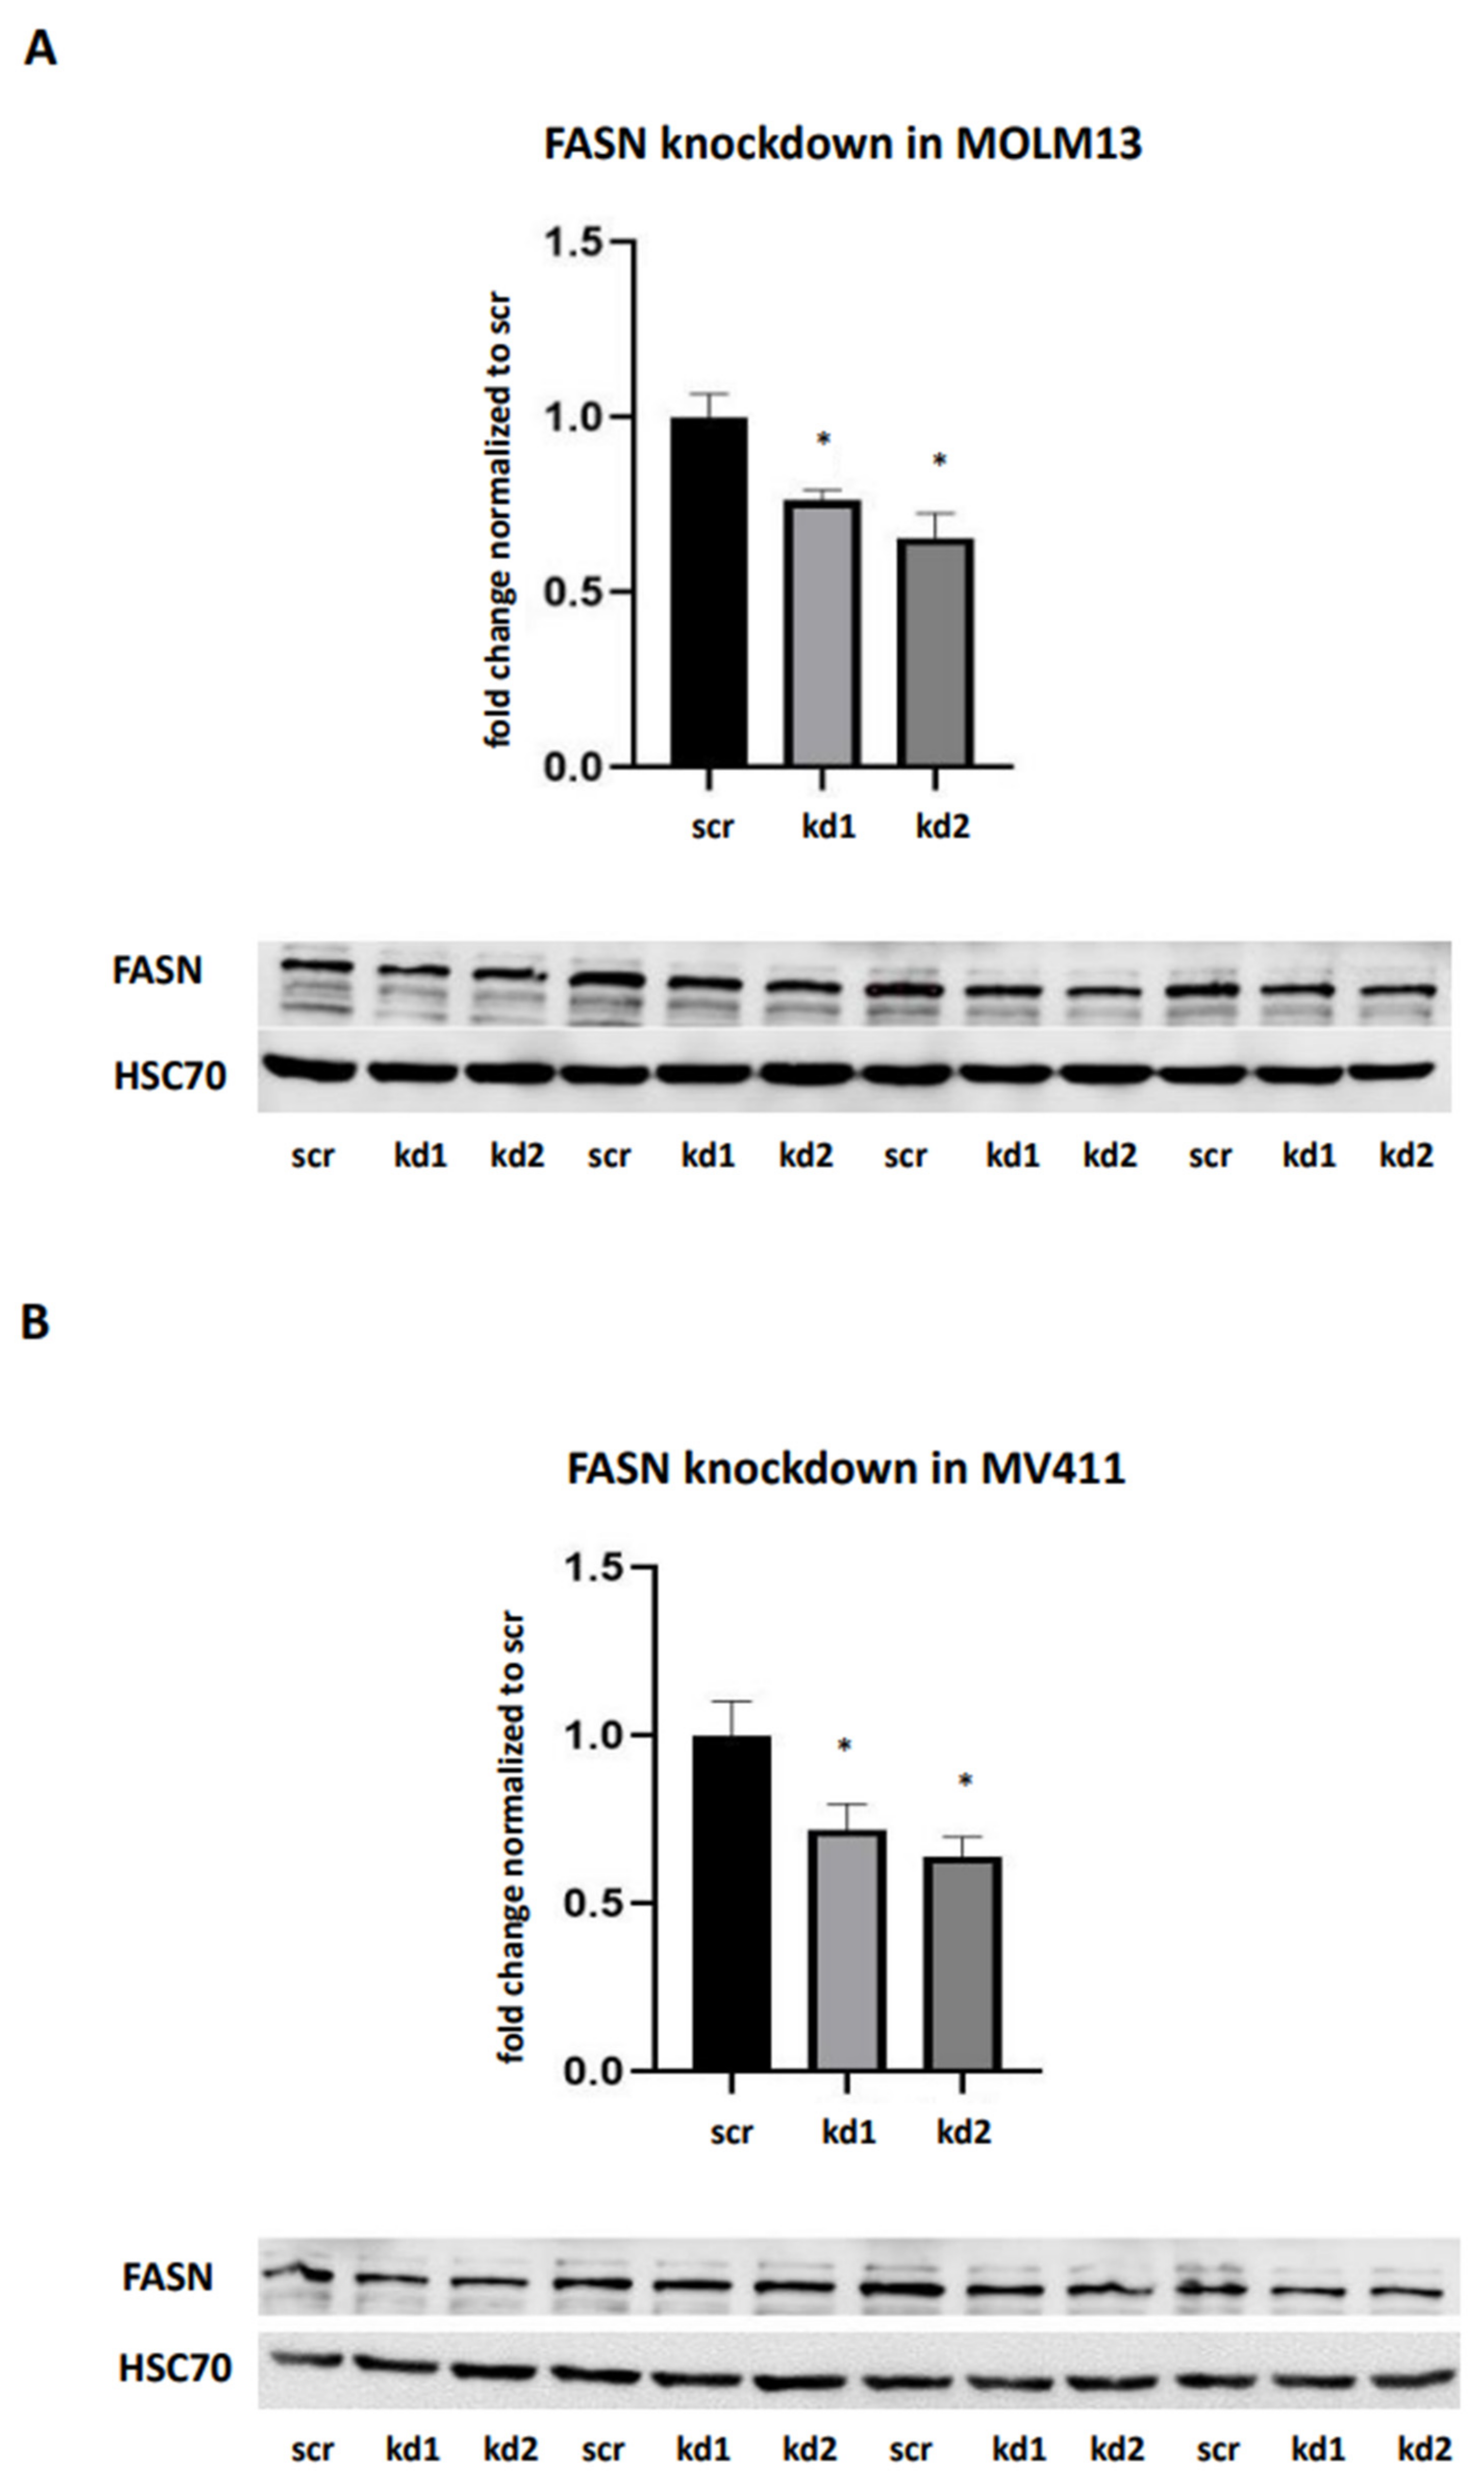
Figure 2.
.
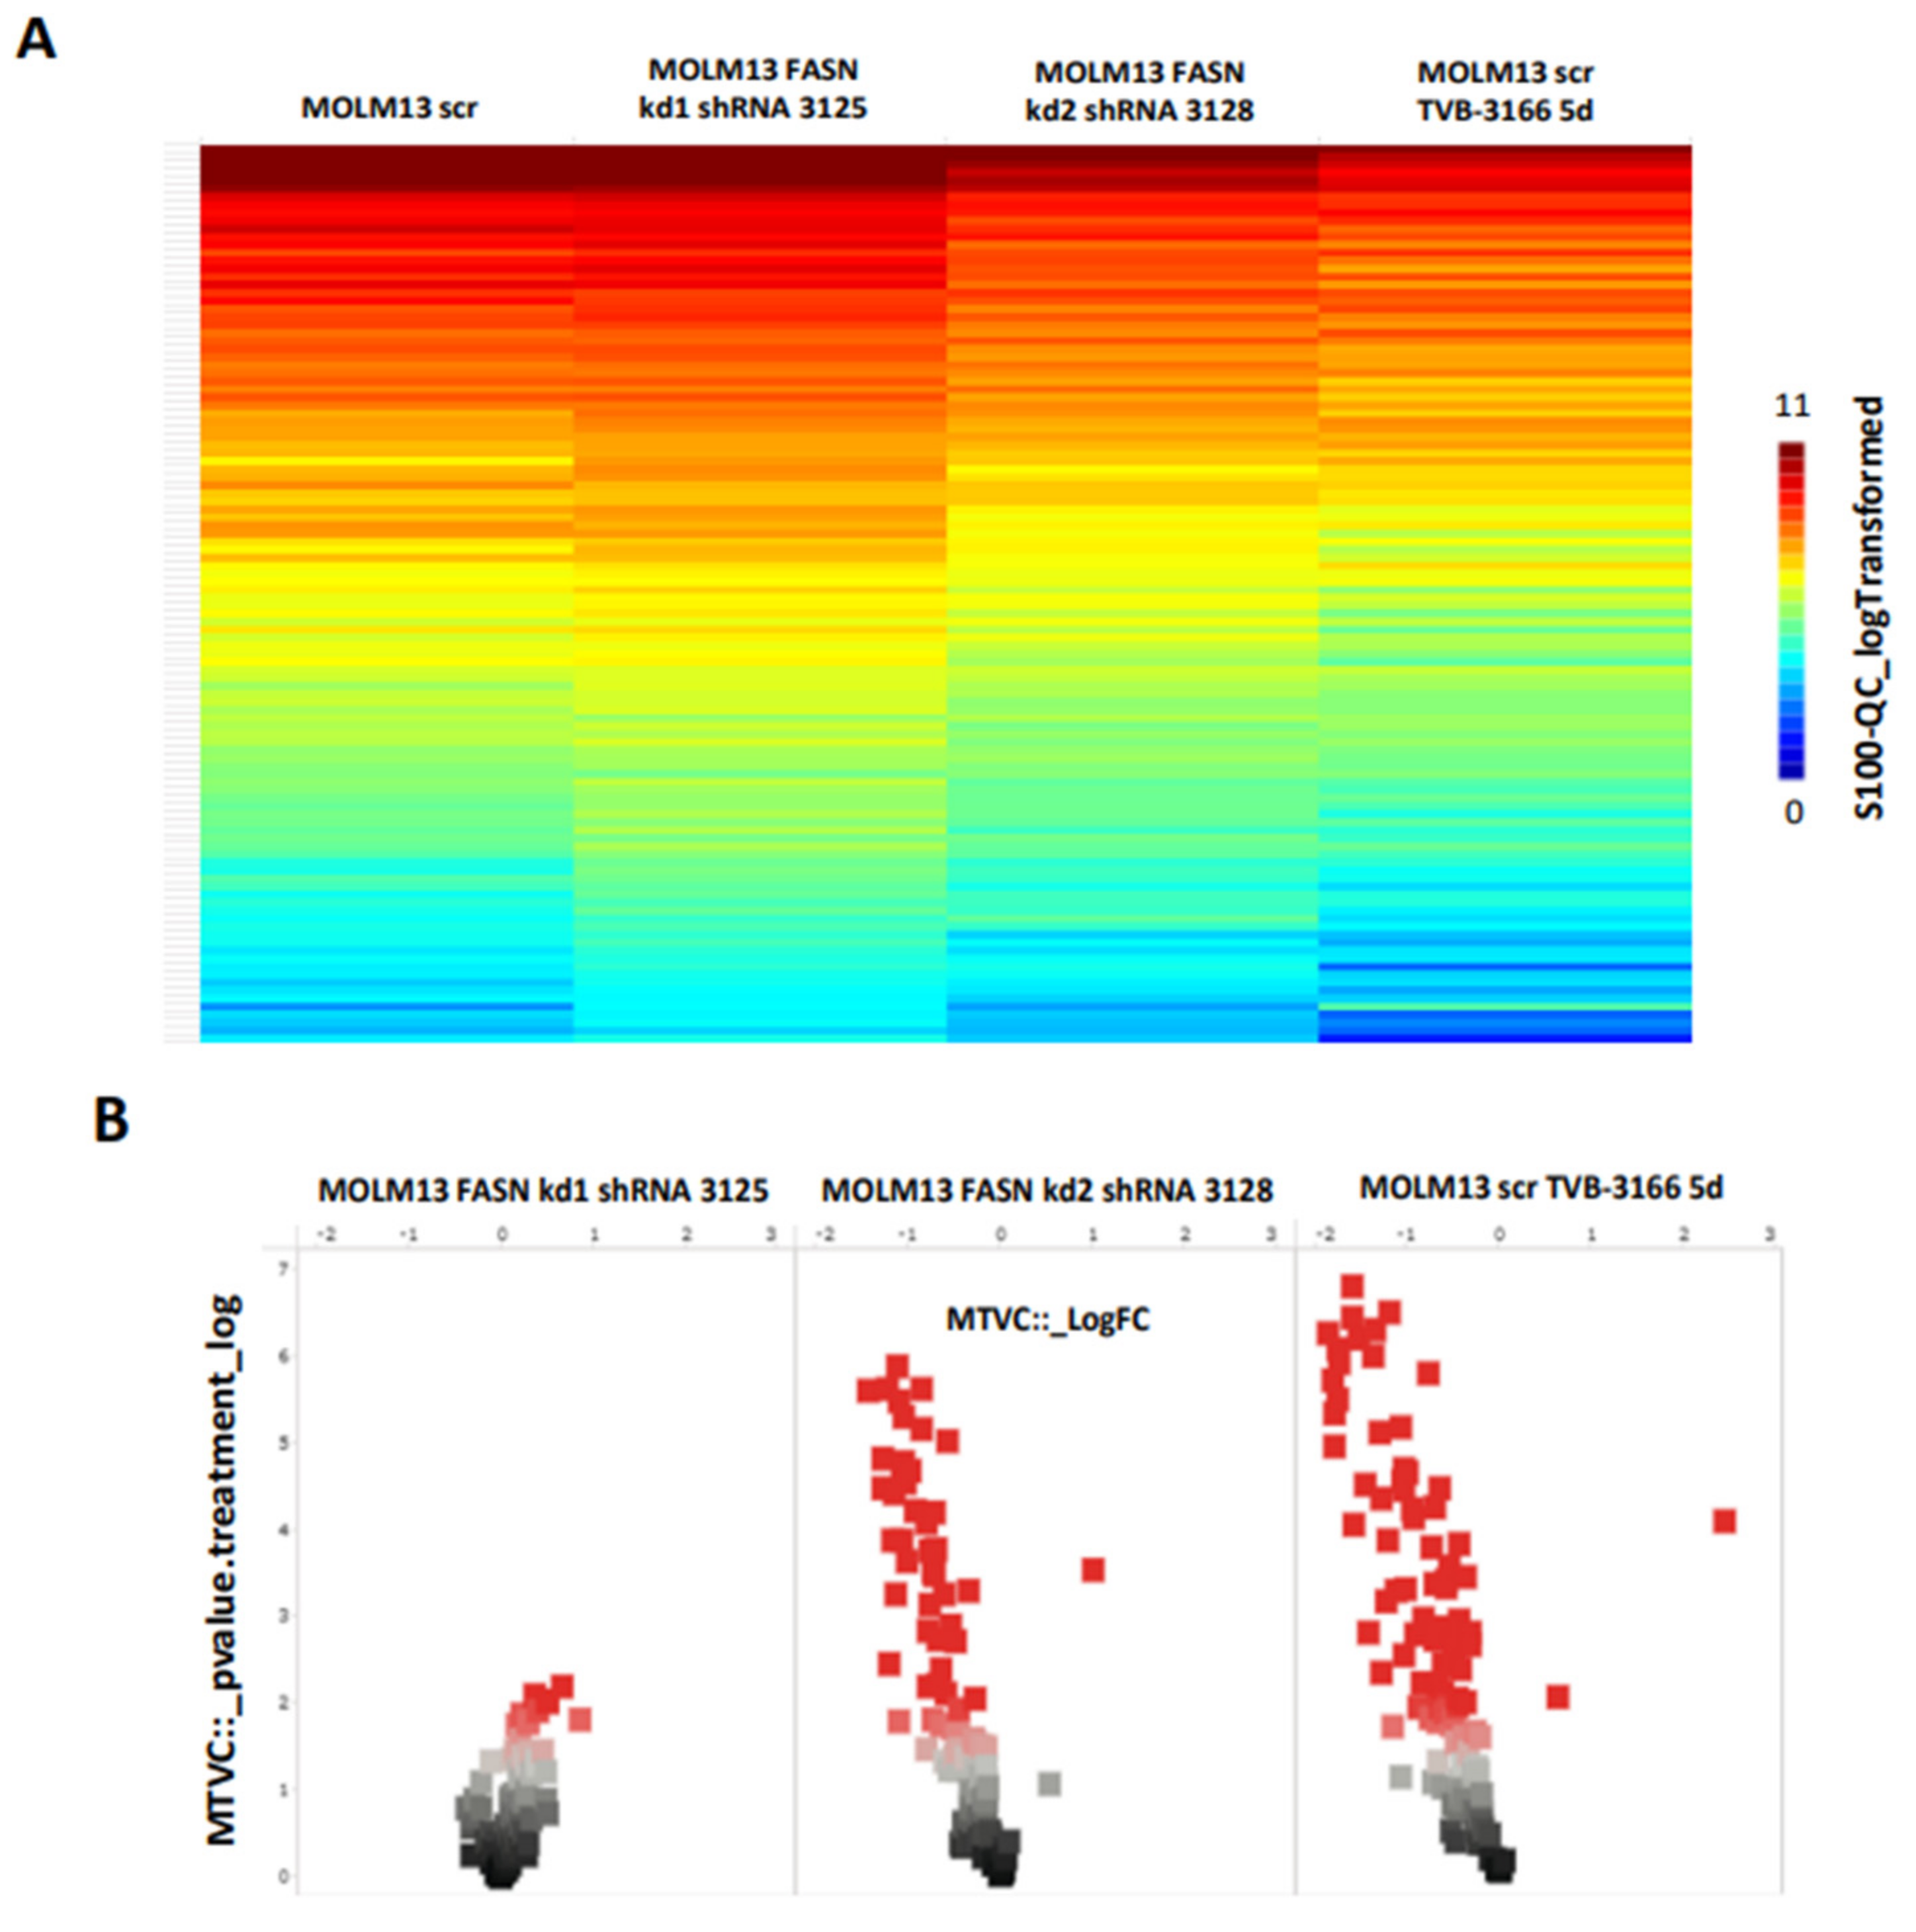
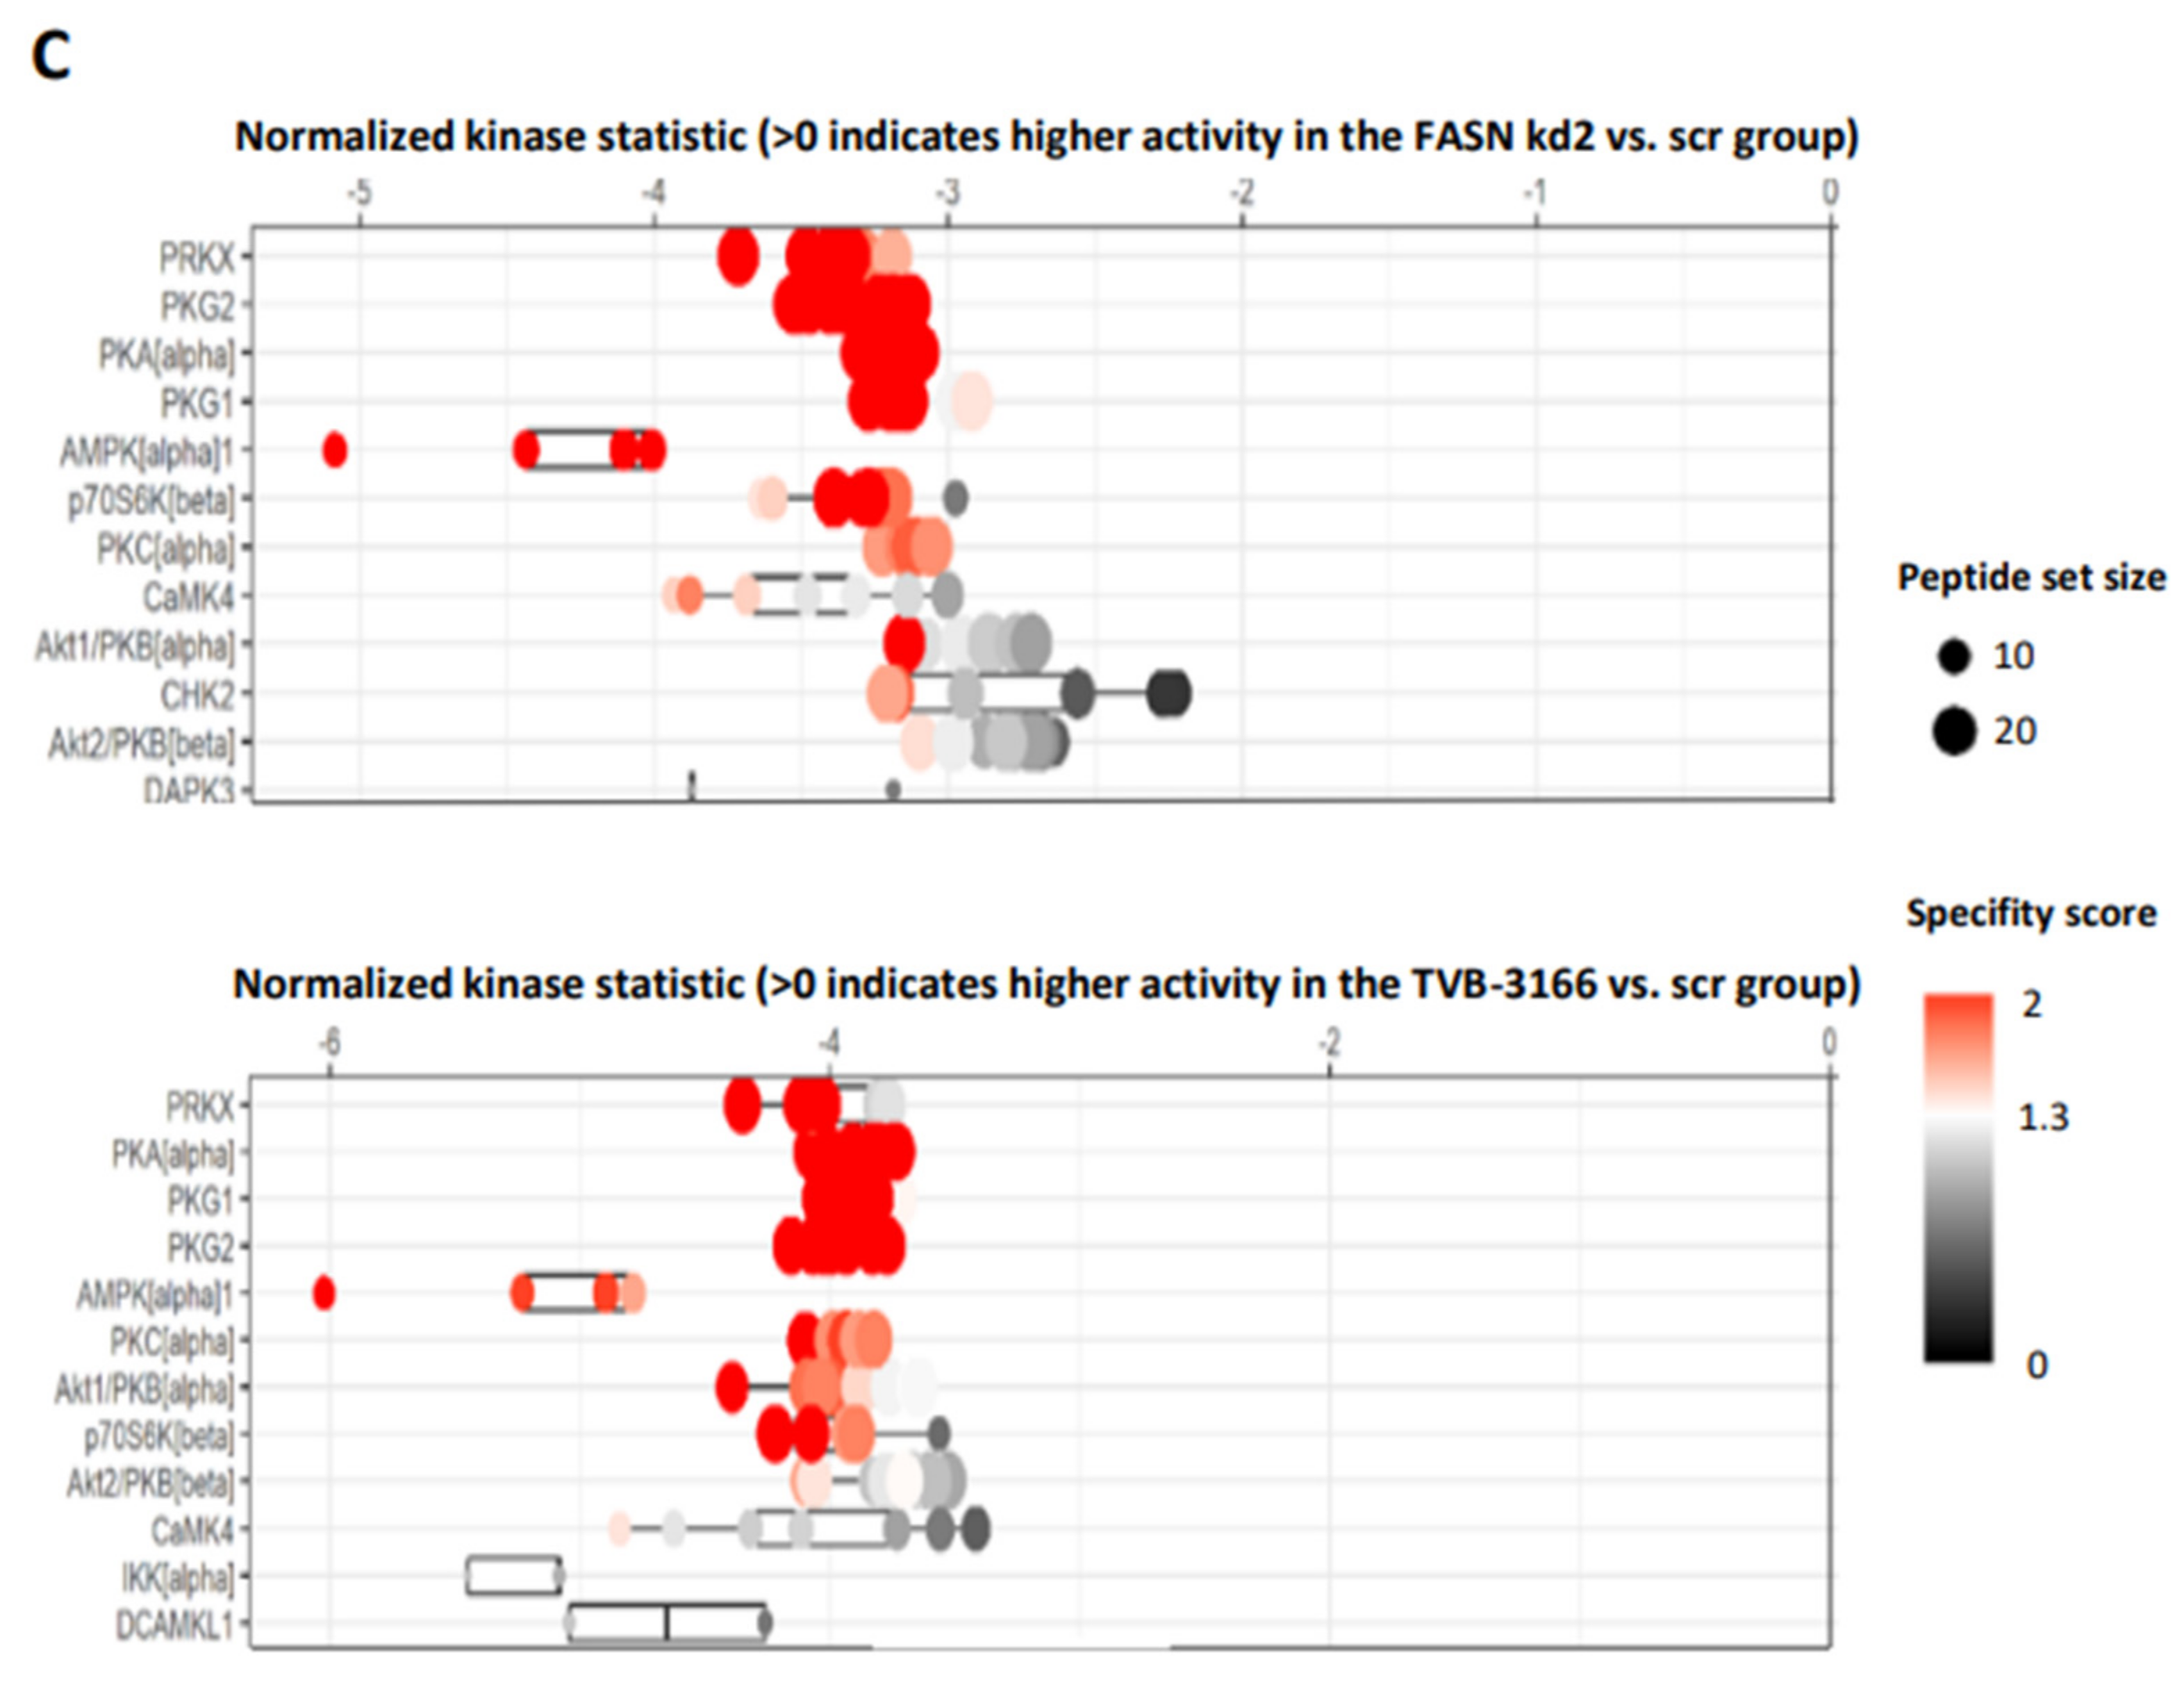
Figure 3.
.
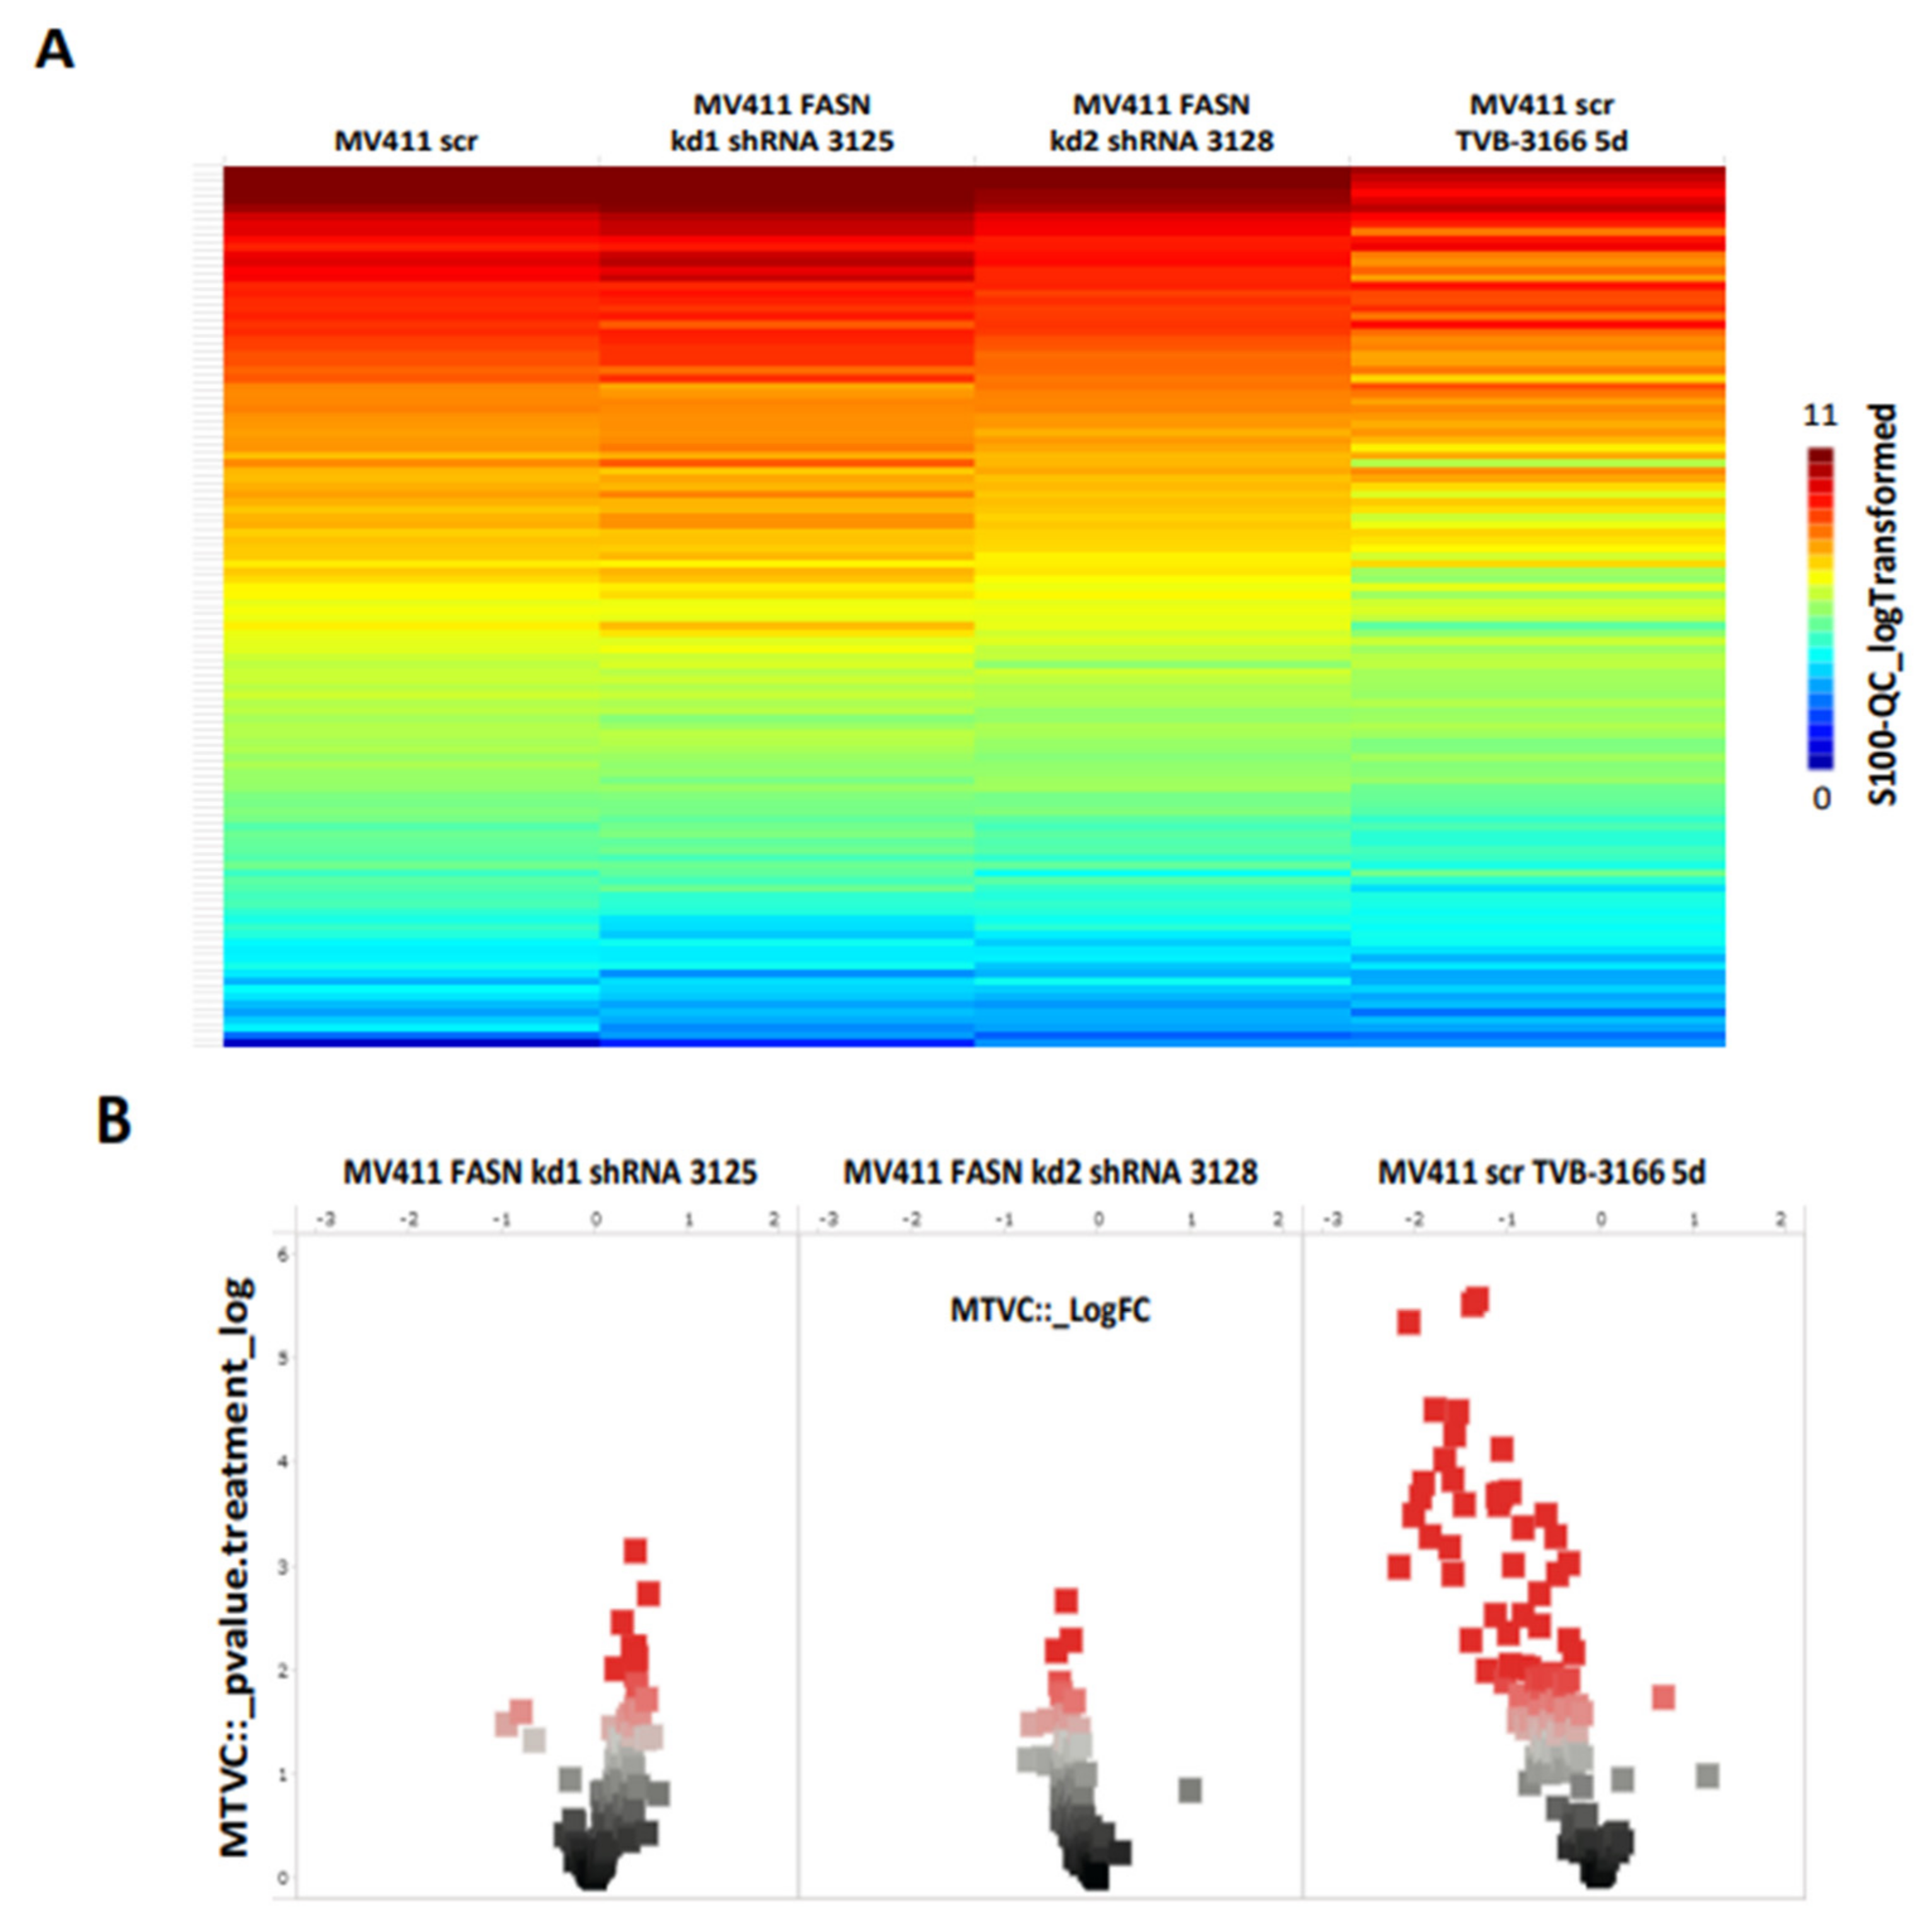
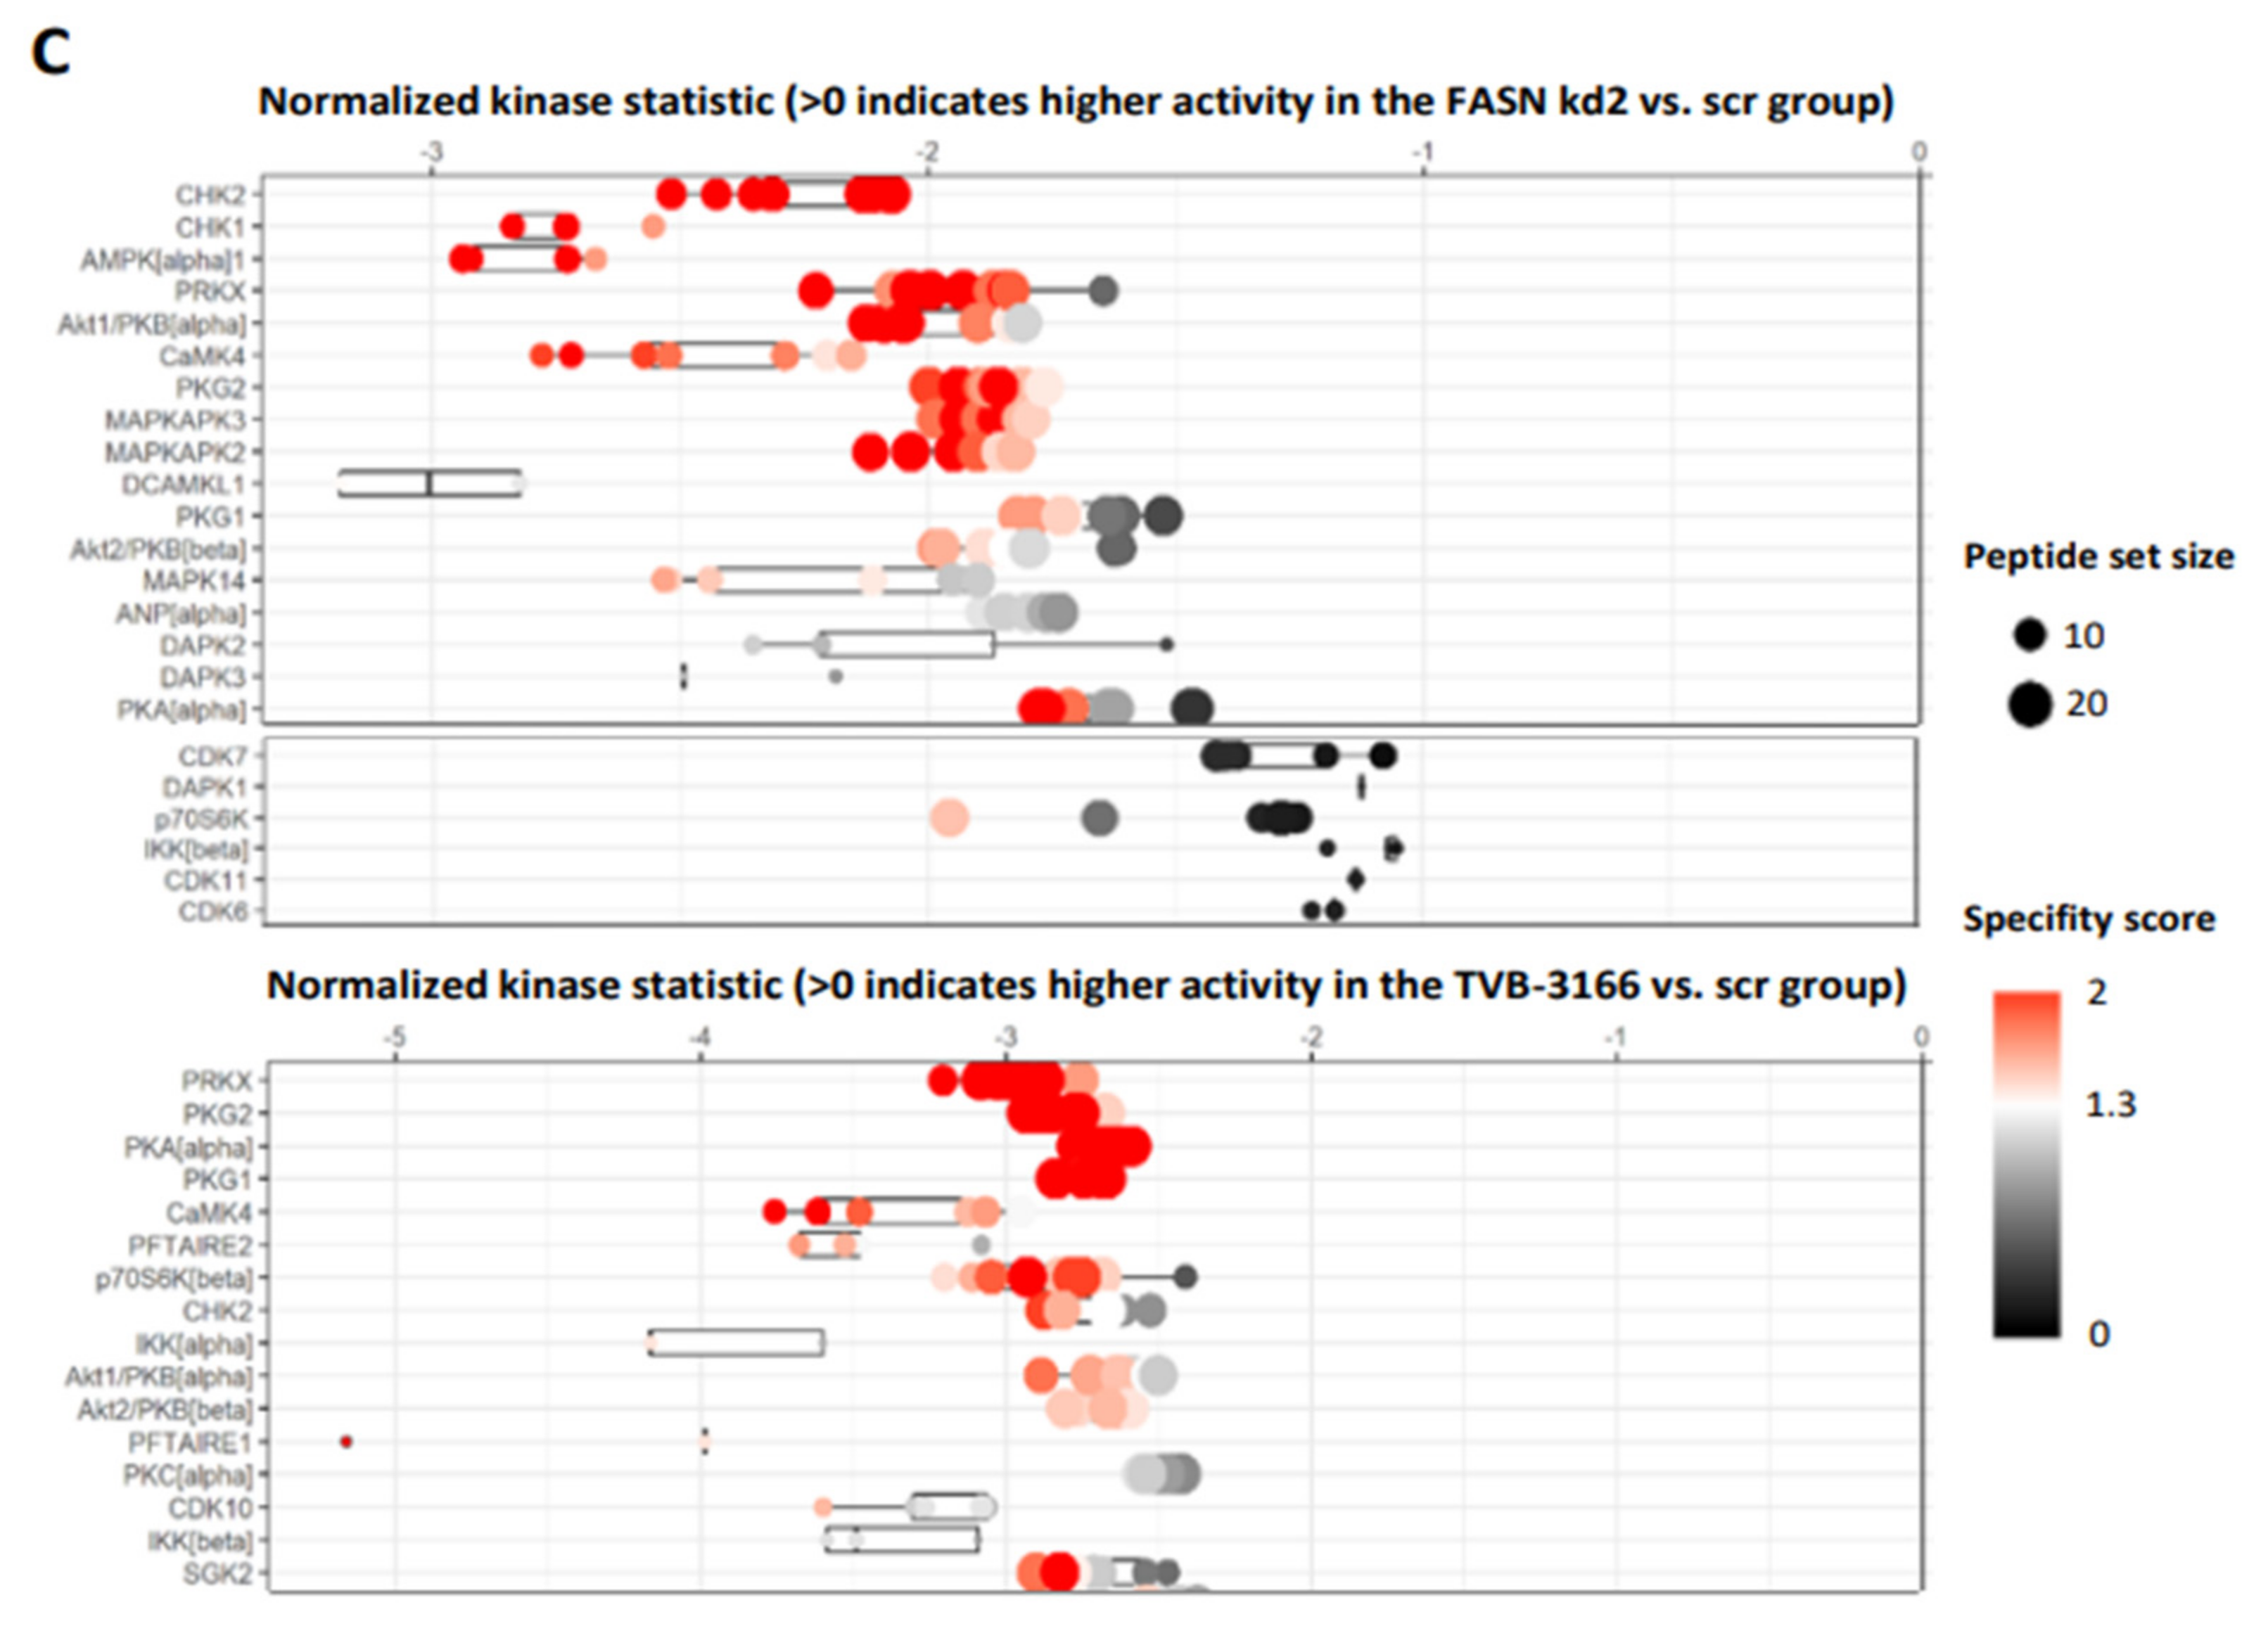
Figure 4.
.
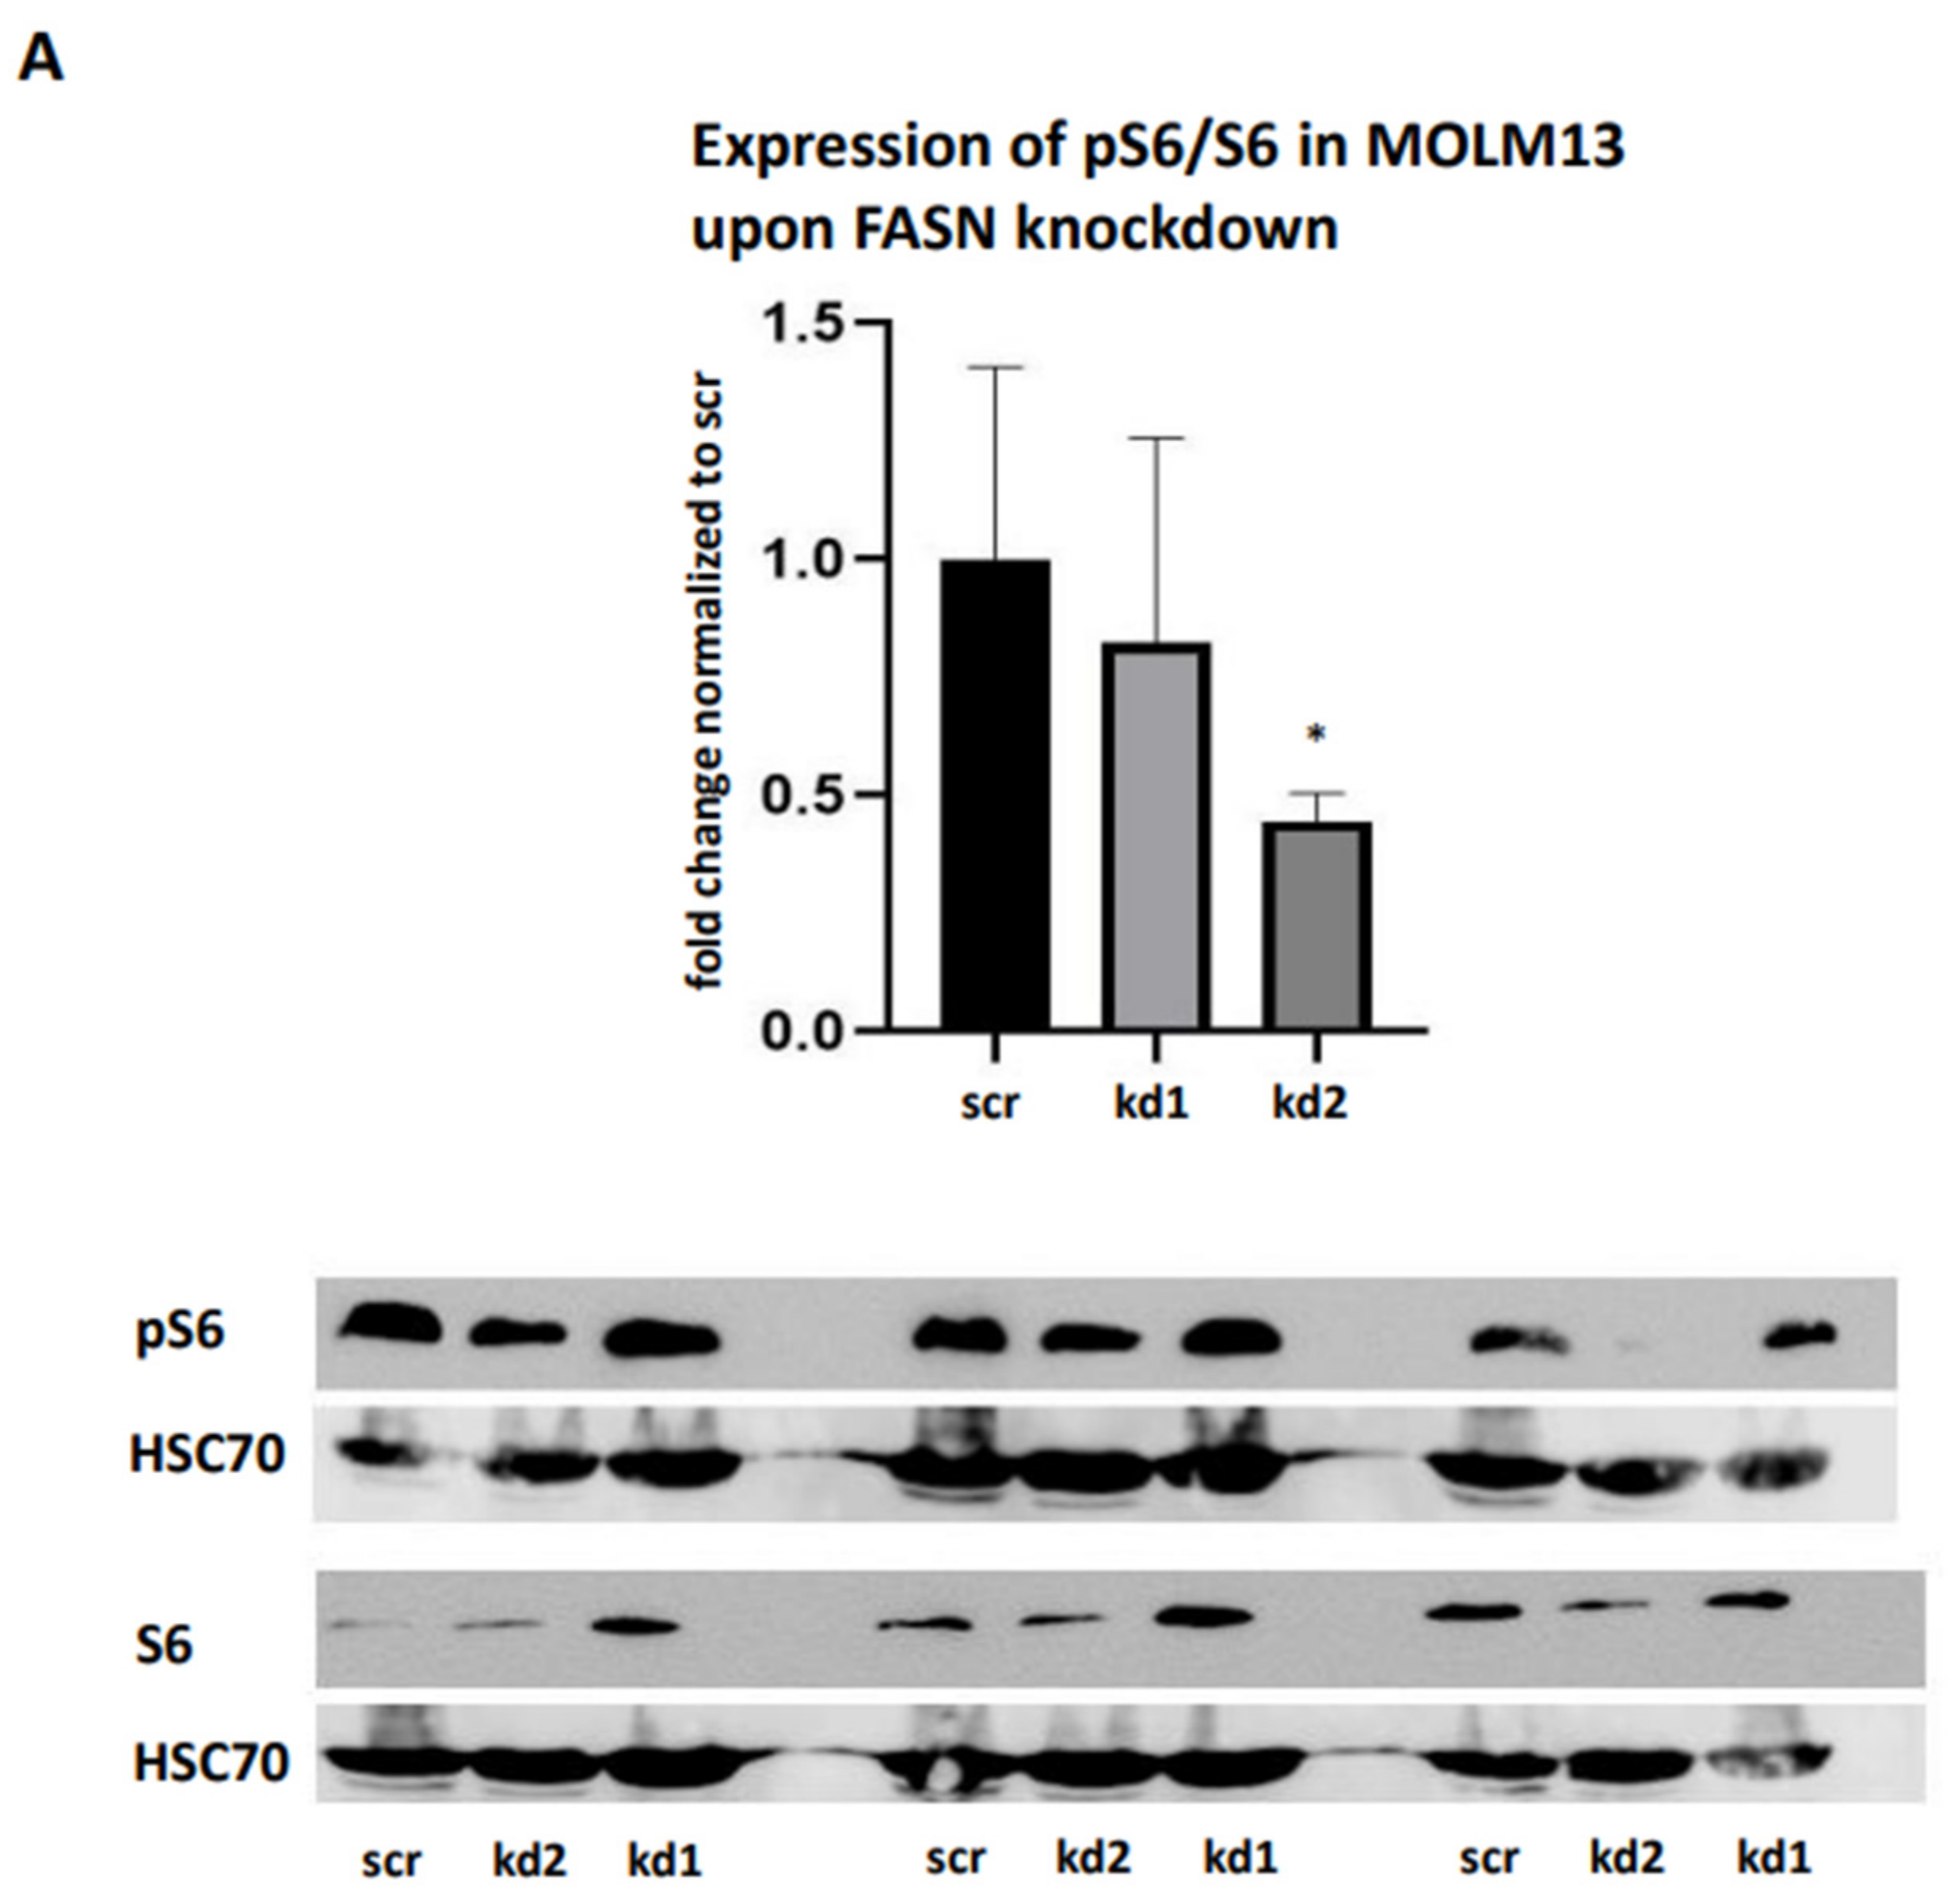
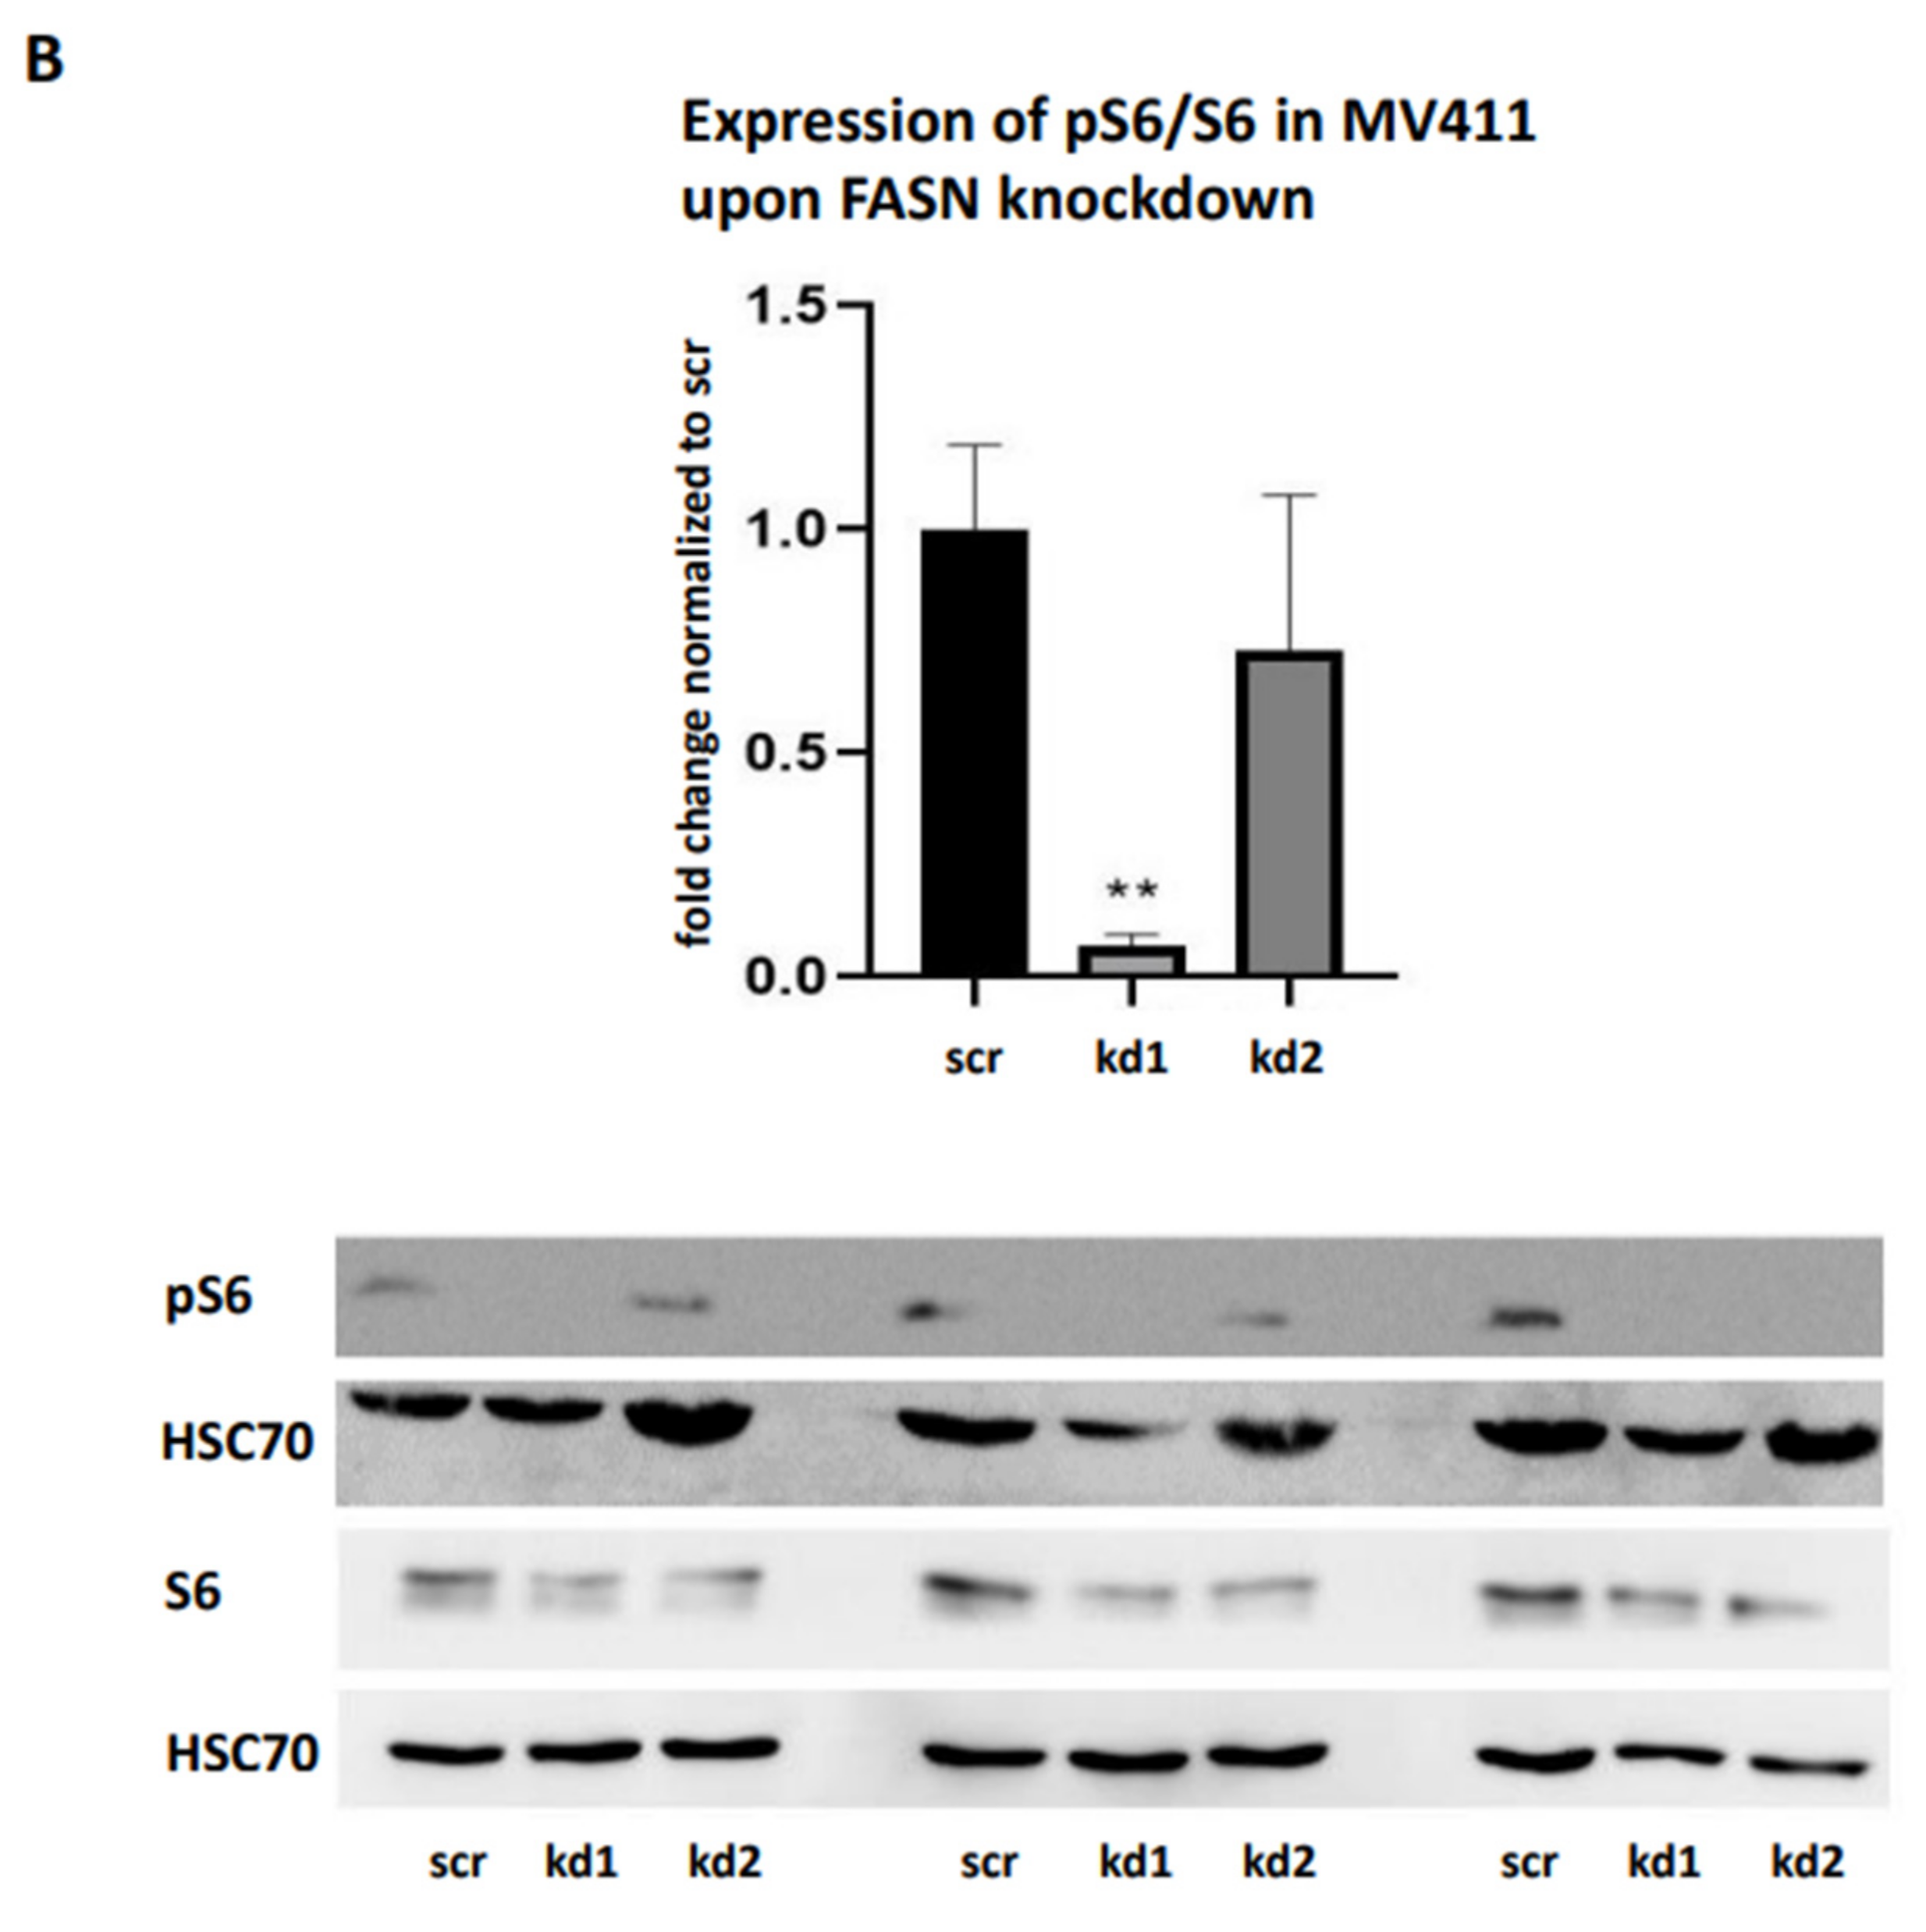
Figure 5.
.
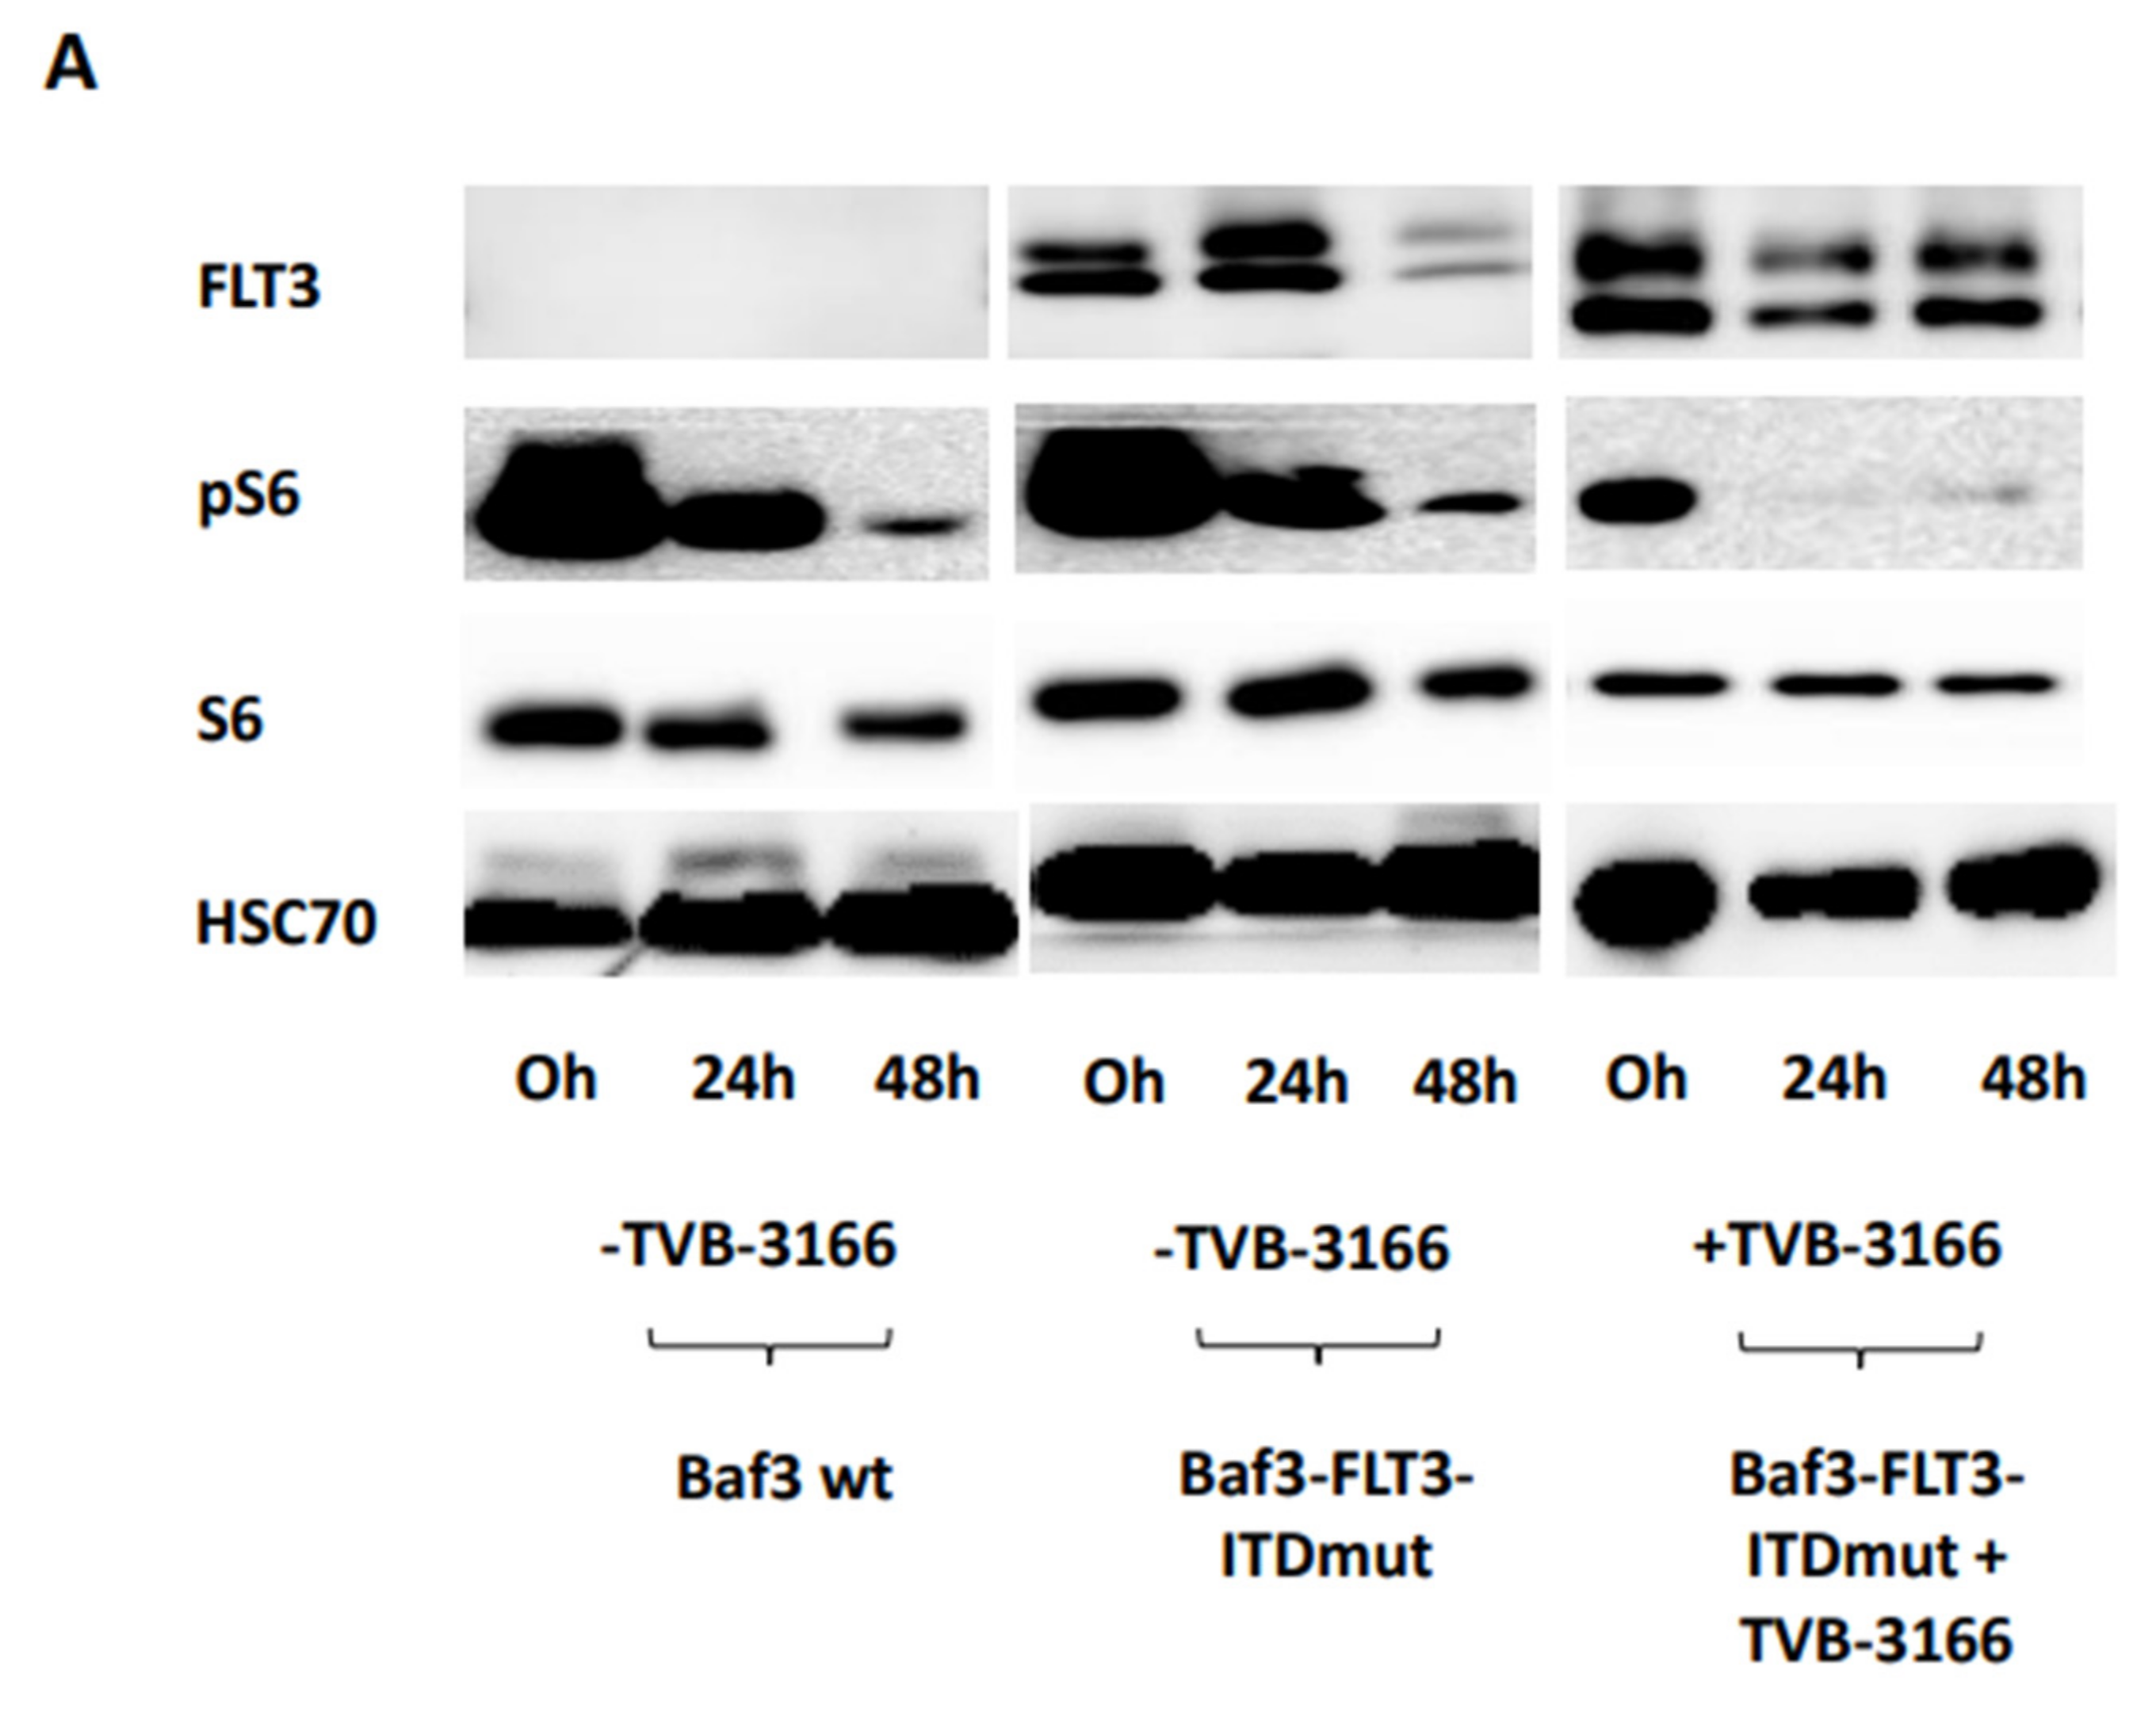
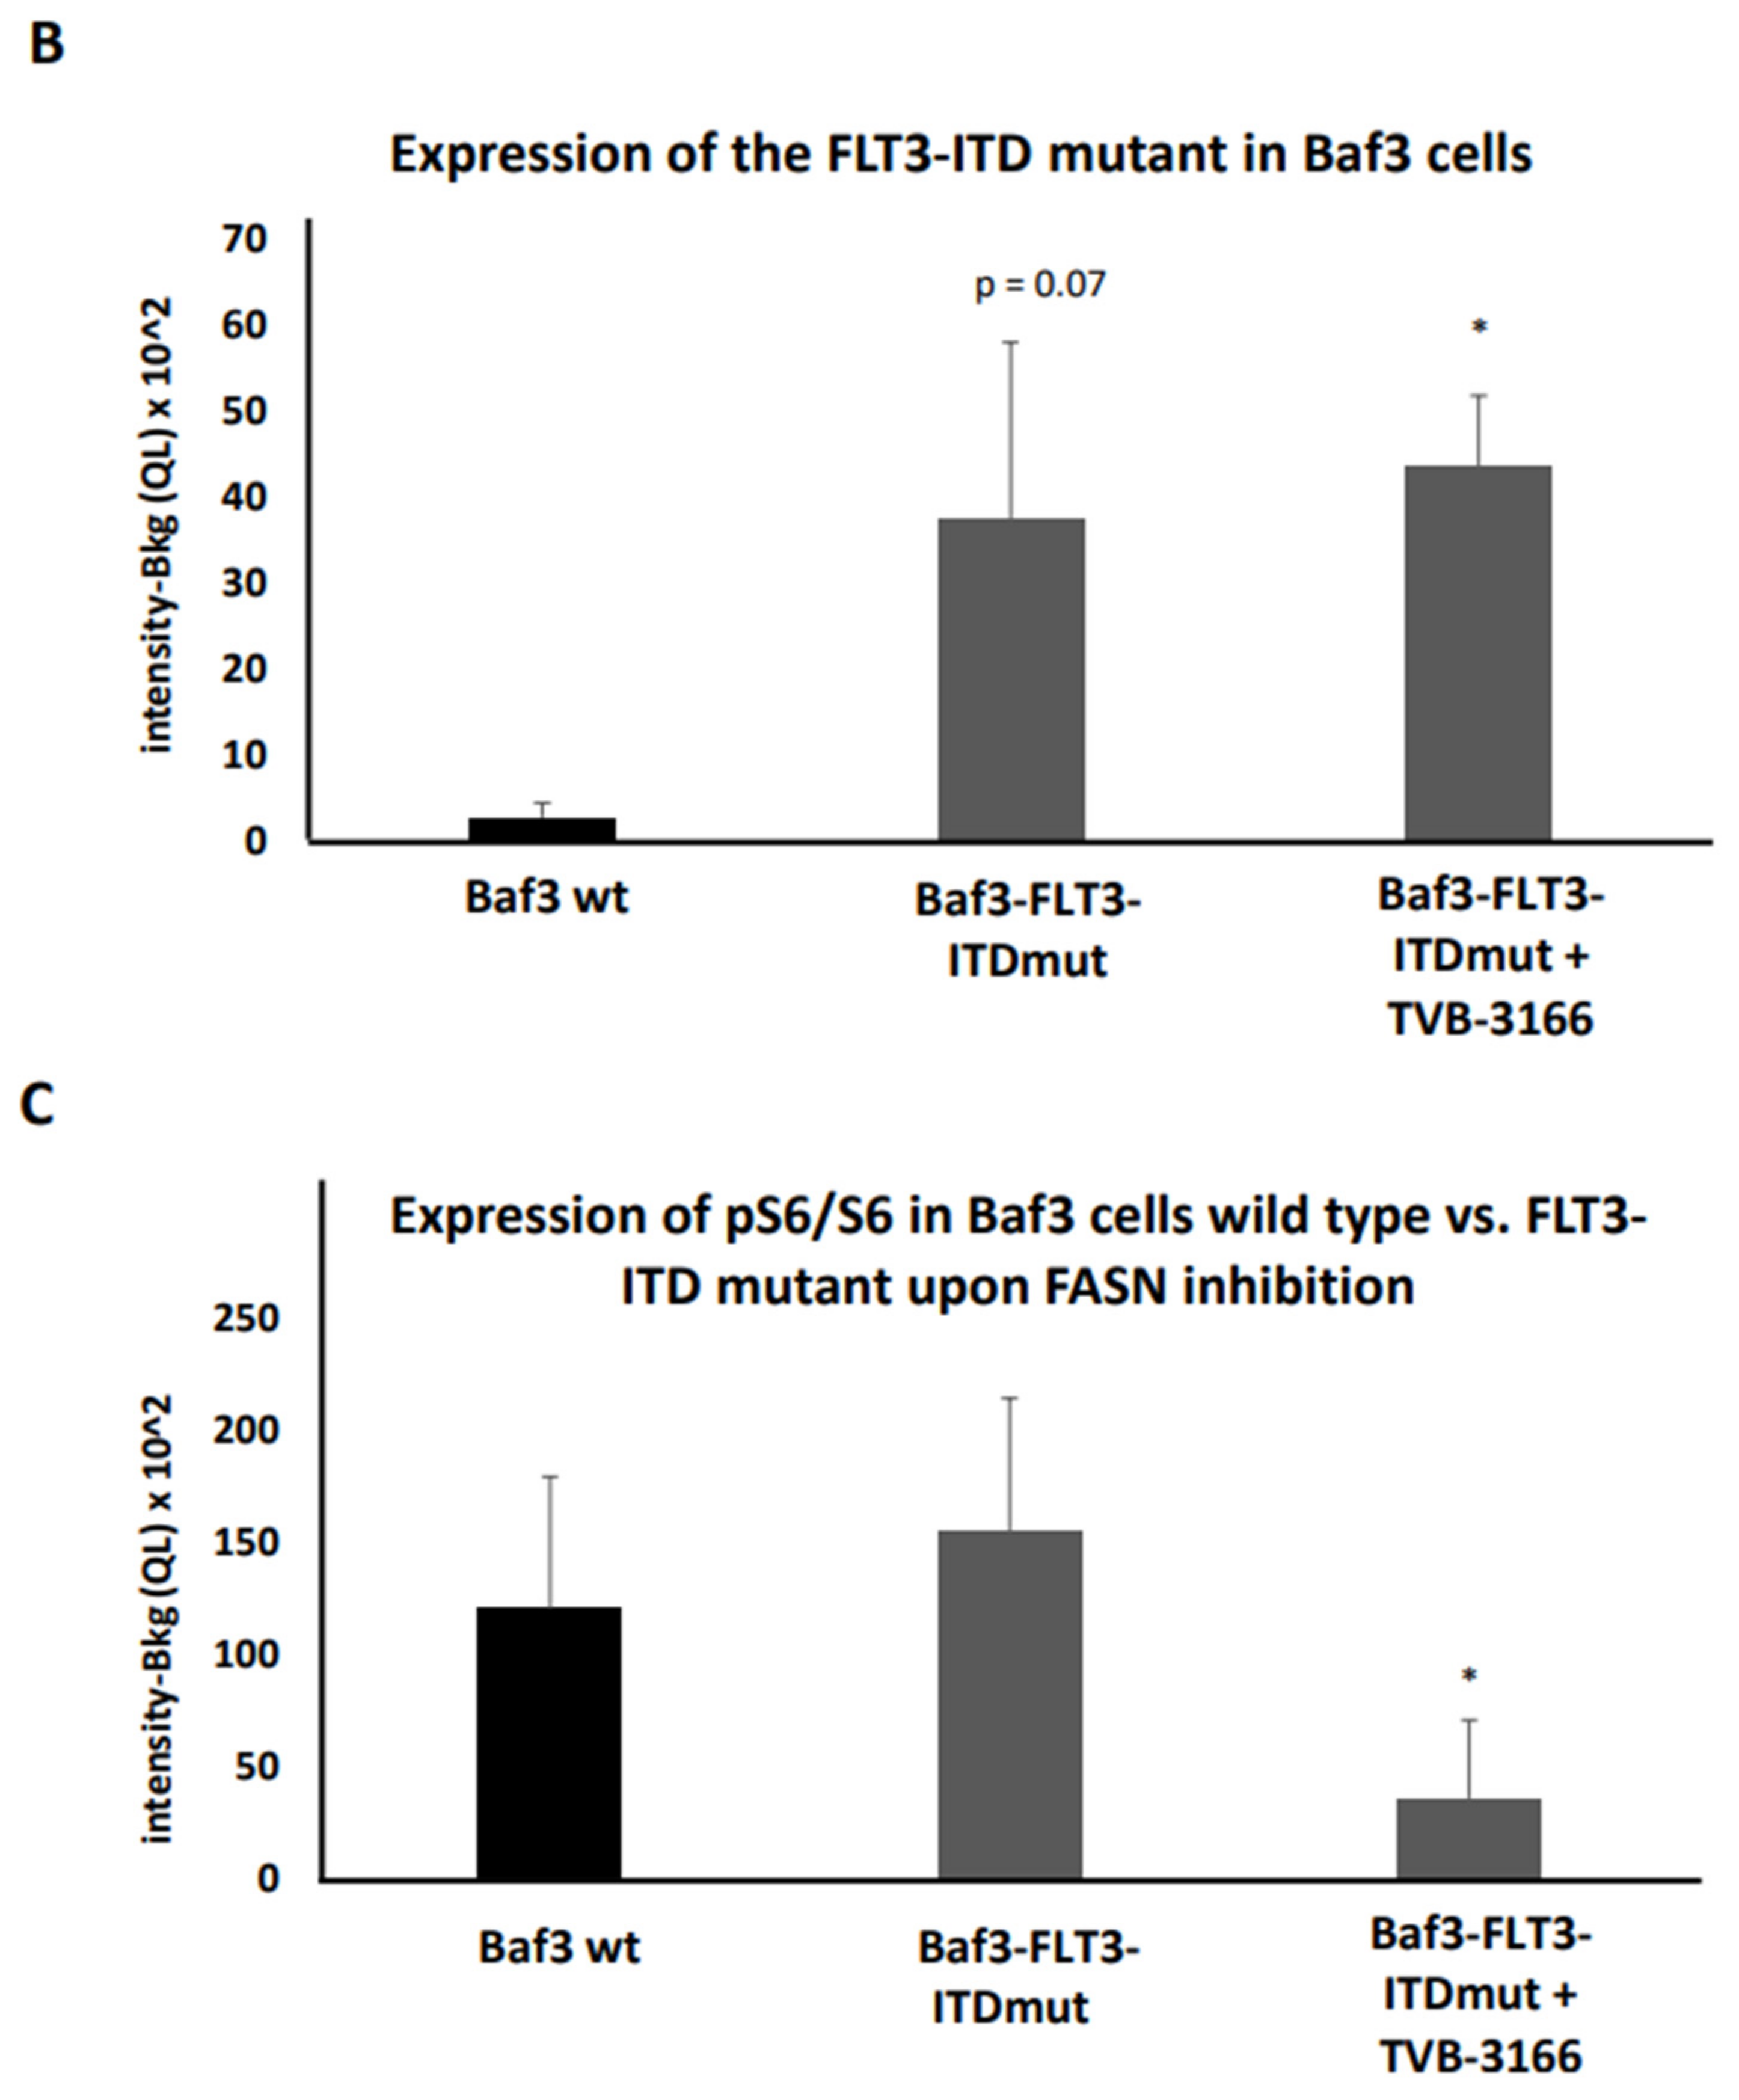
Figure 6.
As mentioned above, in 2021, Kaosheng Lv et al. observed an upregulation of pFLT3 in MV411 cells when palmitoylation of FLT3-ITD was disrupted by depleting the palmitoyl acyltransferase ZDHHC6, which led to the progression of FLT3-ITD mutant AML in mice [4]. To replicate this effect in our experiments, we assessed pFLT3 levels in MOLM13 and MV411 cells following FASN inhibition, either via shRNA or treatment with TVB-3166. No significant upregulation of pFLT3 levels was observed following FASN inhibition with shRNA despite significant FASN knockdowns were detected in both MOLM13 and MV411 cell line (Figure 7 and Figure 8).
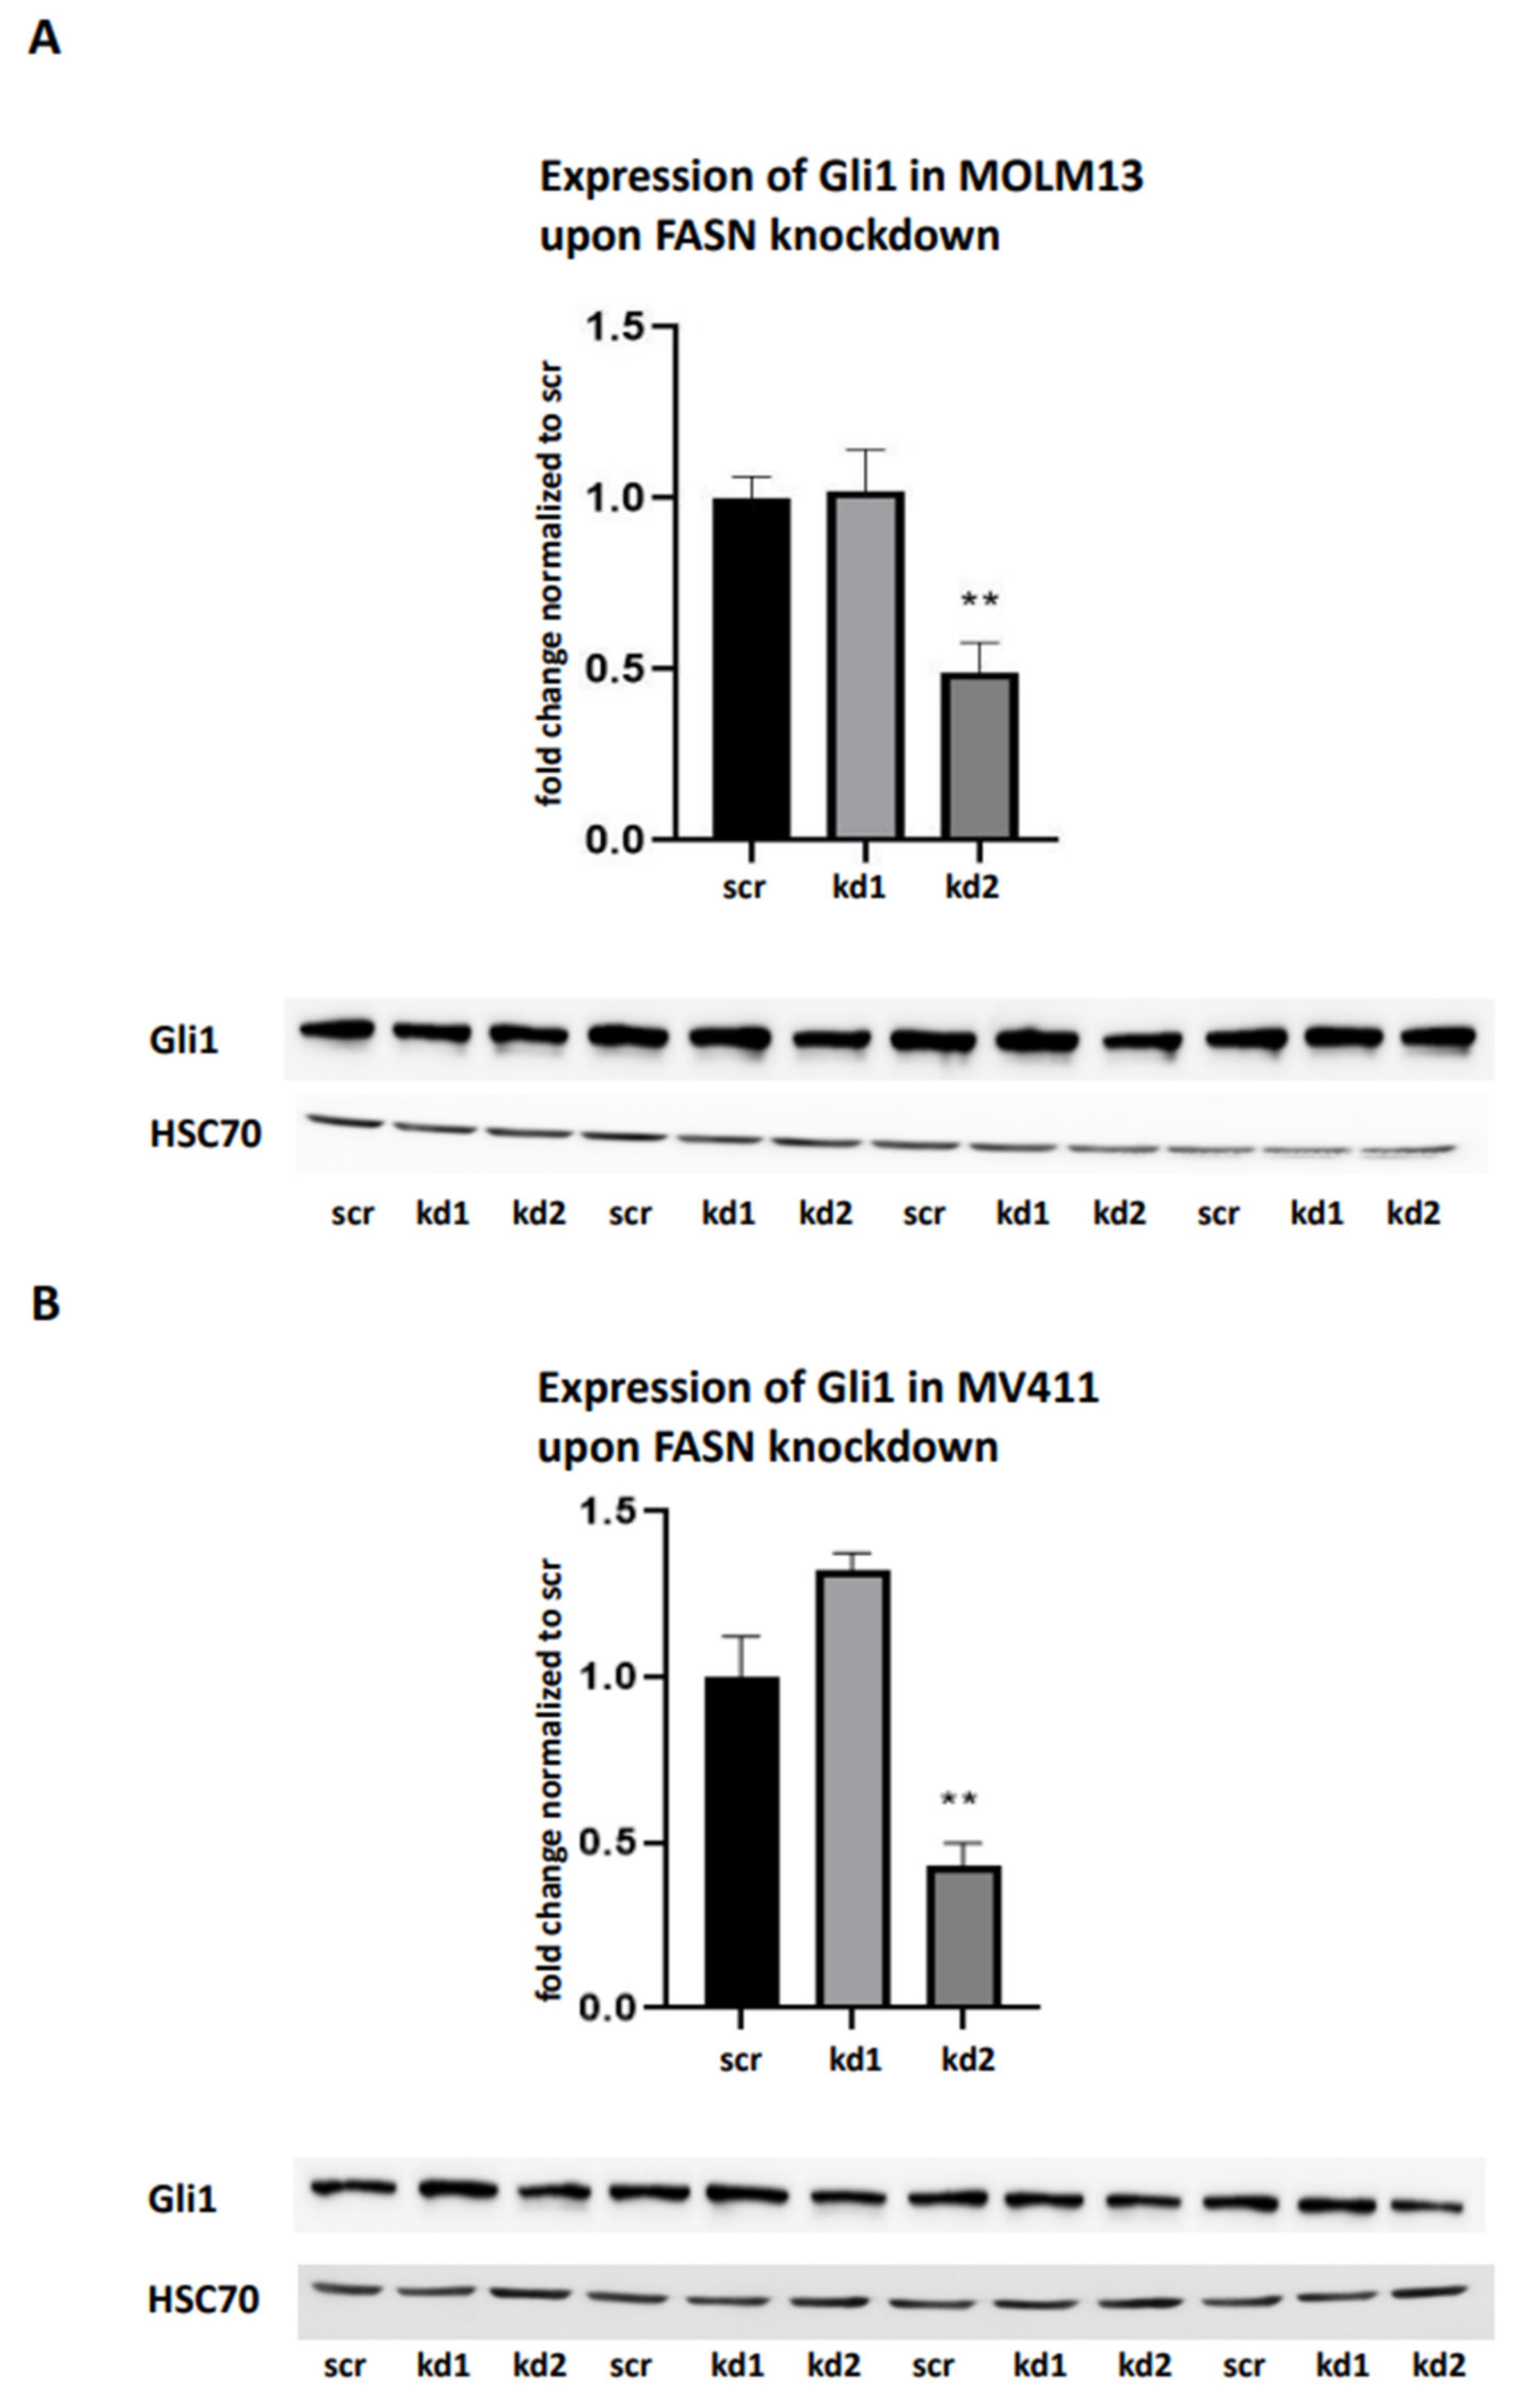
Figure 7.
.
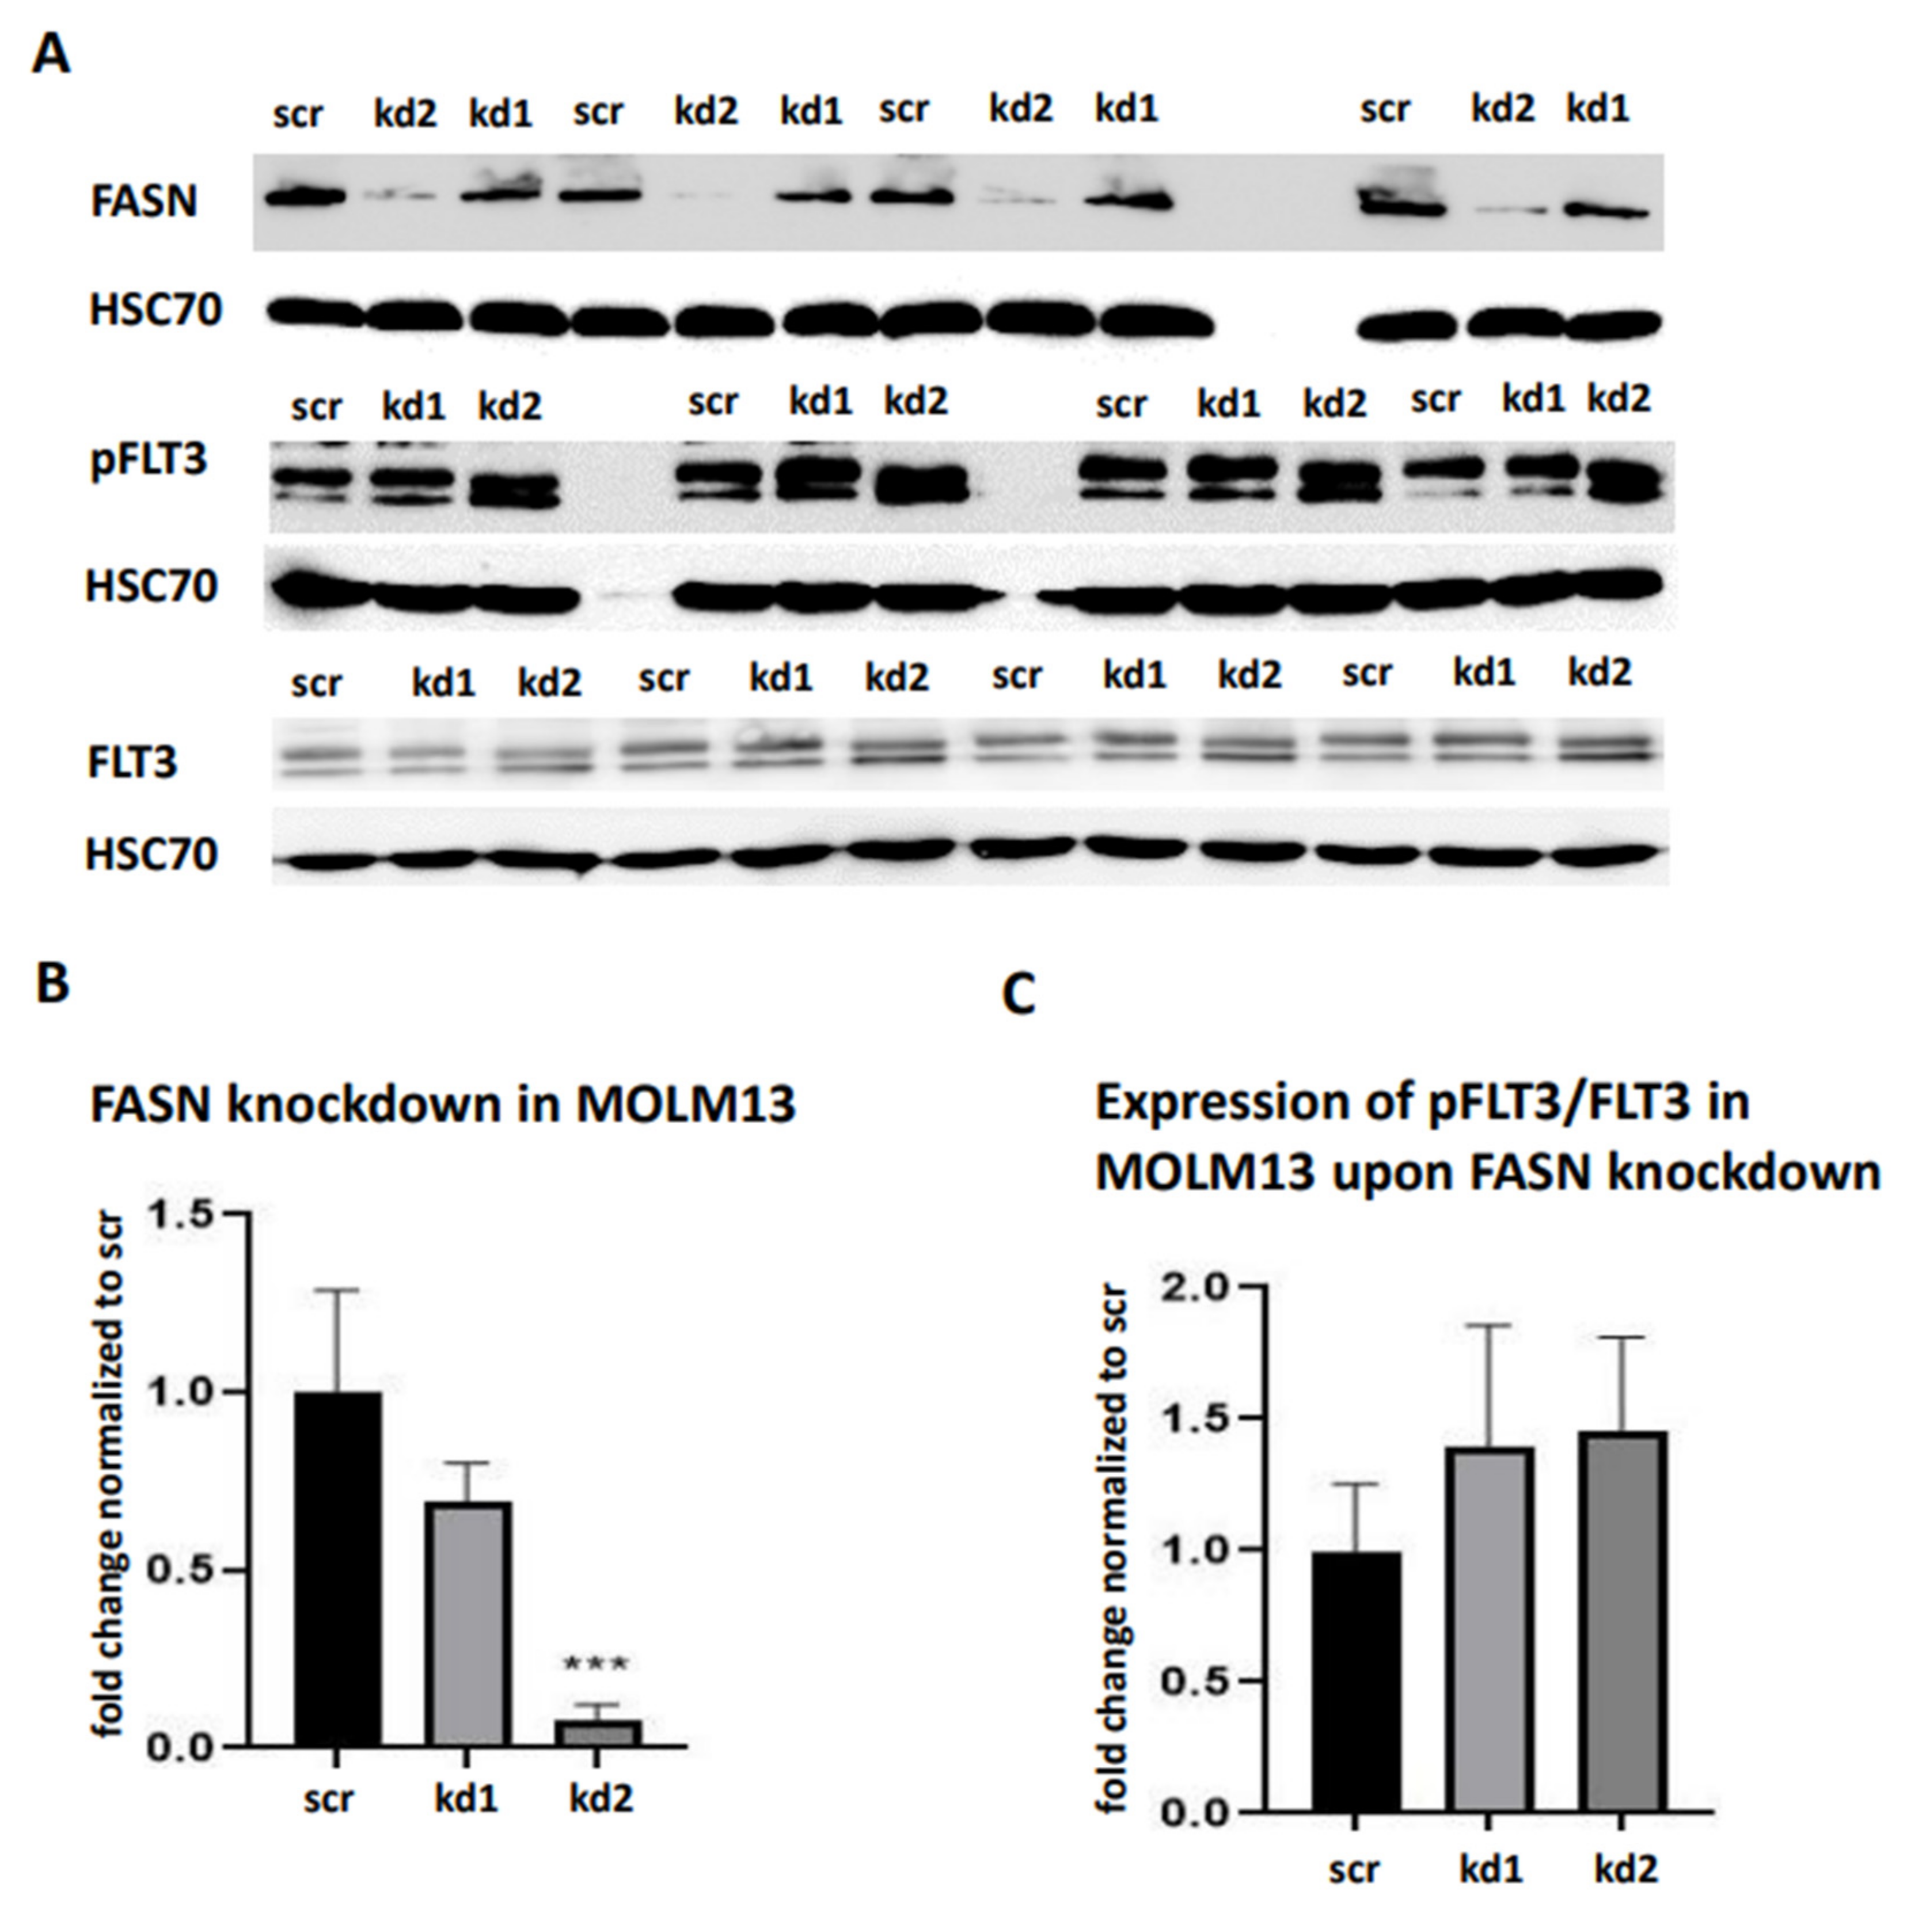
Figure 8.
.
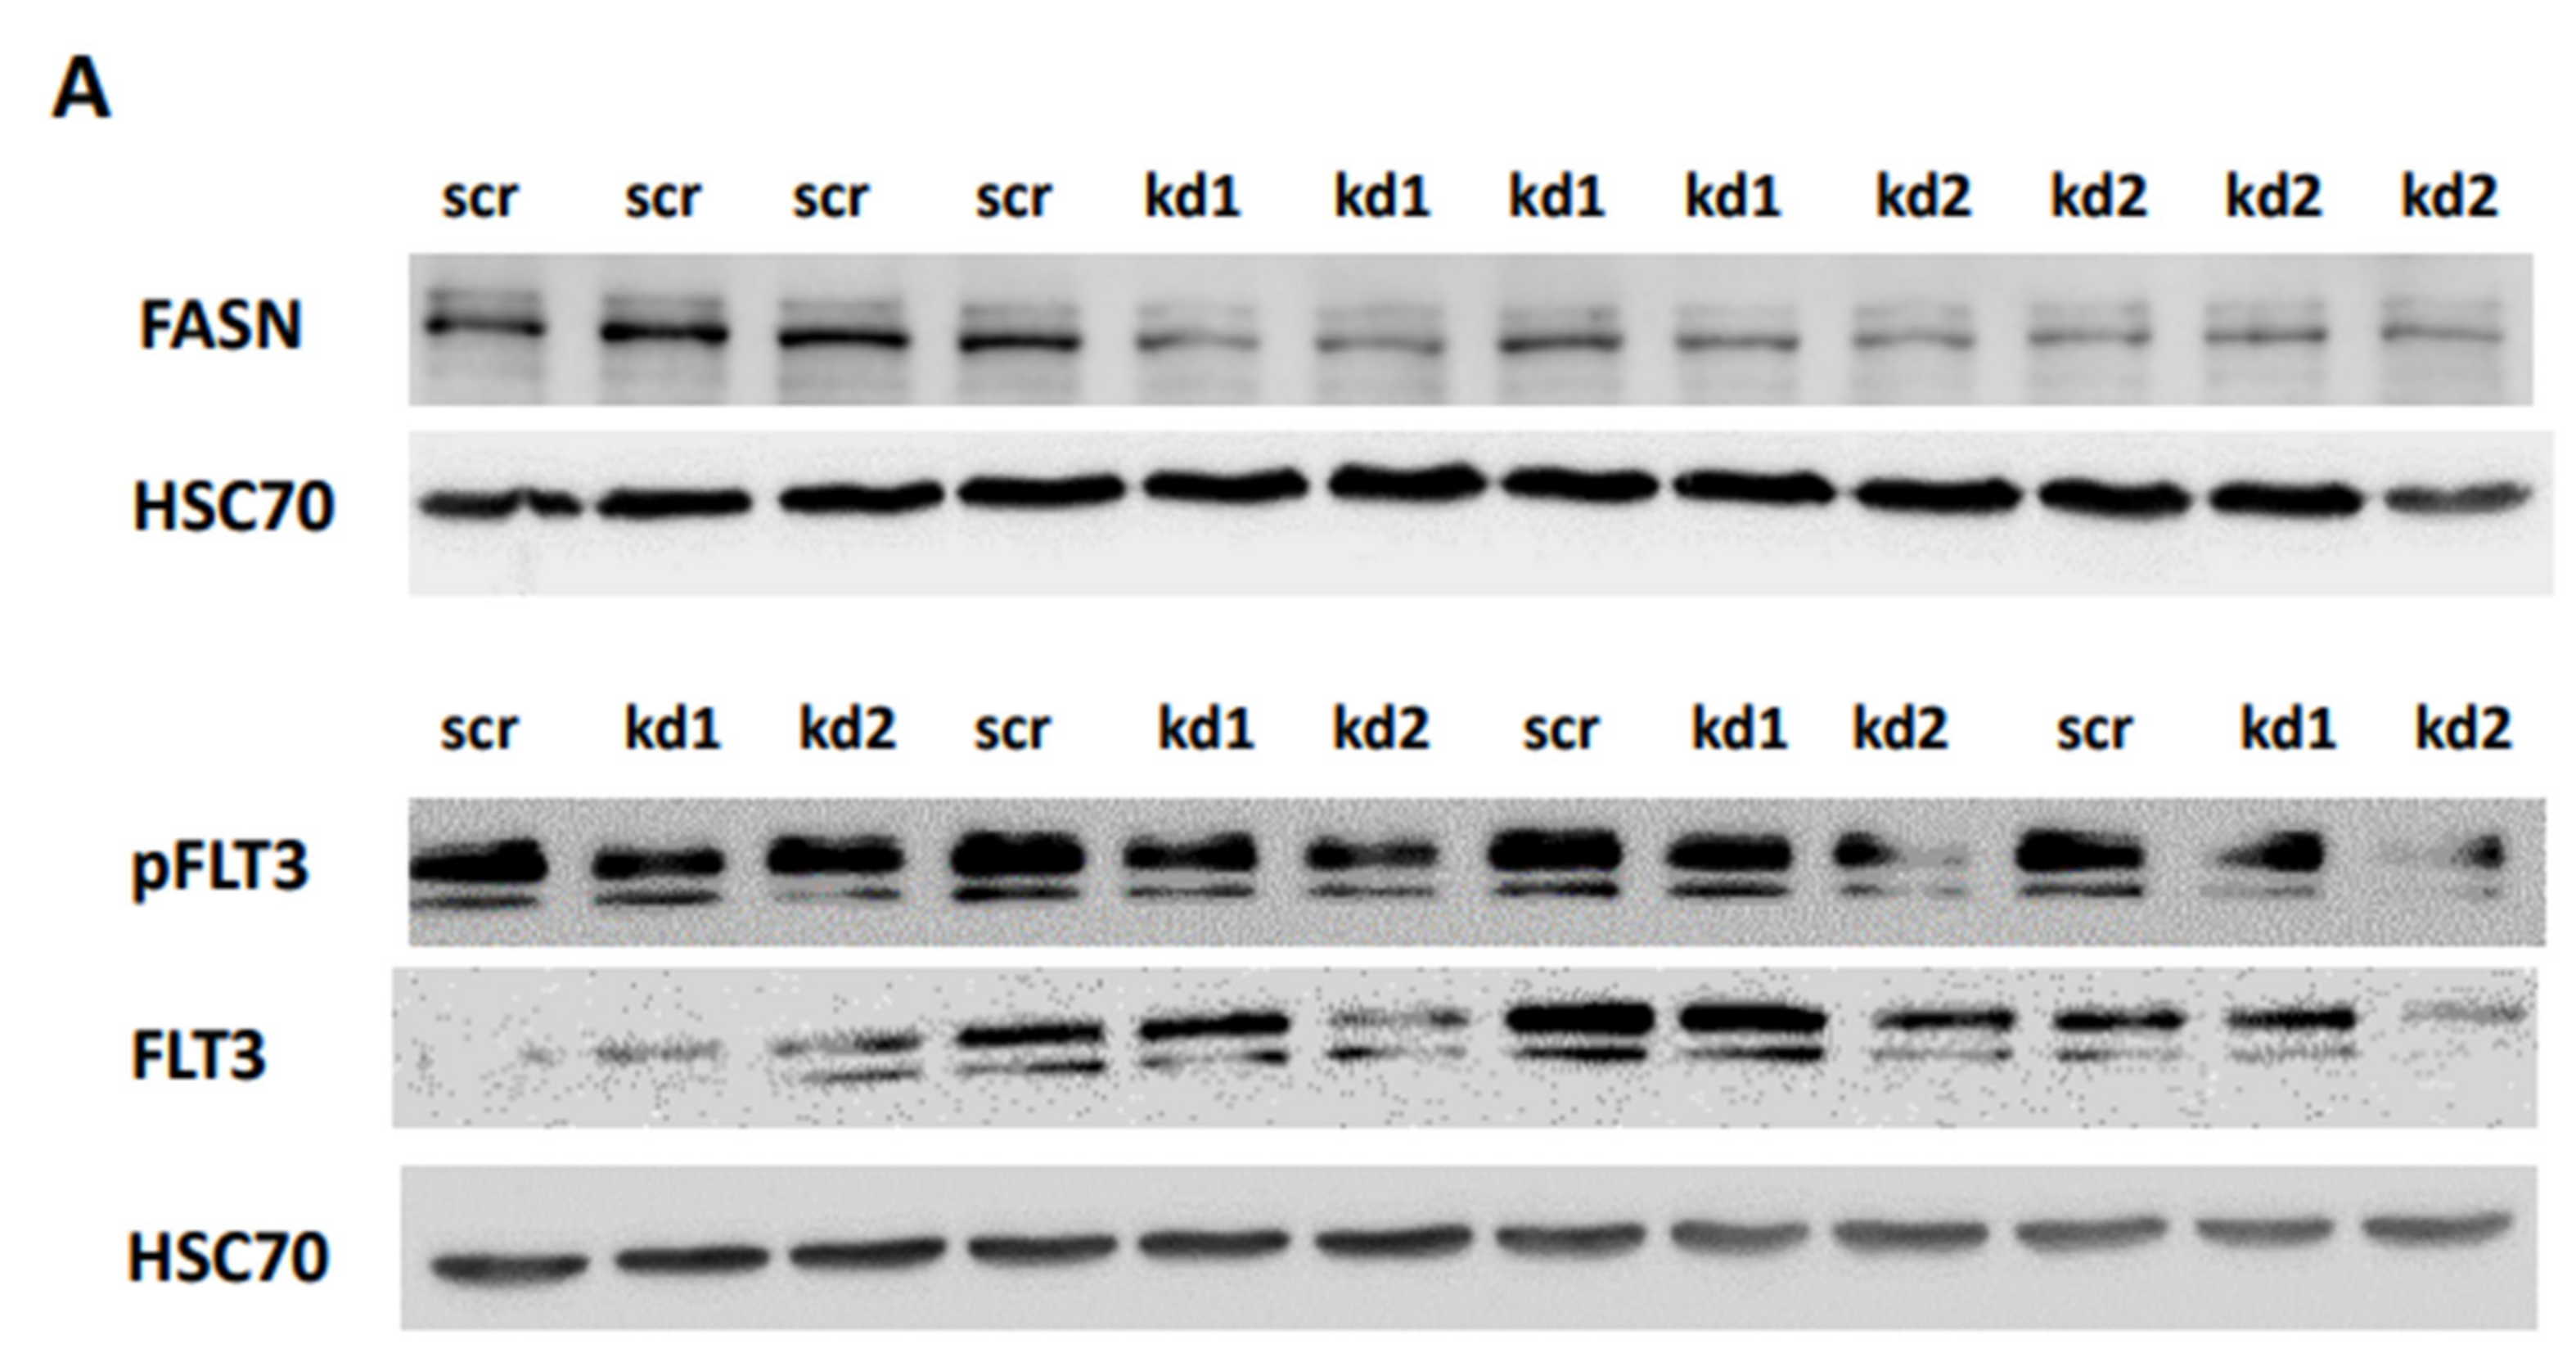
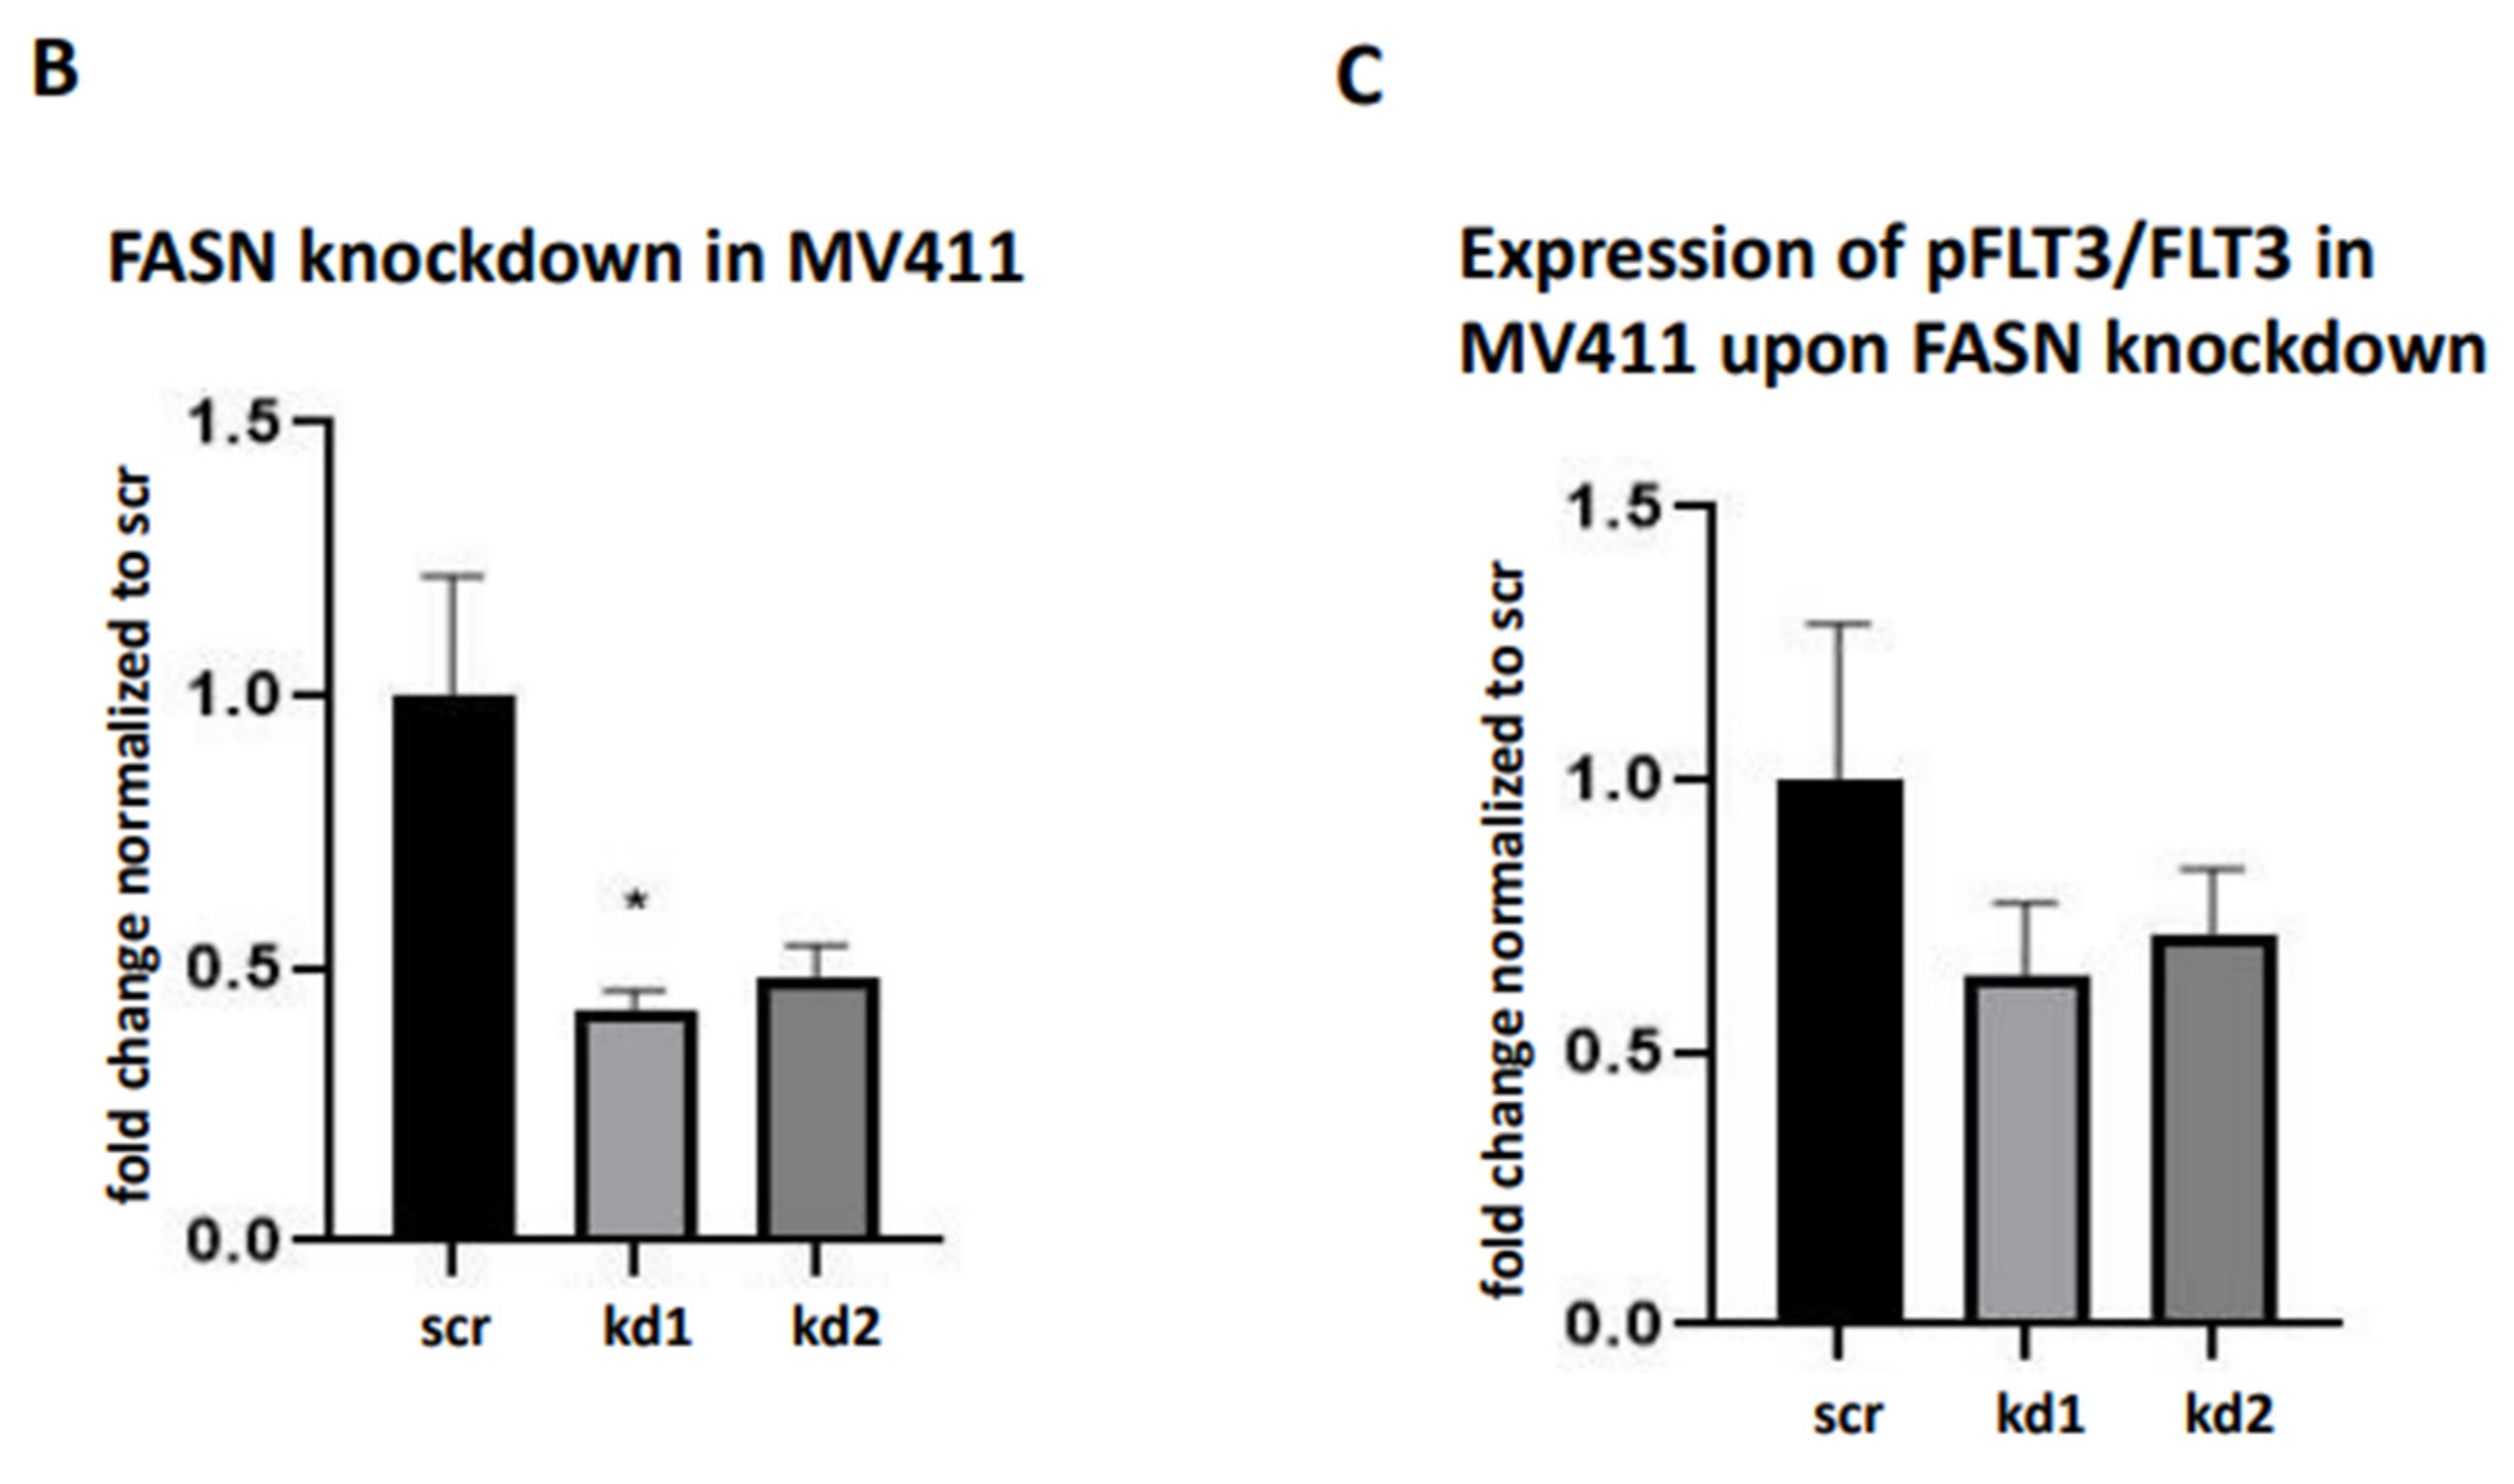
Figure 9.
.
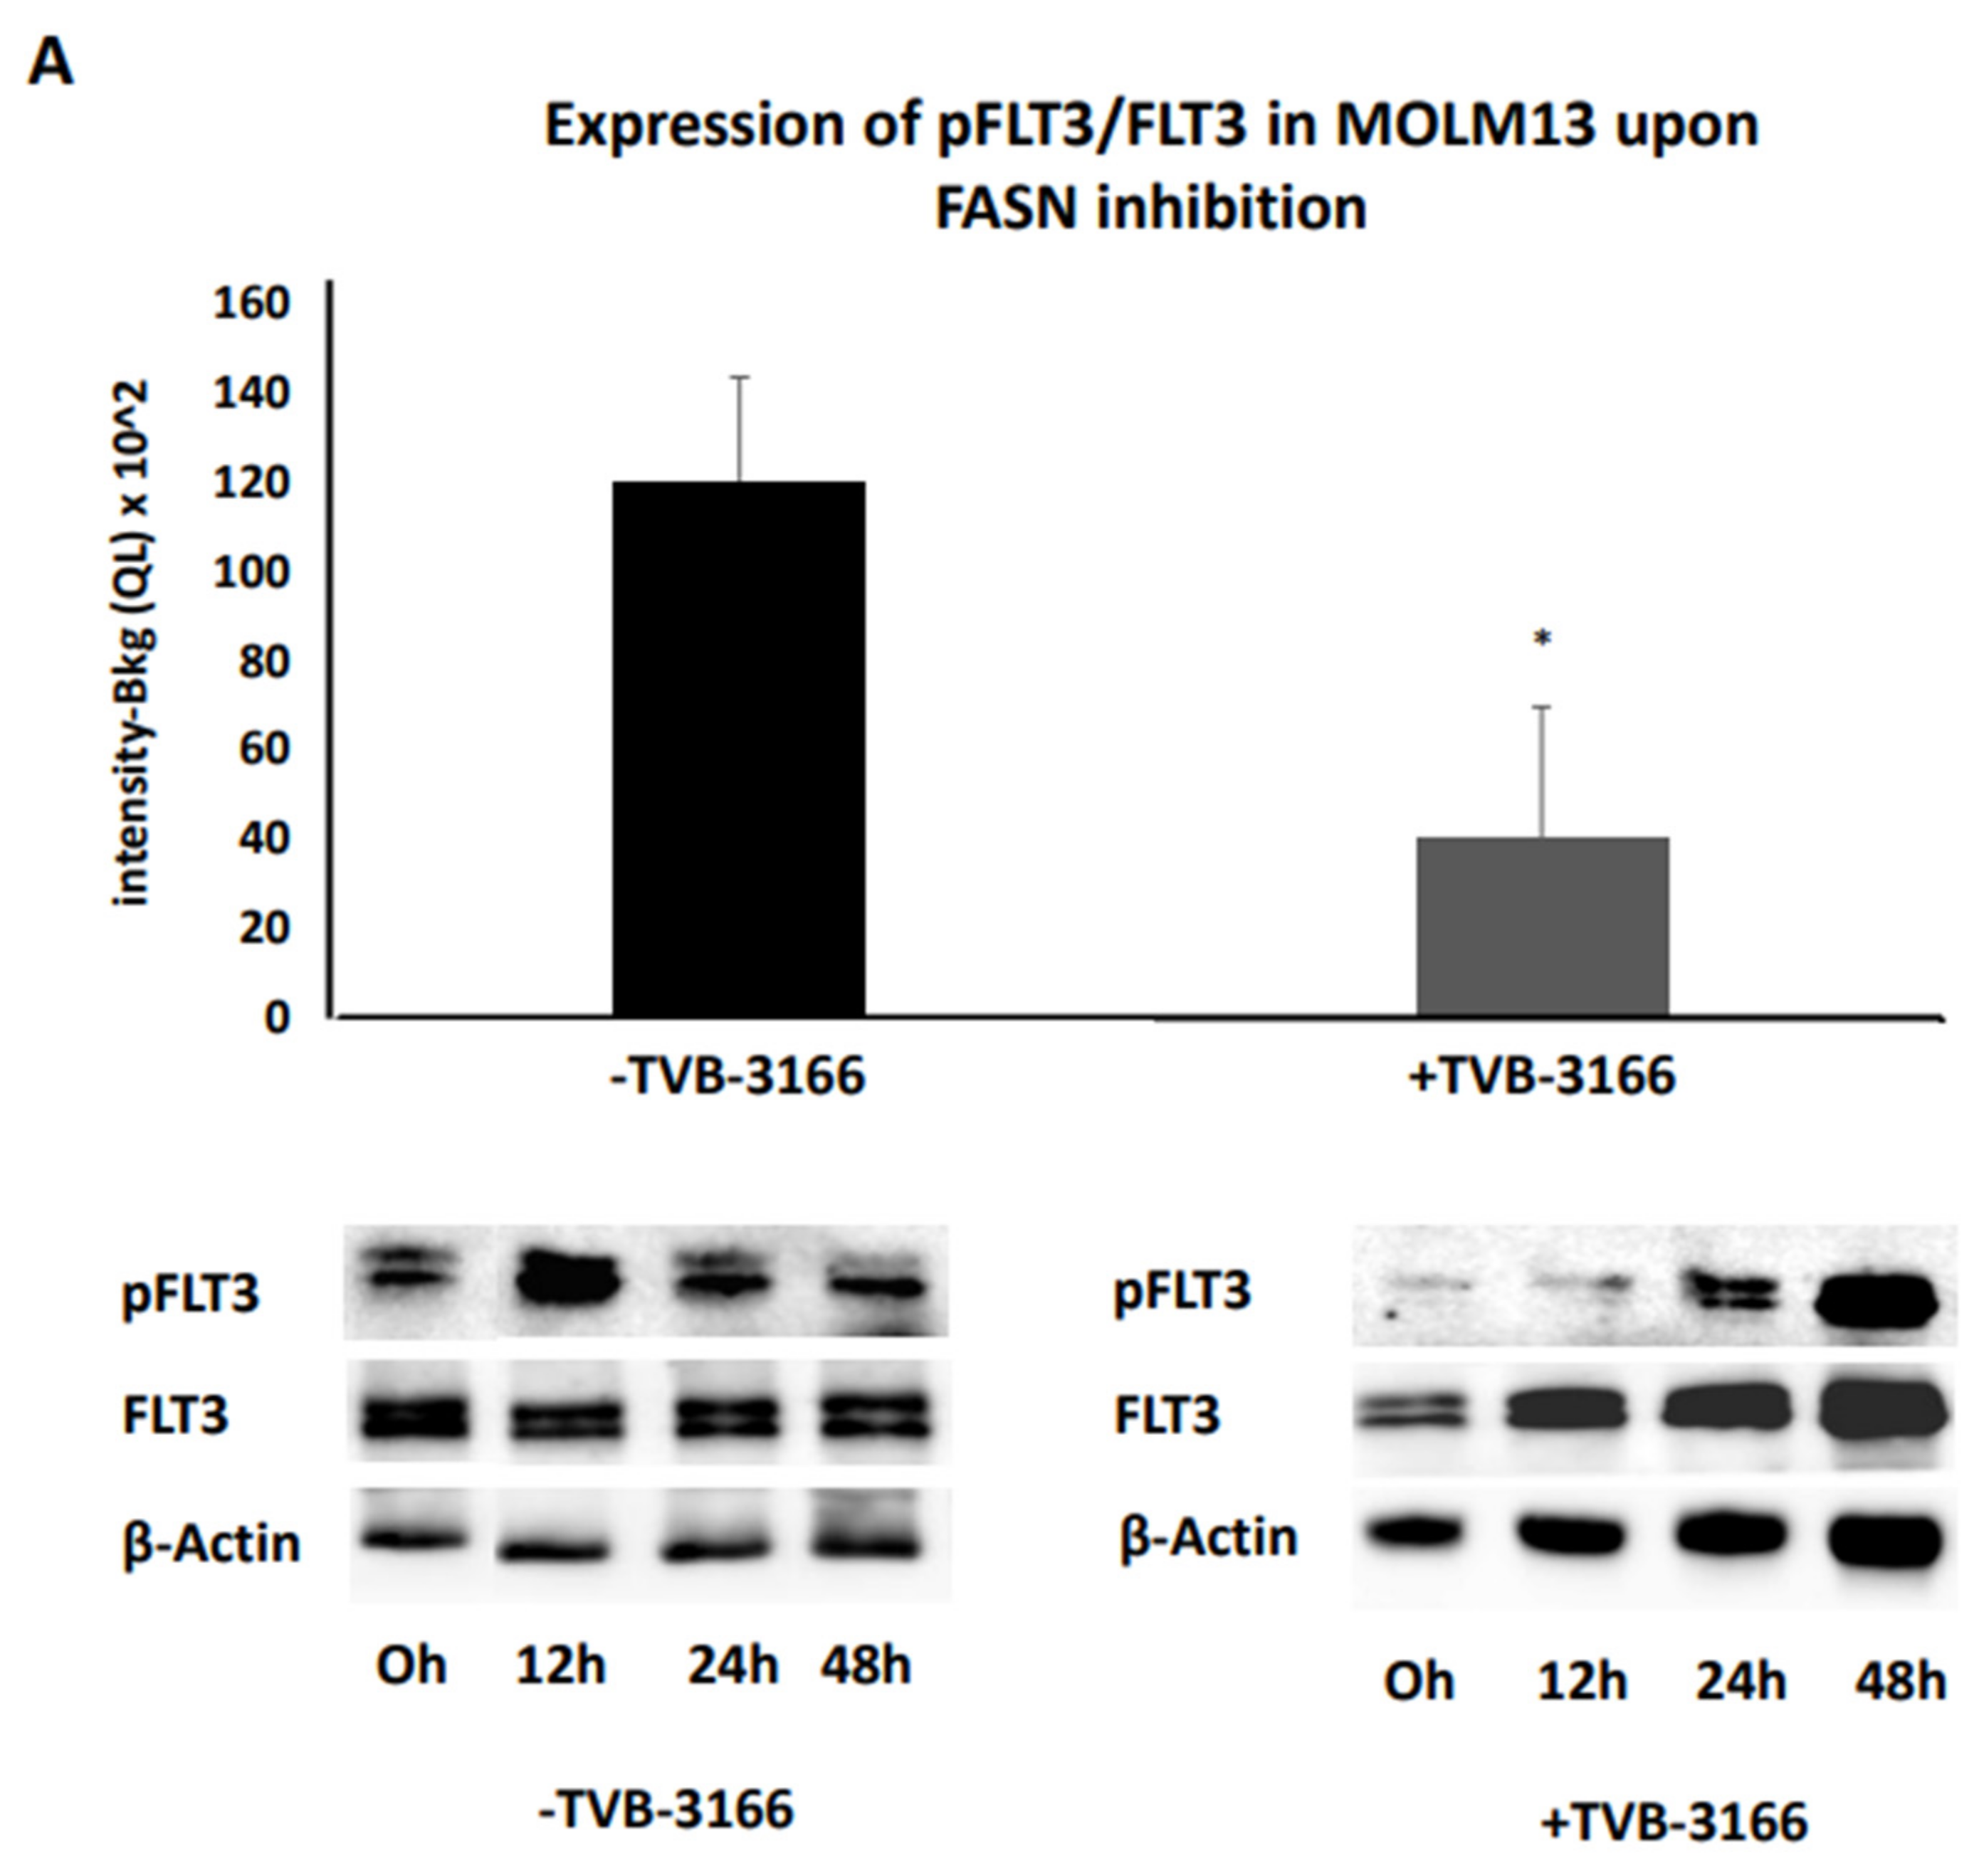
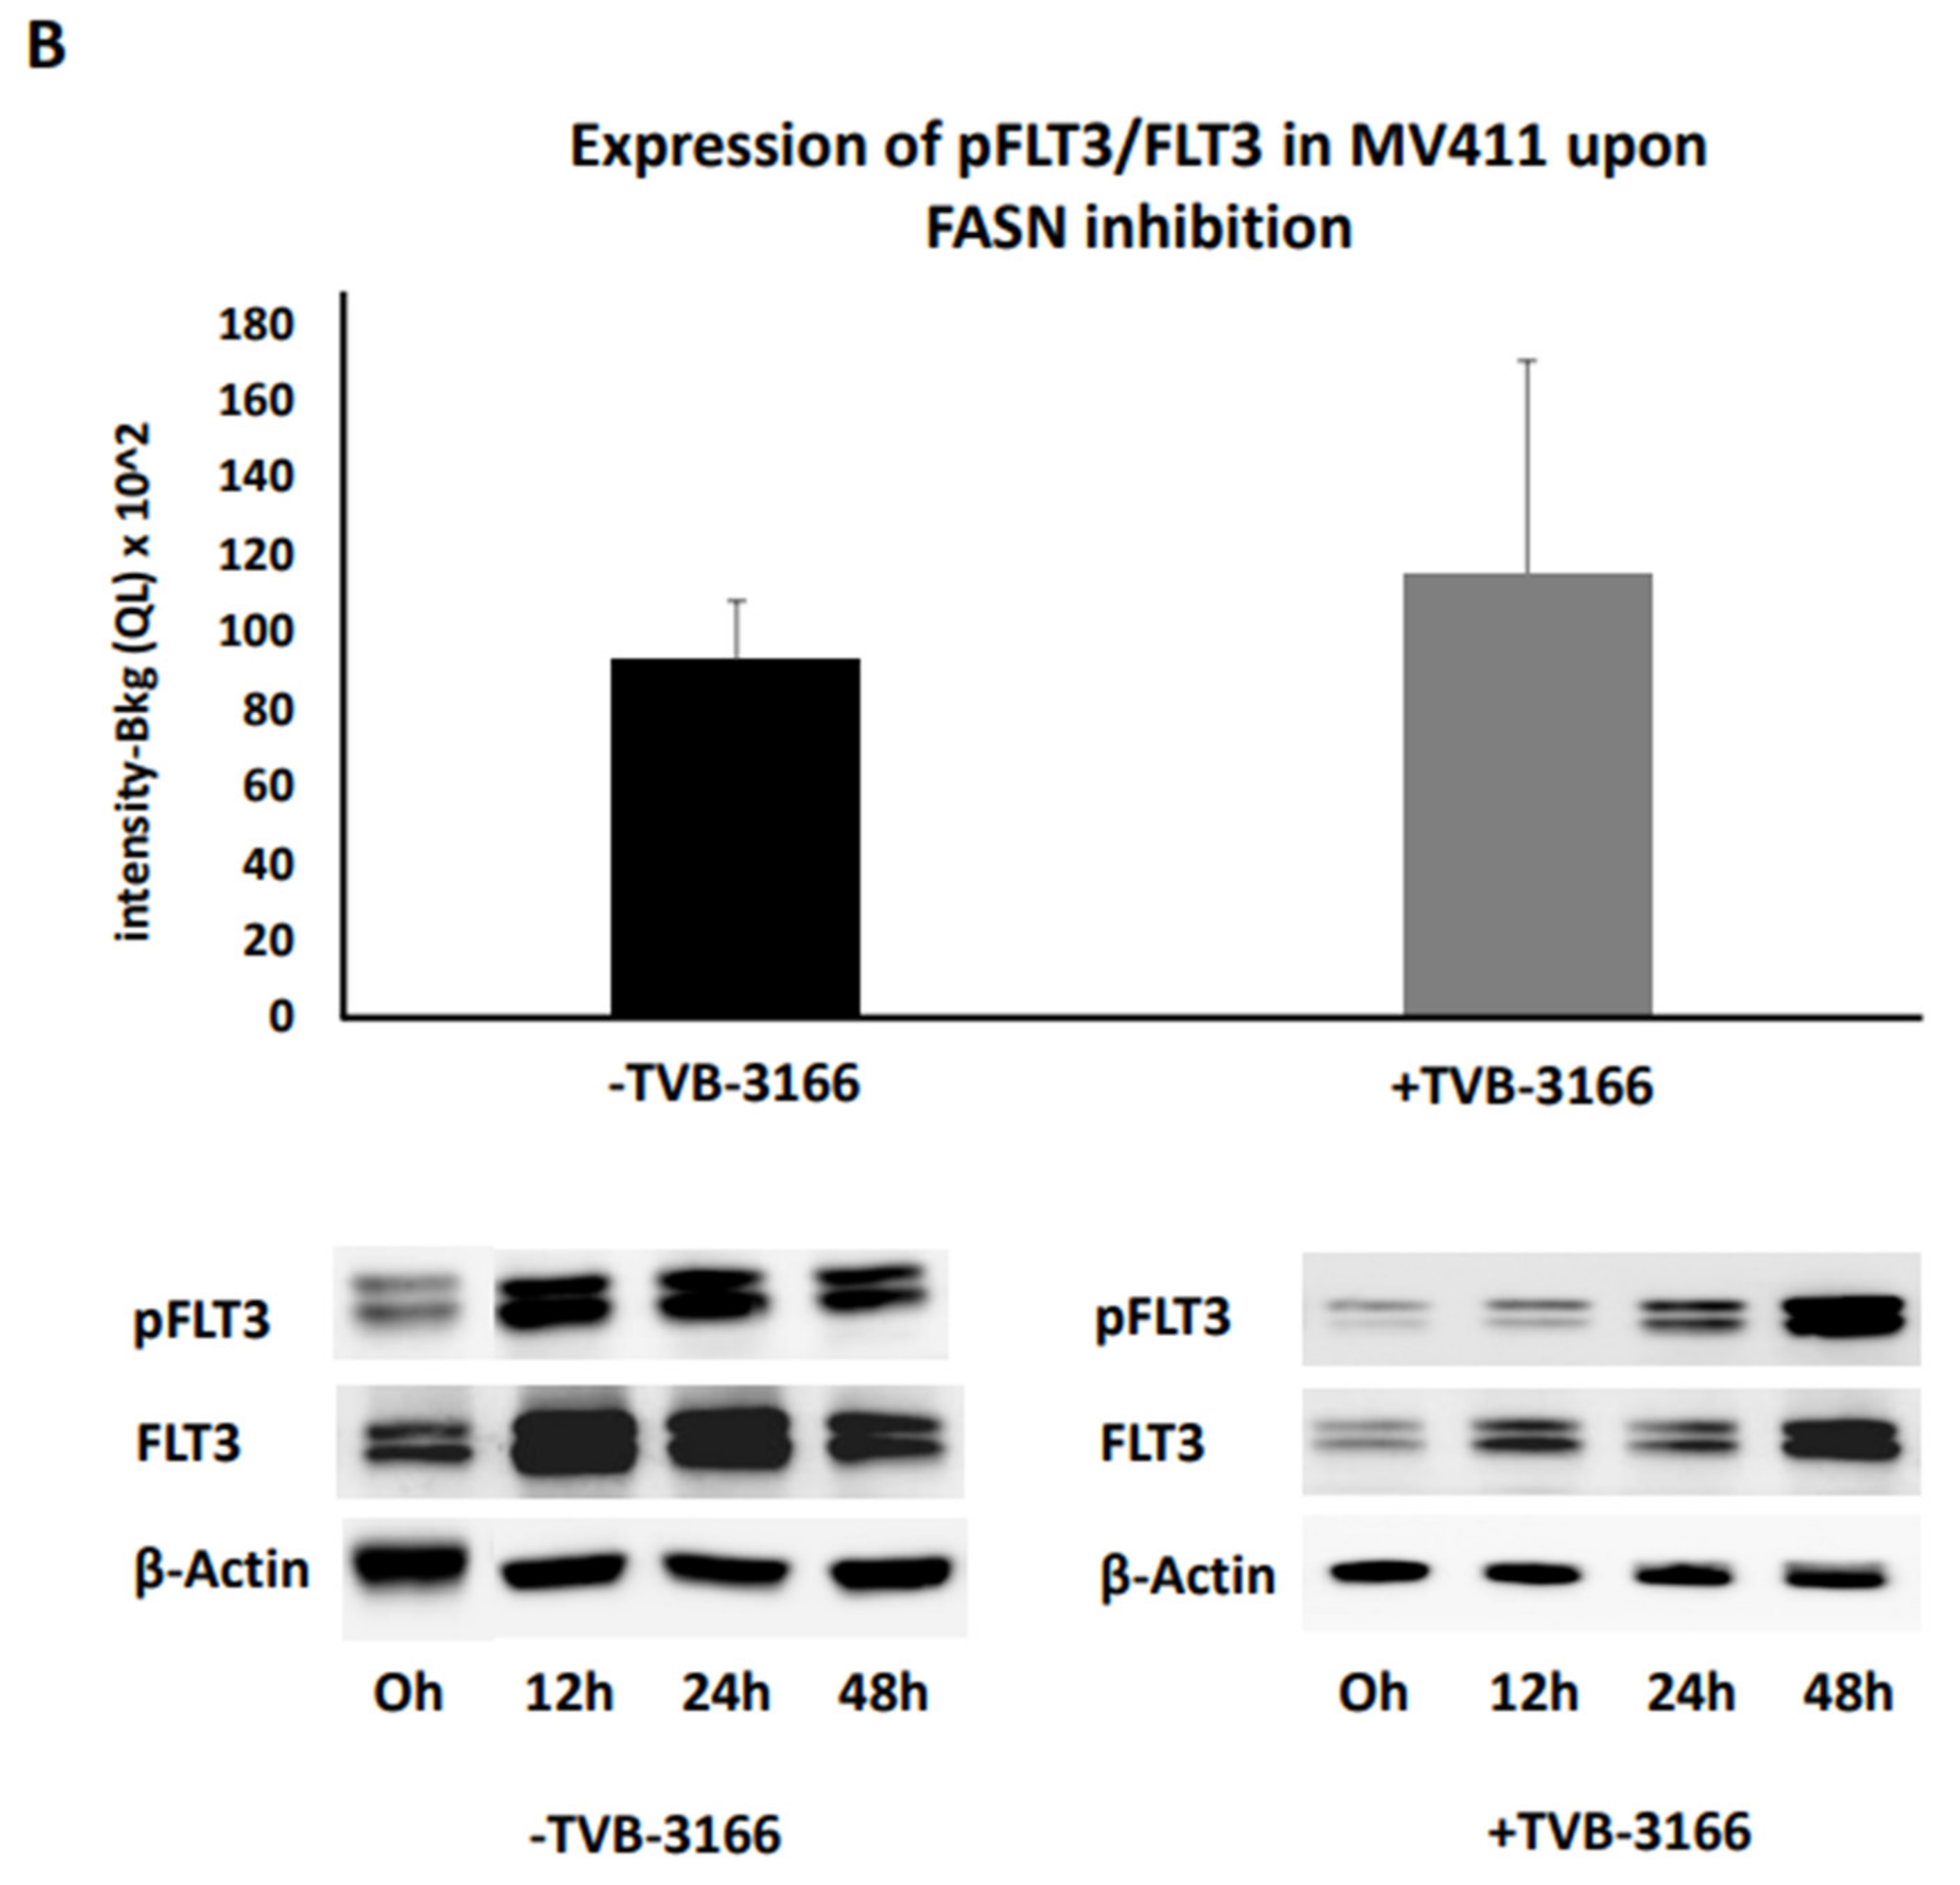
Figure 10.
.
Disclaimer/Publisher’s Note: The statements, opinions and data contained in all publications are solely those of the individual author(s) and contributor(s) and not of MDPI and/or the editor(s). MDPI and/or the editor(s) disclaim responsibility for any injury to people or property resulting from any ideas, methods, instructions or products referred to in the content. |
© 2025 by the authors. Licensee MDPI, Basel, Switzerland. This article is an open access article distributed under the terms and conditions of the Creative Commons Attribution (CC BY) license (http://creativecommons.org/licenses/by/4.0/).
Copyright: This open access article is published under a Creative Commons CC BY 4.0 license, which permit the free download, distribution, and reuse, provided that the author and preprint are cited in any reuse.


