
Submitted:
28 April 2025
Posted:
30 April 2025
You are already at the latest version
Abstract
With the advancement of urbanization, the complexity and fragility of urban traffic systems are becoming increasingly prominent. The reliability of urban road networks, characterized by their dynamic nature, multi-scale characteristics, and anti-interference capabilities, directly restricts the functional guarantee of urban traffic and the efficiency of emergency response. To address the limitations of existing road network connectivity reliability assessment methods in representing time dynamics and modeling failure correlation, this study proposes a road network reliability assessment method based on Dynamic Bayesian Network (DBN) by constructing a probabilistic reasoning model that integrates cascading failure characteristics. First, the connectivity reliability of the road network under random and targeted attack strategies was evaluated using Monte Carlo Simulation (MCS), revealing the impact of different attack strategies on network reliability. Subsequently, considering the time-dependent failure distribution of road sections and their interdependencies, a cascading failure mechanism was introduced to build a time-varying reliability assessment model based on DBN. The effectiveness of the proposed method was verified through a case study of a partial road network in Dalian. The results show that ignoring cascading effects can significantly overestimate the reliability of the road network, especially during peak traffic hours, where such deviations may mask the real paralysis risks of the network. In contrast, the method proposed in this study fully considers time dynamics and failure correlation, and can better capture the reliability of the road network under various dynamic conditions, providing a scientific basis for the resilience planning and emergency management of urban traffic systems.
Keywords:
Urban road network
; Road network reliability
; Dynamic Bayesian Network
; Fault Tree
; Cascading failure
1. Introduction
With the continuous progress of global urbanization, urban traffic systems, as important infrastructures supporting the operation of modern cities, are becoming increasingly complex and fragile [1]. Urban road networks, as key components of traffic systems, involve dynamic interactions among people, vehicles, roads, and the environment. They need to meet the growing travel demands and maintain stable operation under disturbances such as emergencies, adverse weather, or equipment failures [2]. In the framework of systems engineering, the complexity of urban road networks is mainly manifested in their multi-level, multi-scale structural characteristics and dynamic behaviors [3]. At the topological level, road networks usually exhibit a hybrid pattern of small-world and scale-free characteristics, with some major intersections or transportation hubs carrying far more traffic load than the average level [4]. At the functional level, road networks need to meet various traffic demands such as commuting, freight, and emergency services, and the competition and coordination among different demands further increase the uncertainty of the system. In addition, the state of the road network evolves over time, with tidal phenomena during morning and evening peaks and temporary traffic control during special events significantly changing the network's operating characteristics [5]. Under these multiple challenges, road network reliability research has become an important topic for alleviating urban traffic congestion.
Road network reliability research emphasizes analyzing and optimizing the stability and emergency response capabilities of road networks to ensure continuous operation under various disturbances. It originated in the 1980s, mainly drawing on the reliability theory of power systems and focusing on the connectivity performance of the network [6,7]. As research deepens, scholars have gradually recognized the limitations of considering only physical connectivity and have begun to introduce travel time reliability and capacity reliability, which are closer to the actual traffic operation status[8]. Connectivity reliability mainly assesses the ability of the road network to maintain connectivity between nodes after partial element failures, but its binary assumption of connectivity or interruption is difficult to reflect different levels of service degradation [9]. Travel time reliability quantifies the stability of services by analyzing the statistical distribution of travel time, which is more in line with travelers' actual experiences [10,11]. Capacity reliability focuses on the performance of the road network when it is close to its design capacity and has important guiding significance for urban traffic planning [12,13]. However, the coupling among elements within the road network system means that local failures can quickly spread through cascading effects, leading to functional degradation or even paralysis of the entire network. This complexity and probabilistic uncertainty are not only reflected in the physical topology but also in the spatiotemporal distribution of traffic flow, the randomness of travel behavior, and the diversity of management strategies [14].
In summary, there are three main limitations in current road network reliability assessment [15]. First, the modeling of time dynamics is insufficient. Most studies assume a static network, ignoring the time-varying characteristics of traffic demand and the aging process of infrastructure, resulting in deviations between the assessment results and the actual situation. Second, the failure correlation among elements is not fully considered. Traditional methods often assume that the failures of nodes or roads are independent, which is inconsistent with the observed cascading failures [16,17]. Cascading failure in road networks refers to the chain reaction where the failure of one node or road section triggers the successive failures of other related elements through topological or functional dependencies. This effect can significantly amplify the impact of local failures, leading to rapid network performance degradation or even global collapse. Existing methods generally ignore the impact of cascading failures, so quantifying the propagation mechanism of cascading failures is a key link to improving the accuracy of reliability assessment and identifying potential paralysis risks [18]. Third, the uncertainty quantification method needs to be improved. There are many random factors in the road network operation environment, such as the incidence rate of traffic accidents and the impact of weather changes, which require more precise probabilistic modeling tools [19,20].
In response to the above research status, this study proposes a road network reliability assessment method based on Dynamic Bayesian Networks (DBN). In terms of structural reliability, the road network reliability under different attack strategies is analyzed multidimensionally using Monte Carlo Simulation (MCS). In terms of time-varying reliability, a DBN is constructed to characterize the time-dependent failure relationships of road network elements. On this basis, the strength of cascading failure propagation is quantified by introducing a Conditional Probability Table (CPT) that reflects the failure correlation among elements, enabling the model to more realistically reflect the failure diffusion process. This method integrates graph theory, probability theory, and system reliability theory to achieve unified modeling of the spatiotemporal dynamic characteristics of the road network, effectively improving the accuracy of the assessment and providing a new analytical perspective for understanding the formation mechanism of road network fragility.
2. Methods and Models
The assessment model constructed in this study includes two parts: structural connectivity reliability and time-varying connectivity reliability, as shown in Figure 1.
2.1. Structural Connectivity Reliability Modeling and Assessment
2.1.1. Road Network Connectivity Reliability Modeling
To analyze the structural connectivity reliability of the road network from a structural perspective, this study constructs a structural connectivity reliability model based on graph theory and topological analysis methods. The dual method is used to map roads to nodes and the connections between roads to edges, assuming there are m roads and n nodes. The topological structure of the road network with different values of m and n is shown in Figure 2.
The characteristics of the road network topology are described by network parameters, as shown in Table 1.
The average degree in Table 1 is calculated as:
where N is the number of nodes in the undirected graph, and ki is the degree of node i, that is, the number of nodes directly connected to node i.
The average path length is calculated as:
where dij is the shortest path length between node i and node j.
The clustering coefficient of node i is calculated as:
where Ti is the number of edges actually existing between the nodes directly connected to node i.
The average clustering coefficient of the network is calculated as:
The global network efficiency is calculated as:
The structural reliability of the road network is also assessed by connectivity reliability and the size of the largest connected component, among other indicators. The connectivity reliability is expressed as:
where NCOD is the number of OD pairs that remain connected after the attack, and NTOD is the total number of OD pairs.
The size of the largest connected component refers to the proportion of the number of nodes in the largest connected subgraph of the remaining network after the attack to the number of remaining nodes, and the calculation formula is:
where Nmax is the number of nodes in the largest connected subgraph, and Nr is the number of remaining nodes after the attack.
2.1.2. Road Network Reliability Assessment Based on MCS
Regarding road network reliability assessment, two attack strategies are defined: when edges or nodes in the road network are destroyed with uniform probability, it is called a random attack; when nodes or edges in the road network are preferentially destroyed based on their topological importance or functional criticality, it is called a targeted attack. The former simulates the impact of random failures on the road network due to natural disasters such as earthquakes and floods, or the aging and failure of traffic equipment. The latter simulates the targeted interruption of the highest traffic volume sections or commuter corridors during peak hours.
Based on the constructed road network topology model, MCS is used to estimate statistical characteristics through repeated simulations, simulating the failure process of the road network under random and targeted attacks, and continuously calculating Rc, RLCC, and Rglobal to obtain the mean and standard deviation of each index. The mean of connectivity reliability is calculated as:
where M is the total number of simulations, and is the connectivity reliability value obtained in the k-th simulation, that is, the proportion of connected node pairs after the attack.
The standard deviation of connectivity reliability is calculated as:
The road network reliability calculated using the largest connected component of the remaining network is expressed as:
where Nc is the number of remaining nodes, and Nc′ is the number of nodes contained in the largest connected subgraph.
The flowchart of Monte Carlo Simulation for road network structural connectivity reliability assessment is shown in Figure 3.
2.2. Time-Varying Connectivity Reliability Modeling and Assessment
2.2.1. Road Network Time-Varying Reliability Modeling
To establish a mapping relationship between the actual traffic operation state and topological connectivity, a definition of time-varying connectivity reliability is proposed based on the physical structure of the road network and the dynamic characteristics of traffic flow, that is, the ability of the road network to meet traffic demands and maintain normal operation within a specific condition and time domain.
(1) Reliability modeling without considering cascading failures
Without considering the impact of cascading failures, a Fault Tree (FT) of road network failures is constructed to systematically establish a logical mapping relationship from road sections to the entire road network. The road network is regarded as an organic whole, analyzing the associations among its hierarchical structures and the synergistic effects of different hierarchical elements on road network reliability, and determining the dynamic laws of road network reliability over time.
According to the definition of time-varying connectivity reliability, assuming that the failure events of different OD pairs are independent, that is, the failure of one OD pair does not affect the failure probability of other OD pairs, the reliability R(D)(t) of the road network without considering cascading failures is defined as the probability that at least one path exists between any OD pair within a specific condition and time t, and the general form is expressed as:
where is the probability that at least one OD pair will fail.
The probability that all OD pairs remain connected is the product of the connectivity probabilities of each OD pair, so equation (11) can be directly expressed as:
where Ri(D)(t) is the probability that the i-th OD pair remains connected at time t, and P(ODi) is the probability that the i-th OD pair fails at time t.
(2) Reliability modeling considering cascading failure
According to the definition of cascading failure, let the failure event of path Pi be Ei. If paths Pi and Pj share a road section or have connected road sections Lk that make Ei and Ej influence each other, then Ei and Ej are dependent. To characterize the dependency between paths, joint probability and conditional probability of cascading failures need to be introduced in the road network reliability modeling considering failure correlation. The reliability considering shared and connected road sections is expressed as:
where is the probability that paths Pi and Pj fail simultaneously.
where P(Ej) is the probability of independent failure of path Pj, and is the probability of failure of path Pi under the condition of failure of path Pj.
When constructing the DBN model of OD pairs, road section failures are considered as child nodes, path failures as intermediate nodes, and OD pair failures as parent nodes, with logical gates used to characterize the dynamic dependencies between nodes.
The failure of an OD pair is an "AND" logic of path failures, and its failure probability is expressed as:
where P(Pj) is the failure probability of path Pj.
The failure of a path is an "OR" logic of road section failures, and its failure probability is expressed as:
where P(Lk) is the failure probability of road section Lk.
The traffic congestion delay index is analyzed to divide road congestion conditions into four levels: free-flow, slow-moving, congested, and severely congested. The threshold G=4.0 is defined for severe congestion, and when Ii≥G, the road is considered to have failed. The frequency of road section failures within a given time is counted to determine the prior probability of the time-varying connectivity reliability assessment model, that is, the failure probability of the road section, expressed as:
where NF is the number of times road section Lk has Ii≥G within the given time, and NT is the total number of observations.
The congestion delay index Ii is expressed as:
where Ia is the actual travel time, and If is the free-flow travel time.
2.2.2. Road Network Reliability Assessment Based on FT-DBN
Based on road network reliability theory, a FT is constructed from the perspective of network topology, and a Bayesian Network (BN) is used for quantitative analysis, combining the advantages of qualitative and quantitative analysis to systematically evaluate the failure modes of the road network. Assuming that the random event of OD pair failure is ODF, the random events of path failures are P1,P2,…,Pm, and the random events of road section failures are L1,L2,…,Ln, an FT of OD pair failure is established with path failures as intermediate events and road section failures as bottom events. The top event ODF and random events P1,P2,…,Pm have an "AND" logic gate relationship; the path failures and random events L1,L2,…,Ln have an "OR" logic gate relationship. The structure of the FT is shown in Figure 4.
In the BN constructed based on the road network, nodes represent the failure states of random variables such as road sections, paths, and nodes, and directed edges represent the conditional dependencies between variables. According to the prior and posterior probabilities of the BN, bidirectional reasoning can be realized. This study applies forward reasoning to predict the changes in road network reliability over time under specific attacks and backward reasoning to determine the key failed road sections based on observed congestion phenomena.
Based on the BN model, the continuous time is divided into a finite number of discrete time steps, with the time interval between adjacent time steps denoted as the step length , which is the truncation time of the i-th discrete time step, i = 0,1,2,..., A Dynamic Bayesian Network (DBN) model is constructed by adding cross-time arcs to connect the same nodes in adjacent time steps, reflecting the changes in node failure states over time.
To fully consider the failure modes of the road network, this study utilizes the advantages of Dynamic Fault Trees (DFT) and DBN in road network analysis modeling and reasoning calculations, respectively, and constructs a DBN considering cascading failure based on DFT. The DFT of ODF failure considering cascading failure is shown in Figure 5.
The specific conversion rules and conversion diagrams of the two models are shown in Table 2.
3. Case Analysis
3.1. Assessment of Road Network Structural Connectivity Reliability
3.1.1. Analysis of Road Network Basic Characteristics
This section selects a partial transportation hub area in Dalian with high road network density and complex road conditions, which clearly reflects the characteristics of urban roads, as the research object. The road network map of the study area is shown in Figure 9.
The road network data is preprocessed and visualized in ArcGIS, and the main and secondary roads are selected as topological objects. The area includes a total of 24 roads and 80 road junctions. The dual topology structure of the partial road network in Dalian is shown in Figure 10.
The adjacency matrix of the above road network is calculated, and the initial values of various statistical characteristics of the complex network of the partial road network in Dalian are shown in Table 3.
3.1.2. Assessment of Road Network Structural Reliability
A thousand MCS are performed to simulate the failure process of the road network under random and targeted attack strategies. The impact of different attack strategies on road network connectivity, the size of the largest connected component, and global network efficiency is calculated according to equations (5) – (10), and the structural connectivity reliability of a partial road network in Dalian is assessed.
The differences in indicators under the two attack strategies are compared in Table 4, and the statistical significance is verified.
The road network reliability calculation results under the two attack strategies are shown in Table 5.
The changes in road network assessment indicators under the two attack strategies are shown in Figure 11.
According to Table 5 and Figure 11, through MCS, the influence difference of attack strategy is quantified. The simulation results verify the effectiveness of MCS method in revealing system uncertainty and reducing accidental error. Under the random attack strategy, it is difficult to concentrate on destroying key nodes, and the road network shows higher reliability, with an RLCC decrease rate of -3.2%/attack, indicating that the road network has basic redundancy capabilities. Such assessments can only reflect the global redundancy characteristics of the network and cannot reveal the potential vulnerabilities of key nodes. Under the targeted attack strategy, the failure of key nodes directly exposes the structural vulnerabilities of the road network, resulting in an RLCC decrease rate of -10.5%/attack, and the decay speed of Rc is 2.4 times that of the random attack, indicating that key nodes have a decisive impact on road network connectivity. The multidimensional statistics of MCS further show that the decrease in Rglobal is highly correlated with RLCC (Pearson coefficient = 0.93), revealing the strong dependence of road network functional efficiency on topological connectivity structure. Therefore, to improve road network reliability, it is necessary to focus on key nodes and increase redundancy connections or enhance recovery capabilities to improve reliability.
3.2. Assessment of Road Network Time-Varying Connectivity Reliability
3.2.1. Reliability Assessment Model without Considering Cascading Failures
This section selects a total of 9 roads, including congested roads and connecting roads in Dalian, as the research object. The road network data is processed, and the dual topology diagram of the area is constructed according to Figure 2, as shown in Figure 12. Figure (a) is the original road topology structure diagram, and Figure (b) is the dual topology structure diagram.
From Figure 12, it can be seen that the road network topology diagram has 9 nodes and 12 edges. There are 4 OD pairs: (1→4), (1→2), (6→8), (7→9). The paths they contain are as follows:
OD Pair 1 (1→4): {1,6,4}, {1,6,5,8,4}, {1,6,3,8,4}, {1,7,2,8,4}, {1,6,5,9,3,8,4};
OD Pair 2 (1→2): {1,7,2}, {1,6,3,2}, {1,6,5,8,2}, {1,6,3,8,2}, {1,6,4,8,2}, {1,6,5,9,3,2}, {1,6,3,9,8,2};
OD Pair 3 (6→8): {6,5,8}, {6,3,8}, {6,4,8}, {6,1,7,2,8};
OD Pair 4 (7→9): {7,2,8,9}, {7,2,3,9}, {7,1,6,5,9}, {7,1,6,3,9}.
The average failure probabilities of the roads calculated based on the historical traffic congestion delay index over the past three months are shown in Table 6.
A failure FT of OD Pair 1 is constructed without considering cascading failures, as shown in Figure 13.
According to the conversion rules in Table 2, the BN of OD Pair 1 is constructed, as shown in Figure 14.
The overall BN of the road network is obtained by integrating the BNs of all OD pairs, as shown in Figure 15.
3.2.2. Reliability Assessment Model Considering Cascading Failures
Based on the FT-DBN method for road network reliability assessment, the DFT of path P1 considering cascading failures is constructed, as shown in Figure 17.
According to the conversion rules in Table 2, the DBN model of the road network considering cascading failures is obtained by setting the discrete time step length be minutes and simplifying it, as shown in Figure 18.
The DBN of path P1 is shown in Figure 19.
The CPT of cascading failures for path P1 is shown in Table 7.
3.2.3. Assessment of Road Network Time-Varying Reliability
The road network reliability R(t) with and without considering cascading failures is calculated according to equations (11) - (18), and the results are shown in Table 8.
The curve of road network reliability R(t) over time is shown in Figure 20.
The key road sections under the cascading failure and independent failure models are shown in Table 9.
The posterior probabilities under the independent failure and cascading failure models are shown in Figure 21.
According to Figure 20 and Figure 21, when only time-varying factors are considered without considering cascading failures, the reliability R(t) of the road network remains within the range of 0.58 - 0.68 due to the locality of independent failures. When considering both cascading failures and time-varying factors, R(t) drops sharply to 0.28 - 0.33 during the two peak traffic periods due to cascading propagation, with a decrease of over 0.3. This exposes the cascading amplification effect of key nodes L1 and L6, reflecting the actual situation of the road network. Although the repair mechanism partially recovers R(t) to 0.35 - 0.42 at and step, the recovery lag caused by the failure correlation between road sections results in low road network recovery efficiency. Notably, ignoring cascading effects can significantly overestimate road network reliability, especially during peak traffic hours, which may mask the real paralysis risks. Therefore, time-varying reliability assessment considering cascading failures is crucial for emergency planning. It is necessary to reinforce key nodes and optimize the allocation of repair resources during peak periods to enhance the reliability of the road network.
4. Conclusions
This paper proposes a multi-scale assessment method for urban traffic network reliability based on Dynamic Bayesian Networks and Monte Carlo Simulation, addressing the insufficient dynamic representation and missing failure correlation modeling in existing methods. The specific contributions are as follows:
(1) A road network structural connectivity reliability assessment method based on MCS is proposed. The dual method is used to construct the road network topology model, and network parameters are used to describe the structural connectivity reliability of the road network. Combined with MCS, the redundancy and vulnerability characteristics of the road network under random and targeted attack strategies are revealed. The structural connectivity reliability of a partial road network in Dalian is analyzed, confirming the effectiveness of this method in addressing system uncertainty and reducing accidental error. The failure of key nodes significantly accelerates the risk of network collapse, providing theoretical support for optimizing road network structural redundancy design.
(2) A road network time-varying connectivity reliability assessment method based on FT-DBN is proposed. A failure Fault Tree of the road network is constructed to establish the failure logic relationship from road sections to the entire road network. The hierarchical element associations and their impacts on overall road network reliability are analyzed. The congestion delay index is introduced to construct a Bayesian Network, which is expanded into a Dynamic Bayesian Network based on Conditional Probability Tables to quantify the failure correlation. This breaks through the static limitations of traditional Fault Trees and reveals the laws of road network reliability changes over time without considering cascading failures. In terms of failure propagation modeling, a road network failure probability model is proposed by converting Dynamic Fault Trees into Dynamic Bayesian Networks. The time delay mechanism is introduced to construct the conditional probability table of cascading failures, establishing a non-linear mapping from traffic congestion states to topological connectivity. This accurately characterizes the time-varying evolution laws of road network reliability under cascading failure scenarios. The empirical analysis using traffic data from Dalian shows that ignoring cascading effects can lead to a maximum reliability assessment deviation of 0.3, especially during morning peak hours. The failure of key nodes triggers cascading propagation, causing the road network reliability to drop by 58%. Through multidimensional indicator comparisons, the proposed method is proven to have significant advantages over traditional methods in terms of structural vulnerability point identification accuracy and emergency resource allocation efficiency. The adaptability of the model to complex dynamic scenarios is verified, and it can provide more accurate traffic congestion warnings and resource allocation suggestions for traffic management departments.
Author Contributions
Conceptualization, S.H.D., N.J. and S.Q.L.; methodology, S.H.D., N.J. and S.Q.L.; software, N.J. and S.Q.L.; validation, S.H.D., N.J. and S.Q.L.; case analysis, N.J. and Y.Z.Z; investigation, S.H.D., N.J. and S.Q.L.; resources, N.J. and S.H.D.; data process, N.J. and S.H.D.; writing—original draft preparation, S.H.D., N.J. and S.Q.L.; writing—review and editing, S.H.D., N.J. and S.Q.L.; visualization, N.J. and Y.Z.Z.; supervision, S.H.D. and S.Q.L.; project administration, S.H.D. and N.J.; funding acquisition, S.H.D. All authors have read and agreed to the published version of the manuscript.
Funding
This research received no external funding.
Institutional Review Board Statement
Not applicable.
Informed Consent Statement
Not applicable.
Data Availability Statement
The data presented in this study are available on request from the corresponding author..
Acknowledgments
Thanks for the financial support from KINGFAR INTERNATIONAL INC. (20230114479).
Conflicts of Interest
The authors declare no conflicts of interest.
Abbreviations
The following abbreviations are used in this manuscript:
| DBN | Dynamic Bayesian Network |
| MCS | Monte Carlo Simulation |
| CPT | Conditional Probability Table |
| FT | Fault Tree |
| BN | Bayesian Network |
| DFT | Dynamic Bayesian Network |
References
- Peiravian, F.; Derrible, S. Multi-dimensional geometric complexity in urban transportation systems. arxiv 2015, arXiv:1507.03607. [Google Scholar] [CrossRef]
- Yangyang, M. Vulnerability Comparisons of Various Complex Urban Metro Networks Under Multiple Failure Scenarios. Sustainability 2024, 16, 9603–9603. [Google Scholar] [CrossRef]
- Zhang, R.; Li, Y.; Li, C.; Chen, T. A complex network approach to quantifying flood resilience in high-density coastal urban areas: A case study of Macau. International Journal of Disaster Risk Reduction 2025, 119, 105335. [Google Scholar] [CrossRef]
- Dumedah, G.; Garsonu, E.K. Characterising the structural pattern of urban road networks in Ghana using geometric and topological measures. Geo: Geography and Environment 2021, 8. [Google Scholar] [CrossRef]
- Liu, J.; Jia, H.; Lin, J.; Hu, H. Seismic Damage Rapid Assessment of Road Networks considering Individual Road Damage State and Reliability of Road Networks in Emergency Conditions. Advances in Civil Engineering 2020, 2020, 9631804. [Google Scholar] [CrossRef]
- Shuwen, L. Improve the reliability index of power supply - strengthen reliability management and reduce the average power outage time of customers. Science and Technology Wind 2017, 1. [Google Scholar]
- Zhang, H.; Wang, M.; Tang, M.; Yang, H. The reliability measures model of multilayer urban distribution network. Soft Computing 2018, 22, 107–118. [Google Scholar] [CrossRef]
- Shao, F.; Shao, H.; Wang, D.; Lam, W.H. A multi-task spatio-temporal generative adversarial network for prediction of travel time reliability in peak hour periods. Physica A: Statistical Mechanics and its Applications 2024, 638, 129632. [Google Scholar] [CrossRef]
- Jiang, L.; Huang, S. Analyzing connectivity reliability and critical units for highway networks in high-intensity seismic region using Bayesian network. Journal of Infrastructure Intelligence and Resilience 2022, 1, 100006. [Google Scholar] [CrossRef]
- Menghan, Q. Dynamic estimation and reliability calculation method of urban arterial travel time. Doctoral dissertation, Chongqing Jiaotong University, Chinese, 2020.
- Kato, T.; Uchida, K.; Lam, W. H. , & Sumalee, A. Estimation of the value of travel time and of travel time reliability for heterogeneous drivers in a road network. Transportation 2021, 48, 1639–1670. [Google Scholar]
- Luo, X.Q.; Hou, Q.H.; Duan, Y.Q. The research of the road network capacity based on the unblocked reliability. BioTechnology: An Indian Journal 2014, 10. [Google Scholar]
- Kuang, A.; Tang, Z.; Shan, L. Road network capacity reliability considering travel time reliability. Procedia-Social and Behavioral Sciences 2013, 96, 1818–1827. [Google Scholar] [CrossRef]
- Yang, W.; Mu, L.; Jiang, H.; Li, X.; Hou, K. Fault Spread and Recovery Strategy of Urban Rail Transit System Based on Complex Network. In Journal of Physics: Conference Series 2021, 2037, 012049. [Google Scholar] [CrossRef]
- Xing, C.; Guohua, C.; Hao, W.; Shenghua, C.; Yun, Z. Reliability analysis method of power system based on GT-RBD. Journal of Shenyang University of Technology 2023, 45, 17–23. [Google Scholar]
- Du, J.; Cui, J.; Ren, G.; Thompson, R.G.; Zhang, L. Cascading failures and resilience evolution in urban road traffic networks with bounded rational route choice. Physica A: Statistical Mechanics and its Applications 2025, 664, 130456. [Google Scholar] [CrossRef]
- Cao, Y.; Lu, C. Reliability analysis for continuous degrading systems subject to multi-level failure dependence. Quality Engineering 2025, 37, 79–91. [Google Scholar] [CrossRef]
- Zhou, S.; Li, Z.; Wang, J. Reliability analysis of dynamic fault trees with Priority-AND gates using conditional binary decision diagrams. Reliability Engineering & System Safety 2025, 253, 110495. [Google Scholar]
- Dou, Q.; Lu, D.G.; Zhang, B.Y. Physical resilience assessment of road transportation systems during post-earthquake emergency phase: With a focus on restoration modeling based on dynamic Bayesian networks. Reliability Engineering & System Safety 2025, 257, 110807. [Google Scholar]
- Liu, P.J.; Guang, S.W.; Xue, J.F.; Tong, Y.; Zhi, Y.L. Study on cascading failure vulnerability of the 21st-century Maritime Silk Road container ship network. Journal of Transport Geography 2024, 117, 103891. [Google Scholar]
- Ziqiang, G. Study on the resilience of dynamic heterogeneous urban road traffic network considering the influence of information conditions. Doctoral dissertation, Southwest Jiaotong University, Chinese, 2021.
- Qingguo, W. Comprehensive analysis of urban road importance evaluation methods. Surveying and mapping bulletin 2018, 4. [Google Scholar]
- Jing, H. Study on the evaluation method of road network failure degree and safety level. Doctoral dissertation, Shanghai Jiaotong University, Chinese, 2010.
- Lei, J. Research on reliability and availability modeling and evaluation methods of high-speed railway signal systems. Doctoral dissertation, Southwest Jiaotong University, Chinese, 2020.
- Meiling, L. Research on the invulnerability of high-speed railway network in China based on complex network theory. Doctoral dissertation, Beijing Jiaotong University, Chinese, 2025.
- Xuliang, G. Research and development of road network traffic operation situation assessment method and system under disaster events. Doctoral dissertation, Chang 'an University, Chinese, 2022.
- Shen, S.; Cheng, J.; Liu, Z.; Tan, J.; Zhang, D. Bayesian inference-assisted reliability analysis framework for robotic motion systems in future factories. Reliability Engineering & System Safety 2025, 110894. [Google Scholar]
- Monfared, M.A.S.; Rezazadeh, M.; Alipour, Z. Road networks reliability estimations and optimizations: A Bi-directional bottom-up, top-down approach. Reliability Engineering & System Safety 2022, 222, 108427. [Google Scholar]
- Zhang, R.; Song, S. Bayesian network approach for dynamic fault tree with common cause failures and interval uncertainty parameters. Maintenance & Reliability 2024, 26. [Google Scholar]
- Barahimi, A.H.; Eydi, A.; Aghaie, A. Urban transportation network reliability calculation considering correlation among the links comprising a route. Scientia Iranica 2022, 29, 1742–1754. [Google Scholar] [CrossRef]
- Wu, S.; Zhu, Y.; Li, N.; Wang, Y.; Wang, X.; Sun, D.J. Urban rail transit system network reliability analysis based on a coupled map lattice model. Journal of Advanced Transportation 2021, 2021, 5548956. [Google Scholar] [CrossRef]
Figure 1.
Flowchart of the assessment model.
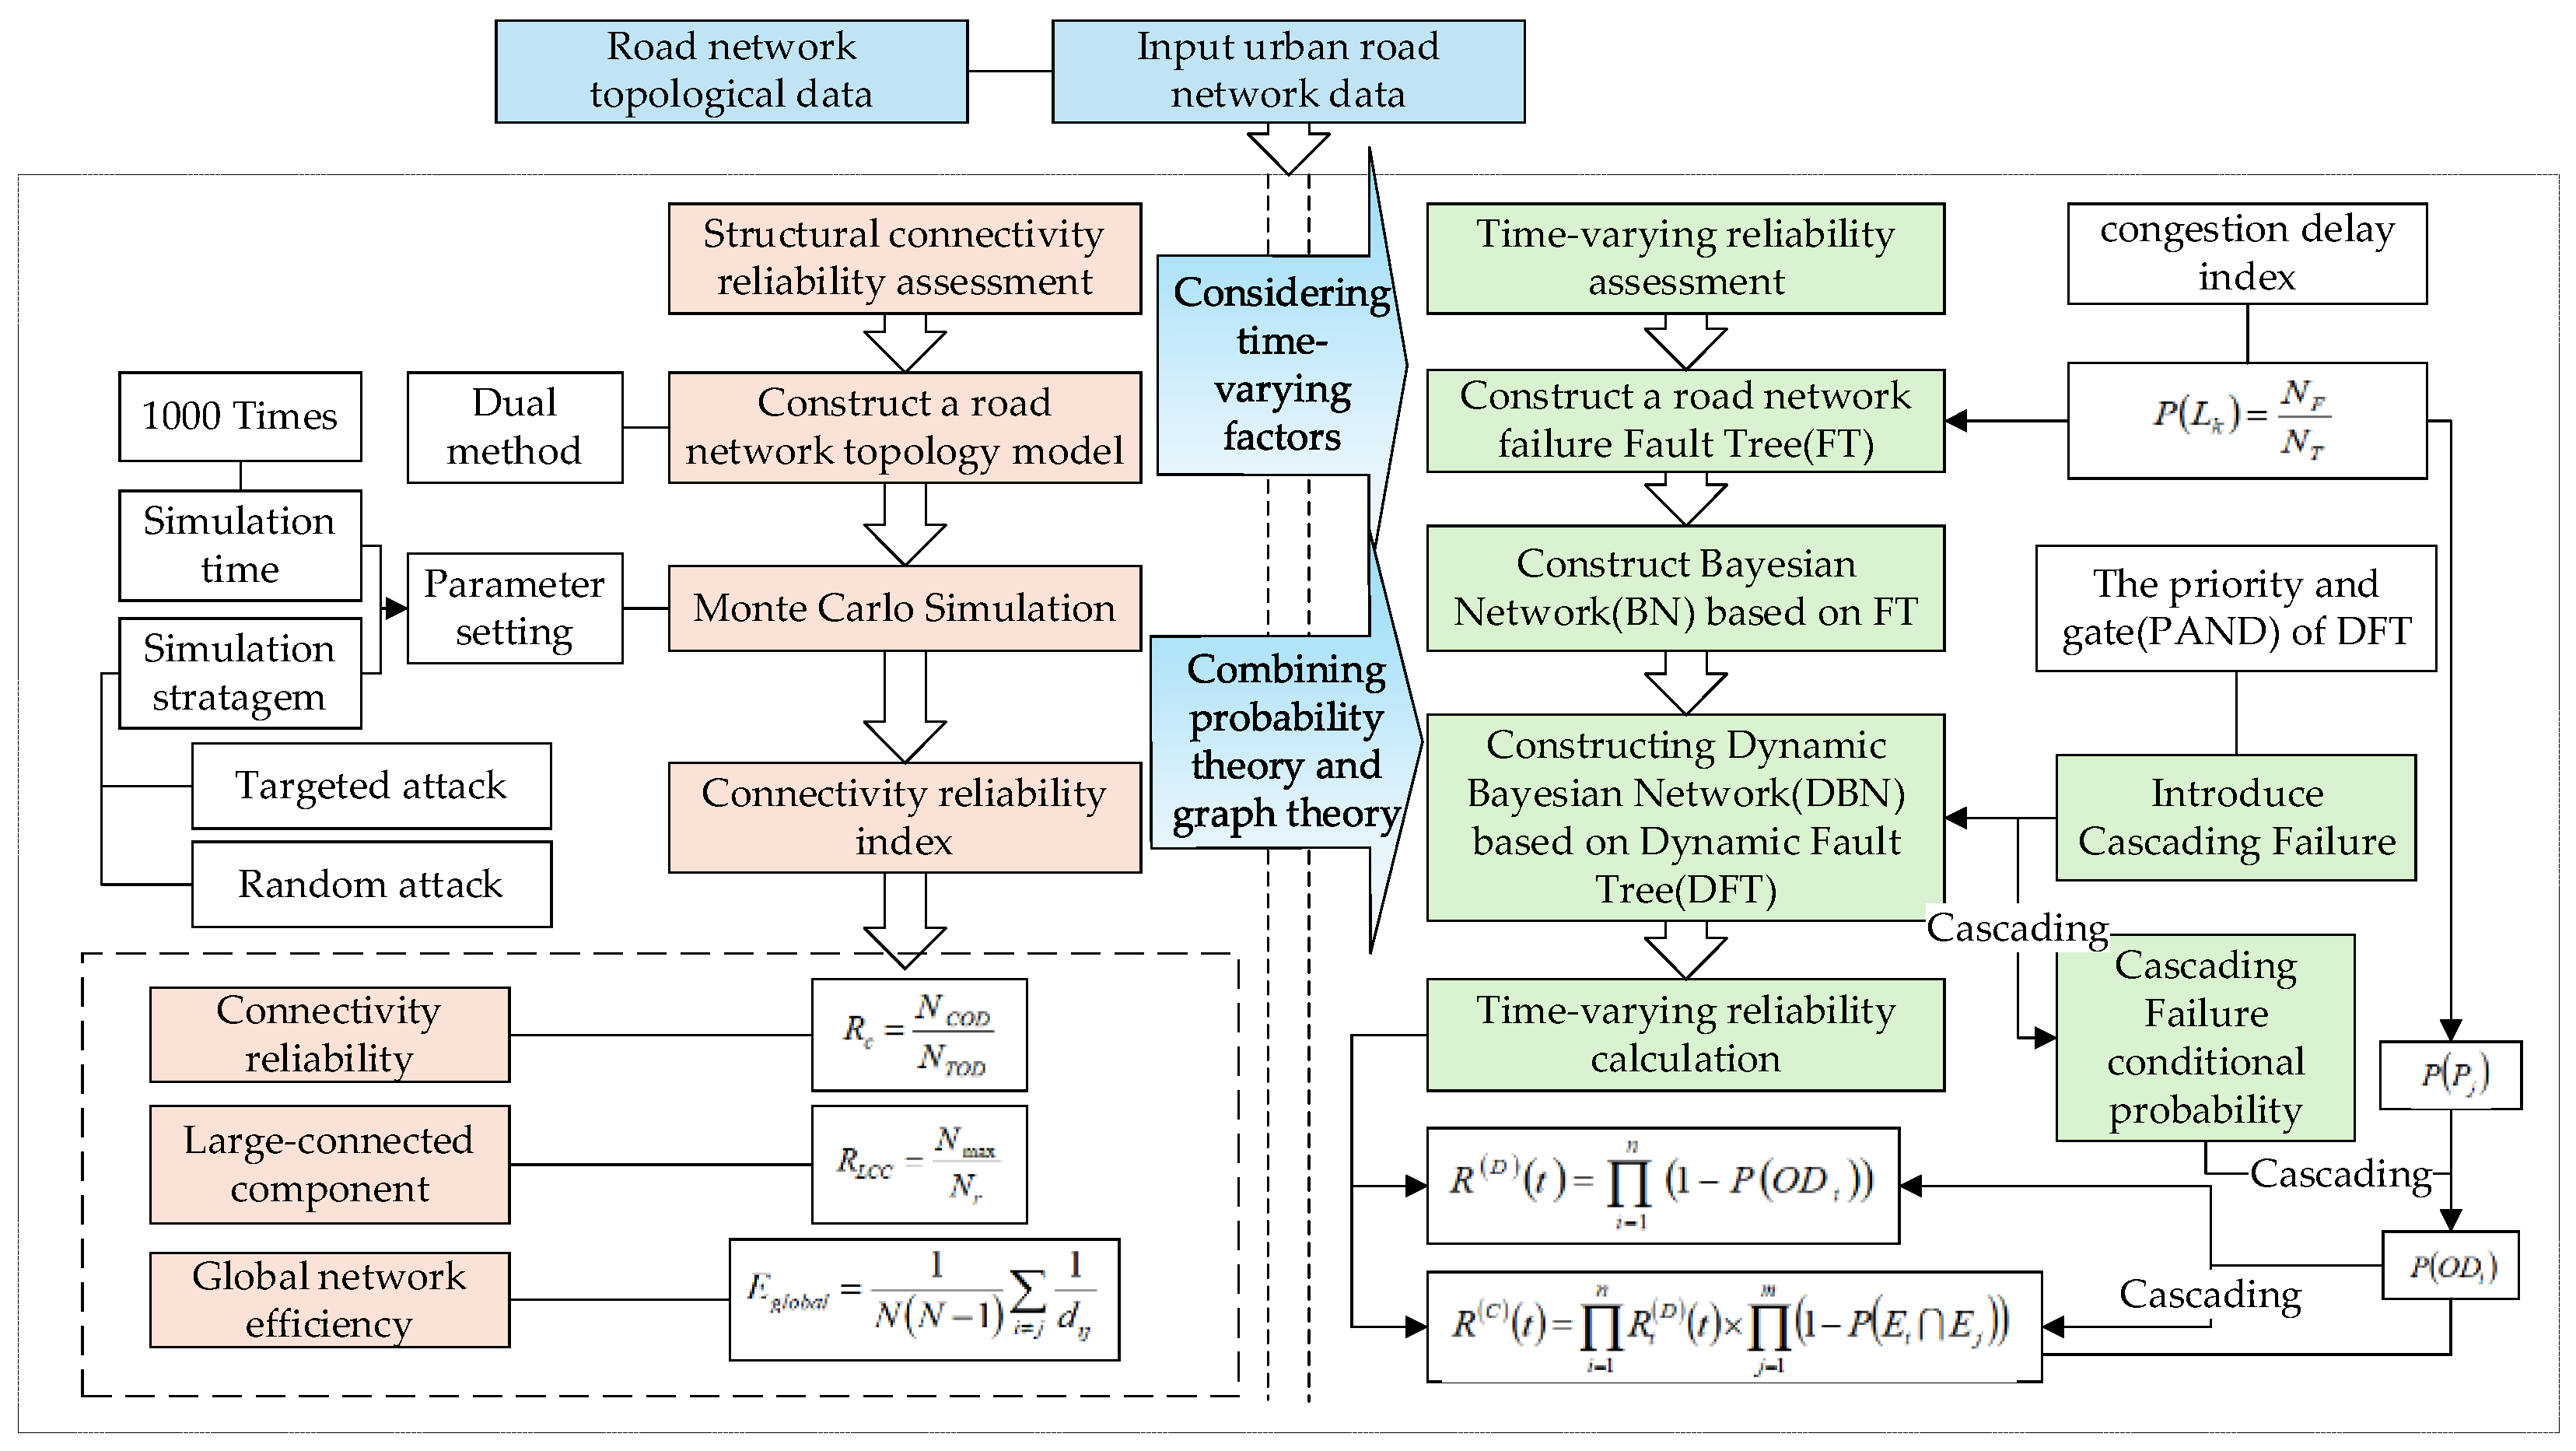
Figure 2.
Schematic diagram of road network topology.
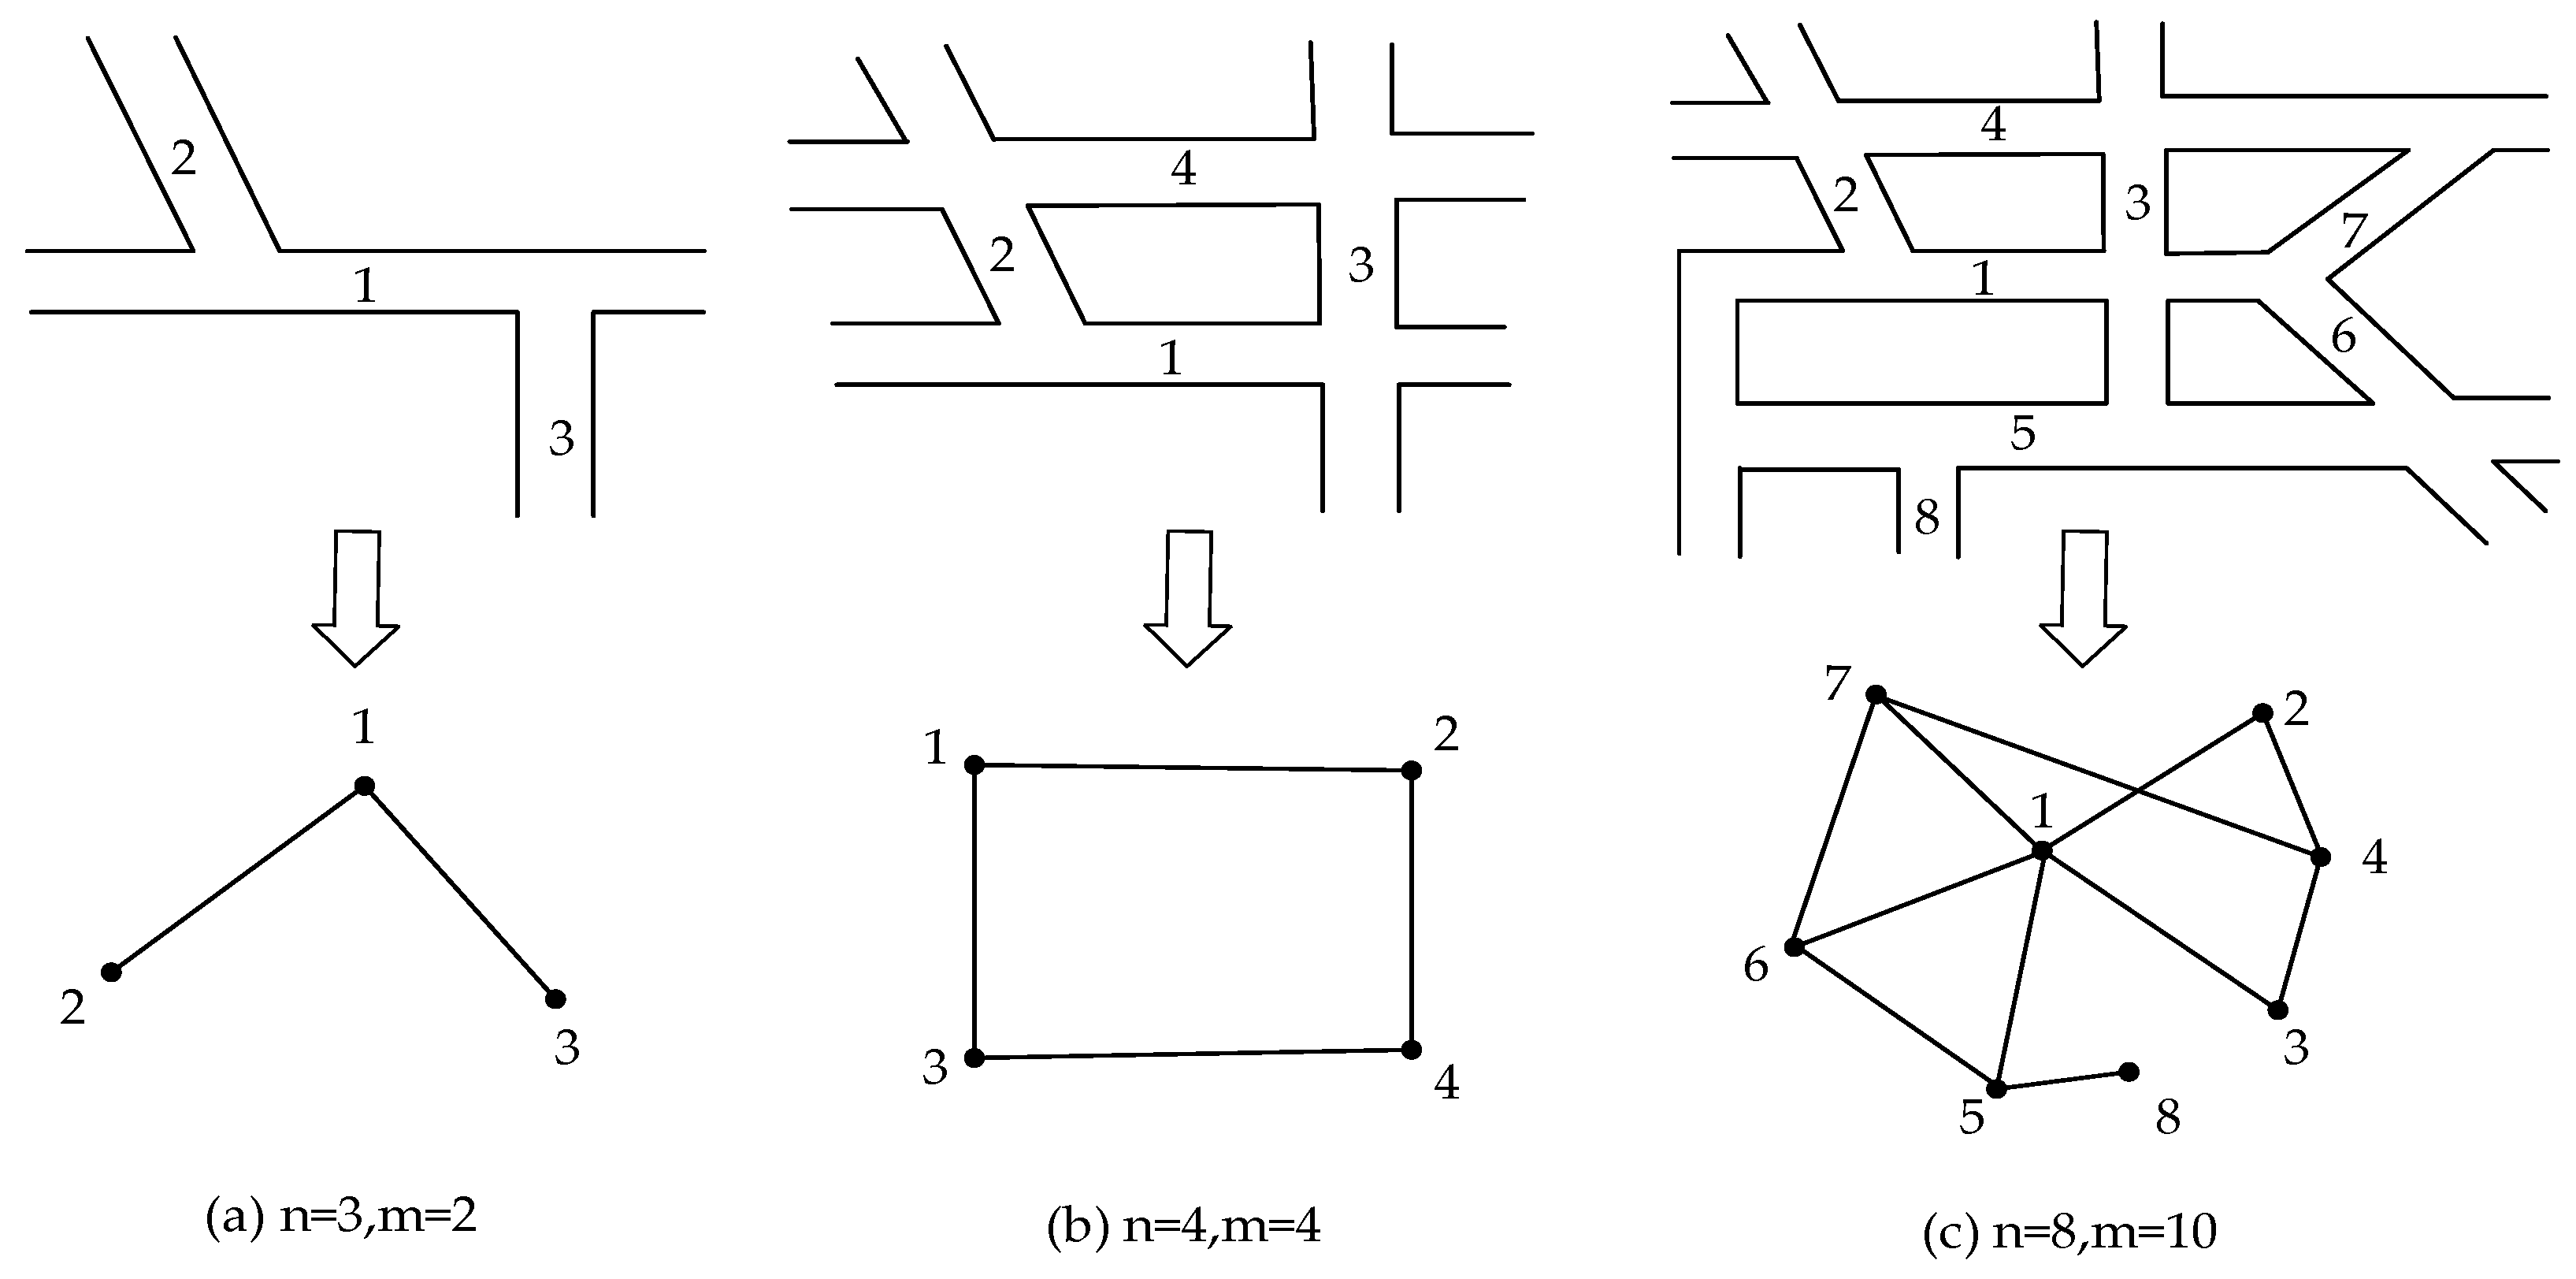
Figure 3.
Flowchart of Monte Carlo Simulation.
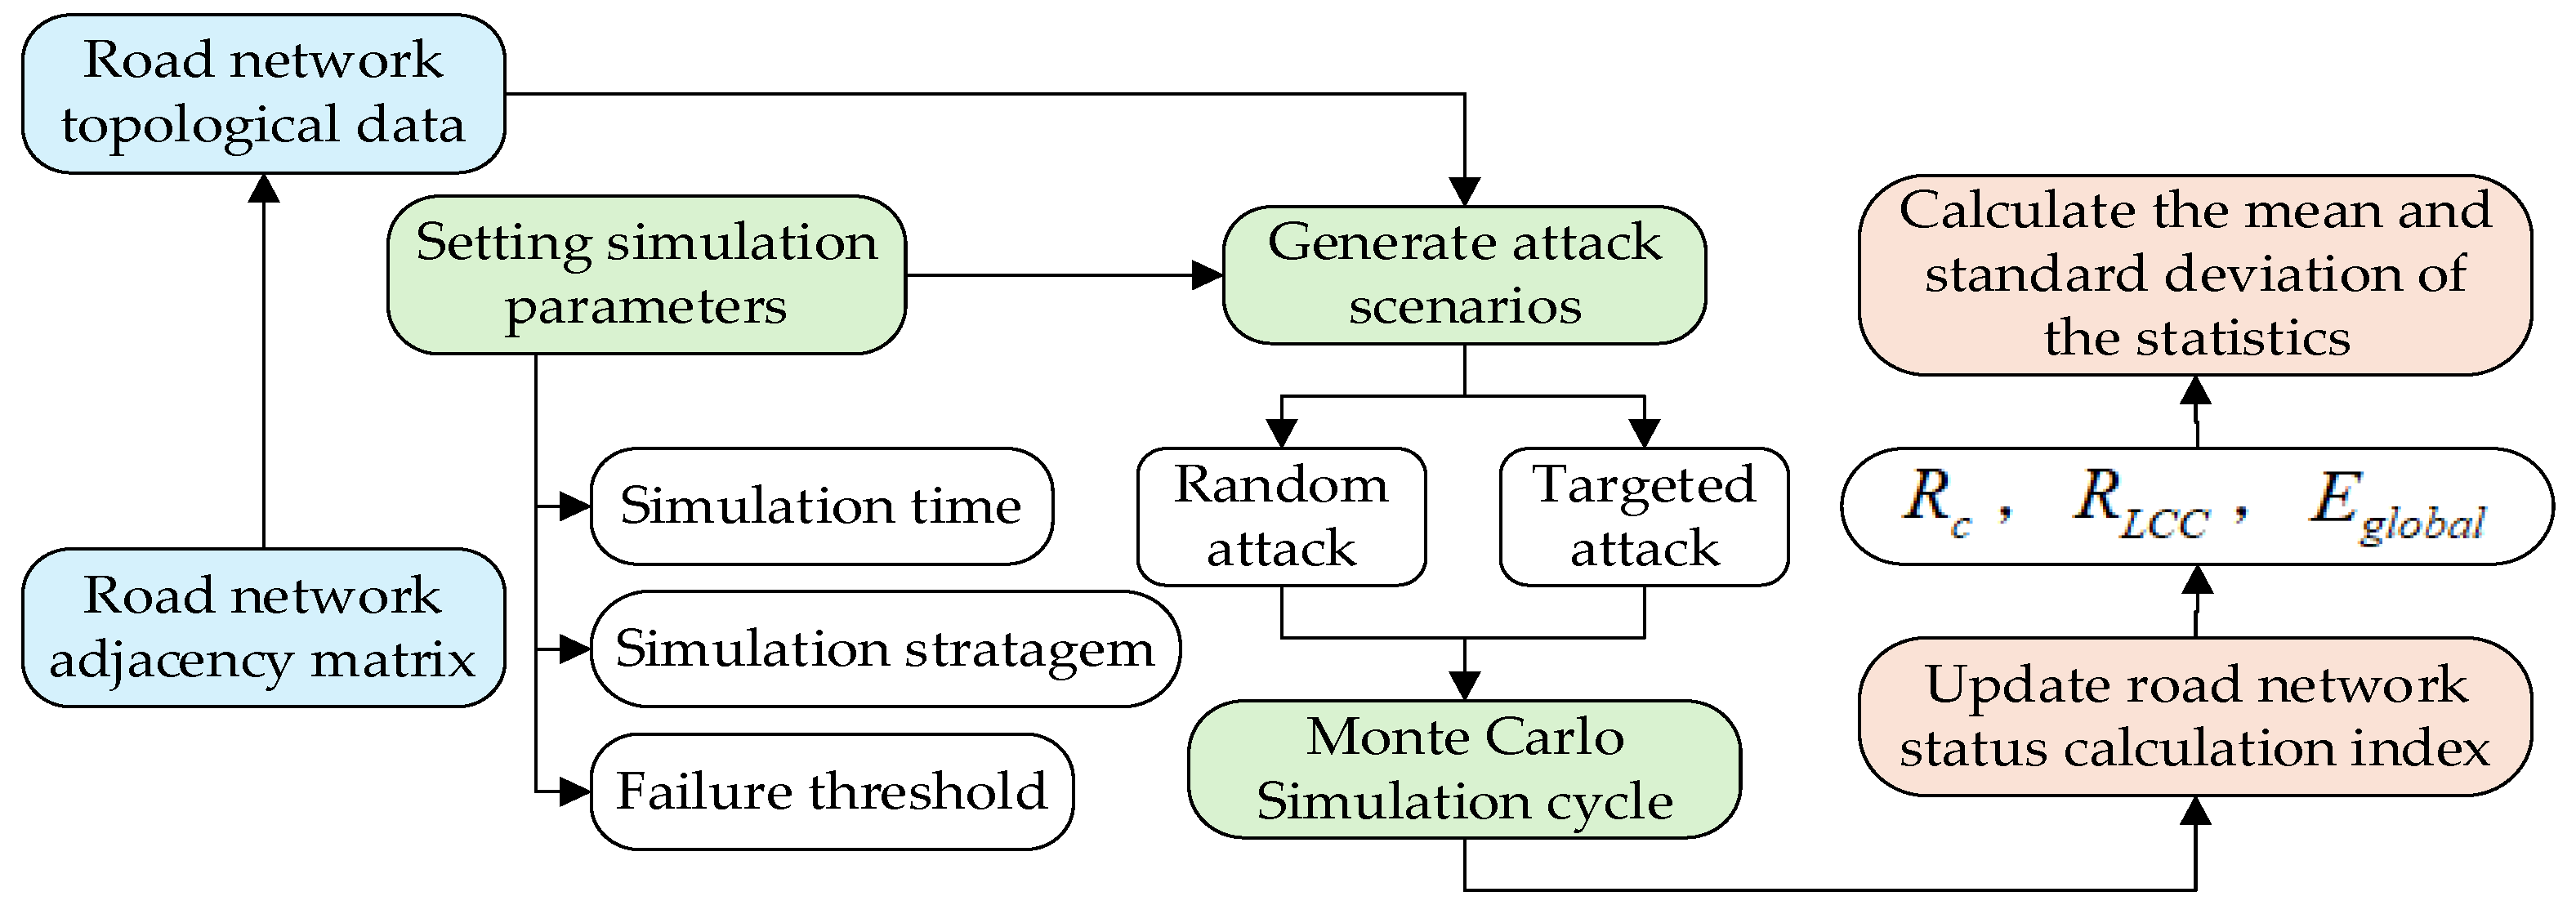
Figure 4.
The Fault Tree of ODF.
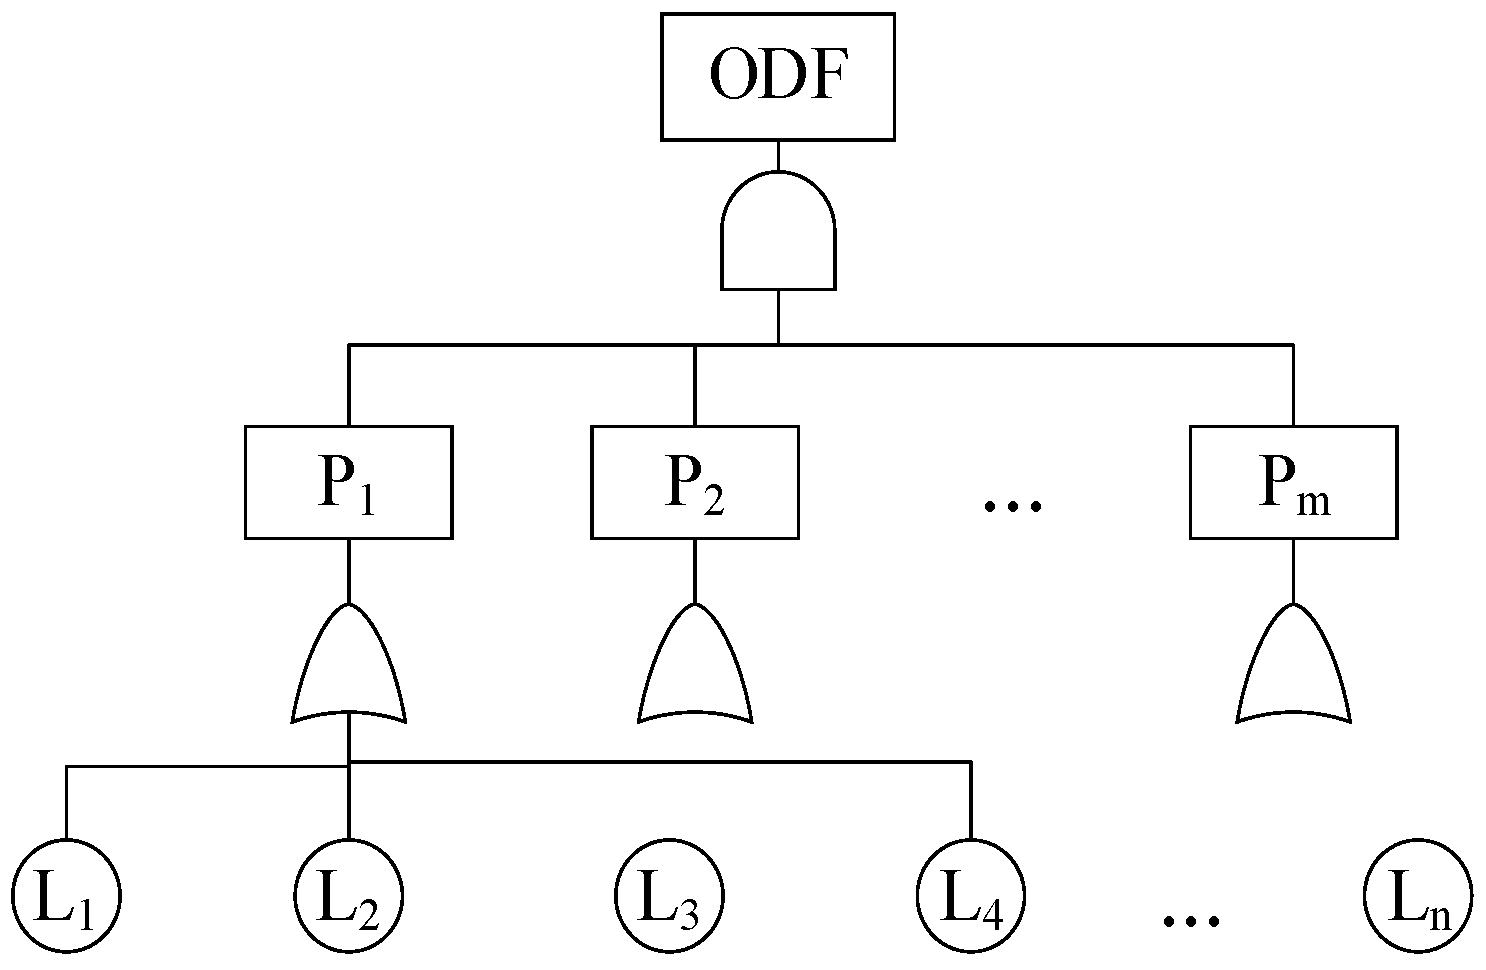
Figure 5.
The Dynamic Fault Tree of ODF considering cascading failure.
Figure 9.
Road network map of a partial area in Dalian.
Figure 10.
Dual topology structure of a partial road network in Dalian.
Figure 11.
Changes in network indicators under the two attack strategies.
Figure 12.
Network diagram of partial congested roads and connecting roads in Dalian.
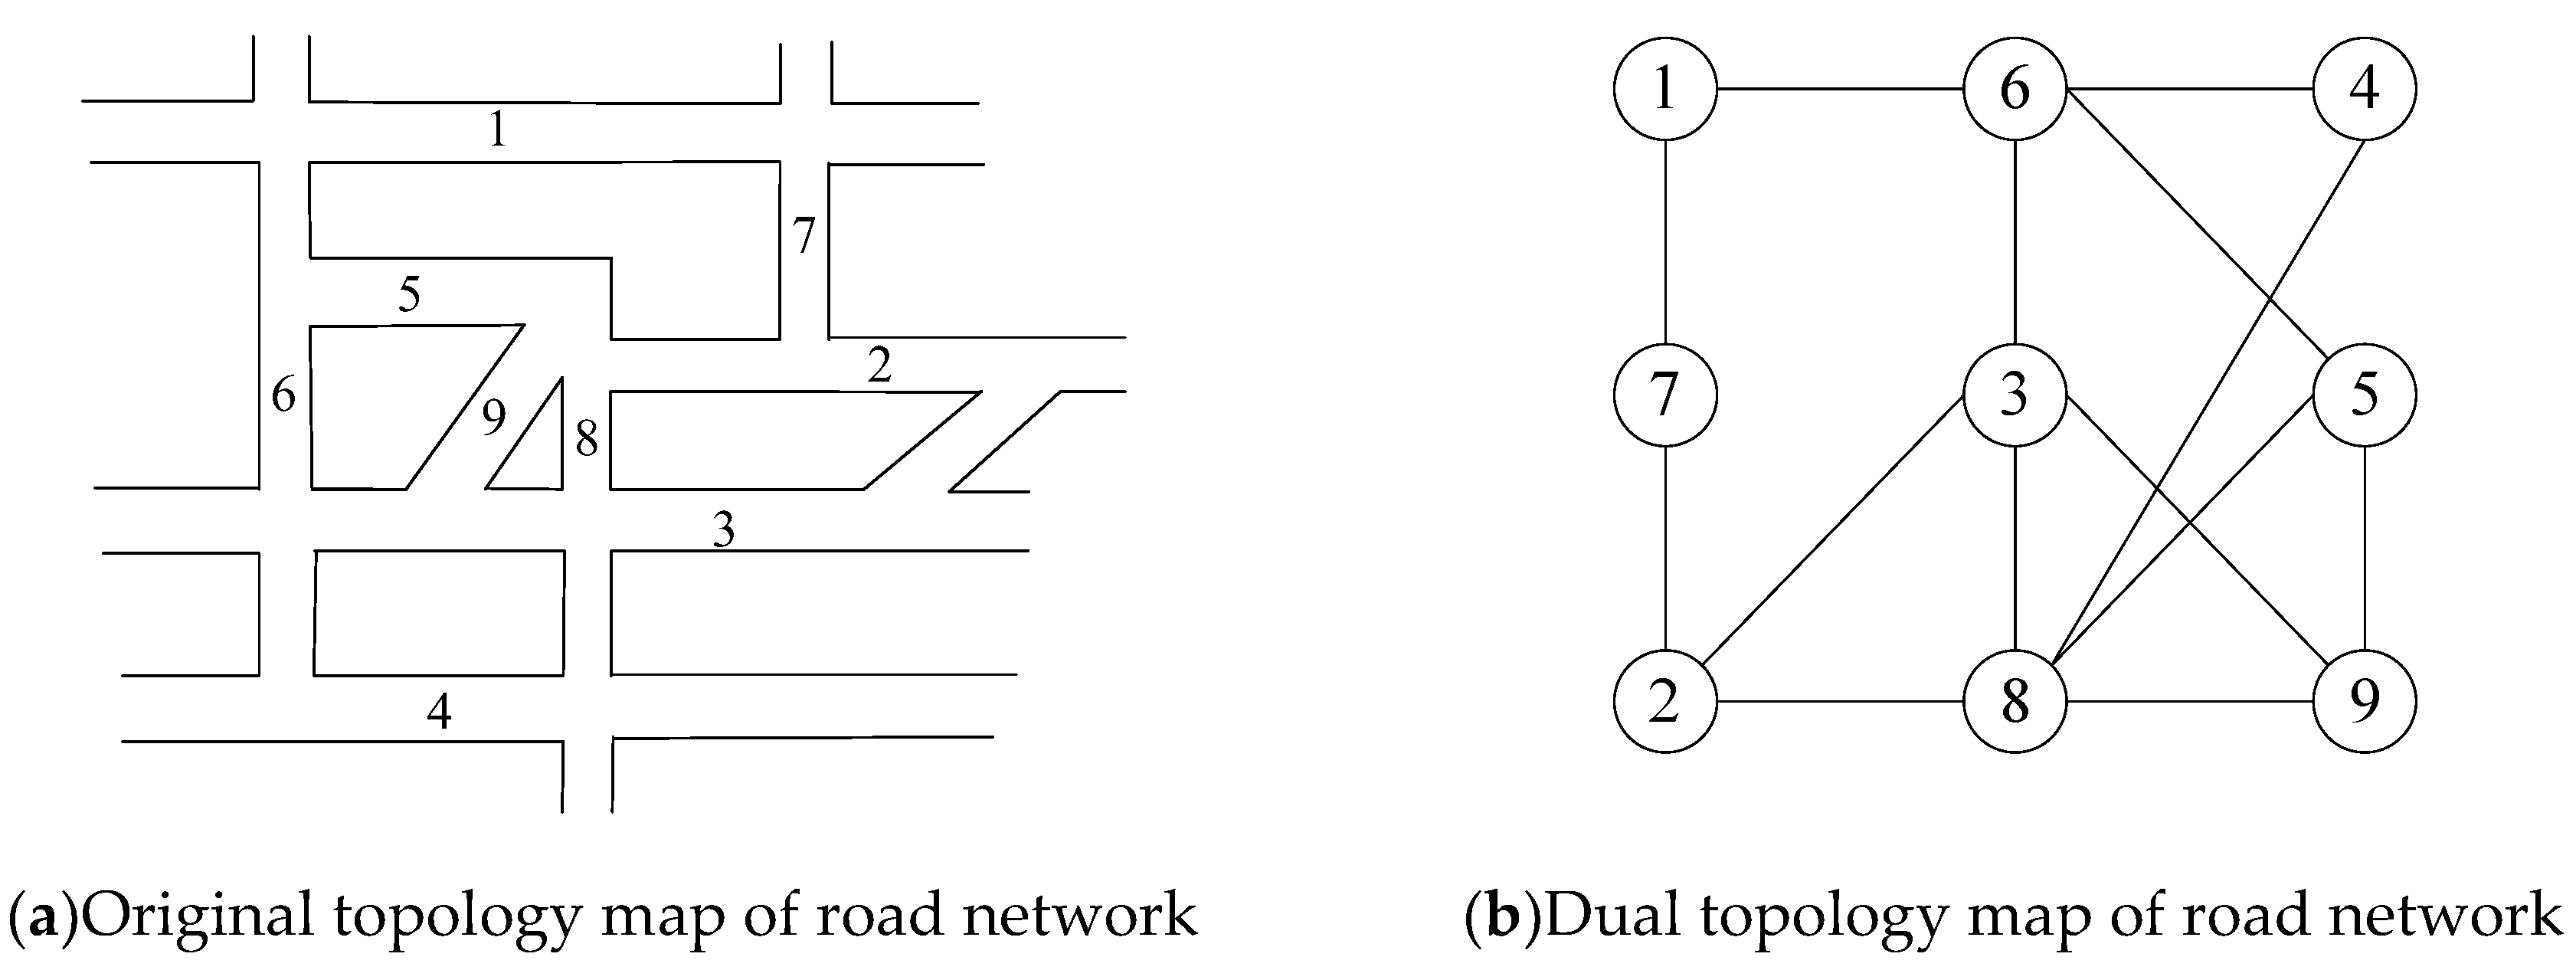
Figure 13.
Failure Fault Tree of OD Pair 1.
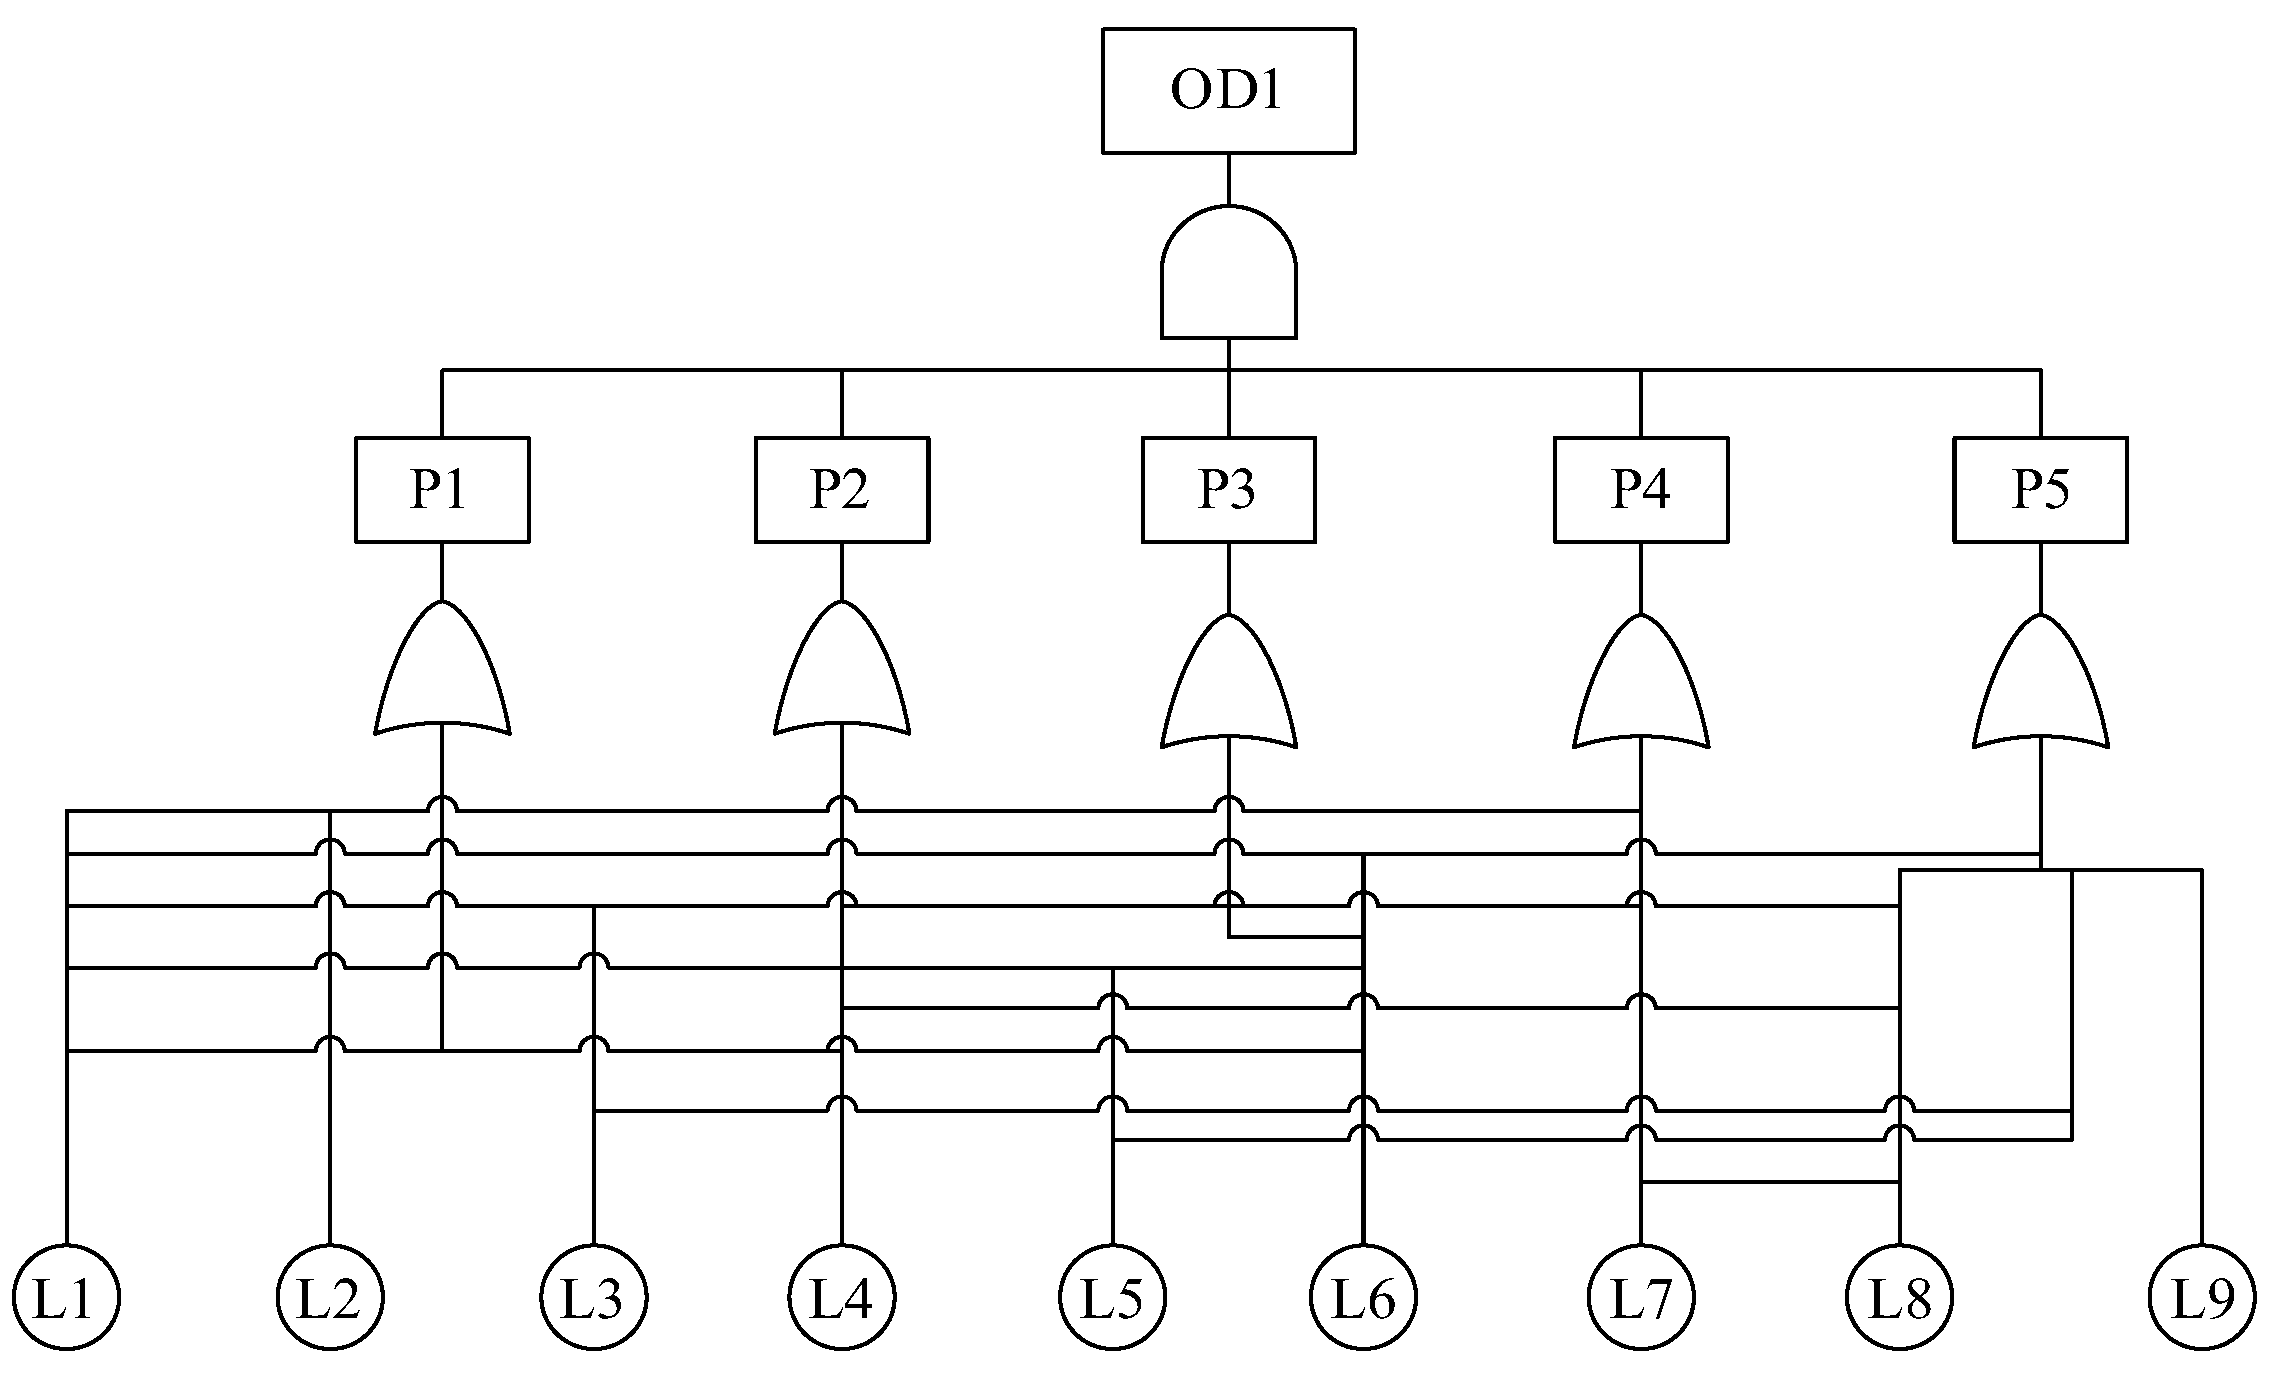
Figure 14.
Bayesian Network of OD Pair 1.
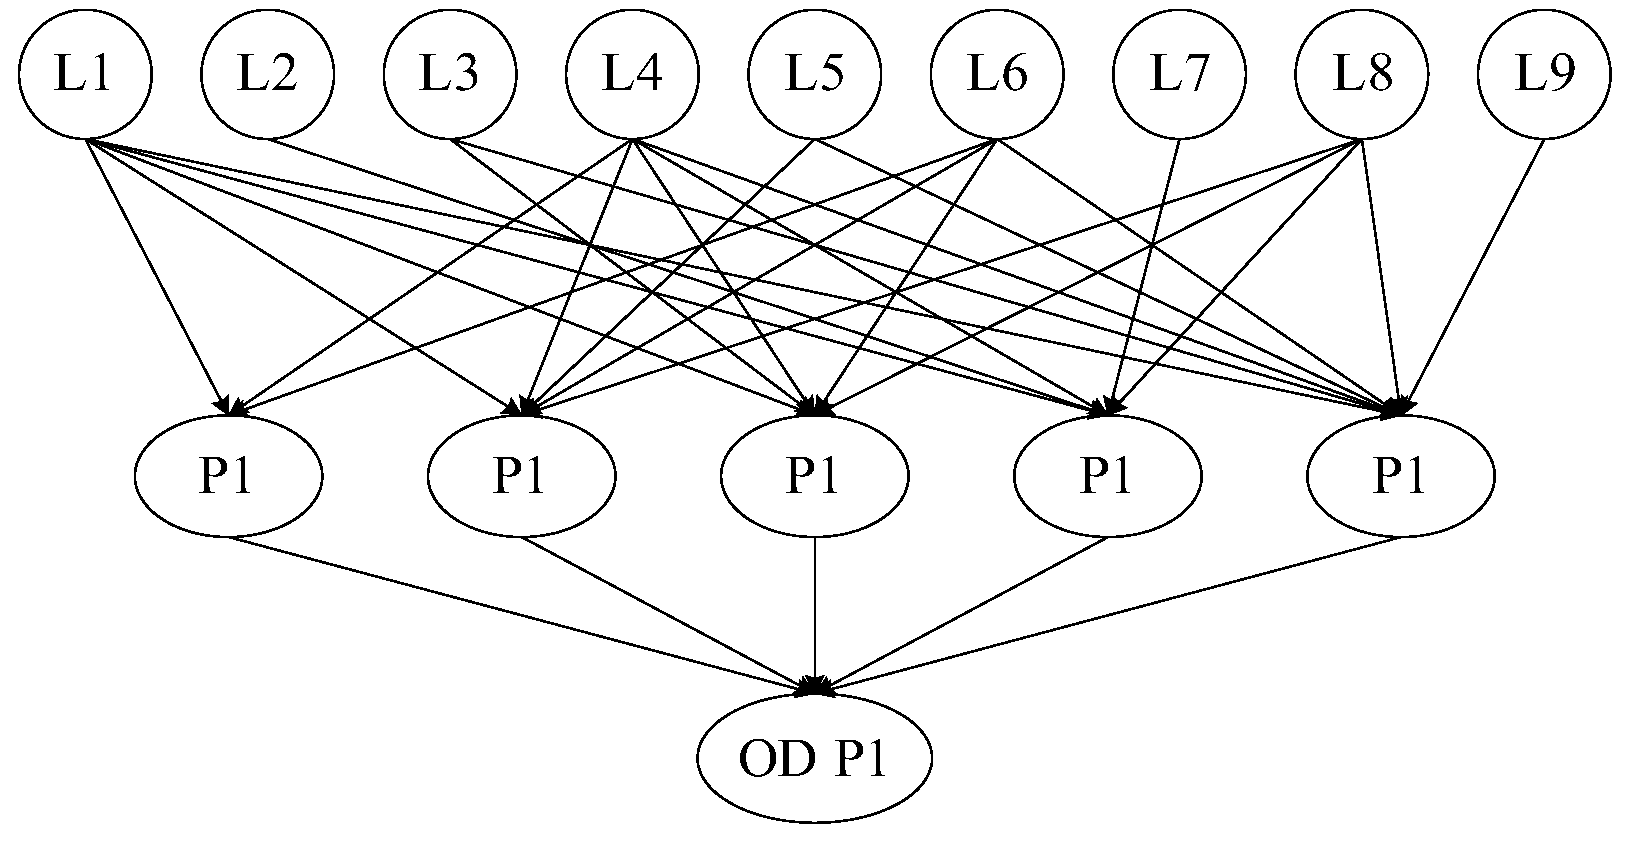
Figure 15.
Bayesian Network of the road network.
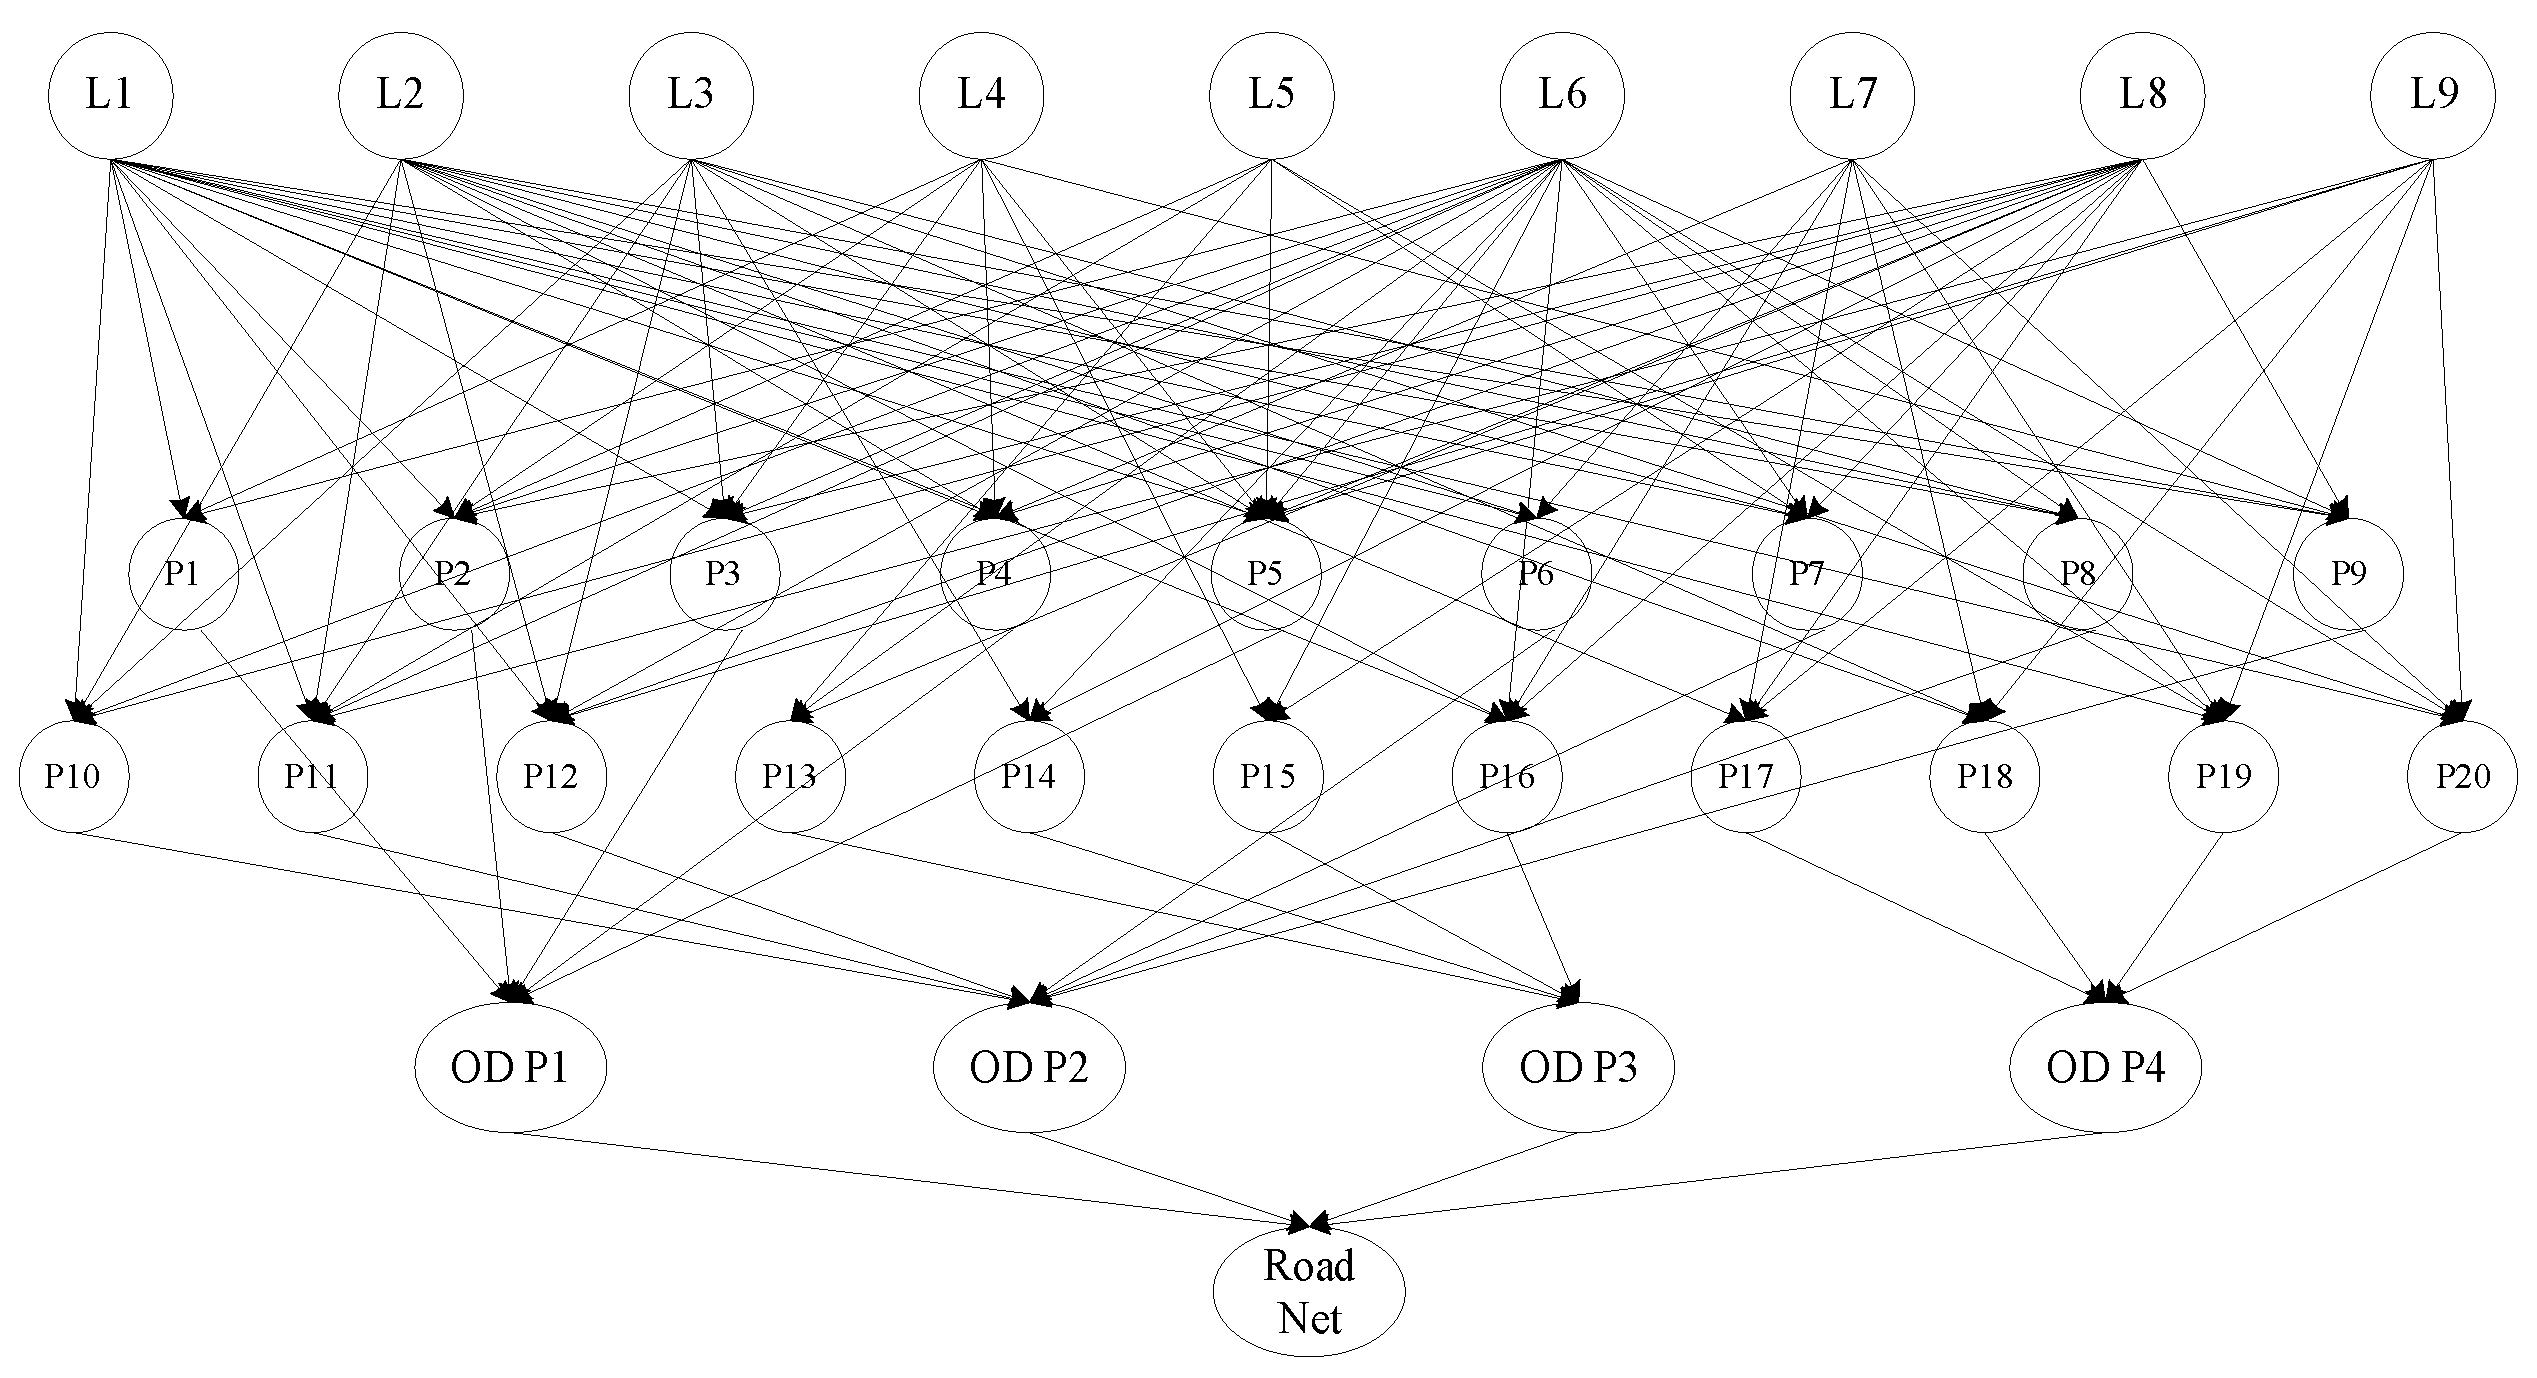
Figure 16.
Dynamic Bayesian Network of the road network.
Figure 17.
Dynamic Fault Tree of path P1 considering cascading failures.
Figure 18.
Dynamic Bayesian Network of the road network.
Figure 19.
Dynamic Bayesian Network of path P1.
Figure 20.
Curve of road network reliability over time.
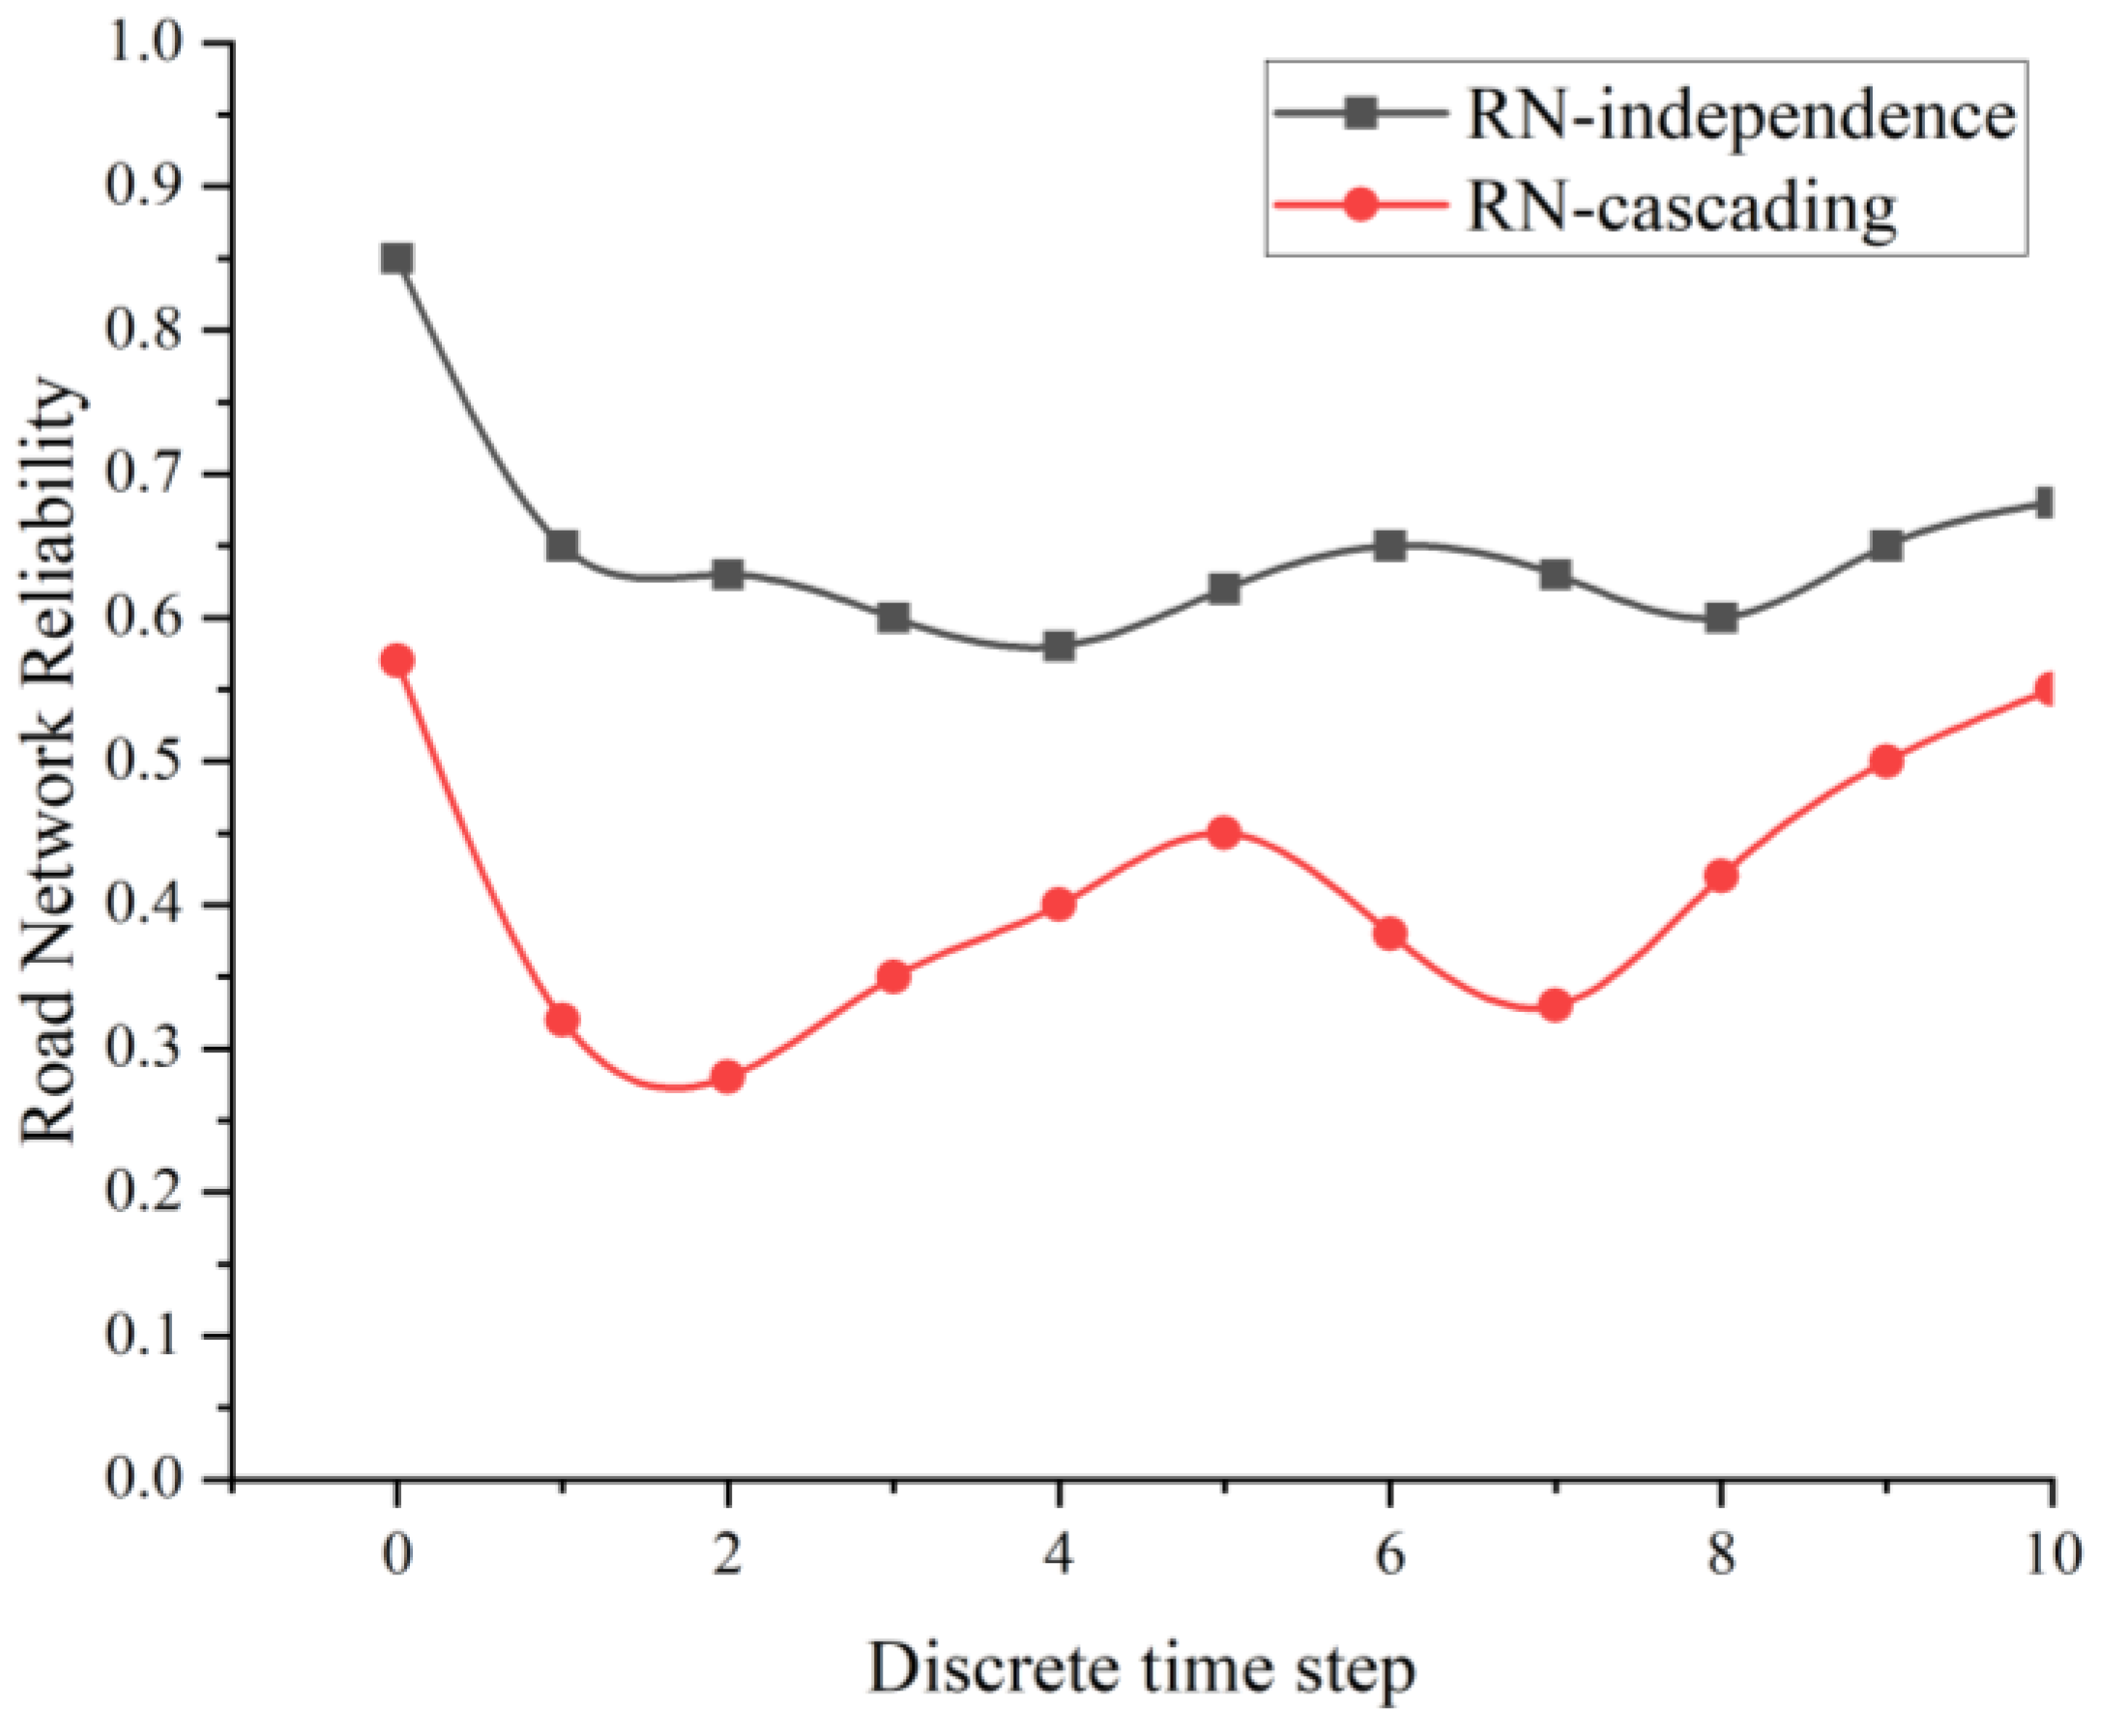
Figure 21.
Posterior probabilities under independent failure and cascading failure models.
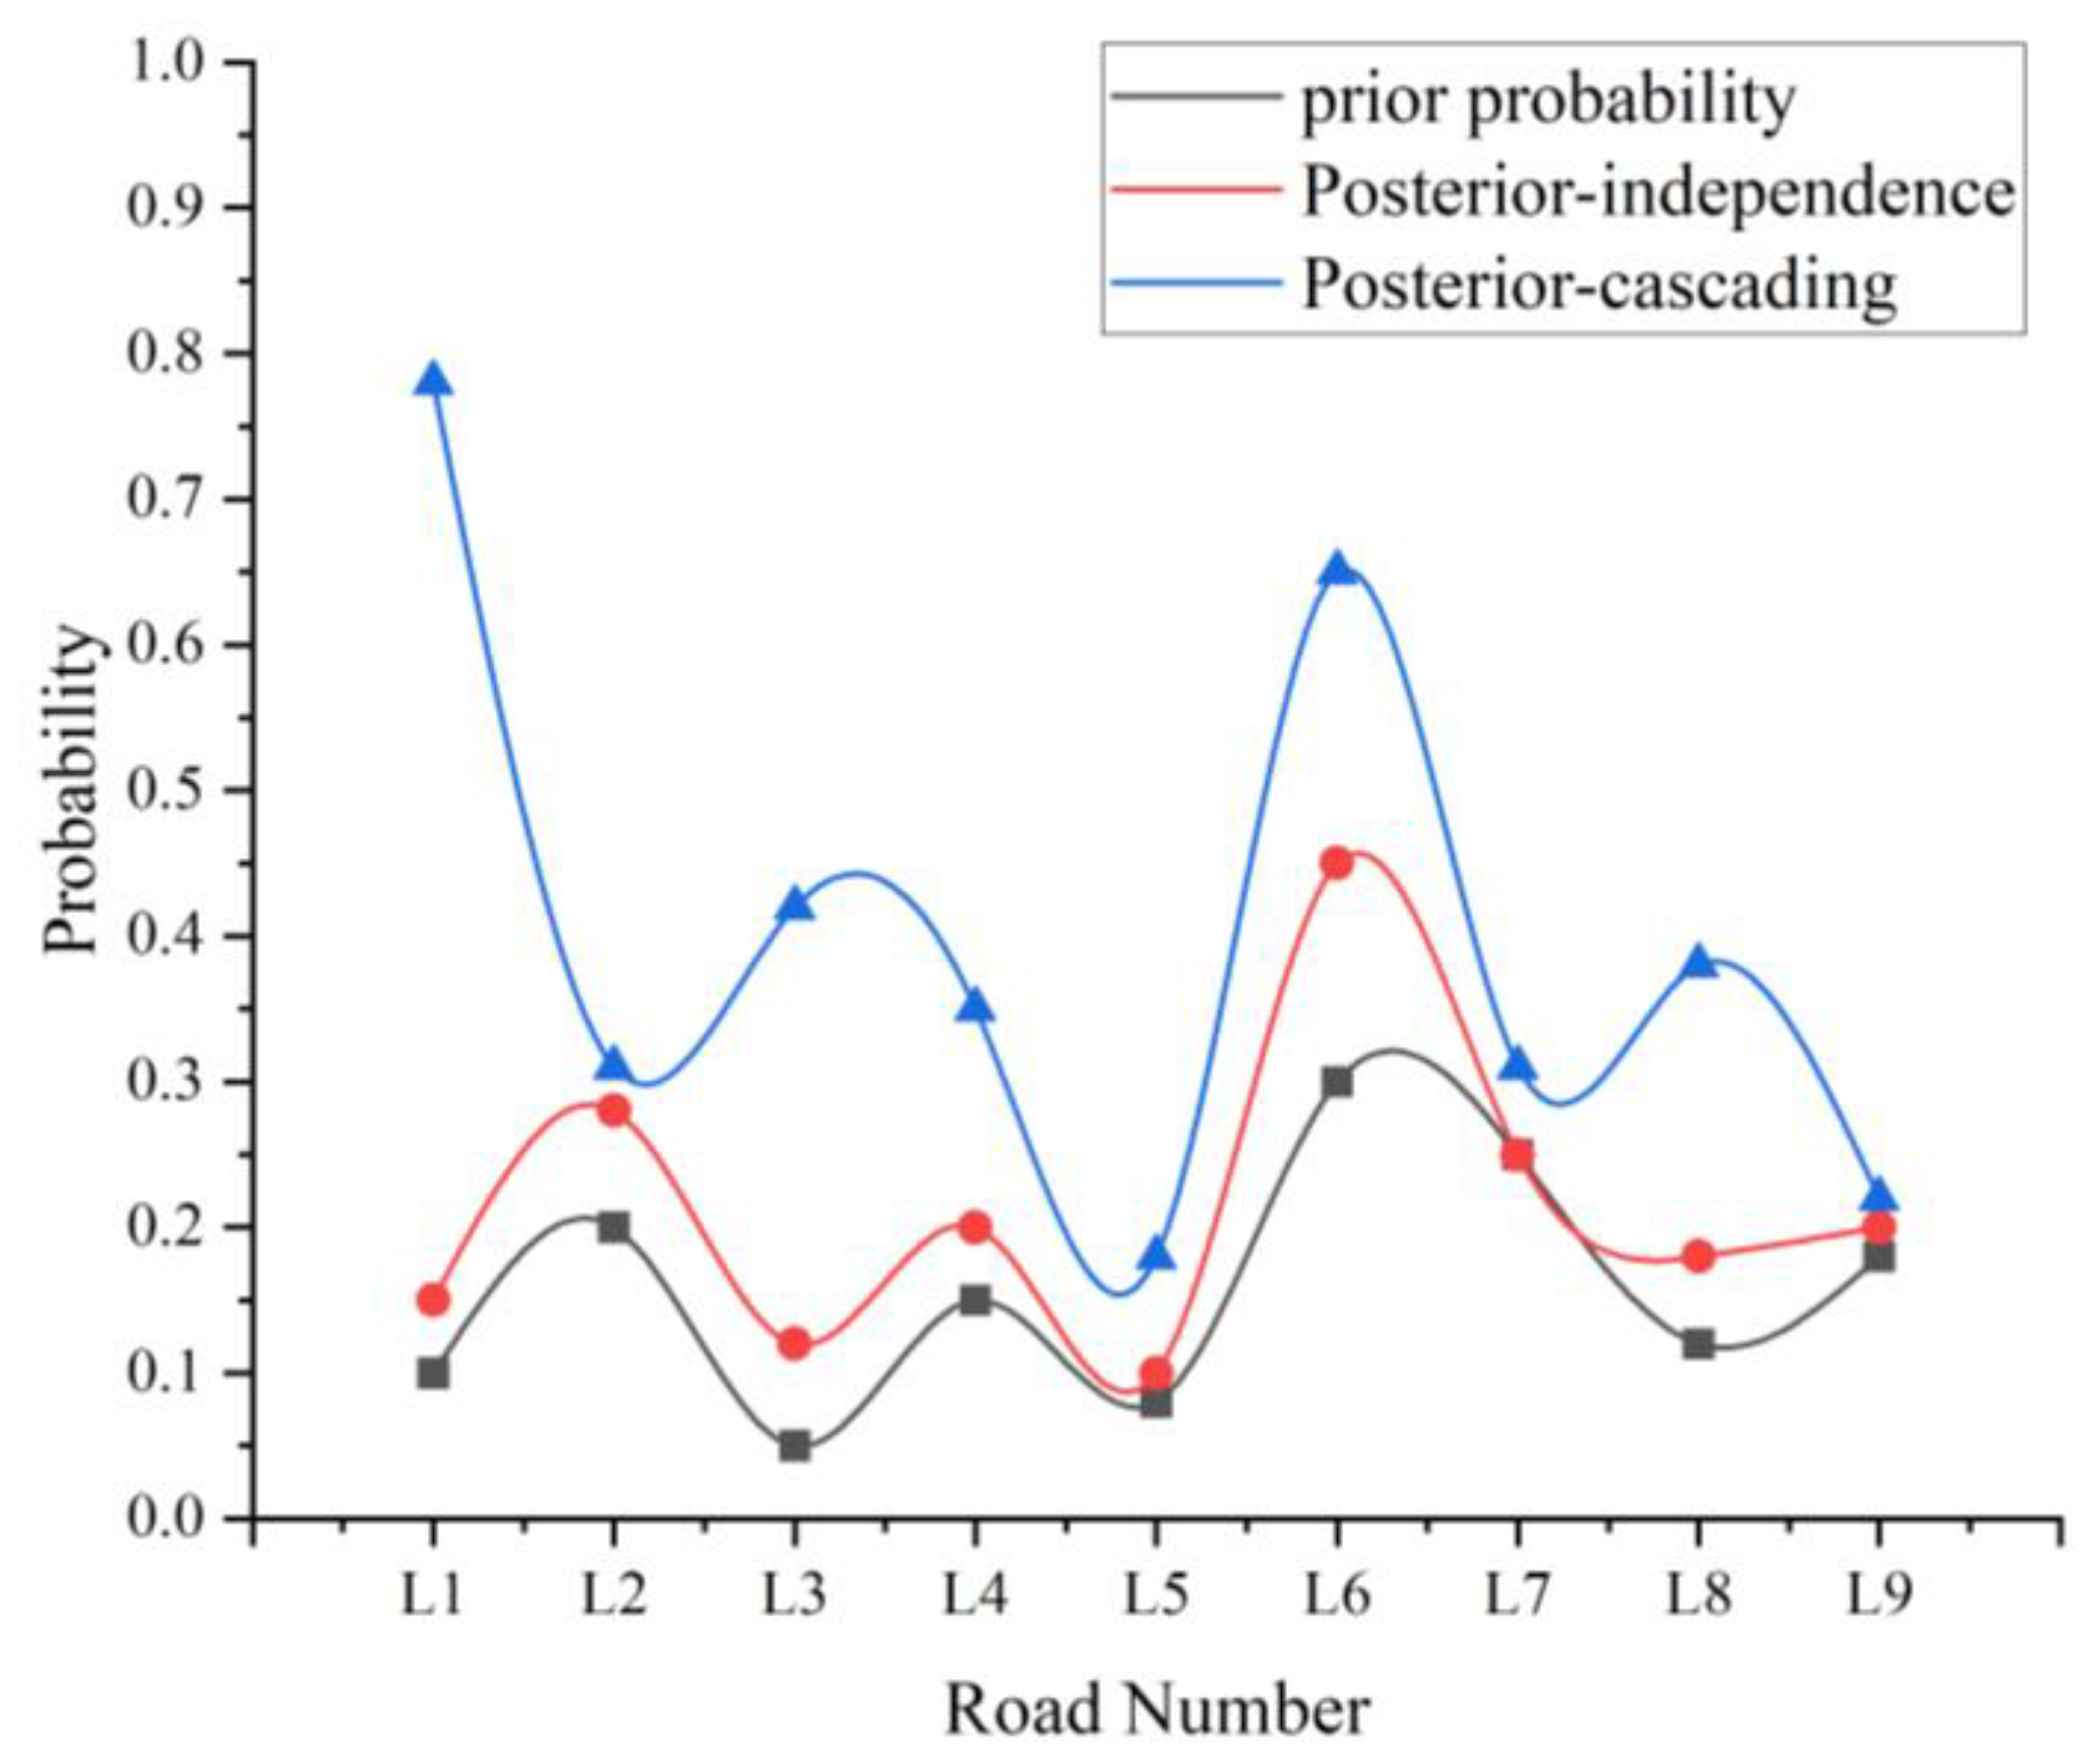

Table 1.
Parameters and meanings of road network topology characteristics.
| Parameter | Meaning |
|---|---|
| Number of nodes | The number of nodes in the network |
| Number of edges | The number of edges in the network |
| Average degree | The average value of the degrees of all nodes in the network |
| Average path length | The average distance between any two nodes in the network |
| Average clustering coefficient | The average clustering coefficient of all nodes in the network |
| Global network efficiency | The average of the reciprocals of the shortest path lengths between all pairs of nodes in the network |
Table 2.
Conversion rules and conversion diagrams of models.
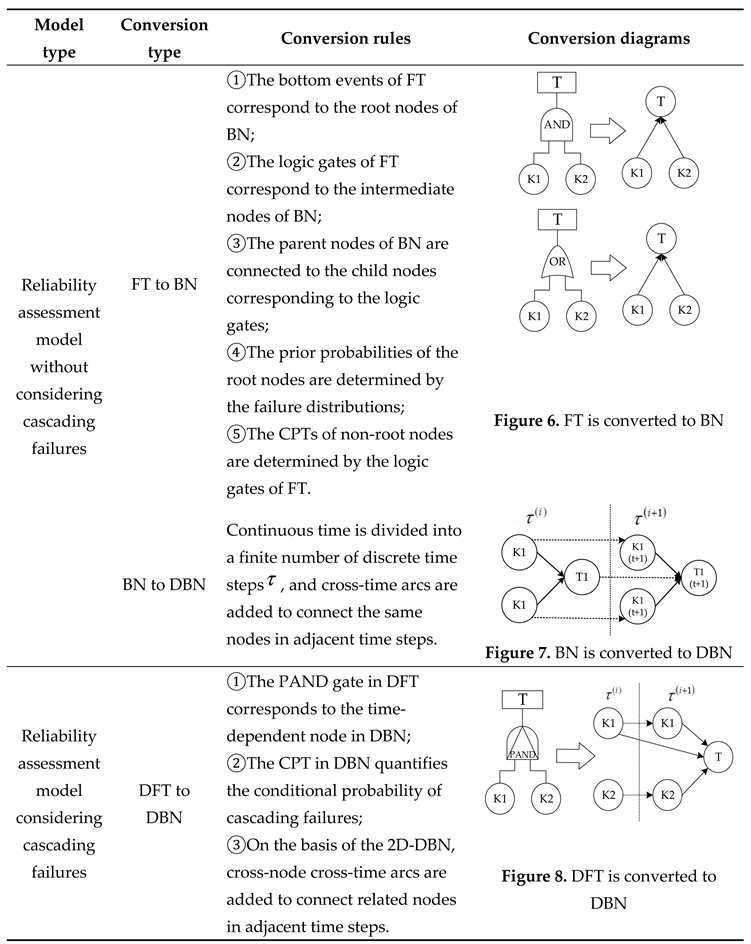
Table 3.
Initial values of statistical characteristics of the complex network of a partial road network in Dalian.
Table 3.
Initial values of statistical characteristics of the complex network of a partial road network in Dalian.
| Parameter | Number of nodes | Number of edges | Average degree | Average path length | Average clustering coefficient | Global network efficiency |
| feature value | 24 | 80 | 6.6667 | 1.9094 | 0.55476 | 0.61202 |
Table 4.
Differences in indicators under the two attack strategies (mean ± standard deviation).
| Indicator | Random attack | Targeted attack |
|---|---|---|
| Number of attacks required for collapse | 28.3±4.2 | 9.1±1.5 |
| Decrease rate of the largest connected component per attack | -3.2%(±0.5%)/attack | -10.5%(±1.2%)/attack |
| Decrease rate of global efficiency per attack | -2.1%(±0.3%)/attack | -8.7%(±1.0%)/attack |
Table 5.
Road network reliability under the two attack strategies.
| Number of attacked nodes | Reliability under random attacks | Reliability under targeted attack |
|---|---|---|
| 1 | 0.988 | 0.752 |
| 5 | 0.985 | 0.403 |
| 10 | 0.961 | 0.211 |
| 20 | 0.856 | 0.032 |
Table 6.
Average failure probability of roads.
| Number | Road name | Connected road numbers | Failure probability during peak hours | Failure probability during non-peak hours |
|---|---|---|---|---|
| L1 | Zhonghua West Road | L6、L7 | 0.1 | 0.0087 |
| L2 | Yangtze Road | L3、L7、L8 | 0.2 | 0.0091 |
| L3 | Yellow River Road | L2、L6、L8、L9 | 0.05 | 0.0032 |
| L4 | Digital Road | L6、L8 | 0.15 | 0.0067 |
| L5 | North China Road | L6、L8、L9 | 0.08 | 0.0043 |
| L6 | Southwest Road | L1、L3、L4、L5 | 0.3 | 0.0098 |
| L7 | Northeast Expressway | L1、L2 | 0.25 | 0.0084 |
| L8 | Xi'an Road | L2、L3、L4、L5、L9 | 0.12 | 0.0072 |
| L9 | Zhongchang Street | L3、L5、L8 | 0.18 | 0.0079 |
Table 7.
Average failure probability of roads.
| Triggering event | Affected road section | Conditional failure probability | Propagation delay time |
|---|---|---|---|
| Failure of L1 | L6 | 0.4577 | 30 minutes |
| Failure of L1 | L7 | 0.3728 | 15 minutes |
| Failure of L6 | L1 | 0.4278 | 15 minutes |
| Failure of L6 | L3 | 0.3897 | 15 minutes |
| Failure of L6 | L4 | 0.2738 | 30 minutes |
| Failure of L6 | L5 | 0.5637 | 30 minutes |
| Failure of L4 | L6 | 0.4359 | 30 minutes |
| Failure of L4 | L8 | 0.4893 | 45 minutes |
Table 8.
Road network reliability R(t) results.
| ) | Time (minutes) | R(D)(t) | R(C)(t) | Key event description |
|---|---|---|---|---|
| 0 | 0 | 0.85 | 0.57 | Initial state |
| 1 | 15 | 0.65 | 0.32 | Early peak starts, cascading triggered from L1 to L6 |
| 2 | 30 | 0.63 | 0.28 | Cascading spreads to L3 |
| 3 | 45 | 0.60 | 0.35 | Partial effectiveness of repair mechanism |
| 4 | 60 | 0.58 | 0.40 | Peak ends, pressure relieved |
| 5 | 75 | 0.62 | 0.45 | Traffic flow stabilizes |
| 6 | 90 | 0.65 | 0.38 | Evening peak starts, secondary cascading from L6 to L4 |
| 7 | 105 | 0.63 | 0.33 | Cascading impact expands |
| 8 | 120 | 0.60 | 0.42 | Secondary effectiveness of repair mechanism |
| 9 | 135 | 0.65 | 0.50 | System stabilizes |
| 10 | 150 | 0.68 | 0.55 | Low traffic flow period at night |
Table 9.
Key road sections under the cascading failure and independent failure models.
| Road number | Prior probability | Posterior probability (independentfailure) | Posterior probability (cascading failure) | Keyness ranking (independent failure) | Keyness ranking (cascading failure) | Keyness analysis and cascading failure analysis |
|---|---|---|---|---|---|---|
| L1 | 0.10 | 0.15 | 0.78 | 6 | 1 | Triggering cascading failures of L6 and L7 |
| L2 | 0.20 | 0.28 | 0.31 | 2 | 6 | Secondary impact |
| L3 | 0.05 | 0.12 | 0.42 | 8 | 3 | Affected by L6 |
| L4 | 0.15 | 0.20 | 0.35 | 5 | 5 | Affected by L6 and L8 |
| L5 | 0.08 | 0.10 | 0.18 | 9 | 8 | Connecting L6 and L8 |
| L6 | 0.30 | 0.45 | 0.65 | 1 | 2 | Connecting L3, L4, and L5 |
| L7 | 0.25 | 0.25 | 0.31 | 3 | 7 | Affected by L1 |
| L8 | 0.12 | 0.18 | 0.38 | 7 | 4 | Multiple path dependencies |
| L9 | 0.18 | 0.20 | 0.22 | 4 | 9 | Minimal impact |
Disclaimer/Publisher’s Note: The statements, opinions and data contained in all publications are solely those of the individual author(s) and contributor(s) and not of MDPI and/or the editor(s). MDPI and/or the editor(s) disclaim responsibility for any injury to people or property resulting from any ideas, methods, instructions or products referred to in the content. |
© 2025 by the authors. Licensee MDPI, Basel, Switzerland. This article is an open access article distributed under the terms and conditions of the Creative Commons Attribution (CC BY) license (http://creativecommons.org/licenses/by/4.0/).
Copyright: This open access article is published under a Creative Commons CC BY 4.0 license, which permit the free download, distribution, and reuse, provided that the author and preprint are cited in any reuse.


