
Submitted:
29 April 2025
Posted:
29 April 2025
You are already at the latest version
Abstract
The study of personalities is a major component of human psychology and with the understanding of personality traits, practical applications can be used in various domains, such as mental health care, predicting job performance and optimising marketing strategies. This study explores the prediction of Big Five personality trait scores from online comments with transformer-based language models, focusing on improving model performance with a larger dataset and investigating the role of intercorrelations among traits. Using the PANDORA dataset from Reddit, RoBERTa and BERT models, including both base and large variants, were fine-tuned and evaluated to determine their effectiveness in personality trait prediction. Compared to previous work, our study utilises a significantly larger dataset to enhance model generalisation and robustness. The results indicate that RoBERTa outperforms BERT across most metrics, with RoBERTa large achieving the best overall performance. In addition to evaluating overall predictive accuracy, this study investigates the impact of intercorrelations among personality traits. A comparative analysis is conducted between a single-model approach, which predicts all five traits simultaneously, and a multiple-models approach, fine-tuning models independently, each predicting a single trait. The findings reveal that the single-model approach achieves lower RMSE and higher R2 values, highlighting the importance of incorporating trait intercorrelations in improving prediction accuracy. Furthermore, RoBERTa large demonstrated a stronger ability to capture these intercorrelations compared to previous studies. These findings emphasise the potential of transformer-based models in personality computing and underscore the importance of leveraging both larger datasets and intercorrelations to enhance predictive performance.
Keywords:
Natural Language Processing (NLP)
; Personality
; Automatic Personality Recognition
; Machine Learning
; Personality Computing
; Big Five Personality Traits
1. Introduction
1.1. Background
Personality traits are stable patterns of thoughts, emotions, and behaviours that indicate a consistent tendency to react in specific ways across different situations [1]. The study of personalities is a major component of human psychology, and extensive studies have been conducted to understand human behaviour, emotions, and social interactions. With the understanding of personality traits, the practical applications can be used in various domains, such as mental health care [1], predicting job performance [2], optimising marketing strategies [3] and enhancement of recommendation systems [4].
Various personality taxonomies have been developed to comprehend and assess personality. For example, the Big Five Model [5] and the Myers-Briggs Type Indicator (MBTI) [6]. The Big Five Model emerged as one of the most widely utilised frameworks for personality evaluation due to its strong empirical backing and proven applicability across different cultures [7,8]. The Big Five Model consists of five key dimensions: Openness (OPE), Conscientiousness (CON), Extraversion (EXT), Agreeableness (AGR), and Neuroticism (NEU).
Personality trait assessments have traditionally depended on questionnaire-based methods, self-reports or other reports [9]. Some well-known questionnaires that are used to assess the Big Five personality traits include the Revised NEO Personality Inventory (NEO-PI-R)[10] and the Big Five Inventory (BFI) [11]. These questionnaires generally include a set of items or statements that participants evaluate by indicating their level of agreement or preference on a scale. The answers are subsequently scored and analysed to generate personality trait scores or profiles for each individual [12]. However, these questionnaire-based methods tend to be labour-intensive and time-intensive [9].
However, in the last decade, social media has revolutionised the way individuals express themselves, communicate, and engage with the world. With billions of users actively sharing their thoughts, experiences, and opinions online, social media platforms have become a rich data source reflecting diverse human behaviours and characteristics [13]. Researchers have recognized the opportunity to explore users’ personalities based on their social media posts and profiles using automated personality assessment methods, giving rise to the field of Personality Computing (PC).
PC is an emerging field that bridges personality research and computer science using computational methods and machine learning techniques [14]. It aims to identify and analyse personality-related information, such as Big Five personality trait scores, by utilising techniques such as Natural Language Processing (NLP) and Machine Learning (ML) algorithm to process information encapsulated in various forms, including written text [15], smartphone interactions [16], speech patterns [17], and gameplay behaviour [18]. ML algorithms are trained to analyse this information automatically and predict self-reported personality trait scores or other-reported trait scores using signals detected by the system [14]. This eliminates the need for human evaluators, decreasing labour and reducing time consumption.
Previous research used leveraged architectures such as Recurrent Neural Networks (RNN) to predict personality trait scores and had shown substantial results [19]. However, with the emergence of transformers such as the Bidirectional Encoder Representations from Transformers (BERT), which were trained on extensive collections of text, have demonstrated exceptional performance across various tasks [20]. These advancements have also significantly propelled the development of automated PC.
Although numerous studies have focused on predicting personality trait scores, the intercorrelations between traits have not been sufficiently explored, despite being considered essential for a deeper understanding of the underlying structure of personality [9]. This has led studies to focus on this gap in the field, deepening the understanding of the intercorrelations of the personality traits [21]. However, no study mentioned has proven the efficiency of the intercorrelations of personality traits.
This paper presents a detailed methodological framework, outlining the preprocessing steps and the implementation of the models on a larger dataset compared to previous work [21]. Specifically, the BERT model [20] and the RoBERTa model [22], an advanced version of BERT known for its ability to comprehend context and semantics in text, were tested. Their results were then analysed to identify the optimal model for predicting personality trait scores within the chosen models. Furthermore, the impact of personality trait intercorrelations in improving the prediction of personality trait scores was investigated to highlight its importance.
1.2. Problem Definition
Understanding personality traits from social media data has garnered significant attention due to its broad applications in fields such as psychology [23] and marketing [3]. However, in previous work [21], only a subset of the dataset was used, which limited the model’s ability to generalise to the broader online population. By utilising the full dataset, this study aims to enhance the model’s robustness and improve its applicability to diverse user-generated content. The performance of several models was evaluated to identify the most effective approach for accurately predicting personality trait scores from text data.
Furthermore, while many studies focus on predicting individual personality trait scores, the intercorrelations between traits remain relatively underexplored [9]. This gap limits our understanding of the structure of personality and its influence on prediction accuracy.
To address this issue, this paper examines how incorporating intercorrelations among traits impacts predictive accuracy, demonstrating that leveraging these relationships enhances model performance and contributes to the development of more robust personality prediction models.
2. Literature Review
2.1. The Big Five
The Big Five Model, also referred to as the OCEAN model, is a widely accepted taxonomy that represents personality traits along a dimensional structure. [5]. Independent research groups have investigated this taxonomy [5,24,25], which have consistently identified five distinct dimensions (traits) that account for inter-individual differences in personality [9]. The five different traits include [26] :
- 1.
- Openness: characterised by a keen intellectual curiosity and a desire for new experiences and diversity.
- 2.
- Conscientiousness: demonstrated through traits such as discipline, organisation, and achievement-orientation.
- 3.
- Extraversion: marked by increased sociability, assertiveness, and talkativeness.
- 4.
- Agreeableness: refers to being helpful, cooperative, and sympathetic towards others.
- 5.
- Neuroticism: refers to the degree of emotional stability, impulse control, and susceptibility to anxiety.
These five traits, while distinct, often exhibit meaningful intercorrelations, forming a cohesive personality profile. Additionally, these personality dimensions play a crucial role in forecasting individual behaviours and life outcomes. For instance, Conscientiousness has consistently been linked to job performance across all occupations [27]. On the other hand, Neuroticism is strongly associated with challenges in psychological adjustment and emotional stability, indicating individuals with high Neuroticism are more prone to experiencing negative moods and physical issues [28]. Thus, understanding these traits and their interrelations can provide valuable insights into predicting various aspects of an individual’s behaviour, career success, and overall well-being.
2.2. Intercorrelation of Big Five Personality Traits
The Big Five personality traits, though categorised separately, are not entirely independent; instead, they show meaningful intercorrelations that reflect underlying patterns in personality, a finding consistently highlighted by questionnaire-based approaches. For example, Digman [29] reported a mean correlation of 0.26 across all traits after analysing data from 14 studies, examining the inter-scale correlations among the Big Five personality traits. Similarly, J. Philippe Rushton et al. [30] conducted a meta-analysis highlighting significant intercorrelations among the Big Five personality traits. For instance, Extraversion and Openness exhibit a strong positive correlation with a coefficient of 0.413. Similarly, Agreeableness and Conscientiousness also show an equally strong positive correlation, with the same coefficient of 0.413.
Van der Linden et al. [31] also examined the intercorrelations among the Big Five personality traits, revising the correlation between Extraversion and Openness to 0.43. Additionally, they reported a strong positive correlation of 0.43 between Conscientiousness and Agreeableness. In contrast, they identified a negative correlation of -0.43 between Conscientiousness and Neuroticism and a negative correlation of -0.36 between Agreeableness and Neuroticism.
Research such as the ones mentioned above suggests that certain pairs of Big Five traits often show positive correlations. For instance, individuals high in Openness frequently display sociable and outgoing behaviours, which are characteristic of Extraversion. Similarly, those high in Conscientiousness are often cooperative and considerate, behaviours associated with Agreeableness.
Conversely, some traits tend to exhibit negative correlations. High Neuroticism is often associated with lower Conscientiousness, which suggests difficulties in maintaining organisation and self-discipline. Likewise, individuals with high Neuroticism scores tend to have low Agreeableness, indicating possible difficulties in cooperating and being considerate toward others.[30][31].
While such intercorrelations and patterns are commonly observed in research, they should not be regarded as absolute. Moreover, the study of these intercorrelations remains under-explored in the emerging field of personality computing [9]. Given the importance of intercorrelations to the foundation of personality trait theory, further research and integration in this area could significantly enhance the understanding of how personality traits interact and influence one another.
2.3. Personality Computing
Personality computing, an interdisciplinary field that bridges psychology and computer science, has its roots in traditional personality assessments, based primarily on questionnaires [10,11]. However, these traditional methods tend to be labour-intensive, time-intensive and susceptible to biases such as social desirability or lack of self-awareness [9]. As the field advanced, researchers began to seek alternative data sources and methodologies that could overcome these limitations and provide richer, more dynamic insights into personality. This shift was catalysed by the rapid expansion of the internet, which emerged as a potentially rich source of behavioural data.
The researchers started investigating using social media text to predict personality traits based on the Big Five traits and have seen the success of using information on social media platforms as a valuable data source. Some of the earlier works involve using smaller sources of data such as essays [15,32] and blogs [33]. The release of the MyPersonality dataset [34], which contains information such as user profiles and labels for the Big Five model, from the widely used social media platform Facebook 1, was very successful and became a turning point for the field of personality computing. However, due to privacy concerns, most of the dataset was removed.
The automatic personality trait detection methods from texts generated by online users are divided into two categories: the lexical method and the open vocabulary machine learning method [35].
The lexical method is most commonly represented by Linguistic Inquiry and Word Count (LIWC) [36,37]. LIWC is a text analysis tool that classifies words into psychological, linguistic, and cognitive categories. Its purpose is to analyse individuals’ emotional, social, and psychological states based on their written language. It works by matching words to a predefined dictionary and measuring the frequency of words in specific psychological or linguistic categories. These psychological features have been widely used as inputs for machine learning models in personality detection studies [14,23]. However, despite its popularity, LIWC has several limitations. One major drawback is its limited language support, as it only covers a small selection of languages [38]. Furthermore, LIWC relies solely on basic dictionary look-ups and word matching, making it unable to understand the context or interpret metaphorical language [39].
In contrast, the open vocabulary method analyses text data using machine learning and NLP techniques without relying on a predefined dictionary. This approach identifies patterns and linguistic features linked to psychological traits in the text
[40]. Open-vocabulary methods have demonstrated the ability to uncover more precise patterns across various content domains, handle ambiguous word meanings more effectively, and are less prone to misinterpretation. These advantages make open-vocabulary methods particularly effective in capturing the subtlety of everyday psychological processes [41].
Recently, deep neural networks (DNN) and large language models (LLM) have gained considerable attention for their ability to model complex relationships within textual data, leading to significant advances in NLP applications [42]. These techniques have also been applied to personality computing. Tadesse et al. [43] used methods such as multilayer perceptron, Long Short-Term Memory (LSTM), Gated Recurrent Unit (GRU), and 1-Dimensional Convolutional Neural Networks (1-DCNN) to predict personality traits based on user behaviour on the Facebook platform. These methods helped to extract behavioural patterns from social media activity and text. Similarly, Xue et al. [42] employed deep learning-based methods to recognise personality traits from text posts on online social networks, utilising DNNs and LSTMs to capture complex relationships in the data and uncover complex patterns linked to personality traits.
In another study, Arijanto et al. [44] leveraged BERT to analyse Twitter data and predict personality traits. Additionally, Mehta et al. [45] highlighted the value of integrating psycholinguistic and language model features, such as BERT, to enhance personality prediction performance. BERT excels in this task due to its ability to process complex language structures and semantic meanings [20], allowing it to detect subtle psychological traits embedded within the text.
The range of studies and approaches demonstrates the versatility and potential of the open vocabulary method in advancing automated personality computing.
3. Methodology
3.1. Dataset
The PANDORA dataset [46], sourced from Reddit 2, was utilised in this study’s experiments. It comprises over 17 million comments on subreddits from over 10,000 users (authors), each annotated with self-reported personality labels. It provides three personality models: the Big Five, the Myers–Briggs Type Indicator (MBTI) [6], and the Enneagram [47]. However, only the Big Five data was used for the experiments in this study. Additionally, the PANDORA dataset includes demographic information of some authors such as gender, age, and country. Table 1 provides an overview of the dataset attributes, while Table 2 details the total number of authors with complete personality labels along with their corresponding comments.
The MBTI9k dataset, based on the Pushift Reddit dataset with comments dating back to 2015, served as the foundation for the PANDORA dataset. Flairs—short descriptions users add to their profiles on various subreddits—and occasionally comments were used to collect MBTI and Enneagram labels, as these were easier to identify compared to Big Five personality trait scores.
In contrast, Big Five scores were more challenging to gather due to their varied reporting formats depending on the test taken. Unlike MBTI and Enneagram labels, Big Five scores were typically not included in flairs but rather found in comments replying to posts about specific online tests.
To extract Big Five personality scores from Reddit comments, a semi-automatic process was employed to address the unstandardised formats and lack of flairs. Comments mentioning traits were first retrieved and linked to posts referencing specific tests, identified through provided links. Comments tied to text-based prediction services were discarded, and scores were extracted using test-specific regular expressions.
The extracted scores were manually verified to ensure the accuracy of the data and its association with the correct comments. For comments lacking identifiable links, a test identification classifier, with an F1-macro score of 81.4%, was used to determine the referenced tests. The score extraction procedure was then repeated for these comments, yielding a total of 1,608 authors’ Big Five personality trait scores.
The dataset was distributed in two separate CSV files: one containing author information and the other containing their generated text. Some authors had missing information, which, as noted in the PANDORA paper, may have been excluded from the dataset upon request. Additionally, authors with incomplete Big Five scores were removed to ensure data consistency for the experiments. These exclusions resulted in fewer authors included in this study compared to the number reported in the original paper.
From the first file, authors with complete Big Five scores were identified. Their corresponding comments from the second file were then extracted and combined into a single dataset. After processing, the final dataset included 1,568 authors, yielding a total of 3,006,567 comments.
The dataset is divided into three subsets: the training, validation, and test sets. First, the dataset is split into a training set and a test set, with 70% of the data allocated to the training set and the remaining 30% to the test set. This ensures that the test set remains independent and is used solely for the final evaluation of the model. To maintain reproducibility, the split is performed using a fixed random state of 42.
Next, the training set obtained from the initial split is further divided into a smaller training set and a validation set. The validation set accounts for 20% of the original training set, which corresponds to 14% of the total dataset. The remaining 56% of the total data is used as the final training set. Similarly, the random state is fixed at 42 during this second split to ensure consistency.
3.2. Data Cleaning and Preprocessing
Data cleaning and preprocessing for the dataset were minimal, as BERT is designed to understand the contextual meaning of words, eliminating the need for traditional preprocessing steps such as lemmatisation, stemming, stopword removal, and text case conversion [21] [20]. BERT’s tokenizer uses WordPiece tokenization to break words into subwords, allowing it to handle out-of-vocabulary words effectively by mapping them to smaller, meaningful units. This enables better representation and generalisation across diverse vocabulary.[48].
Furthermore, BERT incorporates special tokens such as "[CLS]" and "[SEP]" to mark the start and end of sentences, allowing the model to process text contextually rather than treating words in isolation. This ability to capture context-dependent meanings makes BERT highly adaptable to linguistic variations [20].
3.3. Experiments
Two experiments that have been conducted will be described in the following section. The models used, the flow of the training process and their hyperparameters will be outlined in this section.
3.3.1. Comparative Analysis of RoBERTa and BERT Models for Predicting Big Five Personality Trait Scores
In the previous work [21], fine-tuned and evaluated two models—RoBERTa base and Bidirectional Long Short-Term Memory (Bi-LSTM)—using a random sample of 20,000 comments from 134 authors. Building on this, the present study adopts a broader approach by including all authors with complete Big Five personality scores, a total of 3,006,567 comments from 1,568 authors, thereby expanding the dataset for fine-tuning and evaluation. This larger dataset allows for a more comprehensive assessment of model performance with a more generalised dataset.
In the previous work [21], RoBERTa, an improved version of BERT, and Bi-LSTM were chosen to predict the Big Five personality trait scores. Although RoBERTa shares the same transformer-based architecture as BERT, utilising multiple layers of self-attention mechanisms, it sets itself apart with its extensive pretraining corpus [22]. This enables RoBERTa to effectively capture the underlying structure of language and the contextual meaning of words [21]. In the previous work [21], the results showed that RoBERTa base significantly outperformed Bi-LSTM across all evaluation metrics, demonstrating the superiority of transformer-based architectures in capturing linguistic nuances and contextual relationships in a text.
The models used in this study is a pre-trained model accessible through the Hugging Face library. 3
Raw text from the dataset is input into the model and the model then processes it and outputs a vector representation for each input text. The vector representation is then passed through a dropout layer to reduce overfitting by randomly disabling a portion of the inputs during fine-tuning, helping the model learn more generalised and robust features. The dropout rate is set to 0.3.
After the dropout layer, the vector representation is passed through a fully connected linear layer, where it is transformed from a high-dimensional space into a lower-dimensional space that corresponds to the Big Five personality traits. The output size of this linear layer is set to 5 to match the multitask regression problem, which is appropriate for this regression task, personality prediction.
The models are fine-tuned using the AdamW optimiser, a variant of Adam that includes weight decay for better regularisation and has a learning rate of 1e-5. The loss function used is Mean Squared Error (MSE) and models are fine-tuned over 10 epochs with a batch size of 16.
Additionally, to explore potential improvements, the RoBERTa large model is fine-tuned and evaluated alongside the base variant. To further assess the suitability of transformer-based models for this task, BERT base and BERT large are also included in the study.
The hyperparameters are referenced from the previous work [21], which identified them as the most optimal through a grid search strategy. Moreover, to ensure fair and reliable comparisons, the fine-tuning process, experimental environment, and hyperparameters are kept consistent across all models. This controlled setup allows for an objective evaluation of the relative strengths and weaknesses of each model.
3.3.2. Investigating the Impact of Intercorrelations Among Big Five Personality Traits
To investigate the impact of the intercorrelations of the Big Five personality traits, two fine-tuning approaches were employed and tested.
The first approach is a single-model approach, fine-tuning a single model to predict all five traits simultaneously. This model received all Big Five personality trait scores as inputs and was trained to predict all five scores at once. Table 3 provides a sample of the data used for fine-tuning with the single-model approach. The first column, labelled "body," contains comments written by the authors, while the five columns on the right represent the corresponding Big Five personality trait scores. As shown in the table, all five personality trait scores are used together to fine-tune a single model.
In contrast, the second approach is a multiple-models approach, fine-tuning five separate models separately, each dedicated to predicting only one specific trait. In this approach, each model received input data where irrelevant trait scores were removed to ensure a focused learning process. Table 4 visually represents the data used for this fine-tuning method. The "body" column contains the authors’ comments, while the "agr," column represents the corresponding authors’ Big Five personality trait scores that the model is being fine-tuned on, and in this table, the Agreeableness personality trait scores were displayed.
Both approaches used the same models (RoBERTa base model 4), parameters, dataset, and fine-tuning process as described in Section 3.3.1 to ensure comparability. The only difference was in the output size of the linear layer: in the single-model approach, the linear layer following the dropout layer had an output size of 5, consistent with the multitask regression setup. In contrast, the multiple-models approach set the output size to 1 for each model, as each was trained to predict a single personality trait independently.
4. Results
This section begins by introducing the evaluation metrics used to assess model performance in Section 4.1. Then, Section 4.1 and Section 4.3 present the results of the two experiments described in Section 3.3, along with a comparison to the findings from previous work [21], highlighting key differences and insights.
4.1. Evaluation Metrics
The evaluation metrics chosen for this study are Root Mean Square Error (RMSE) and the Coefficient of Determination (). These metrics were selected for their complementary perspectives on model performance, offering a comprehensive evaluation framework. Additionally, using these metrics facilitates a clear and direct comparison of results between this study and the findings presented in the previous work [21]. A lower RMSE signifies greater accuracy by reducing prediction errors.
RMSE quantifies the average prediction error, providing insight into how much the predicted values typically deviate from the actual ones on average. It is an important metric for evaluating model performance and is widely used as a benchmark in numerous studies within the field of personality computation.
In contrast, , or the coefficient of determination, assesses the extent to which the model’s predictions align with the actual values by measuring the explained variance [49]. It reflects the proportion of variance in the dependent variable that can be attributed to the independent variable, thereby indicating the model’s overall goodness of fit. A higher reflects better model performance by indicating a stronger alignment between predicted and actual values.
- n : Number of data points
- : The actual value for the i-th data point
- : The predicted value for the i-th data point
- : The mean of the actual values
4.2. Comparative Analysis of RoBERTa and BERT Models for Predicting Big Five Personality Trait Scores
Table 5 presents the performance of four transformer-based models: RoBERTa base, RoBERTa large, BERT base, and BERT large. The table includes a comparison of evaluation metrics covered in Section 4.1, to assess how well each model predicts the Big Five personality traits. The results provide insight into the impact of model size and architecture on performance, helping to determine the most effective model for this task.
The average RMSE values across all models in this paper were similar, approximately 0.26, indicating comparable levels of prediction error. However, the RoBERTa models outperformed the BERT models in terms of , with the RoBERTa large model achieving the highest average value of 0.2404. Furthermore, the large model of the RoBERTa demonstrated slightly better performance than its base counterpart, suggesting that the dataset size is sufficient to effectively leverage the increased capacity of larger models. However, both the base and large BERT models exhibited nearly identical performance, showing no improvement despite the increased model capacity.
When examining the prediction of individual traits, Openness consistently exhibited the lowest RMSE values across all models, indicating that it is the easiest trait to predict. Similarly, Extraversion achieved the highest values across all models, highlighting its relative ease of predictability. In contrast, the models struggled with the prediction of Conscientiousness, Agreeableness, and Neuroticism. Conscientiousness posed significant challenges, as three models (RoBERTa base, BERT base, and BERT large) recorded the lowest values for this trait. Agreeableness was also difficult to predict, with two models yielding the highest RMSE values for this trait. Neuroticism proved particularly challenging for the RoBERTa large model, which recorded both the highest RMSE and the lowest values for this trait.
These findings highlight that while a larger model such as RoBERTa large, generally outperforms smaller models with this dataset, the prediction difficulty varies significantly across traits. Traits like Openness and Extraversion are more predictable, while others, such as Conscientiousness and Neuroticism, present persistent challenges even for advanced architectures.
Figure 1 presents the training loss progression for the models, while Figure 2 depicts the validation loss trends.
Based on the validation loss graphs, RoBERTa large consistently outperforms the others, achieving the lowest validation loss across all epochs, which indicates superior generalisation capabilities. Similarly, its training loss is the lowest, reflecting its efficiency in learning from the training data while minimizing overfitting. RoBERTa base follows closely, maintaining lower validation and training losses than both BERT base and BERT large, though it falls short of matching RoBERTa large’s performance.
In contrast, the BERT models demonstrate relatively higher training and validation losses. While BERT large performs slightly better than BERT base, both are outperformed by the RoBERTa models.
These results further highlight the advantages of the RoBERTa large architecture in effectively capturing linguistic nuances and context for this task.
Table 6 compares the results of a previous study [21], models fine-tuned on a subset of the dataset used in this study, and the best-performing model in this paper—RoBERTa large—fine-tuned on a larger dataset. The columns labelled "Mean Baseline" and "RoBERTa" present the results from the reference study [21], with "Mean Baseline" serving as a simplistic benchmark and "RoBERTa" showing the performance of the RoBERTa base model. In contrast, the column labelled "RoBERTa (large)" represents the best performing model in this paper, the RoBERTa large model.
The RoBERTa large model, which was fine-tuned on a larger dataset, outperformed the Mean Baseline in all five Big Five personality traits, demonstrating superior predictive accuracy across the board. In comparison to the Mean Baseline, the RoBERTa large model consistently achieved lower RMSE values and higher scores, indicating improved model performance, especially in the evaluation metric.
However, when comparing RoBERTa large to the RoBERTa model used in the previous work, we observe that the larger dataset used to fine-tune RoBERTa large did not translate into better performance in the evaluation metrics used. Despite its larger training data, RoBERTa large underperformed relative to the RoBERTa model from the previous work in terms of both RMSE and across all traits. Specifically, the RoBERTa model from the previous work achieved an average RMSE of 0.2241 and an average of 0.4148, both of which are generally better than those of RoBERTa large, which achieved an average RMSE of 0.2606 and an average of 0.2404. This suggests that even though a larger dataset was used for fine-tuning RoBERTa large, it did not necessarily improve its predictive capabilities compared to the RoBERTa fine-tuned on a smaller dataset in the previous work.
Despite these differences, the two models exhibited similar trends in terms of trait prediction. Both RoBERTa models showed the lowest RMSE in predicting Openness, suggesting that the models were more accurate in this trait. Additionally, both models showed the highest for Extraversion, indicating relatively stronger performance in predicting this trait. However, both models struggled with Neuroticism, as it was associated with the highest RMSE and the lowest in both cases. This suggests that predicting Neuroticism is particularly challenging for these models, regardless of the dataset size.
4.3. Investigating the Impact of Intercorrelations Among Big Five Personality Traits
Table 7 summarises the results of Big Five personality trait score predictions in Section 3.3.2 in comparison to the previous work [21]. The columns labelled "Mean Baseline" and "RoBERTa" present the results from the reference study [21]. In contrast, the columns labelled "RoBERTa (Single)" and "RoBERTa (Multiple)" reflect the results of this study. "RoBERTa (Single)" represents the results of the single-model approach, fine-tuning a single model to predict all five traits simultaneously, while "RoBERTa (Multiple)" refers to the average performance of the separate models in the multiple-models approach, fine-tuned individually for each trait.
When the overall performance of the single-model RoBERTa approach in this study is compared with the results of RoBERTa in the previous work, it is observed that the model fine-tuned in this study underperformed despite being fine-tuned on a larger dataset. However, the trends in the results are mostly consistent between the two models.
For both models, Openness achieved the lowest RMSE (0.1742 for the model from the previous work and 0.2345 for the single-model approach), while Neuroticism had the highest RMSE (0.2527 for the model from the previous study and 0.2737 for the single-model approach). This indicates that Openness is relatively easier to predict, whereas Neuroticism is more challenging. In terms of , both models also agree that Extraversion is the easiest trait to predict with the model from the previous work scoring 0.5229 and the single model approach scoring 0.2604. However, the model fine-tuned in this study recorded the lowest for Conscientiousness (0.2161), whereas the previous work reported Neuroticism as having the lowest (0.3248). This suggests differences in trait-specific performance, despite some alignment in trait predictability trends.
In contrast, the results for the multiple-models approach, where separate models were fine-tuned for each trait, were closer to the mean baseline results. These models exhibited higher RMSE values overall and values close to zero, indicating poor predictive performance. This suggests that fine-tuning separate models for each trait is less effective and produces inconclusive results than the single-model approach. It highlights the significance of the intercorrelations among the Big Five personality traits in enhancing predictive performance.
5. Discussion
Figure 3 illustrates the distribution of the Big Five personality trait scores that were used in the experiments conducted in this paper. Although the distribution does not appear to have many outliers or extreme bias, the dataset predominantly comprises authors from English-speaking countries, specifically the United States and Canada, as reported by Matej Gjurkovic et al. [46]. Consequently, the dataset may not fully represent the distribution of the global online population, which could limit the generalisability of the findings.
The average number of comments per author is approximately 1,917, with the range varying from a single comment to as many as 52,406 comments. The author column was removed during the fine-tuning process, which prevented the models from distinguishing between repeated authors. This may cause the models to overfit certain authors who have a fixed set of Big Five personality scores. Such overfitting could lead to a lack of generalisation and poorer performance on unseen data.
Table 8 presents the personality traits correlations between the Big Five personality traits derived from the dataset and those predicted by the RoBERTa large model. Slight differences can be observed between the two sets of correlations. Notably, the largest differences occur in the trait pairs AGR-CON () and EXT-OPE (). However, these variations are relatively minor. A paired t-test analysis of the actual and the predicted personality trait correlations yielded a p-value of 0.9367, which is significantly greater than the commonly accepted significance threshold of 0.05. This result indicates that the observed differences are not statistically significant, suggesting that the variations between the predicted and actual correlations can be attributed to random variation rather than systematic error.
Table 9 compares the intercorrelations of the Big Five personality traits from the dataset used in experiments with the intercorrelations predicted by RoBERTa models from the previous work [21]. Although the RoBERTa fine-tuned with a larger dataset underperformed compared to the model from previous work, it demonstrated a lower average absolute difference in intercorrelations between actual and predicted values. Specifically, the absolute average difference in this paper is 0.0372, compared to 0.2540 for the previous work. This finding indicates that, while overall performance was lower on the evaluation metrics used in this paper, the RoBERTa large model was able to better capture the intercorrelations of the Big Five personality traits after being fine-tuned on a larger dataset.
6. Conclusions and Future Works
This study highlights the impact of dataset size on model performance, revealing that while larger datasets can lead to greater generalisation, they may also lower predictive accuracy. However, this trade-off allowed the model to better capture the intercorrelations among the Big Five personality traits—an essential factor in accurately predicting personality trait scores.
Among the models evaluated, the RoBERTa large model outperformed its base counterpart, achieving the lowest RMSE and highest . In contrast, the BERT large model showed minimal improvement over its base counterpart, despite its more complex architecture designed for large datasets. While the RoBERTa large model underperformed in evaluation metrics compared to the previous work [21], it effectively modelled trait intercorrelations, achieving an average absolute difference of just 0.0372.
Interestingly, all tested models demonstrated stronger predictive accuracy for Openness and Extraversion but struggled with Neuroticism, Agreeableness, and Conscientiousness. This study also reinforces the importance of intercorrelations among the Big Five personality traits, an aspect often overlooked in previous research.
Another key finding was the advantage of fine-tuning models simultaneously on all five traits rather than training separate models for each trait. While separately fine-tuned models exhibited high RMSE values and an average close to zero—similar to the mean baseline—the simultaneous fine-tuning approach significantly reduced RMSE and increased , demonstrating superior performance.
These results highlight the potential of RoBERTa, particularly its large model variant, to enhance personality trait prediction. They also underscore the under-explored influence of intercorrelations among the Big Five traits, which could improve both prediction accuracy and model interpretability.
Despite the strong performance in capturing the intercorrelations of the Big Five personality traits, future work should focus on addressing potential dataset biases and enhancing model generalisability to improve the accuracy of personality trait predictions. Given the large range of comments per author, balancing the dataset by imposing constraints on the number of comments or number of words per user can help prevent overfitting to specific score patterns. Additionally, incorporating demographic labels from the original dataset as features will provide valuable context, allowing the model to account for variations across different population groups. Expanding the dataset to include multiple languages and a broader representation of countries and regions would further enhance the model’s applicability, ensuring it better reflects the diversity of the global online population.
To further boost performance, testing various hyperparameter configurations or exploring newer LLMs like LLaMA, which may be better at capturing the intercorrelations of the traits, could improve accuracy and better predict personality trait scores. Future research can advance the field of personality trait prediction by addressing these key areas. This will ensure that models are not only more accurate but also equitable and generalisable across diverse contexts and populations.
Author Contributions
Conceptualization, M.P. and K.S.; methodology, M.P. and K.S.; software, K.S.; validation, F.M., M.P. and K.S.; formal analysis, K.S.; investigation, K.S.; resources, K.S.; data curation, K.S.; writing—original draft preparation, K.S.; writing—review and editing, M.P. and K.S.; visualization, M.P. and K.S.; supervision, F.M. and M.P.; project administration, F.M. and M.P.; funding acquisition, F.M. and M.P. All authors have read and agreed to the published version of the manuscript.
Funding
This research received no external funding
Institutional Review Board Statement
Not applicable
Informed Consent Statement
Not applicable
Data Availability Statement
This study utilizes the PANDORA dataset available at: https://psy.takelab.fer.hr/datasets/all/ (accessed on 12 April 2024), with the code for this research available at: https://github.com/kitmay2001/Big-Five-personality-score-predictions_RoBERTa_and_BERT (accessed on 8 March 2025).
Conflicts of Interest
The authors declare no conflicts of interest.
Abbreviations
The following abbreviations are used in this manuscript:
| AGR | Agreeableness |
| BERT | Bidirectional Encoder Representations from Transformers |
| BFI | Big Five Inventory |
| Bi-LSTM | Bidirectional Long Short-Term Memory |
| CLS | Classification Token |
| CON | Conscientiousness |
| CSV | Comma-Separated Values |
| DNN | Deep Neural Network |
| EXT | Extraversion |
| GRU | Gated Recurrent Unit |
| LIWC | Linguistic Inquiry and Word Count |
| LLaMA | Large Language Model Meta AI |
| LLM | Large Language Models |
| LSTM | Long Short-Term Memory |
| MBTI | Myers-Briggs Type Indicator |
| ML | Machine Learning |
| MSE | Mean Squared Error |
| NEO | Neuroticism, Extraversion, Openness |
| NEU | Neuroticism |
| NLP | Natural Language Processing |
| OCEAN | Openness, Conscientiousness, Extraversion, Agreeableness, Neuroticism |
| OPE | Openness |
| PC | Personality Computing |
| RoBERTa | Robustly Optimized BERT Pretraining Approach |
| RMSE | Root Mean Square Error |
| RNN | Recurrent Neural Network |
| Coefficient of Determination | |
| SEP | Separator Token |
| 1-DCNN | 1-Dimensional Convolutional Neural Network |
References
- Sanchez-Roige, S.; Gray, J.C.; MacKillop, J.; Chen, C.H.; Palmer, A.A. The genetics of human personality. Genes, Brain and Behavior 2018, 17, e12439. [Google Scholar] [CrossRef] [PubMed]
- Judge, T.A.; Zapata, C.P. The person–situation debate revisited: Effect of situation strength and trait activation on the validity of the Big Five personality traits in predicting job performance. Academy of Management Journal 2015, 58, 1149–1179. [Google Scholar] [CrossRef]
- Caliskan, A. Applying the right relationship marketing strategy through big five personality traits. Journal of Relationship Marketing 2019, 18, 196–215. [Google Scholar] [CrossRef]
- Ricci, F.; Rokach, L.; Shapira, B. Recommender systems: Techniques, applications, and challenges. Recommender systems handbook 2021, pp. 1–35.
- Costa Jr, P.T.; McCrae, R.R. The five-factor model of personality and its relevance to personality disorders. Journal of personality disorders 1992, 6, 343–359. [Google Scholar] [CrossRef]
- Myers, I.B. The Myers-Briggs Type Indicator: Manual (1962). 1962.
- Allik, J.; McCrae, R.R. A five-factor theory perspective. The five-factor model of personality across cultures 2002, pp. 303–322.
- John, O.P.; Naumann, L.P.; Soto, C.J. Paradigm shift to the integrative big five trait taxonomy. Handbook of personality: Theory and research 2008, 3, 114–158. [Google Scholar]
- Fang, Q.; Giachanou, A.; Bagheri, A.; Boeschoten, L.; van Kesteren, E.J.; Kamalabad, M.S.; Oberski, D. On text-based personality computing: Challenges and future directions. In Proceedings of the Findings of the Association for Computational Linguistics: ACL 2023, 2023, pp. 10861–10879.
- Costa, P.T.; McCrae, R.R. The revised neo personality inventory (neo-pi-r). The SAGE handbook of personality theory and assessment 2008, 2, 179–198. [Google Scholar]
- John, O.P.; Donahue, E.M.; Kentle, R.L. Big five inventory. Journal of personality and social psychology 1991. [Google Scholar]
- John, O.P.; Srivastava, S.; et al. The Big-Five trait taxonomy: History, measurement, and theoretical perspectives 1999.
- Azucar, D.; Marengo, D.; Settanni, M. Predicting the Big 5 personality traits from digital footprints on social media: A meta-analysis. Personality and Individual Differences 2018, 124, 150–159. [Google Scholar] [CrossRef]
- Phan, L.V.; Rauthmann, J.F. Personality computing: New frontiers in personality assessment. Social and personality psychology compass 2021, 15, e12624. [Google Scholar] [CrossRef]
- Mairesse, F.; Walker, M.A.; Mehl, M.R.; Moore, R.K. Using linguistic cues for the automatic recognition of personality in conversation and text. Journal of artificial intelligence research 2007, 30, 457–500. [Google Scholar] [CrossRef]
- Harari, G.M.; Vaid, S.S.; Müller, S.R.; Stachl, C.; Marrero, Z.; Schoedel, R.; Bühner, M.; Gosling, S.D. Personality sensing for theory development and assessment in the digital age. European Journal of Personality 2020, 34, 649–669. [Google Scholar] [CrossRef]
- Vinciarelli, A.; Mohammadi, G. A survey of personality computing. IEEE Transactions on Affective Computing 2014, 5, 273–291. [Google Scholar] [CrossRef]
- Yee, N.; Ducheneaut, N.; Nelson, L.; Likarish, P. Introverted elves & conscientious gnomes: the expression of personality in world of warcraft. In Proceedings of the Proceedings of the SIGCHI conference on human factors in computing systems, 2011, pp. 753–762.
- Kosan, M.A.; Karacan, H.; Urgen, B.A. Predicting personality traits with semantic structures and LSTM-based neural networks. Alexandria Engineering Journal 2022, 61, 8007–8025. [Google Scholar] [CrossRef]
- Devlin, J. Bert: Pre-training of deep bidirectional transformers for language understanding. arXiv preprint arXiv:1810.04805 2018. [CrossRef]
- Chen, Y. Exploring the Intercorrelations of Big Five Personality Traits: Comparing Questionnaire-Based Methods and Automated Personality Assessment using BERT and RNN Models. Master’s thesis, 2023.
- Liu, Y. Roberta: A robustly optimized bert pretraining approach. arXiv preprint arXiv:1907.11692 2019, 364. [CrossRef]
- Li, M.; Liu, H.; Wu, B.; Bai, T. Language style matters: Personality prediction from textual styles learning. In Proceedings of the 2022 IEEE International Conference on Knowledge Graph (ICKG). IEEE, 2022, pp. 141–148. [CrossRef]
- Cattell, R.B. The description of personality. I. Foundations of trait measurement. Psychological review 1943, 50, 559. [Google Scholar] [CrossRef]
- Tupes, E.C.; Christal, R.E. Recurrent personality factors based on trait ratings. Journal of personality 1992, 60, 225–251. [Google Scholar] [CrossRef]
- Komarraju, M.; Karau, S.J.; Schmeck, R.R.; Avdic, A. The Big Five personality traits, learning styles, and academic achievement. Personality and individual differences 2011, 51, 472–477. [Google Scholar] [CrossRef]
- Barrick, M.R.; Mount, M.K. The big five personality dimensions and job performance: a meta-analysis. Personnel psychology 1991, 44, 1–26. [Google Scholar] [CrossRef]
- Judge, T.A.; Higgins, C.A.; Thoresen, C.J.; Barrick, M.R. The big five personality traits, general mental ability, and career success across the life span. Personnel psychology 1999, 52, 621–652. [Google Scholar] [CrossRef]
- Digman, J.M. Higher-order factors of the Big Five. Journal of personality and social psychology 1997, 73, 1246. [Google Scholar] [CrossRef] [PubMed]
- Rushton, J.P.; Irwing, P. A General Factor of Personality (GFP) from two meta-analyses of the Big Five: and. Personality and individual differences 2008, 45, 679–683. [Google Scholar] [CrossRef]
- van der Linden, D.; te Nijenhuis, J.; Bakker, A.B. The General Factor of Personality: A meta-analysis of Big Five intercorrelations and a criterion-related validity study. Journal of Research in Personality 2010, 44, 315–327. [Google Scholar] [CrossRef]
- Pennebaker, J.W.; King, L.A. Linguistic styles: language use as an individual difference. Journal of personality and social psychology 1999, 77, 1296. [Google Scholar] [CrossRef] [PubMed]
- Oberlander, J.; Nowson, S. Whose thumb is it anyway? Classifying author personality from weblog text. In Proceedings of the Proceedings of the COLING/ACL 2006 Main Conference Poster Sessions, 2006, pp. 627–634.
- Stillwell, D.J.; Kosinski, M. myPersonality project: Example of successful utilization of online social networks for large-scale social research. American Psychologist 2004, 59, 93–104. [Google Scholar]
- Ren, Z.; Shen, Q.; Diao, X.; Xu, H. A sentiment-aware deep learning approach for personality detection from text. Information Processing & Management 2021, 58, 102532. [Google Scholar]
- Pennebaker, J.W. Linguistic inquiry and word count: LIWC 2001, 2001.
- Pennebaker, J.W.; Boyd, R.L.; Jordan, K.; Blackburn, K. LIWC2015 User’s Manual. LIWC.net, Austin, TX, 2015. Available online: www.liwc.net.
- Adi, G.Y.N.; Tandio, M.H.; Ong, V.; Suhartono, D. Optimization for automatic personality recognition on Twitter in Bahasa Indonesia. Procedia Computer Science 2018, 135, 473–480. [Google Scholar] [CrossRef]
- Ptaszynski, M.; Zasko-Zielinska, M.; Marcinczuk, M.; Leliwa, G.; Fortuna, M.; Soliwoda, K.; Dziublewska, I.; Hubert, O.; Skrzek, P.; Piesiewicz, J.; et al. Looking for razors and needles in a haystack: multifaceted analysis of suicidal declarations on social media—a pragmalinguistic approach. International journal of environmental research and public health 2021, 18, 11759. [Google Scholar] [CrossRef]
- Schwartz, H.A.; Eichstaedt, J.C.; Kern, M.L.; Dziurzynski, L.; Ramones, S.M.; Agrawal, M.; Shah, A.; Kosinski, M.; Stillwell, D.; Seligman, M.E.; et al. Personality, gender, and age in the language of social media: The open-vocabulary approach. PloS one 2013, 8, e73791. [Google Scholar] [CrossRef]
- Eichstaedt, J.C.; Kern, M.L.; Yaden, D.B.; Schwartz, H.A.; Giorgi, S.; Park, G.; Hagan, C.A.; Tobolsky, V.A.; Smith, L.K.; Buffone, A.; et al. Closed-and open-vocabulary approaches to text analysis: A review, quantitative comparison, and recommendations. Psychological Methods 2021, 26, 398. [Google Scholar] [CrossRef]
- Xue, D.; Wu, L.; Hong, Z.; Guo, S.; Gao, L.; Wu, Z.; Zhong, X.; Sun, J. Deep learning-based personality recognition from text posts of online social networks. Applied Intelligence 2018, 48, 4232–4246. [Google Scholar] [CrossRef]
- Tadesse, M.M.; Lin, H.; Xu, B.; Yang, L. Personality predictions based on user behavior on the facebook social media platform. IEEE Access 2018, 6, 61959–61969. [Google Scholar] [CrossRef]
- Arijanto, J.E.; Geraldy, S.; Tania, C.; Suhartono, D. Personality prediction based on text analytics using bidirectional encoder representations from transformers from english twitter dataset. International Journal of Fuzzy Logic and Intelligent Systems 2021, 21, 310–316. [Google Scholar] [CrossRef]
- Mehta, Y.; Fatehi, S.; Kazameini, A.; Stachl, C.; Cambria, E.; Eetemadi, S. Bottom-up and top-down: Predicting personality with psycholinguistic and language model features. In Proceedings of the 2020 IEEE international conference on data mining (ICDM). IEEE, 2020, pp. 1184–1189. [CrossRef]
- Gjurković, M.; Karan, M.; Vukojević, I.; Bošnjak, M.; Šnajder, J. PANDORA talks: Personality and demographics on Reddit. arXiv preprint arXiv:2004.04460 2020. [CrossRef]
- Riso, D. Personality types: Using the enneagram for self-discovery; Houghton Mifflin Company, 1996.
- Ma, W.; Cui, Y.; Si, C.; Liu, T.; Wang, S.; Hu, G. CharBERT: Character-aware pre-trained language model. arXiv preprint arXiv:2011.01513 2020. [CrossRef]
- Uma, A.N.; Fornaciari, T.; Hovy, D.; Paun, S.; Plank, B.; Poesio, M. Learning from disagreement: A survey. Journal of Artificial Intelligence Research 2021, 72, 1385–1470. [Google Scholar] [CrossRef]
| 1 | Facebook (https://www.facebook.com) |
||||||||
| 2 | Reddit (https://www.reddit.com) |
||||||||
| 3 |
|
||||||||
| 4 | RoBERTa base (https//huggingface.co/FacebookAI/roberta-base) |
Figure 1.
Train loss of models.
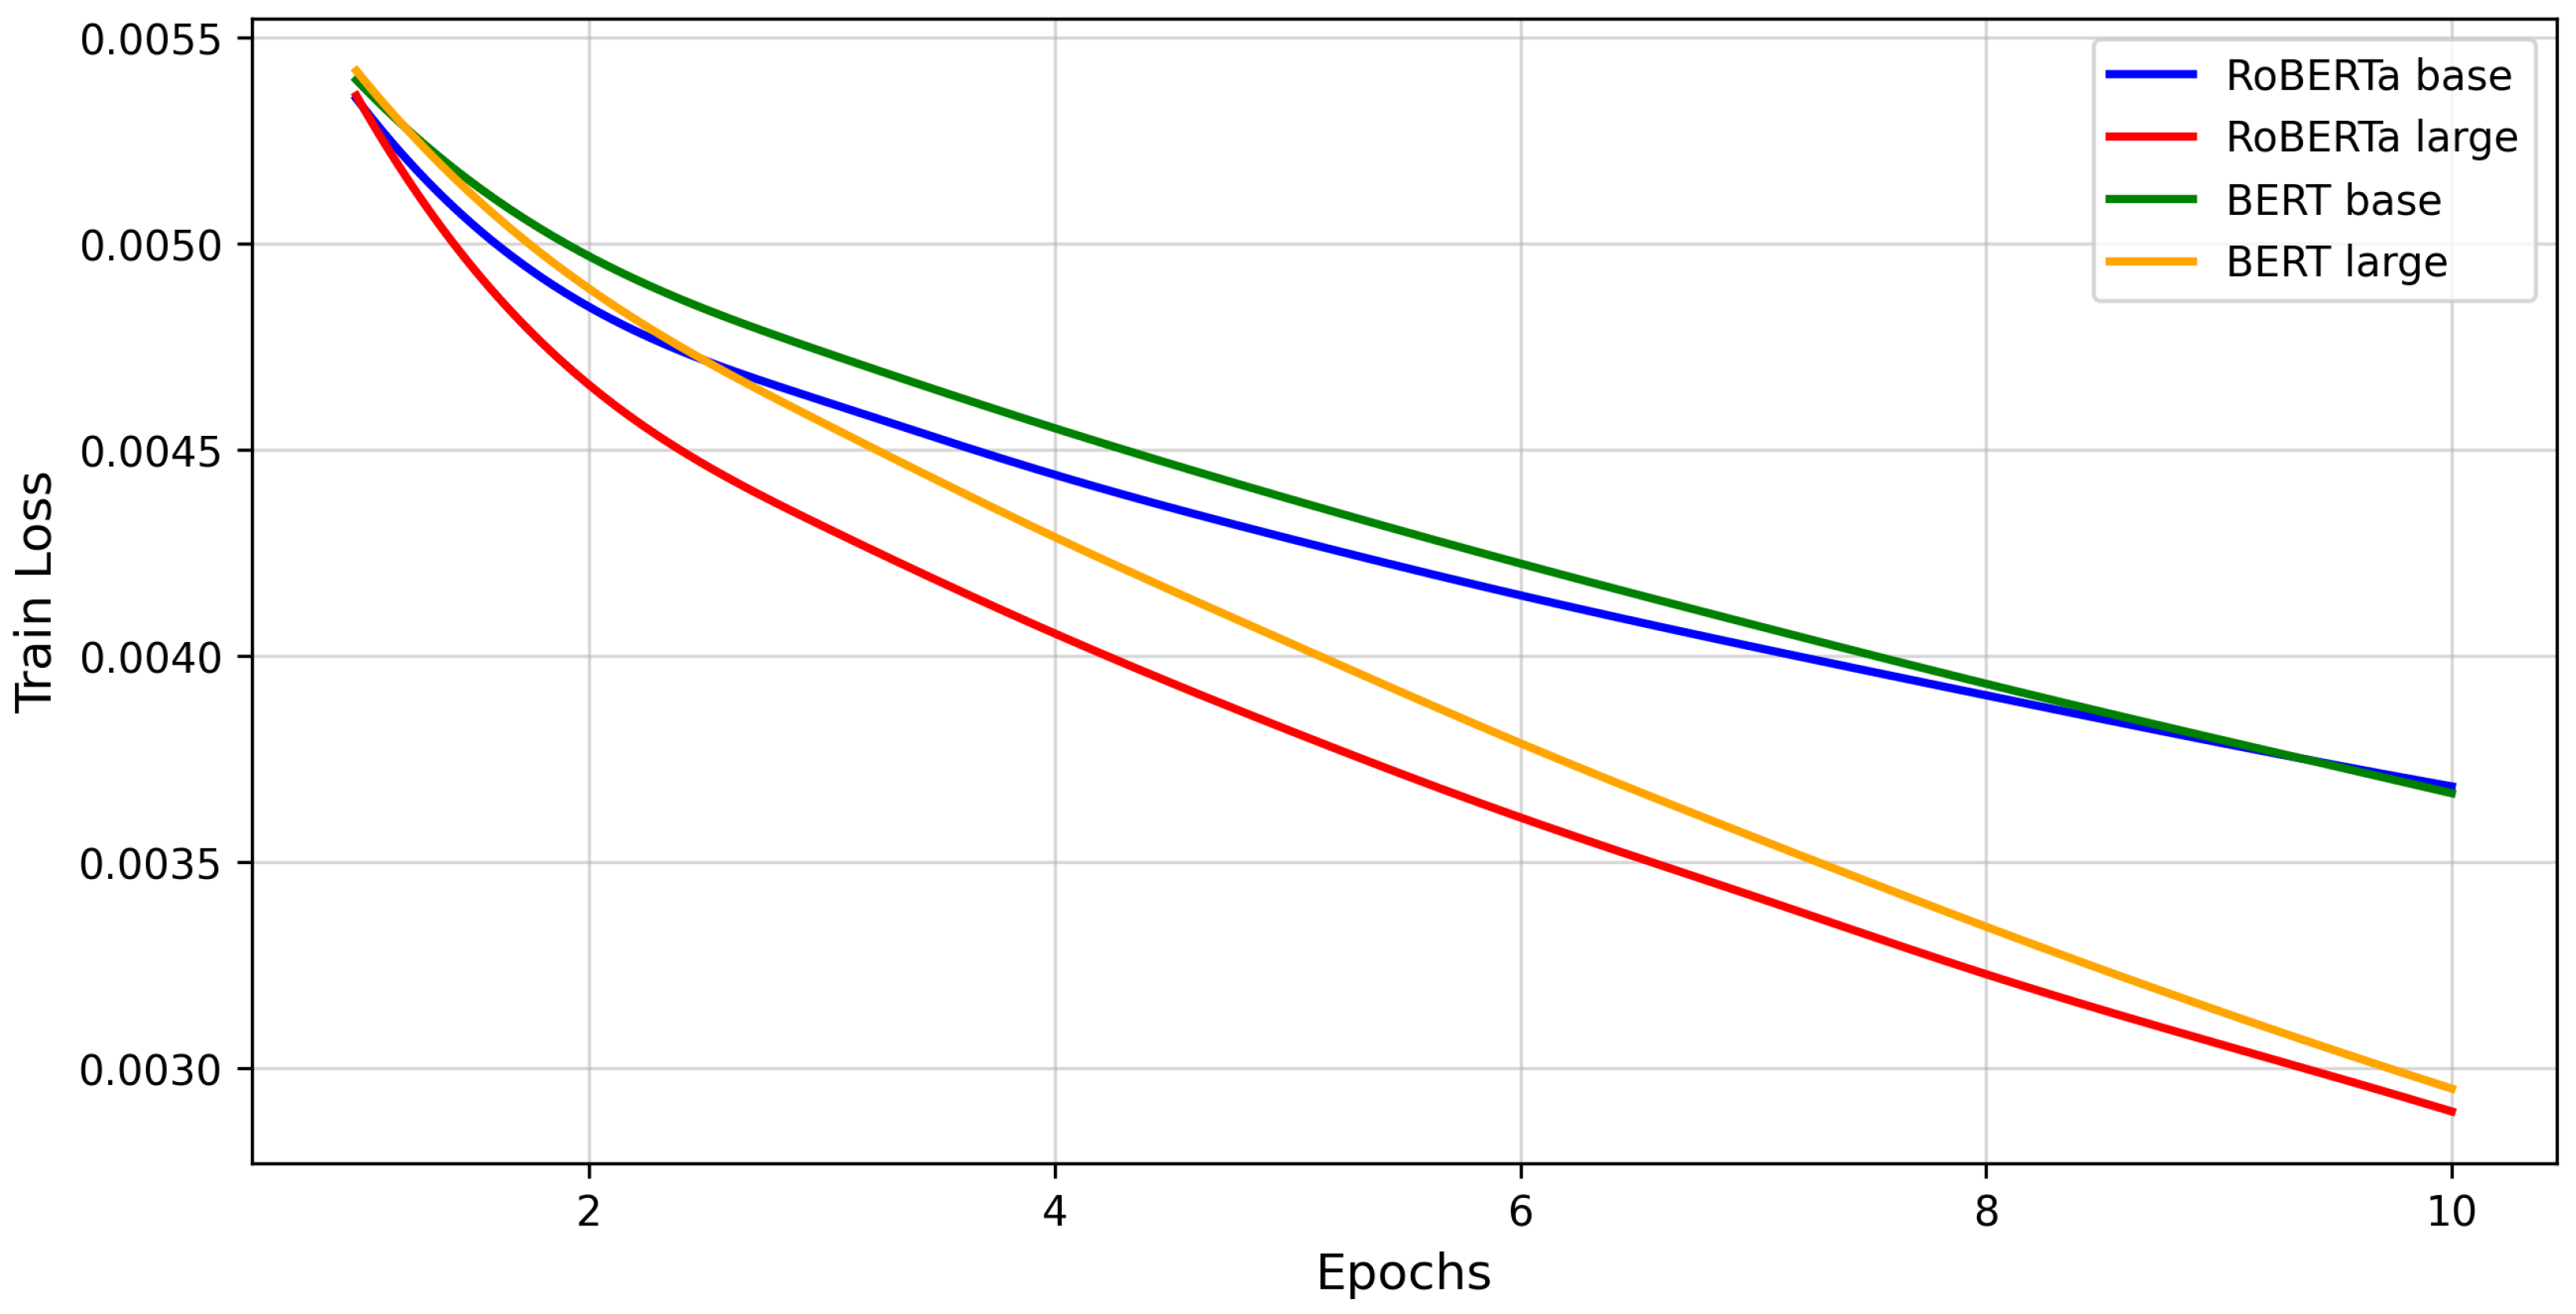
Figure 2.
Validation loss of models.
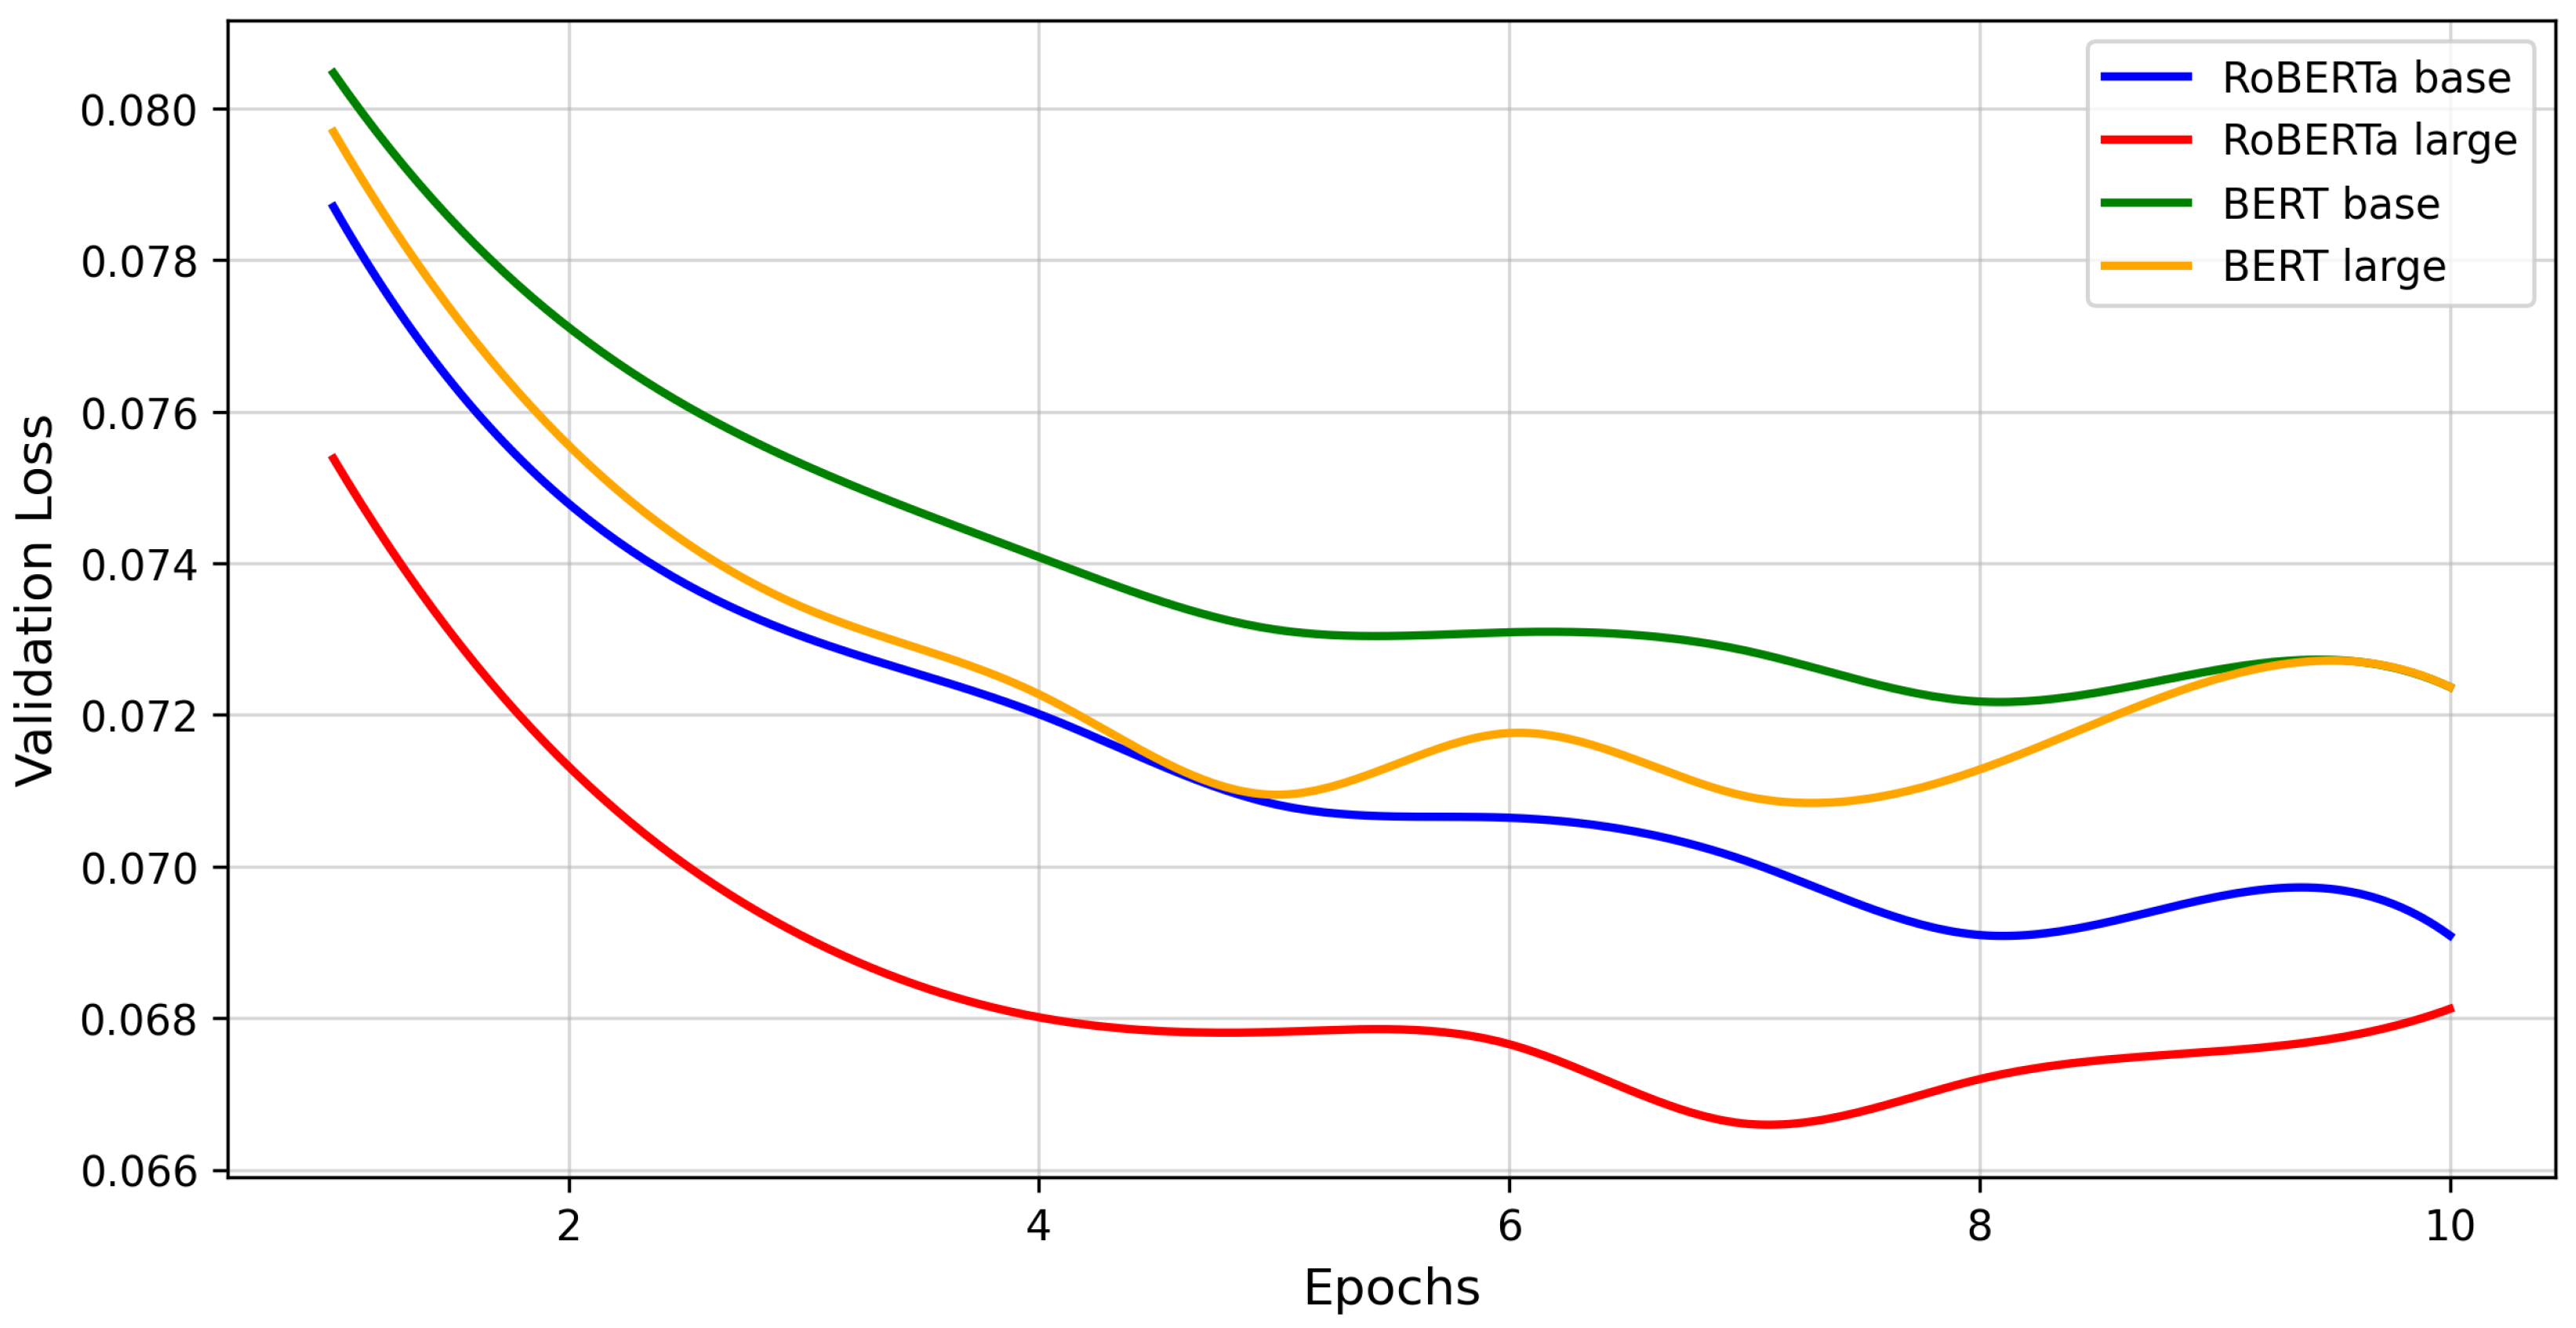
Figure 3.
Distribution of Big Five personality trait scores (Note: Extraversion(EXT), Neuroticism(NEU), Agreeableness(AGR), Conscientiousness(CON), Openness(OPE))
Figure 3.
Distribution of Big Five personality trait scores (Note: Extraversion(EXT), Neuroticism(NEU), Agreeableness(AGR), Conscientiousness(CON), Openness(OPE))
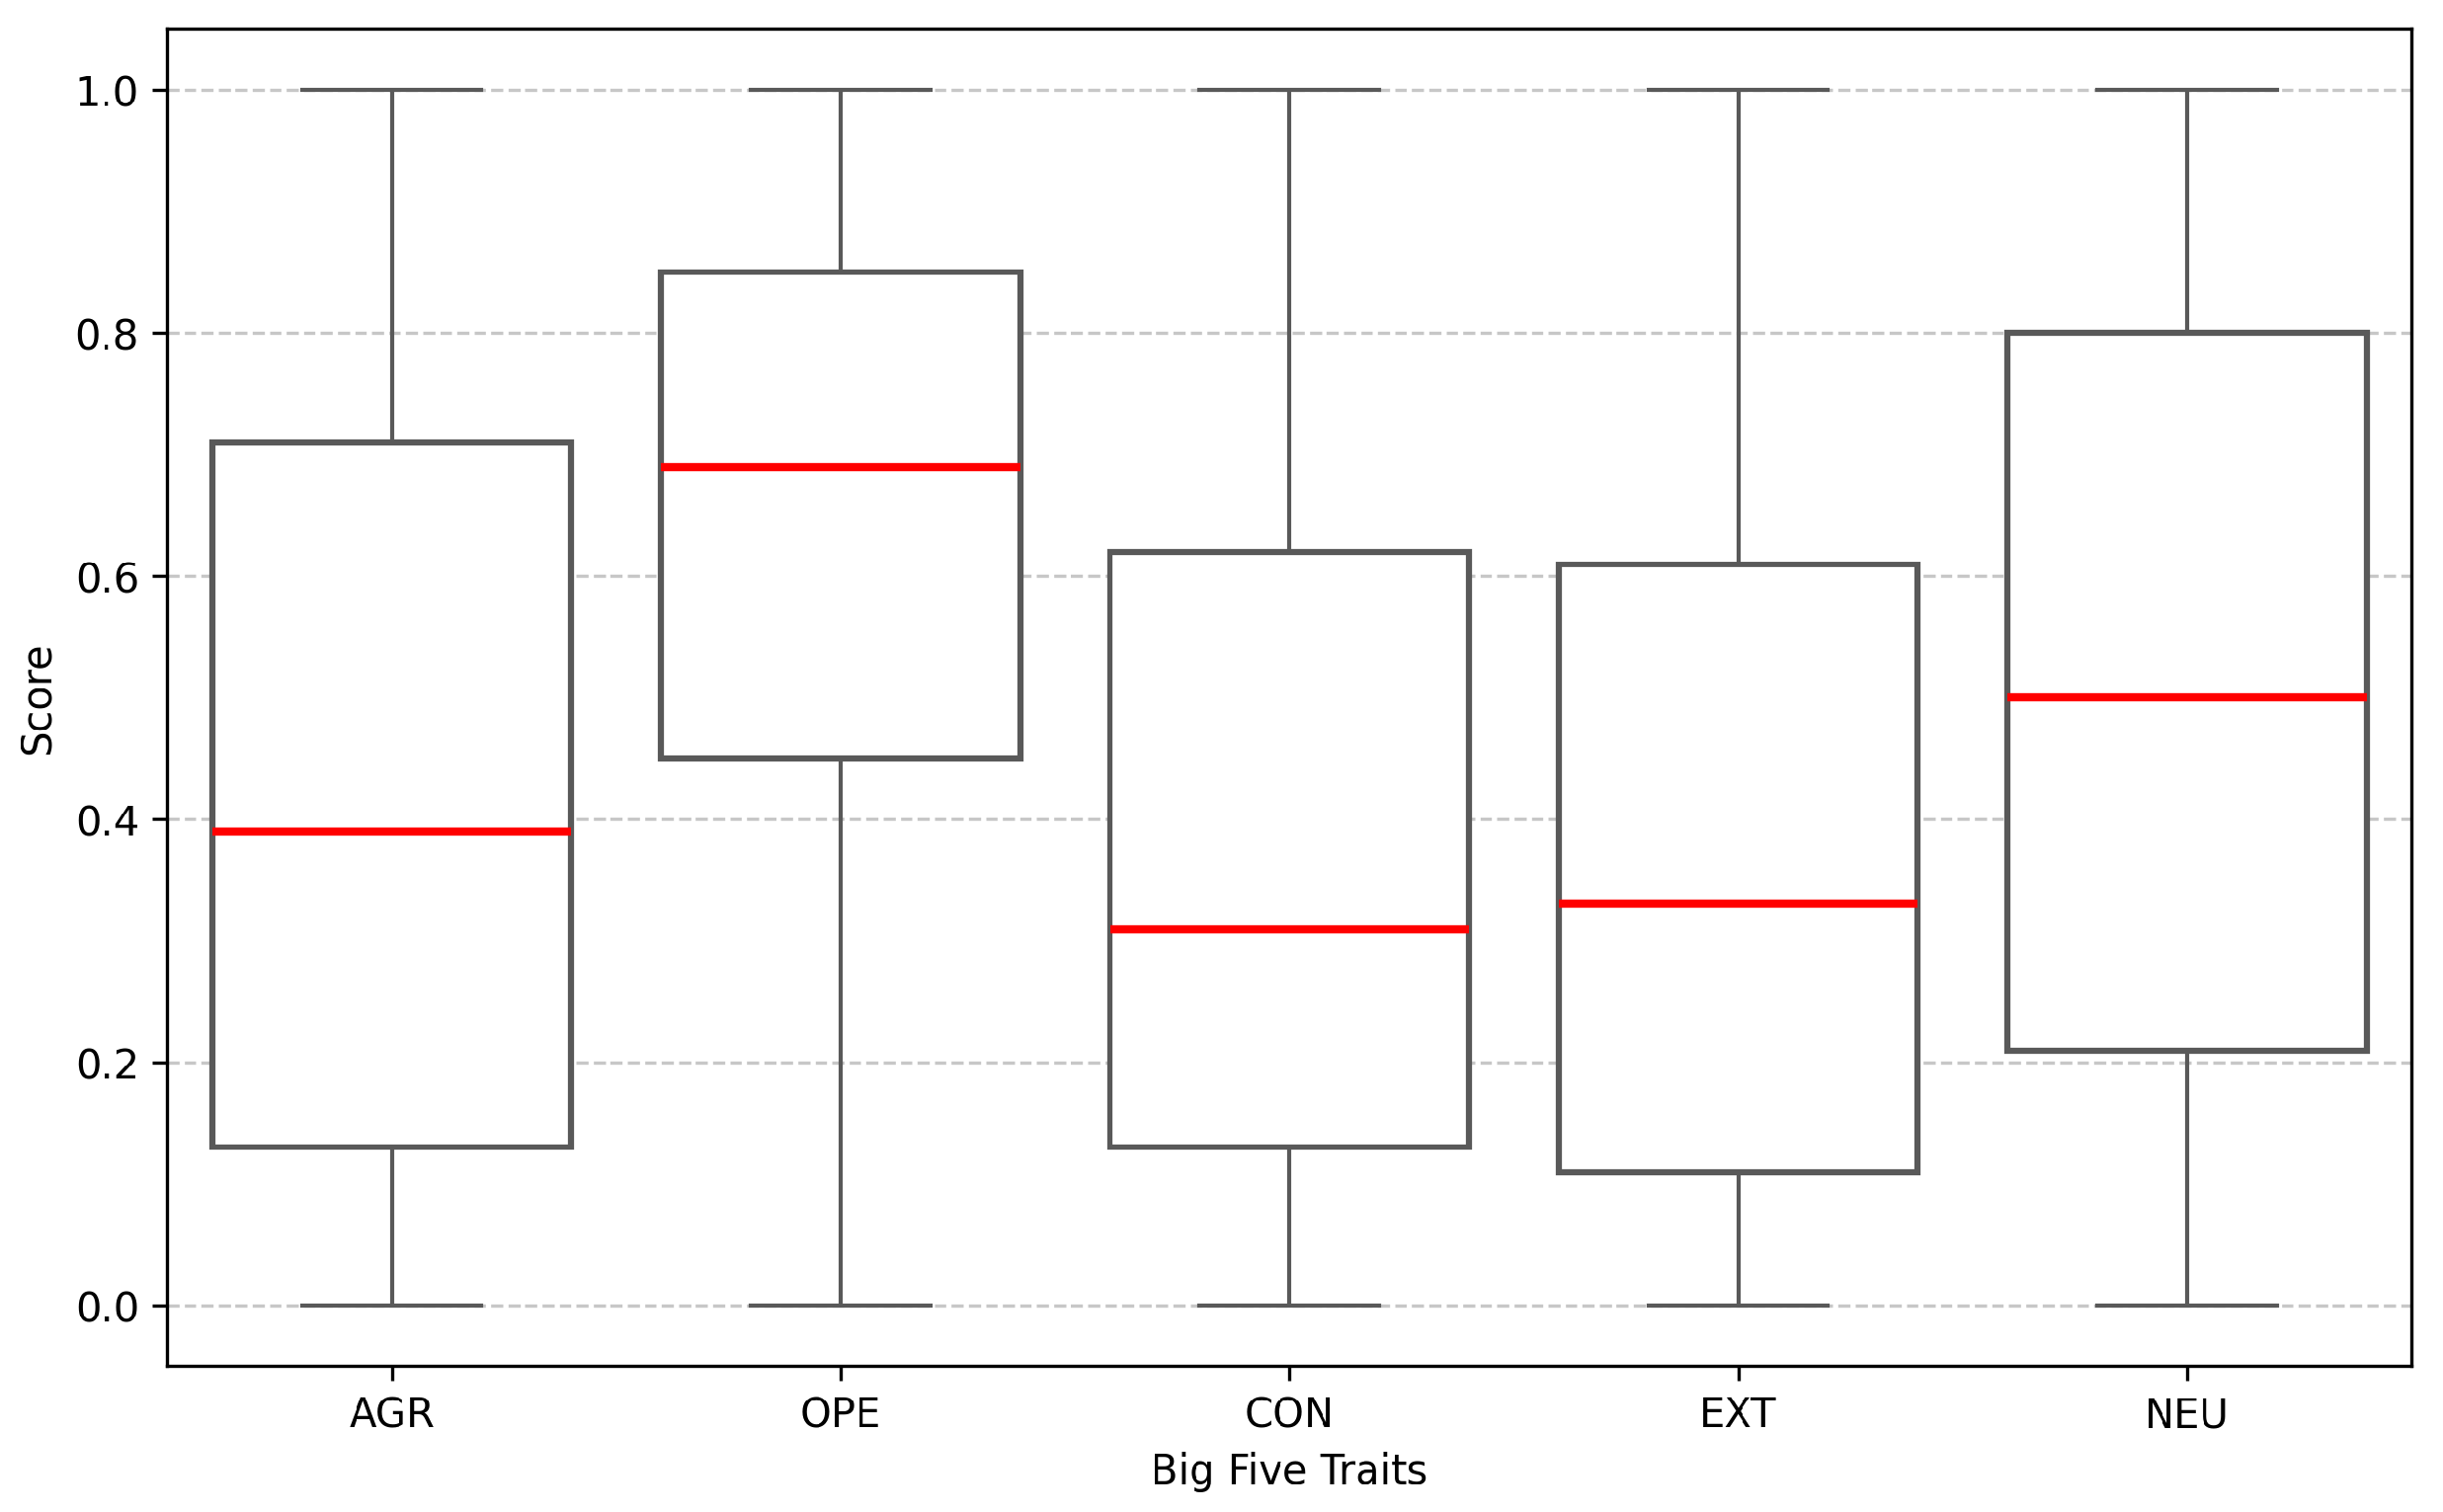

Table 1.
PANDORA dataset details. *Note: Demographic labels were not available for all authors. Only the three most common languages in the dataset are listed.
Table 1.
PANDORA dataset details. *Note: Demographic labels were not available for all authors. Only the three most common languages in the dataset are listed.
| Attributes | Details |
|---|---|
| Source | |
| Period | 2015-2020 |
| Total authors | 10,295 |
| Total comments | 17,640,979 |
| Demographic labels | Age, Gender, Location* |
| Language | English, Spanish, French* |
Table 2.
Number of comments and authors with complete personality labels
| Personality taxonomy | Number of authors | Number of comments |
|---|---|---|
| MBTI | 9,067 | 15,555,974 |
| Big Five | 1,568 | 3,006,567 |
| Enneagram | 794 | 1,458,816 |
| Big Five + MBTI | 377 | 1,045,375 |
| Big Five + Enneagram | 64 | 235,883 |
| MBTI + Enneagram | 793 | 1,457,625 |
| Big Five + MBTI + Enneagram | 63 | 234,692 |
Table 3.
Sample input data and corresponding Big Five trait scores for single-model fine-tuning
| body | agr | ope | con | ext | neu |
|---|---|---|---|---|---|
| I admit having fallen into the trap myself.. | 0.3 | 0.7 | 0.15 | 0.15 | 0.5 |
| thats a great business idea, why didn’t i.... | 0.09 | 0.59 | 0.05 | 0.73 | 0.07 |
| Hey, at least you lost something that’s...... | 0.09 | 0.61 | 0.13 | 0.04 | 0.72 |
Table 4.
Sample input data and corresponding Agreeableness scores for multiple models fine-tuning
| body | agr |
|---|---|
| I admit having fallen into the trap myself. As much as I know.... | 0.3 |
| thats a great business idea, why didn’t i think of that!! | 0.09 |
| Hey, at least you lost something that’s still currently made. I’ve.. | 0.09 |
Table 5.
Personality trait predictions with RoBERTa and BERT
| Big Five personality traits | RoBERTa (base) | RoBERTa (large) | BERT (base) | BERT (large) | ||||
|---|---|---|---|---|---|---|---|---|
| RMSE | RMSE | RMSE | RMSE | |||||
| Openness | 0.2345 | 0.2201 | 0.2315 | 0.2403 | 0.2391 | 0.1895 | 0.2386 | 0.1926 |
| Conscientiousness | 0.2669 | 0.2161 | 0.2653 | 0.2255 | 0.2739 | 0.1743 | 0.2730 | 0.1797 |
| Extraversion | 0.2625 | 0.2604 | 0.2602 | 0.2734 | 0.2694 | 0.2212 | 0.2702 | 0.2168 |
| Agreeableness | 0.2743 | 0.2288 | 0.2727 | 0.2379 | 0.2803 | 0.1949 | 0.2805 | 0.1939 |
| Neuroticism | 0.2737 | 0.2223 | 0.2732 | 0.2248 | 0.2796 | 0.1884 | 0.2800 | 0.1859 |
Table 6.
Personality trait prediction results of RoBERTa large in comparison with previous work [21]
Table 6.
Personality trait prediction results of RoBERTa large in comparison with previous work [21]
| Big Five personality traits | Mean Baseline | RoBERTa | RoBERTa (large) | |||
|---|---|---|---|---|---|---|
| RMSE | RMSE | RMSE | ||||
| Openness | 0.2314 | -0.0002 | 0.1742 | 0.4333 | 0.2315 | 0.2403 |
| Conscientiousness | 0.2633 | 0.0000 | 0.2046 | 0.3964 | 0.2653 | 0.2255 |
| Extraversion | 0.3574 | -0.0001 | 0.2469 | 0.5229 | 0.2602 | 0.2734 |
| Agreeableness | 0.3036 | -0.0004 | 0.2423 | 0.3964 | 0.2727 | 0.2379 |
| Neuroticism | 0.3074 | -0.0002 | 0.2527 | 0.3248 | 0.2732 | 0.2248 |
Table 7.
Results of Big Five personality trait score predictions with single model and multiple models approach in comparison to previous work [21]
Table 7.
Results of Big Five personality trait score predictions with single model and multiple models approach in comparison to previous work [21]
| Big Five personality traits | Mean Baseline | RoBERTa | RoBERTa (Single) | RoBERTa (Multiple) | ||||
|---|---|---|---|---|---|---|---|---|
| RMSE | RMSE | RMSE | RMSE | |||||
| Openness | 0.2314 | -0.0002 | 0.1742 | 0.4333 | 0.2345 | 0.2201 | 0.2655 | 0.0008 |
| Conscientiousness | 0.2633 | 0.0000 | 0.2046 | 0.3964 | 0.2669 | 0.2161 | -0.3016 | -0.0005 |
| Extraversion | 0.3574 | -0.0001 | 0.2469 | 0.5229 | 0.2625 | 0.2604 | 0.3033 | 0.0131 |
| Agreeableness | 0.3036 | -0.0004 | 0.2423 | 0.3964 | 0.2743 | 0.2288 | 0.3124 | -0.0001 |
| Neuroticism | 0.3074 | -0.0002 | 0.2527 | 0.3248 | 0.2737 | 0.2223 | 0.3103 | -0.0001 |
Table 8.
Comparison of Big Five personality trait intercorrelations between dataset and predicted correlations by RoBERTa large (Note: Extraversion(EXT), Neuroticism(NEU), Agreeableness(AGR), Conscientiousness(CON), Openness(OPE))
Table 8.
Comparison of Big Five personality trait intercorrelations between dataset and predicted correlations by RoBERTa large (Note: Extraversion(EXT), Neuroticism(NEU), Agreeableness(AGR), Conscientiousness(CON), Openness(OPE))
| Trait Pairs | Dataset | RoBERTa large |
|---|---|---|
| EXT-NEU | -0.2905 | -0.4252 |
| EXT-AGR | -0.0615 | -0.0803 |
| EXT-CON | 0.0689 | 0.0923 |
| EXT-OPE | 0.2344 | 0.2782 |
| NEU-AGR | 0.0491 | 0.1027 |
| NEU-CON | -0.2474 | -0.2377 |
| NEU-OPE | 0.0433 | 0.0583 |
| AGR-CON | 0.1350 | 0.1823 |
| AGR-OPE | 0.1178 | 0.1132 |
| CON-OPE | -0.0655 | -0.0861 |
Table 9.
Comparison of Big Five personality trait intercorrelations between dataset and predicted correlations by RoBERTa from previous work (Chen 2023). (Note: Extraversion(EXT), Neuroticism(NEU), Agreeableness(AGR), Conscientiousness(CON), Openness(OPE))
Table 9.
Comparison of Big Five personality trait intercorrelations between dataset and predicted correlations by RoBERTa from previous work (Chen 2023). (Note: Extraversion(EXT), Neuroticism(NEU), Agreeableness(AGR), Conscientiousness(CON), Openness(OPE))
| Trait Pairs | Dataset | RoBERTa |
|---|---|---|
| EXT-NEU | -0.5471 | -0.7611 |
| EXT-AGR | -0.4373 | -0.6480 |
| EXT-CON | -0.0484 | -0.1260 |
| EXT-OPE | 0.2428 | -0.4436 |
| NEU-AGR | 0.0309 | 0.3321 |
| NEU-CON | -0.1578 | -0.0346 |
| NEU-OPE | -0.0572 | -0.1750 |
| AGR-CON | 0.3486 | 0.6360 |
| AGR-OPE | -0.1860 | -0.4895 |
| CON-OPE | -0.4200 | -0.6385 |
Disclaimer/Publisher’s Note: The statements, opinions and data contained in all publications are solely those of the individual author(s) and contributor(s) and not of MDPI and/or the editor(s). MDPI and/or the editor(s) disclaim responsibility for any injury to people or property resulting from any ideas, methods, instructions or products referred to in the content. |
© 2025 by the authors. Licensee MDPI, Basel, Switzerland. This article is an open access article distributed under the terms and conditions of the Creative Commons Attribution (CC BY) license (http://creativecommons.org/licenses/by/4.0/).
Copyright: This open access article is published under a Creative Commons CC BY 4.0 license, which permit the free download, distribution, and reuse, provided that the author and preprint are cited in any reuse.


