
Submitted:
26 May 2025
Posted:
27 May 2025
You are already at the latest version
Abstract
In today’s digital age, social media platforms like Instagram dominate daily life with billions of pieces of content uploaded every day. Much of this publicly accessible information offers a rich resource for various areas of research. The vast volume of data presents both opportunities and risks for society, especially with the growing power of machine learning which is particularly effective at analyzing large datasets. In this paper, we developed an accurate personality prediction system using convolutional neural networks (CNN) and random forest (RF) to predict personality traits using Instagram data. The personality prediction model developed in this study is based on the Big Five Personality traits which are Extraversion, Agreeableness, Conscientiousness, Neuroticism, and Openness. A group of 941 participants was recruited and their Instagram data was collected with their consent. Two pretrained convolutional neural networks (CNNs) were employed to extract features from the images. These features were then used to train five RF models each corresponding to one of the Big Five traits. Our proposed model achieved an average mean absolute error of 0.1867 across all traits. Compared to the PAN-2015 benchmark, our model achieved competitive performance matching existing methods.
Keywords:
Personality prediction
; machine learning
; big five personality
; Extraversion
; Agreeableness
; Conscientiousness
; Neuroticism
; Openness
1. Introduction
With the advent of the internet the amount of data being created and collected is truly immense. With about 2.5 quintillion bytes of data being generated each day [1] and with a sizable portion of that data coming from social media sites, it has become a goldmine for researchers. With billions of active users on social media sites [2] there is an abundance of data which can be used to find patterns and correlations between personality and digital footprints. This can be achieved by using machine learning to analyse the data and create correlations between user personality and their social media data [3]. Identifying personality traits through digital patterns enables applications in counselling, recruitment, and finance to personalize services, improve decision-making, and enhance user experiences [4].
Instagram is a social media platform owned by Meta [5]. Instagram enables users to upload and share images and videos with their followers who can view, like, and comment on the posts. As the fourth most popular social media platform globally, it boasts over 1.5 billion active users [6]. The platform generates a vast amount of data daily. This present a significant challenge in terms of efficient data collection. This process is complicated by ethical and technical considerations particularly since the data is user-generated and may contain personally identifiable information. Application Programming Interfaces (APIs) offer a method for gathering data in an efficient and timely manner provided that user consent has been obtained. To analyse and predict future personality traits, participants' personalities should be assessed using established frameworks such as the Big Five Inventory (BFI), the Big Five Inventory-10 (BFI-10), the International Personality Item Pool (IPIP), or the Ten Item Personality Measure (TIPI) [7].
While the highlighted personality models are considered effective for Conscientiousness with a proven dominance effect, they are limited in some extent [8]. For instance, with the dynamic nature of social media platforms like Instagram, individuals are frequently exposed to curated content, social comparisons, and changing social norms. This environment can influence behaviour and self-presentation, potentially leading to shifts in personality traits over time particularly traits like Conscientiousness. As a result, models that assume trait stability may become less accurate in predicting behaviour.
To address the aforementioned issues, this paper proposes two distinct network personality models. First, we propose a CNN model to analyse patterns within Instagram users’ photos. Second, we propose a RF algorithm that trained on both Instagram users’ metadata and the processed outputs from the CNN to predict users’ personalities. Volunteers using Instagram were recruited to make a dataset for this research. The volunteer's personality test was recorded on a spreadsheet to allow the data to be easily passed into the program in an organised way for easy analysis. The data was extracted from the spreadsheet, and the personalities of the volunteers were calculated.
To analyse the volunteer's data, it was first collected by downloading it from Instagram using their public APIs. Images contained important data for this research, so pretrained CNNs were used to extract relevant personality-related features from them. A Random Forest algorithm was then created and used all data points including processed data from the CNN and other recorded inputs to make a final prediction of user's personality. Users uploaded their own Instagram data into the personality prediction system, which was then analysed and the results were displayed. This research made the follow contributions:
- We propose a novel personality prediction framework that estimates the Big Five personality traits (Extraversion, Agreeableness, Conscientiousness, Neuroticism, and Openness) from Instagram image data by leveraging two pretrained convolutional neural networks (CNNs) for robust feature extraction. The model explicitly addresses the challenge of generalizability across diverse populations to mitigate social desirability bias.
- We present a hybrid methodology for personality inference that integrates CNNs with ensemble learning through Random Forest regressors. Comprehensive hyperparameter optimization is employed to maximize predictive performance.
- We conduct a critical review of machine learning approaches to personality prediction to highlight their strengths and limitations to contextualize the proposed model.
The structure of this paper is as follows: Section 2 reviews related literature on personality prediction methodologies, including reliability assessments and a comparative analysis of existing approaches. Section 3 outlines the comprehensive methodology for model development, covering stages from data acquisition and feature extraction to prediction modelling. Section 4 presents the experimental findings, discusses evaluation metrics, and benchmarks the proposed model against established personality prediction frameworks. Finally, Section 5 concludes the study by highlighting the implications of the results and proposing directions for future research in personality detection.
2. Related Works
To effectively contextualize the research on Personality Prediction Model from Instagram Users Using Machine Learning, it is essential to examine the foundation laid by prior studies in the domain of computational personality assessment. A study was conducted employing Generalizability Theory to evaluate the reliability of the Big Five Inventory (BFI) [9]. Reliability was assessed using Cronbach's Alpha, with a score greater than 0.7 deemed acceptable, and through Test-Retest reliability, where a coefficient above 0.75 is considered acceptable. The study found that the Big Five Inventory was reliable based on both its internal consistency (Cronbach's Alpha) and its stability over time (Test-Retest reliability). The proposed model in this paper relies on reliable personality assessments like the BFI to evaluate and compare its predictions. If the machine learning model accurately predicts personality traits, it should ideally correlate with these reliable BFI measures.
In [10], the study indicates that the Five-Factor Model (FFM) may not be universally applicable across all societies. The authors argue that the FFM serves as a valid measure of personality primarily in literate and urbanized contexts. This suggests that machine learning models based on FFM might be less effective or less accurate in rural or non-literate societies just as the FFM might not universally apply across all cultures. As societies become more literate and urbanized, they adopt more complex systems of identity, social roles, and psychological expressions that FFM can measure [11]. Non-literate or rural societies which are more likely to rely on oral traditions, less formalized structures of communication, and community-based relationships may not exhibit personality traits in ways that align with FFM. The absence of certain markers such as the use of language or social media interactions as proxies for openness or extraversion in such societies could skew the FFM model’s effectiveness [12].
In [13], the authors collected Facebook user profiles and status updates to develop a system aimed at predicting individual personality traits based on social media activity. The study employed the Big Five Personality Model as the theoretical framework for personality classification. Distinct from previous research that predominantly utilized traditional machine learning approaches, this work investigates the applicability of deep learning techniques, achieving a classification accuracy of 74.17%. The model use of real-world Facebook profiles and status updates enhances ecological validity which provides insights into naturally occurring digital behaviour [14]. However, a significant limitation lies in its reliance on the Big Five Personality Model that may not generalize well across diverse cultural contexts. A data driven and multimodal deep learning trait model like the CNNs will adopt cultural generalization using regional fine-tuning for high validity and domain adaptation through image, text, and social interaction patterns.
Recent advancements in affective computing and sentiment analysis have increasingly focused on the automatic identification of personality traits from textual data. Earlier approaches primarily relied on handcrafted feature engineering techniques such as linguistic style analysis and psycholinguistic resource utilization, to identify correlations with personality dimensions. However, the field has seen a paradigm shift with the advent of transfer learning in natural language processing (NLP) [15] particularly through the use of pre-trained language models that allow for both feature extraction and fine-tuning.
A study [16] proposed a deep learning-based framework that integrates both data-level and classifier-level fusion to enhance personality classification. using NLP models with increase in classification accuracy by approximately 1.25%. However, important personality bias such as opinions and mood were not captured by the model. In [17], a deep learning framework for multimodal personality prediction was proposed. The model integrated visual, auditory, and textual information. Facial signs and contextual scene elements were extracted via Multi-task Cascaded Convolutional Networks (MTCNN) and ResNet. While the model explored both feature concatenation and attention-based mechanisms to enhance multimodal integration, limited set of image inputs were used.
Similarly, the research in [18] provided a comprehensive review of the current landscape in automated personality trait prediction, with a strong emphasis on multimodal deep learning-based approaches. It systematically analyses and synthesizes the state-of-the-art machine learning models. The findings of this research highlight the growing potential of machine learning driven systems in understanding human behavior which significantly enhances applications in different fields such as recruitment, marketing, education, and human-computer interaction. As summarized in Table 1, these existing personality prediction models have limitations.
One of the key limitations is that the studies excluded psychological perspectives and focused solely on computational methods. This narrows the contextual understanding of personality traits and may limit the integration of interdisciplinary insights necessary for holistic personality modelling [19]. Building upon these findings, our study uses Instagram’s image-rich environment as a primary data source for data collection and feature extraction. This aligns with recent trends in affective computing where vision-based models complement traditional textual analyses to improve prediction.
3. Materials and Methods
3.1. Data Collection
Data acquisition was initiated by creating a Microsoft form comprising an informed consent section and a structured questionnaire consisting of 44 items. These items were designed to capture Instagram respondents' personality characteristics to enable a quantitative assessment based on the Big Five Personality Traits model. The questionnaire was disseminated through LinkedIn posts and Instagram stories accompanied by an invitation for voluntary participation. Over an eight-week collection period, a total of 941 individuals consented and participated. Each respondent was subsequently asked to confirm their submission to ensure the correct linkage of their Instagram profile to the dataset.
The responses collected via Microsoft forms were then exported directly into Microsoft excel using the platform’s native export functionality. This was to facilitate streamlined data organization and preprocessing. All tools employed for data collection, as well as the source code for the components of the final personality prediction models are publicly accessible at: https://github.com/JoshuaBryan02/Personality-Prediction-System. However, the dataset used in this study cannot be shared publicly due to the inclusion of personally identifiable information from Instagram participants. Figure 1 presents a detailed flow diagram illustrating the systematic development process of the proposed personality prediction system.
3.2. Data Extraction
A Python script titled CSV-splitting.py (can be accessed here: https://github.com/JoshuaBryan02/Personality-Prediction-System/blob/main/JoshuaBryan_Final_Code/CSV-splitting.py) was developed to automate the processing of raw data collected via Microsoft Forms. The script performs separates the consent form from the personality assessment data and computes individual personality trait scores. Initially, file path variables are defined to locate the questionnaire responses. The program checks whether it has been executed previously, prompting the user to confirm if a reload is necessary. If running for the first time or reloading is approved, the script sequentially executes three custom-defined functions. The first function, convert_xlsx(), utilizes the pandas library to convert the excel formatted dataset into a comma-separated values (CSV) format for streamlined processing.
The second function split_csv() parses the converted CSV file and separates it into two distinct files: Consent_Form.csv and Personality_Test.csv. This contains the respective data. The third function Personality_calculation() reads the Personality_Test.csv file and initializes data structures to store personality scores. These include five lists corresponding to the Big Five Inventory (BFI) traits [20] with lengths equal to the number of valid participants. Algorithm 1 presents personality scores calculation approach. As shown in Figure 2, a systematic sequence of preprocessing and implementation steps was employed to ensure the effective development of the prediction model.
A nested loop is implemented where the outer loop iterates through each participant (data point) and the inner loop processes responses to the 44 BFI questions. This procedure enables trait-wise score calculation [21] by aggregating and interpreting individual responses according to the BFI scoring scheme. Each response was scored in accordance with the Big Five Inventory (BFI) guidelines [22] with individual data points allocated to one of the five personality traits based on the corresponding questionnaire item. During each iteration of the outer loop, the counter advanced to the next index, effectively separating responses by participant. To accommodate items requiring reverse scoring, a custom function was implemented. This function performs a transformation such that a score of 5 is converted to 1, 4 to 2. This aligns with the BFI’s reversed scoring mechanism [23]. The function is invoked conditionally based on the reverse-coded nature of specific questions as presented in Algorithm 2.
Following the assignment and adjustment of trait scores, the raw values were normalized to facilitate comparative analysis. Normalization was achieved using min-max scaling by transforming the values to a [0, 1] range which were subsequently multiplied by 100 to yield percentage-based scores for interpretability. The minimum possible score for a trait corresponds to the number of questions associated with that trait (assuming a score of 1 per item), while the maximum is calculated as the number of items multiplied by the maximum score of 5. After normalization, the resulting scores for all five traits were compiled into a list and appended as a new row to a CSV file named Normalized_Traits.csv. This is to support model analysis and visualization.
| Algorithm 1 Personality Scores Calculation | |
| Input: | Personality_Scores_Dataset |
| Output: | Lists of calculated scores for each of the five personality traits |
| 1. | dataset Load_Personality_Test () |
| 2. | convert loaded_data into list of values() |
| 3. | set counters() |
| 4. | fix variable |
| 6. | with |
| 7. | compute_scores_and_update_initialised_lists |
| 8. | return display_results_for_lists_containing_scores(extraversion, agreeableness, conscientiousness, neuroticism, openness) |
| Algorithm 2 Reverse Code | |
| Input: | Number_to_reverse [1 to 5] |
| Output: | Reversed_score |
| 1. | define close interval () |
| 2. | check and reverse score: |
| 3. | if 1 <= number_to_reverse <= 5: |
| 4. | endif |
| 5. | output = 6 (number_to_reverse) |
3.3. Instagram API Instaloader
A Python script, Data_collection.py is created using the Instaloader library to facilitate the automated extraction of user data from Instagram. Initially, variables were declared to specify the file paths of both the pre-existing Consent_Form.csv file and a new output file (Instagram_data.csv) which is generated during the data collection process. For training the personality prediction system, usernames and dates of birth are extracted from the Consent_Form.csv file which is generated by a preceding script CSV-splitting.py. These values are then transformed into a list for processing. When the system is employed to predict the personality of a new individual, the corresponding Instagram username and date of birth are manually provided by the user and appended to the input list.
An instance of the Instaloader class is initialized to handle data acquisition from Instagram with parameters configured to restrict retrieval to user posts and video thumbnails. An overview of the automated Instagram data extraction pipeline is presented in Algorithm 3. The script iterates over each retrieved post using a for loop. For each post, the posting date is compared against the volunteer’s eighteenth birthday. Posts made prior to this age threshold are excluded from further analysis. Posts made on or after this date are downloaded using the initialized Instaloader instance. The retrieved content is saved in a directory named after the user's Instagram handle.
To mitigate the risk of surpassing Instagram’s API rate limits, a randomized delay is introduced between post retrieval iterations. This delay ranges from 20 to 50 seconds to generate a pseudo-random number generator implemented through a sleep function. The program prompts the user to input their Instagram username which is used by a pre-initialized instance of the Instaloader class to retrieve the corresponding session cookie. This session is then imported into the program. This process allows the instance to operate within an authenticated environment. A loop is then implemented to iterate through a predefined list of usernames. During each iteration, a temporary list is instantiated to store the data associated with the current user. The username is extracted and sanitized by removing any leading '@' characters which were occasionally appended by volunteers when submitting their Instagram identifiers.
| Algorithm 3 Automated Extraction of Instagram User Data | |
| Input: | Instagram_user_profile_object |
| Output: | Username_ Identifier_used_with_downloader_posts |
| 1. | get_posts(from_the_user_profile) |
| 2. | check if a folder with the name_ username exists: |
| 3. | if it does not exist, |
| 4. | iterate through the_user’s_posts using |
| 5. | dropwhile skip posts created before the user’s_eighteenth_birthdate |
| 6. | takewhile process posts created after the eighteenth_birthday |
| 7. | create folder_path by joining output_folder and username. |
| 8. | for each qualifying post: |
| 9. | download the post into the folder named after the_user |
| 10. | randomise delay |
| 11. | if counts >150: |
| 12. | end if |
| 13. | end for |
| 14. | return display_results (file_paths, username, dates_of_birth, posts) |
In each iteration of the loop, the birthdate corresponding to the volunteer is extracted and converted into a Python datetime object using the strptime function. To compute the date on which the volunteer attained the age of eighteen, a time delta object equivalent to 18 years is added to the original birthdate. When initiated, the volunteer’s Instagram profile is accessed by invoking the Profile.from_username method which requires the Instagram username. This uses a pre-configured Instaloader instance to authenticate the session and enforce download constraints. Once the profile object is instantiated, essential account metadata such as username, total number of media posts, follower count, and number of followees is extracted. These data are appended as a new entry to an output CSV file named Instagram_data.csv. A get_posts method is created to retrieve metadata for all posts associated with the profile including download paths. Prior to initiating the download process, the script verifies the existence of a directory designated for the current user's posts to avoid redundant downloads.
3.4. Model Description
The Places_365 convolutional neural network (CNN) [24] was employed to extract contextual features from the background of social media images, while the YOLOv8 model [25,26] was used to estimate the number of individuals depicted in each image. A CSV file named Image_Paths.csv was generated to store the file paths of the downloaded Instagram posts. A for loop iterated over a list of Instagram usernames, each of which was preprocessed to remove any leading '@' symbol. For each user, a variable was defined to specify the path to the directory containing their downloaded images. Another for loop was used to traverse all files within the user's directory by appending the file paths of individual posts to a list. The collected paths were then written as new rows into the Image_Paths.csv file as illustrated in Algorithm 4. Following this, the image paths were loaded from the Image_Paths.csv file and converted into a Python list for further processing. The file labels_sunattribute.txt contains the class labels required by the model which reads line by line with each line appended to a list.
A conditional check was implemented to verify the existence of the label_encoder_CNN1.pkl file. If the file was not found, a new instance of the LabelEncoder class was initialized and fitted using the compiled list of labels. The fitted encoder was then serialized and saved to label_encoder_CNN1.pkl using the pickle module. Similarly, if the file already existed, it was deserialized and loaded into the program. The script CNN2.py begins by defining a variable to store the output path for the People_Count_features.csv file which contains the features extracted by the CNN. An empty list was initialized to store the extracted features during the execution cycle and the corresponding image file paths were retrieved for processing.
| Algorithm 4 Data Preprocessing | |
| Input: | Username_list |
| Output: | Store_image _paths |
| 1. | if Image_paths file exists: |
| 2. | dele the file |
| 3. | else, |
| 4. | open the Image_paths |
| 5. | for each username in username_list: |
| 6. | if username starts ‘@’, remove ‘@’ from the beginning |
| 7. | create folder_path by joining output_folder and username. |
| 8. | for each file in the directory folder_path: |
| 9. | create img_path by joining folder_path and file |
| 10. | append img_path to user_paths |
| 11. | return user_paths as Image_paths |
A nested while loop was created to iterate through all image paths and extract the associated features. The outer loop concluded by computing the frequency of each individual's appearance across all volunteer posts. The loop was subsequently normalized by the total number of images. The resulting normalized frequency was appended to the feature list. Thereafter, the set of normalized frequencies for each volunteer was further scaled to the range [0, 1] with a small constant added to mitigate division-by-zero errors. In training mode as specified by the user prompt, the maximum and minimum values used in the normalization process were stored in a pickle file. These values were retrieved from the pickle file to ensure consistent normalization of the input data. Finally, the normalized feature list was transformed into a Pandas data frame and exported as a CSV file titled People_Count_features.csv.
A Python-based implementation titled Random_Forest.py was developed to construct a personality prediction pipeline utilizing environmental and social media-derived features based on the Instagram metadata. The initial stage involved defining file paths for all requisite datasets including Final_Dataset.csv. Two feature sets namely Environment_features.csv and People_Count_features.csv were loaded independently into Pandas data frames and subsequently concatenated to form a unified feature matrix. In parallel, Instagram_data.csv was loaded into a separate data frame. its columns were iteratively normalized using min–max scaling within a while-loop construct. The maximum and minimum values employed during normalization were serialized using the pickle module to ensure consistency during future inference. Normalized_Traits.csv was imported and integrated with the composite feature to produce the final training dataset which was saved as Final_Dataset.csv. This concluded the data preprocessing phase.
A function named Random_Forest_Tuning was executed. This function ingested the Final_Dataset.csv, converting its contents into a NumPy array. The features were defined as all columns excluding the final five, which represented the target personality traits. Given the presence of low-variance features potentially detrimental to model performance, Principal Component Analysis (PCA) [27] was employed to retain components explaining 95% of the total variance. The trained PCA model was serialized for reuse in subsequent stages. A Random Forest Regressor was instantiated, and hyperparameter optimization was performed via exhaustive grid search. This procedure evaluated multiple hyperparameter configurations using a 4-fold cross-validation scheme, where each fold held out one subset for validation and used the remaining data for training. For each configuration, the Mean Absolute Error (MAE) [28], Mean Squared Error (MSE) [29], and Root Mean Squared Error (RMSE) [30] were calculated. The average of these metrics across all folds was used to identify the optimal hyperparameter set. The results were compiled into a CSV file, sorted by MAE for ease of interpretability. To further assess the influence of individual hyperparameters, a separate analysis module, Ranking_Parameters.py, was implemented. This script parsed the grid search output, extracting and analyzing hyperparameter-specific columns. A defaultdict structure was utilized to associate parameter values with their corresponding performance ranks. For each parameter, the average rank and standard deviation were computed to assess both effectiveness and stability. These results were presented in a tabular format, enabling informed selection of consistently high-performing configurations. Additionally, to account for stochastic effects, the random_state parameter was varied across 20 random seeds (ranging from 0 to 10,000), ensuring robust evaluation.
Following hyperparameter selection, final model training was conducted using the Random_Forest.py script. The Final_Dataset.csv was reloaded, and identical preprocessing steps were applied, including PCA transformation. For each of the Big Five personality traits, the corresponding labels were extracted. The dataset was partitioned into training and testing subsets using Scikit-learn's train_test_split function. A Random Forest model was then trained using the optimal hyperparameters, and its performance was assessed on the test set using standard regression metrics: standard error, standard deviation, MAE, MSE, and RMSE. Additionally, scatter plots of predicted versus actual values were generated for each trait, with trait labels displayed in the plot titles to facilitate interpretation. Each trained model was serialized and saved with filenames reflecting the personality trait being predicted.
A graphical user interface-based application name Personality_Prediction_System (https://github.com/JoshuaBryan02/Personality-Prediction-System/blob/main/JoshuaBryan_Final_Code/Personality_Prediction_System.py) was created to facilitate personality trait inference. Upon initialization the system defines file paths and loads the machine learning models serialized in pickle format. Users are guided through a step process beginning with a brief overview of usage instructions. The application contained two primary functions. The first Create_Dataset replicates the data preparation workflow from Random_Forest.py but excluded label extraction. This saves the processed features to Predict_Dataset.csv for inference. The second function called Predictions transforms the dataset into a NumPy array and then applied PCA using the preloaded model. It then utilized the five independent RF models to predict each Big Five trait. The raw outputs were converted to percentages and rounded decimal places for easy interpretation. Apart from the csv files and functions which contain PII, the rest of the codes and functions included in the model development can be found in the data availability statement section.
4. Results and Discussion
This section presents a concise result of this study with a summary of the results evaluation based on the metrics used to assess the performance of the personality prediction system. It also discusses the corresponding outcomes and potential factors that may have influenced these results.
4.1. Performance Evaluation
The personality prediction framework employs five distinct non-linear multivariate regression models. As these models operate independently, a comprehensive evaluation of each is necessary to assess their individual predictive capabilities. The system's overall performance may vary depending on the specific personality trait being estimated. Equations (1)-(5) are the mathematical representation of how the standard deviation (δ), Standard Error (SE), Mean Absolute Error (MAE), Mean Squared Error (MSE), and Root Mean Squared Error (RMSE) of the model calculation.
The first evaluation metric applied is the standard deviation [31] which estimates the dispersion of either the actual or predicted personality trait scores around their mean. It measures how much the predicted values deviate from the sample mean u of the sample size n. By measuring the variability of prediction errors, δ provides insight into the uncertainty associated with the model’s estimates which provides a statistical range within which the true value is likely to fall. The second evaluation metric employed is the Standard Error (SE) [32], which estimates the precision of the predicted personality trait scores (e.g., the Big Five traits) by quantifying the extent to which these predictions deviate from the sample mean. While conceptually related to the standard deviation, the SE offers a narrower and more precise confidence interval for the estimation of the true values.
The third evaluation metric employed is the Mean Absolute Error (MAE) [33], which quantifies the average magnitude of the errors between the predicted values and the actual personality scores without considering their direction. A lower MAE value reflects a higher predictive accuracy of the model in capturing personality traits. The fourth evaluation metric employed is the Mean Squared Error (MSE) [34], which quantifies the average of the squared differences between the predicted and actual personality scores. By assigning greater weight to larger errors, MSE is particularly advantageous in personality prediction tasks, where extreme deviations are of greater significance. The final evaluation metric employed is the Root Mean Squared Error (RMSE) [35], defined as the square root of the Mean Squared Error (MSE). In the context of personality prediction, RMSE offers a more interpretable measure of prediction error, facilitating direct comparison with standard personality scale ranges, such as those spanning from 1 to 5 or 0 to 100.
4.2. Parameter Sampling
The model parameters and corresponding evaluation metrics are summarized in Table 2. Among the five personality traits, Conscientiousness yielded the highest mean absolute error (MAE) with an average prediction deviation of 0.119 (11.9%). This implies that for a predicted Conscientiousness score of 0.50, the actual value may deviate by approximately ±0.119. It also exhibited the highest root mean square error (RMSE) indicating the presence of comparatively larger individual prediction errors. In contrast, Agreeableness achieved the most accurate performance with the lowest MAE, RMSE, and other evaluated metrics. While these results suggest strong model performance, exclusive reliance on these metrics may lead to an overestimation of the models' generalizability. We consider exploring other evaluation metrics in our future research.
To assess the overall performance of the personality prediction system across the Big Five traits which are Extraversion (E), Neuroticism (N), Agreeableness (A), Conscientiousness (C), and Openness to Experience (O), the arithmetic mean (A.M.) of the predicted values for each trait was calculated. Among these, Openness to Experience exhibited the highest mean score indicating that the model is particularly effective in capturing features associated with this trait from the Instagram input data. Equally, Conscientiousness demonstrated the lowest mean value which suggests a scarcity of distinctive features relevant to this dimension in the dataset. These findings are summarised in Table 3.
4.3. Traits
To complement the quantitative evaluation, the performance of each model is further illustrated using scatter plots that compare predicted and actual values on the test dataset. Both axes in these plots are normalized to the [0, 1] range with the x-axis representing the ground truth and the y-axis showing the corresponding model predictions. A reference line (y = x) is included to denote perfect prediction alignment. The closeness of data points to this diagonal line offers a visual indication of predictive accuracy where points near the line reflect high precision while deviations suggest underestimation or overestimation. This visualization approach provides understanding into each model’s bias and variance. Figure 3 presents the individual prediction plots for each personality trait.
An analysis of the predictive distributions across the five personality traits reveals consistent clustering patterns. The model's predictions for Extraversion are predominantly centered around 0.6, Agreeableness around 0.7, Conscientiousness near 0.6, Neuroticism approximately 0.5, and Openness around 0.6. This consistent concentration suggests that the model demonstrates a degree of stability and reliability in estimating personality scores with predictions falling within relatively narrow confidence intervals. These clustering tendencies indicate the model's capacity to capture underlying patterns associated with personality traits with reasonable accuracy. But the limited variance observed across trait predictions may indicate a potential constraint in the model’s sensitivity to individual differences. Addressing this issue could enhance the model’s discriminatory capability and improve its ability to represent the broader spectrum of personality variation.
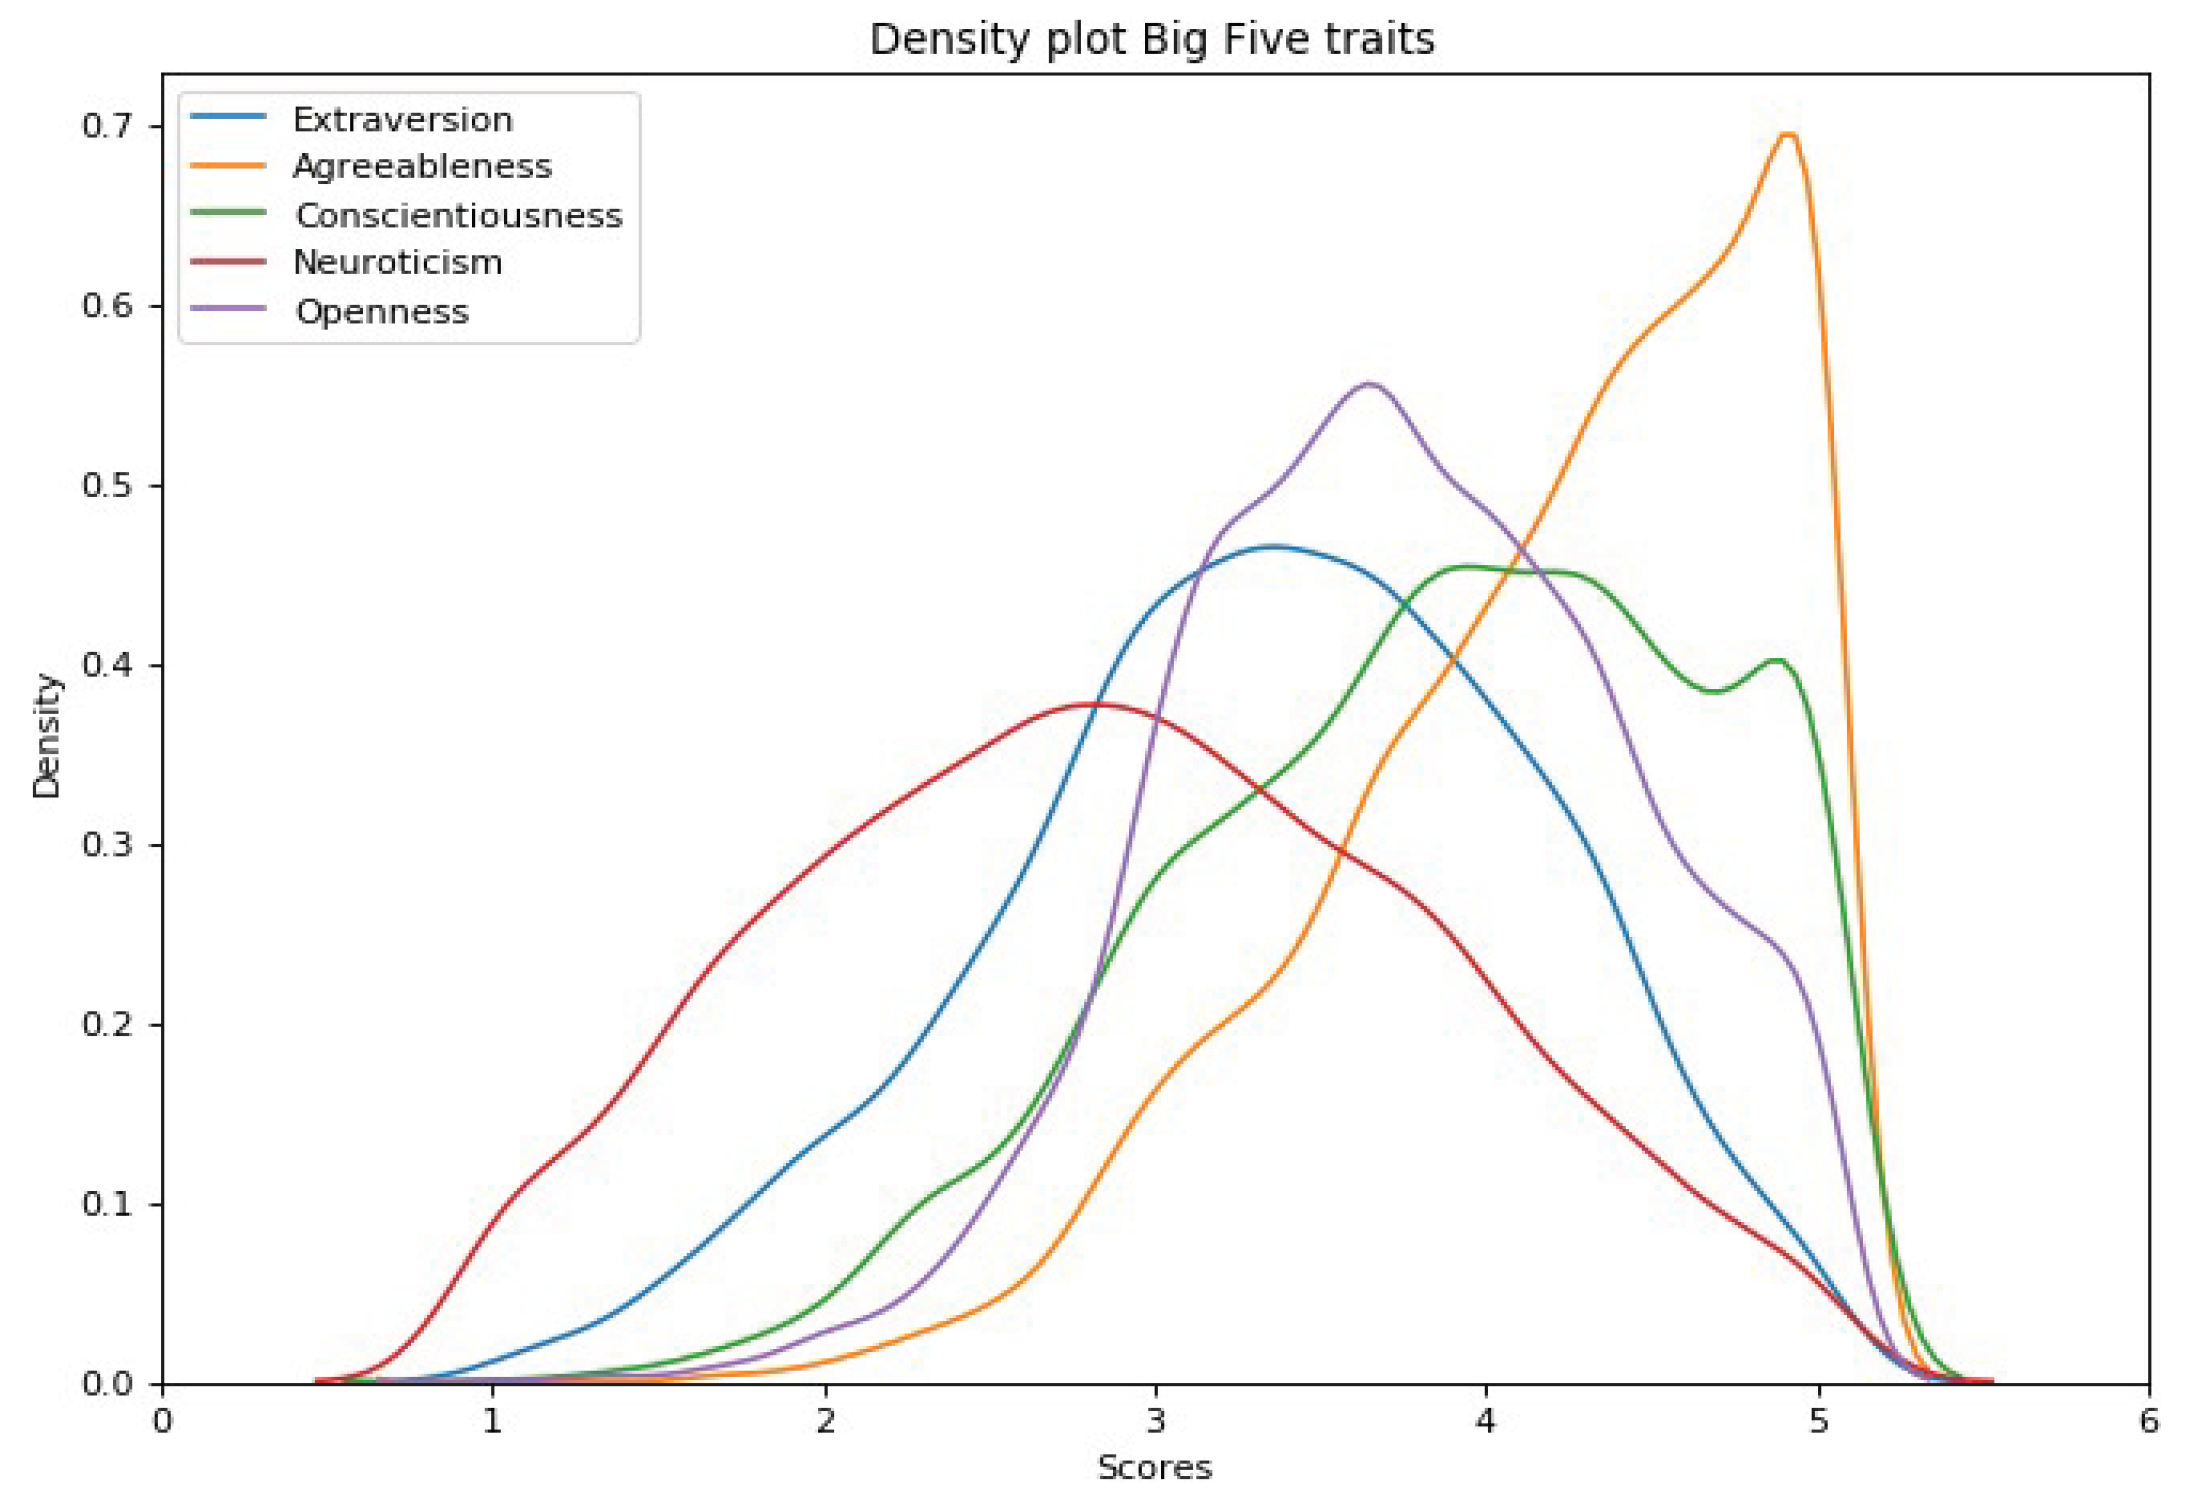
To contextualize our findings, a comparative analysis was conducted using the results presented in [36], which involved data from over 6,000 participants. In that study, personality trait distributions were illustrated using a line graph (Figure 4). It employed a scale ranging from approximately 0.5 to 5.5, differing from the conventional 0 to 5 scale. Each 0.1 increment on this adjusted scale is roughly equivalent to a 0.2 (or 20%) shift on the scale used in the current study. A close inspection of the distribution peaks across the five traits in [36] reveals substantial alignment with the predicted values produced by our model. This convergence provides supporting evidence of the model’s effectiveness in capturing the central tendencies of personality traits particularly as the sample size of Instagram users increases. Such alignment is not unexpected as traits with higher population frequencies are more likely to be reflected in prediction concentrations around corresponding values.
However, it is important to note a limitation of our model which is the underrepresentation of predictions at the extreme ends of the trait range. This limitation is likely attributable to the relatively constrained size and diversity of the dataset used during training. Future research will aim to address this shortcoming by incorporating a broader and more heterogeneous set of Instagram user profiles to improve generalizability and sensitivity across the full spectrum of personality traits.
Figure 8.
Personality Traits values predicted in [36].
Figure 8.
Personality Traits values predicted in [36].
To contextualize the performance of the proposed model, a comparative evaluation was undertaken against the benchmark results reported in the PAN-2015 personality prediction challenge as presented in Table 4. The PAN-2015 dataset was selected for comparison due to its adoption of the widely recognized Big Five personality traits framework and its considerable scale encompassing 27,344 tweets. The experimental results indicate that the proposed model outperforms the PAN-2015 baseline which can be attributed to its advanced feature extraction techniques and its robustness in processing large-scale and noisy social media text. This comparative analysis highlights the effectiveness and scalability of the proposed approach in personality trait prediction, thereby supporting its applicability in real-world settings.
The proposed model exhibits competitive predictive performance across the five personality dimensions. While the absolute metric values differ from those reported in the PAN-2015 benchmark, it is noteworthy that the present approach incorporates novel feature extraction and modeling strategies aimed at improving generalizability and adaptability across diverse datasets. The model achieves an overall average metric score of 0.1867 surpassing the PAN-2015 baseline average of 0.1590. A trait-specific analysis reveals a heterogeneous pattern of performance. Our model demonstrates improved accuracy in predicting Neuroticism (0.3671 vs. 0.2262) and Extraversion (0.1609 vs. 0.1492) suggesting increased sensitivity to these dimensions. Equally, PAN-2015 achieves slightly superior outcomes in Agreeableness (0.1492 vs. 0.1039) and Openness (0.1690 vs. 0.1520) potentially indicating a better capture of these specific traits. Predictions for Conscientiousness are relatively comparable between the two models (0.1640 vs. 0.1509) reflecting similar modeling capacity for this trait. These variations may be attributed to differences in feature engineering and underlying model design.
5. Conclusions
The purpose of this project is to help further the research in the field of personality prediction. An accurate personality prediction system would be extremely beneficial when hiring new candidates by employers. The personality prediction model could help employers find candidates that suit the job role much fasters than shortlisting hundreds of applicants for interview. Also, the candidates could find a job that is more suited to their personality. This could make the employees be more satisfied and thus more productive in their job roles or positions. This will sustain development goals for economic growth and productivity.
This study presents a comprehensive literature review that establishes the theoretical foundation and methodological framework for personality prediction system. The paper critically evaluates the validity and reliability of the Big Five Inventory (BFI) affirming its status as a widely accepted benchmark for personality assessment. In this paper, we developed a personality prediction system using CNN and Random Forest algorithms. The research question that guided the development of this model is “Can a personality prediction system created by analyzing data from Instagram accounts with a focus on feature extraction from images be considered accurate when evaluating different regression scoring metrics?”
This model was evaluated by looking at the metrics that each of the models created. Multiple machine learning models were trained and evaluated using key statistical performance metrics including Standard Deviation (SD), Standard Error (SE), Mean Absolute Error (MAE), Mean Squared Error (MSE), and Root Mean Squared Error (RMSE). The results demonstrate that features extracted from images are effective in predicting personality traits with appreciable accuracy. The best-performing model achieved an average MAE of 0.1867 across all traits with individual trait-specific errors ranging from 0.1039 for Agreeableness to 0.3671 for Neuroticism.
In comparison, the PAN-2015 benchmark reported an average MAE of 0.1590. even though our model demonstrated high performance, the significantly lower error for Neuroticism (0.03676) indicates limitation which is underrepresentation of this trait in the Instagram-derived image features due to the small number of data samples used this this study. In the future, a study with a larger dataset needs to be conducted if a concrete conclusion has to be found.
Author Contributions
Conceptualization, J.D.B. and M.A.; methodology, J.D.B.; software, N.O.; validation, J.D.B. and M.A.; formal analysis, J.D.B.; data curation, J.D.B.; writing—original draft preparation, M.A.; writing—review and editing, N.O; visualization, M.A.; supervision, M.A.; project administration, J.D.B. All authors have read and agreed to the published version of the manuscript.
Funding
This research received no external funding.
Data Availability Statement
All tools employed for data collection as well as the source code for the model are publicly accessible at: https://github.com/JoshuaBryan02/Personality-Prediction-System. However, the Instagram dataset generated and used in this study cannot be shared publicly due to the inclusion of personally identifiable information from Instagram participants. This data is not made public due to privacy concern.
Conflicts of Interest
The authors declare that they have no known financial or personal relationships that could have appeared to influence the work reported in this manuscript. They confirm that there are no conflicts of interest that could compromise the integrity, objectivity, or impartiality of the research presented.
References
- Manodee, N. K. Pandey, A. K. Mishra, and A. Kumar, “DNA Data Storage: A Solution to the Growing Digital Data Dilemma,” in 2024 2nd International Conference on Disruptive Technologies, ICDT 2024, Institute of Electrical and Electronics Engineers Inc., 2024, pp. 1374–1379. [CrossRef]
- Kanchan, S.; Gaidhane, A. Social Media Role and Its Impact on Public Health: A Narrative Review. Cureus 2023, 15, e33737. [Google Scholar] [CrossRef] [PubMed]
- Shah, A.; Varshney, S.; Mehrotra, M. Detection of Fake Profiles on Online Social Network Platforms: Performance Evaluation of Artificial Intelligence Techniques. SN Comput. Sci. 2024, 5, 1–15. [Google Scholar] [CrossRef]
- Liberati, C.; Camillo, F. Personal values and credit scoring: new insights in the financial prediction. J. Oper. Res. Soc. 2018, 69, 1994–2005. [Google Scholar] [CrossRef]
- Yang, C. Research in the Instagram Context: Approaches and Methods. J. Soc. Sci. Res. 2021, 15–21. [Google Scholar] [CrossRef]
- M. J. Shayegan and F. Karimi, “When is the most Effective Time to Post on Instagram to Increase Engagement Rate?,” International Journal of Web Research, vol. 6, no. 2, pp. 43–55, 2023. [CrossRef]
- Thørrisen, M.M.; Sadeghi, T. The Ten-Item Personality Inventory (TIPI): a scoping review of versions, translations and psychometric properties. Front. Psychol. 2023, 14, 1202953. [Google Scholar] [CrossRef]
- Christian, H.; Suhartono, D.; Chowanda, A.; Zamli, K.Z. Text based personality prediction from multiple social media data sources using pre-trained language model and model averaging. J. Big Data 2021, 8, 1–20. [Google Scholar] [CrossRef]
- Arterberry, B.J.; Martens, M.P.; Cadigan, J.M.; Rohrer, D. Application of Generalizability Theory to the Big Five Inventory. Pers. Individ. Differ. 2014, 69, 98–103. [Google Scholar] [CrossRef]
- Supplemental Material for How Universal Is the Big Five? Testing the Five-Factor Model of Personality Variation Among Forager–Farmers in the Bolivian Amazon. J. Pers. Soc. Psychol. 2012. [CrossRef]
- M. MacLachlan and J. McVeigh, Macropsychology: A population science for sustainable development goals. Springer International Publishing, 2021. [CrossRef]
- Giorgi, S.; Le Nguyen, K.; Eichstaedt, J.C.; Kern, M.L.; Yaden, D.B.; Kosinski, M.; Seligman, M.E.P.; Ungar, L.H.; Schwartz, H.A.; Park, G. Regional personality assessment through social media language. J. Pers. 2021, 90, 405–425. [Google Scholar] [CrossRef]
- Tandera, T.; Hendro; Suhartono, D; Wongso, R.; Prasetio, Y.L. Personality Prediction System from Facebook Users. Procedia Comput. Sci. 2017, 116, 604–611. [Google Scholar] [CrossRef]
- Supplemental Material for Ecological Validity of Trait Emotion Regulation Strategy Measures. Psychol. Assess. 2020. [CrossRef]
- Zhang, P.; Zhang, D.; Zhao, X.; Zhao, X.; Iqbal, M.; Tuerxunmaimaiti, Y.; Zhao, Q. Natural language processing-based deep transfer learning model across diverse tabular datasets for bond strength prediction of composite bars in concrete. Comput. Civ. Infrastruct. Eng. 2024, 40, 917–939. [Google Scholar] [CrossRef]
- El-Demerdash, K.; El-Khoribi, R.A.; Shoman, M.A.I.; Abdou, S. Deep learning based fusion strategies for personality prediction. Egypt. Informatics J. 2022, 23, 47–53. [Google Scholar] [CrossRef]
- Suman, C.; Saha, S.; Gupta, A.; Pandey, S.K.; Bhattacharyya, P. A multi-modal personality prediction system. Knowledge-Based Syst. 2022, 236. [Google Scholar] [CrossRef]
- G. S. Nagaraja and S. Revathi, “Multimodal Personality Prediction Using Deep Learning Techniques,” in 7th IEEE International Conference on Computational Systems and Information Technology for Sustainable Solutions, CSITSS 2023 - Proceedings, Institute of Electrical and Electronics Engineers Inc., 2023. [CrossRef]
- Liu, W.; Li, Z.; Ding, C.; Wang, X.; Chen, H. A holistic view of gender traits and personality traits predict human health. Pers. Individ. Differ. 2024, 222. [Google Scholar] [CrossRef]
- Mammadov, S. Big Five personality traits and academic performance: A meta-analysis. J. Pers. 2021, 90, 222–255. [Google Scholar] [CrossRef]
- Qamar, N.; Malik, A.A. A Quantitative Assessment of the Impact of Homogeneity in Personality Traits on Software Quality and Team Productivity. IEEE Access 2022, 10, 122092–122111. [Google Scholar] [CrossRef]
- Soto, C.J.; John, O.P. Short and extra-short forms of the Big Five Inventory–2: The BFI-2-S and BFI-2-XS. J. Res. Pers. 2017, 68, 69–81. [Google Scholar] [CrossRef]
- Soto, C.J.; John, O.P. The next Big Five Inventory (BFI-2): Developing and assessing a hierarchical model with 15 facets to enhance bandwidth, fidelity, and predictive power. J. Pers. Soc. Psychol. 2017, 113, 117–143. [Google Scholar] [CrossRef]
- Zhou, B.; Lapedriza, A.; Khosla, A.; Oliva, A.; Torralba, A. Places: A 10 Million Image Database for Scene Recognition. IEEE Trans. Pattern Anal. Mach. Intell. 2017, 40, 1452–1464. [Google Scholar] [CrossRef]
- Wang, G.; Chen, Y.; An, P.; Hong, H.; Hu, J.; Huang, T. UAV-YOLOv8: A Small-Object-Detection Model Based on Improved YOLOv8 for UAV Aerial Photography Scenarios. Sensors 2023, 23, 7190. [Google Scholar] [CrossRef] [PubMed]
- Wang, X.; Gao, H.; Jia, Z.; Li, Z. BL-YOLOv8: An Improved Road Defect Detection Model Based on YOLOv8. Sensors 2023, 23, 8361. [Google Scholar] [CrossRef] [PubMed]
- Katahira, K.; Takano, K.; Oba, T.; Kimura, K. Evaluating the performance of personality-based profiling in predicting physical activity. BMC Psychol. 2024, 12, 1–13. [Google Scholar] [CrossRef]
- Chicco, D.; Warrens, M.J.; Jurman, G. The coefficient of determination R-squared is more informative than SMAPE, MAE, MAPE, MSE and RMSE in regression analysis evaluation. PeerJ Comput. Sci. 2021, 7, e623. [Google Scholar] [CrossRef]
- Kumar, A.; Alsadoon, A.; Prasad, P.W.C.; Abdullah, S.; Rashid, T.A.; Pham, D.T.H.; Nguyen, T.Q.V. Generative adversarial network (GAN) and enhanced root mean square error (ERMSE): deep learning for stock price movement prediction. Multimedia Tools Appl. 2021, 81, 3995–4013. [Google Scholar] [CrossRef]
- Kedam, N.; Tiwari, D.K.; Kumar, V.; Khedher, K.M.; Salem, M.A. River stream flow prediction through advanced machine learning models for enhanced accuracy. Results Eng. 2024, 22. [Google Scholar] [CrossRef]
- Karunasingha, D.S.K. Root mean square error or mean absolute error? Use their ratio as well. Inf. Sci. 2022, 585, 609–629. [Google Scholar] [CrossRef]
- Tomar, M.; Bhardwaj, R.; Kumar, M.; Singh, S.P.; Krishnan, V.; Kansal, R.; Verma, R.; Yadav, V.K.; Dahuja, A.; Ahlawat, S.P.; et al. Development of NIR spectroscopy based prediction models for nutritional profiling of pearl millet (Pennisetum glaucum (L.)) R.Br: A chemometrics approach. LWT 2021, 149. [Google Scholar] [CrossRef]
- Yew, S.M.E.; Lei, X.; Chen, Y.; Goh, J.H.L.; Pushpanathan, K.; Xue, C.C.; Wang, Y.X.; Jonas, J.B.; Sabanayagam, C.; Koh, V.T.C.; et al. Deep Imbalanced Regression Model for Predicting Refractive Error from Retinal Photos. Ophthalmol. Sci. 2024, 5, 100659. [Google Scholar] [CrossRef]
- Yang, D. Correlogram, predictability error growth, and bounds of mean square error of solar irradiance forecasts. Renew. Sustain. Energy Rev. 2022, 167. [Google Scholar] [CrossRef]
- Hodson, T.O. Root-mean-square error (RMSE) or mean absolute error (MAE): when to use them or not. Geosci. Model Dev. 2022, 15, 5481–5487. [Google Scholar] [CrossRef]
- Ramon, Y.; Farrokhnia, R.; Matz, S.C.; Martens, D. Explainable AI for Psychological Profiling from Behavioral Data: An Application to Big Five Personality Predictions from Financial Transaction Records. Information 2021, 12, 518. [Google Scholar] [CrossRef]
- Kosan, M.A.; Karacan, H.; Urgen, B.A. Predicting personality traits with semantic structures and LSTM-based neural networks. Alex. Eng. J. 2022, 61, 8007–8025. [Google Scholar] [CrossRef]
Figure 1.
Flowchart of the Proposed Model.
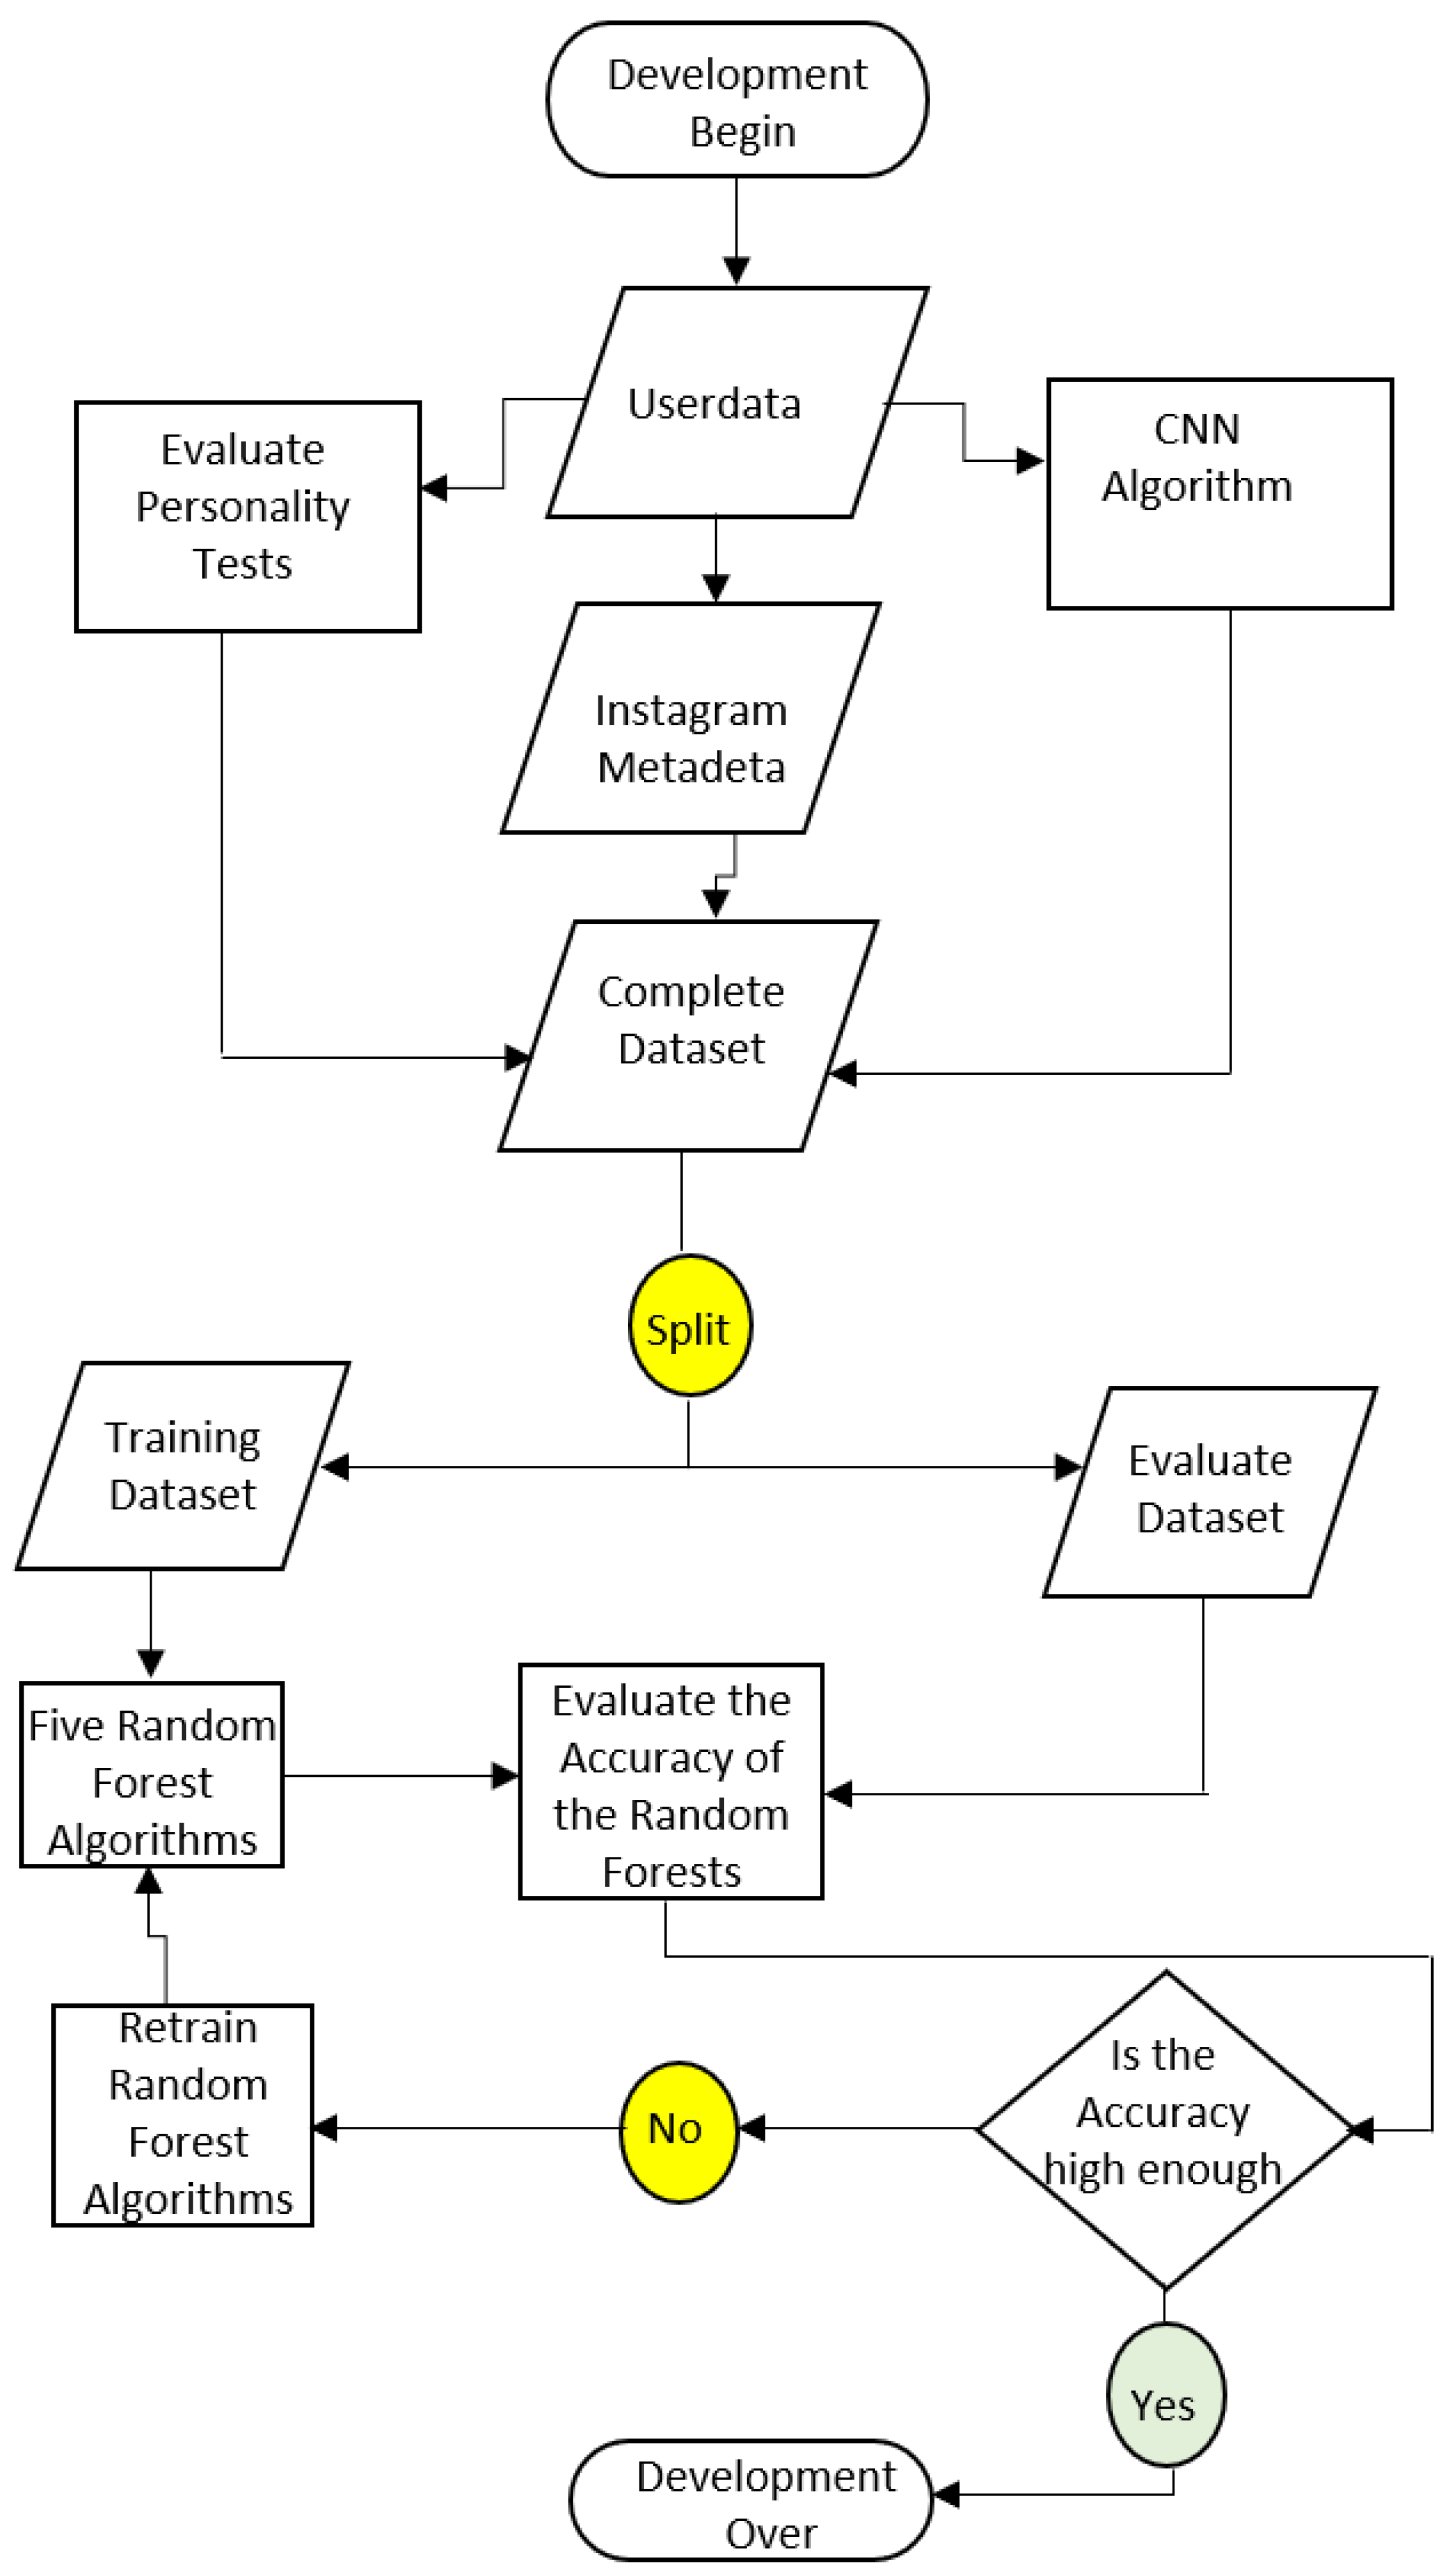
Figure 2.
The Proposed Personality Prediction Model.
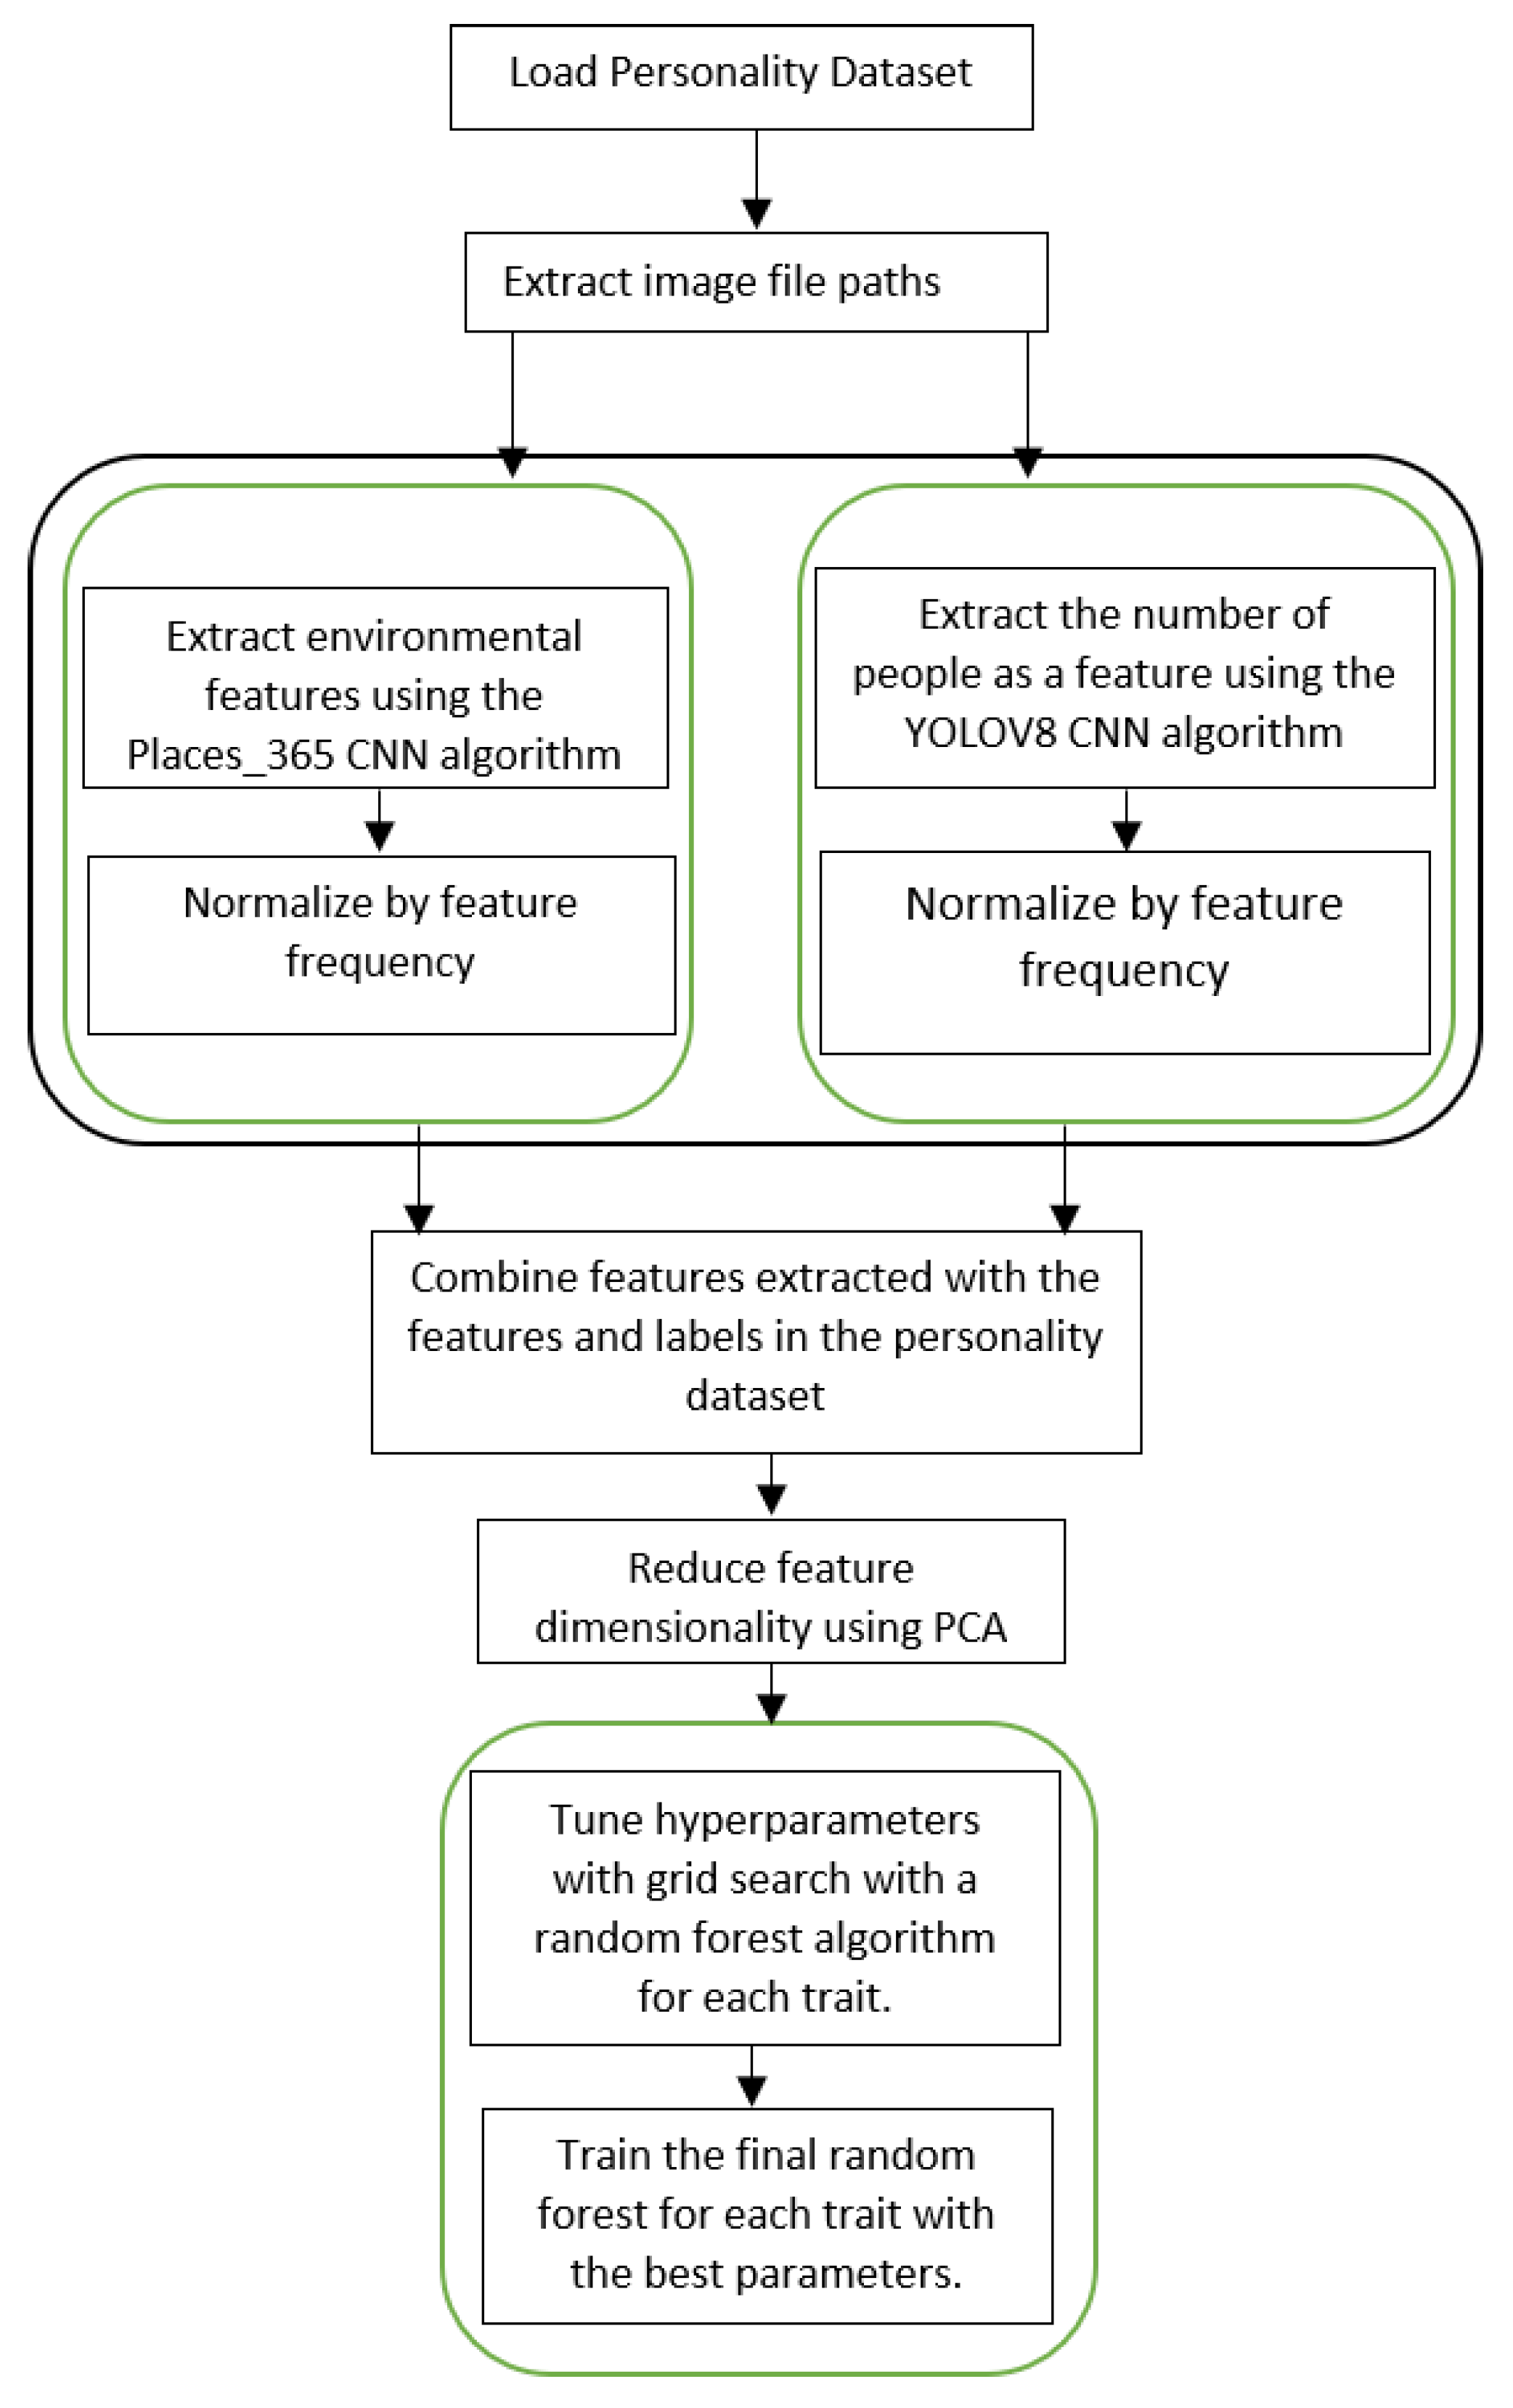
Figure 3.
Figure 3 shows the individual prediction for each trait.
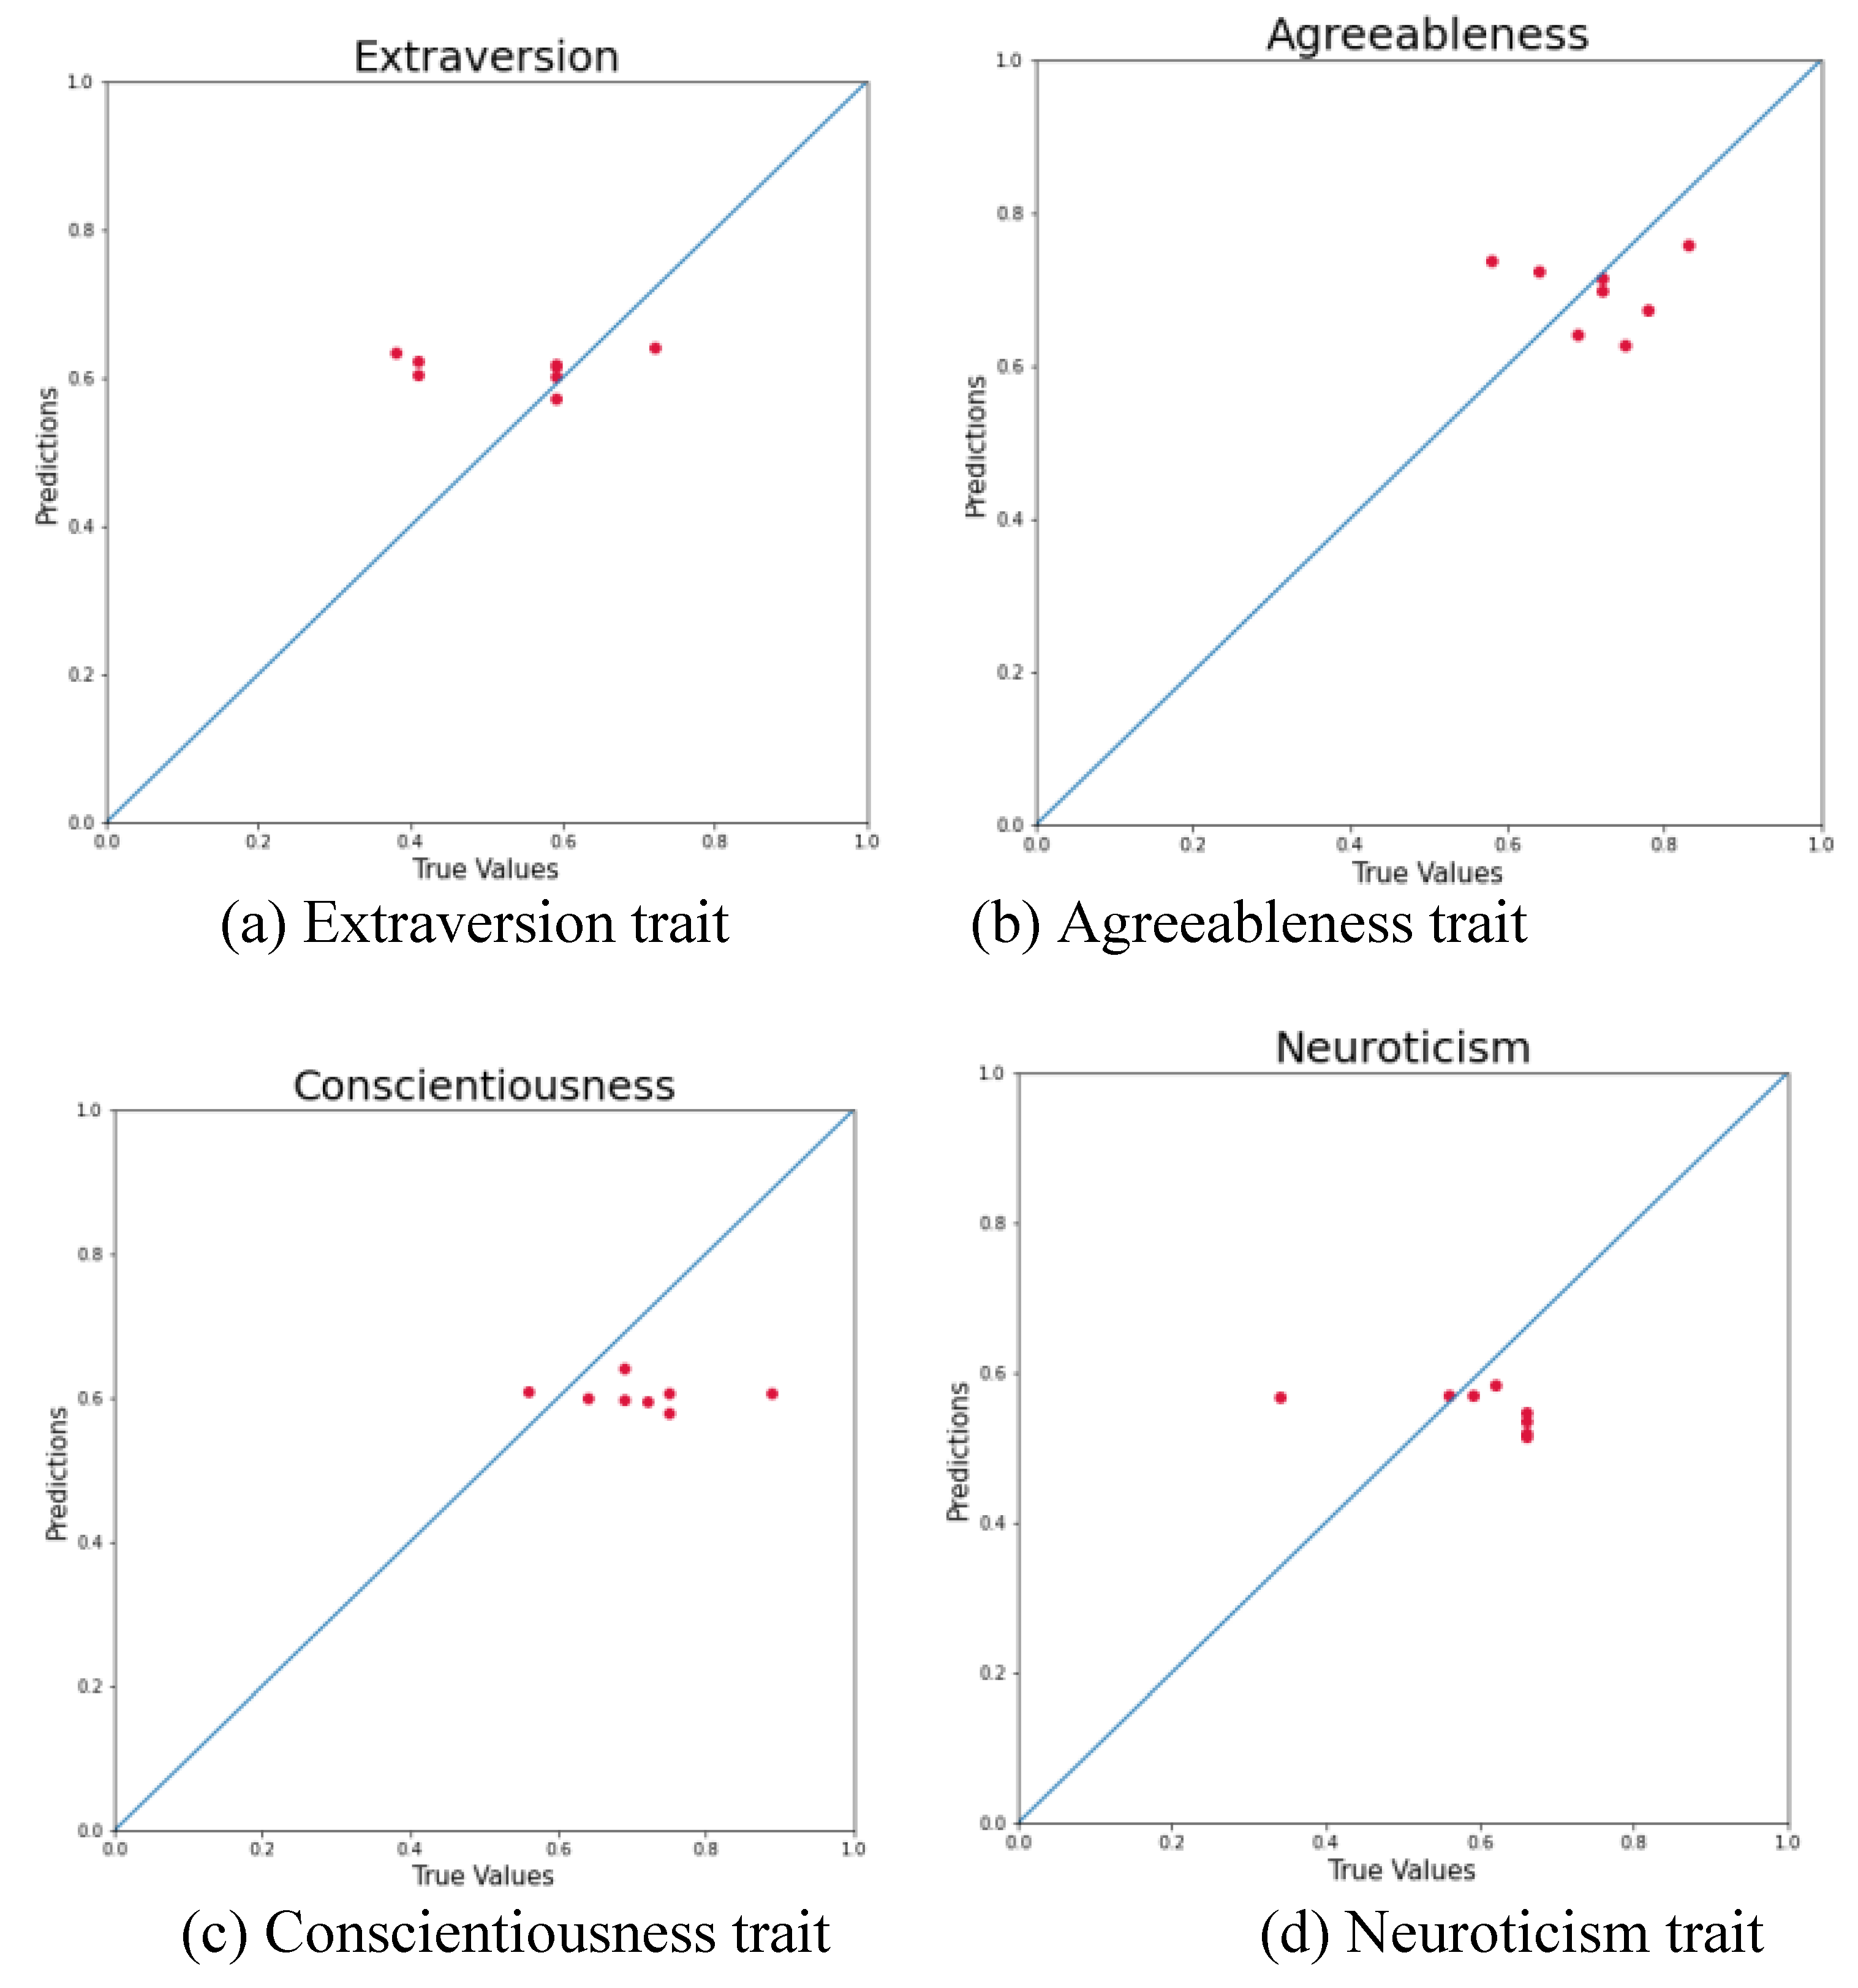
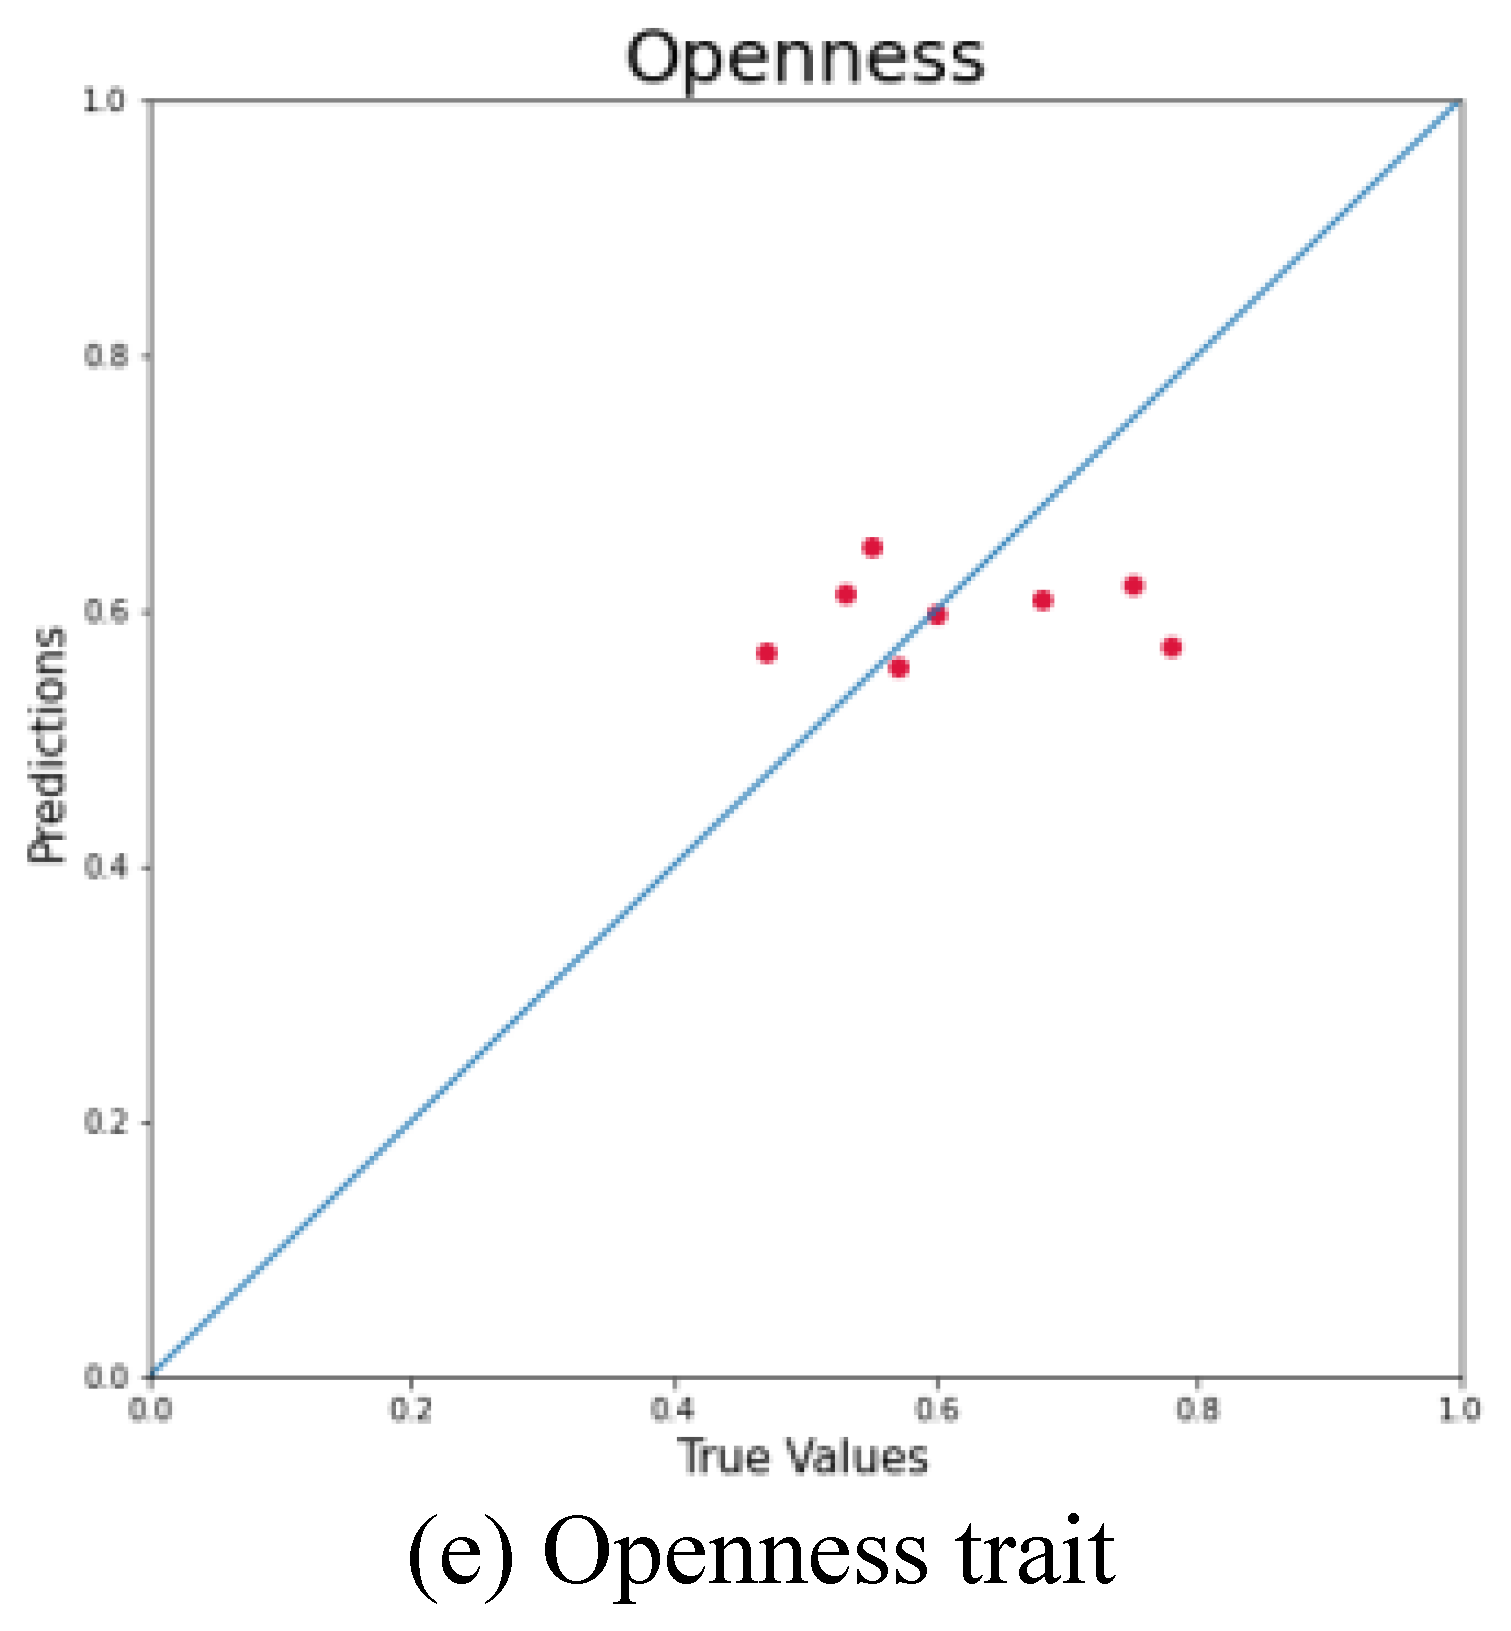

Table 1.
Comparison of Related Works used in Personality Prediction.
| Related Works | Research | Method Used | Results | Strengths | Limitations |
| [9] | Reliability of BFI in personality assessment | Generalizability Theory, Cronbach's Alpha, Test-Retest | BFI found to be reliable (α > 0.7; test-retest > 0.75) | Strong empirical validation of BFI | Focused only on psychometric reliability |
| [10,11,12] | Cultural generalizability of FFM | Comparative analysis across societies | FFM effective in urban, literate societies | Highlights cultural limitations of FFM | Limited in scope to cultural analysis, not ML modeling |
| [13,14] | Predicting personality from Facebook data | Deep learning using Facebook statuses with BFI labels | 74.17% classification accuracy | Use of real-world social media enhances ecological validity | Relies heavily on FFM; potential cultural/linguistic bias |
| [15,16] | Text-based personality prediction via NLP | Pretrained language models, feature fusion | Accuracy improved by ~1.25% using deep learning fusion | Modern NLP techniques and improved prediction performance | Misses subjective elements like mood/opinion in text |
| [17] | Multimodal deep learning personality model | Visual, auditory, and text features via CNN (ResNet, MTCNN) | Effective multimodal fusion; enhanced prediction | Integration of multiple data types enhances robustness | Limited visual dataset constrains generalizability |
| [18] | Survey of multimodal personality prediction | Systematic review of ML approaches | Identified potential of AI in HCI, marketing, recruitment | Comprehensive overview of computational methods | Ignores psychological frameworks; narrow perspective |
Table 2.
Parameter Metric Values for Each Personality Trait.
| Model | () | SE | MAE | MSE | RMSE |
| Extraversion | 0.1155 | 0.0408 | 0.103 | 0.0195 | 0.1397 |
| Agreeableness | 0.0893 | 0.0316 | 0.0771 | 0.0083 | 0.0909 |
| Conscientiousness | 0.0931 | 0.0329 | 0.119 | 0.0201 | 0.1417 |
| Neuroticism | 0.1159 | 0.041 | 0.1021 | 0.0153 | 0.1236 |
| Openness | 0.1059 | 0.0375 | 0.0888 | 0.0115 | 0.1074 |
Table 3.
Average mean generated by our model.
| Personality traits |
A.M 0.1867 |
|||||
| E | N | A | C | O | ||
| 0.1609 | 0.3671 | 0.1039 | 0.1640 | 0.1520 | ||
Table 4.
Our Model Performance Compared with those Reported in Prior Work.
| Personality traits | A.M | |||||
| E | N | A | C | O | ||
| PAN-2015 [37] | 0.1590 | 0.2262 | 0.1492 | 0.1509 | 0.1470 | 0.1690 |
| Our model | 0.1609 | 0.3671 | 0.1039 | 0.1640 | 0.1520 | 0.1867 |
Disclaimer/Publisher’s Note: The statements, opinions and data contained in all publications are solely those of the individual author(s) and contributor(s) and not of MDPI and/or the editor(s). MDPI and/or the editor(s) disclaim responsibility for any injury to people or property resulting from any ideas, methods, instructions or products referred to in the content. |
© 2025 by the authors. Licensee MDPI, Basel, Switzerland. This article is an open access article distributed under the terms and conditions of the Creative Commons Attribution (CC BY) license (http://creativecommons.org/licenses/by/4.0/).
Copyright: This open access article is published under a Creative Commons CC BY 4.0 license, which permit the free download, distribution, and reuse, provided that the author and preprint are cited in any reuse.


