
Submitted:
29 April 2025
Posted:
30 April 2025
You are already at the latest version
Abstract
Background/Objectives: Early detection of biological changes is crucial for effective monitoring of orthodontic tooth movement (OTM). Research that elucidates the connection between OTM and its proteomic profile remains limited. This study aimed to identify salivary protein biomarkers specific to fixed orthodontic appliances (FOA) and Invisalign (IN) treatment modalities. Methods: Unstimulated saliva was collected from 17 patients treated with FOA and 6 patients treated with IN before treatment (T0), and at 3 (T1) and 6 (T2) months after therapy initiation. Salivary proteomes were analyzed using liquid chromatography-tandem mass spectrometry, followed by label-free protein quantification and identification with MaxQuant. Heatmap visualization, Partial Least Squares Discriminant Analysis (PLS-DA), and ANOVA were performed using MetaboAnalyst (P≤0.05) to identify differentially expressed proteins (DEPs). Gene Ontology enrichment analysis and Protein-Protein Interaction (PPI) network analysis were conducted on the identified DEPs. Results: PLS-DA demonstrated clear separation between T0, T1, and T2 in both groups. From 17,603 DEPs, 12 and 50 top proteins were identified between FOA and IN at T1 and T2, respectively. Three DEPs—CD19, FAM20C, and GNRHR—were identified in both groups. Their expression levels significantly decreased (P<0.05) at T1 and T2 within each group, with no significant differences in CD19 and FAM20C between the two groups at T0, T1, and T2. PPI revealed associations between these proteins and OTM-related proteins, including fibronectin, RANK, osteopontin, dentin sialophosphoprotein, SOX9, alkaline phosphatase, collagen alpha-1, and collagen alpha-2.Conclusions: CD19, FAM20C, and GNRHR are involved in OTM, suggesting their potential utility as salivary biomarkers.
Keywords:
Orthodontic tooth movement
; Salivary protein biomarkers
; Fixed orthodontic appliances
; Invisalign
; Proteomic analysis
; CD19
; FAM20C
; GNRHR
; Liquid Chromatography-Tandem Mass Spectrometry
1. Introduction
Orthodontic tooth movement (OTM) induces biological responses, altering periodontal ligament blood flow and triggering the release of mediators that initiate bone remodeling [1]. While clinical outcomes of OTM are traditionally measured through esthetic and functional parameters such as occlusion and tooth alignment, these changes often require extended periods to become visually apparent. Therefore, early detection methods are crucial for monitoring the effectiveness of OTM. Salivary proteins offer a non-invasive approach to monitor both the progression and potential adverse consequences of OTM [2]. Salivary biomarkers, identified through advanced mass spectrometry techniques, provide diagnostic advantages due to their high sensitivity and specificity [3]. Previous studies have documented changes in specific proteins involved in inflammation and bone remodeling in the saliva of orthodontic patients, including S100 calcium-binding protein A9 (S100-A9), immunoglobulin J chain, Ig alpha-1 chain C region, cysteine-rich secretory protein 3 precursor (CRISP-3) [4], bone morphogenetic protein 4 (BMP4) [5], and apolipoprotein E [6].
Notably, most proteomic-based studies have primarily compared human salivary proteomes between orthodontic patients and controls. To date, few investigations have examined the proteomic differences between fixed orthodontic appliance (FOA) and Invisalign (IN) treatment modalities. Therefore, the aim of this study was to identify potential salivary biomarkers that respond specifically to FOA and IN treatments.
2. Materials and Methods
2.1. Ethical Approval
The Human Research Ethics Committee of Walailak University (Nakhon Si Thammarat, Thailand) approved the protocols for clinical treatments and saliva collection from orthodontic patients (protocol number WU-EC-DE-1-429-65). The study was registered at the Thai clinical trials registry (TCTR20250313003). Written informed consent was obtained from each participant before any study-related procedures were performed. This study was conducted in compliance with the applicable ethical standards on human experimentation and with the Helsinki Declaration of 1975, as revised in 2013 [7].
2.2. Study Design and Subjects
The study was conducted at the Center for Advanced Oral Health, International College of Dentistry, Walailak University, Bangkok, Thailand, between 2023 and 2024. Sample size estimation was performed using G Power software version 3.1.9.4 (Heinrich-Heine-Universität Düsseldorf, Düsseldorf, Germany). Considering a standardized effect size (f) of 0.40, study power of 80%, significance level of 0.05, number of groups (N = 2), number of repeated measures at 3 different time points, and correlation between repeated measures at 0.50, the total required sample size was determined to be 12 [8]. Participants were selected according to the following exclusion criteria: history of previous orthodontic treatment, antibiotic therapy within the past 3 months, current systemic medication use, active smoking, diagnosis of systemic disease, and signs of gingivitis and/or periodontitis.
A total of 23 patients were enrolled in this study. The crowding degree was moderate to severe (≥ 3.1 mm) for both maxillary and mandibular arches [9]. Seventeen subjects received fixed orthodontic appliances with metallic brackets of 0.022-inch slot size (American Orthodontics, Sheboygan, WI, USA). The bonding process was performed using the same adhesive (BracePaste, American Orthodontics) for all patients, and treatment was initiated with 0.014-inch NiTi archwires (Highland Metals™, Franklin, IN, USA). Six subjects received clear aligners (Invisalign®, Align Technology Inc., Santa Clara, CA, USA). All participants received standardized oral hygiene instructions. This study followed the Transparent Reporting of Evaluations with Nonrandomized Designs (TREND) reporting guidelines for clinical research studies [10]. The study selection process is outlined in Figure 1.
2.3. Collection and Processing of Saliva
Saliva samples were collected prior to orthodontic treatment (T0), at 3-month follow-up (T1), and at 6-month follow-up (T2). Participants were instructed to rest for 15 minutes before saliva collection, which occurred between 9:00-12:00 am, and to refrain from consuming food and beverages for at least 1 hour prior to collection. Unstimulated whole saliva was collected in 50-mL centrifuge tubes until approximately 5 mL was obtained. Immediately after collection, saliva samples were centrifuged at 10,000×g for 15 minutes at 4°C to remove insoluble materials, cells, and debris. The supernatants were stored at -80°C for subsequent analyses.
2.4. Salivary Sample Processing for Liquid Chromatography-Tandem Mass Spectrometry (LC-MS/MS) Analysis
Protein concentration of saliva samples was determined using the Lowry assay with bovine serum albumin (Sigma-Aldrich, St Louis, MA, USA) as a standard protein [11]. Five micrograms of protein samples underwent in-solution digestion. Salivary proteins were dissolved in 10 mM ammonium bicarbonate (AmBic), and disulfide bonds were reduced using 5 mM dithiothreitol (DTT) in 10 mM AmBic at 60°C for 1 hour. Alkylation of sulfhydryl groups was performed using 15 mM iodoacetamide (IAA) in 10 mM AmBic at room temperature for 45 minutes in darkness. Proteins were then digested with sequencing-grade porcine trypsin (1:20 ratio) for 16 hours at 37°C. The resulting tryptic peptides were dried in a speed vacuum concentrator and resuspended in 0.1% formic acid for nano LC-MS/MS analyses.
2.5. LC-MS/MS Analysis and Protein Identification
Tryptic peptide samples were prepared for injection into an Ultimate3000 Nano/Capillary LC System (Thermo Scientific, UK) coupled to a ZenoTOF 7600 mass spectrometer (SCIEX, Framingham, MA, USA). Briefly, one microliter of peptide digest was enriched on a μ-Precolumn 300 μm i.d. × 5 mm C18 Pepmap 100, 5 μm, 100 Å (Thermo Scientific, UK), then separated on a 75 μm I.D. × 15 cm column packed with Acclaim PepMap RSLC C18, 2 μm, 100 Å, nanoViper (Thermo Fisher Scientific, UK). The C18 column was housed in a thermostatted column oven maintained at 60°C. Solvents A and B, containing 0.1% formic acid in water and 0.1% formic acid in 80% acetonitrile, respectively, were supplied to the analytical column. A gradient of 5-55% solvent B was used to elute the peptides at a constant flow rate of 0.30 μL/min for 30 minutes. MaxQuant 2.4.2.0 was used to quantify proteins in individual samples using the Andromeda search engine to correlate MS/MS spectra to the Uniprot Homo sapiens database [12]. Protein false discovery rate (FDR) was set at 1% and estimated using reversed search sequences. The maximum number of modifications per peptide was set to 5. The search utilized the Homo sapiens proteome FASTA file downloaded from Uniprot (March 31, 2024).
2.6. Data Visualization and Statistical Analyses
The MaxQuant ProteinGroups.txt file was imported into Perseus version 1.6.6.0 [12]. Potential contaminants not corresponding to any UPS1 protein were removed from the dataset. ShinyGO 0.77 software was used for in-depth analysis of salivary proteins involved in biological processes, with graphical visualization of enrichment [13]. Visualization and statistical analyses of the LC-MS/MS data, including Partial Least Squares Discriminant Analysis (PLS-DA), heatmap generation, and analysis of variance (ANOVA) with post-hoc Tukey HSD (Honestly Significant Difference) test, were conducted using Metaboanalyst version 6.0, with a significance threshold of P-value < 0.05 [14]. Additionally, as a complementary statistical approach, two-way repeated measures ANOVA followed by Tukey's multiple comparisons test was performed using GraphPad Prism version 10.0 for Windows (GraphPad Software, San Diego, CA, USA). A P-value < 0.05 was considered statistically significant. The STRING (Search Tool for the Retrieval of Interacting Genes) database version 12.0 was used to investigate interactions with proteins related to OTM [15]. These proteins included alkaline phosphatase (ALPL) [16,17], osteocalcin (BGLAP) [16], collagen alpha-1 (COL1A1), collagen alpha-2 (COL1A2) [18], dentin sialophosphoprotein (DSPP) [19,20], Sex-determining region Y-box 9 (SOX9) [21,22], osteopontin (SPP1) [23], tumor necrosis factor receptor superfamily member 11B or osteoprotegerin (TNFRSF11B/OPG), tumor necrosis factor receptor superfamily member 11 (TNFSF11 or RANK) [24,25], and fibronectin (FN1) [26].
3. Results
3.1. Characteristics of Participants
A total of 23 patients (15 females and 8 males, aged 19-52 years; mean 28 ± 8.88 years) participated in this study. The FOA group (N = 17; 5 males, 12 females) had a mean age of 27 ± 8.86 years (range: 19-52 years). The IN group (N = 6; 3 males, 3 females) had a mean age of 32 ± 8.85 years (range: 19-46 years). All patients had a median crowding of 4 mm (range: 4-10 mm). Regarding malocclusion types [9], 70% of total patients presented with moderate crowding, while 30% exhibited severe crowding. In the FOA group, the median crowding was 4 mm (range: 4-10 mm), with 71% classified as moderate crowding and 29% as severe crowding. In the IN group, the median crowding was 4.5 mm (range: 4-8 mm), with 67% exhibiting moderate crowding and 33% severe crowding.
3.2. Salivary Protein Profiles in Response to FOA and IN at T0, T1, and T2
To identify salivary protein alterations across the study period, a total of 17,603 differentially expressed proteins (DEPs) were quantified. Gene Ontology (GO) enrichment analysis using ShinyGO revealed that the majority of these proteins were associated with biological processes such as system development, cellular developmental processes, cell differentiation, and regulation of biosynthesis (Figure 2). Partial Least Squares Discriminant Analysis (PLS-DA) demonstrated that the salivary protein profiles of FOA and IN groups were largely indistinguishable at T0 (Figure 3), suggesting similar metabolic states prior to orthodontic treatments. However, distinct separation of protein profiles between the FOA and IN groups was observed at the T1 and T2 compared to T0. Within each treatment group, minimal separation of protein clusters was evident between T1 and T2. These findings indicate that FOA and IN treatments induce differential alterations in the salivary proteomic landscape over time.
3.3. Identification of DEPs in FOA and IN at T0, T1, and T2
Among the 17,603 DEPs, 12 were significantly differentially expressed between the FOA and IN groups at T1 (Figure 4A), while 50 DEPs were identified between the two groups at T2 (Figure 4B). Three proteins—P15391 [cluster of differentiation (CD)19)], Q8IXL6 [family with sequence similarity (FAM) 20C], and Q96P88 [Gonadotropin-releasing hormone receptor (GNRHR) ]—were identified in both groups at both time points. Heatmap visualization of expression trends across the two groups for the 12 and 50 DEPs based on ANOVA is shown in Figure 5A and Figure 5B, respectively. The heatmap revealed that among the 12 DEPs responding to FOA and IN treatments at T1, 10 proteins exhibited decreased expression levels in the FOA group, while 3 proteins were downregulated in the IN group (Figure 5A). Figure 5B demonstrates that after 6 months of orthodontic treatment , 40 proteins were downregulated in the FOA group, while 14 proteins were downregulated in the IN group.
We focused particularly on DEPs expressed in both FOA and IN groups. Two-way repeated measures ANOVA and Tukey's HSD tests demonstrated significant effects of time (P < 0.05) and group (P < 0.05) for CD19 (Figure 6A) and FAM20C (Figure 6B), but no significant time × group interaction (P > 0.05) for these proteins. Significant effects of time (P < 0.05), group (P < 0.05), and time × group interaction (P < 0.05) were observed for GNRHR (Figure 6C). Expression levels of CD19 and FAM20C were significantly lower (P < 0.05) after 3 months of FOA or IN treatment compared to baseline. However, no further significant differences (P > 0.05) in the expression of these proteins were observed at the 6-month follow-up. Significant reduction (P < 0.05) in GNRHR expression was observed after 3 months in the FOA group, but no significant differences (P > 0.05) were found across time points in the IN group. GNRHR expression did not significantly change at T2 compared to T1 in the FOA group. Notably, a significant difference (P < 0.05) in GNRHR expression was observed between the FOA and IN groups at T1.
3.4. Pathway Analysis with the STRING Database
To elucidate the potential roles of DEPs found in FOA and IN groups, we assessed their interactions with proteins involved in OTM using the STRING database. The 12 DEPs (Figure 7) and 50 DEPs (Figure 8) interacted with alkaline phosphatase, osteocalcin, collagen alpha-1, collagen alpha-2, dentin sialophosphoprotein, SOX9, osteopontin, osteoprotegerin, RANK, and fibronectin. Notably, the three top proteins expressed in both groups—CD19, FAM20C, and GNRHR—demonstrated relationships with proteins involved in OTM. CD19 was directly linked to fibronectin and RANK. FAM20C directly associated with fibronectin, osteopontin, and dentin sialophosphoprotein, while GNRHR indirectly interacted with alkaline phosphatase, collagen alpha-1, collagen alpha-2, fibronectin, osteopontin, and RANK via SOX9 (Figure 9).
4. Discussion
In this study, top DEPs were selected based on the P-values from ANOVA and post hoc analyses. STRING database analysis revealed associations between these DEPs and proteins related to OTM, including alkaline phosphatase, osteocalcin, collagen alpha-1, collagen alpha-2, dentin sialophosphoprotein, SOX-9, osteopontin, osteoprotegerin, RANK, and fibronectin. Among these DEPs, CD19, FAM20C, and GNRHR were selected for further investigation based on their significant expression changes in both treatment groups at T1 and T2.
The significant downregulation of the "B-cell development" pathway (evidenced by CD19 downregulation) in saliva samples at T1 and T2, as revealed by STRING analysis, was unexpected. The human CD19 antigen is a 95 kDa transmembrane glycoprotein belonging to the immunoglobulin superfamily. CD19 is critically involved in establishing intrinsic B cell signaling thresholds through modulation of both B cell receptor-dependent and independent signaling pathways [27]. Minimal presence of B cells in healthy gingiva has been reported, suggesting that such low levels might be important for preventing bone loss around teeth due to subclinical inflammation that occurs in clinically healthy periodontium [28]. Basically B cells are considered a source of RANKL [receptor activator of nuclear factor kappa B (NF-κB) ligand], which facilitates osteoclastogenesis in the periodontium. This evidence suggests that B cells can influence RANKL and OPG levels, thereby affecting the periodontium. However, direct evidence supporting B cell involvement in bone remodeling induced by OTM remains limited. A similar situation pertains to T cells, another important immune cell type capable of regulating bone homeostasis. T cells express CD40L, which binds to CD40 to induce B cells to release OPG, which competitively binds to RANKL to inhibit osteoclast activity [29]. Interestingly, a previous study in mice demonstrated peak CD19 expression at day 3 post-spring activation, with subsequent downregulation [30].
STRING analysis in our study suggests associations between CD19, fibronectin, and RANK. Currently, little is known about the relationships among these proteins in OTM. Extracellular matrix components, particularly fibronectin, gradually increase in the pressure side and decrease in the tension side during orthodontic therapy [31]. Fibronectin/β1-integrin inhibits osteoclast formation by preventing pre-osteoclast fusion. Therefore, increased fibronectin expression during orthodontic treatment may contribute to controlled bone remodeling and tooth movement [32]. In vivo studies have demonstrated the presence of RANKL and RANK in periodontal tissues during experimental tooth movement in rat molars, suggesting that periodontal ligament cells under mechanical stress may induce osteoclastogenesis through upregulation of RANKL expression during OTM [25]. Collectively, our results suggest an important contribution of CD19 in modulating OTM. Although the precise interplay between CD19 and orthodontic forces requires further elucidation, our findings demonstrate a tangible link between the two. A decrease in CD19 might be associated with reduced osteoclastogenesis, potentially downregulating alveolar bone resorption during OTM [33].
FAM20C is a member of the family with sequence similarity 20, consisting of three members: FAM20A, FAM20B, and FAM20C. FAM20C is highly expressed in chondrocytes, osteoblasts, osteocytes, odontoblasts, ameloblasts, and cementoblasts, as well as in dentin, enamel, and bone matrices. FAM20C plays an important role in the formation of these mineralized tissues and subsequent mineralization processes [34]. However, current knowledge regarding the relationship between FAM20C and OTM is limited. This protein is involved in biomineralization processes through phosphorylation of members of the secretory calcium-binding phosphoprotein family (non-collagenous proteins) primarily located in bone and dentin. This family encodes the small integrin-binding ligand N-linked glycoproteins (SIBLINGs), such as dentin matrix protein 1 (DMP1), bone sialoprotein (BSP), osteopontin, matrix extracellular phosphoglycoprotein (MEPE), and dentin sialophosphoprotein. These SIBLINGs possess high calcium affinity and regulate calcium phosphate precipitation as hydroxyapatite in bone and teeth [35].
Our study suggests indirect interactions between GNRHR and certain OTM-related proteins, including alkaline phosphatase, collagen alpha-1, collagen alpha-2, fibronectin, osteopontin, and RANK, via SOX9. To date, SOX9 has primarily been studied in tooth development, with few investigations reporting its possible role in OTM [36]. A meta-analysis suggests that SOX9, parathyroid hormone-related protein (PTHrp), and Indian Hedgehog (IHH) protein play vital roles in directly regulating type II collagen genes and transducing applied forces to bone and teeth during OTM [37]. However, conclusive evidence regarding the relationship between orthodontic force and pulp tissue in humans remains elusive. Nevertheless, tooth movement involves cell damage, inflammation, and wound healing processes, which may affect dental pulp health [38]. According to recent research, application of orthodontic forces results in timely and localized release of several cytokines that work in concert to initiate and sustain bone and periodontal tissue remodeling processes. Elevated concentrations of pro-inflammatory cytokines, including interleukin-1β (IL-1β), tumor necrosis factor-alpha (TNF-α), and interleukin-6 (IL-6), have been associated with osteoclast stimulation [39]. A previous study showed that SOX9, as a downstream target of TNF-α, plays an important role in dental pulp inflammation and immune responses [40].
Alterations in ALPL activity serve as a biological marker of cellular responses in periodontal tissues during OTM. Multiple studies have demonstrated significant elevation in ALPL levels from baseline following the application of orthodontic forces [41,42,43]. Concurrently, RANKL concentrations in gingival crevicular fluid exhibit marked increases during active tooth movement [44]. These findings indicate that periodontal ligament cells subjected to mechanical stress promote osteoclastogenesis through enhanced RANKL expression, facilitating the bone resorption phase of OTM [25]. OPN and RANKL collectively work to induce the bone resorption in response to compressive forces. In this process, OPN functions synergistically with RANKL to mediate bone resorption in response to compressive forces applied during OTM. Furthermore, tension forces during OTM trigger the upregulation of several osteogenic markers-including OPN, ALPL, collagen type I, BGLAP, and BSP- through signaling cascades mediated by extracellular signal-regulated kinase (ERK) and p38 mitogen-activated protein kinase (MAPK) pathways [23].
Zhang et al. [6] reported ApoE as a potntial salivary biomarker for OTM. Surprisingly, our findings contradict this previous study, as we did not identify ApoE among the DEPs during orthodontic treatments. These discrepancies may be attributed to differences in study design and additional processing steps applied to saliva samples in our investigation. However, it is unlikely that undetectable sources of technical error leading to false-negative results in salivary proteomic profiles occurred in this study, as we employed LC-MS/MS, a highly sensitive technique for protein detection [45].
It should be noted that this study had limitations, particularly the imbalanced sample size between treatment groups, with only six patients receiving Invisalign treatment. Furthermore, the potential utility of CD19, FAM20C, and GNRHR as biomarkers requires validation in larger patient cohorts. To the best of our knowledge, our study represents the first to suggest CD19, FAM20C, and GNRHR as salivary biomarkers for monitoring orthodontic treatments. While much remains to be discovered about the roles of CD19, FAM20C, and GNRHR in OTM, the present study expands our knowledge in this area. In clinical practice, monitoring CD19, FAM20C, and GNRHR expression during orthodontic treatments may provide valuable biomarkers for predicting OTM progression and outcomes.
5. Conclusions
In summary, our findings demonstrate that different orthodontic treatment modalities—fixed orthodontic appliances and Invisalign systems—influence salivary proteomic profiles after 3-6 months of treatment. Downregulation of CD19, FAM20C, and GNRHR was observed in both treatment groups. Protein-protein interactions revealed associations between these three proteins and proteins related to orthodontic tooth movement, including alkaline phosphatase, collagen alpha-1, collagen alpha-2, dentin sialophosphoprotein, SOX9, osteopontin, RANK, and fibronectin. Therefore, CD19, FAM20C, and GNRHR demonstrate potential as salivary biomarkers for monitoring orthodontic treatment progression.
Author Contributions
Conceptualization, S.K., R.C., and S.R.; software, S.R. and S.K.; data collection, R.C. and S.K.; data analysis, S.K. and S.R.; writing—original draft preparation, R.C., S.R., and S.K.; writing—review and editing, R.C., S.R., and S.K.; funding acquisition, S.K. All authors have read and agreed to the published version of the manuscript.
Funding
This research was funded by the International College of Dentistry, Walailak University, Bangkok, Thailand (grant number WUICD 2564).
Institutional Review Board Statement
The study was conducted in accordance with the Declaration of Helsinki, and approved by the Ethics Committee of Walailak University (protocol number: WU-EC-DE-1-429-65 and date of approval 30 March 2023) for studies involving humans. Additionally, the study was registered at the Thai clinical trials registry (TCTR20250313003).
Informed Consent Statement
Informed consent was obtained from all subjects involved in the study.
Data Availability Statement
The LC-MS/MS raw data and analysis files have been deposited with the ProteomeXchange Consortium (http://proteomecentral.proteomexchange.org) via the jPOST partner repository (https://jpostdb.org) with the data set identifier JPST003758 and PXD062882 (preview URL for reviewers: https://repository.jpostdb.org/preview/162480563467fbcaa19ba96, Access key: 6601).
Acknowledgments
We would like to thank Christian Estacio, a native English speaker and Academic Counselor for international affairs at Walailak University, International College of Dentistry, for English editing assistance.
Conflicts of Interest
The authors declare no conflicts of interest.
Abbreviations
The following abbreviations are used in this manuscript:
| ALPL | Alkaline phosphatase |
| AmBic | Ammonium bicarbonate |
| ApoE | Apolipoprotein E |
| BGLAP | Osteocalcin |
| BSP | Bone sialoprotein |
| CD | Cluster of differentiation |
| COL1A1 | Collagen alpha-1 |
| COL1A2 | Collagen alpha-2 |
| DEPs | Differentially expressed proteins |
| DMP1 | Dentin matrix protein 1 |
| DSPP | Dentin sialophosphoprotein |
| DTT | Dithiothreitol |
| ERK | Extracellular signal-regulated kinase |
| FAM20C (Q8IXL6) | Family with sequence similarity 20C |
| FDR | False discovery rate |
| FN1 | Fibronectin |
| FOA | Fixed orthodontic appliance |
| GNRHR(Q96P88) | Gonadotropin-releasing hormone receptor |
| GO | Gene ontology |
| IAA | Iodoacetamide |
| IHH | Indian hedgehog |
| IL-1β | Interleukin-1β |
| IL-6 | Interleukin-6 |
| IN | Invisalign |
| LC-MS/MS | Liquid chromatography-tandem mass spectrometry |
| MAPK | Mitogen-activated protein kinase |
| MEPE | Matrix extracellular phosphoglycoprotein |
| NF-κB | Nuclear factor kappa B |
| OPG | Osteoprotegerin |
| OTM | Orthodontic tooth movement |
| PLS-DA | Partial least squares discriminant analysis |
| PPI | Protein-protein interaction |
| PTHrp | Parathyroid hormone-related protein |
| RANK | Receptor activator of nuclear factor-kappa B |
| RANKL | Receptor activator of nuclear factor-kappa B ligand |
| SIBLING | Small integrin-binding ligand N-linked glycoprotein |
| SOX9 | Sex-determining region Y-box 9 |
| SPP1/OPN | Osteopontin |
| STRING | Search tool for the retrieval of interacting genes |
| TNF-α | Tumor necrosis factor-alpha |
| TNFSF11/RANK | Tumor necrosis factor receptor superfamily member 11 |
| TNFRSF11B | Tumor necrosis factor receptor superfamily member 11B |
| TREND | Transparent reporting of evaluations with nonrandomized designs |
References
- Li, Y.; Zhan, Q.; Bao, M.; Yi, J.; Li, Y. Biomechanical and biological responses of periodontium in orthodontic tooth movement: up-date in a new decade. Int J Oral Sci 2021, 13, 20. [Google Scholar] [CrossRef] [PubMed]
- Allen, R.K.; Edelmann, A.R.; Abdulmajeed, A.; Bencharit, S. Salivary protein biomarkers associated with orthodontic tooth movement: A systematic review. Orthod Craniofac Res 2019, 22 (Suppl 1), 14–20. [Google Scholar] [CrossRef] [PubMed]
- Popovic, V.Z.; Grgurevic, L.; Trkulja, V.; Novak, R.; Negovetic-Vranic, D. The role of new technologies in defining salivary protein composition following placement of fixed orthodontic appliances - breakthrough in the development of novel diagnostic and therapeutic procedures. Acta Clin Croat 2020, 59, 480–488. [Google Scholar] [CrossRef]
- Ellias, M.F.; Ariffin, S.H.Z.; Karsani, S.A.; Rahman, M.A.; Senafi, S.; Wahab, R.M.A. Proteomic analysis of saliva identifies potential biomarkers for orthodontic tooth movement. Sci World J 2012, 2012, 647240. [Google Scholar] [CrossRef]
- Grgurevic, L.; Novak, R.; Salai, G.; Trkulja, V.; Hamzic, L.F.; Popovic, V.Z.; Bozic, D. Identification of bone morphogenetic protein 4 in the saliva after the placement of fixed orthodontic appliance. Prog Orthod 2021, 22, 19. [Google Scholar] [CrossRef]
- Zhang, J.; Sun, B.; Zhao, H.; Zhang, T.; He, D.; Lin, J.; Chen, F. Apolipoprotein E is an effective biomarker for orthodontic tooth movement in patients treated with transmission straight wire appliances. Am J Orthod Dentofacial Orthop 2022, 161, 255–262 e251. [Google Scholar] [CrossRef]
- Shrestha, B.; Dunn, L. The declaration of Helsinki on medical research involving human subjects: A review of seventh revision. J Nepal Health Res Counc 2020, 17, 548–552. [Google Scholar] [CrossRef]
- Brysbaert, M. How many participants do we have to include in properly powered experiments? A tutorial of power analysis with reference tables. J Cogn 2019, 2, 16. [Google Scholar] [CrossRef]
- Portillo, F.R.L.; Valenzuela, J.G.; Alcaraz, V.R.; Urias, A.E.V.; Pérez, D.D.R.M.; Guerrero, F.M.M.; Celaya, G.E.G.; Arredondo, T.G.; Beltrán, M.A.Q.; Antonio, M.; et al. Dental crowding: a review. Int J Res Med Sci 2024, 12, 1344–1348. [Google Scholar] [CrossRef]
- Falagas, M.E.; Pitsouni, E.I. Guidelines and consensus statements regarding the conduction and reporting of clinical research studies. Arch Intern Med 2007, 167, 877–888. [Google Scholar] [CrossRef]
- Lowry, O.H.; Rosebrough, N.J.; Farr, A.L.; Randall, R.J. Protein measurement with the Folin phenol reagent. J Biol Chem 1951, 193, 265–275. [Google Scholar] [CrossRef] [PubMed]
- Tyanova, S.; Temu, T.; Cox, J. The MaxQuant computational platform for mass spectrometry-based shotgun proteomics. Nat Protoc 2016, 11, 2301–2319. [Google Scholar] [CrossRef]
- Ge, S.X.; Jung, D.; Yao, R. ShinyGO: a graphical gene-set enrichment tool for animals and plants. Bioinformatics 2020, 36, 2628–2629. [Google Scholar] [CrossRef]
- Pang, Z.; Zhou, G.; Ewald, J.; Chang, L.; Hacariz, O.; Basu, N.; Xia, J. Using MetaboAnalyst 5.0 for LC-HRMS spectra processing, multi-omics integration and covariate adjustment of global metabolomics data. Nat Protoc 2022, 17, 1735–1761. [Google Scholar] [CrossRef]
- Szklarczyk, D.; Kirsch, R.; Koutrouli, M.; Nastou, K.; Mehryary, F.; Hachilif, R.; Gable, A.L.; Fang, T.; Doncheva, N.T.; Pyysalo, S.; et al. The STRING database in 2023: protein-protein association networks and functional enrichment analyses for any sequenced genome of interest. Nucleic Acids Res 2023, 51, D638–D646. [Google Scholar] [CrossRef]
- Bud, A.; Lazar, L.; Martu, M.A.; Dako, T.; Suciu, M.; Vlasiu, A.; Lazar, A.P. Challenges and perspectives regarding the determination of gingival crevicular fluid biomarkers during orthodontic treatment: A narrative review. Medicina (Kaunas) 2024, 60. [Google Scholar] [CrossRef]
- Javed, F.; Al-Kheraif, A.A.; Romanos, E.B.; Romanos, G.E. Influence of orthodontic forces on human dental pulp: a systematic review. Arch Oral Biol 2015, 60, 347–356. [Google Scholar] [CrossRef] [PubMed]
- Maltha, J.C.; Kuijpers-Jagtman, A.M. Mechanobiology of orthodontic tooth movement: An update. J World Fed Orthod 2023, 12, 156–160. [Google Scholar] [CrossRef] [PubMed]
- Thalanany, R.; Uma, H.I.; Ahmed, N. Estimation of dentin sialophosphoprotein in gingival crevicular fluid during orthodontic intrusion using Ricketts’ simultaneous intrusion and retraction utility arch. Int J Curr Res 2017, 9, 50483–50486. [Google Scholar]
- Kumar, A.A.; Saravanan, K.; Kohila, K.; Kumar, S.S. Biomarkers in orthodontic tooth movement. J Pharm Bioallied Sci 2015, 7, S325–S330. [Google Scholar] [CrossRef]
- Nugraha, A.P.; Narmada, I.B.; Ernawati, D.S.; Dinaryanti, A.; Hendrianto, E.; Ihsan, I.S.; Riawan, W.; Rantam, F.A. Osteogenic potential of gingival stromal progenitor cells cultured in platelet rich fibrin is predicted by core-binding factor subunit-alpha1/Sox9 expression ratio ( in vitro). F1000Res 2018, 7, 1134. [Google Scholar] [CrossRef] [PubMed]
- Wesott, D.C.; Pinkerton, M.N.; Gaffey, B.J.; Beggs, K.T.; Milne, T.J.; Meikle, M.C. Osteogenic gene expression by human periodontal ligament cells under cyclic tension. J Dent Res 2007, 86, 1212–1216. [Google Scholar] [CrossRef]
- Singh, A.; Gill, G.; Kaur, H.; Amhmed, M.; Jakhu, H. Role of osteopontin in bone remodeling and orthodontic tooth movement: a review. Prog Orthod 2018, 19, 18. [Google Scholar] [CrossRef] [PubMed]
- Kumar, I.G.; Raghunath, N.; Jyothikiran, H. RANK-RANKL-OPG: A current trends in orthodontic tooth movement and its role in accelerated orthodontics. Int J Appl Dent Sci 2022, 8, 630–635. [Google Scholar] [CrossRef]
- Yamaguchi, M. RANK⁄RANKL ⁄OPG during orthodontic tooth movement. Orthod Craniofac Res 2009, 12, 113–119. [Google Scholar] [CrossRef]
- Vermiglio, G.; Centofanti, A.; Matarese, G.; Militi, A.; Matarese, M.; Arco, A.; Nicita, F.; Cutroneo, G. Human dental pulp tissue during orthodontic tooth movement: An immunofluorescence study. J Funct Morphol Kinesiol 2020, 5. [Google Scholar] [CrossRef] [PubMed]
- Wang, K.; Wei, G.; Liu, D. CD19: a biomarker for B cell development, lymphoma diagnosis and therapy. Exp Hematol Oncol 2012, 1, 36. [Google Scholar] [CrossRef]
- Figueredo, C.M.; Lira-Junior, R.; Love, R.M. T and B cells in periodontal disease: New functions in a complex scenario. Int J Mol Sci 2019, 20, 3949. [Google Scholar] [CrossRef]
- Gao, Y.; Min, Q.; Li, X.; Liu, L.; Lv, Y.; Xu, W.; Liu, X.; Wang, H. Immune system acts on orthodontic tooth movement: Cellular and molecular mechanisms. Biomed Res Int 2022, 2022, 9668610. [Google Scholar] [CrossRef]
- Klein, Y.; Fleissig, O.; Polak, D.; Barenholz, Y.; Mandelboim, O.; Chaushu, S. Immunorthodontics: in vivo gene expression of orthodontic tooth movement. Sci Rep 2020, 10, 8172. [Google Scholar] [CrossRef]
- Anastasi, G.; Cordasco, G.; Matarese, G.; Rizzo, G.; Nucera, R.; Mazza, M.; Militi, A.; Portelli, M.; Cutroneo, G.; Favaloro, A. An immunohistochemical, histological, and electron-microscopic study of the human periodontal ligament during orthodontic treatment. int J Mol Med 2008, 21, 545–554. [Google Scholar] [CrossRef] [PubMed]
- Goda, S.; Hayashi, H.; Ujii, Y.; Takeuchi, O.; Komasa, R.; Domae, E.; Yamamoto, K.; Matsumoto, N.; Ikeo, T. Fibronectin inhibited RANKL-induced differentiation into osteoclast. J Oral Tissue Engin 2014, 11, 227–233. [Google Scholar]
- Manabe, N.; Kawaguchi, H.; Chikuda, H.; Miyaura, C.; Inada, M.; Nagai, R.; Nabeshima, Y.-i.; Nakamura, K.; Sinclair, A.M.; Scheuermann, R.H.; et al. Connection between B lymphocyte and osteoclast differentiation pathways. J Immunol 2001, 167, 2625–2631. [Google Scholar] [CrossRef] [PubMed]
- Lin, J.H.; Lin, I.P.; Ohyama, Y.; Mochida, H.; Kudo, A.; Kaku, M.; Mochida, Y. FAM20C directly binds to and phosphorylates periostin. Sci Rep 2020, 10, 17155. [Google Scholar] [CrossRef] [PubMed]
- Palma-Lara, I.; Perez-Ramirez, M.; Alonso-Themann, P.G.; Espinosa-Garcia, A.M.; Godinez-Aguilar, R.; Bonilla-Delgado, J.; Lopez-Ornelas, A.; Victoria-Acosta, G.; Olguin-Garcia, M.G.; Moreno, J.; et al. FAM20C overview: classic and novel targets, pathogenic variants and Raine syndrome phenotypes. Int J Mol Sci 2021, 22. [Google Scholar] [CrossRef]
- Kawasaki, K.; Kawasaki, M.; Wanatabe, M.; Idrus, E.; Nagai, T.; Oommen, S.; Maeda, T.; Haiwara, N.; Que, J.; Sharpe, P.; et al. Expression of Sox genes in tooth development. Int. J. Dev. Biol. 2015, 59, 471–478. [Google Scholar] [CrossRef]
- Siddharth, S.; Shweta, R.K.; Sunil, K.; Shrinivas, R.; Gayetri, K. Orthodontic forces commanding genes to cue teeth in lines: A meta analysis. Genom & Gene Ther Int J 2018, 2, 000106. [Google Scholar] [CrossRef]
- Wang, C.-W.; Wang, K.-L.; Ho, K.-H.; Hsieh, S.-C.; Chang, H.-M. Dental pulp response to orthodontic tooth movement. Taiwanese J Orthod 2017, 29, 204–212. [Google Scholar] [CrossRef]
- Inchingolo, F.; Inchingolo, A.M.; Malcangi, G.; Ferrante, L.; Trilli, I.; Di Noia, A.; Piras, F.; Mancini, A.; Palermo, A.; Inchingolo, A.D.; et al. The Interaction of cytokines in orthodontics: A systematic review. Appl Sci 2024, 14. [Google Scholar] [CrossRef]
- Luo, H.; Chenglin, W.; Liu, M.; Yin, B.; Huang, D.; Ye, L. ;. Inhibition of SOX9 promotes inflammatory and immune responses of dental Pulp. J Endod 2018, 44, 792–799. [Google Scholar] [CrossRef]
- Ameer, S.A.A.; Alhuwaizi, A.F. The effect of orthodontic force on salivary levels of alkaline phosphatase enzyme. J Bagh Coll Dent 2015, 27, 175–179. [Google Scholar] [CrossRef]
- Al-Khatieeb, M.M.; Rafeeg, R.A.; Saleem, A. The relationship between orthodontic force applied by monoblock and salivary levels of alkaline phosphatase and lactate dehydrogenase enzymes. J Contemp Dent Pract 2018, 19, 1346–1351. [Google Scholar] [CrossRef] [PubMed]
- Florez-Moreno, G.A.; Marin-Restrepo, L.M.; Isaza-Guzman, D.M.; Tobon-Arroyave, S.I. Screening for salivary levels of deoxypyridinoline and bone-specific alkaline phosphatase during orthodontic tooth movement: a pilot study. Eur J Orthod 2013, 35, 361–368. [Google Scholar] [CrossRef] [PubMed]
- Amanda, J.; RWidayati, R.; Soedarsono, N.; Purwanegara, M.K. RANKL concentrations in early orthodontic treatment using passive self-ligating and preadjusted edgewise appliance bracket systems. J Phys Conf. Ser 2018, 1073, 042002. [Google Scholar] [CrossRef]
- Pitt, J.J. Principles and applications of liquid chromatography-mass spectrometry in clinical biochemistry. Clin Biochem Rev 2009, 30, 19–34. [Google Scholar]
Figure 1.
Recruitment and flow diagram (TREND). Seventeen and six patients received FOA (fixed orthodontic appliance) and the Invisalign (IN) system, respectively.
Figure 1.
Recruitment and flow diagram (TREND). Seventeen and six patients received FOA (fixed orthodontic appliance) and the Invisalign (IN) system, respectively.
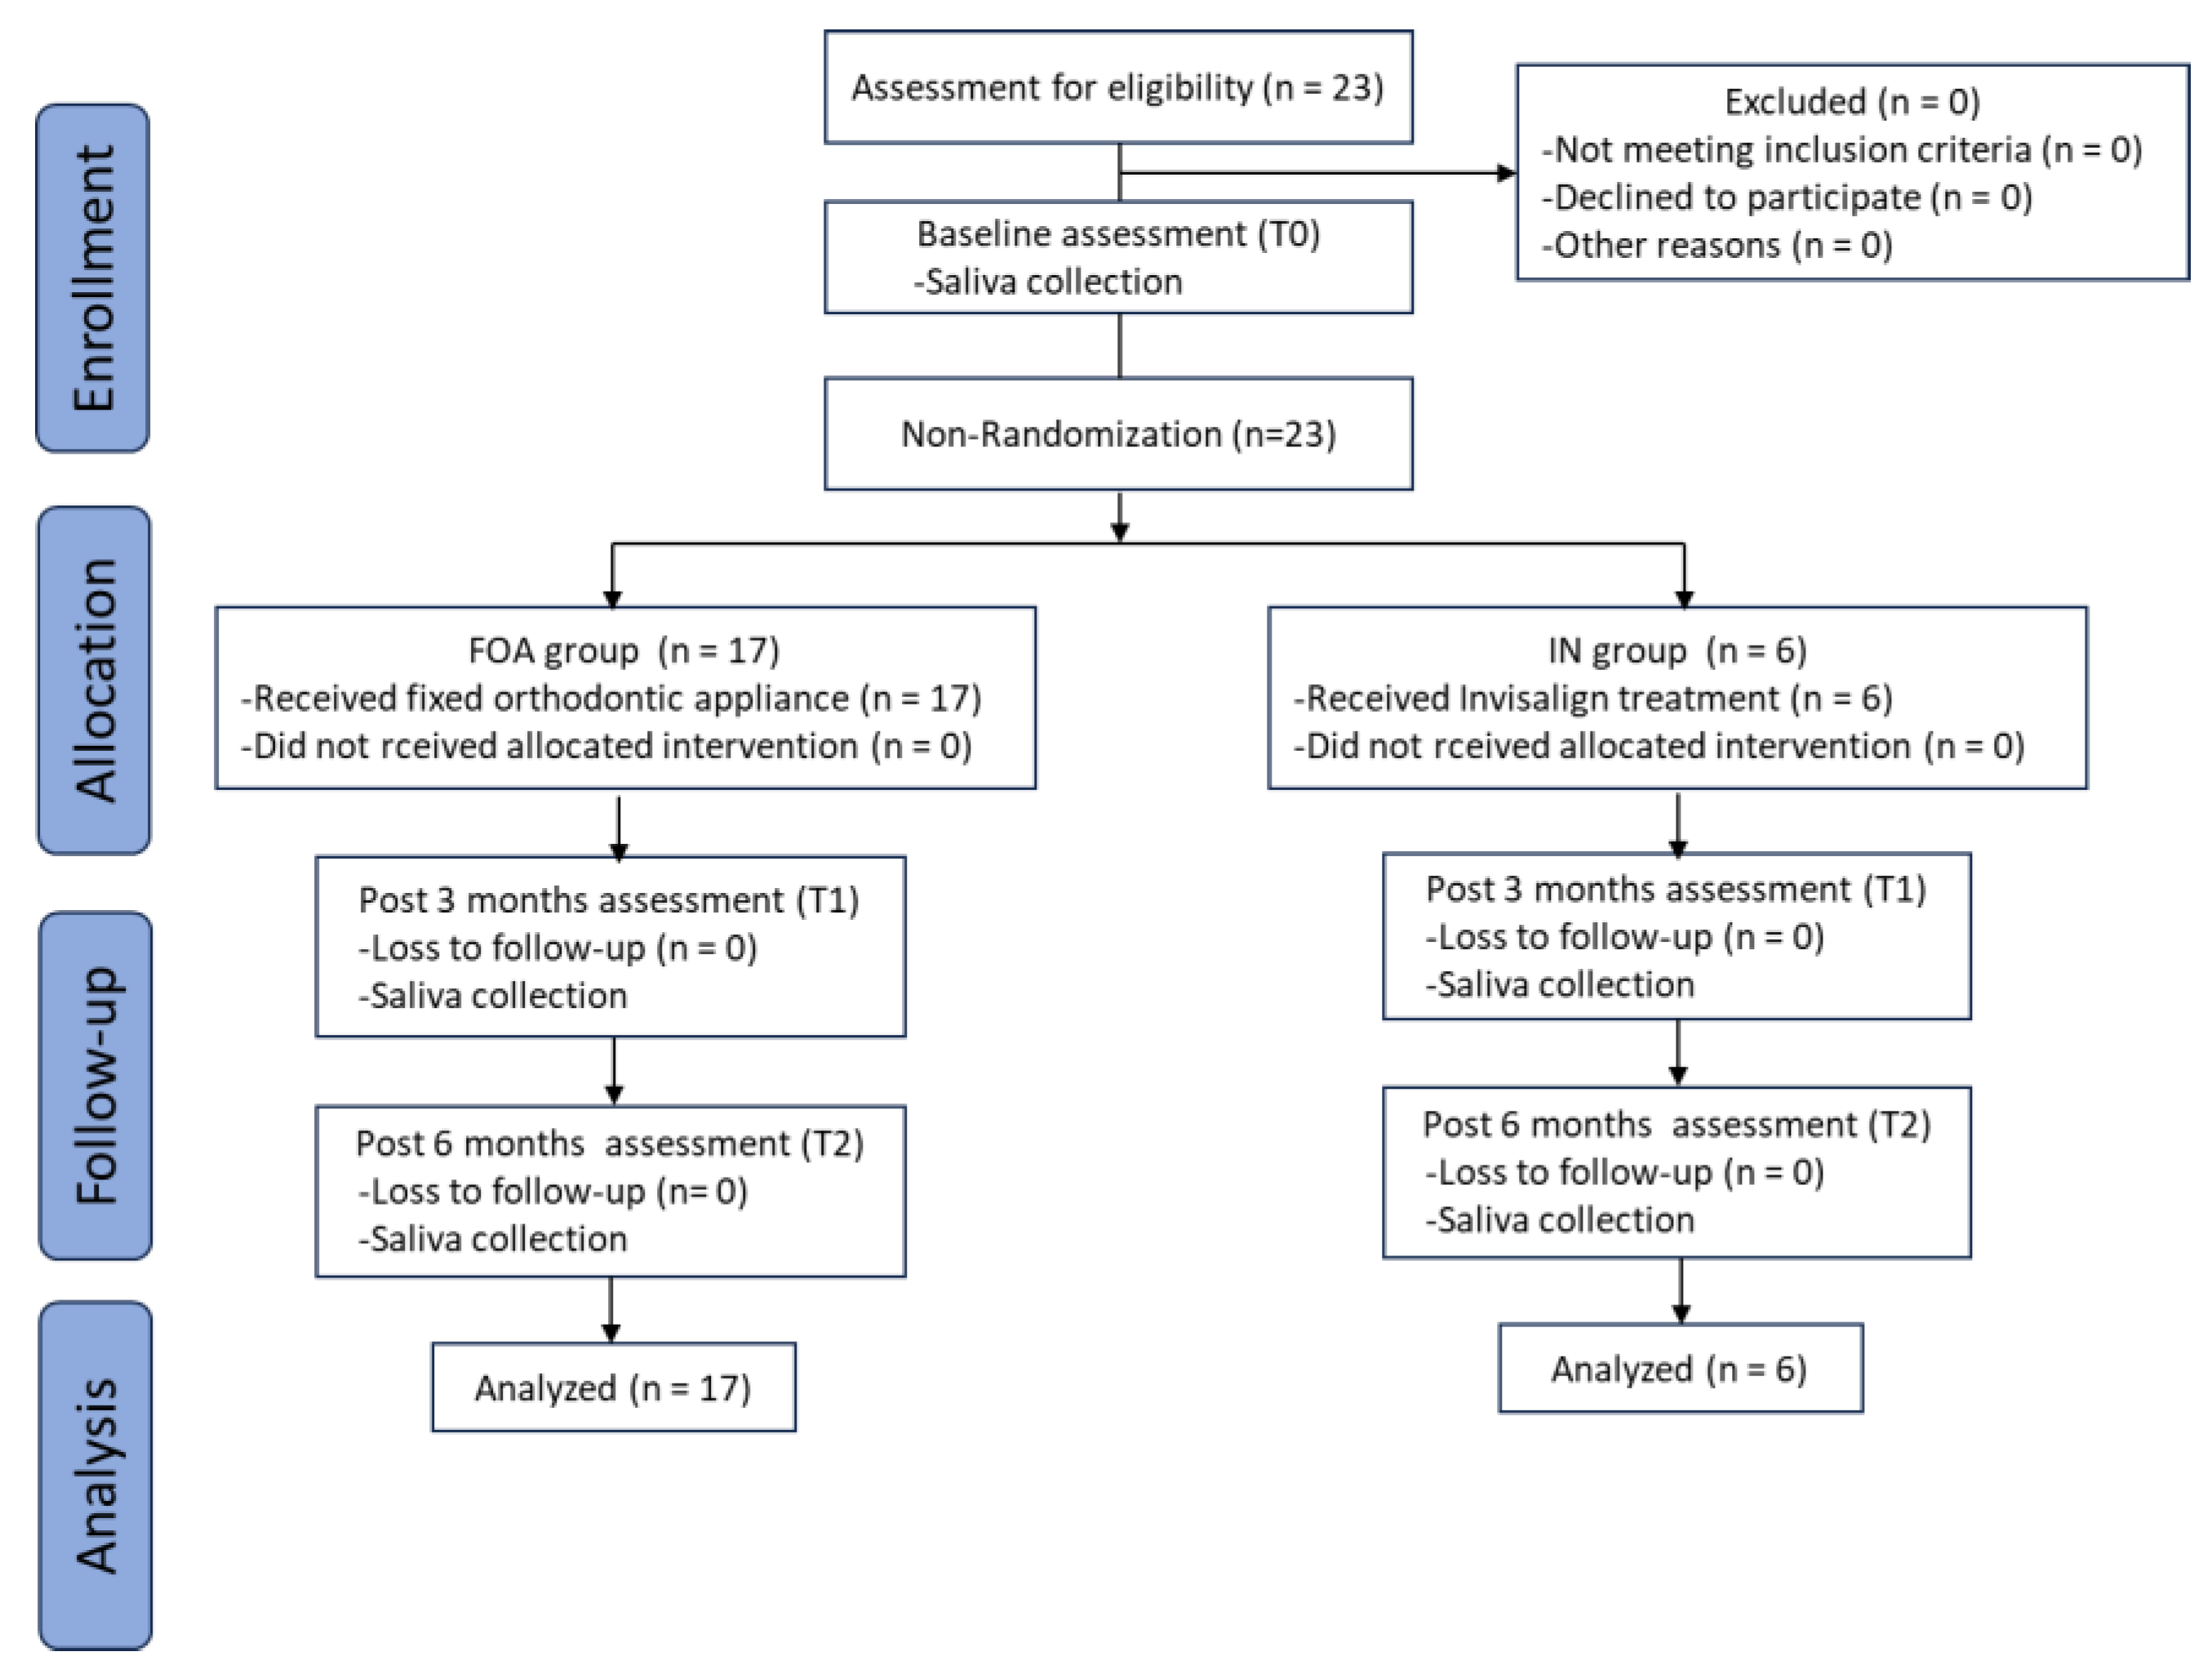
Figure 2.
Functional classification of the identified proteins based on the biological process category of Gene Ontology (GO). A total of 17,603 DEPs involved in biological processes were identified in whole saliva of FOA and IN patients. Within each overarching biological process category, proteins were further classified into specific GO terms, presented on the y-axis, with the corresponding number of proteins indicated on the x-axis. Protein expression levels, represented as -log₁₀(FDR), are indicated by a color gradient ranging from blue (low expression) to red (high expression).
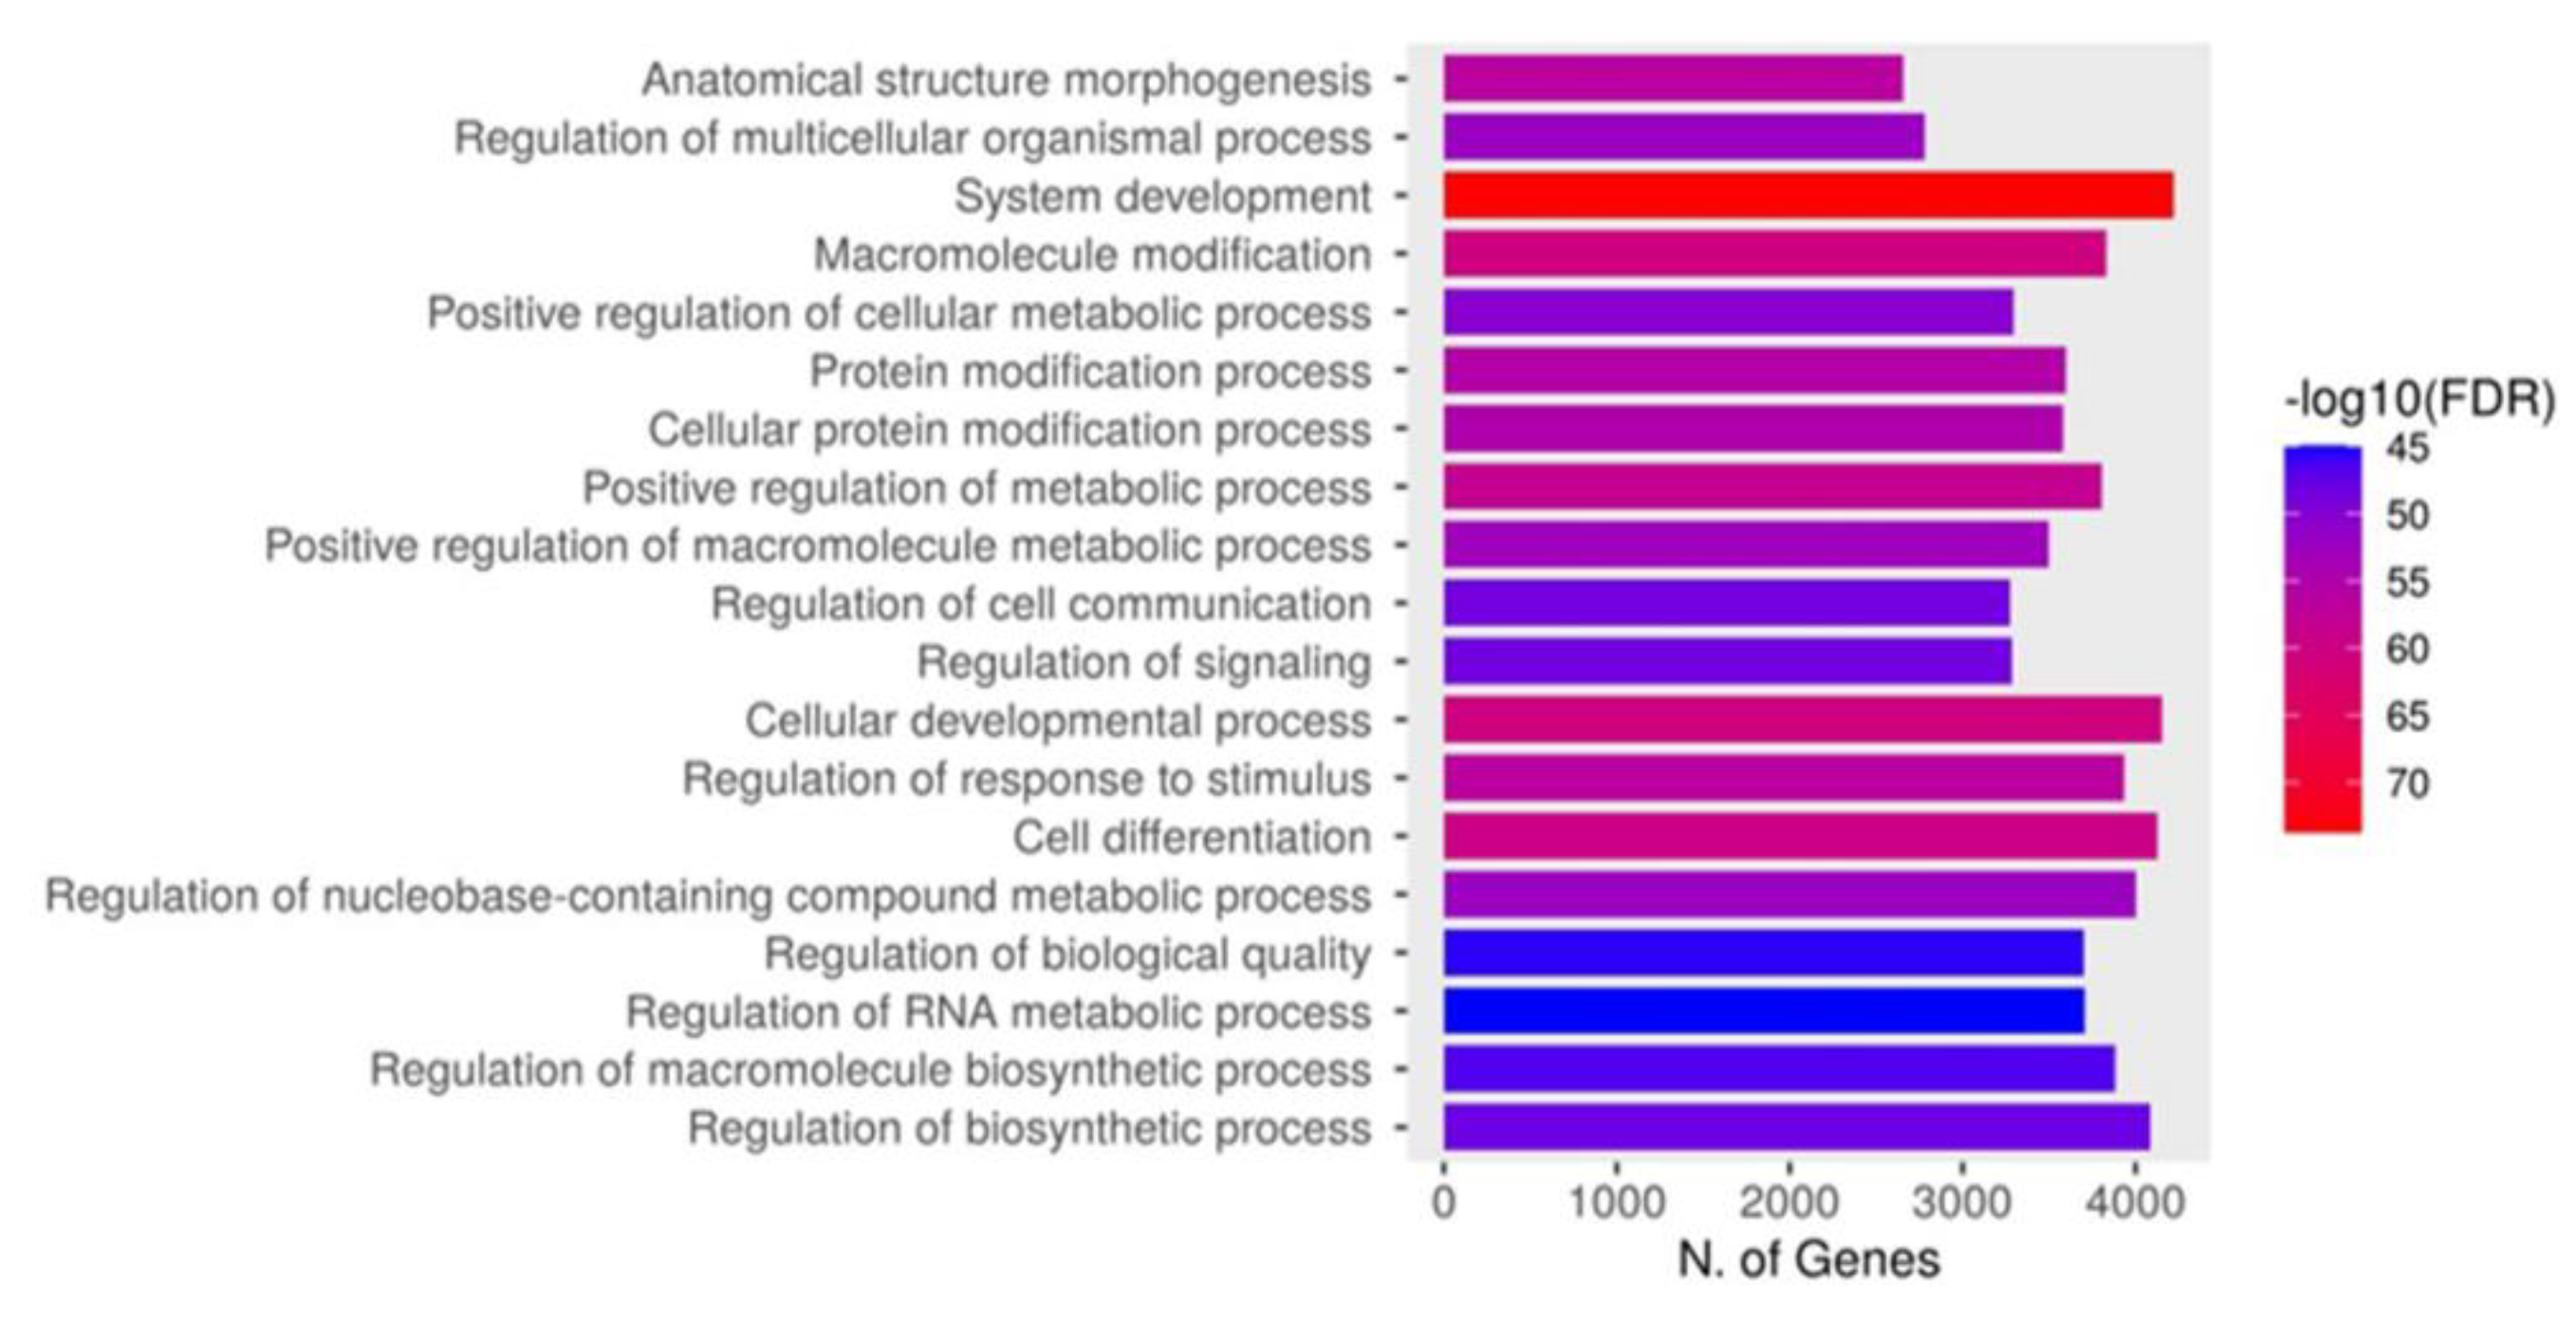
Figure 3.
Three-dimensional Partial Least Squares Discriminant Analysis (3D PLS-DA) of salivary proteins at T0, T1, and T2. The 3D PLS-DA plot captures variance between groups using the first three components. Component 1 explains 3.5% of the variance, component 2 explains 2.8%, and component 3 accounts for 1.2% of the variance. Different groups are represented by distinct colors with corresponding ellipsoids delineating the 95% confidence intervals of data distributions. The red, green, dark blue, light blue, and pink points represent individual saliva samples from five distinct observational conditions, emphasizing the multivariate separation among them. Pink represents expressed proteins at T0 for both FOA and IN groups. Dark blue and light blue represent FOA at T1 and T2, respectively. Red represents IN at T1, while green denotes IN at T2.
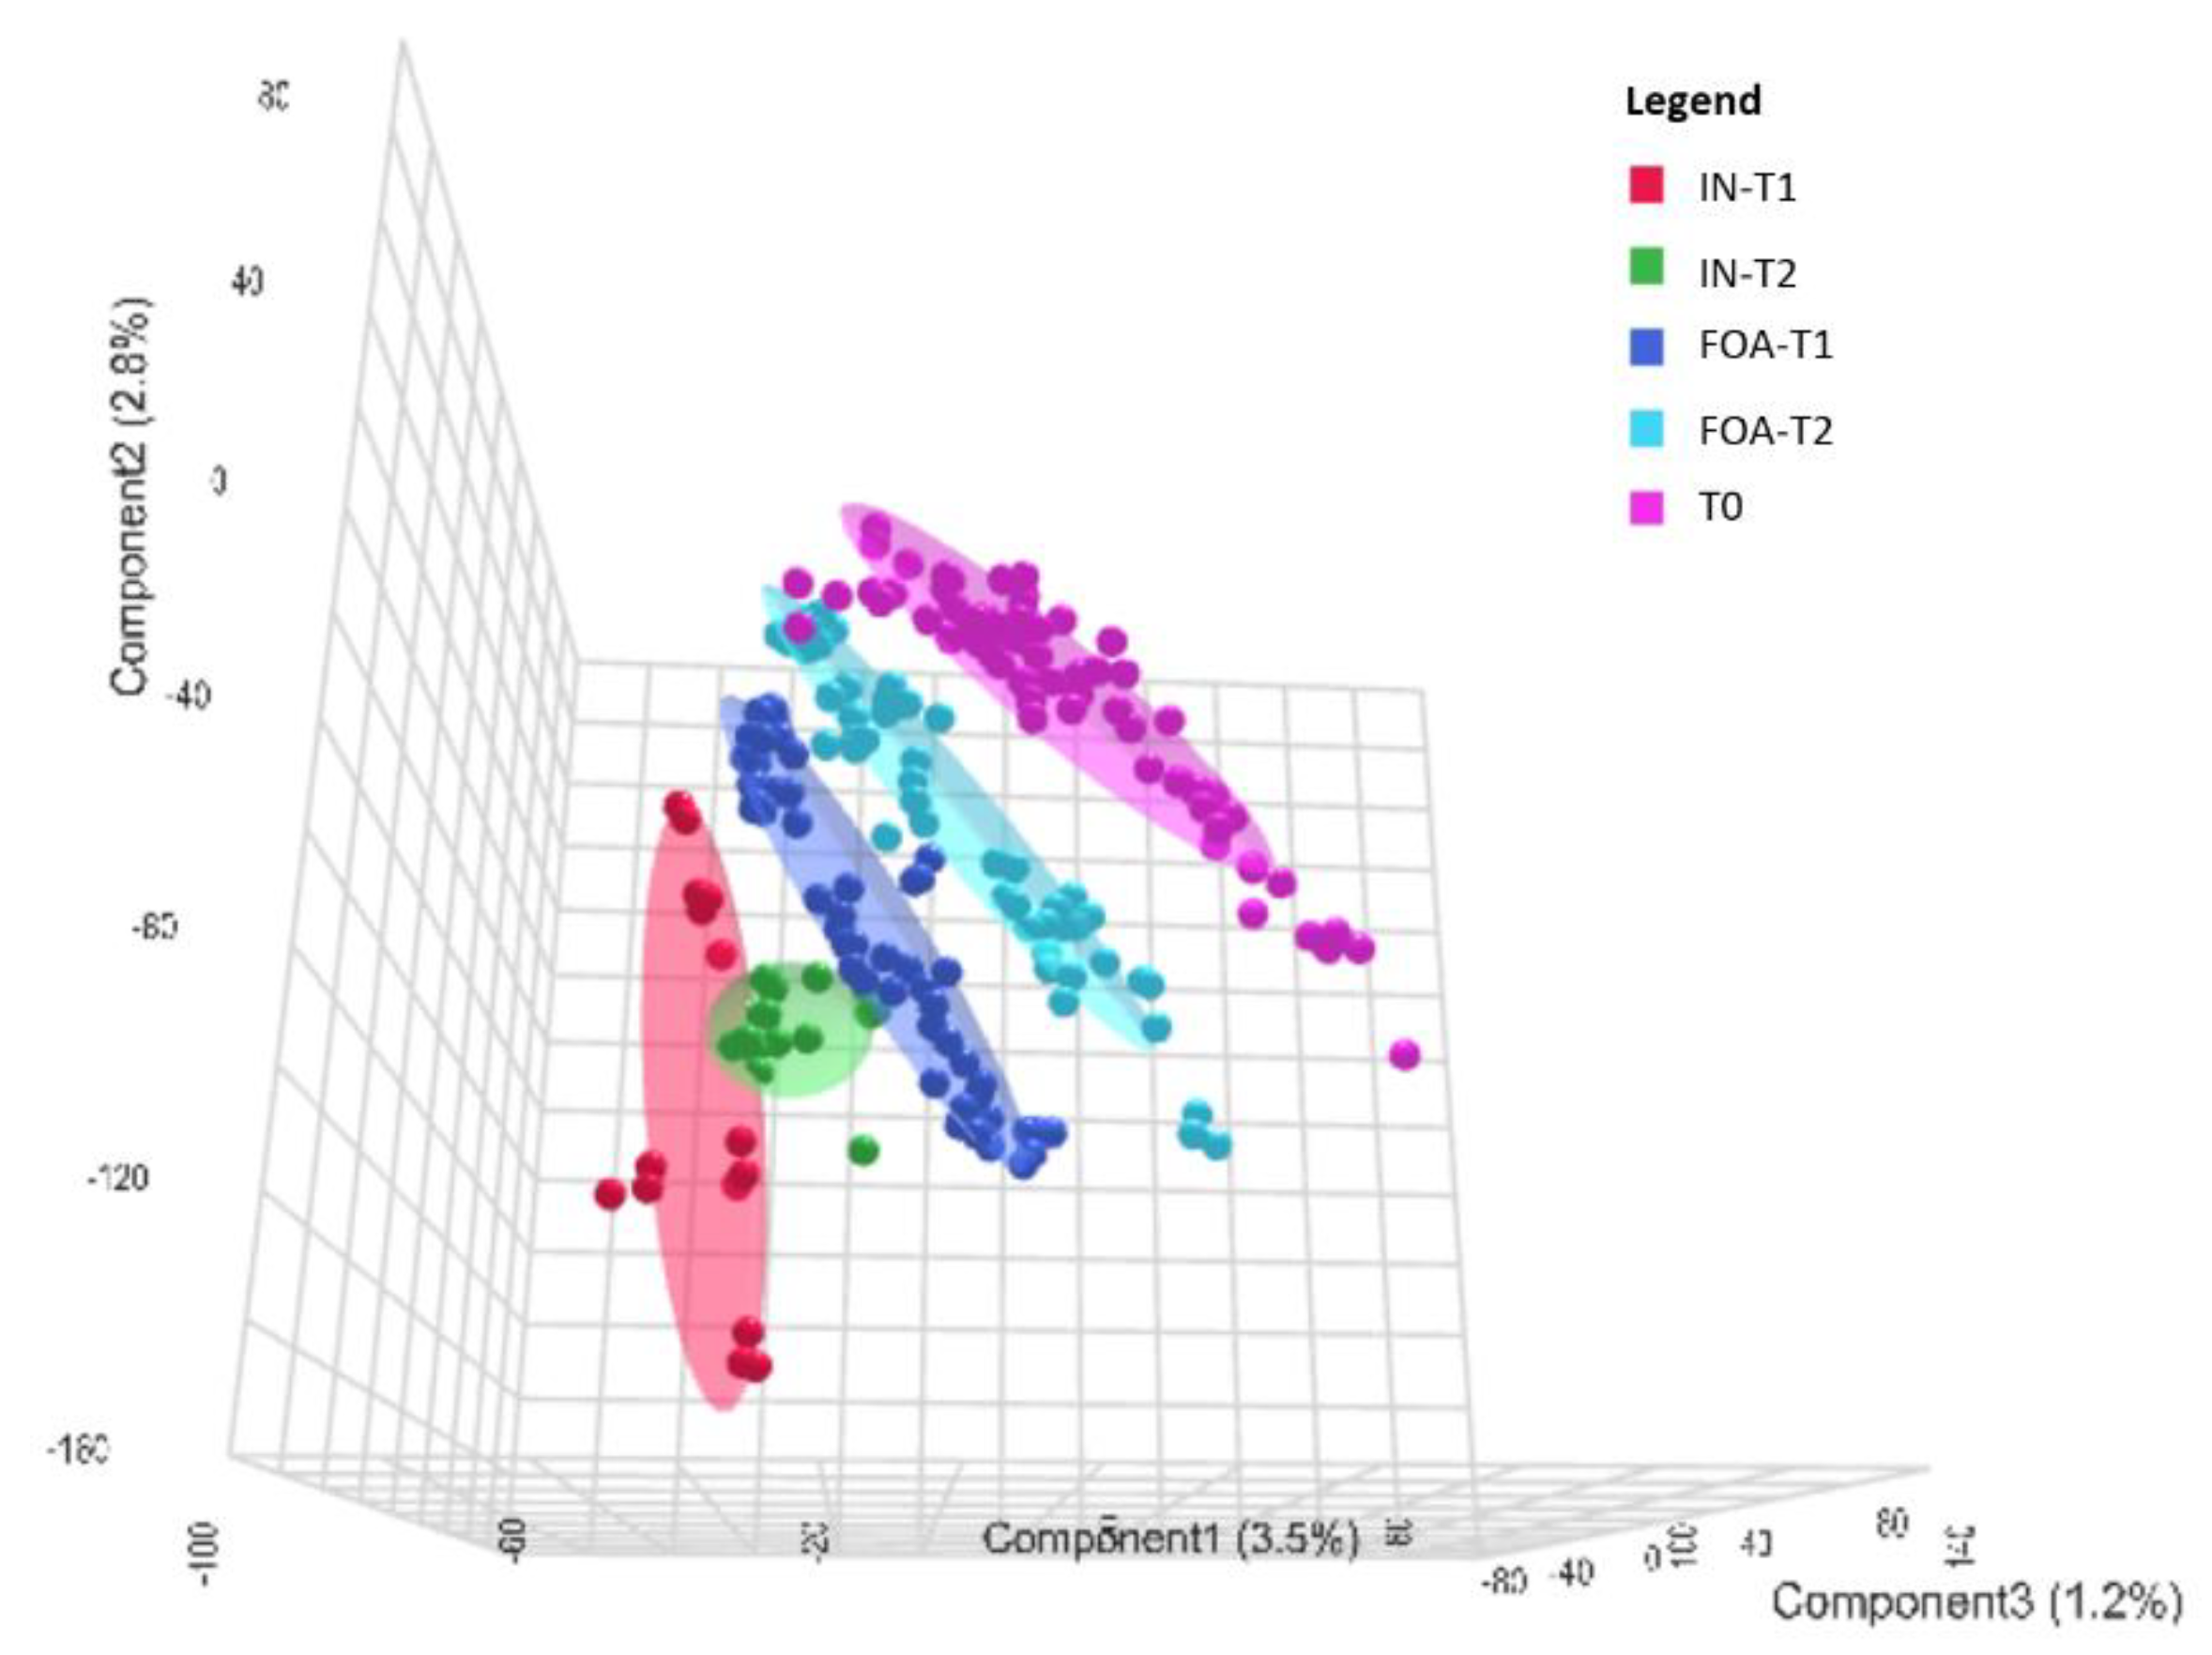
Figure 4.
One-way ANOVA identification of differentially expressed proteins (DEPs) in response to orthodontic treatments. The plots depict one-way ANOVA results showing (A) the top 12 DEPs when comparing FOA and IN at T1 and (B) the top 50 DEPs when comparing FOA and IN at T2. Only three proteins—P15391 (CD19), Q8IXL6 (FAM20C), and Q96P88 (GNRHR)—were identified in both groups. Note: The Y-axis scale of the scatter plot was automatically adjusted by Metaboanalyst based on the range of -log₁₀(raw P). Colored dots (yellow to red spectrum) represent statistically significant proteins (P < 0.05), while gray dots indicate no significant difference in protein expression (P > 0.05).
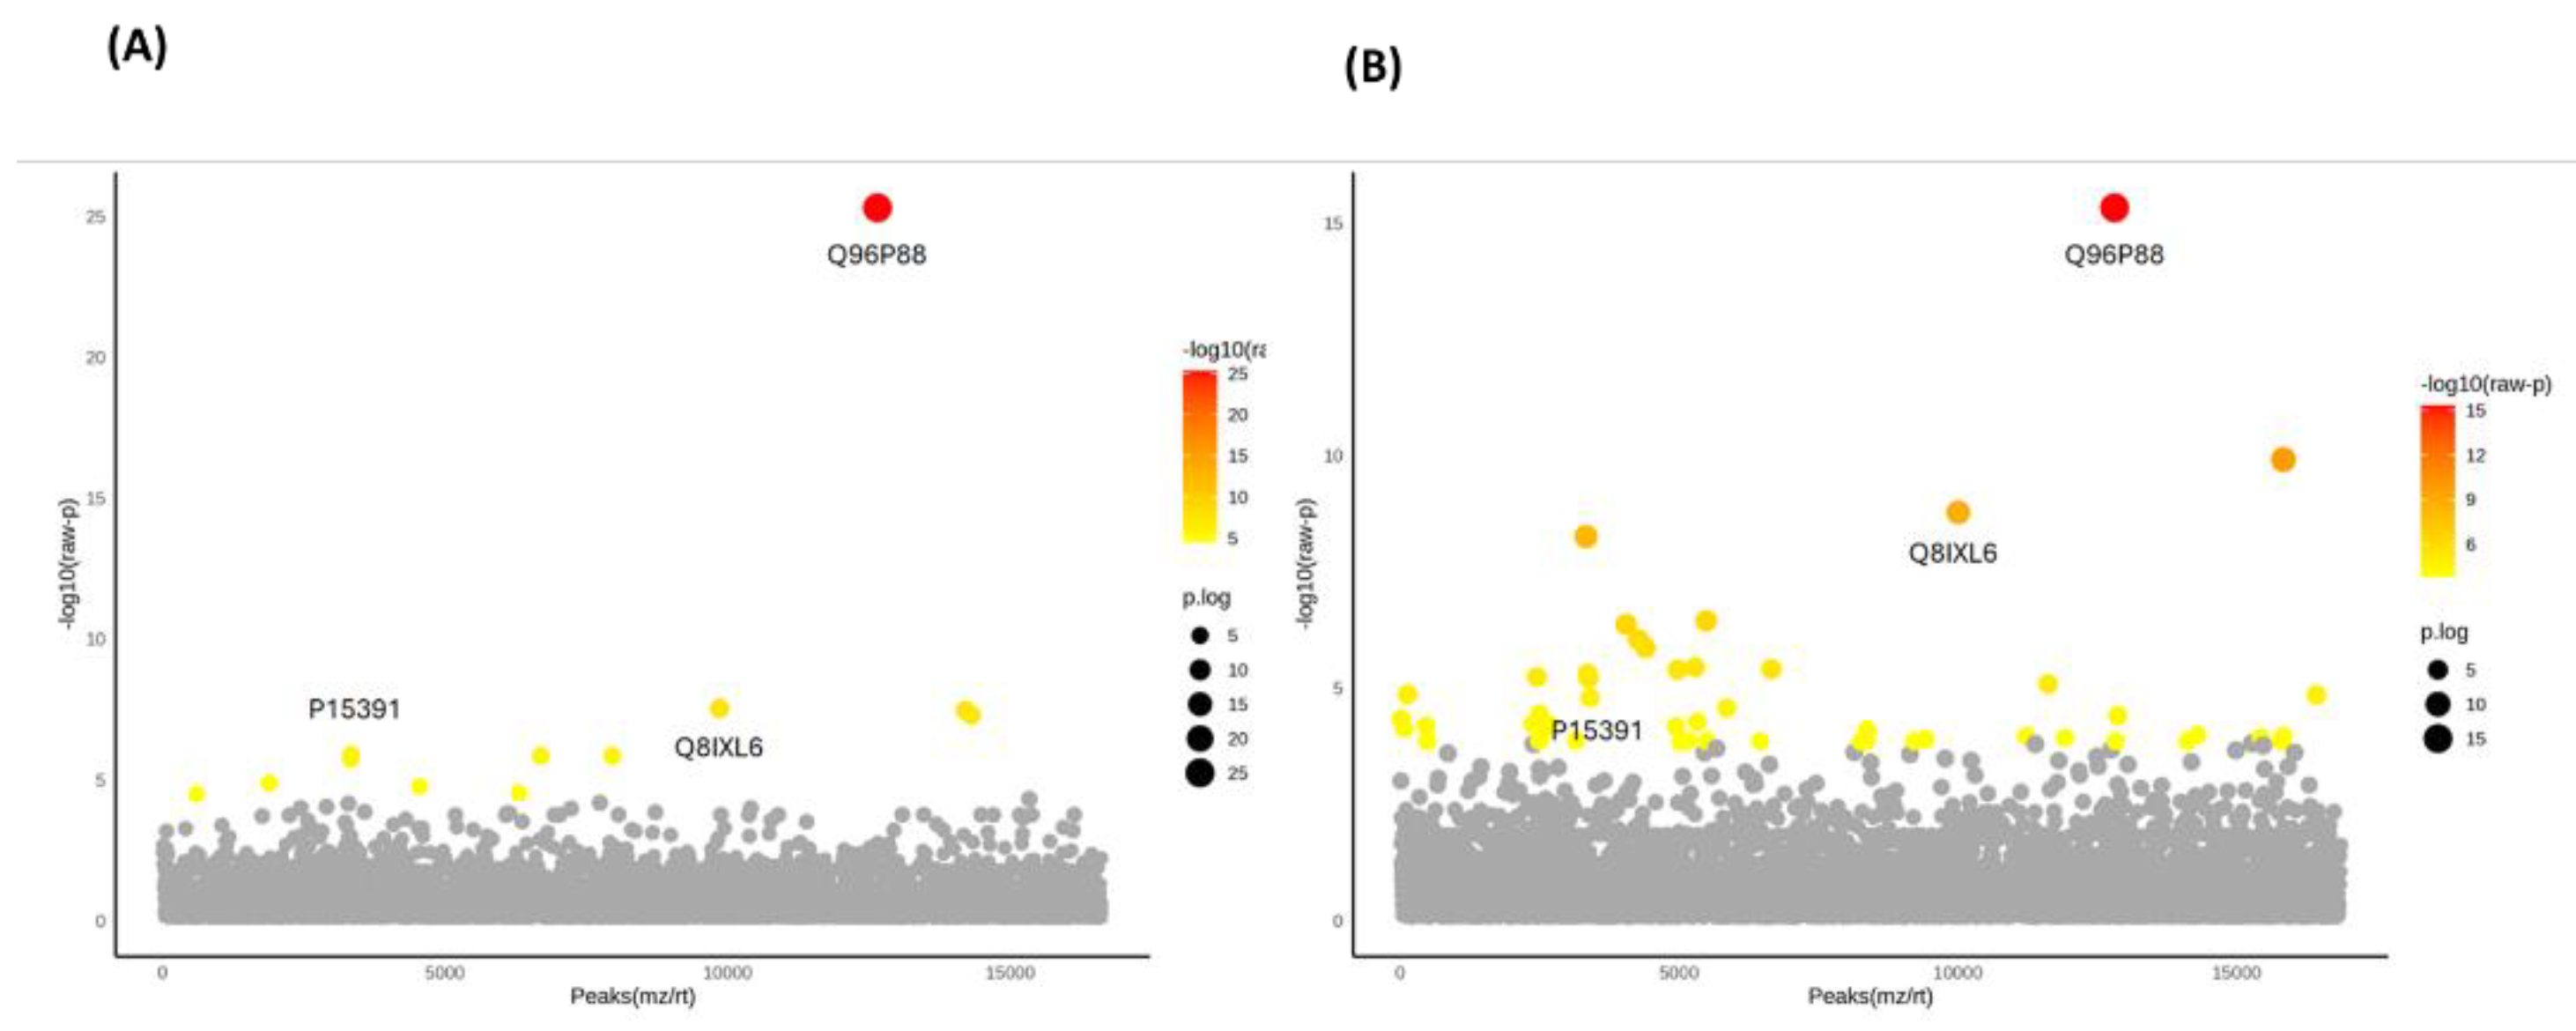
Figure 5.
Heatmap analysis of DEPs in FOA and IN at T0, T1, and T2. (A) Heatmap of the top 12 proteins based on one-way ANOVA in FOA and IN at T1 compared to T0. (B) Heatmap of the top 50 proteins based on one-way ANOVA in FOA and IN at T2 compared to T0. The color gradient from blue to red indicates the degree of expression from low to high.
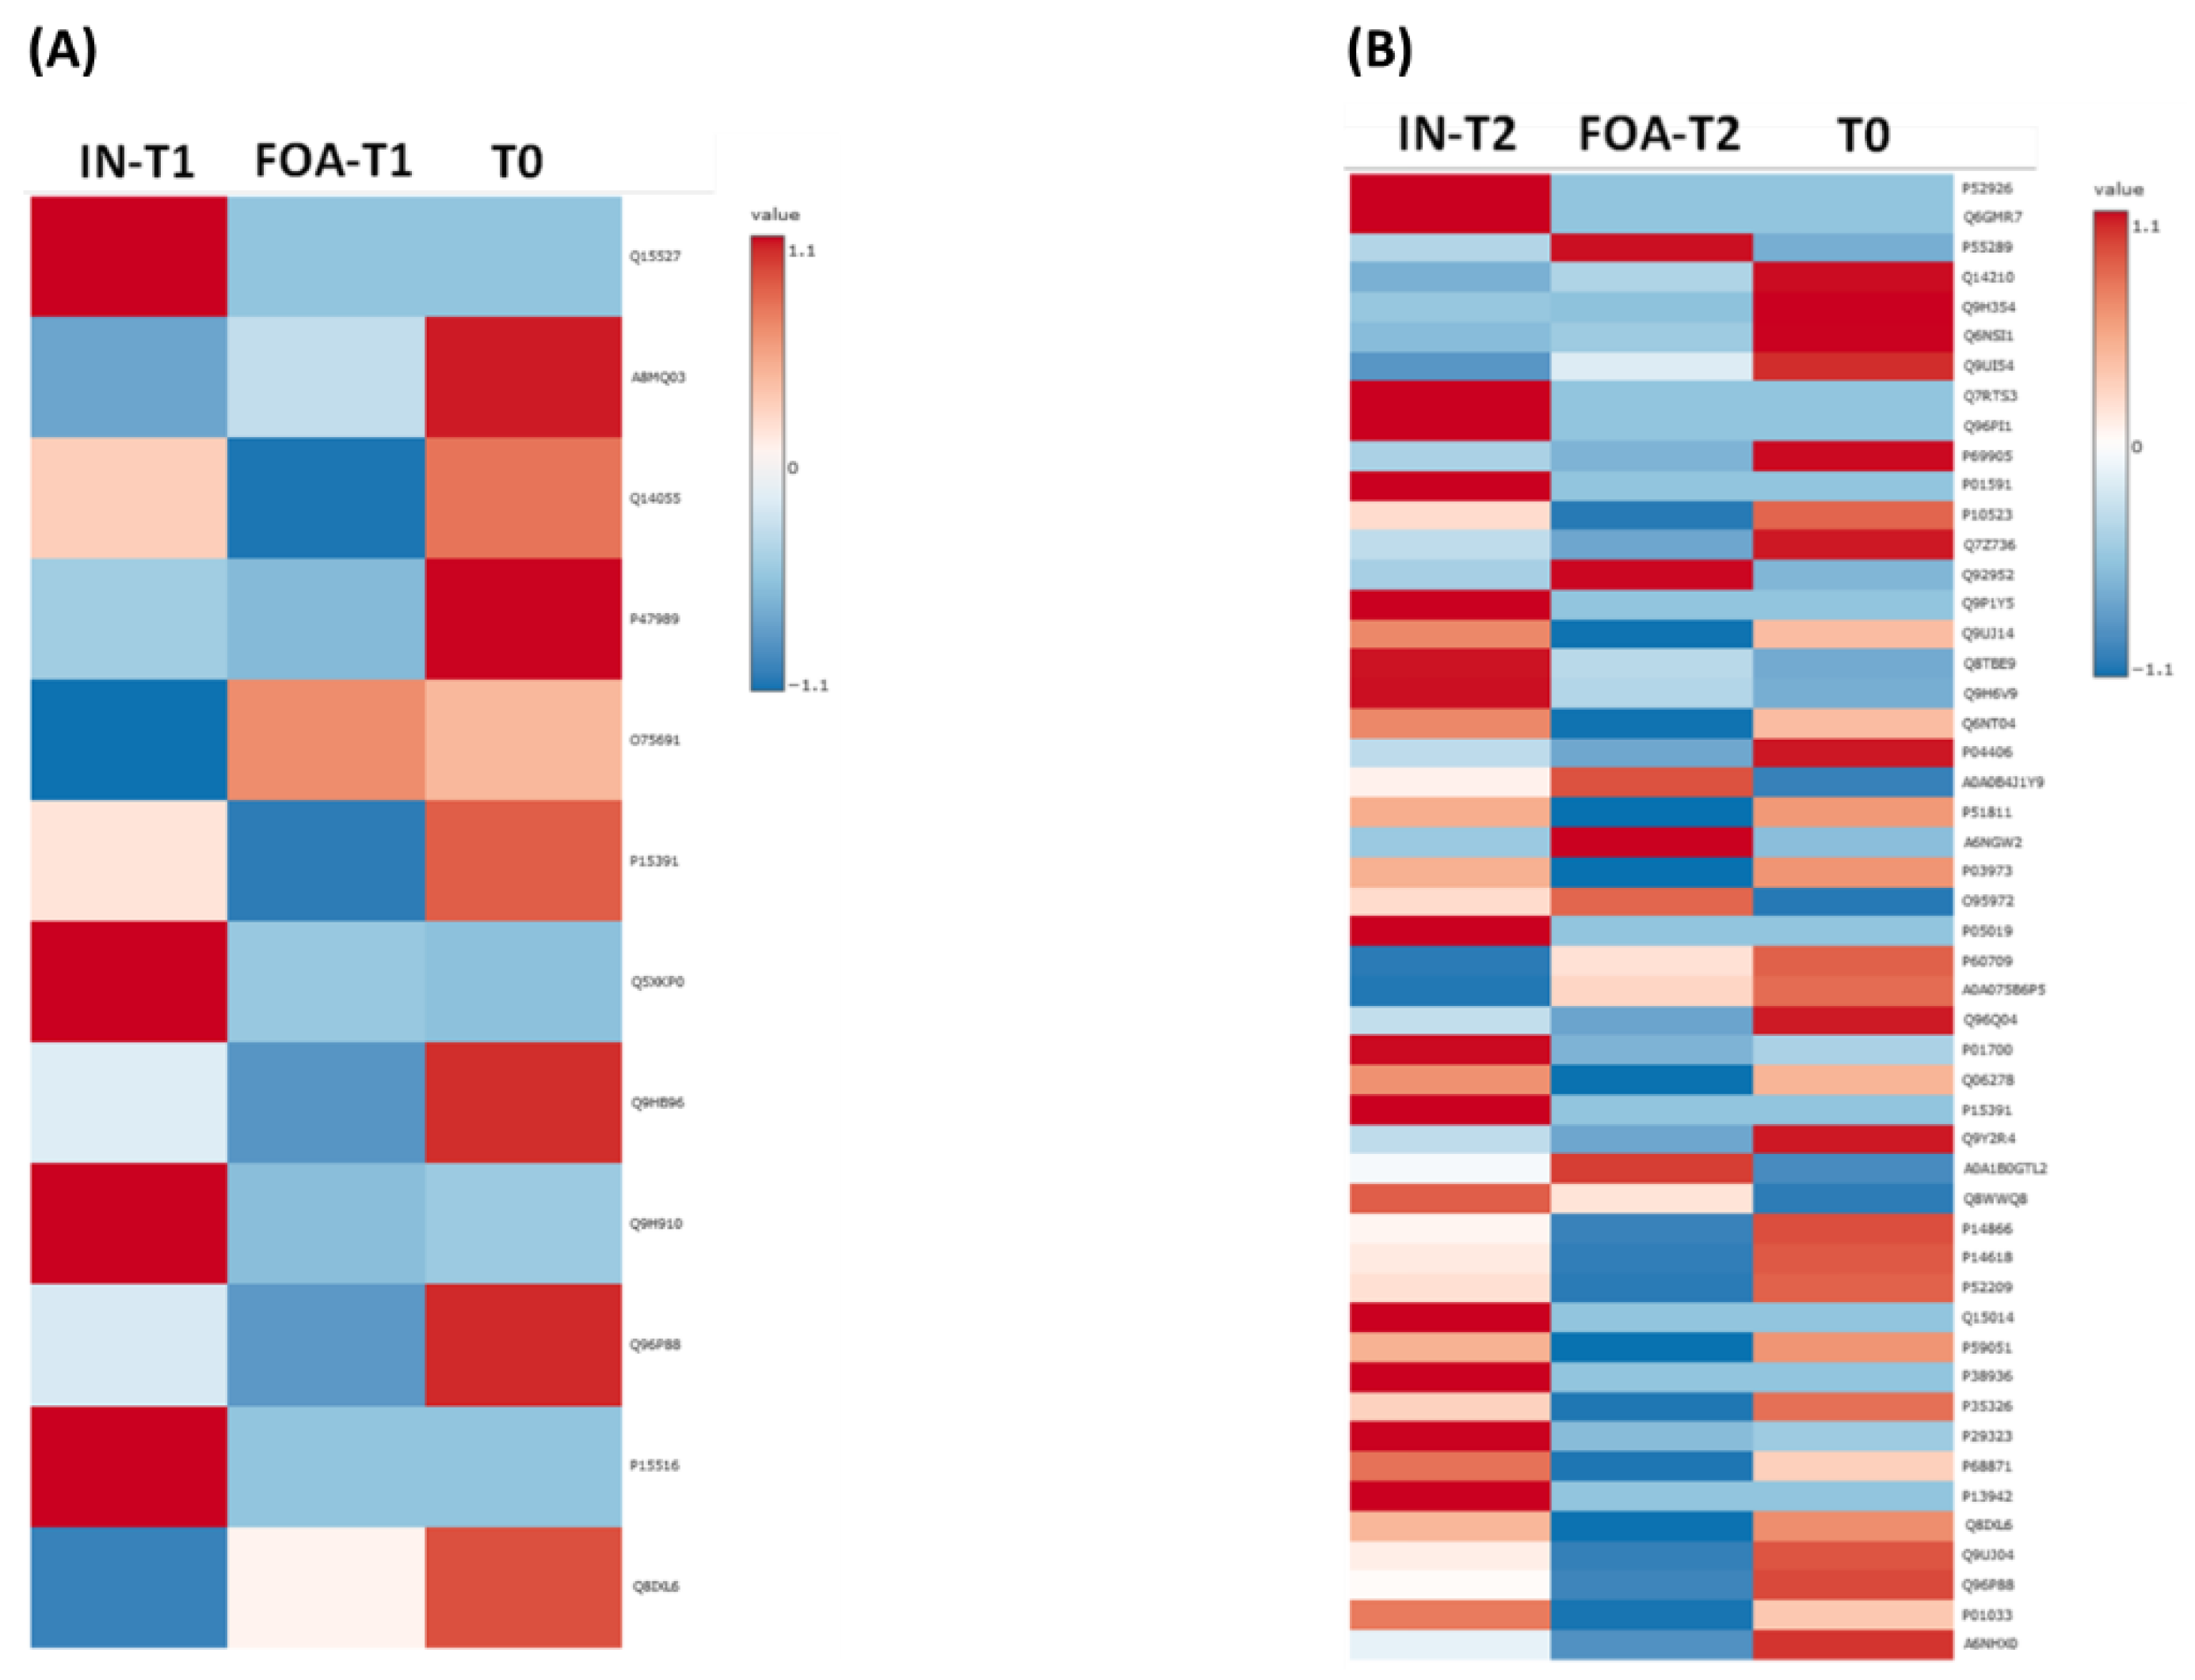
Figure 6.
Bar graphs of CD19, FAM20C, and GNRHR expression in FOA and IN at T0, T1, and T2. These graphs represent the results of two-way repeated measures ANOVA and Tukey's HSD test comparing the mean values of (A) P15391/CD19, (B) Q8IXL6/FAM20C, and (C) Q96P88/GNRHR from baseline over time between the FOA and IN groups. The y-axis represents the normalized peak intensity of proteins obtained from LC-MS/MS analysis. The x-axis represents three time points in each group. Each bar represents the mean (± SEM) of three different replicates.* P < 0.05, **P < 0.01, ***P< 0.001 and ****P < 0.0001 indicate levels of statistical significance between time points within groups, whereas #P < 0.05 indicates FOA versus IN differences at the same time point.
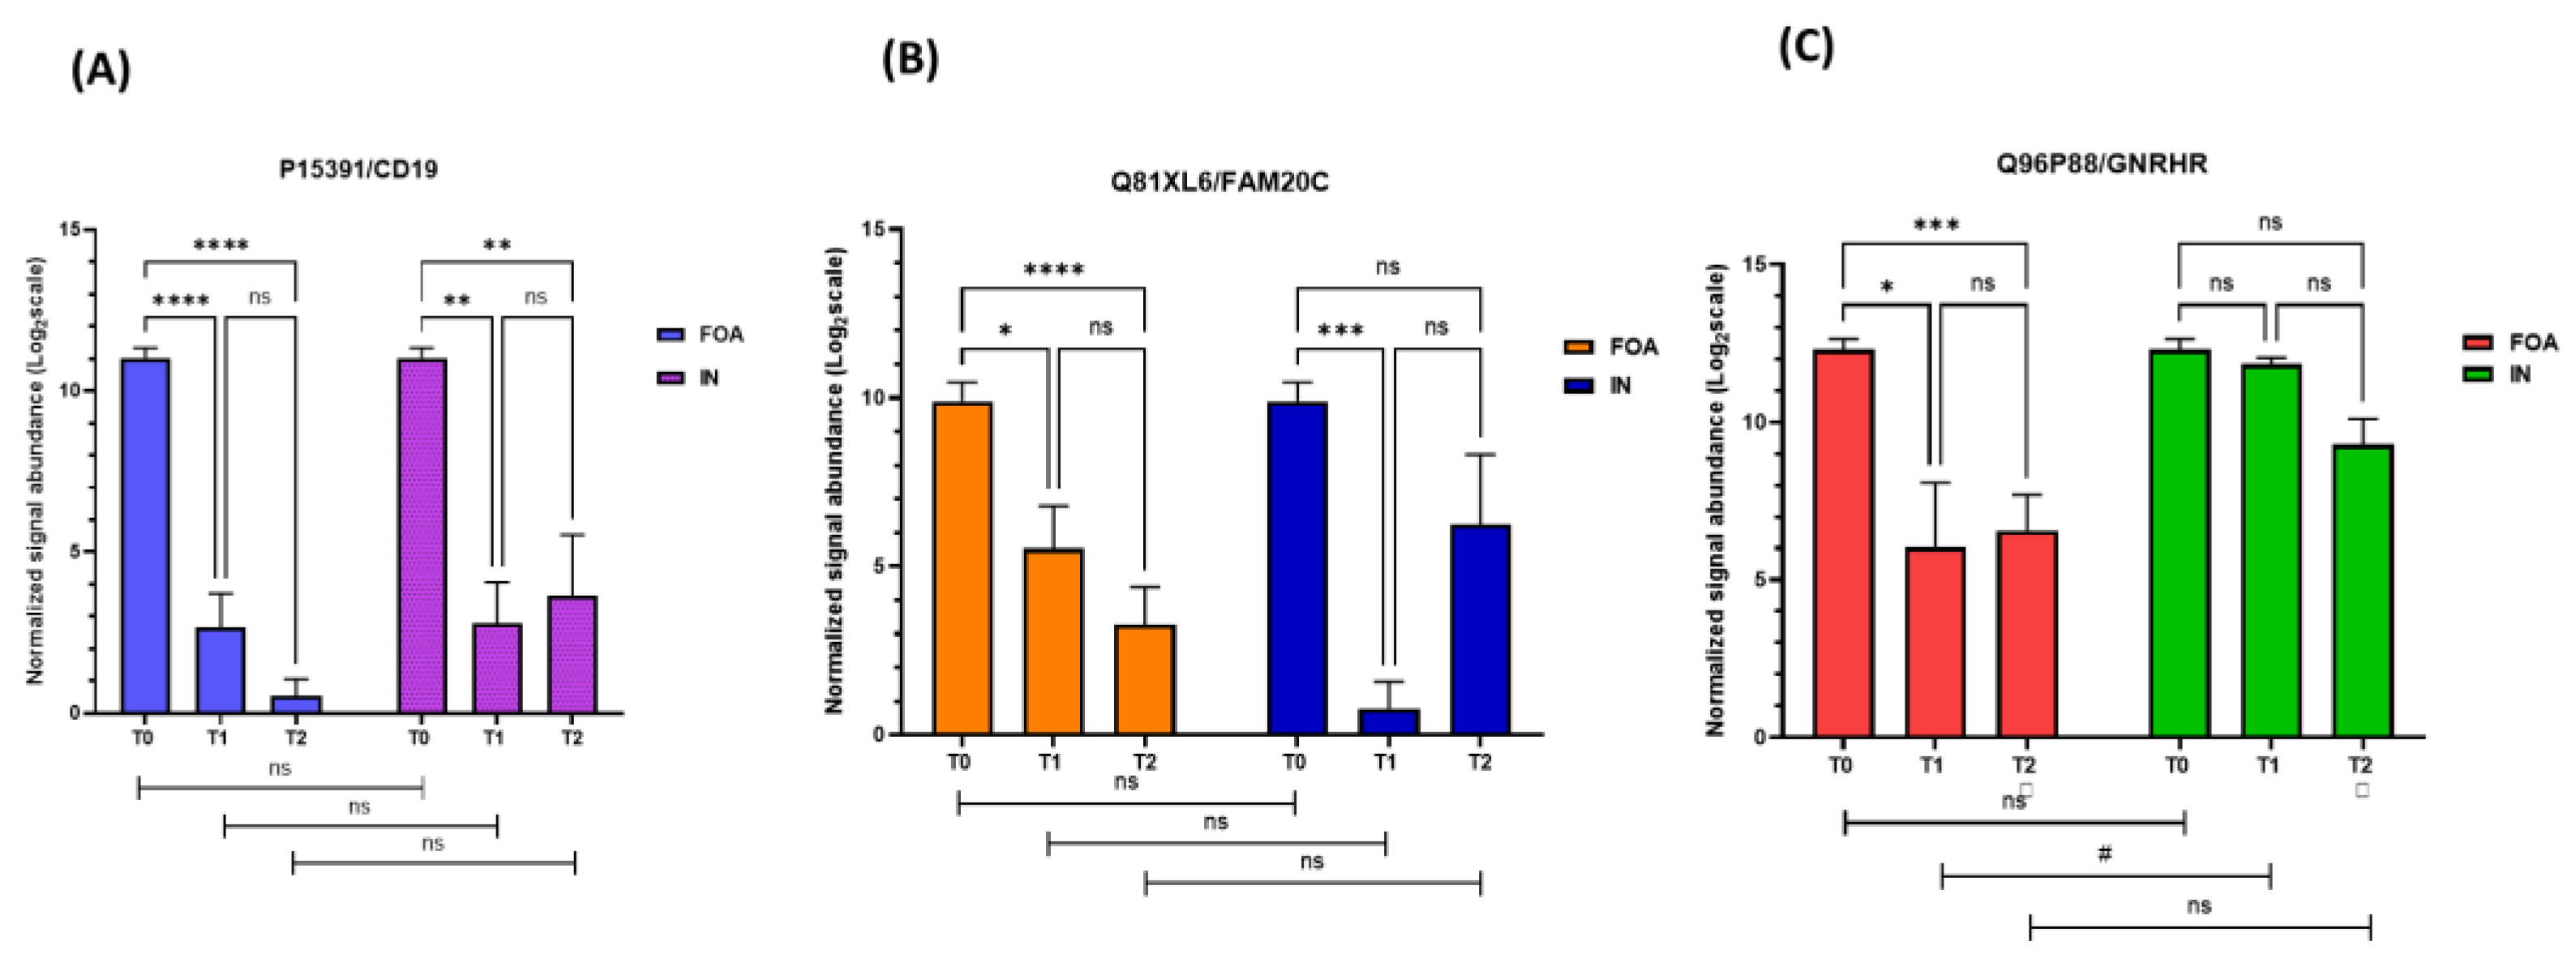
Figure 8.
Interaction networks of 50 DEPs in FOA and IN at T2. The STRING database demonstrated associations between certain proteins among the 50 DEPs (red boxes) and proteins related to OTM (dashed blue boxes), including ALPL, BGLAP, COL1A1, COL1A2, DSPP, SOX9, SPP1, TNFRSF11B, TNFSF11, and FN1. Proteins are represented by colored nodes, and interactions are represented by edges. Lines between nodes (edges) represent the type of evidence used in predicting the associations: co-occurrence evidence (blue), neighborhood evidence (green), experimental evidence (purple), database evidence (light blue), and co-expression evidence (black).
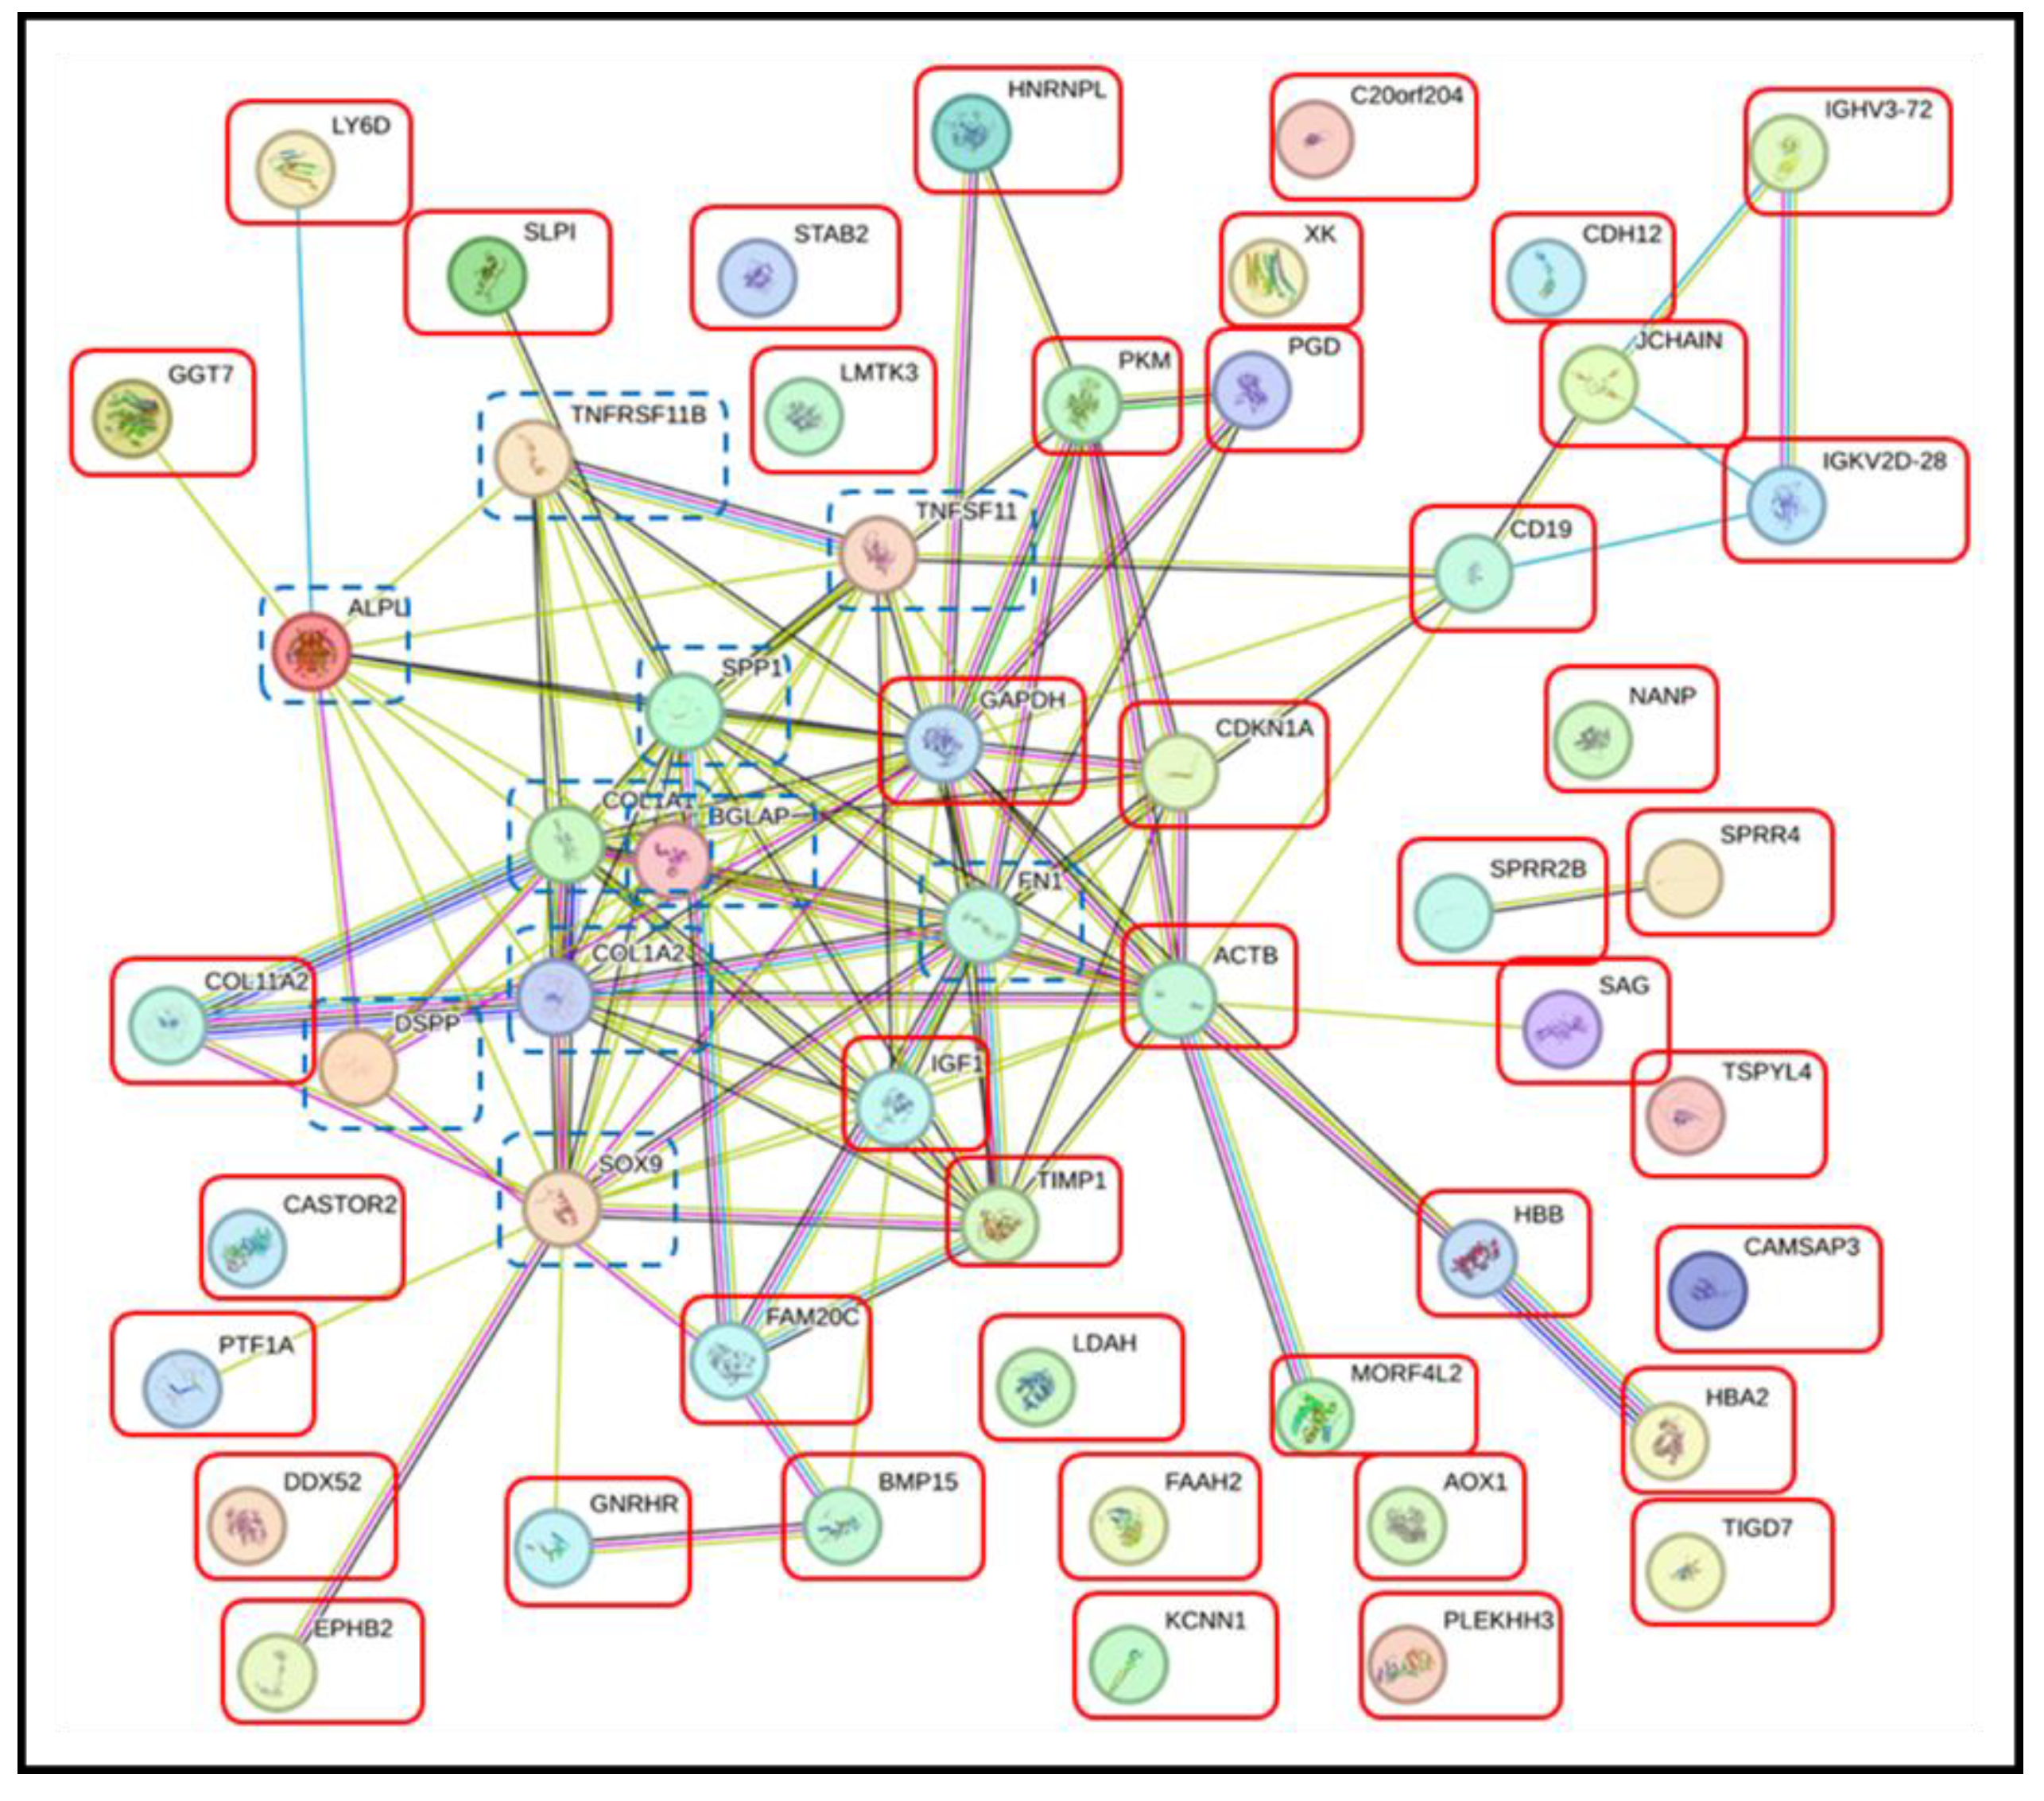
Figure 7.
Interaction networks of 12 DEPs in FOA and IN at T1. The STRING database demonstrated associations between certain proteins among the 12 DEPs (red boxes) and proteins related to OTM (dashed blue boxes), including ALPL (alkaline phosphatase), BGLAP (osteocalcin), COL1A1 (collagen alpha-1), COL1A2 (collagen alpha-2), DSPP (dentin sialophosphoprotein), TNFSF11 (tumor necrosis factor receptor superfamily member 11 or RANK), TNFRSF11B (tumor necrosis factor receptor superfamily member 11B or osteoprotegerin), SOX9 (sex-determining region Y-box 9), SPP1 (osteopontin), and FN1 (fibronectin). Proteins are represented by colored nodes, and interactions are represented by edges. Lines between nodes (edges) represent the type of evidence used in predicting the associations: co-occurrence evidence (blue), neighborhood evidence (green), experimental evidence (purple), database evidence (light blue), and co-expression evidence (black).
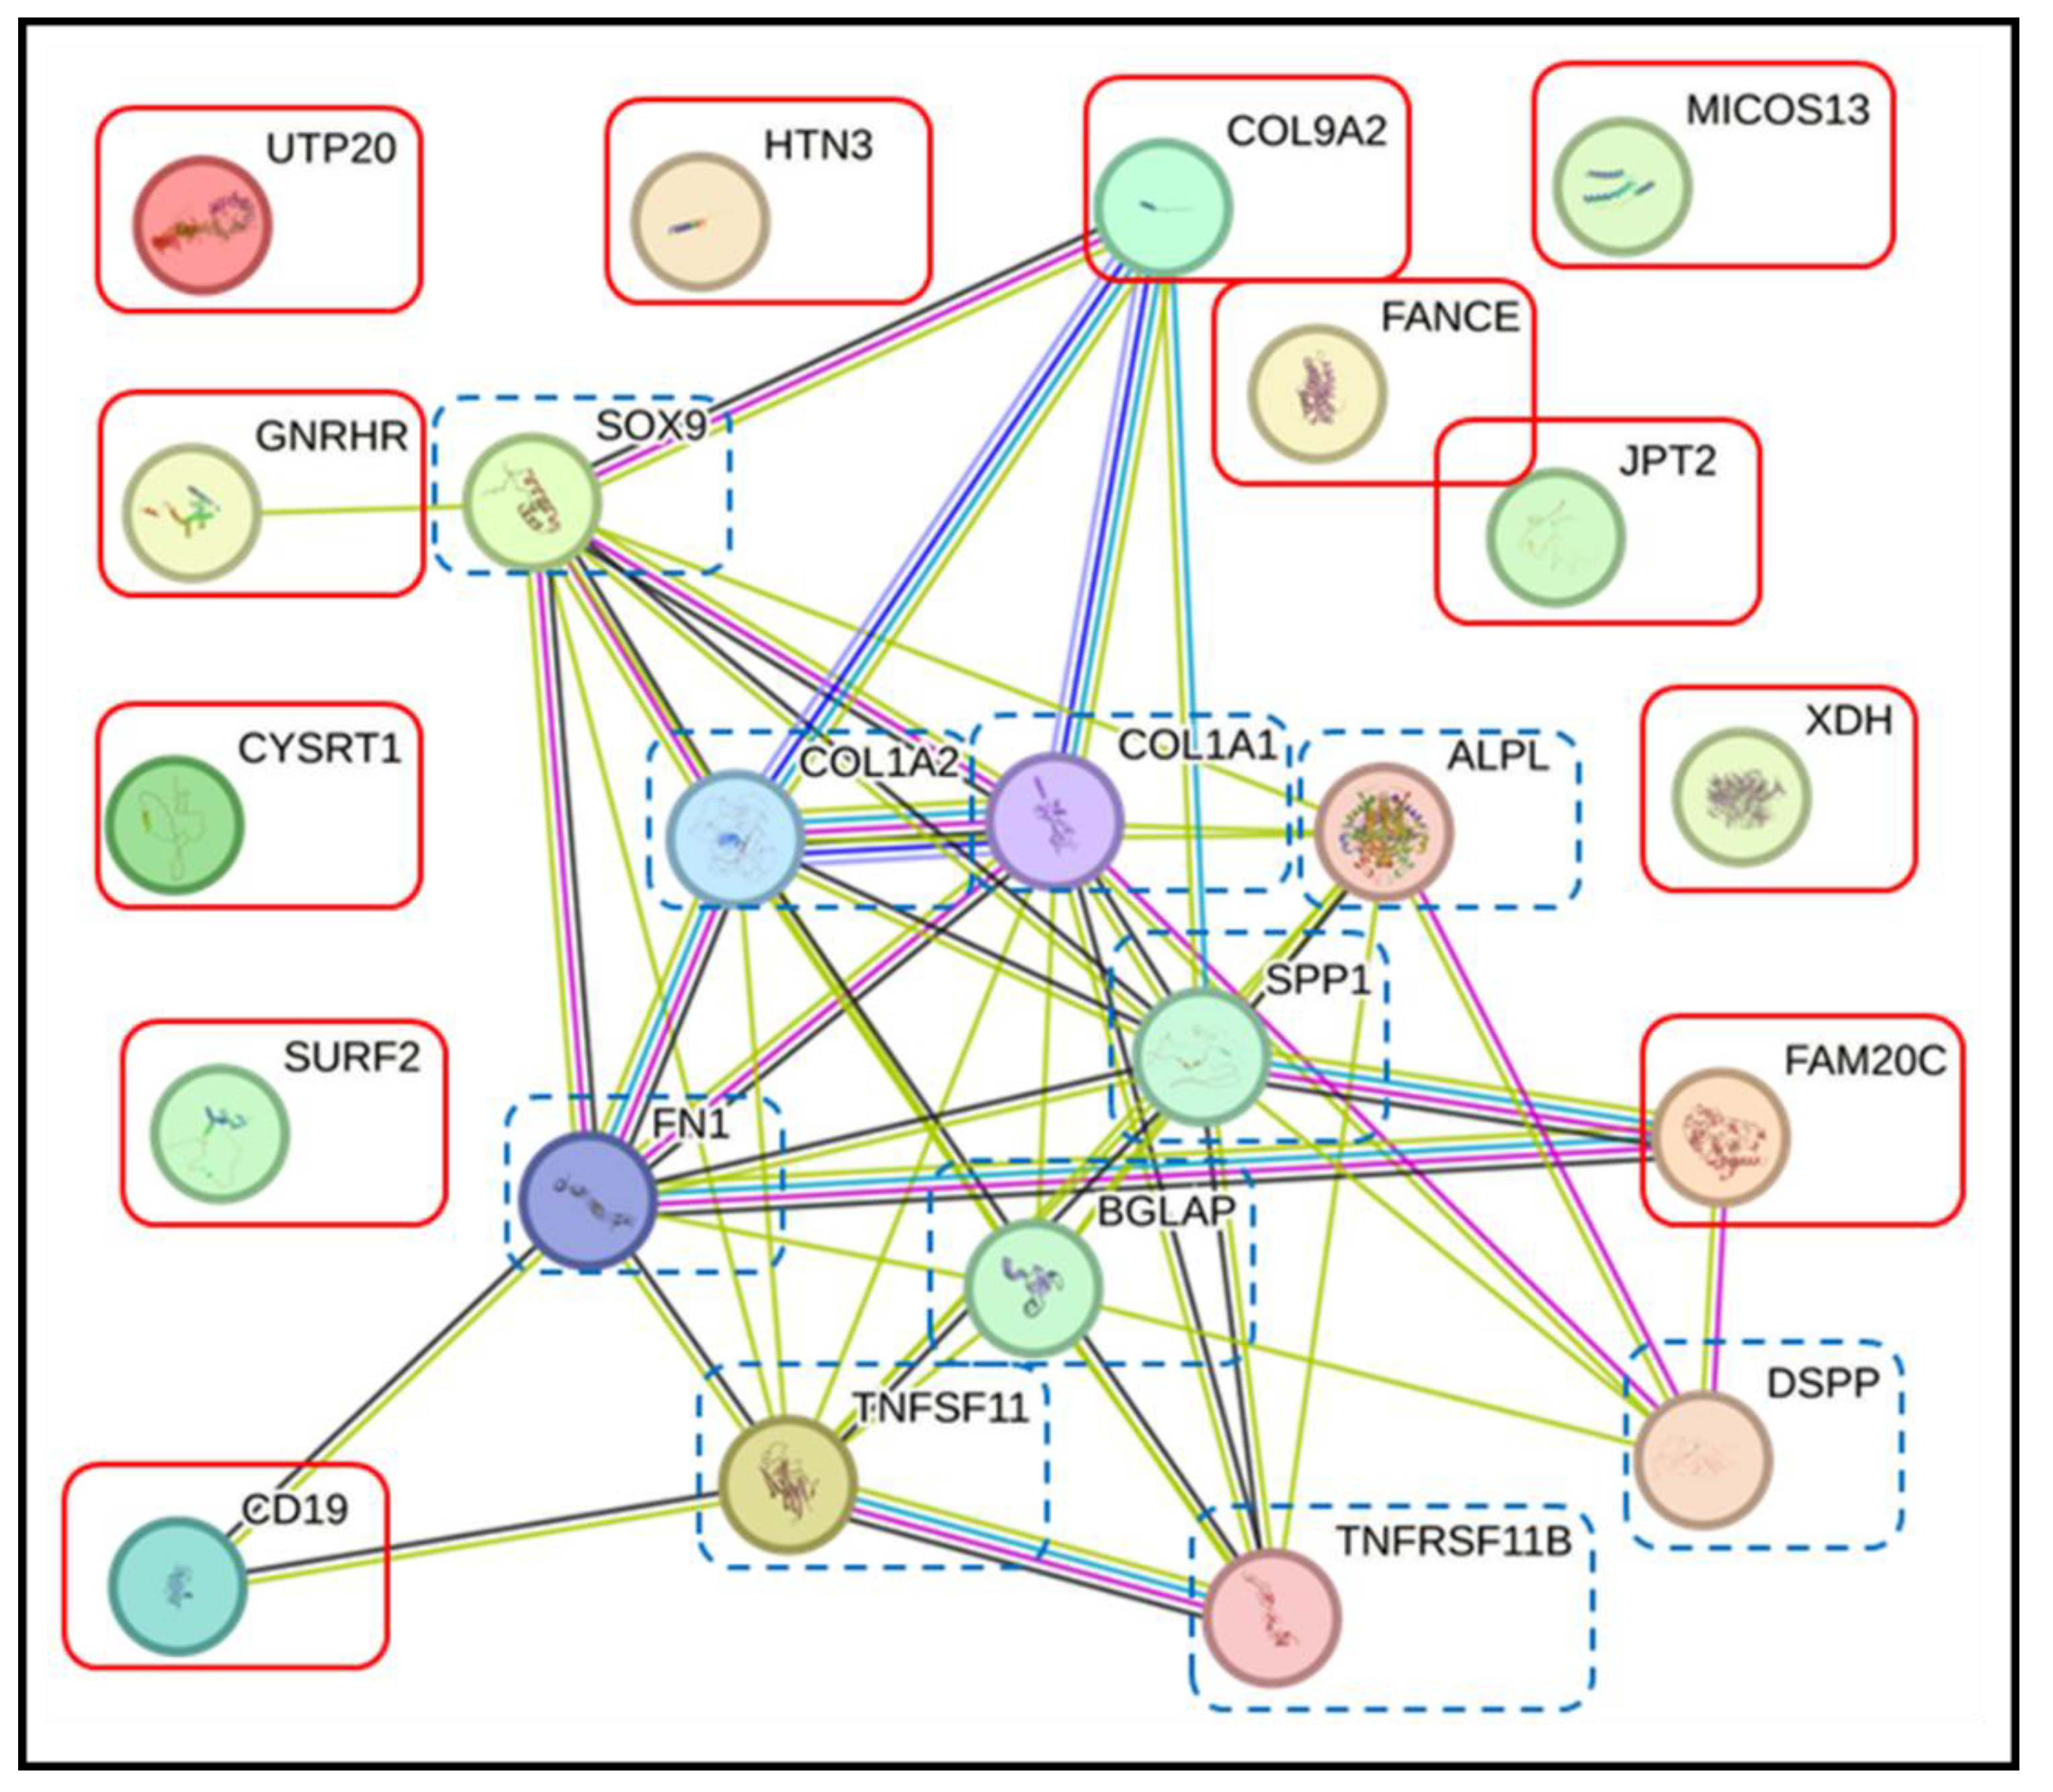
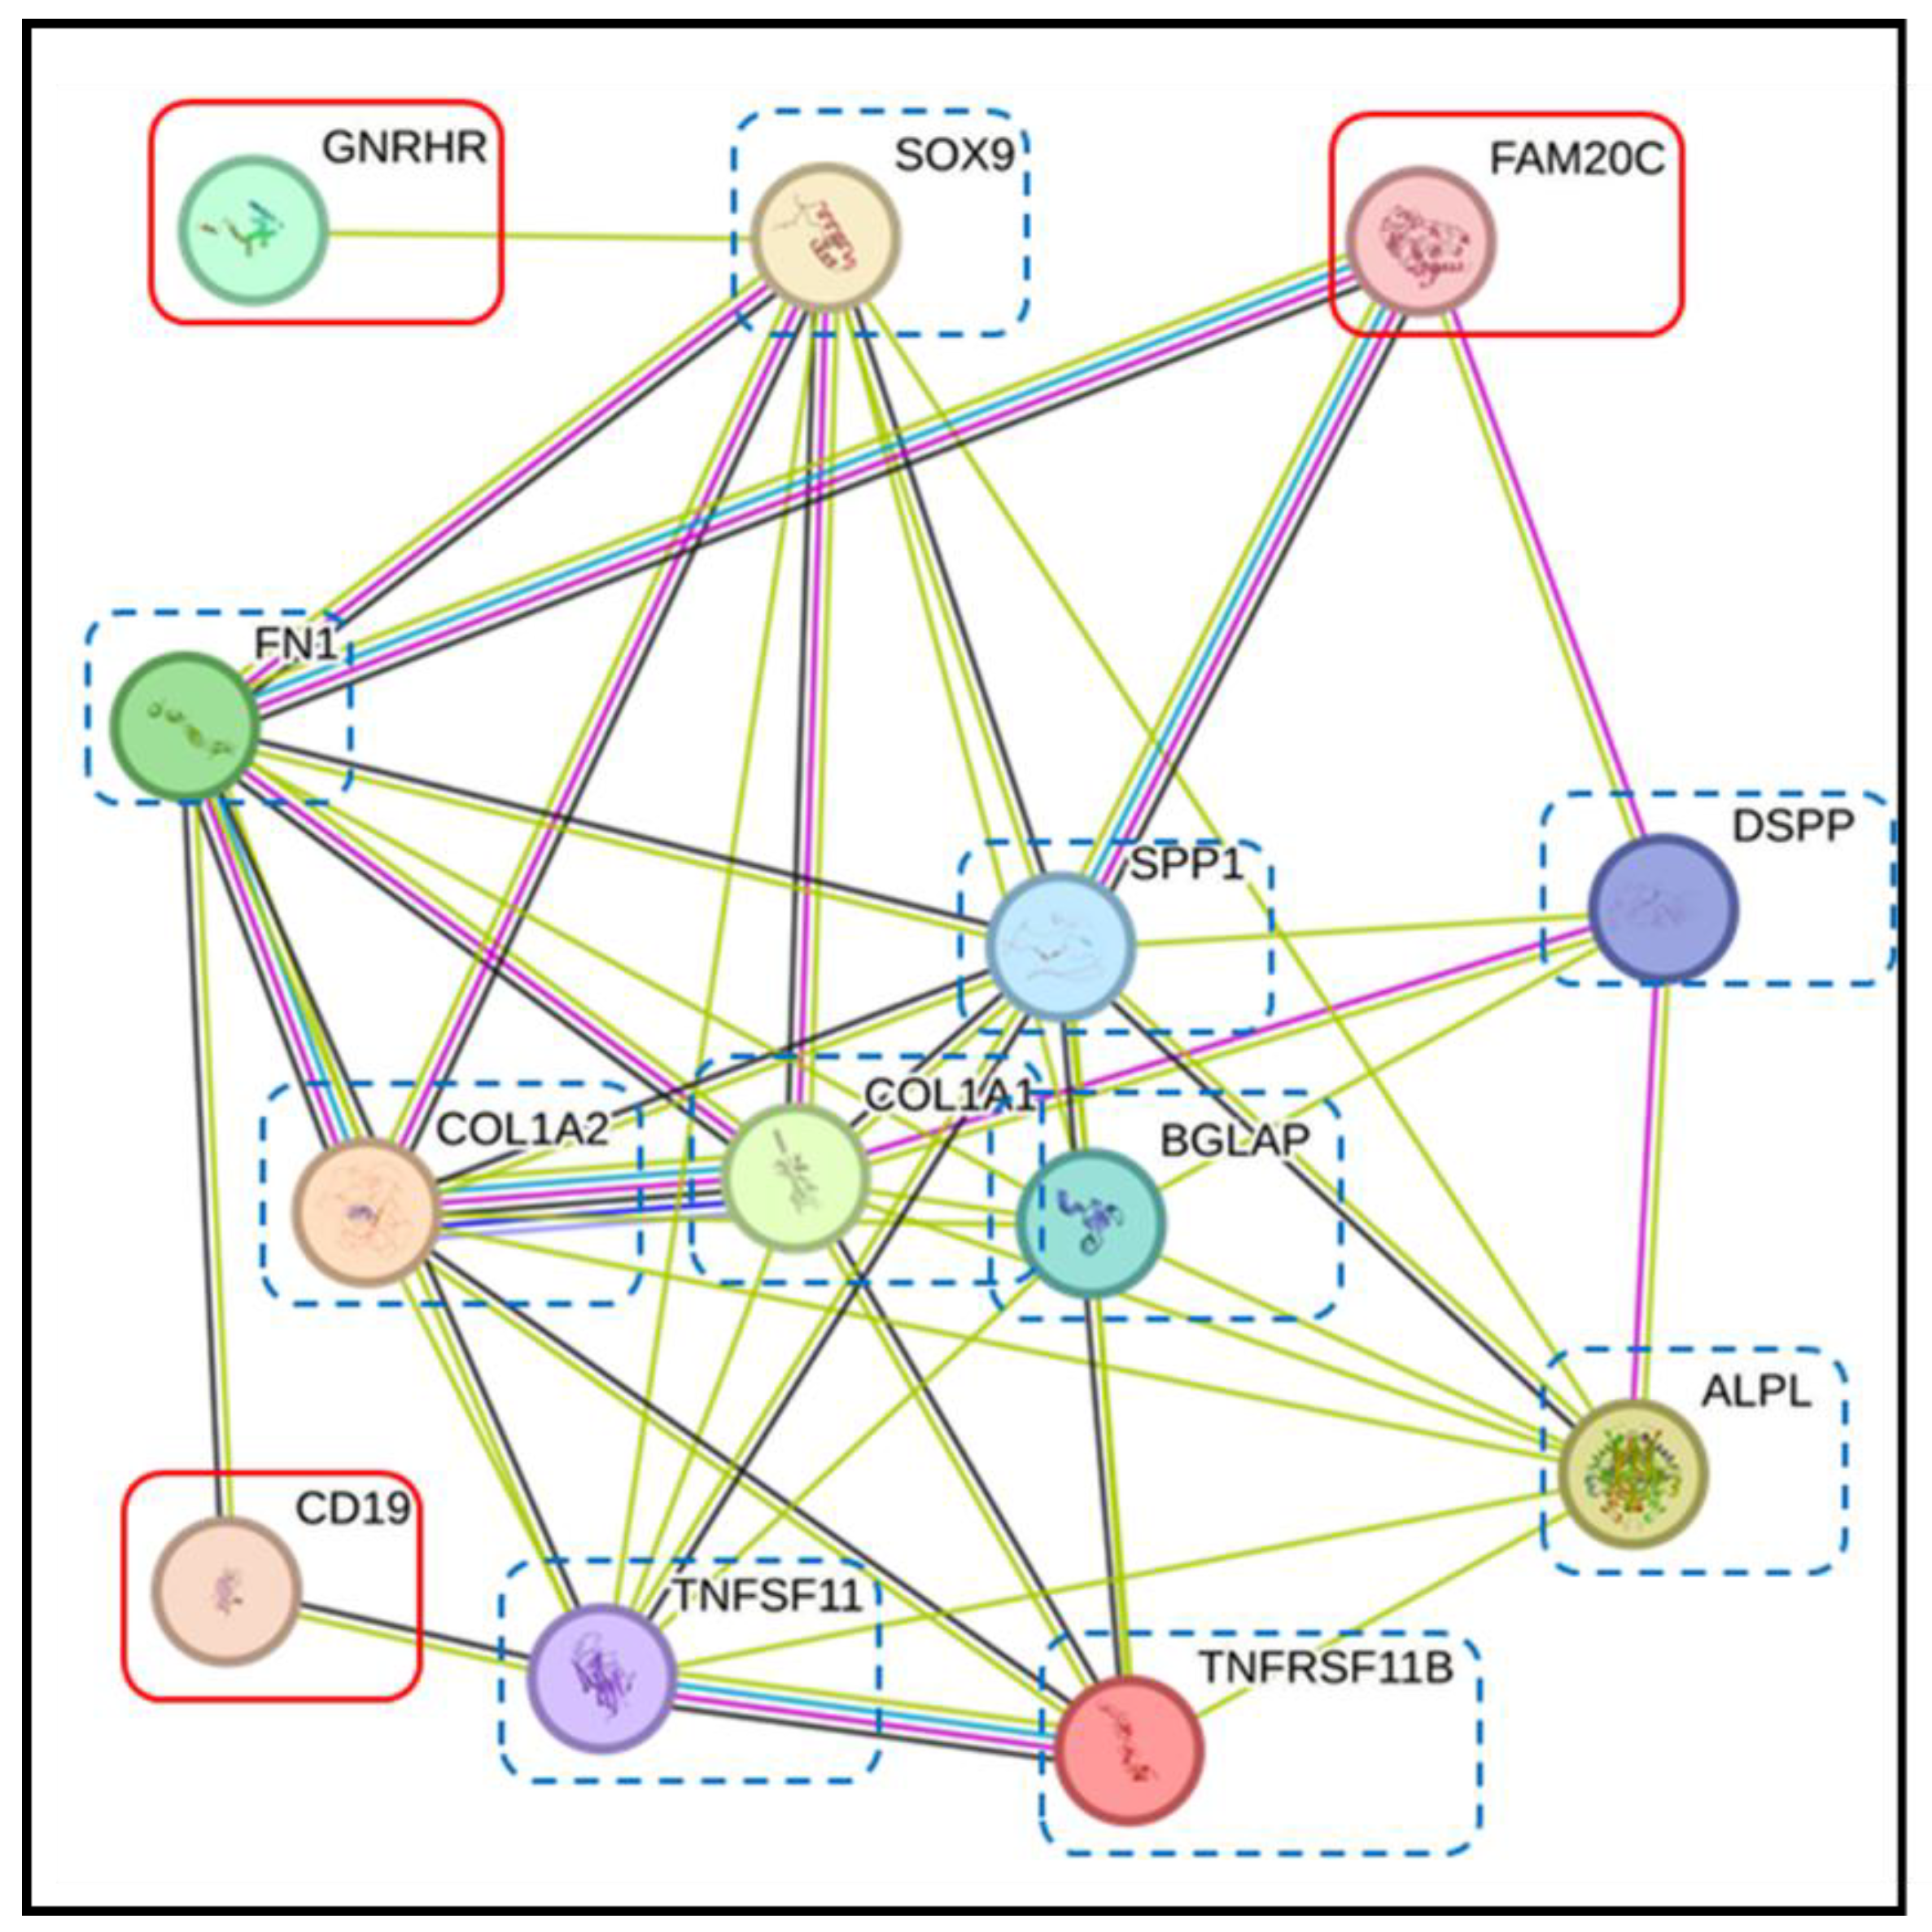
Figure 9.
Interaction networks of CD19, FAM20C, and GNRHR in FOA and IN at T1 and T2. The STRING database demonstrated associations between CD19, FAM20C, and GNRHR (red boxes) and proteins related to OTM (dashed blue boxes). CD19 was directly linked to FN1 and TNFSF11. FAM20C directly associated with FN1, SPP1, and DSPP. GNRHR indirectly interacted with FN1, ALPL, COL1A1, COL1A2 , SPP1, and TNFRSF11 via SOX9. Proteins are represented by colored nodes, and interactions are represented by edges. Lines between nodes (edges) represent the type of evidence used in predicting the associations: co-occurrence evidence (blue), neighborhood evidence (green), experimental evidence (purple), database evidence (light blue), and co-expression evidence (black).
Disclaimer/Publisher’s Note: The statements, opinions and data contained in all publications are solely those of the individual author(s) and contributor(s) and not of MDPI and/or the editor(s). MDPI and/or the editor(s) disclaim responsibility for any injury to people or property resulting from any ideas, methods, instructions or products referred to in the content. |
© 2025 by the authors. Licensee MDPI, Basel, Switzerland. This article is an open access article distributed under the terms and conditions of the Creative Commons Attribution (CC BY) license (http://creativecommons.org/licenses/by/4.0/).
Copyright: This open access article is published under a Creative Commons CC BY 4.0 license, which permit the free download, distribution, and reuse, provided that the author and preprint are cited in any reuse.


