
Submitted:
28 April 2025
Posted:
30 April 2025
You are already at the latest version
Abstract
Background/Objectives: Cancer survivors often face persistent physical, emotional, and financial burdens, yet engagement in structured lifestyle interventions remains low. This study aimed to evaluate the efficacy of a synchronous telehealth lifestyle intervention on total medical expenses and cancer-related health outcomes. Methods: A decentralized randomized clinical trial (RCT) was conducted across 33 U.S. states, recruiting a total of 158 adult cancer survivors via social media advertisements. Participants, who had undergone cancer treatment in the last 12 months, were randomly assigned to an intervention (n=84) or a control group (n=74). The intervention group received 45-minute live coaching sessions via Complement Theory’s online application, while the control group was given access to standard lifestyle recommendations via the online application. The primary endpoint was total healthcare expenditures, with secondary endpoints including quality of life (FACT-G scores), absenteeism, and presenteeism. A 90-day interim analysis was conducted using a difference-in-differences (DiD) approach and linear mixed regression. Results: Intervention adherence at 90 days was significantly higher (86% vs. 15%). The intervention group experienced a 56% relative reduction in medical expenses (DiD = $14,955, p = 0.0089) and improved FACT-G scores (DiD = 10.84, p = 0.0002), with gains in functional, emotional, social, and physical well-being (p < 0.01). Presenteeism metrics, including motivation (p = 0.0332) and work performance (p = 0.013), showed significant improvements. Absenteeism improved but was not statistically significant. Conclusion: This interim analysis suggests that synchronous coaching via a telehealth platform enhances adherence, reduces healthcare costs, improves quality of life, and increases work productivity in cancer survivors. Further evaluation is ongoing.
Keywords:
telehealth
; cancer survivorship
; employment
; healthcare expenditures
Introduction
Cancer care is a significant driver of healthcare expenditures in the United States, with annual costs projected to rise by 16% annually—five times the healthcare average—due to increasing incidence, earlier diagnoses, and high treatment expenses [1]. Beyond financial burdens, cancer and its therapies significantly impact survivors’ physical function, workplace productivity, and overall quality of life (QoL). Many survivors experience persistent fatigue, pain, emotional distress, and functional decline, leading to reduced participation in daily activities and employment.
Lifestyle modifications, including structured exercise, dietary changes, and mindfulness-based therapies such as meditation, have demonstrated substantial benefits for cancer survivors. Research indicates that exercise can reduce cancer recurrence by 35% and mortality by 30%, while also improving physical function, symptom management, and QoL [2,3]. Similarly meditation has been associated with reduced depression and enhanced immune function [4]. Despite this growing evidence base, adherence to recommended lifestyle interventions remains low, with fewer than 5% of cancer survivors following clinical guidelines [5]. Common barriers include lack of motivation (67%), difficulty maintaining discipline (65%), and physical limitations such as fatigue (78%) and pain (71%) [6].
Given these challenges, telehealth-based interventions offer a promising approach to increasing accessibility and adherence. Digital health platforms have shown potential to support behavioral changes in chronic disease management; however, the effectiveness of real-time, synchronous coaching in cancer survivorship remains underexplored. This study seeks to fill that gap by evaluating a telehealth-based lifestyle intervention that provides live coaching in exercise, meditation, and wellness strategies via an online mobile application.
Methods
Study Design
A decentralized randomized controlled trial (RCT) was conducted to evaluate the impact of a synchronous telehealth coaching intervention on healthcare utilization, quality of life (QoL), and workplace productivity among cancer survivors. The primary objective was to determine whether live coaching via an online mobile application could reduce healthcare expenditures, specifically hospitalizations, urgent care visits, and outpatient encounters. Secondary analyses assessed adherence to lifestyle modifications, while exploratory outcomes examined cancer progression and recurrence in prostate and colorectal cancer survivors.
The trial employed a two-arm design: (1) an intervention group receiving live coaching through the mobile application and (2) an active comparator group accessing self-guided, publicly available lifestyle modification guidelines via the same application. The intervention lasted 12 months, followed by a 6-month post-intervention follow-up.
Participant Recruitment and Eligibility Criteria
Participants were screened using online recruitment via Facebook advertisements. Eligibility criteria included:
1. Diagnosis of any cancer type
- Any Cancer stage
- Completion of cancer-related treatment within the past 12 months
- Age ≥ 21 years
- Consent to access health records
- Access to a smartphone or tablet
Exclusion criteria were:
- Recent surgery within the past 4 weeks or scheduled surgery in the next 4 weeks
- Medically unfit for physical activity, as determined by a physician
- Eastern Cooperative Oncology Group (ECOG) performance status ≥ 3
Randomization was performed using computer-generated sequences to ensure unbiased allocation. The study employed a double-blind design, wherein neither participants nor the principal investigators were aware of group assignments. Both groups accessed the mobile application, but content was tailored based on the assigned study arm.
Intervention and Control Conditions
Participants in the intervention group engaged in a 12-month live coaching program delivered via the online mobile application (Complement1, Complement Theory Inc., Dover, Delaware). The program incorporated evidence-based strategies for exercise and meditation, supplemented with dietary, sleep, and lifestyle recommendations. Each session consisted of:
- 30 min of structured physical activity (aerobic, strength, flexibility, and balance exercises)
- 7 min of guided meditation
Participants were encouraged to complete at least three sessions per week, with up to five sessions available. The program was personalized based on each participant’s medical profile, performance status, and treatment history (Refer Appendix for more details).
The comparator group accessed the online mobile application for self-guided resources on exercise, meditation, diet, and sleep. These materials, derived from publicly available guidelines, represented standard-of-care survivorship recommendations. Unlike the intervention group, the control group did not receive personalized guidance or live coaching.
Outcome Measures
- The primary outcome was total healthcare expenditures, encompassing both cancer-related and non-cancer-related costs. Secondary outcomes included:
- Quality of Life (QoL) measured using the Functional Assessment of Cancer Therapy-General (FACT-G) instrument
- Absenteeism, assessed through self-reported short-term and long-term leave status and average weekly work hours
- Presenteeism, evaluated based on self-reported changes in work motivation and performance
- Motivation and performance were quantified on a five-point Likert scale:
- Motivation: 1 (Very Demotivated) to 5 (Very Motivated)
- Performance: 1 (Unacceptable) to 5 (Excellent)
Data Collection and Statistical Analysis
Data were collected at baseline and 12 weeks after intervention. Healthcare expenditure data were obtained from insurance claims, collating information from multiple insurers where applicable. FACT-G scores assessed physical, emotional, and social well-being among participants. Absenteeism and presenteeism data were collected via structured self-reported questionnaires.
Statistical analyses were performed using a difference-in-differences (DiD) model with linear mixed regression to assess significant changes from baseline between study arms.
Ethical Considerations
The study protocol was approved by the Advarra Institutional Review Board (IRB) (Pro00077693) and conducted in compliance with the ethical principles outlined in the Declaration of Helsinki. Informed consent was obtained from all participants. Data confidentiality and integrity were maintained through stringent security protocols.
Results
Patient Demographics and Baseline Case Characteristics
A total of 1,897 individuals completed the online eligibility form after responding to targeted Facebook advertisements. Of these, 496 individuals (27%) were deemed ineligible based on predefined inclusion criteria: no active cancer treatment within the past 12 months (295 individuals, 15.5%) and age above 65 years (253 individuals, 13.3%).
From the remaining 1,401 eligible participants, 909 scheduled an online recruitment session. These 909 participants were randomized into Intervention and Control groups using a block randomization algorithm (see Appendix for details on the algorithm).
Attendance at the scheduled recruitment sessions was approximately 29% (262 individuals), consistent with typical rates observed in online recruitment methodologies. Attendance rates naturally varied between the Intervention and Control groups.
Several challenges influenced onboarding completion rates among attendees, affecting the groups unevenly. Technical issues, mainly related to app installation, impacted 35 participants. Non-technical obstacles, such as scheduling conflicts, affected an additional 11 individuals. Furthermore, 17 participants expressed reluctance to share sensitive information, including healthcare expenses, while 9 withdrew or declined participation after reviewing detailed program information. Another 8 participants encountered miscellaneous issues, primarily session initiation delays. These challenges occurred differently across the Intervention and Control groups (Figure 1).
Additionally, eligibility validation during recruitment resulted in the disqualification of 21 participants. Among these, 12 were medically unfit to exercise, 9 had undergone surgery within the previous 4 weeks, 2 were above the age of 65, and 1 was not diagnosed with cancer. The rates of disqualification also varied between the two groups (Figure 1).
Collectively, these factors—attendance disparities, varied technical and non-technical barriers, hesitancy to share personal data, withdrawal after detailed review, and eligibility disqualifications—resulted in a slightly uneven final cohort. Ultimately, the Intervention Group consisted of 84 consenting participants, while the Control Group had 74 consenting participants.
The observed funnel—from the initial 1,897 eligibility forms completed to the final 158 participants onboarded—is consistent with expected attrition rates documented in online-based clinical trial recruitment literature[17].
The median age of the study population was 55 years, with the intervention group comprising slightly older participants than the control group (Table 1). The study cohort was racially diverse, reflecting the broader U.S. population, with similar distributions across both groups (Table 1).
Breast cancer was the most prevalent diagnosis among participants (63%), followed by colorectal cancer (11%), prostate cancer (4%), and lung cancer (3%), with comparable distributions between study arms (Table 1). Cancer stages varied widely, with a slightly higher proportion of stage I cases in the intervention group and a slightly greater representation of stage II cases in the control group (Table 1).
Participant Engagement and Adherence to Intervention
Engagement and adherence to the intervention were assessed at 90 days. The intervention group demonstrated a high engagement rate, with 86% of participants actively participating in scheduled coaching sessions and adhering to the prescribed lifestyle modifications in the 3rd month. In contrast, adherence in the control group was lower, with only 15% of participants engaging with the self-guided educational materials in Month-3.
Medical Expenditures
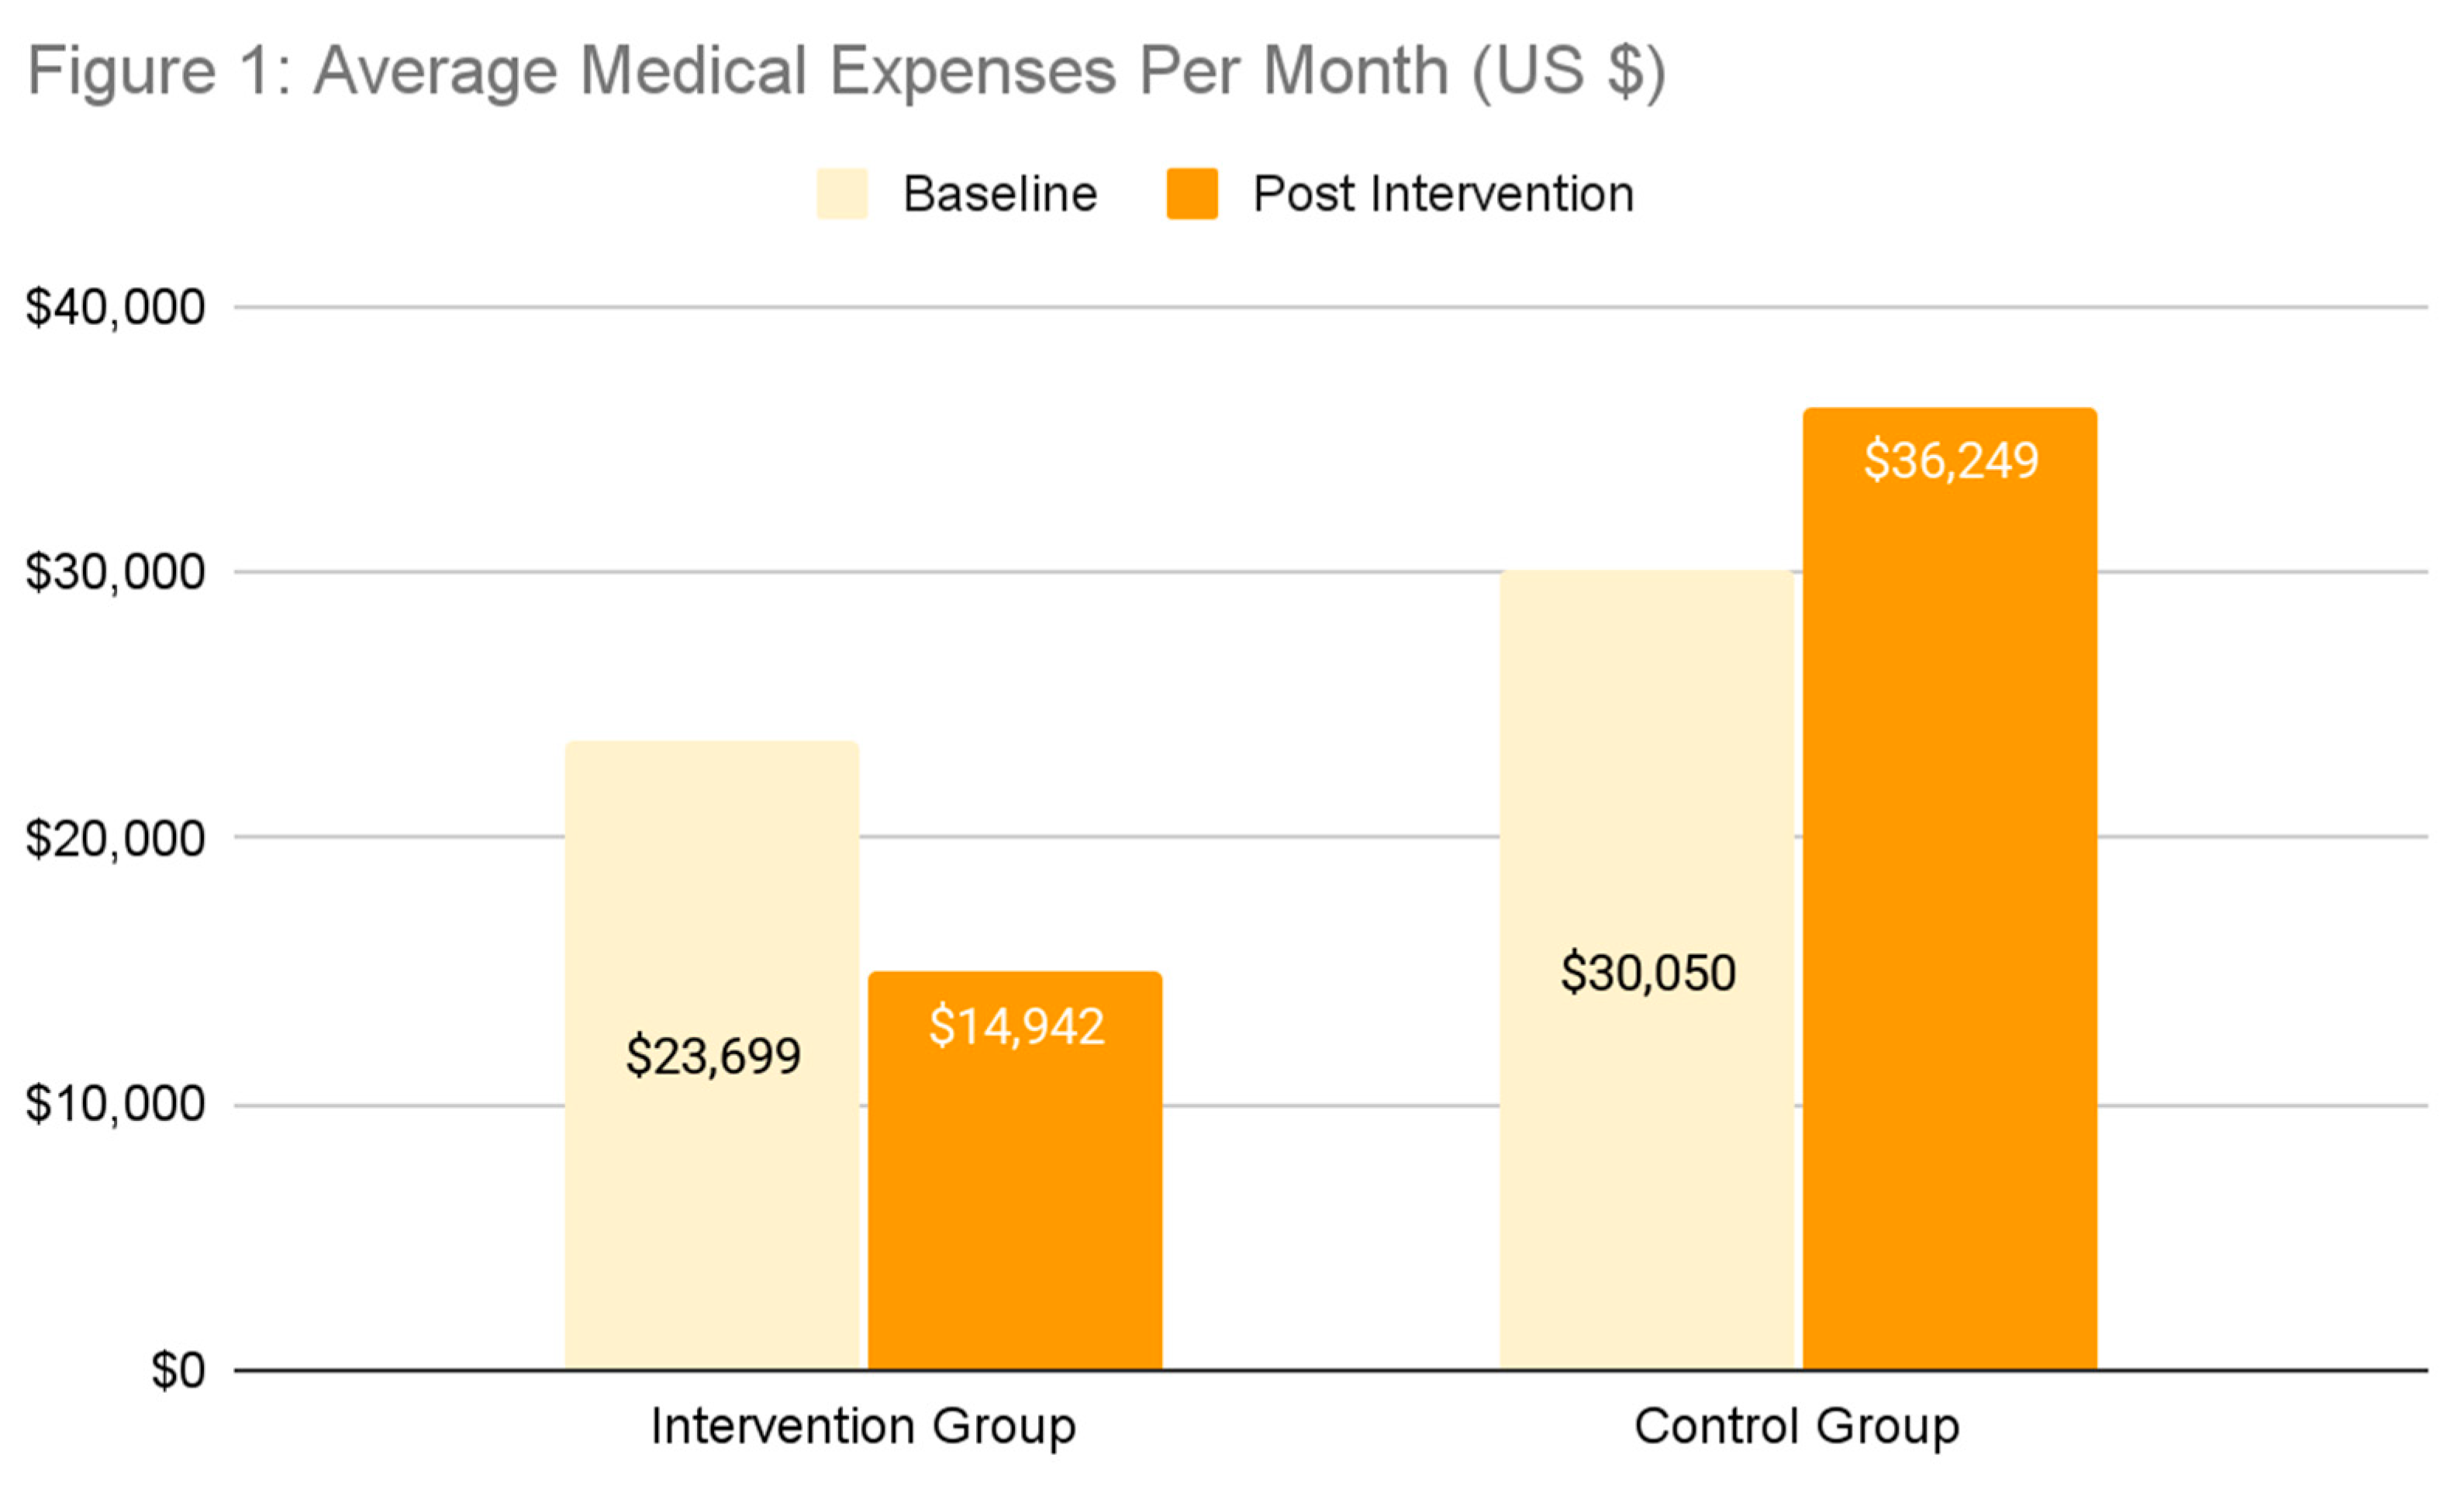
Medical expenditures were analyzed over two time periods: (1) a baseline period spanning the four months prior to the intervention month (ie. January to April 2024) and (2) a post-intervention period, starting from the month of intervention to the 3-months after that (ie. May to July 2024).
At baseline, healthcare costs were comparable between groups, with mean expenditures of $23,698.52 (SD $28,960.9) in the intervention group and $30,049.71 (SD $33,485.76) in the control group. However, in the post-intervention period, the intervention group exhibited a substantial reduction in medical costs, with mean expenditures decreasing to $14,942.18 (SD $16,322.8), while the control group’s costs increased to $36,248.91 (SD $41,469.15).
The difference-in-differences (DiD) analysis demonstrated a statistically significant $14,955.54 (SD $6,107.06) reduction in medical expenses for the intervention group compared to the control group (p = 0.0089) (Table 2).
Quality of Life Outcomes
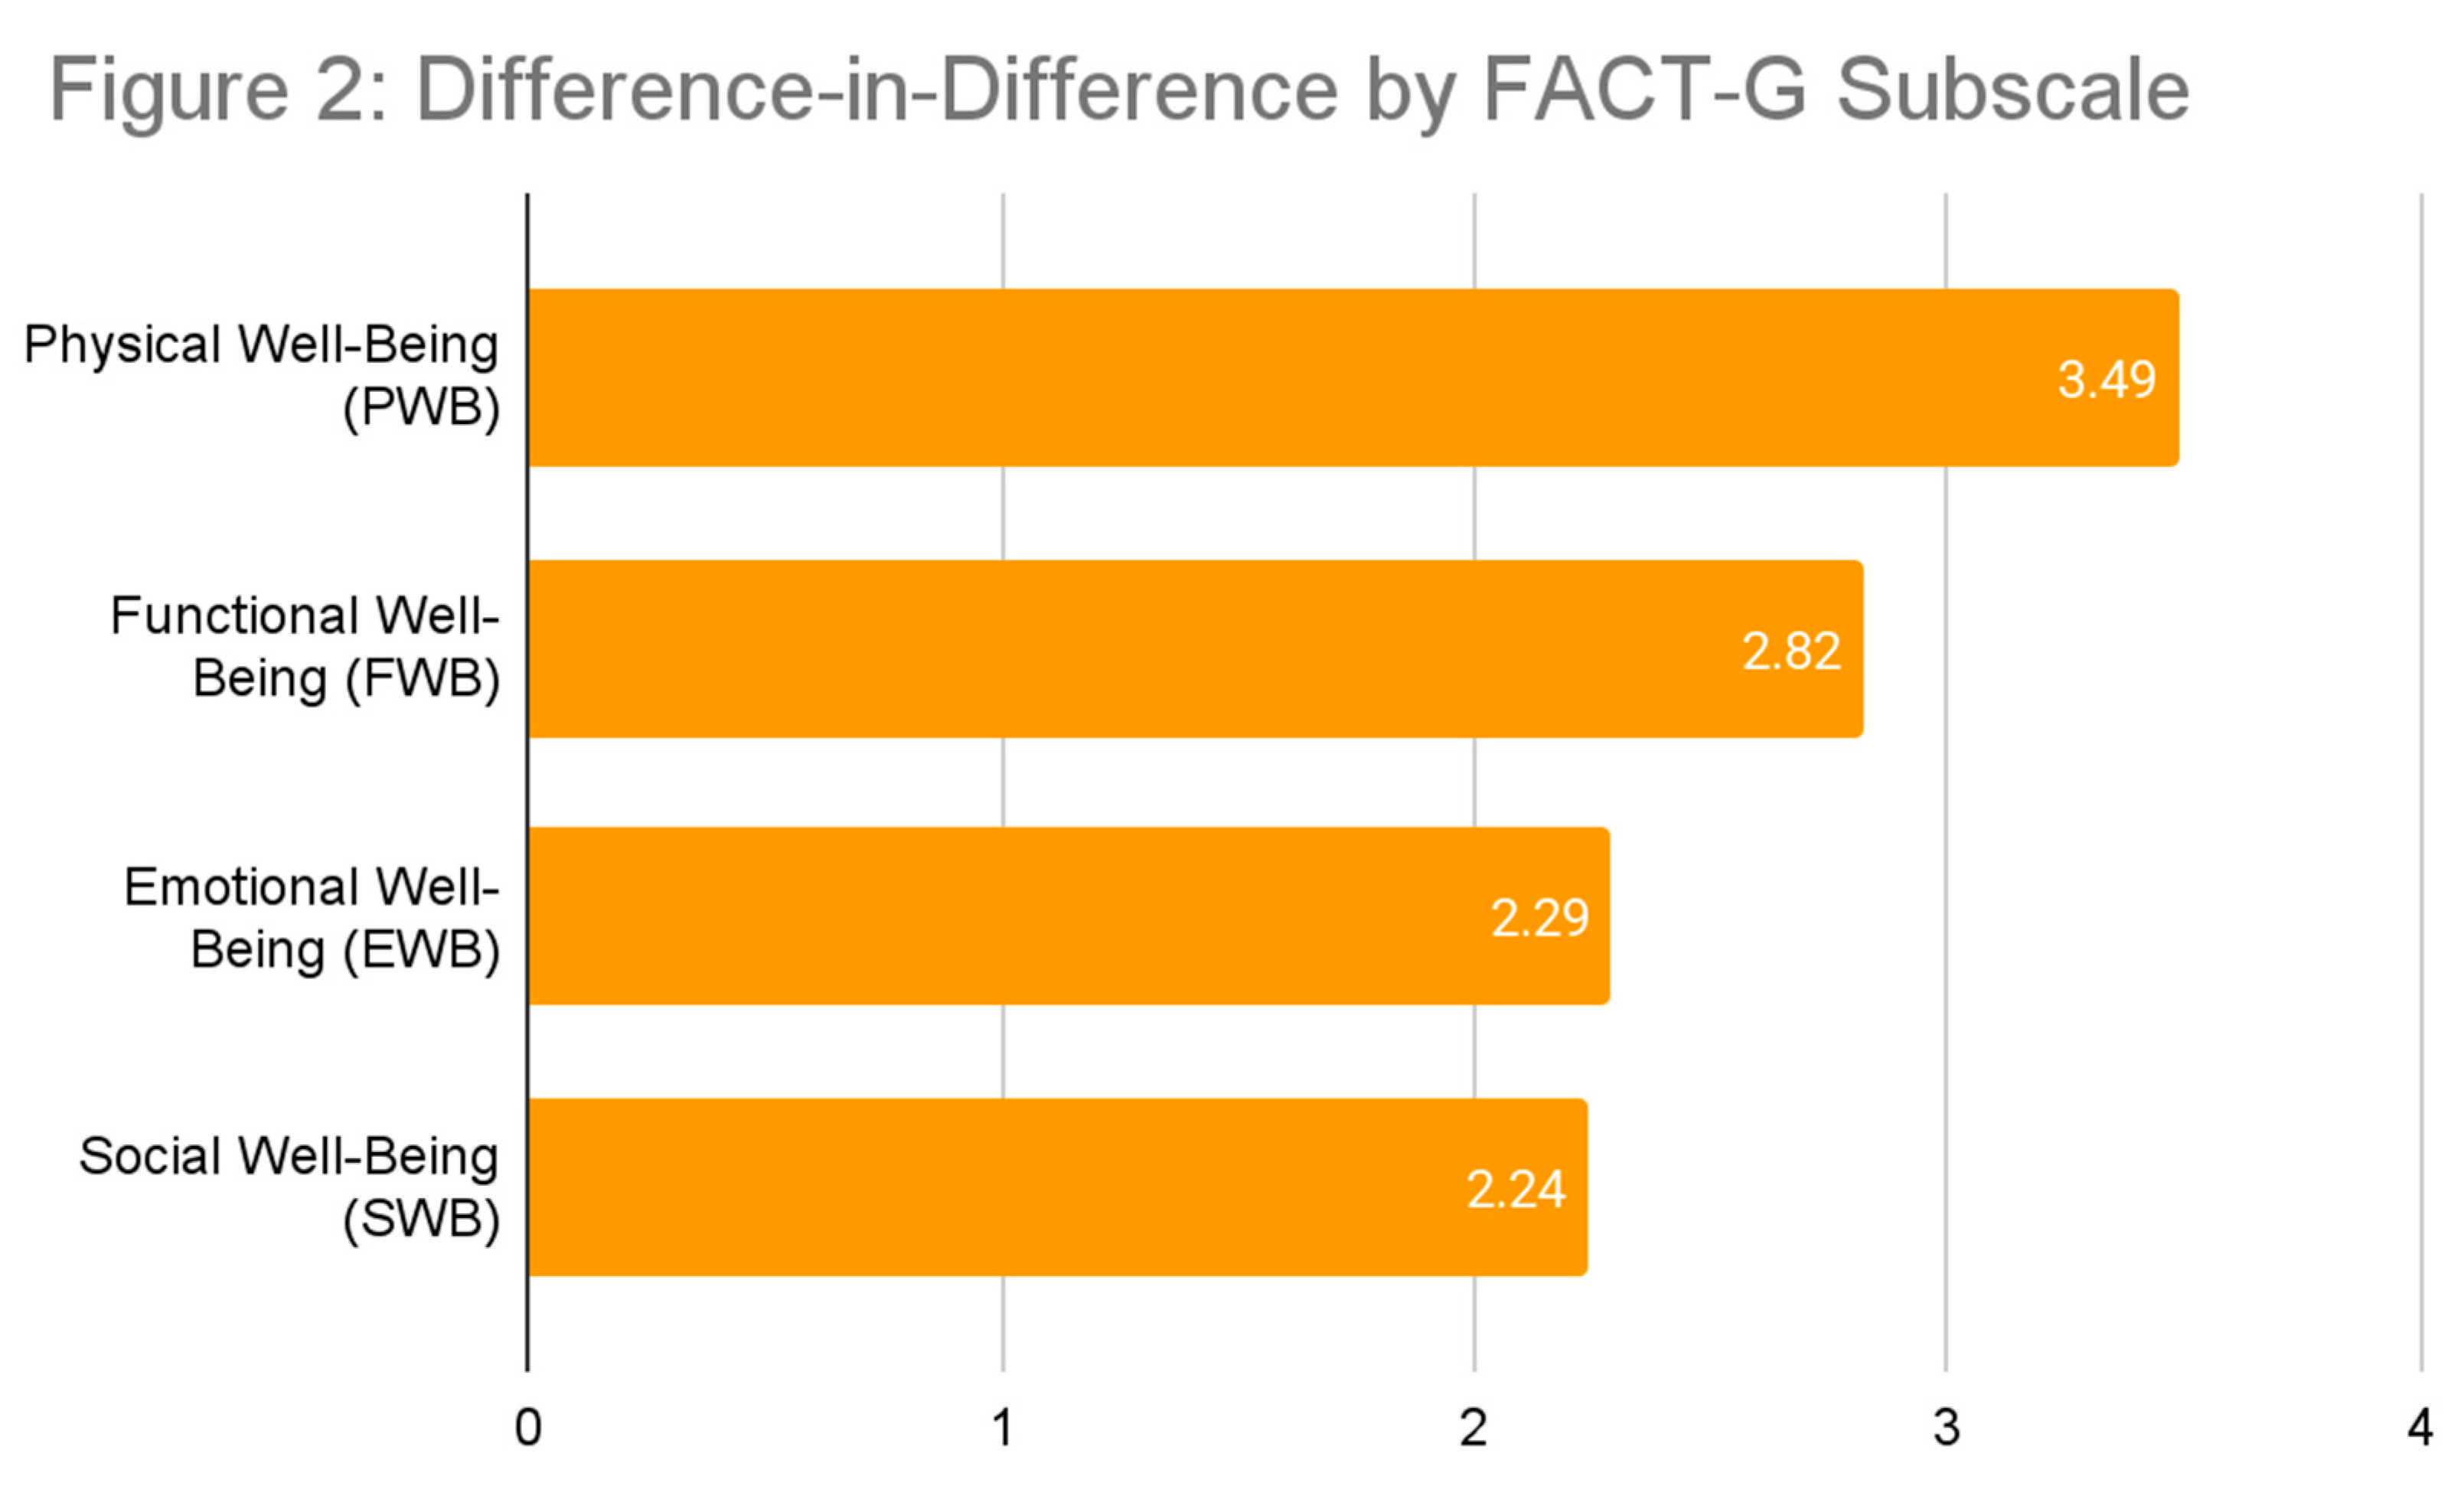
Quality of life (QoL) was assessed using the Functional Assessment of Cancer Therapy-General (FACT-G) instrument, which includes subscales for physical well-being (PWB), social well-being (SWB), emotional well-being (EWB), and functional well-being (FWB). Significant improvements were observed in the intervention group across all domains compared to the control group (Figure 2).
Overall FACT-G Score
At baseline, the mean QoL score was 70.48 (SD 16.03) in the intervention group and 65.78 (SD 16.09) in the control group. After three months, the intervention group showed a significant increase to 78.03 (SD 14.3), while the control group decreased to 63.91 (SD 19.58). The difference-in-differences (DiD) analysis indicated a statistically significant improvement of 10.84 points (SD 13.32, p = 0.0002) in the intervention group (Table 3).
Physical Well-Being (PWB)
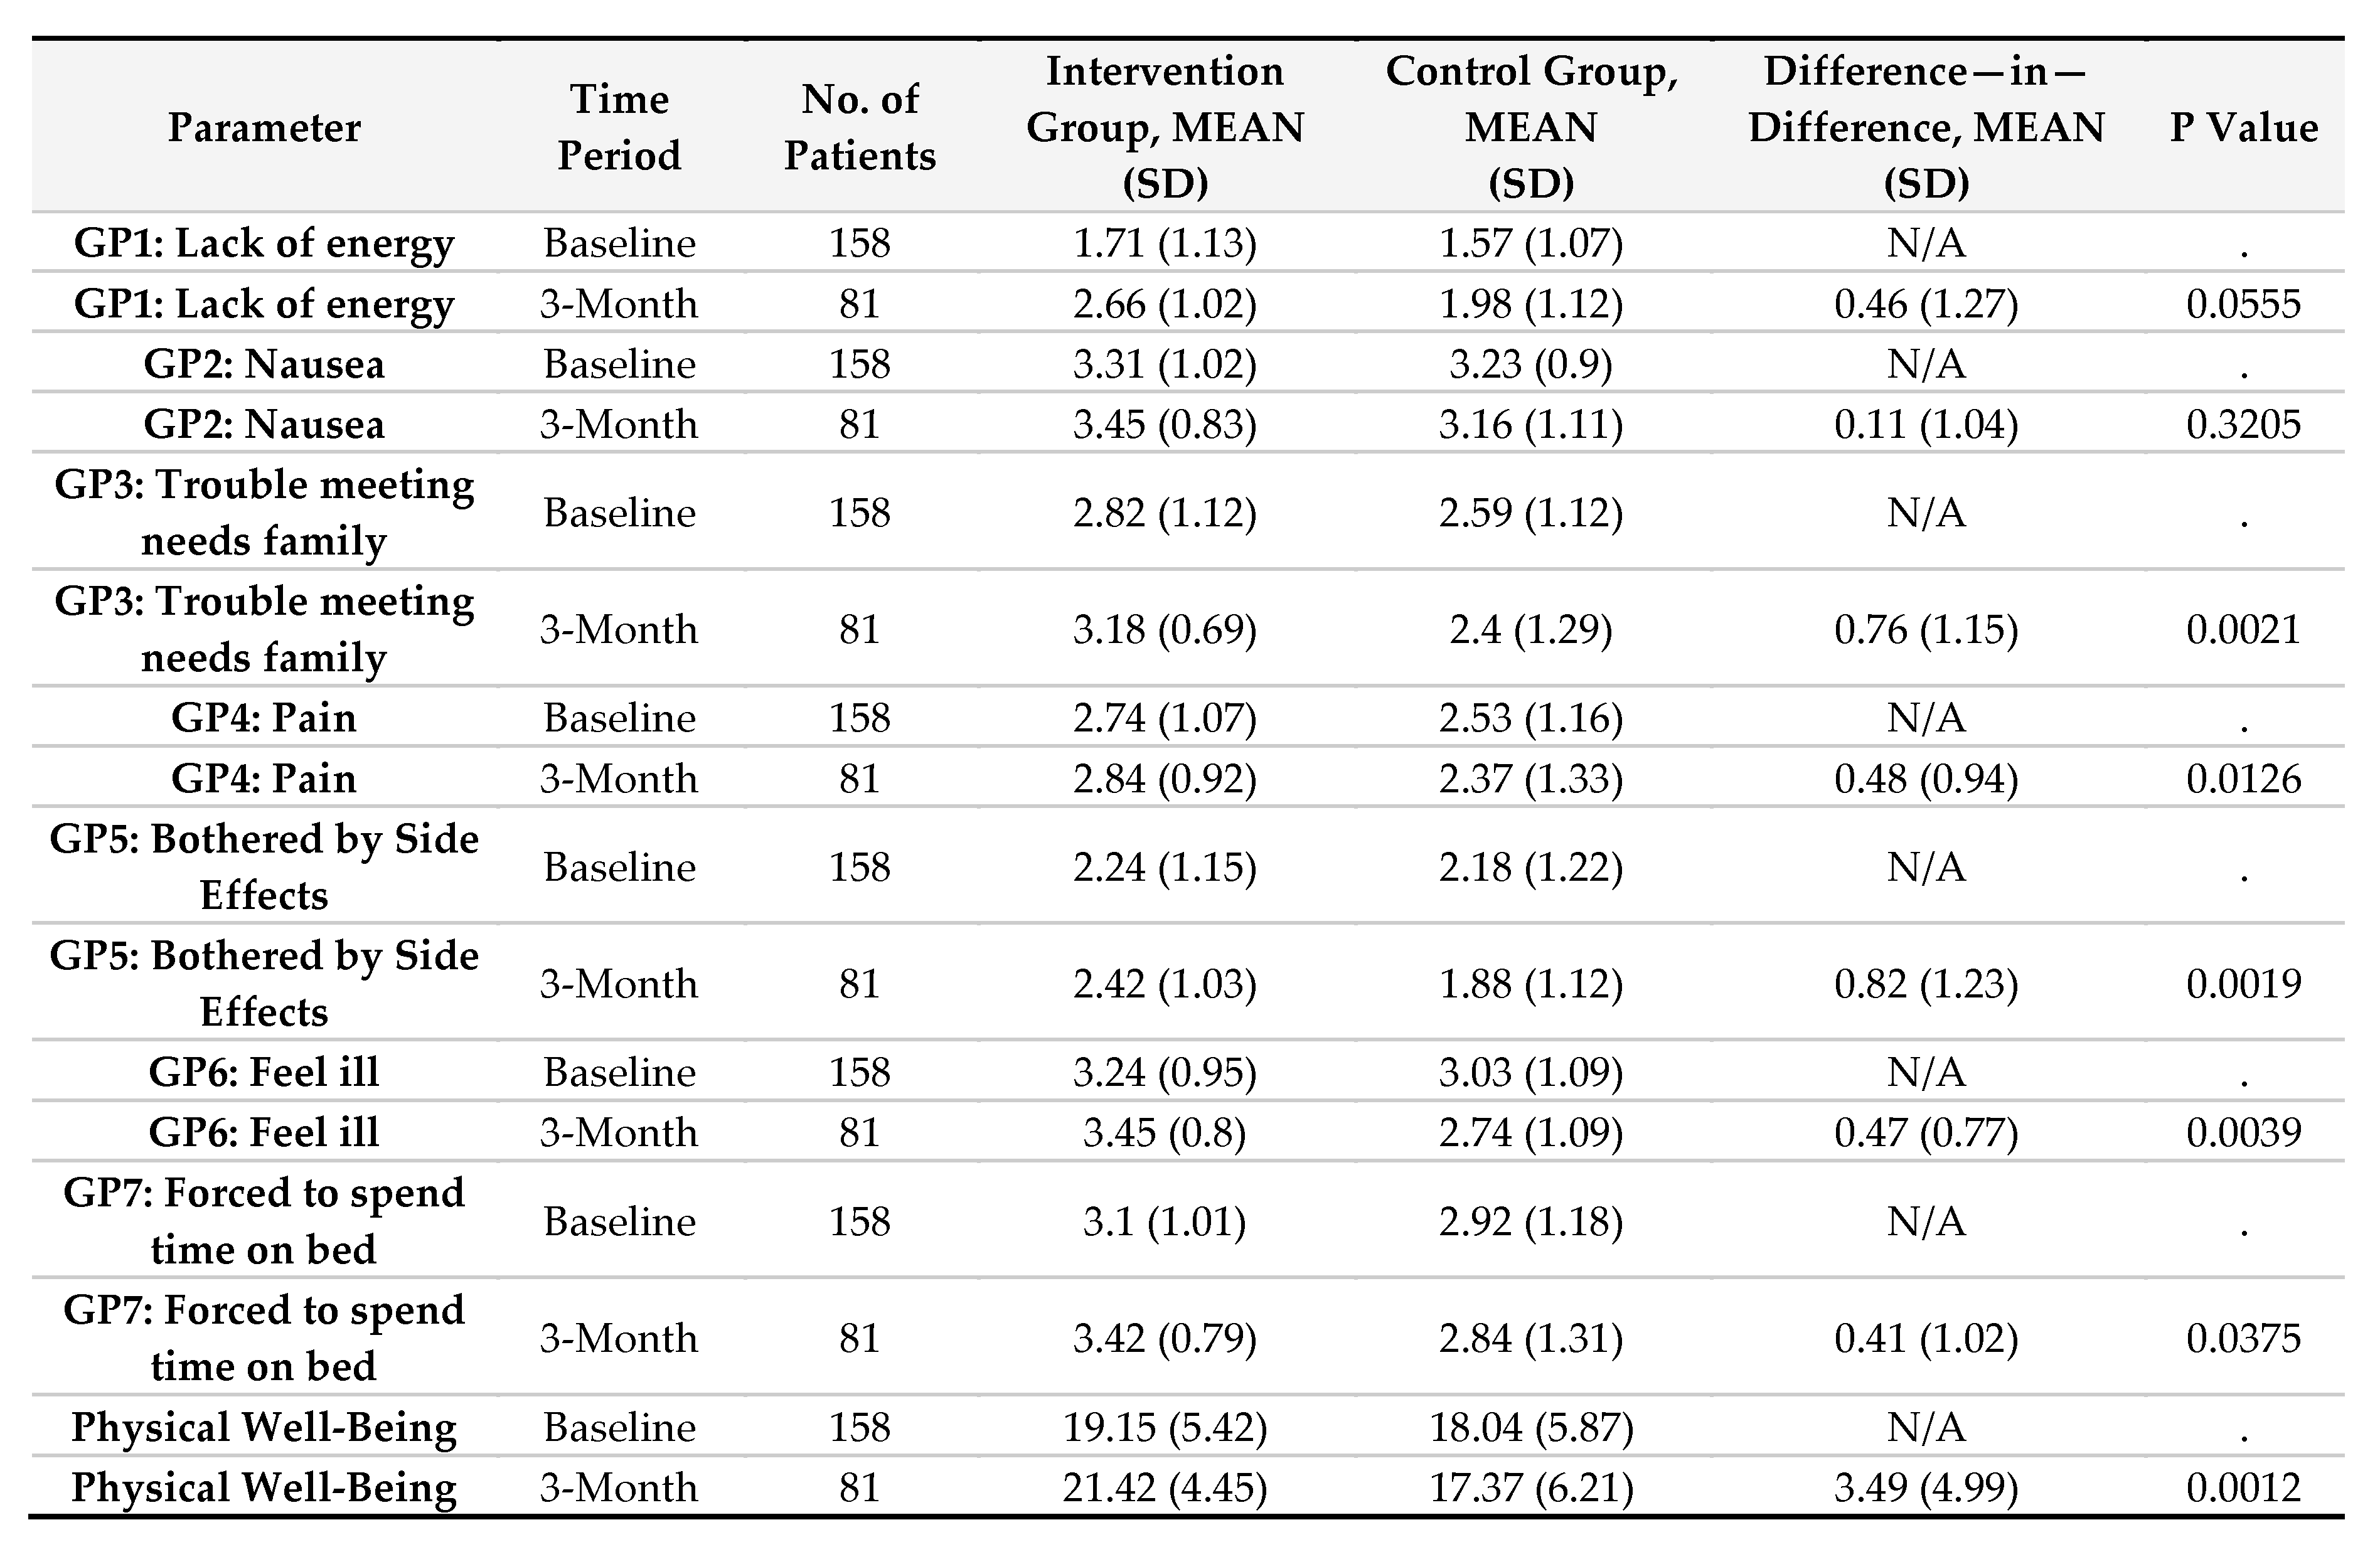
The intervention group experienced a significant improvement in physical well-being, increasing from 19.15 (SD 5.42) at baseline to 21.42 (SD 4.45) at three months. In contrast, the control group declined from 18.04 (SD 5.87) to 17.37 (SD 6.21). The DiD analysis showed a significant gain of 3.49 points (SD 4.99, p = 0.0012) in the intervention group. Improvements were observed in energy levels (p = 0.0555), pain reduction (p = 0.0126), and overall illness perception (p = 0.0039) (Supplemental Table 1).
Social Well-Being (SWB)
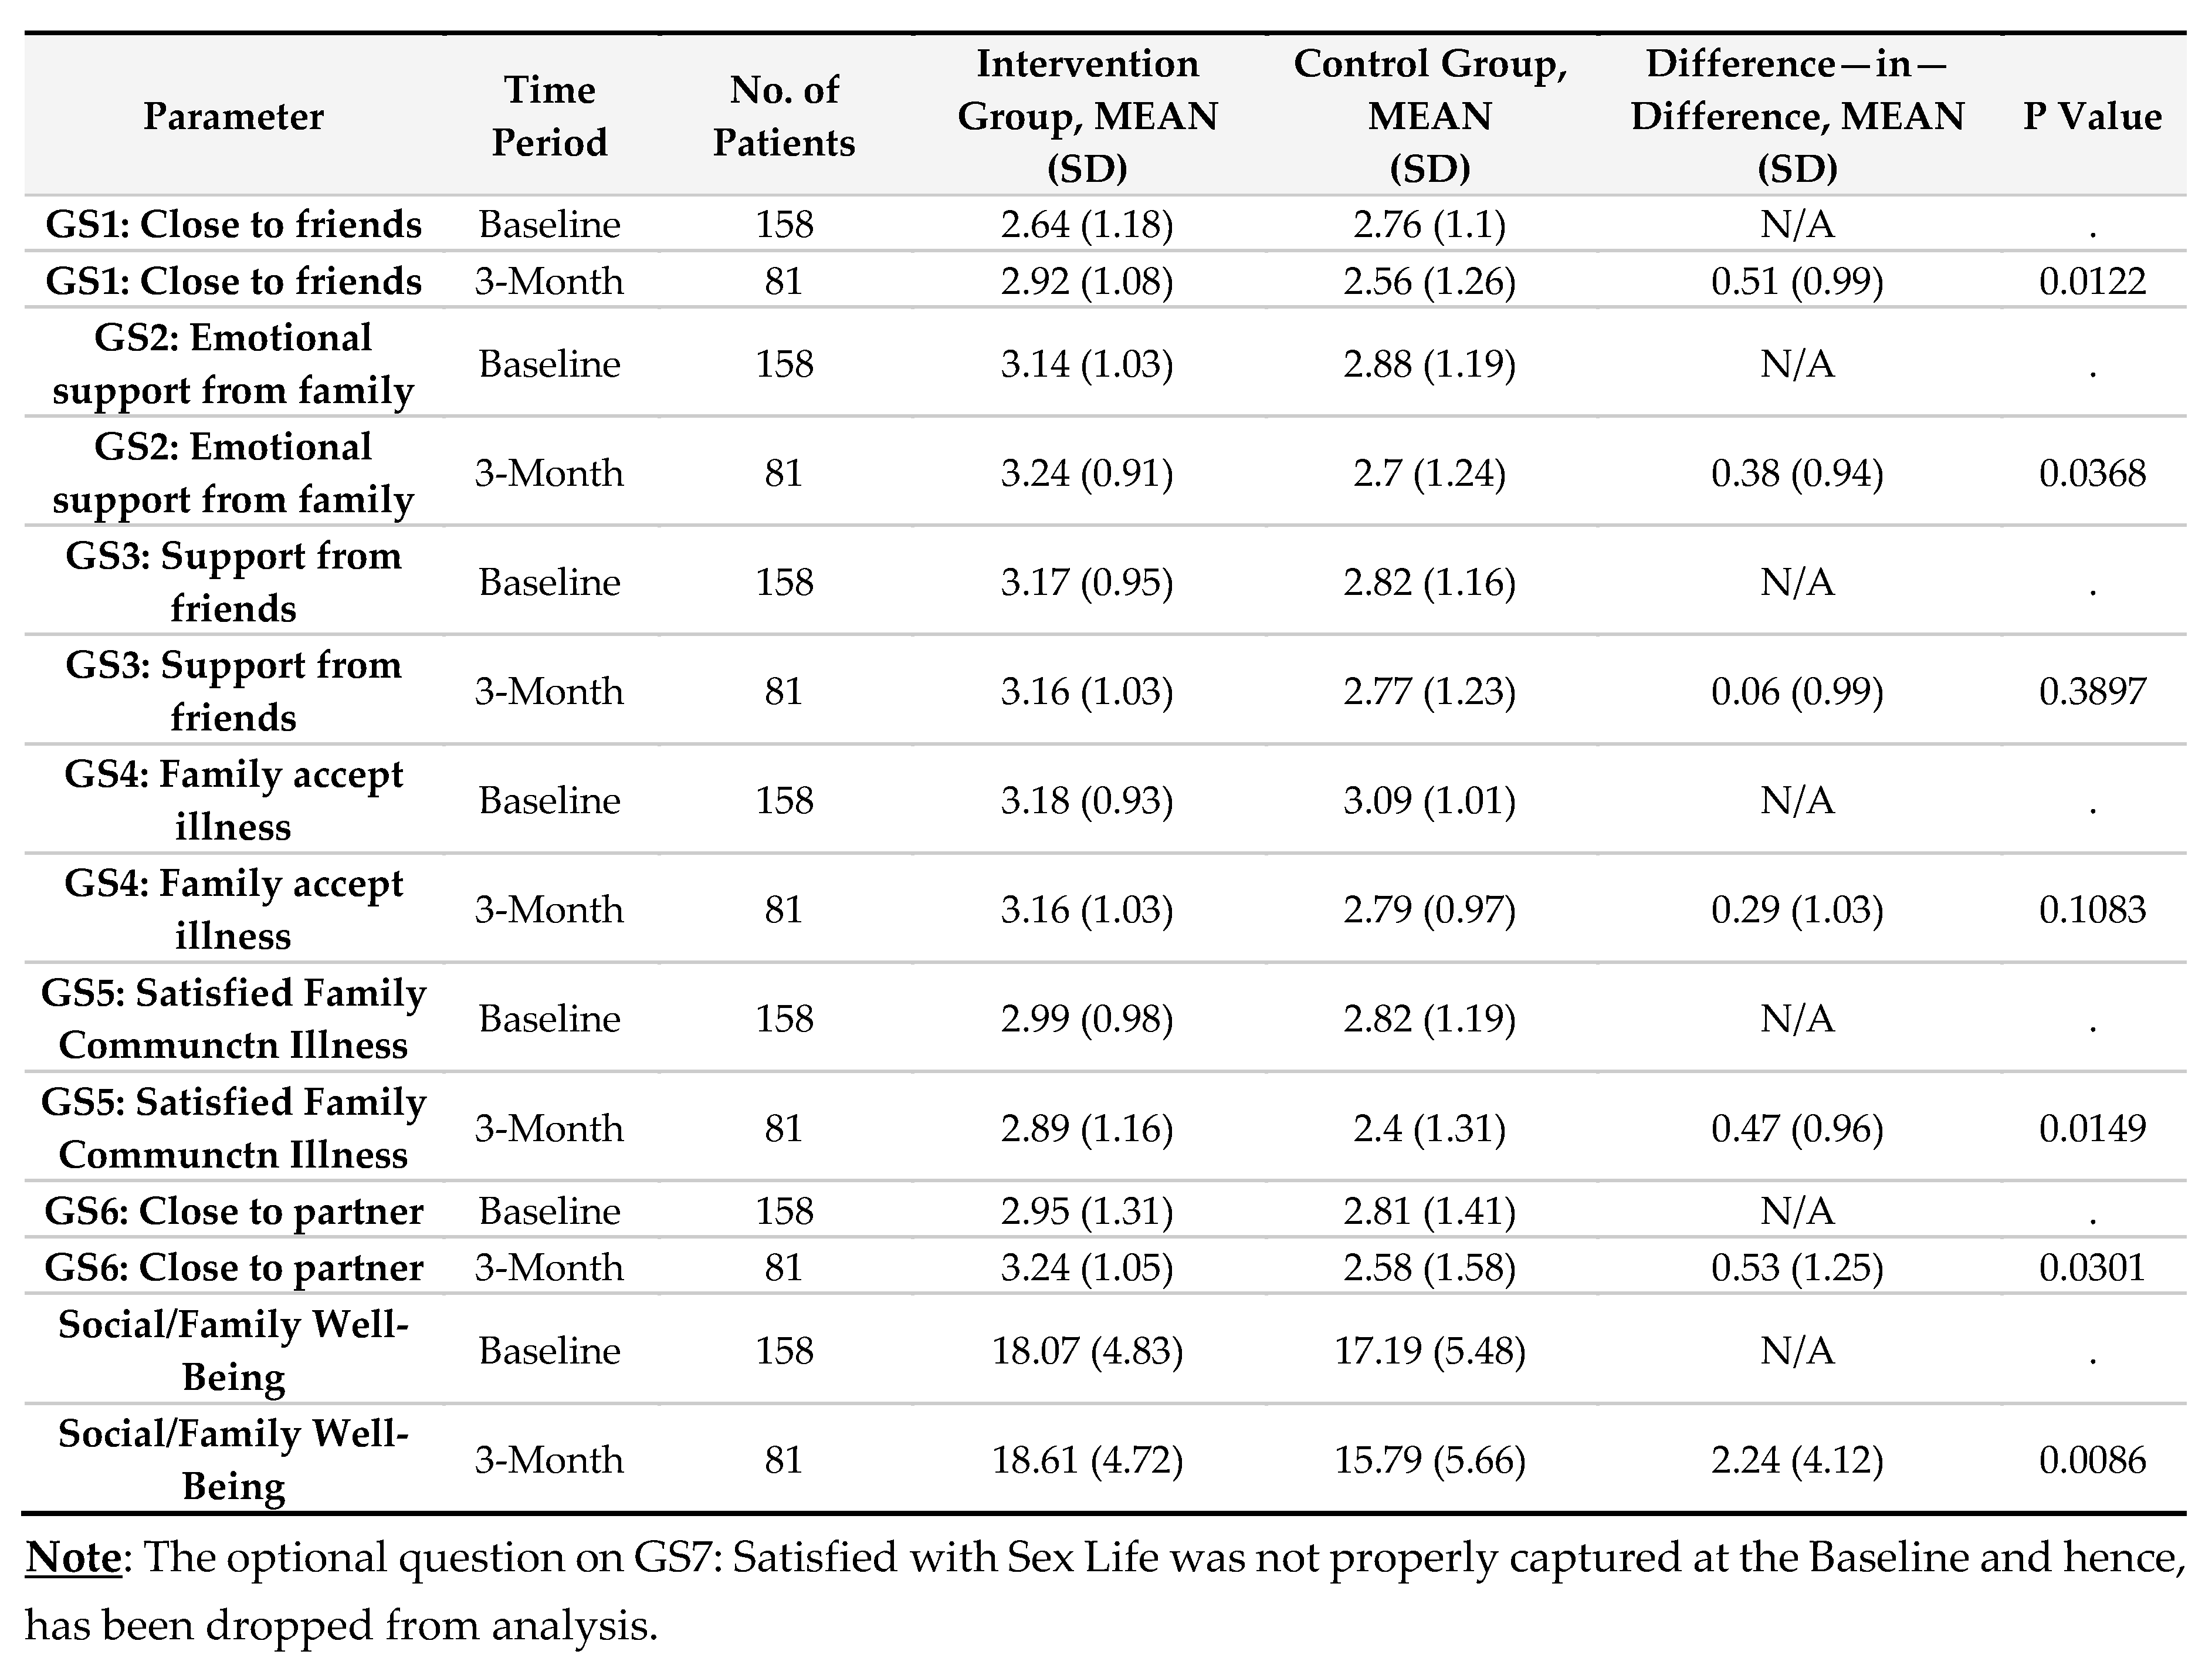
Social well-being scores improved significantly in the intervention group, increasing from 18.07 (SD 4.83) at baseline to 18.61 (SD 4.72) at three months, while the control group declined from 17.19 (SD 5.48) to 15.79 (SD 5.66). The DiD analysis revealed a 2.24-point improvement (SD 4.12, p = 0.0086). Notable increases were seen in emotional support from family (p = 0.0368), closeness to a partner (p = 0.0301), and satisfaction with family communication (p = 0.0149) (Supplemental Table 2).
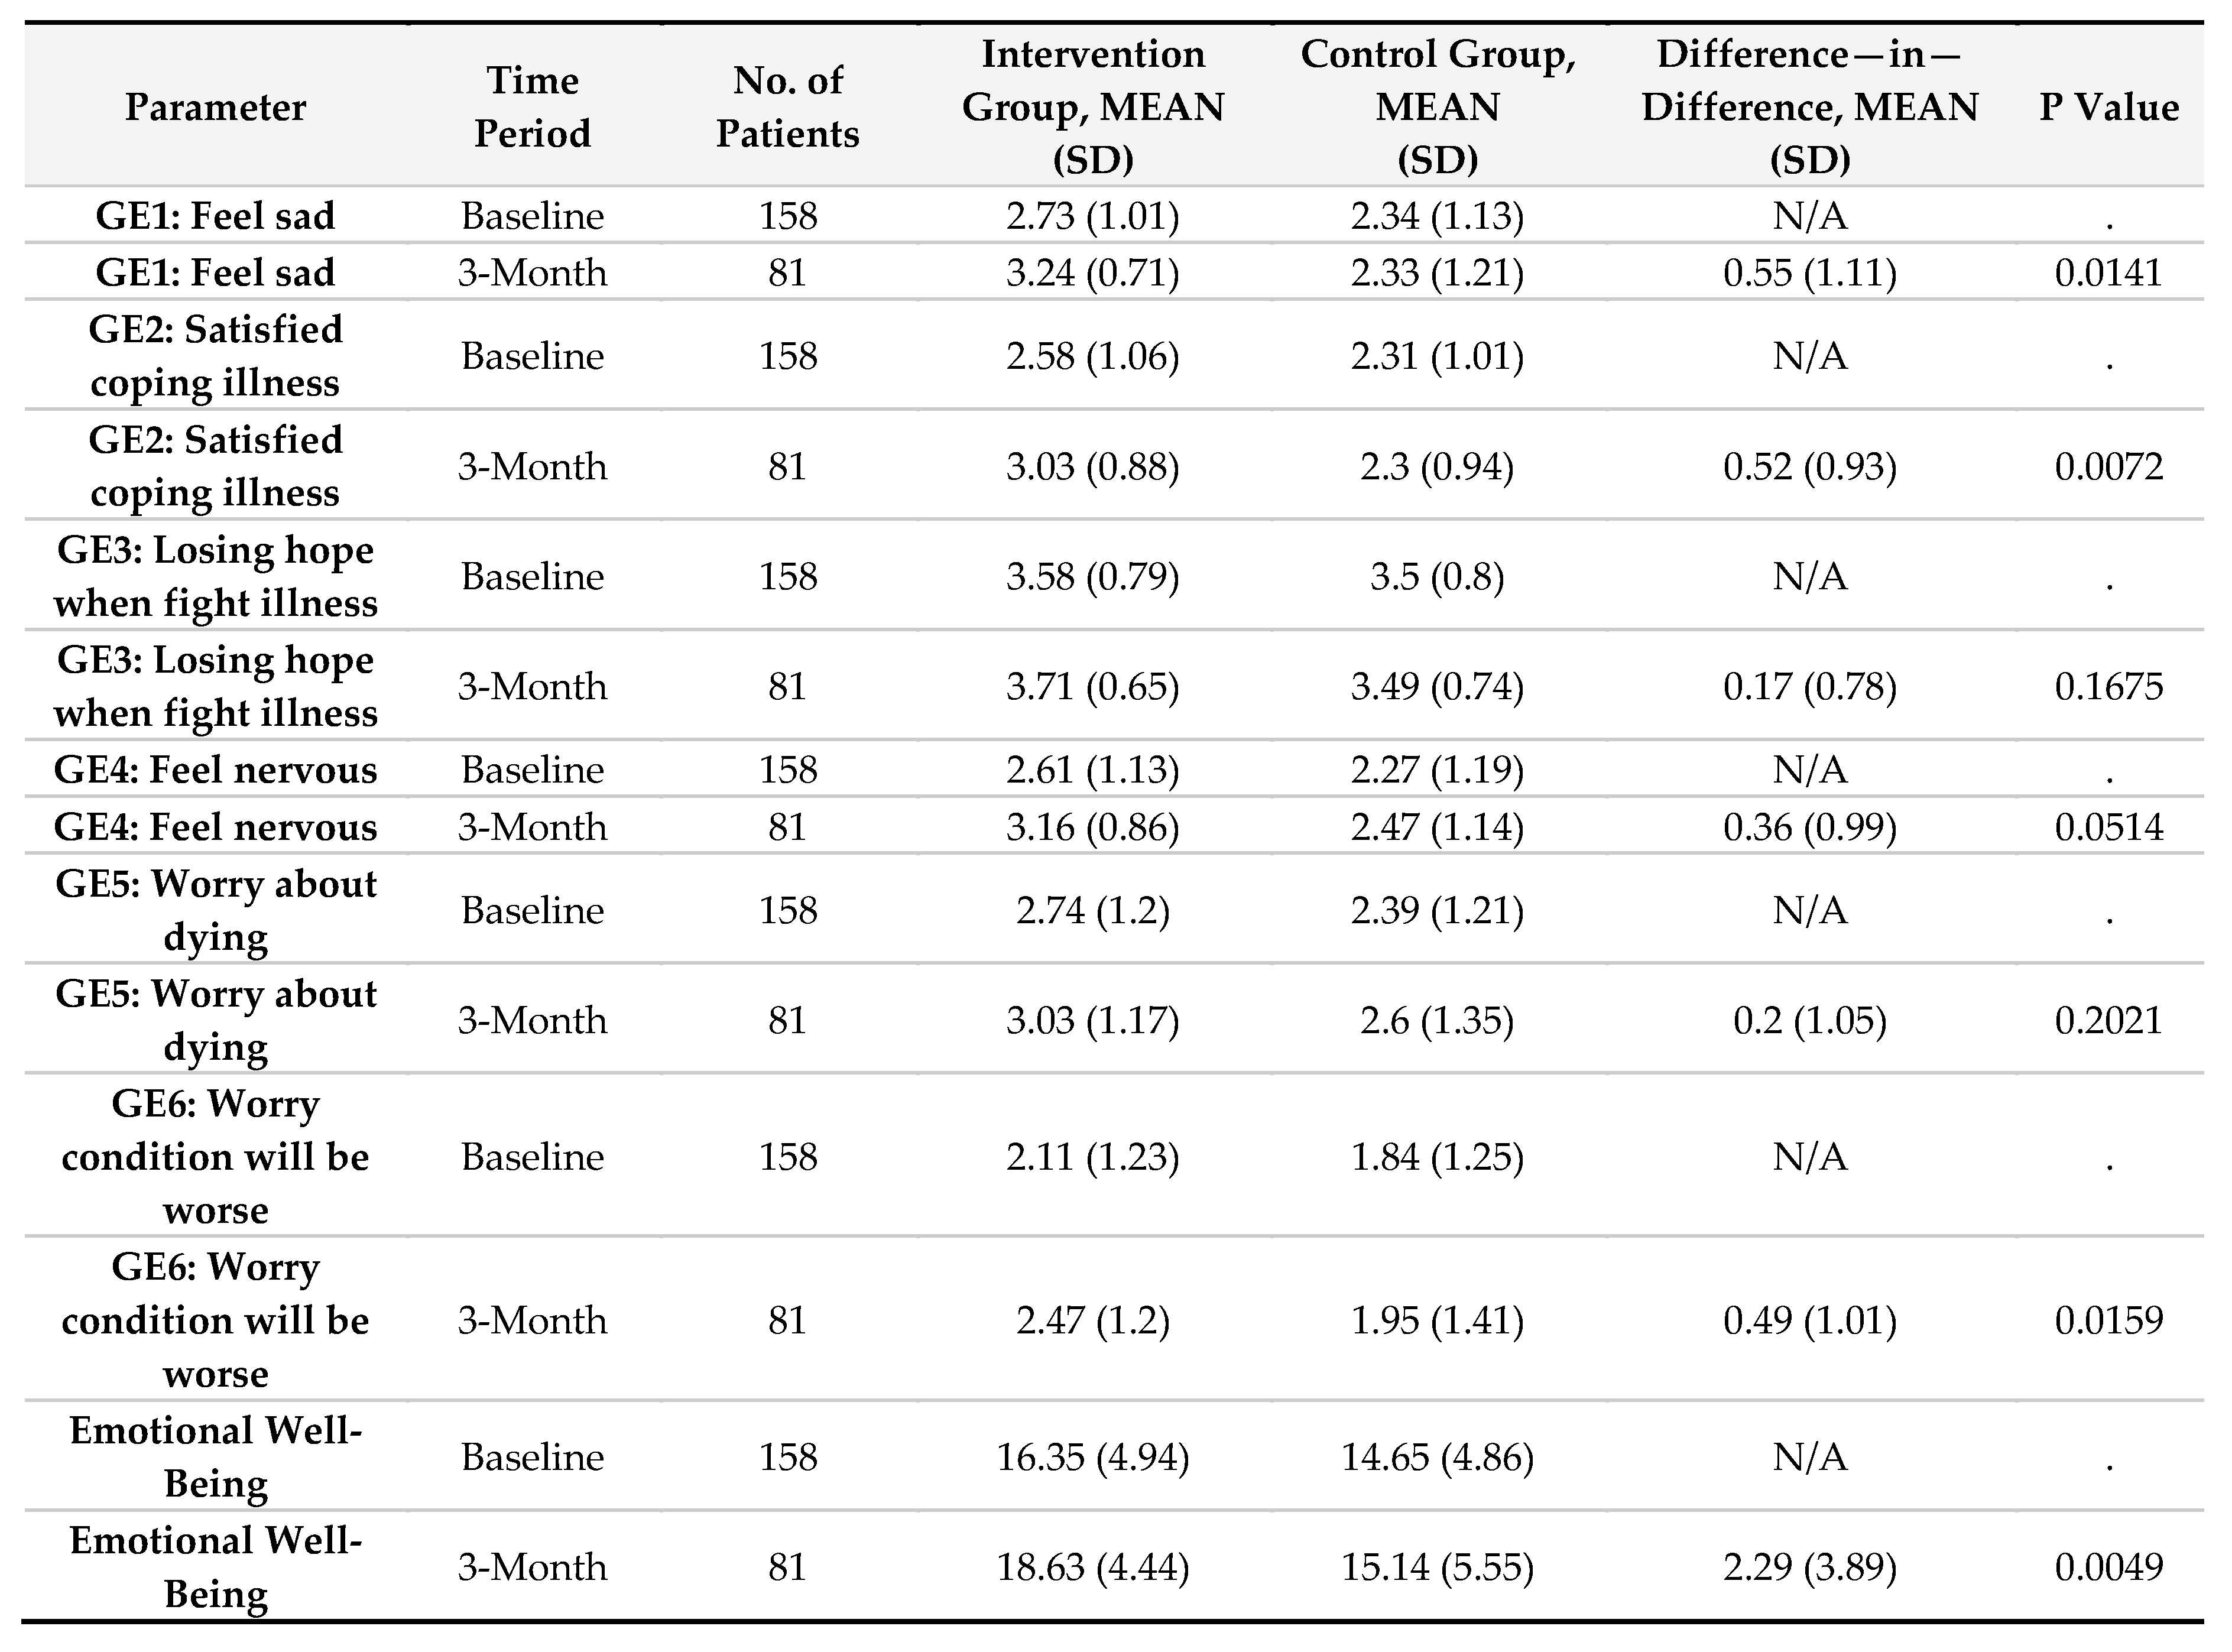
Emotional Well-Being (EWB)
Emotional well-being also improved in the intervention group, rising from 16.35 (SD 4.94) at baseline to 18.63 (SD 4.44) at three months, whereas the control group declined from 14.65 (SD 4.86) to 15.14 (SD 5.55). The DiD analysis indicated a significant 2.29-point increase (SD 3.89, p = 0.0049). Improvements were seen in reduced sadness (p = 0.0141), better coping with illness (p = 0.0072), and reduced worry about disease progression (p = 0.0159) (Supplemental Table 3).
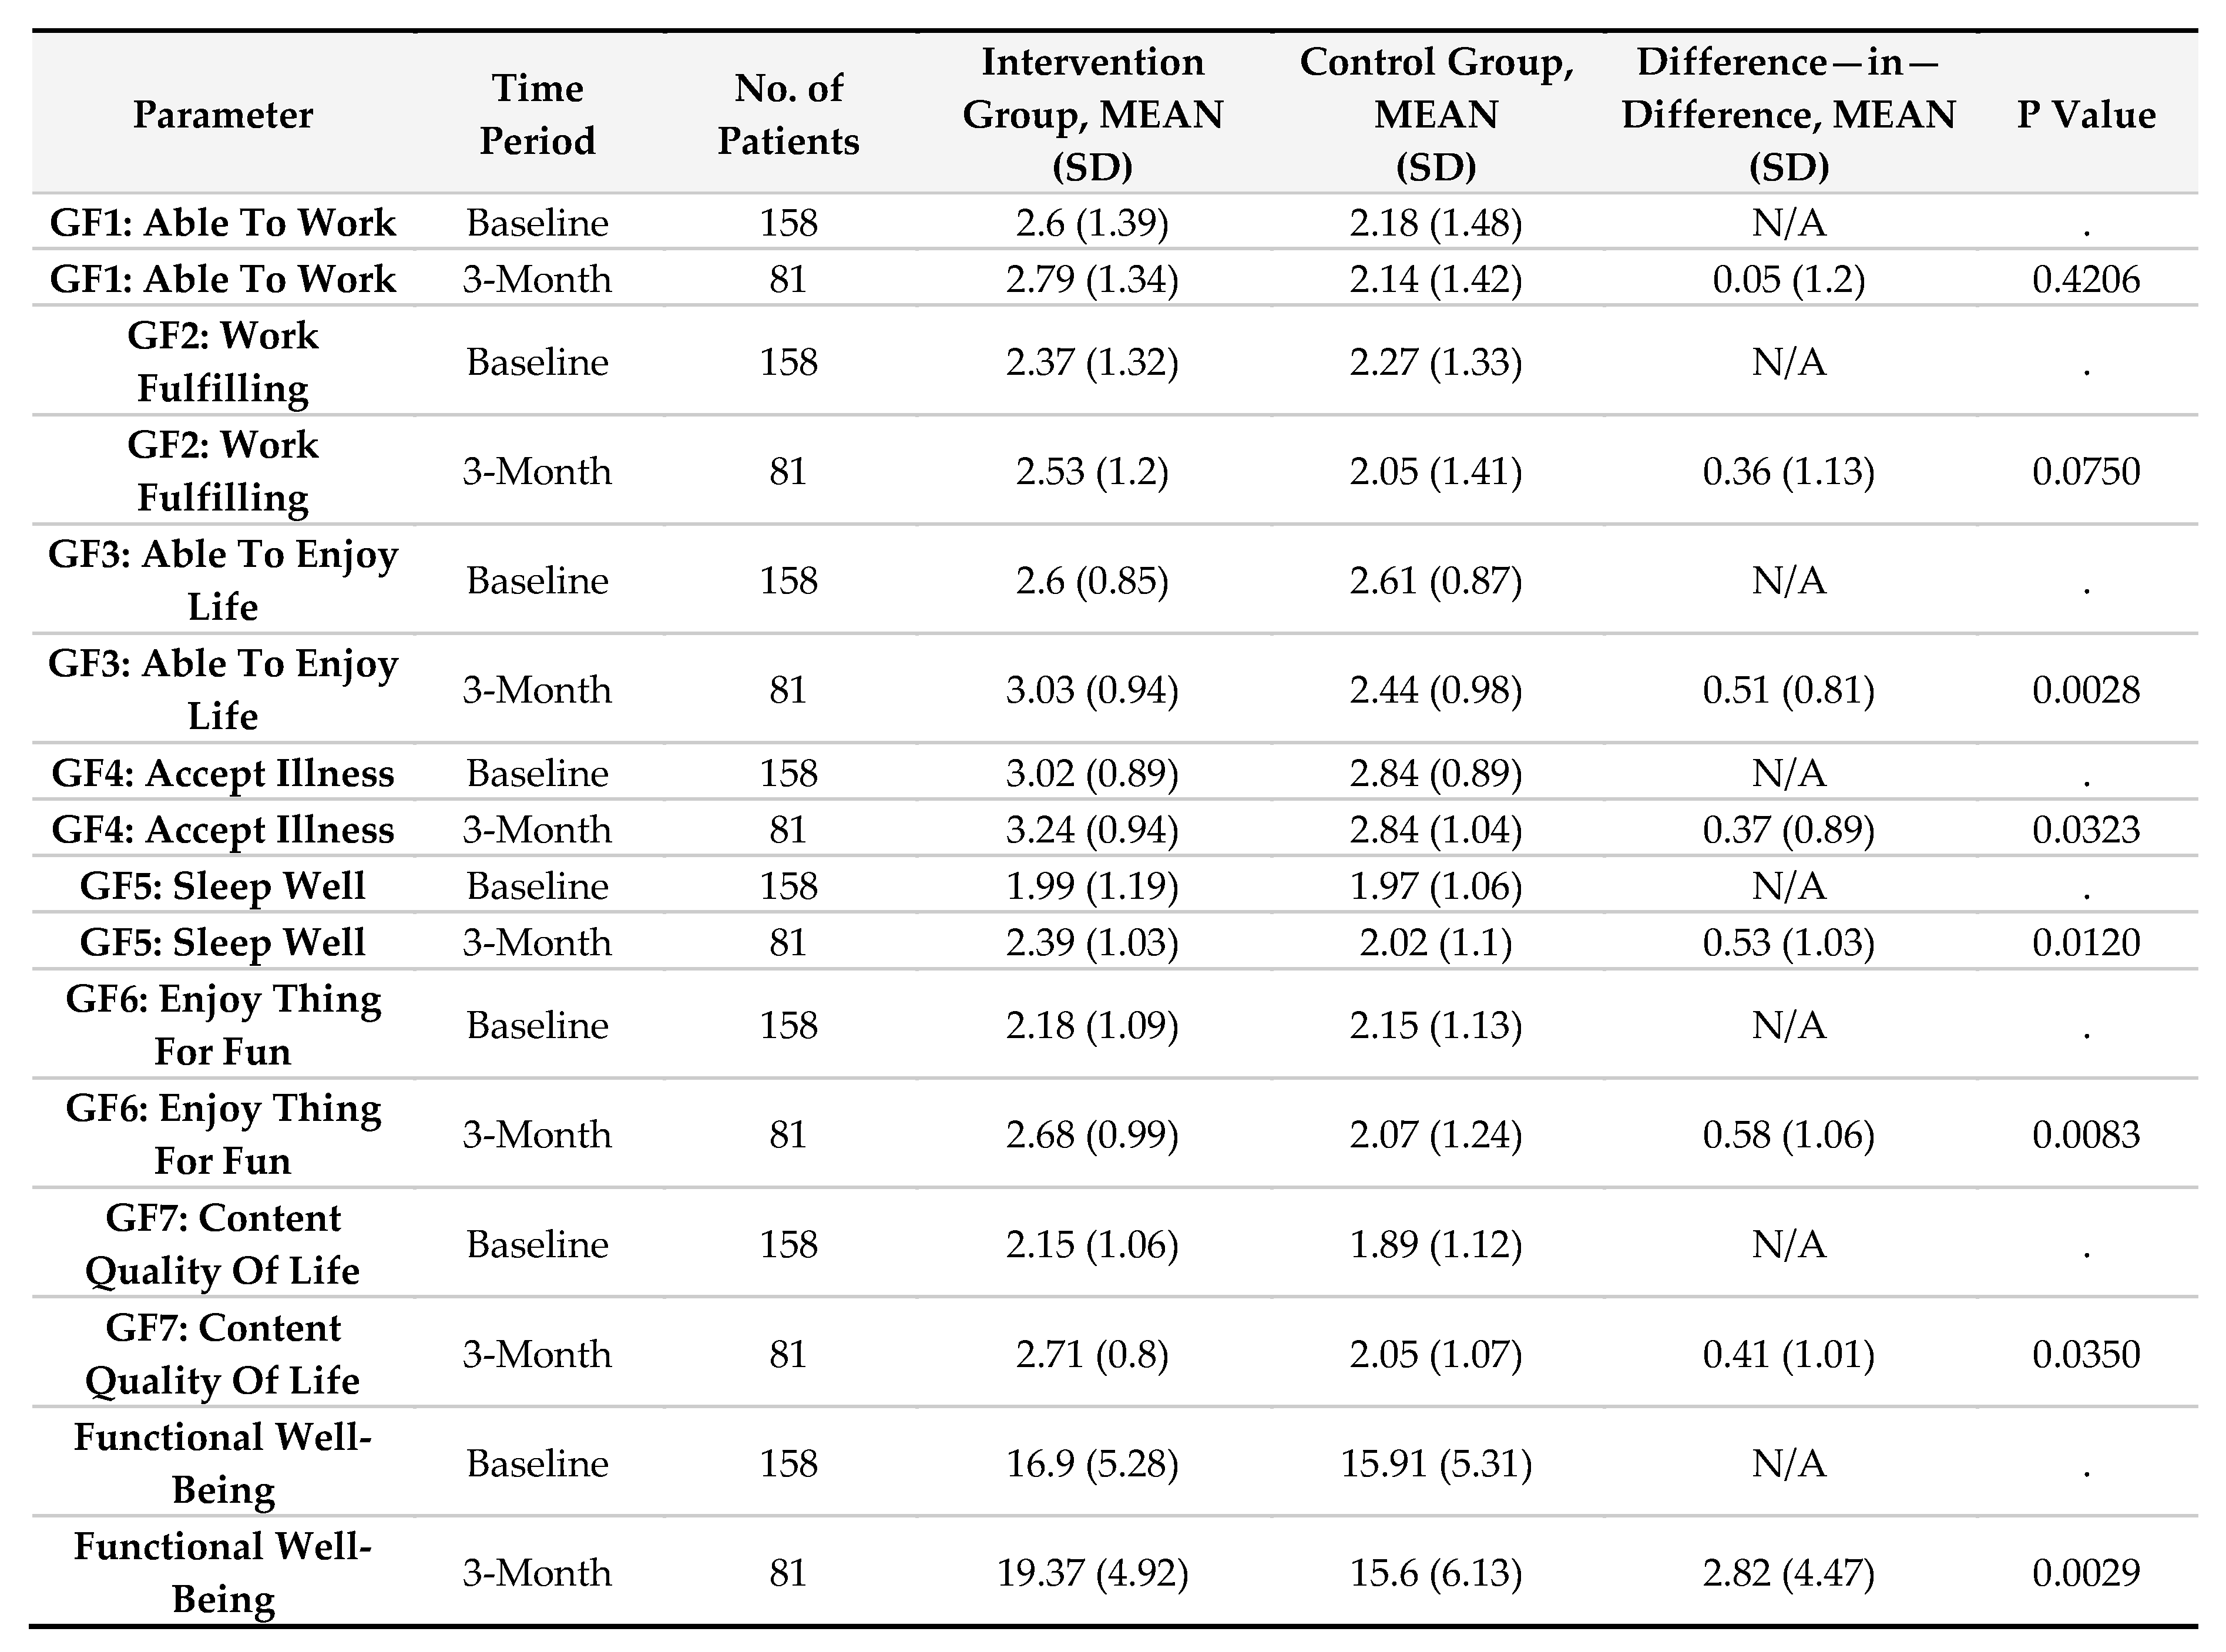
Functional Well-Being (FWB)
The intervention group showed substantial gains in functional well-being, increasing from 16.9 (SD 5.28) at baseline to 19.37 (SD 4.92) at three months, whereas the control group declined from 15.91 (SD 5.31) to 15.6 (SD 6.13). The DiD analysis indicated a 2.82-point increase (SD 4.47, p = 0.0029). Statistically significant improvements were observed in enjoyment of life (p = 0.0028), acceptance of illness (p = 0.0323), and sleep quality (p = 0.0120) (Supplemental Table 4).
Scheme 1.
Summary of Change for Quality-of-Life (FACT-G) Score on Physical Well Being (PWB) Subscale by Clinical Group, in different Time Period.
Scheme 1.
Summary of Change for Quality-of-Life (FACT-G) Score on Physical Well Being (PWB) Subscale by Clinical Group, in different Time Period.
Scheme 2.
Summary of Change for Quality-of-Life (FACT-G) Score on Social Well Being (SWB) Subscale by Clinical Group, in different Time Period.
Scheme 2.
Summary of Change for Quality-of-Life (FACT-G) Score on Social Well Being (SWB) Subscale by Clinical Group, in different Time Period.
Scheme 3.
Summary of Change for Quality-of-Life (FACT-G) Score on Emotional Well Being (EWB) Subscale by Clinical Group, in different Time Period.
Scheme 3.
Summary of Change for Quality-of-Life (FACT-G) Score on Emotional Well Being (EWB) Subscale by Clinical Group, in different Time Period.
Scheme 4.
Summary of Change for Quality-of-Life (FACT-G) Score on Functional Well Being (FWB) Subscale by Clinical Group, in different Time Period.
Scheme 4.
Summary of Change for Quality-of-Life (FACT-G) Score on Functional Well Being (FWB) Subscale by Clinical Group, in different Time Period.
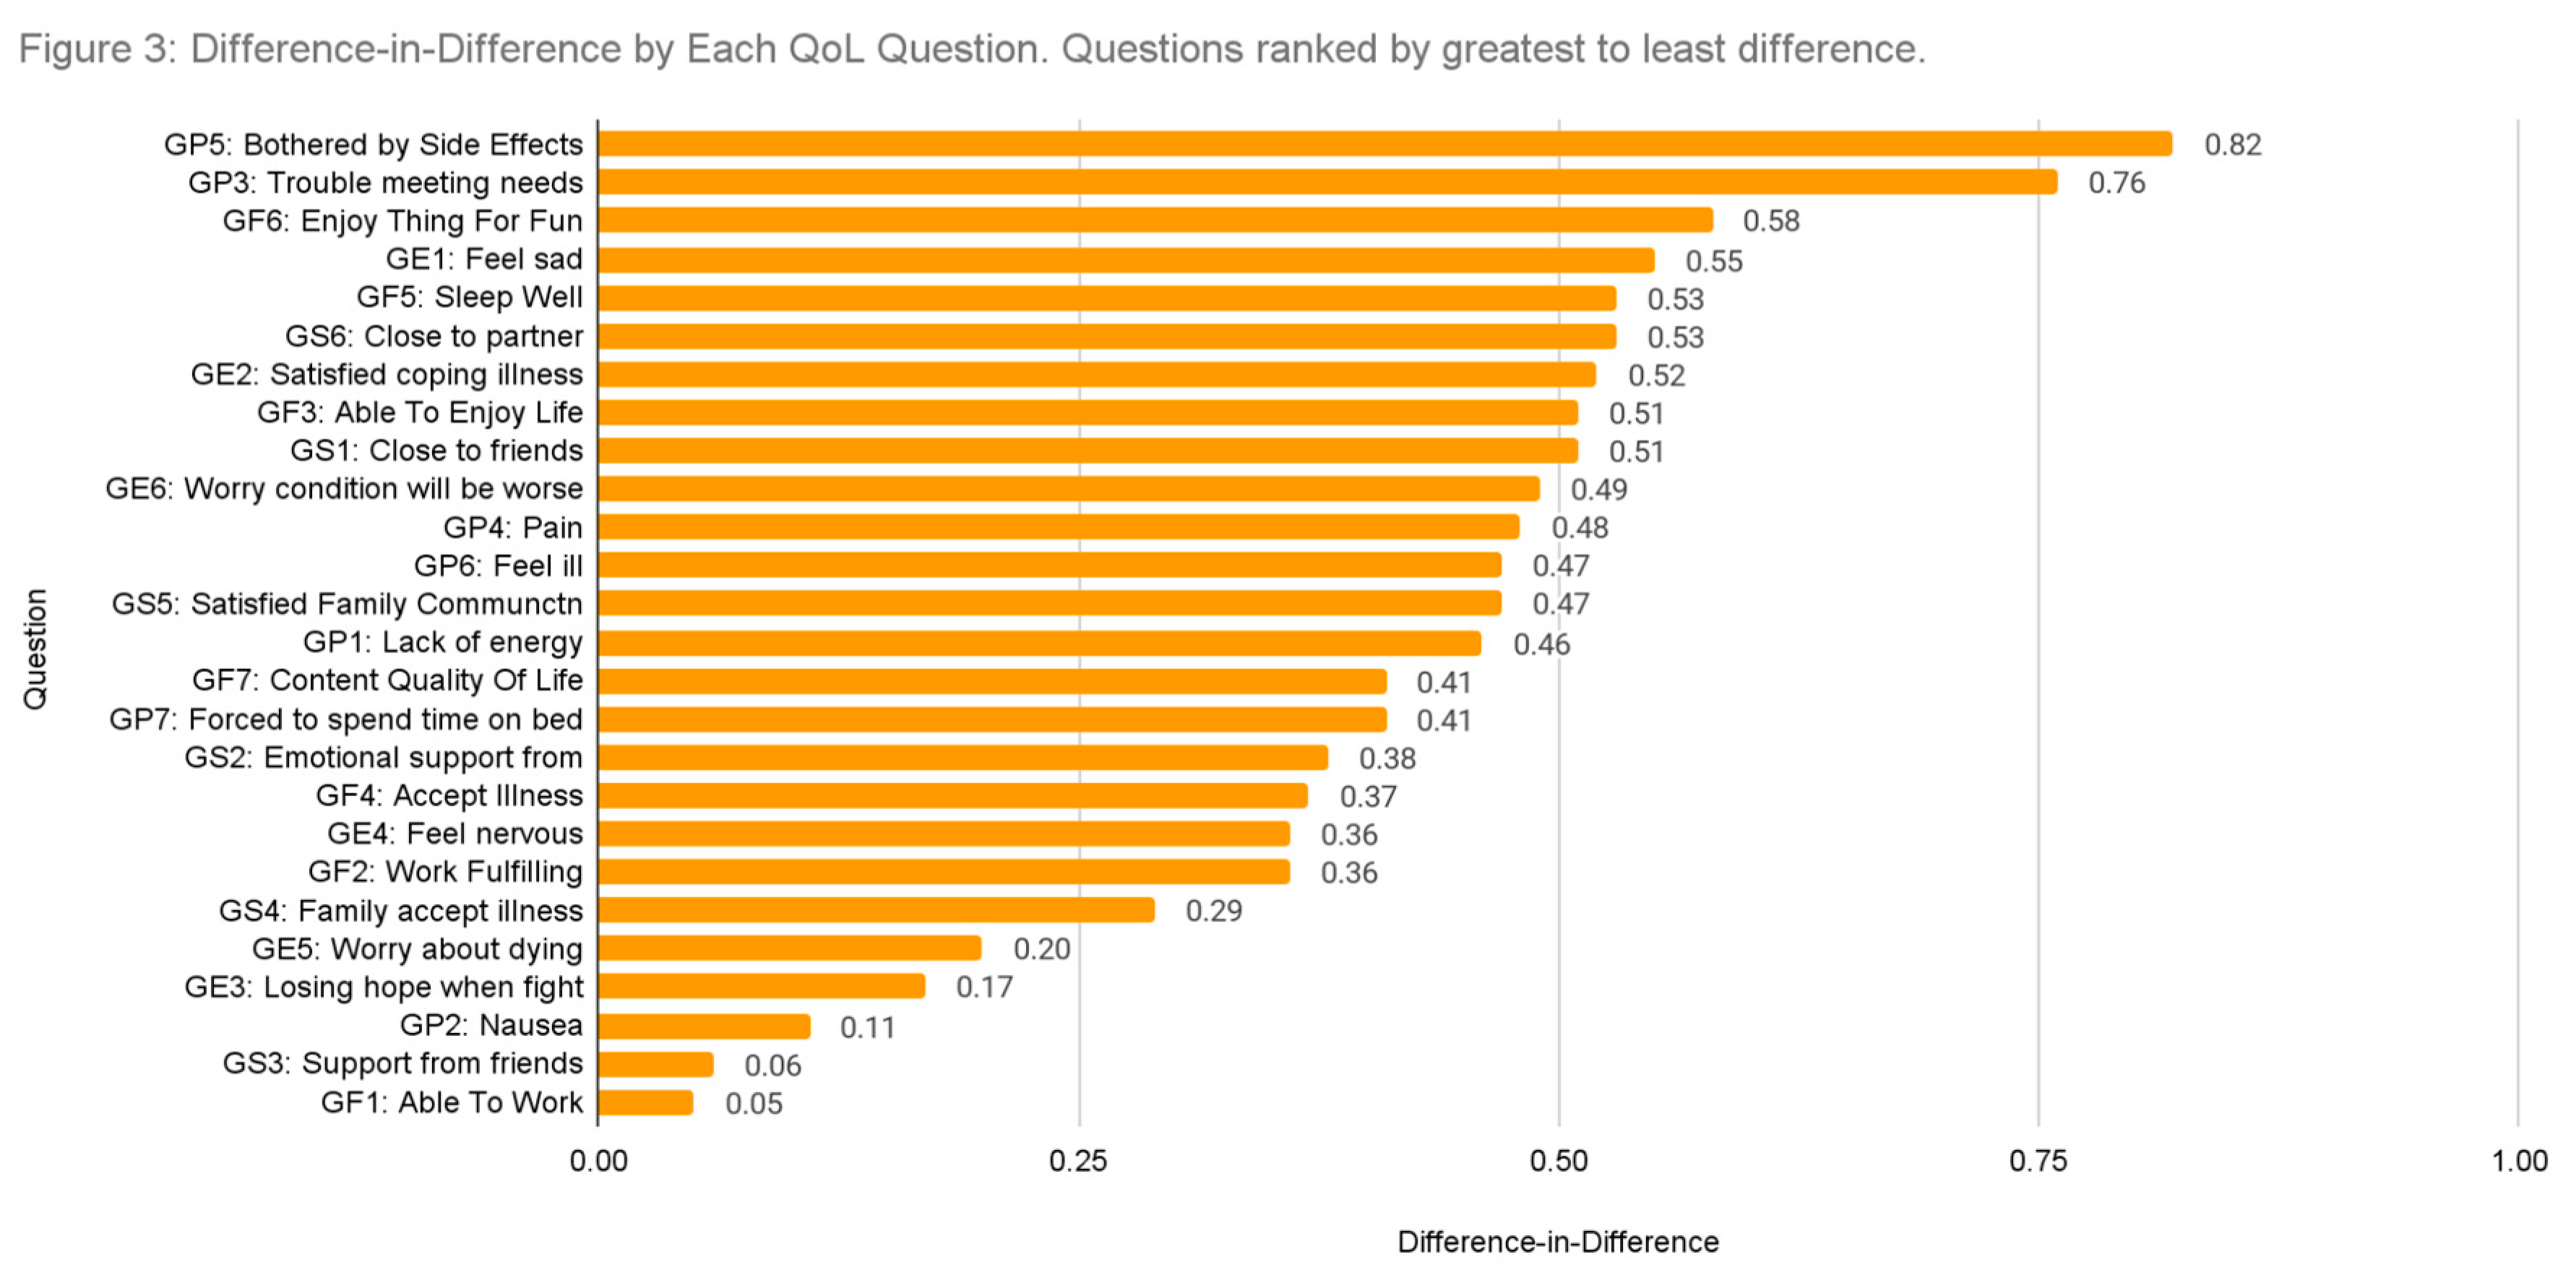
Impact of the Intervention Across Quality-of-Life Metrics
Across the 27 assessed quality-of-life metrics, the intervention demonstrated a positive relative impact, with all difference-in-differences (DiD) values greater than zero, indicating improvements in the intervention group relative to the control group. The most pronounced effect was observed in GP5: Bothered by Side Effects (DiD = 0.82, p < 0.05), suggesting a significant reduction in treatment-related discomfort among participants receiving synchronous coaching.
Additionally, key metrics relevant to cancer survivorship showed notable improvements. GF5: Sleep Well (DiD = 0.53, p < 0.05) indicated better sleep quality, a crucial factor for overall well-being, while GP4: Pain (DiD = 0.48, p < 0.05) demonstrated a significant reduction in pain levels.
Presenteeism at Work
The intervention group demonstrated significant improvements in workplace motivation and performance compared to the control group over the three-month period (Table 4).
At baseline, motivation levels were similar between groups (2.29 ± 1.13 in the intervention group vs. 2.30 ± 1.08 in the control group). After three months, motivation increased significantly in the intervention group to 2.76 ± 0.79, whereas it remained relatively unchanged in the control group (2.26 ± 1.2). The difference-in-differences (DiD) analysis showed a 0.48-point increase (SD 1.15, p = 0.0332) in motivation among participants receiving telehealth coaching.
Similarly, performance at work improved more in the intervention group, rising from 2.2 ± 1.05 at baseline to 2.53 ± 1.01 at three months. In contrast, the control group’s performance declined slightly (2.19 ± 0.96 at baseline to 1.98 ± 1.22 at three months). The DiD analysis indicated a 0.48-point improvement (SD 0.95, p = 0.0130) in work performance among intervention participants.
Absenteeism from Work
The impact of the intervention on work absenteeism was assessed by evaluating changes in weekly working hours among participants who were actively employed at baseline (Table 5).
At baseline, the intervention group reported an average of 29.76 h per week (SD 14.79), compared to 24.51 h per week (SD 13.98) in the control group. After three months, the intervention group showed a slight increase in average working hours to 32.29 (SD 14.59), whereas the control group experienced a decline to 20.05 h per week (SD 18.09).
The difference-in-differences (DiD) analysis indicated a relative improvement of 4.78 h per week (SD 11.95, p = 0.0999) in the intervention group. Although this trend suggests a potential benefit of the intervention in maintaining or increasing workforce participation among cancer survivors, the effect did not reach statistical significance.
The impact of the intervention on work absenteeism was also assessed by evaluating changes in long-term and short-term leave rates among participants in both study groups (Table 6).
At baseline, the proportion of participants on long-term leave was comparable between groups, with 85.71% (SD 35.2%) in the intervention group and 79.73% (SD 40.48%) in the control group. After three months, the percentage of participants on long-term leave in the intervention group remained stable at 84.21% (SD 36.95%), whereas in the control group, the percentage decreased to 72.09% (SD 45.39%). The difference-in-differences (DiD) analysis showed a relative increase of 2.33% (SD 25.1%, p = 0.3392) in long-term leave for the intervention group compared to the control group, though this change was not statistically significant.
For short-term leave, baseline rates were 88.1% (SD 32.58%) in the intervention group and 81.08% (SD 39.43%) in the control group. At three months, the intervention group showed an increase in short-term leave to 97.37% (SD 16.22%), while the control group increased to 88.37% (SD 32.44%). The DiD analysis indicated a 6.36% (SD 36.13%, p = 0.2156) decrease in short-term leave in the intervention group compared to the control group, though this result was also not statistically significant.
Discussion
This study provides strong evidence supporting the effectiveness of a synchronous telehealth lifestyle intervention in reducing healthcare expenditures, improving QoL, and enhancing workforce productivity among cancer survivors. The findings indicate that personalized, live coaching for exercise, mindfulness, and lifestyle modifications can drive substantial cost savings and health benefits, positioning telehealth-based interventions as a scalable and effective adjunct to standard cancer survivorship care.
The intervention resulted in a 56% relative reduction in healthcare expenditures within three months, translating to an average monthly cost savings of $14,955 per participant (p = 0.0089). This significant cost reduction suggests that a structured, coaching-based lifestyle program can mitigate the financial burden associated with cancer survivorship. Potential mechanisms underlying these savings include reduced acute care utilization, fewer emergency department visits, and improved management of cancer-related symptoms such as fatigue and pain. These findings align with previous studies demonstrating that structured lifestyle interventions lower healthcare costs by reducing the need for high-cost medical interventions [9,10,11].
Participants in the intervention group experienced clinically meaningful improvements across all subdomains of QoL, including physical, emotional, social, and functional well-being. A 10.84-point increase in the overall FACT-G score (p = 0.0002) was observed, exceeding the 10-point threshold commonly associated with improved survival outcomes in cancer patients [12,13,14]. Specifically, intervention participants reported improved energy levels (p = 0.0555), reduced pain (p = 0.0126), enhanced sleep quality (p = 0.0120), and better emotional coping (p = 0.0072). These results underscore the broad therapeutic impact of structured lifestyle interventions beyond traditional medical treatment.
A key secondary outcome was the impact on employment-related metrics, given that most participants were of working age. The intervention group demonstrated significant improvements in presenteeism, with increases in workplace motivation (p = 0.0332) and self-reported job performance (p = 0.0130). This aligns with observed enhancements in physical well-being, suggesting that greater energy levels and reduced symptom burden enable cancer survivors to maintain productivity.
Although changes in weekly working hours (+4.78 h, p = 0.0999) and short-term leave (-6.36%, p = 0.2156) trended favorably for the intervention group, they did not reach statistical significance. However, these results suggest a potential for long-term benefits in workforce retention, warranting further study with longer follow-up periods and possibly larger sample sizes.
One of the most striking findings was the high adherence rate (86%) in the intervention group, compared to 15% in the control group. This suggests that synchronous telehealth coaching fosters greater participant engagement by providing personalized guidance, accountability, and social support. Previous studies have highlighted adherence as a key limitation of lifestyle intervention,[5] and this study demonstrates a scalable telehealth solution to address this challenge.
The intervention demonstrated effectiveness across racially diverse populations, with over 35% of participants identifying as non-white. This finding underscores the broad applicability of telehealth coaching interventions, suggesting that lifestyle modifications can be successfully implemented across different racial and ethnic groups. Given the well-documented disparities in cancer outcomes,[7] the ability of this intervention to engage diverse populations highlights its potential to reduce health inequities in survivorship care.
Additionally, the study included participants with a wide range of cancer types, from common malignancies such as breast, lunch, and prostate cancer to colorectal and rarer cancers. The intervention’s consistent impact across cancer types reinforces the case for integrating structured lifestyle modification programs into standard oncology care, regardless of cancer diagnosis. These findings suggest that healthcare systems should prioritize evidence-based lifestyle interventions as a core component of survivorship support, given their broad efficacy across cancer subtypes.
The study also provides important insights into cancer survivorship in younger populations, a demographic experiencing a growing incidence of malignancies [8]. With a median participant age of 55 years, significantly lower than the median age of cancer diagnosis (66 years), the findings indicate that younger cancer survivors can derive substantial benefits from telehealth-based lifestyle coaching. Given the increasing prevalence of early-onset cancers and the long-term survivorship challenges faced by younger patients, scalable interventions such as this study’s online mobile application may play a critical role in supporting functional recovery, workforce participation, and long-term well-being in this population.
While this interim analysis provides promising evidence of the intervention’s effectiveness, several limitations should be acknowledged. First, the study’s relatively short follow-up period (90 days) limits the ability to assess the long-term sustainability of health improvements and cost savings. Future research with extended follow-up is needed to evaluate whether observed benefits persist over time. Second, the study relied on self-reported measures for quality of life, presenteeism, and absenteeism, which may be subject to response bias. Incorporating objective employment and healthcare utilization data from employers or claims databases could strengthen future analyses. Third, although participants were recruited from 33 U.S. states, the use of Facebook-based recruitment may have introduced selection bias, potentially favoring individuals who are more health-conscious or technologically adept. Additionally, while the intervention demonstrated high adherence (86%), its effectiveness in broader real-world settings with lower engagement levels remains to be seen. Lastly, the control group received only self-guided materials, limiting the ability to determine how the intervention compares to other structured lifestyle programs, such as in-person coaching. Future studies should explore comparative effectiveness designs and assess how different levels of engagement influence outcomes.
These findings have broad implications for healthcare systems, employers, and policymakers. As cancer survivorship rates continue to increase, scalable digital health interventions can serve as cost-effective tools to support long-term recovery and well-being. Given the observed improvements in QoL and workforce productivity, employers and insurance providers may consider integrating lifestyle coaching into employee wellness programs and enrollee healthy behavior programs. Managed care health plans may also use the intervention in performance improvement projects to enhance outcomes for their cancer survivor population. Future research will build on further use of Artificial Intelligence and Machine Learning for personalization to optimize engagement.
Conclusions
This study highlights the transformative potential of a telehealth-based lifestyle intervention for cancer survivors, demonstrating significant reductions in healthcare costs, improved quality of life, and enhanced workforce productivity. By integrating live, personalized coaching, the program effectively supports survivorship while reducing the economic burden on healthcare systems and employers. Given the observed improvements in presenteeism, absenteeism, and overall well-being, employers may benefit from incorporating such interventions into workplace wellness programs to support their employees and family with history of cancer. As telehealth continues to evolve, future research will explore the long-term sustainability and broad integration of these interventions into standard oncology care and employer-sponsored health initiatives to maximize both clinical and economic outcomes.
Appendix A
Randomisation
Randomization Approach
We utilized block randomization to maintain balanced sample sizes across groups in our randomized controlled trial. With a block size of 4, participants are grouped into sets of four, ensuring that each block assigns exactly two participants to the Intervention Group and two to the Control Group. This method minimizes imbalance and supports unbiased allocation throughout the trial.
Block Sequence Design
Within each block of four, the assignment sequence (e.g., AABB, ABAB, BBAA, BABA, ABBA, BAAB, where A is Intervention and B is Control) is randomly generated. This randomization of sequences ensures equitable distribution and prevents predictability, enhancing the trial’s integrity. Unique Random IDs (RandIDs) are created for each cancer type based on this logic.
RandID Structure
Each RandID encapsulates key details:
STRATA: A numeric code identifying the cancer type.
STRATADESC: A text description of the cancer (e.g., Breast Cancer).
BLOCK: The block number, ensuring even group sizing.
ACTUALTRT: The true assignment (Control or Intervention).
DUMMYTRT: A masked assignment for blinding purposes.
This structure links each participant to their specific cancer stratum and group allocation.
RandID Reservation Process
Upon initial patient registration, a RandID is temporarily reserved, securing the participant’s spot in either the Intervention or Control Group according to the pre-assigned block sequence. This step ensures that group assignments remain balanced as recruitment progresses.
RandID Confirmation and Allocation
During final confirmation and onboarding, the reserved RandID is officially confirmed and permanently assigned to the participant. At this stage, the patient is formally enrolled into their designated group (Intervention or Control), locking in their trial participation.
RandID Release Mechanism
If a patient opts out or fails to complete the confirmation phase, their reserved RandID is released back into the available pool. This freed RandID is then reassigned to the next eligible participant, maintaining the trial’s randomization integrity and group balance.
Program Details
The intervention group was given access to a fully live platform (ct1.app) delivering personalized, evidence-based lifestyle interventions through highly trained CoActive Cancer Lifestyle Coaches. The cancer survivors in the intervention group were provided daily live one-on-one video guidance tailored specifically to their unique physical and emotional needs.
The journey began with an intake form designed by oncologists and cancer physical therapists. Completed within 120 s, this form was used to create highly customized program for each survivor from Day 0.
On Day 1, participants commence their structured, daily 45-min sessions, conducted 5 times per week. Each session integrates:
- Daily Live Physical Activity Coaching: Personalized exercise sessions across various modalities such as strength and conditioning, cardiovascular workouts, dance, and yoga, tailored precisely to participants’ data-driven physical capabilities and preferences.
- Daily Dietary Challenges: Coaches collaborate directly with participants on dietary challenges, based on AICR nutritional guidelines, fostering mutual accountability and adherence.
- Daily Somatic Practices: Structured meditation and breathwork sessions designed to heal deep-rooted trauma, removing barriers to sustained lifestyle change.

References
- 2024 Global Medical Trend Rates Report (Aon).
- Brown, Justin C.; Gilmore, L. Anne. Physical Activity Reduces the Risk of Recurrence and Mortality in Cancer Patients. Exercise and Sport Sciences Reviews 48(2):p 67-73, April 2020. |. [CrossRef]
- Christine M Friedenreich, Chelsea R Stone, Winson Y Cheung, Sandra C Hayes, Physical Activity and Mortality in Cancer Survivors: A Systematic Review and Meta-Analysis, JNCI Cancer Spectrum, Volume 4, Issue 1, February 2020, pkz080. [CrossRef]
- Mehta R, Sharma K, Potters L, et al. (May 09, 2019) Evidence for the Role of Mindfulness in Cancer: Benefits and Techniques. Cureus 11(5): e4629. [CrossRef]
- Christopher, M. Blanchard et al., Cancer Survivors’ Adherence to Lifestyle Behavior Recommendations and Associations With Health-Related Quality of Life: Results From the American Cancer Society’s SCS-II. JCO 26, 2198-2204(2008). [CrossRef]
- Overcoming Barriers to Maintaining Physical Activity during Cancer Care (MSKCC Research.
- Jianhui Zhao, Liying Xu, Jing Sun, Mingyang Song, Lijuan Wang, Shuai Yuan, Yingshuang Zhu, Zhengwei Wan, Susanna Larsson, Konstantinos Tsilidis, Malcolm Dunlop, Harry Campbell, Igor Rudan, Peige Song, Evropi Theodoratou, Kefeng Ding, Xue Li—Global trends in incidence, death, burden and risk factors of early-onset cancer from 1990 to 2019: BMJ Oncology 2023;2:e000049.
- Florence, C.S. , Bergen, G., Atherly, A., Burns, E., Stevens, J. and Drake, C. (2018), Medical Costs of Fatal and Nonfatal Falls in Older Adults. J Am Geriatr Soc, 66: 693-698. [CrossRef]
- Wonders, K., Harness, J. K., & Lerner, A. G. (2023). BPI23-010: The Benefits of a Clinically Based Individualized Exercise Oncology Program on Health Care Utilization in Patients With Malignancies. Journal of the National Comprehensive Cancer Network, 21(3.5), BPI23-010-BPI23-010. Retrieved Feb 27, 2025. [CrossRef]
- Grossman H, Burnell MJ, Bouchard DR. How One Community Exercise Program for People Living With Cancer Impacted Health Care Utilization. Oncology Issues. 2024;39(5):7-13. [CrossRef]
- Karen, Y. Wonders et al., Cost-Savings Analysis of an Individualized Exercise Oncology Program in Early-Stage Breast Cancer Survivors: A Randomized Clinical Control Trial. JCO Oncol Pract 18, e1170-e1180(2022). [CrossRef]
- J. F. Grutsch et al., Quality of life: An independent prognostic variable in a general population of cancer patients receiving chemotherapy. JCO 25, 19596-19596(2007). [CrossRef]
- Yost, K. J. , Thompson, C. A., Eton, D. T., Allmer, C., Ehlers, S. L., Habermann, T. M., … Cerhan, J. R. (2012). The Functional Assessment of Cancer Therapy—General (FACT-G) is valid for monitoring quality of life in patients with non-Hodgkin lymphoma. Leukemia & Lymphoma, 54(2), 290–297. [CrossRef]
- Therese, Djärv; et al., Prognostic Value of Changes in Health-Related Quality of Life Scores During Curative Treatment for Esophagogastric Cancer. JCO 28, 1666-1670(2010). [CrossRef]
- François, Meyer; et al., Health-Related Quality of Life As a Survival Predictor for Patients With Localized Head and Neck Cancer Treated With Radiation Therapy. JCO 27, 2970-2976(2009). [CrossRef]
- Braun, D.P. , Gupta, D., Grutsch, J.F. et al. Can changes in health related quality of life scores predict survival in stages III and IV colorectal cancer?. Health Qual Life Outcomes 9, 62 (2011). [CrossRef]
- Cowie J, Gurney M The Use of Facebook Advertising to Recruit Healthy Elderly People for a Clinical Trial: Baseline Metrics JMIR Res Protoc 2018;7(1):e20 URL: https://www.researchprotocols.org/2018/1/e2. [CrossRef]
Figure 1.
Participant Flow in the Randomized Clinical Trial.
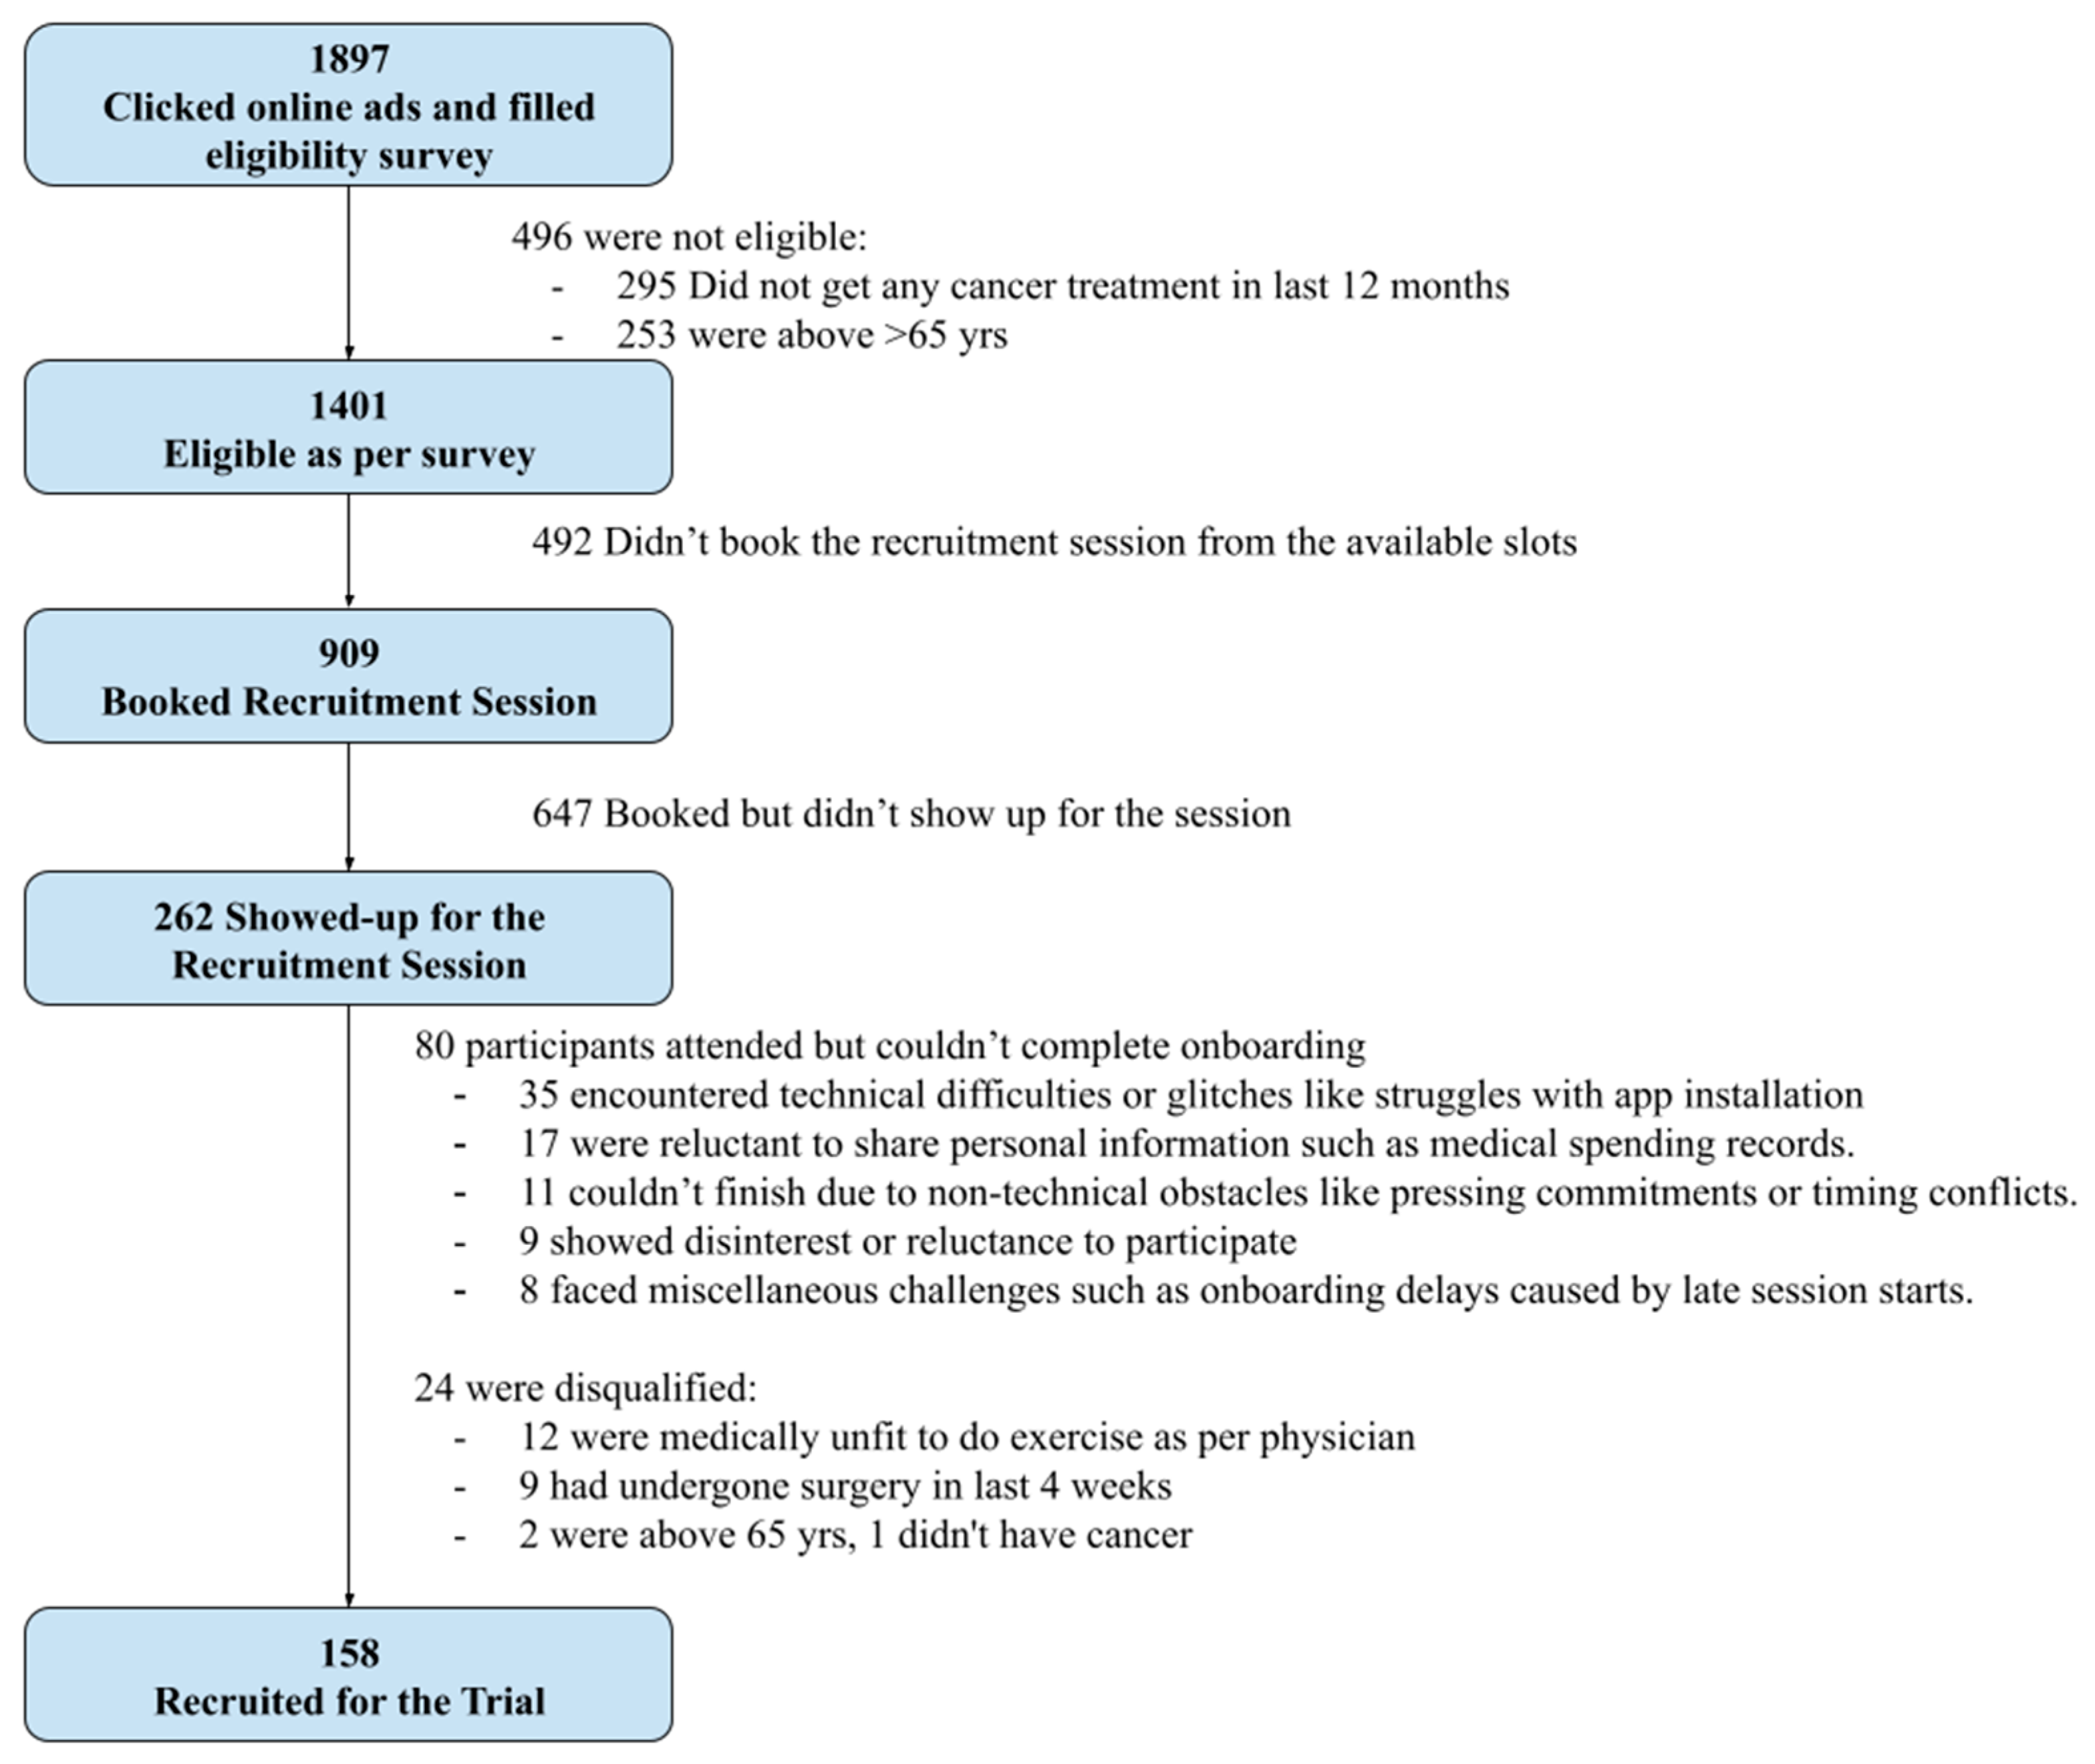

Table 1.
Demographic and Baseline Case Characteristics by Treatment Group.
| Intervention Group | Control Group | Total | ||
| Demographic | Total Participants | 84 | 74 | 158 |
| Median Age | 56 | 53 | 54 | |
| Intervention Group | Control Group | Total | ||
| Age Group | Below 45 | 10.6% | 18.9% | 14.5% |
| Between 45-54 | 29.4% | 41.9% | 35.2% | |
| 55 above | 60.0% | 39.2% | 50.3% | |
| Intervention Group | Control Group | Total | ||
| Cancer Type | Breast | 61.2% | 64.9% | 62.9% |
| Colorectal | 9.4% | 12.2% | 10.7% | |
| Lung | 3.5% | 2.7% | 3.1% | |
| Prostate | 3.5% | 4.1% | 3.8% | |
| Other | 22.4% | 16.2% | 19.5% | |
| Intervention Group | Control Group | Total | ||
| Cancer Stage | CIS* | 3.5% | 5.4% | 4.4% |
| I | 34.1% | 14.9% | 25.2% | |
| II | 14.1% | 24.3% | 18.9% | |
| III | 10.6% | 14.9% | 12.6% | |
| IV | 32.9% | 35.1% | 34.0% | |
| Unknown | 4.7% | 5.4% | 5.0% | |
| Intervention Group | Control Group | Total | ||
| Race and Ethnicity | White | 62.4% | 66.2% | 64.2% |
| Black | 15.3% | 10.8% | 13.2% | |
| Hispanic | 4.7% | 6.8% | 5.7% | |
| Other Minorities—Asian, Indian Origin and Others | 11.8% | 5.4% | 8.8% | |
| Unknown | 5.9% | 10.8% | 8.2% | |
* CIS = Carcinoma In Situ.
Table 2.
Average Monthly Medical Expenditures (US Dollars) by Treatment Group.
| Parameter | Time Period |
No. of Patients | Intervention Group, MEAN (SD) |
Control Group, MEAN (SD) |
Difference—in—Difference, MEAN (SD) |
P Value |
|---|---|---|---|---|---|---|
| Medical Expenses | Baseline | 53 | $23,698.52 (28,960.9) | $30,049.71 (33485.76) | . | |
| Medical Expenses | Post Intervention | 53 | $14,942.18 (16,322.8) | $36,248.91 (41,469.15) | -$14,955.54 (6,107.06) | 0.0089 |
Table 3.
Summary of Change for Overall Quality of Life Score (FACT-G) by Clinical Group, in different Time Period.
Table 3.
Summary of Change for Overall Quality of Life Score (FACT-G) by Clinical Group, in different Time Period.
| Parameter | Time Period |
No. of Patients | Intervention Group, MEAN (SD) |
Control Group, MEAN (SD) |
Difference—in—Difference, MEAN (SD) |
P Value |
|---|---|---|---|---|---|---|
| Quality of Life (FACT-G) | Baseline | 158 | 70.48 (16.03) | 65.78 (16.09) | N/A | . |
| Quality of Life (FACT-G) | 3-Month | 81 | 78.03 (14.3) | 63.91 (19.58) | 10.84 (13.32) | 0.0002 |
Table 4.
Summary of Change for Motivation Level and Performance Level by Clinical Group, in different Time Period.
Table 4.
Summary of Change for Motivation Level and Performance Level by Clinical Group, in different Time Period.
| Parameter | Time Period |
No. of Patients | Intervention Group, MEAN (SD) |
Control Group, MEAN (SD) |
Difference—in—Difference, MEAN (SD) |
P Value |
|---|---|---|---|---|---|---|
| Motivation | Baseline | 158 | 2.29 (1.13) | 2.3 (1.08) | N/A | . |
| Motivation | 3-Month | 81 | 2.76 (0.79) | 2.26 (1.2) | 0.48 (1.15) | 0.0332 |
| Performance | Baseline | 158 | 2.2 (1.05) | 2.19 (0.96) | N/A | . |
| Performance | 3-Month | 81 | 2.53 (1.01) | 1.98 (1.22) | 0.48 (0.95) | 0.0130 |
Table 5.
Summary of Change for Working Hours by Clinical Group, in different Time Period.
| Parameter | Time Period |
No. of Patients | Intervention Group, MEAN (SD) |
Control Group, MEAN (SD) |
Difference—in—Difference, MEAN (SD) |
P Value |
|---|---|---|---|---|---|---|
| Working Hours | Baseline | 87 | 29.76 (14.79) | 24.51 (13.98) | N/A | . |
| Working Hours | 3-Month | 43 | 32.29 (14.59) | 20.05 (18.09) | 4.78 (11.95) | 0.0999 |
Note: The analysis was conducted on patients with non-zero working hours at the Baseline i.e., people who were already working actively.
Table 6.
Summary of Change for Number of Participants taking Long / Short Term Leave by Clinical Group, in different Time Period.
Table 6.
Summary of Change for Number of Participants taking Long / Short Term Leave by Clinical Group, in different Time Period.
| Parameter | Time Period |
No. of Patients | Intervention Group, MEAN (SD) |
Control Group, MEAN (SD) |
Difference—in—Difference, MEAN (SD) |
P Value |
|---|---|---|---|---|---|---|
| Long Term Leave | Baseline | 158 | 85.71% (35.2%) | 79.73% (40.48%) | N/A | . |
| Long Term Leave | 3-Month | 81 | 84.21% (36.95%) | 72.09% (45.39%) | 2.33% (25.1%) | 0.3392 |
| Short Term Leave | Baseline | 158 | 88.1% (32.58%) | 81.08% (39.43%) | N/A | . |
| Short Term Leave | 3-Month | 81 | 97.37% (16.22%) | 88.37% (32.44%) | -6.36% (36.13%) | 0.2156 |
Disclaimer/Publisher’s Note: The statements, opinions and data contained in all publications are solely those of the individual author(s) and contributor(s) and not of MDPI and/or the editor(s). MDPI and/or the editor(s) disclaim responsibility for any injury to people or property resulting from any ideas, methods, instructions or products referred to in the content. |
© 2025 by the authors. Licensee MDPI, Basel, Switzerland. This article is an open access article distributed under the terms and conditions of the Creative Commons Attribution (CC BY) license (http://creativecommons.org/licenses/by/4.0/).
Copyright: This open access article is published under a Creative Commons CC BY 4.0 license, which permit the free download, distribution, and reuse, provided that the author and preprint are cited in any reuse.


