
Submitted:
28 April 2025
Posted:
29 April 2025
You are already at the latest version
Abstract
(1) Background: Many familial diseases are caused by genetic accidents, which affect both the genome and its epigenetic environment, expressed as an interaction graph between the genes. We wish to show the existence of a form of robustness for such interaction networks in the case of three familial diseases: Familial angioedema; Osteogenesis imperfecta; Biliary atresia; (2) Methods: The update of the gene states at the vertices of the interaction graph (1 if a gene is activated, 0 if it is inhibited) can be done in multiple ways, well studied over the last 20 years: parallel, block-parallel, sequential, block-sequential, random, etc. (3) Results: We study three particular interaction graphs, linked to the familial diseases chosen as examples. They have in common a subgraph that is activated in an intricate manner, a new update mode, of which we study the robustness; (4) Conclusions: Comparison of the interaction modes of the three familial diseases studied, which are of different etiology, shows visible common points in the regulatory graphs of the genes involved, in particular a structural robustness with respect to their expression clock.
Keywords:
genetic regulation network
; structural robustness
; gene interaction graph
; familial angioedema
; biliary atresia
; osteogenesis imperfecta
1. Introduction
Many familial diseases are due to accidents caused on the genome of the first pathological carrier in the family, by a problem of endogenous rewriting of the genetic message during meiosis, or by an exogenous influence (radiation, viral pathology, etc.). These accidents are generally nonsense point mutations that change only one amino acid or more important chromosomal recombinations of the genome, such as the translocations, causing often dramatic changes in the interactions between altered genes and the regulation RNAs (siRNAS, miRNAs, circRNAs, etc.) and proteins belonging to their epigenetic regulation graph. Figure 1 shows the graph of such interactions in the case of a regulation network centered on the ubiquitous transcription factor SP1, which plays a central role in many cellular pathways [1]. SP1 activates or represses the transcription of many other genes in response to physiological and pathological stimuli by binding with high affinity to GC-rich motifs of these genes involved in various processes such as cell apoptosis and growth as well as in differentiation and immune responses, cellular response to DNA damage, biological clock regulation, chromatin remodeling, oxidative stress response, etc. For this ubiquitous regulation role, SP1 is involved in many familial diseases such as Familial angioedema, Osteogenesis imperfecta and Biliary atresia. We will study in the following the attractors of the Boolean genetic networks regulating the main genes whose mutations cause these diseases. We will study the attraction basins of these attractors and show their robustness under five types of different perturbations (change of initial conditions, parameter values, interaction graph, transition function or updating clock) susceptible to provoke a loss stability of three types: trajectorial stability, asymptotic stability or structural stability. We will present the results in these two domains in Section 2, discuss these results and the chosen models in Section 3, describe the methods on both mathematical and numerical sides in Section 4 and conclude in Section 5 on the utility of robustness studies in the context of genetic regulation [2].
2. Results
In the following, we will examine in the framework of three applications the existence or absence of the stabilities associated to the last of the five types of perturbation described above, the change of updating mode, which is crucial in biology insofar as such an updating rule exists, because the exact functioning of the clock controlling the gene expression is unknown.
We will study the robustness of the genetic networks associated to three familial diseases [3,4,5,6]: the familial angioedema [7,8,9,10], the osteogenesis imperfecta [11,12,13] and the biliary atresia [14,15,16]
The genetic regulatory networks described in the following contain genes and interactions coming from the cited literature and from the reference databases [17,18,19].
2.1. Familial Angioedema
Figure 2 gives the network regulating the genes involved in angiœdema, a familial disease with a prevalence of about 1/50,000, with 2 types of expression of SERPING1, one with low (type I) and another with high (type II) expression level (the network has been provided initially by MetaCore® [20] and checked after in the literature).
2.2. Osteogenesis Imperfecta Inducing Early Osteoarthritis
2.3. Biliary Atresia
2.4. Dynamics of the Familial Angioedema Network
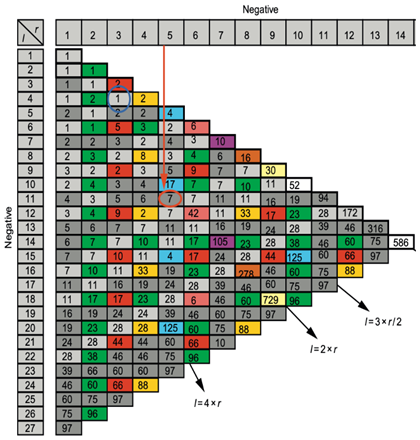
Recent data on the prevalence of familial angioedema come from [17]. They are in agreement with the expression data from Figure 5B and explain the choice of attractors 6 and 11 respectively for the type I and II of this hereditary disease. We can notice on Figure 5A that the physiologic attractor 3 is a fixed point (PF3) whose attraction basin is made of 93.43% of the possible states of the network. The pathologic attractors corresponding to the hereditary forms of the disease called angioedema are the fixed points PF6 and PF11, at which there is an absence of the gene SERPING1 in attractor 6 for type I and presence for type II. The relative size of their attraction basins relative size equals about 1‰ of the possible states of the network, and the observed prevalence of hereditary angioedema in the general population is reported to range from 1:10,000 to 1:150,000, without major sex or ethnic differences [23,24]. The ratio between the two relative sizes of pathologic attractors shows that type I represents 84% of the total as observed in real patients. Eattractor can be evaluated from Figure 5A where the number of genes considered is equal to 21 by supposing that circular RNAs are absent, and the attraction basin relative sizes are given on the line ABRS, then we have Eattractor ≈ 0.4520. Eventually, a previous work [25] gives an algebraic formula allowing for the calculation of the number of attractors of a Boolean network, where there are two tangential circuits (Figure 2C). In the top part of the network of Figure 2C, there are two such circuits, one positive of length five and one negative of length eleven. The attractor number predicted by the theory equals 11 and is the same as that obtained from the simulation of all trajectories of the network involved in angioedema from all possible initial conditions as summarized in Figure 5A.
2.5. Dynamics of the Osteogenesis Imperfecta Network
We propose to give precise results concerning the dynamics of a simplified version of the core of the network associated with the familial osteogenesis imperfecta (see Figure 3B and Figure 6), we will call network J in the following.
Figure 6 shows logical version of the transition function of the interaction graph involved in the osteogenesis imperfecta. By simulating in a parallel updating mode the iterations of the Boolean network having this transition motion from the initial condition where all the genes are inactive, we get from any initial configuration the following limit cycle of length 6 LC: (000000, 010000, 011000, 111000, 101000, 100000). The Table 1 exhibits all the possible dynamical behaviors of the network J depending on various initial configurations, showing the convergence to two attractors, the limit-cycles LC1 and LC2, the first of length 6 with a large basin of 56 configurations and the second of length 2 with a small basin of 2 configurations corresponding to pathologic states. Figure 7 and Table 2 corresponding to intricate updating show a unique limit-cycle LC of length 6 representing only normal states.
2.6. Dynamics of the Biliary Atresia Network
The number of attractors (7 attractors on Table 3) can be predicted by algebraic formula [25] allowing for the calculation of the number of attractors of a Boolean network with tangential circuits. For example, in case of 2 negative circuits of length 3 and 4, this number is 1. In the network of Figure 4, there are two such circuits, one negative of length five and one negative of length eleven. The attractor number predicted by the theory is 7 (see Table 4), the same as that obtained from the simulation of all trajectories of the network involved in biliary atresia from all possible initial conditions as summarized in Table 3.
The attractor limit-cycle LC2 of Table 1 or Table 3A corresponds to a high level of HRS (histone related sequences) and a low level of the expression of EGFR (inhibited by HRS on Figure 4B). Hence, it could correspond to the pathologic (BA) attractor of Table 3B, which shows an expression high for HSR and a low for EGFR (Figure 4B).
3. Discussion
The network J is related to familial angioedema was robust because, regardless of the block-sequential update mode used, fixed points will never appear, which is coherent with the empiric observation that most of genes involved the disease have a periodic expression due in part to the chromatin clock and circadian rhythms [1]. Some genes are updated systematically together under the control of the In order to achieve a systematic plan of numerical experience, we shall compare the block-sequential update modes of the Figure 5 to the intricate block sequential update mode, for which we consider that genes 3 and 4 are always active expressing their protein (Figure 6).
4. Methods
The definitions and theoretical results of this Section will follow previous works [26,27,28,29,30,31,32,33,34,35,36].
4.1. Kauffman Boolean Networks
We denote the whole configuration of a Kauffman Boolean network N of size n at time t by: x(t)={xi(t)}i=1,n, x(t) ∈ Ω={0,1}n, where Ω is the set of all possible Boolean configurations on N. Each node i of N represents a gene and is connected to k(i) other genes i1,...,ik(i) whose state is updated according to a specific order and a specific Boolean rule:
where Fi is a Boolean transition function and represents the state of the gene ij connected to i, where ij may by equal to i itself. The Boolean function Fi is represented by a truth table which gives the output for each of the possible set of input values. For a function Fi with k(i) variables, there are 2k(i) possible sets of input values, each yielding an output in {0,1}.
4.2. Interaction Graph
The interaction graph G(N) of the network N is represented by an oriented graph in which the n nodes correspond to genes and directed edges to the interactions between these genes. Each interaction is characterized by a logic operator wij (considered as an influence weight) which represents the influence that a source node of the interaction graph G(N), i.e., a gene j, exerts on an end node, i.e., a gene i, through the influence of its messenger RNA or of the protein the gene j expresses. More precisely, the wij is the identity represented by the sign + or the color green on the edge between j and I, or the negation represented by the sign – or the color red, depending on the fact that the gene j tends to respectively activate or inhibit gene i. There is no edge between j and i, if j has no influence on i.
4.3. Attractors
Under the influence of the transition functions Fi, the configuration x(t) of the network can evolve in Ω toward two possible asymptotic behaviors called attractors: a fixed configuration (also called fixed point) or a cycle of configuration (also called limit cycle). One of the challenges in a genetic regulation network is to determine the nature of its attractors (fixed point or limit cycle), which can have a great influence on its physiological or pathological character. For each attractor, we call attraction basin the set of all initial configurations of the network which lead after a finite number of iterations to this attractor. In the applications, we determine the possible attractors and their attraction basins (at least their size).
4.4. Frustration, Energy and Entropy
During the dynamics of the network, the states of two interacting genes j and i can change. If xi(t) = xj(t) when the weight between j and i is the identity, or if xi(t) =ùxj(t) when the weight between j and i is the negation, then the local frustration of the interaction between j and i is equal to 0. Else, this frustration equals 1. The global frustration of the network F(t) (or simply the network frustration) of the configuration x(t) is equal to the sum of its local frustrations. The network frustration is equal to the number of edges whose source xj(t) and end xi(t) states are in contradiction with their logic operator wij.
In the following, we will denote E(t) and call network energy the quantity E(t) = 4 E(t)2. Network energy is equal to the number of nodes whose state changes between t and t+1.
The attractor entropy Eattractor is a measure of heterogeneity of the attractor landscape of the network dynamics defined by:
where ABRS(Ak)=Card (Ak)/2n is the attraction basin relative size of the attractor Ak among the m attractors of the network.
4.5. Updating modes
An updating mode of the network is a rule describing in which order the state of the nodes has to be updated. There is three types of updating modes:
- -
-
the block-sequential modeIt consists in choosing a partition of N in m disjoint subsets of nodes S1,…,Sm with , which are updated sequentially, the nodes of each subset being updated parallelly. If each subset is a singleton, the updating mode is called sequential, the choice of the order being possibly random.
- -
- the block parallel mode
- -
- It consists in choosing a partition of N in m disjoint subsets of nodes S1,…,Sm with , which are updated parallelly, the nodes of each subset being updated sequentially. If m=1, S1 = N, the updating mode is called parallel.
- -
-
the block-intricate sequential of parallel modesIt consists in m non obligatory disjoint subsets of nodes S1,…,Sm with , which are updated sequentially (respectively parallelly), the nodes of each subset being updated parallelly (respectively sequentially). An updating robustness study of network dynamics corresponds to consider all the possible updating modes and show which changes of states can occur when updating mode changes. The network can be robust for five types of perturbations (change of initial conditions, parameter values, interaction graph, transition function or updating clock) and three types of stability:
- -
- trajectorial (or Lyapunov) stability, which corresponds to the existence of a distance threshold respected between the ancient trajectory and the new after perturbation
- -
- asymptotic stability, which corresponds to the conservation of the number and nature of the attractors, even if the transient part of trajectories changes
- -
- structural stability, which corresponds to the conservation of the attraction basins in response to structural perturbations (change of interaction graph, transition function or updating clock).
4.6. Examples of Simulations
In the parallel updating mode, the network K has 3 fixed points: 0 1 0 1 1 1 1 0 0, 1 0 1 0 0 0 0 1 1, 0 1 0 0 0 0 1 0 0 and two limit-cycles of length 3.
In the parallel updating mode, the network J has two attractors, the following limit-cycle of length 6: 000000 → 010000 → 011000 → 111000 → 101000 → 100000 → 000000 and the following attractor of length 2: 110000 → 001000.
5. Conclusions
We have defined a new update mode, the entangled block-sequential mode, in which the nodes of the Boolean automata network are updated differently, some being updated at each iteration and others being updated at lower frequencies (every other time, in the chosen example). In the application to Boolean networks of genetic regulation, in the absence of precise information on the mode of updating the states of the nodes of the network (i.e., the expression of the genes involved), it is necessary to examine the consequences of a change of mode on the dynamics of the network (possible change in the number, nature and size of the basins of attraction of its attractors). If the characteristics of the attractors are invariant in a change of update mode, we say that the network is robust. Consequently, the choice of a dynamic is less crucial for the practical consequences of the discrete modeling of the expression of the genes studied, in particular to explain the genesis of a pathology of familial origin involving a set of well-identified interacting genes, which is the case in the diseases taken examples, namely familial angioedema, osteogenesis imperfecta and biliary atresia.
Author Contributions
All authors have had the same contribution to the work. They read and agreed to the published version of the manuscript.
Funding
This research received no external funding.
Acknowledgments
Authors acknowledge C. Drouet for helpul discussion about familial angioedema.
Conflicts of Interest
The authors declare no conflict of interest.
References
- Zhang, G.; Shi, H.; Wang, L.; Zhou, M.; Wang, Z.; Liu, X.; Cheng, L.; Li, W.; Li, X. 2015. MicroRNA and transcription factor mediated regulatory network analysis reveals critical regulators and regulatory modules in myocardial infarction. PLoS One 2015, 10, e0135339. [Google Scholar]
- Rachdi, M.; Waku, J.; Hazgui, H.; Demongeot, J. Entropy as robustness marker in genetic regulatory networks. Entropy 2020, 22, 260. [Google Scholar] [CrossRef] [PubMed]
- Demongeot, J.; Goles, E.; Morvan, M.; Noual, M.; Sené, S. Attraction Basins as Gauges of Environmental Robustness in Biological Complex Systems. PloS ONE 2010, 5, e11793. [Google Scholar] [CrossRef] [PubMed]
- Demongeot, J.; Noual, M.; Sené, S. Combinatorics of Boolean automata circuits dynamics. Discr. Appl. Math. 2012, 160, 398–415. [Google Scholar] [CrossRef]
- Demongeot, J.; Hazgui, H.; Henrion-Caude, A. Genetic regulatory networks: focus on attractors of their dynamics. In Computational Biology, Bioinformatics & Systems Biology; Tran, Q.N., Arabnia, H.R., Eds.; Elsevier: New York, USA, 2015; pp. 135–165. [Google Scholar]
- Demongeot, J.; Jelassi, M.; Hazgui, H.; Ben Miled, S.; Bellamine Ben Saoud, N.; Taramasco, C. Biological Networks Entropies: Examples in Neural Memory Networks, Genetic Regulation Networks and Social Epidemic Networks. Entropy 2016, 20, 36. [Google Scholar] [CrossRef]
- Castellano, G.; Divella, C.; Sallustio, F.; Montinaro, V.; Curci, C.; Zanichelli, A.; Bonanni, E.; Suffritti, C.; Caccia, S.; Bossi, F.; Gallone, A.; Schena, F.P.; Gesualdo, L.; Cicardi, M. A transcriptomics study of hereditary angioedema attacks. J. Allergy Clin. Immunol. 2018, 142, 883–891. [Google Scholar] [CrossRef]
- Kajdácsi, E.; Jandrasics, Z.; Veszeli, N.; Makó, V.; Koncz, A.; Gulyás, D.; Köhalmi, K.V.; Temesszentandrási, G.; Cervenak, L.; Gál, P.; Dobó, J.; de Maat, S.; Maas, C.; Farkas, H.; Varga, L. Patterns of C1-Inhibitor/Plasma Serine Protease Complexes in Healthy Humans and in Hereditary Angioedema Patients. Front. Immunol. 2020, 11, 794. [Google Scholar] [CrossRef]
- Vincent, D.; Parsopoulou, F.; Martin, L.; Gaboriaud, C.; Demongeot, J.; Loules, G.; Fischer, S.; Cichon, S.; Germenis, A.E.; Ghannam, A.; Drouet, C. Hereditary angioedema with normal C1 inhibitor associated with carboxypeptidase N deficiency. J. Allergy. Clin. Immunol. Glob. 2024, 3, 100223. [Google Scholar] [CrossRef]
- Yong, P.F.K.; et al. A National Survey of Hereditary Angioedema and Acquired C1 Inhibitor Deficiency in the United Kingdom. Journal of Allergy and Clinical Immunology: In Practice 2023, 11, 2476–2483. [Google Scholar] [CrossRef]
- Chen, C.G.; Thuillier, D.; Chin, E.N.; Alliston, T. Chondrocyte-intrinsic Smad3 represses Runx2-inducible matrix metalloproteinase 13 expression to maintain articular cartilage and prevent osteoarthritis. Arthritis Rheum. 2012, 64, 3278–3289. [Google Scholar] [CrossRef]
- Li, H.; Wang, D.; Yuan, Y.; Min, J. New insights on the MMP-13 regulatory network in the pathogenesis of early osteoarthritis. Arthritis Res. Ther. 2017, 19, 248. [Google Scholar] [CrossRef] [PubMed]
- Chaugule, S.; Constantinou, C.K.; John, A.A.; Micha, D.; Eekhoff, M.; Gravallese, E.; Gao, G.; Shim, J.H. Comprehensive Review of Osteogenesis Imperfecta: Current Treatments and Future Innovations. Hum. Gene Ther. 2025, 36, 597–617. [Google Scholar] [CrossRef] [PubMed]
- Choe, B.H.; Kim, K.M.; Kwon, S.; Lee, K.S.; Koo, J.H.; Lee, H.M.; Kim, M.K.; Kim, J.C. The pattern of differentially expressed genes in biliary atresia. J. Korean Med. Sci. 2003, 18, 392–396. [Google Scholar] [CrossRef] [PubMed]
- Nizery, L.; Chardot, C.; Sissaoui, S.; Capito, C.; Henrion-Caude, A.; Debray, D.; Girard, M. Biliary atresia: Clinical advances and perspectives. Clin Res Hepatol Gastroenterol. 2016, 40, 281–287. [Google Scholar] [CrossRef]
- Bolia, R. Machine Learning in Biliary Atresia: Taking a Cautious Step into the Future. Indian J Pediatr. 2025, 92, 114–115. [Google Scholar] [CrossRef]
- Medscape. Available online: https://emedicine.medscape.com/article/135604-overview?form=fpf (accessed on 22 February 2025).
- NCBI. Available online: https://www.ncbi.nlm.nih.gov/nucleotide?cmd=search (accessed on 23 February 2025).
- Signor. Available online: https://signor.uniroma2.it/relation_result.php?id=SIGNOR-ST11&organism=human (accessed on 22 February 2025).
- Metacore. Available online: https://clarivate.com/life-sciences-healthcare (accessed on 15 January 2025).
- Jayasena, C.S.; Ohyama, T.; Segil, N.; Groves, A.K. Notch signaling augments the canonical Wnt pathway to specify the size of the otic placode. Development 2008, 135, 2251–2261. [Google Scholar] [CrossRef]
- Tan, T.; Lu, B.; Zhang, J.; Niu, Y.; Si, W.; Wei, Q.; Ji, W. Notch1 signaling antagonizes transforming growth factor-β pathway and induces apoptosis in rabbit trophoblast stem cells. Stem Cells Dev. 2014, 23, 813–822. [Google Scholar] [CrossRef]
- Ghazi, A.; Grant, J.A. Hereditary angioedema: Epidemiology, management, and role of icatibant. Biol. Targets Ther. 2013, 7, 103–113. [Google Scholar] [CrossRef]
- Charignon, D.; Ponard, D.; de Gennes, C.; Drouet, C.; Ghannam, A. SERPING1 and F12 combined variants in a hereditary angioedema family. Ann. Allergy Asthma Immunol. 2018, 121, 500–502. [Google Scholar] [CrossRef]
- Demongeot, J.; Noual, M.; Sené, S. Combinatorics of Boolean automata circuits dynamics. Discret. Appl. Math. 2012, 160, 398–415. [Google Scholar] [CrossRef]
- Kauffman, S. Homeostasis and Differentiation in Random Genetic Control Networks. Nature 1969, 224, 177–178. [Google Scholar] [CrossRef] [PubMed]
- Kauffman, S. The Origins of Order; Oxford University Press, Oxford, 1993.
- Thomas, R. Boolean formalization of genetic control circuits. J. Theoret. Biol. 1973, 42, 563–585. [Google Scholar] [CrossRef] [PubMed]
- Thomas, R. On the relation between the logical structure of systems and their ability to generate multiple steady states or sustained oscillations. Springer Series in Synergetics 1980, 9, 1–23. [Google Scholar]
- Demongeot, J.; Aracena, J.; Ben Lamine, S.; Meignen, S.; Tonnelier, A.; Thomas, R. Dynamical systems and biological regulations. In Complex systems; E. Goles, E., Martinez, S., Eds.; Kluwer: Amsterdam, 2001; pp. 105–151. [Google Scholar]
- Aracena, J.; Demongeot, J.; Goles, E. Mathematical modelling in genetic networks. IEEE Trans. Neural Networks 2004, 15, 77–83. [Google Scholar] [CrossRef]
- Aracena, J.; Demongeot, J.; Goles, E. Fixed points and maximal independent sets on AND-OR networks. Discr. Appl. Math. 2004, 138, 277–288. [Google Scholar] [CrossRef]
- Aracena, J.; Demongeot, J.; Goles, E. On limit cycles of monotone functions with symmetric connection graphs. Theoret. Comp. Sci. 2005, 322, 237–244. [Google Scholar] [CrossRef]
- Demongeot, J.; Elena, A.; Sené, S. Robustness in neural and genetic networks. Acta Biotheoretica 2008, 56, 27–49. [Google Scholar] [CrossRef]
- Aracena, J.; Demongeot, J.; Fanchon, E.; Montalva, M. On the number of different dynamics in Boolean networks with deterministic update schedules. Mathematical Biosciences 2013, 242, 188–194. [Google Scholar] [CrossRef]
- Aracena, J.; Demongeot, J.; Fanchon, E.; Montalva, M. On the number of update digraphs and its relation with the feedback arc sets and tournaments. Discr. Applied Math. 2013, 161, 1345–1355. [Google Scholar] [CrossRef]
- Boolnet. Available online: https:// sysbio.uni-ulm.de (accessed on 15 February 2025).
Figure 1.
Genetic network of gene SP1 coregulation by microRNAs miR-21-5 and miR-29 (after [1]).
Figure 1.
Genetic network of gene SP1 coregulation by microRNAs miR-21-5 and miR-29 (after [1]).
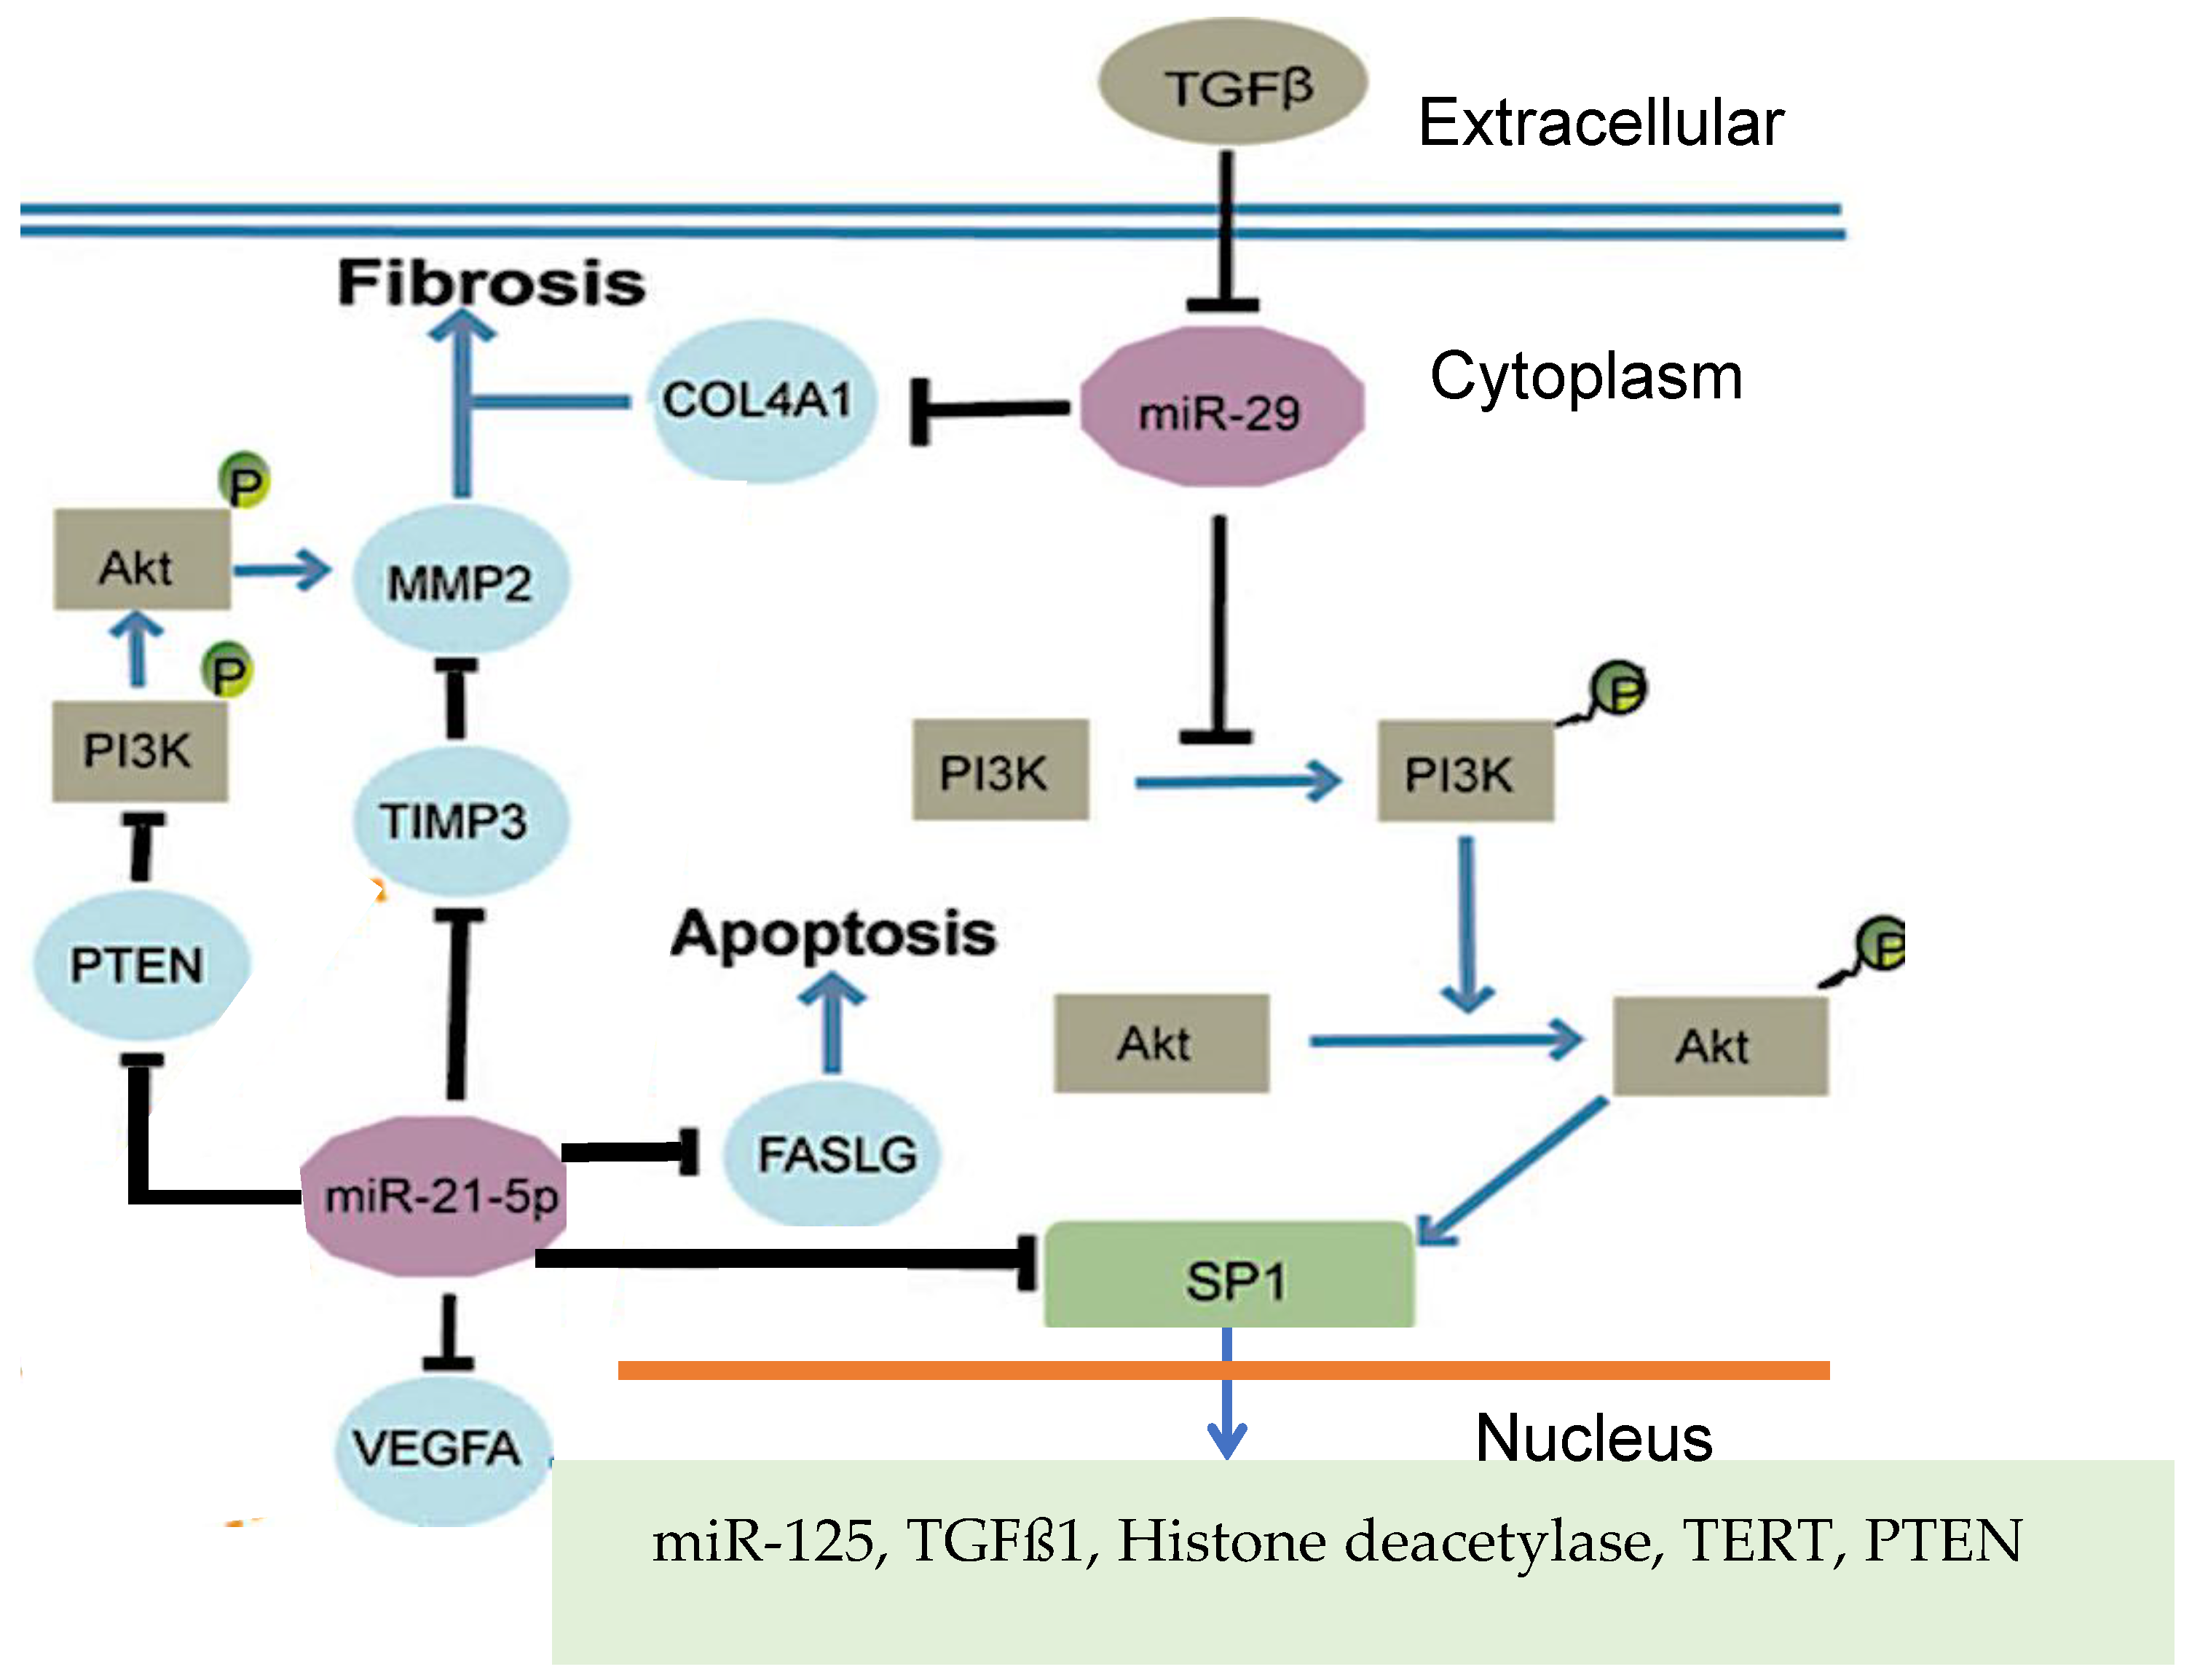
Figure 2.
A) Genetic network regulating the gene expression in familial angioedema; B) Subnetwork representing the core of the regulation; C) Upper part of the network completed with control elements, i.e., specific microRNAs and circular RNAs.
Figure 2.
A) Genetic network regulating the gene expression in familial angioedema; B) Subnetwork representing the core of the regulation; C) Upper part of the network completed with control elements, i.e., specific microRNAs and circular RNAs.
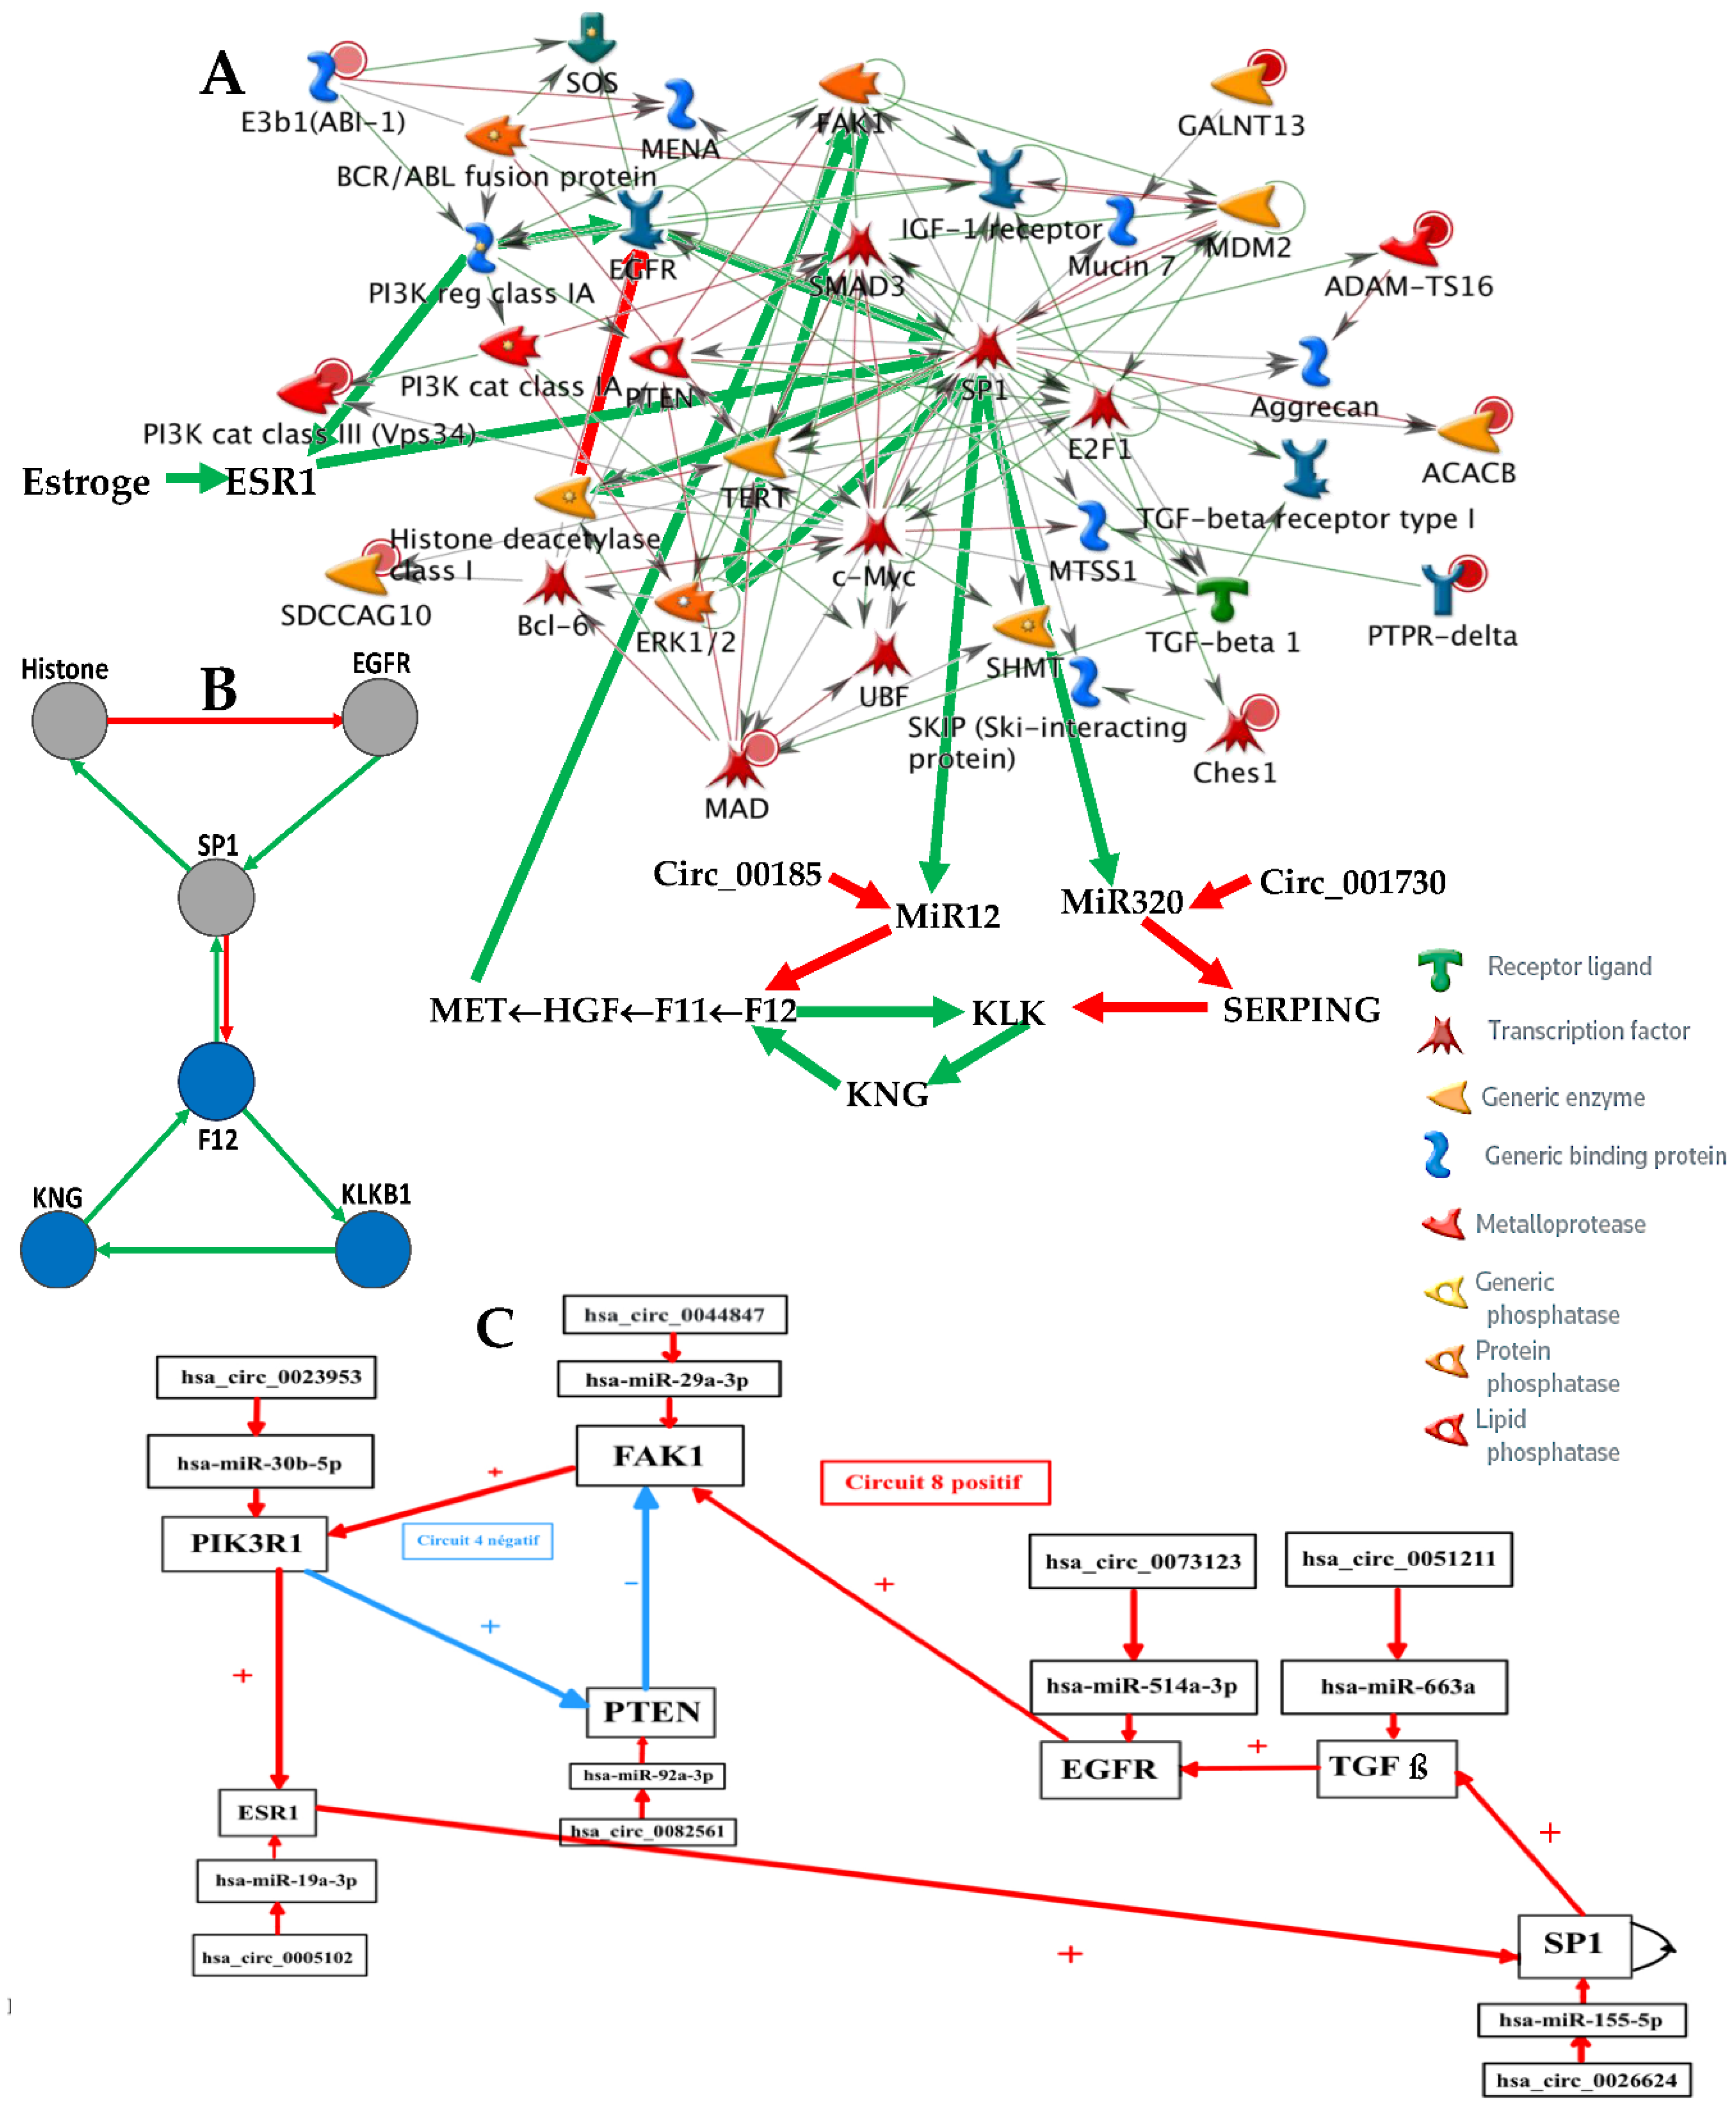
Figure 3.
A: Genetic network regulating the expression of the osteogenesis imperfecta; B: Simplified version of A; C: Subnetwork representing the core of the regulation; D: Network completed with control elements, i.e., specific microRNAs and circular RNAs.
Figure 3.
A: Genetic network regulating the expression of the osteogenesis imperfecta; B: Simplified version of A; C: Subnetwork representing the core of the regulation; D: Network completed with control elements, i.e., specific microRNAs and circular RNAs.
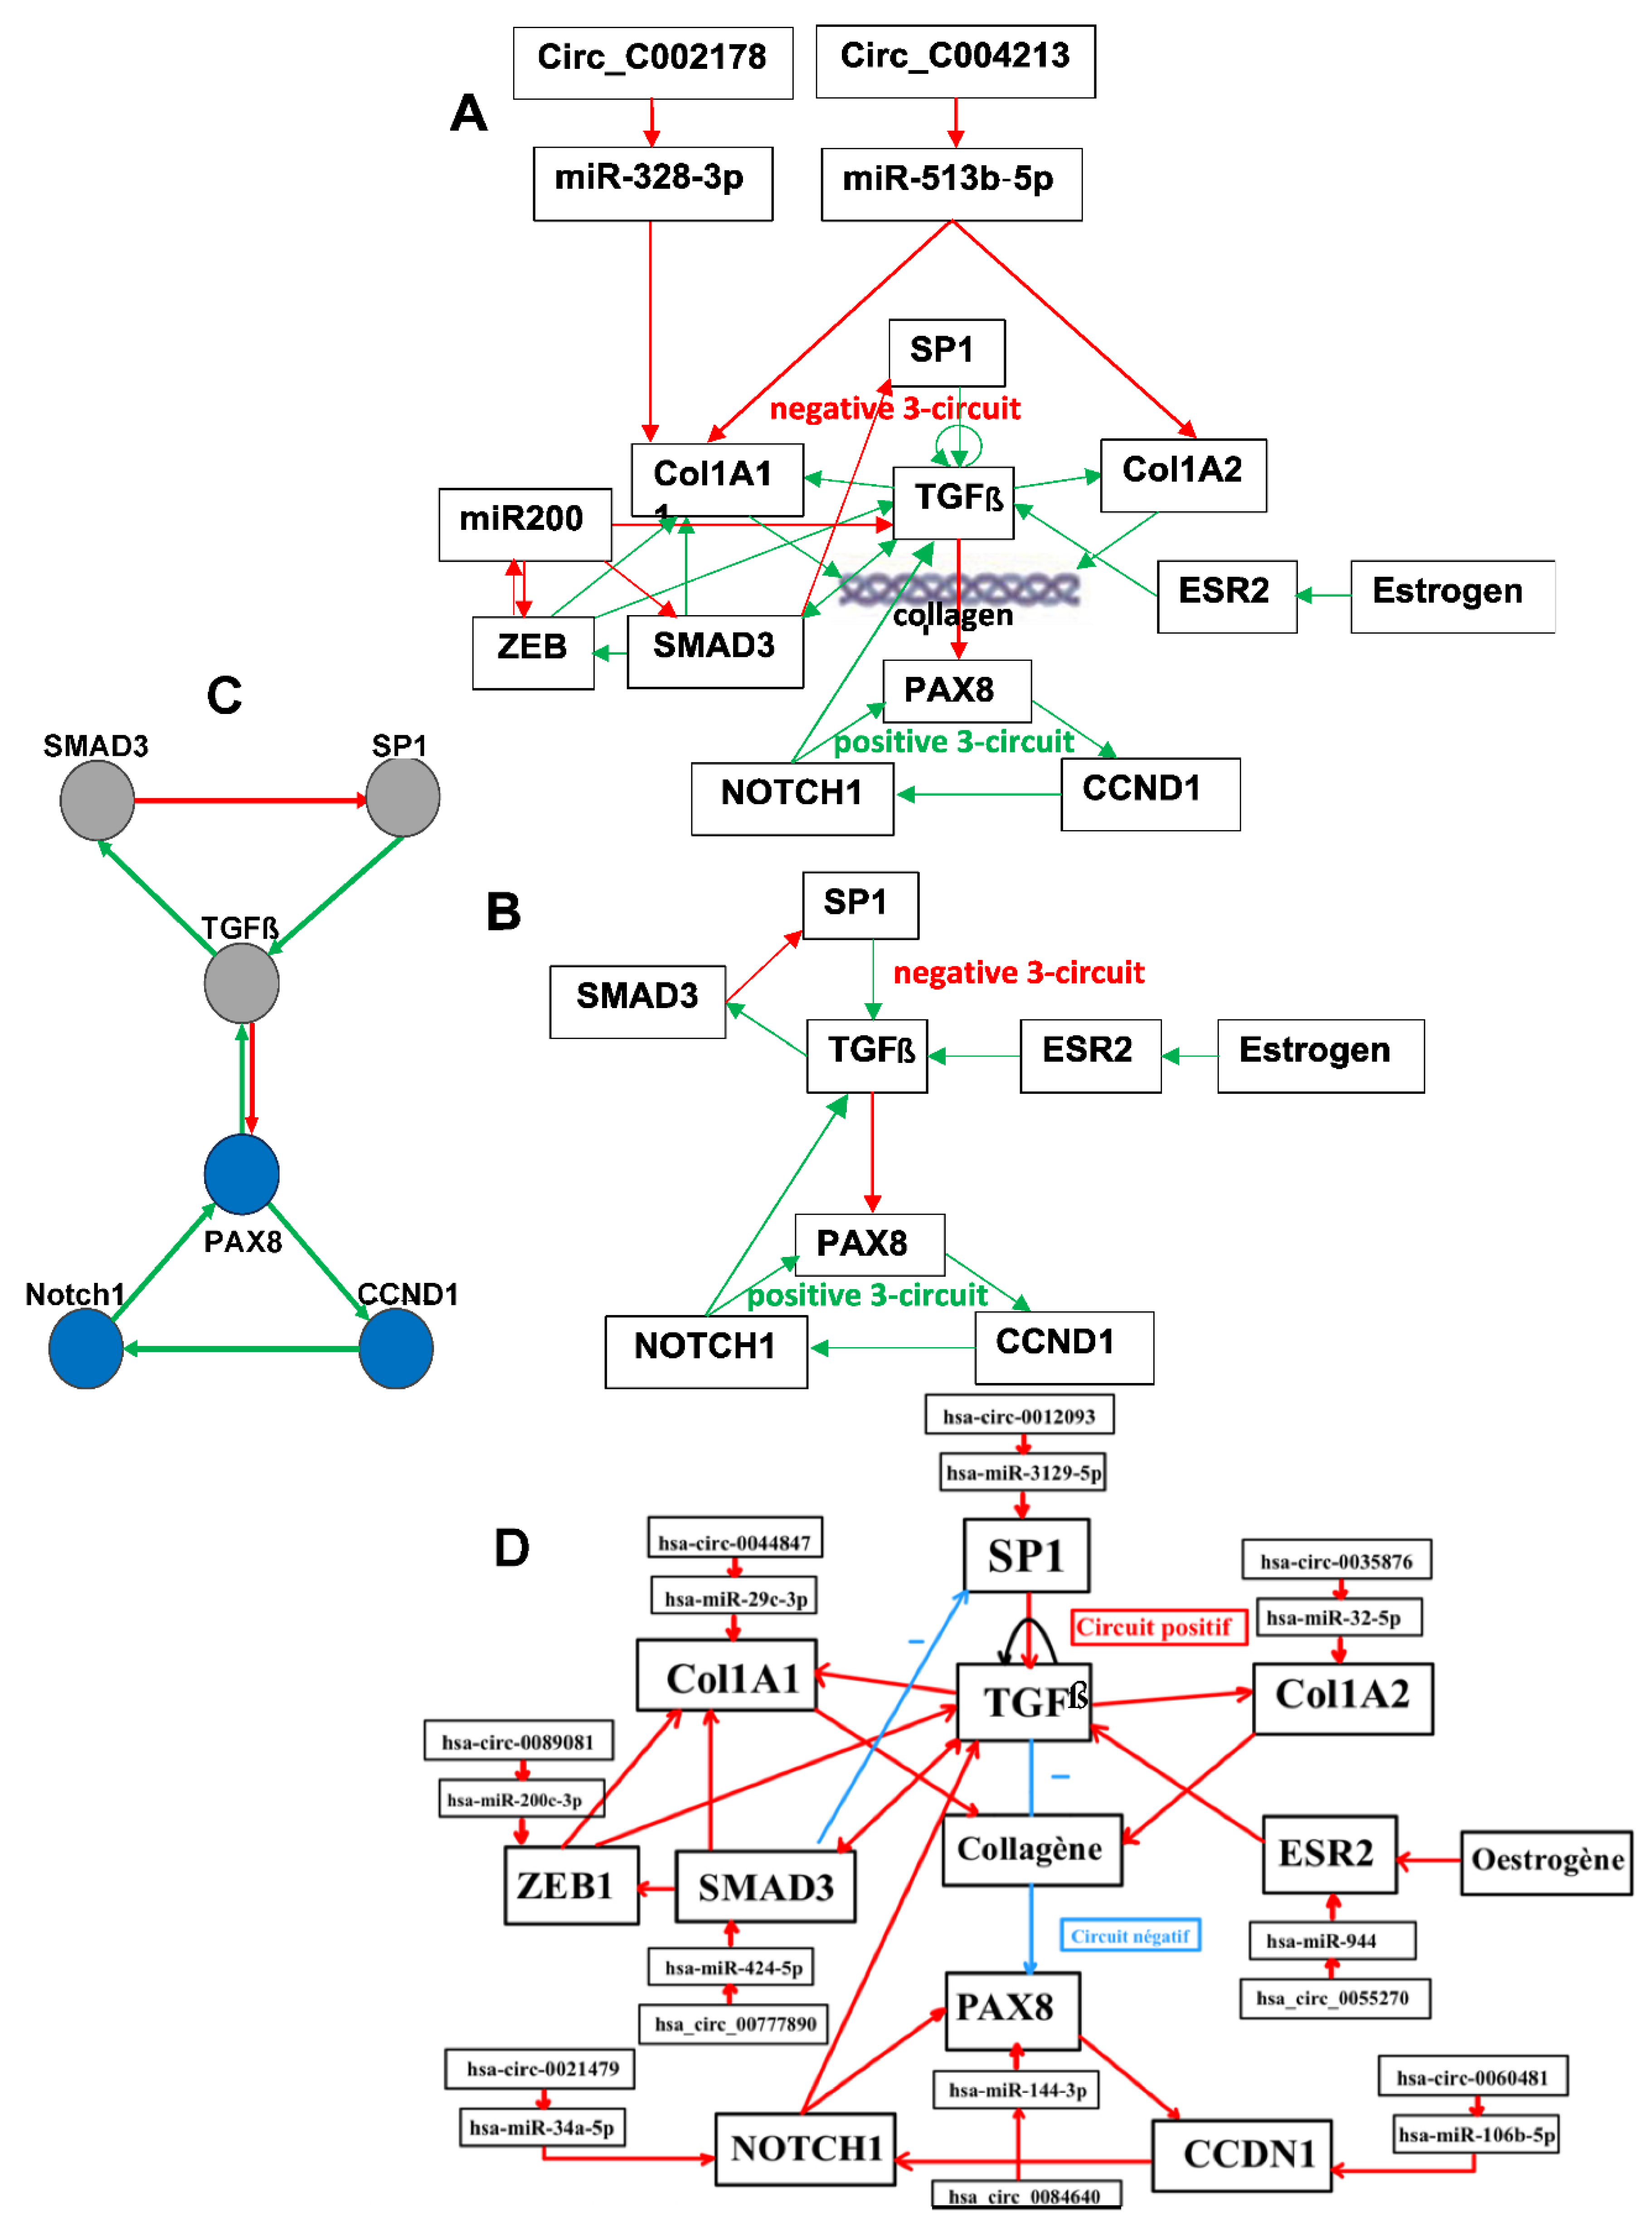
Figure 4.
A: Genetic network regulating the expression of the biliary atresia; B: Subnetwork representing the core of the regulation; C: Network completed with control elements, i.e., specific microRNAs and circular RNAs.
Figure 4.
A: Genetic network regulating the expression of the biliary atresia; B: Subnetwork representing the core of the regulation; C: Network completed with control elements, i.e., specific microRNAs and circular RNAs.
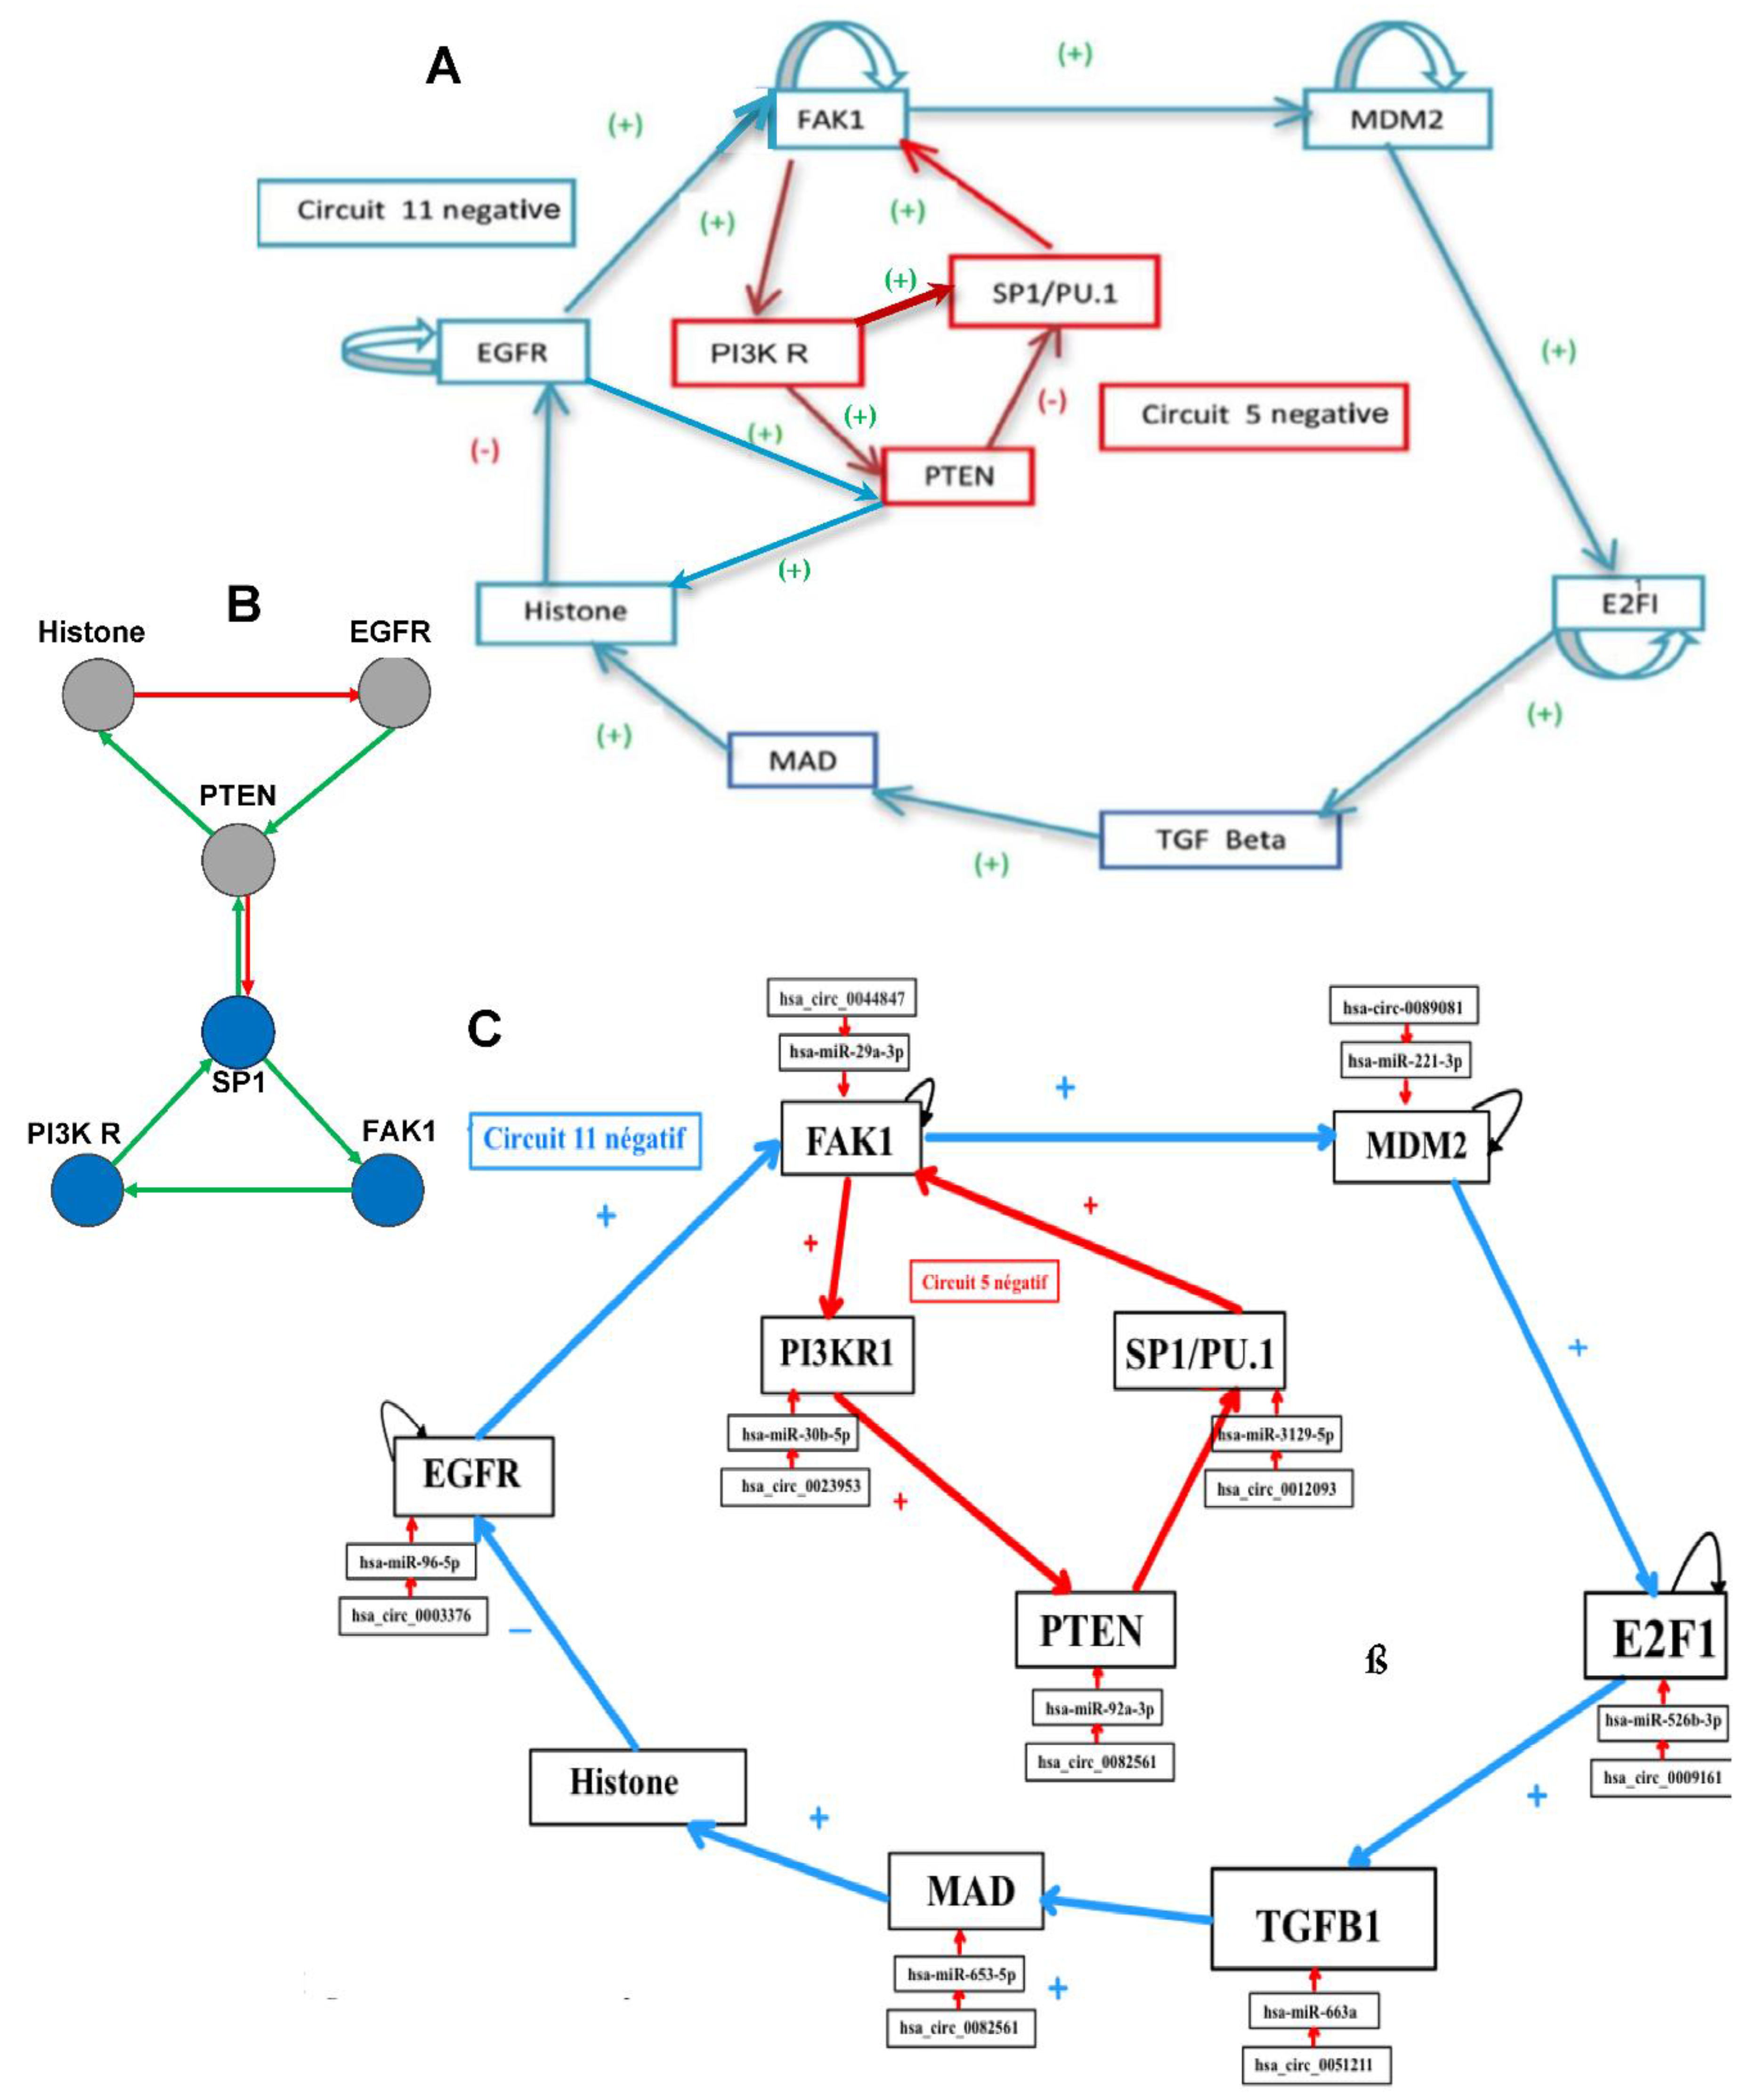
Figure 5.
A) Attractors from the simulation of the dynamics of the genetic network regulating the expression of the familial angiœdema. B) Expression data in the two types of angiœdema. C) Calculation of the number of attractors of two tangent networks, one negative of length l = 4 and the other positive of length r = 8.
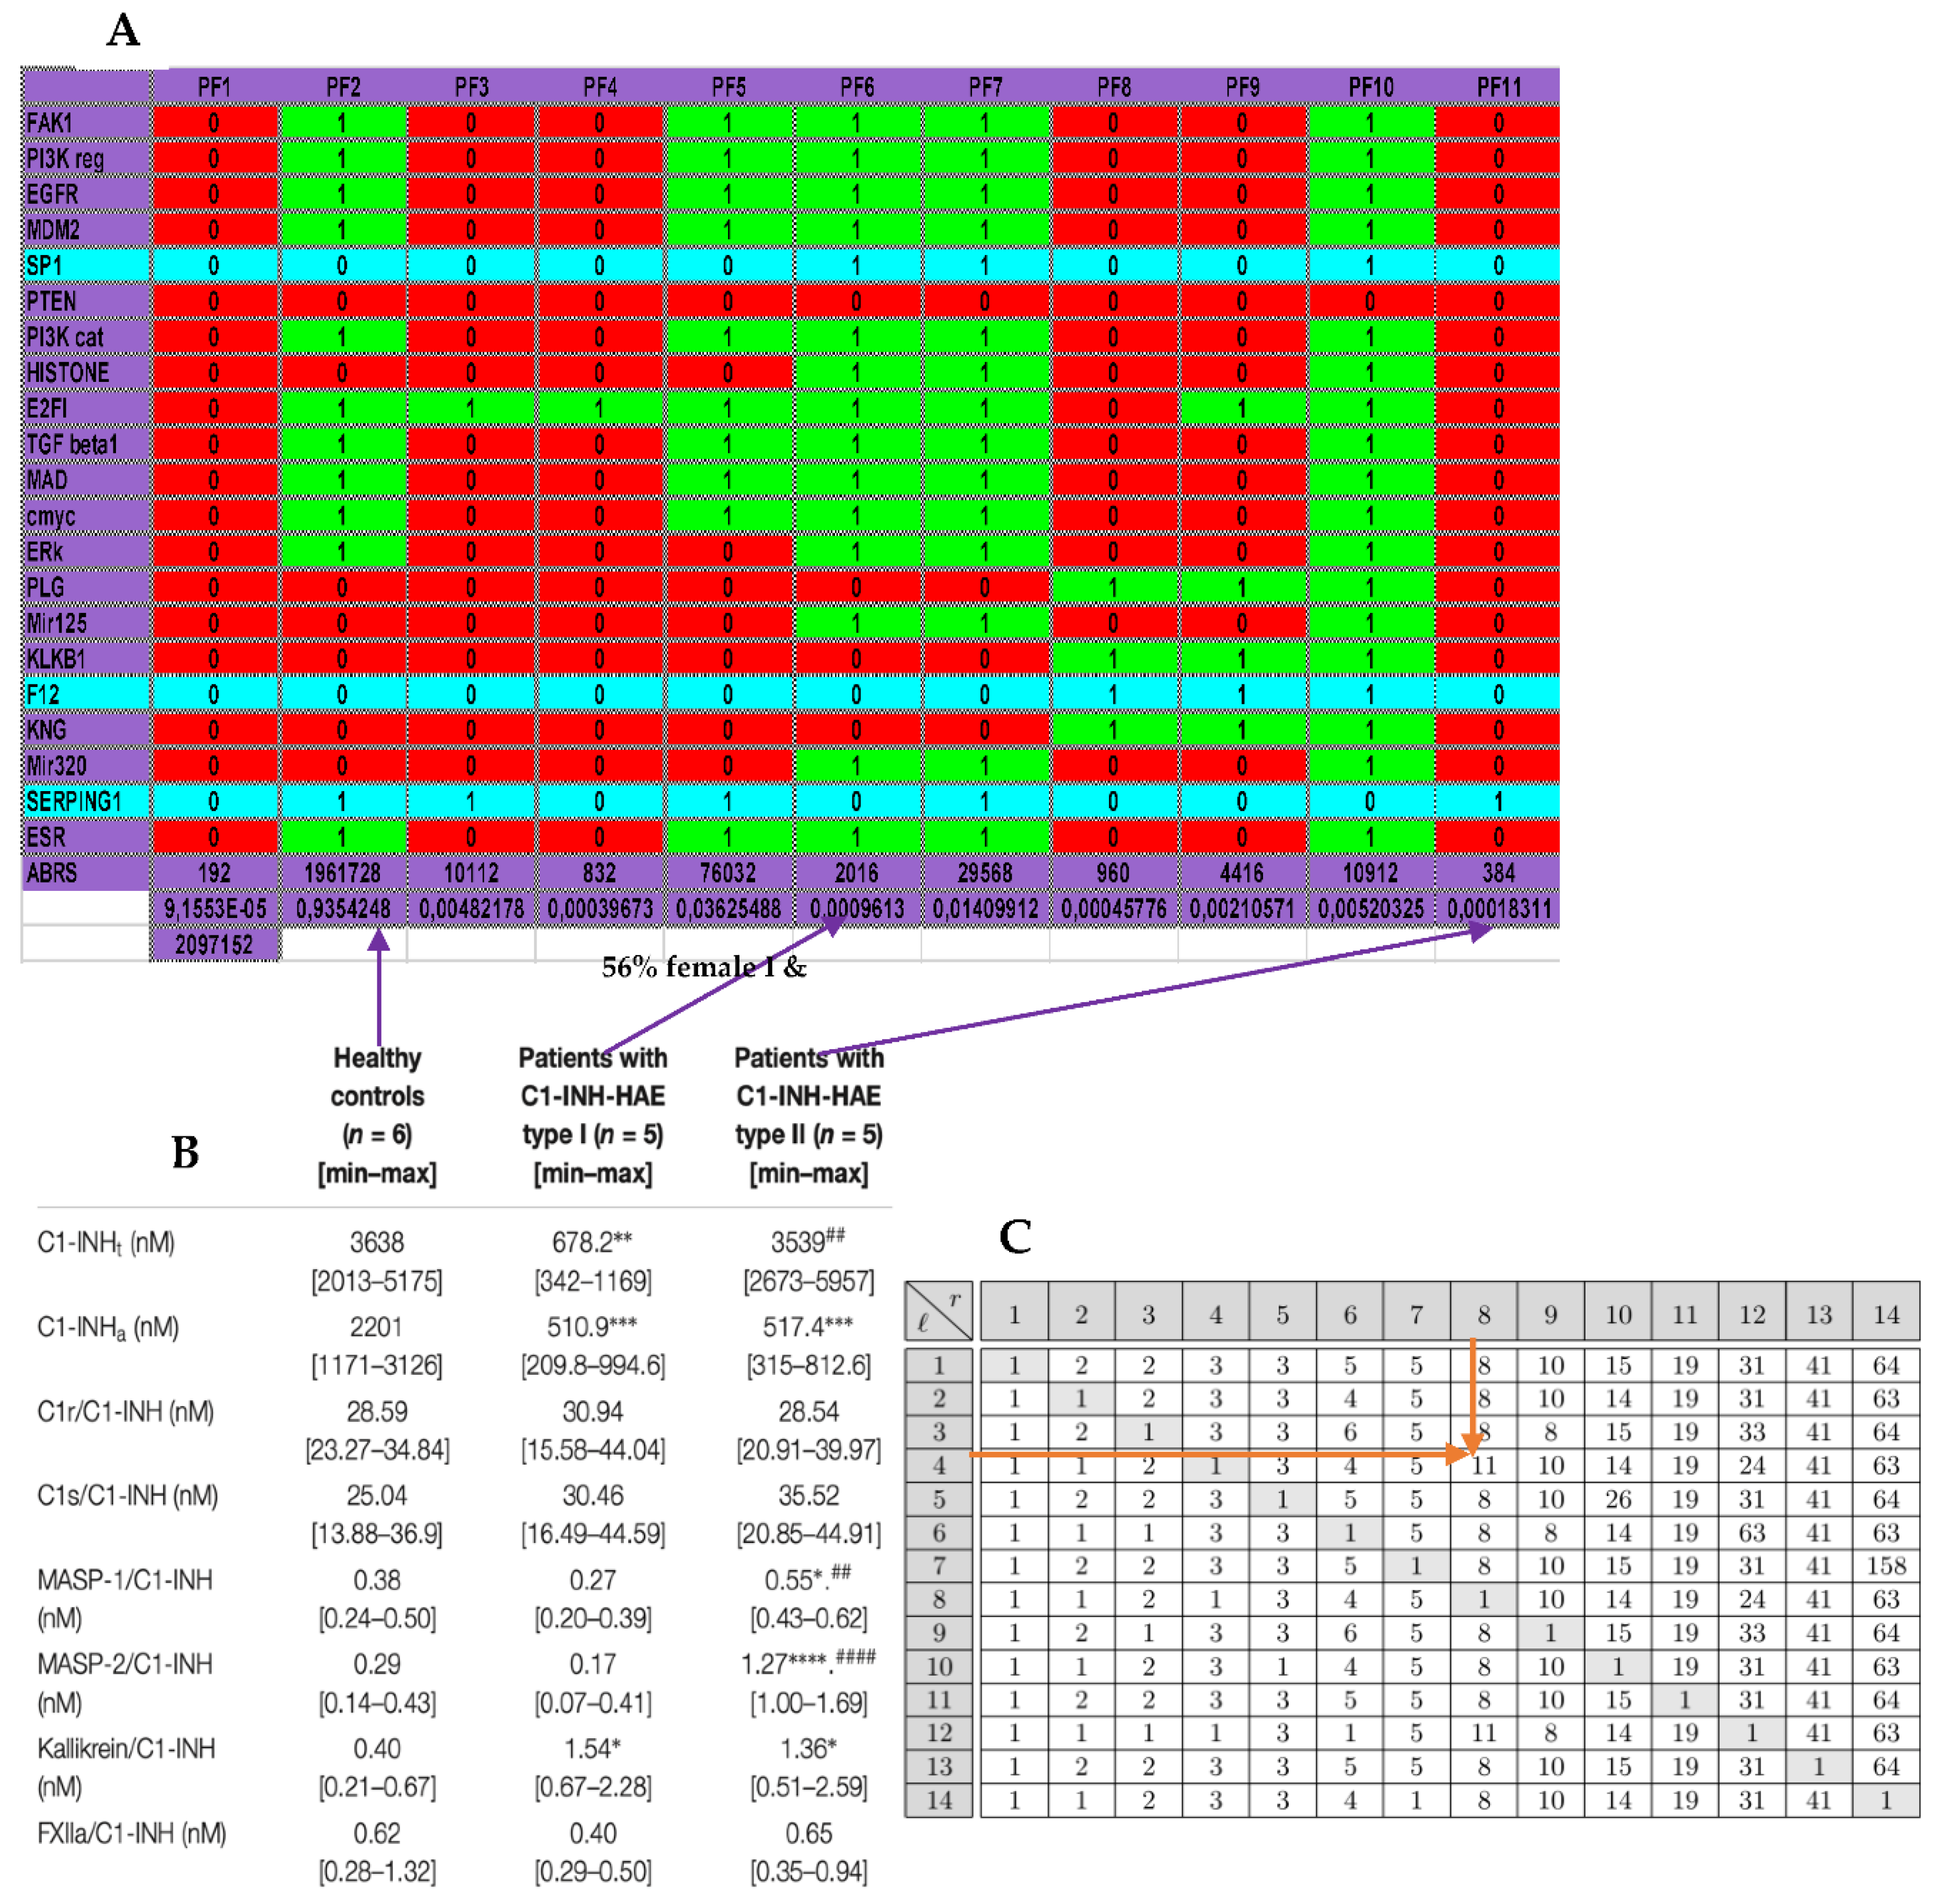
Figure 6.
Attractor limit cycle LC from the simulation of the dynamics of the genetic network regulating the gene expression in the osteogenesis imperfecta (parallel updating).
Figure 6.
Attractor limit cycle LC from the simulation of the dynamics of the genetic network regulating the gene expression in the osteogenesis imperfecta (parallel updating).
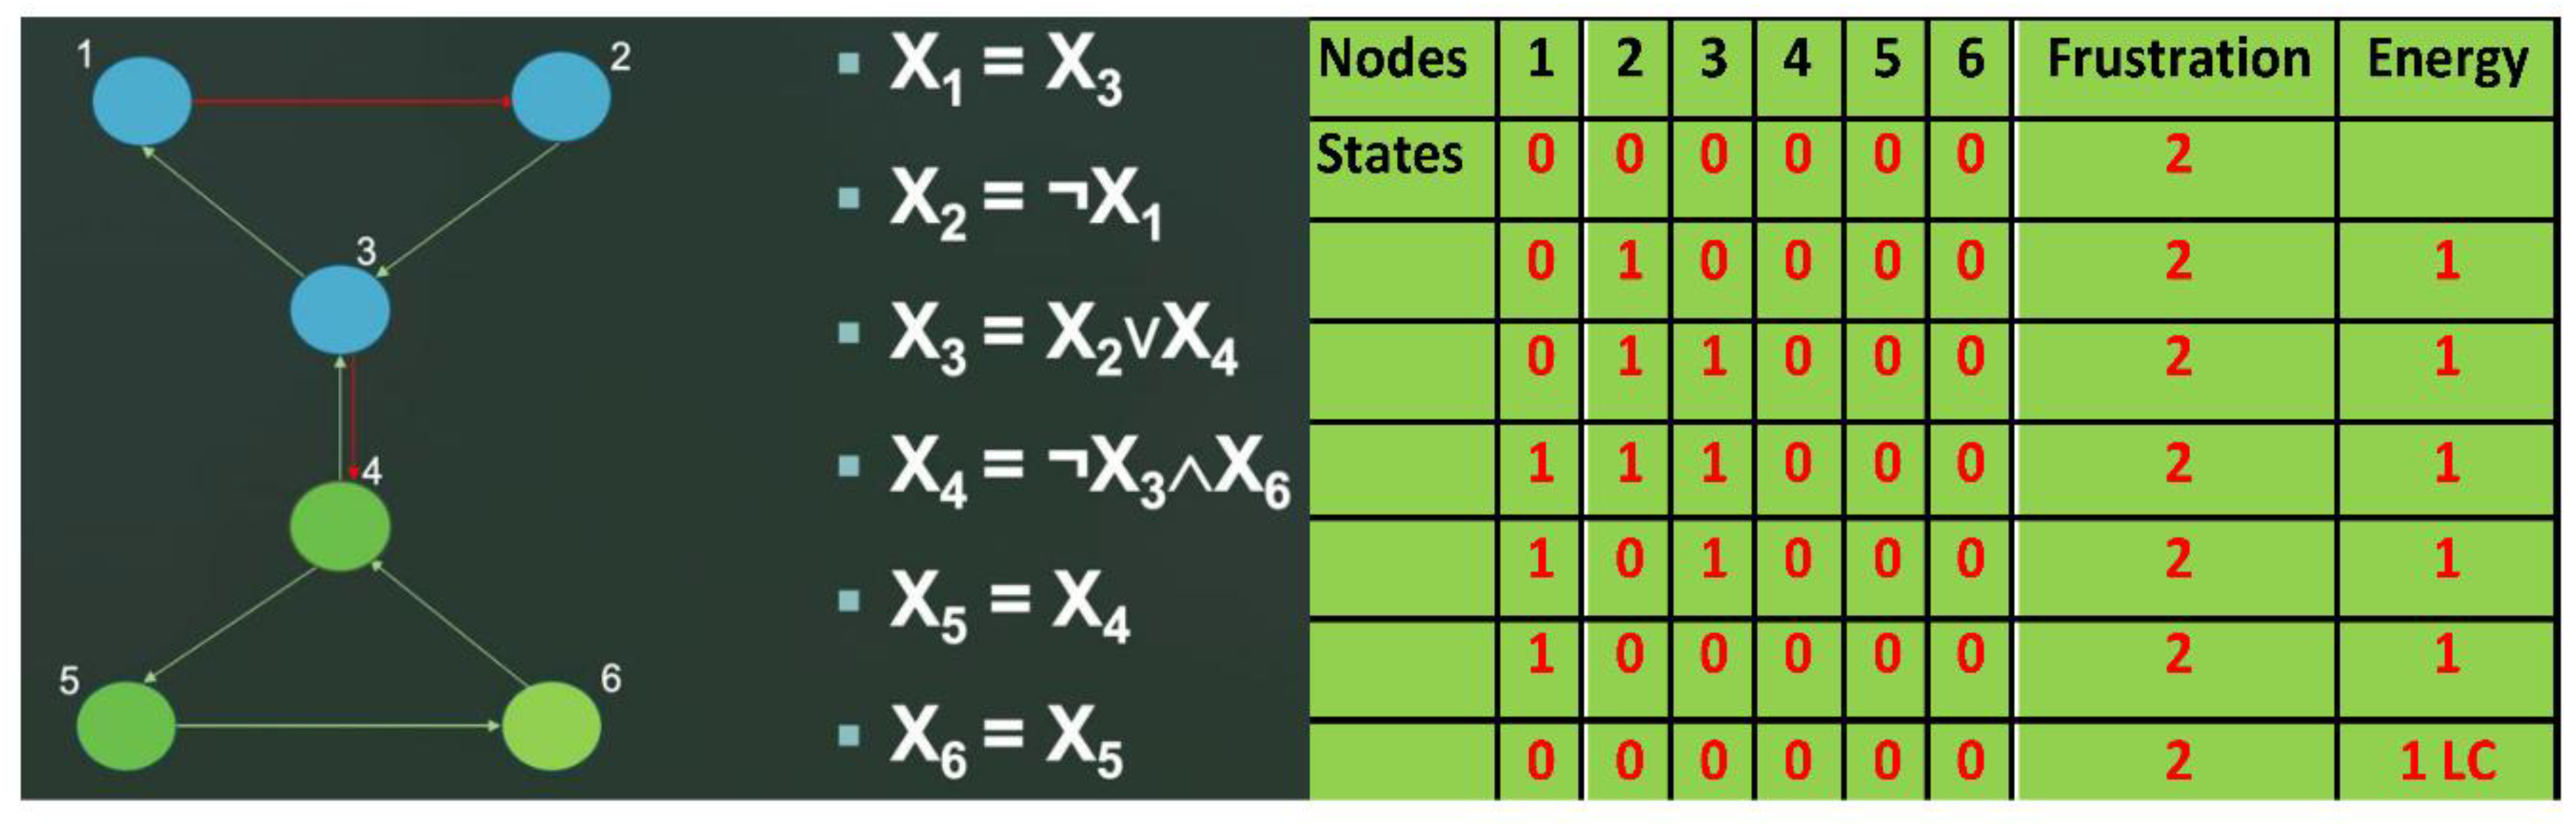
Figure 7.
Limit-cycle from the simulation of the network J in the intricate block-sequential updating.
Figure 7.
Limit-cycle from the simulation of the network J in the intricate block-sequential updating.
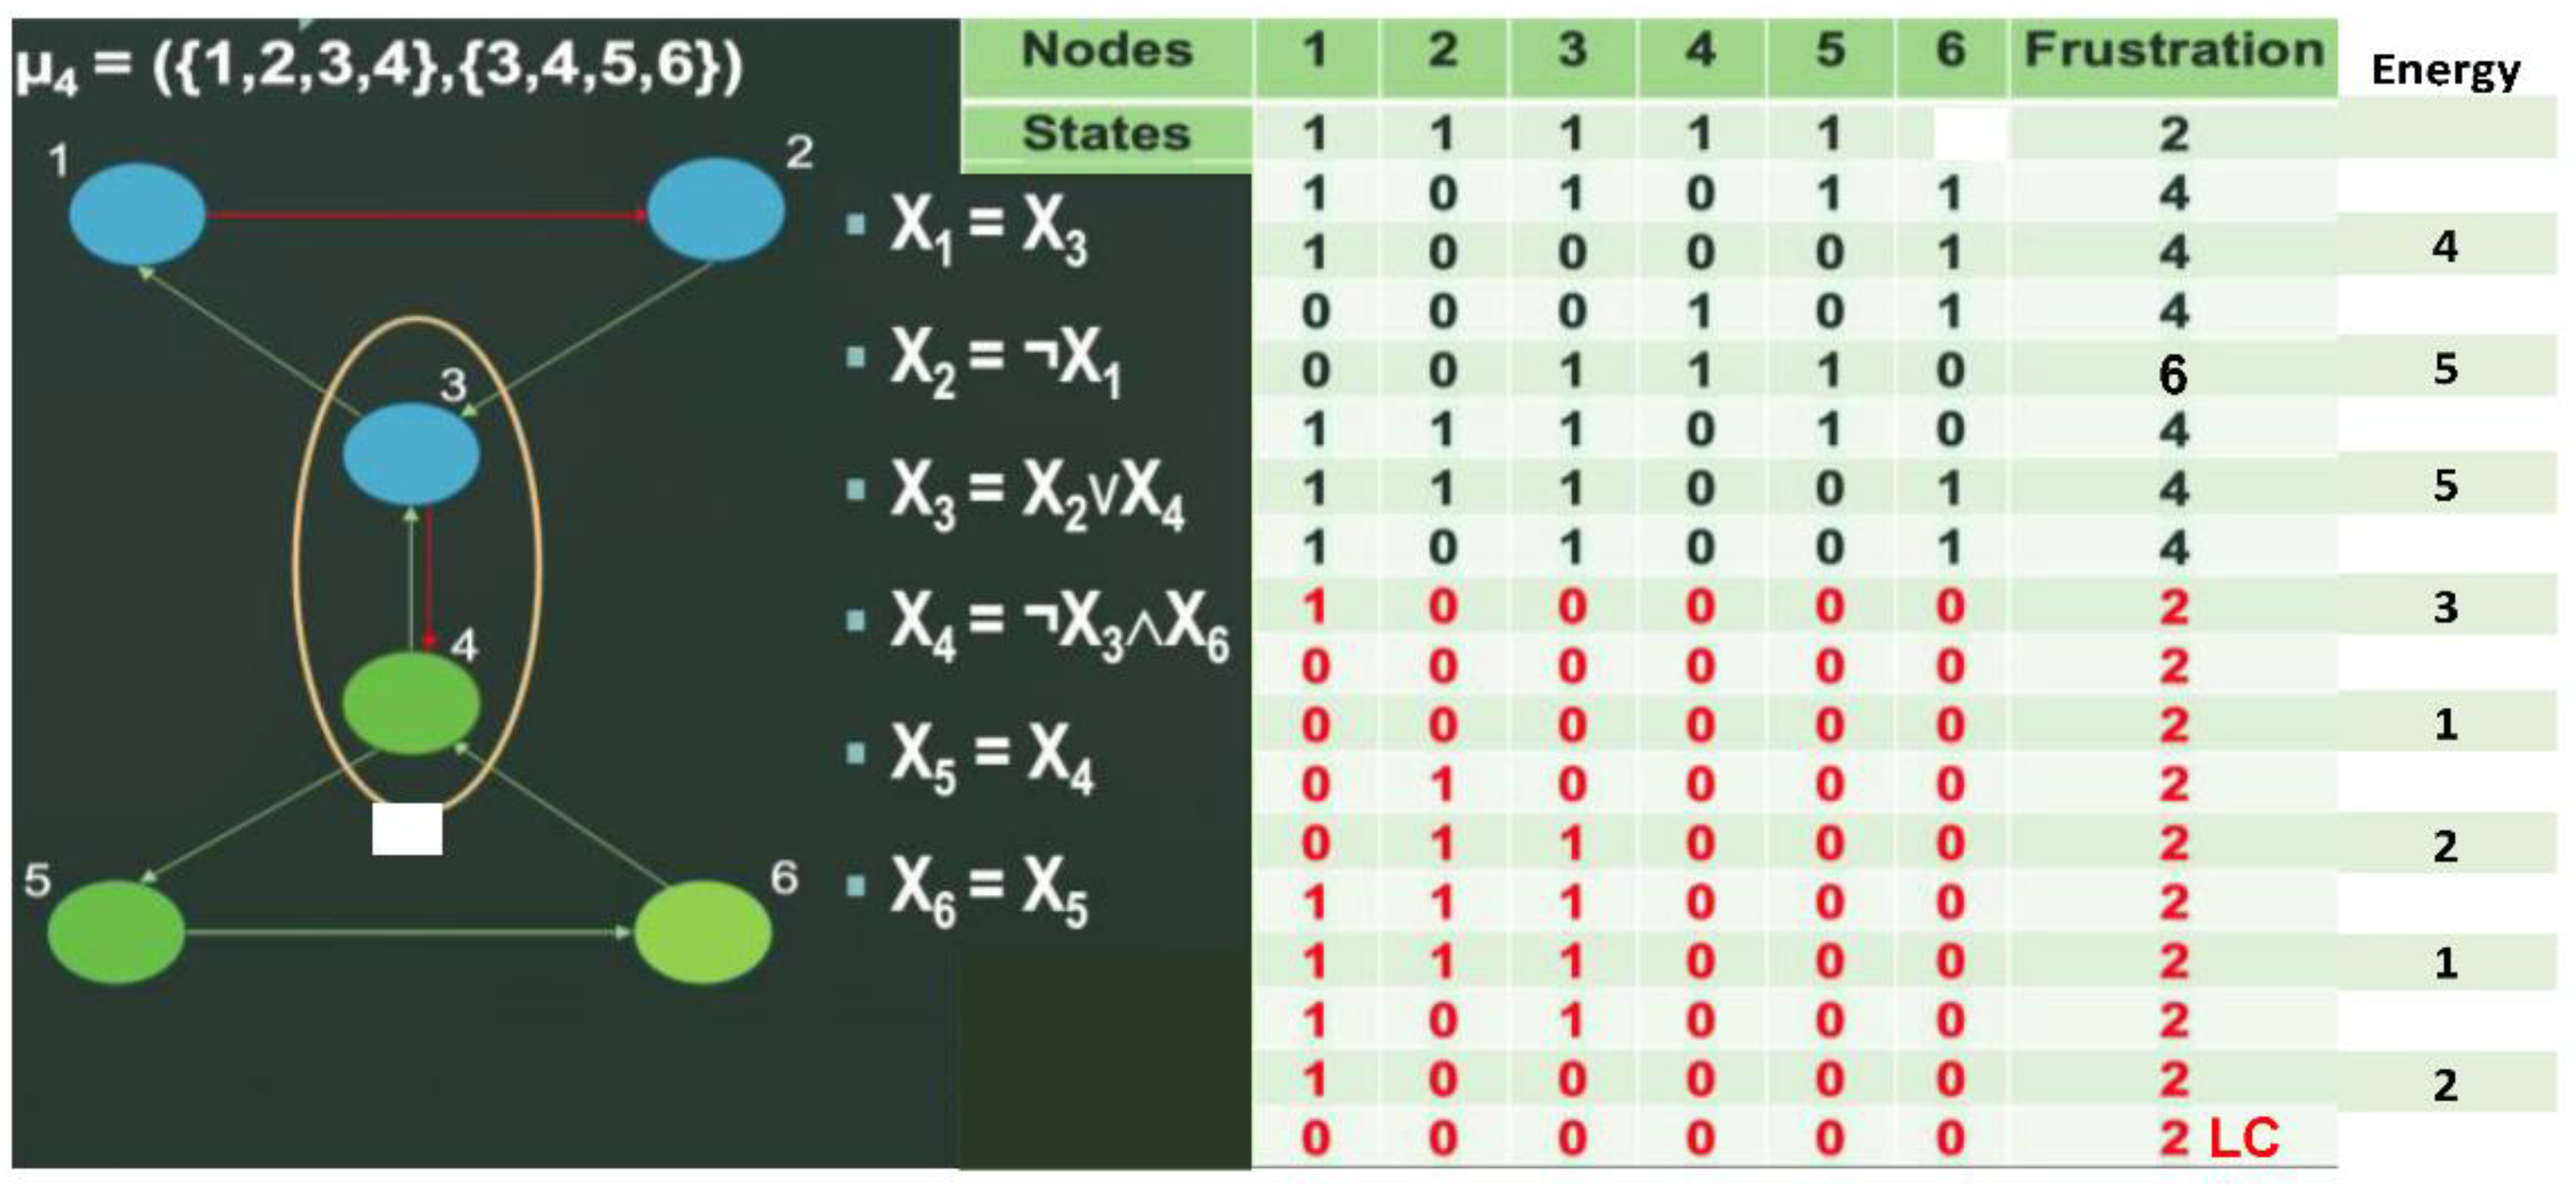
Figure 8.
A: Network K as example of genetic regulatory network. B: Attractors of the network K with parallel updating mode.
Figure 8.
A: Network K as example of genetic regulatory network. B: Attractors of the network K with parallel updating mode.
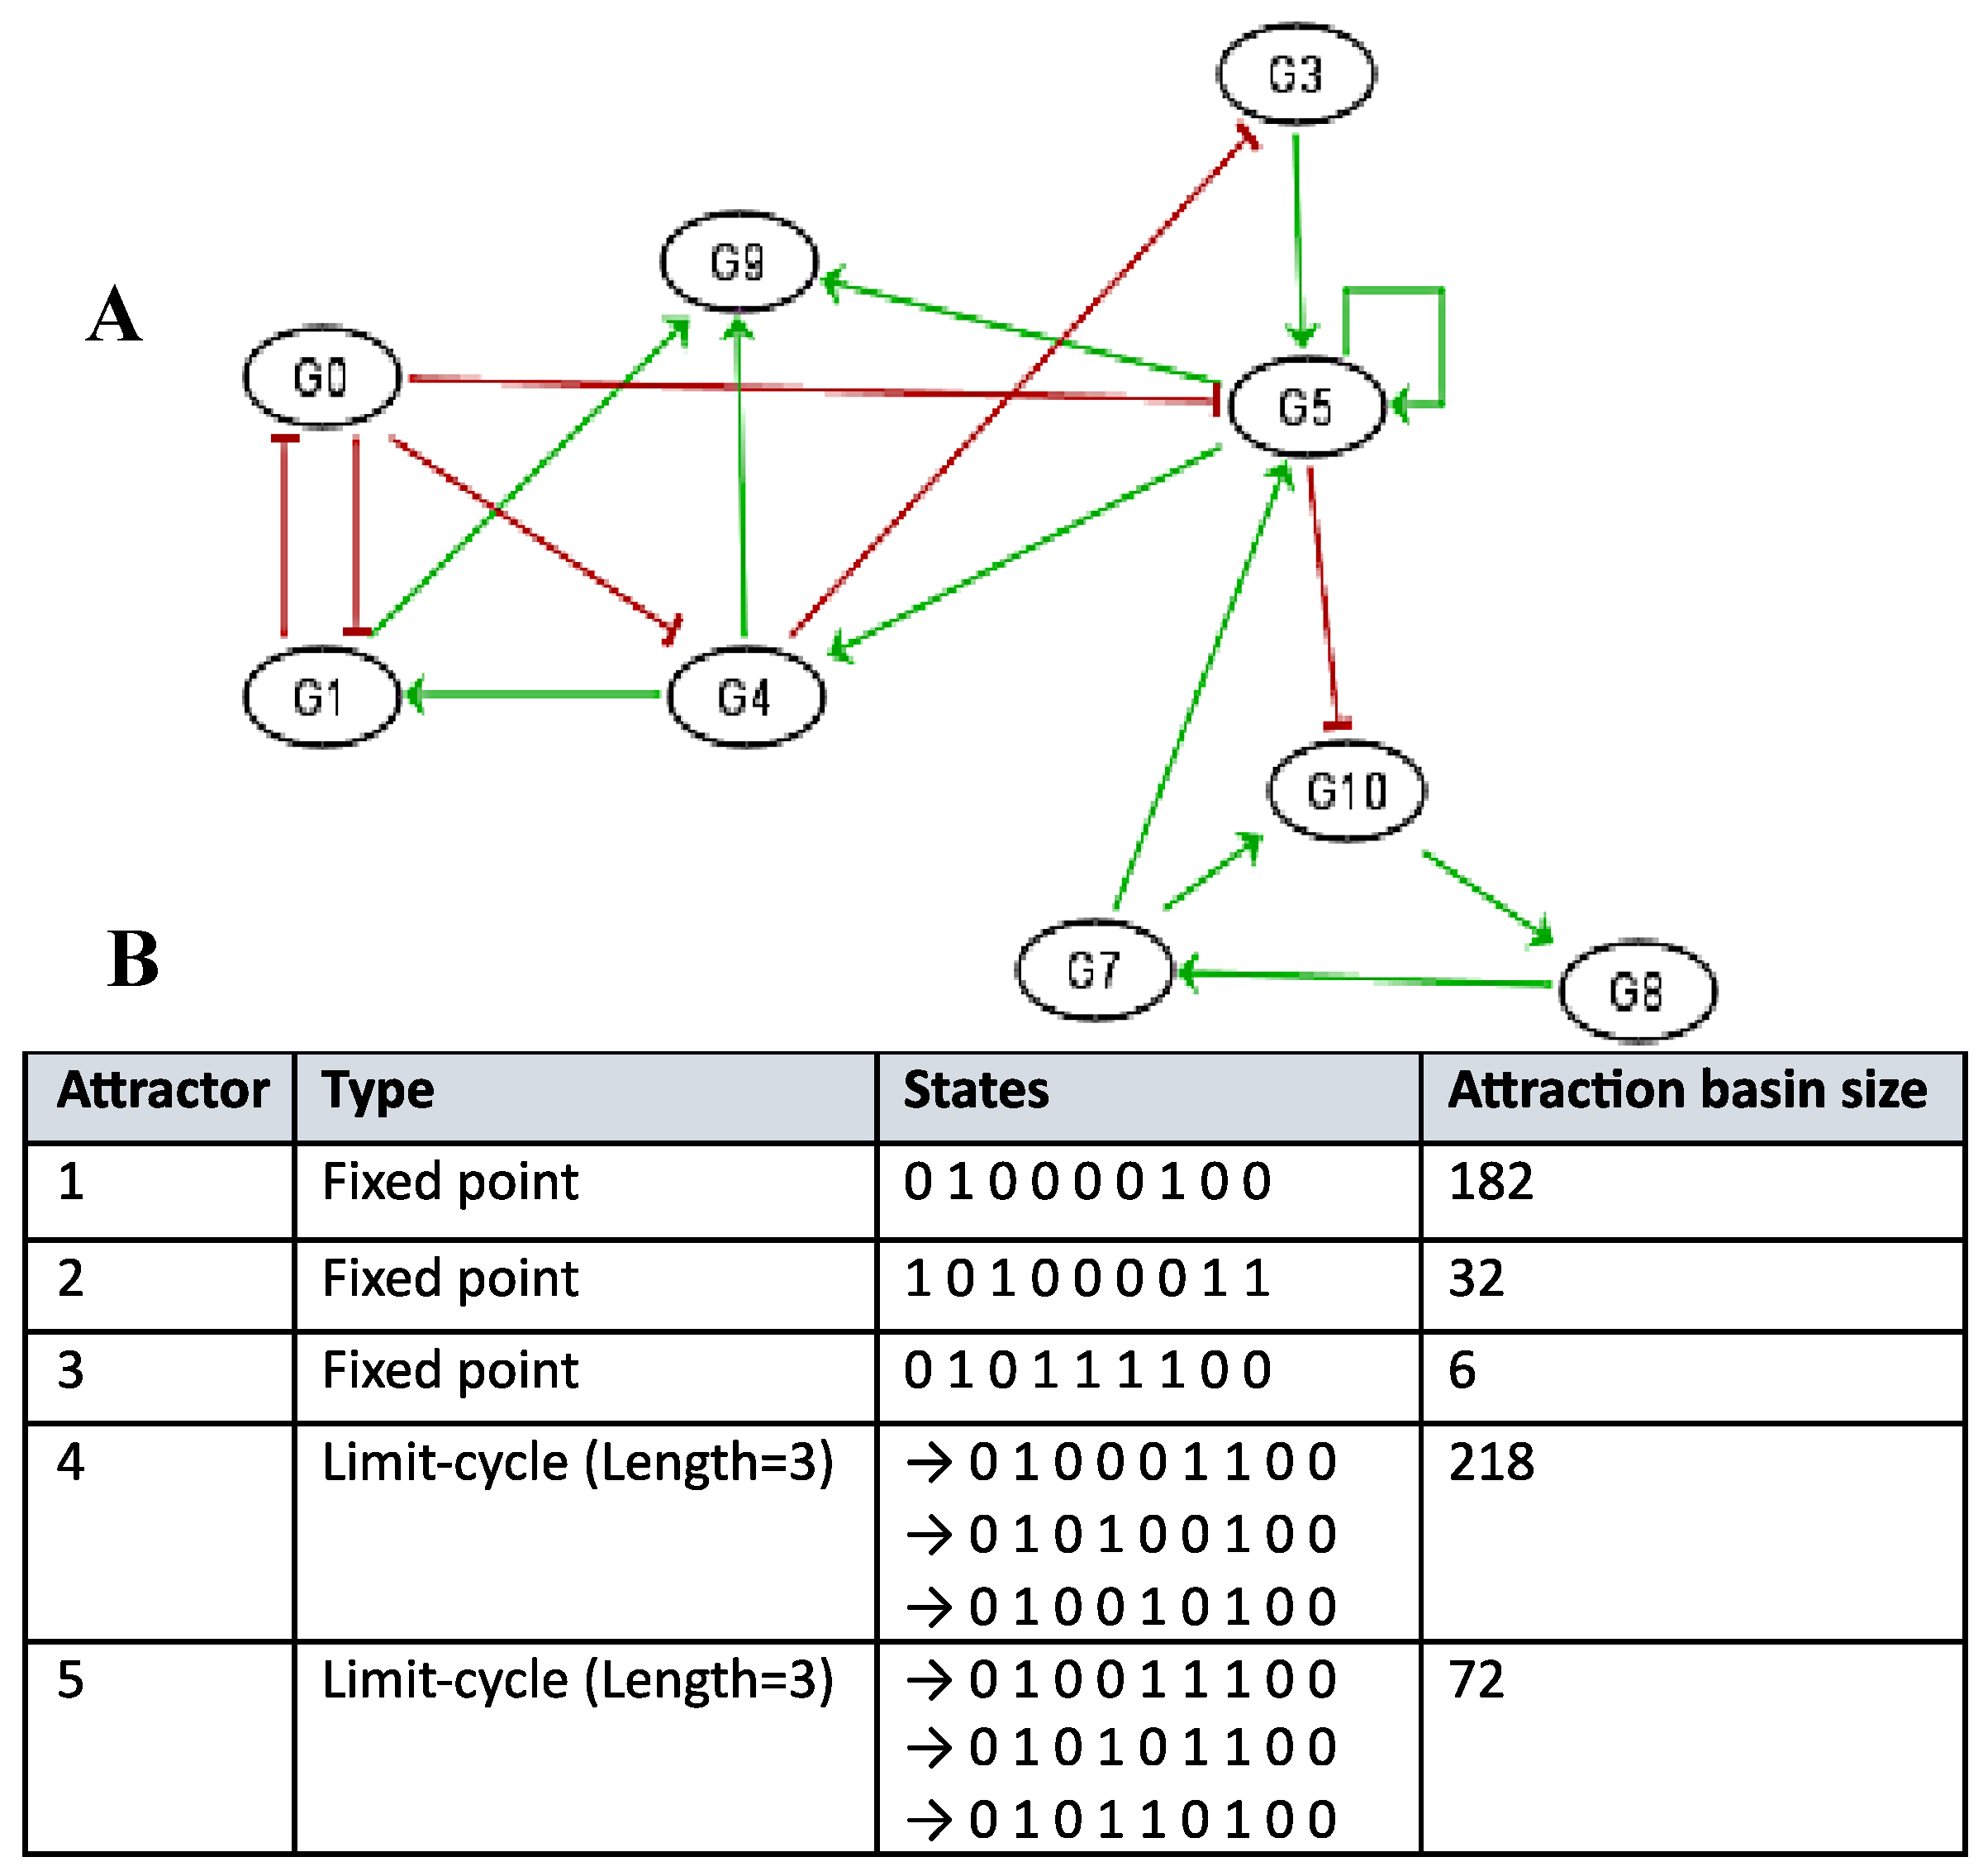
Figure 9.
A: Network J as example of genetic regulatory network. B: Attractors of the network J with parallel updating mode.
Figure 9.
A: Network J as example of genetic regulatory network. B: Attractors of the network J with parallel updating mode.
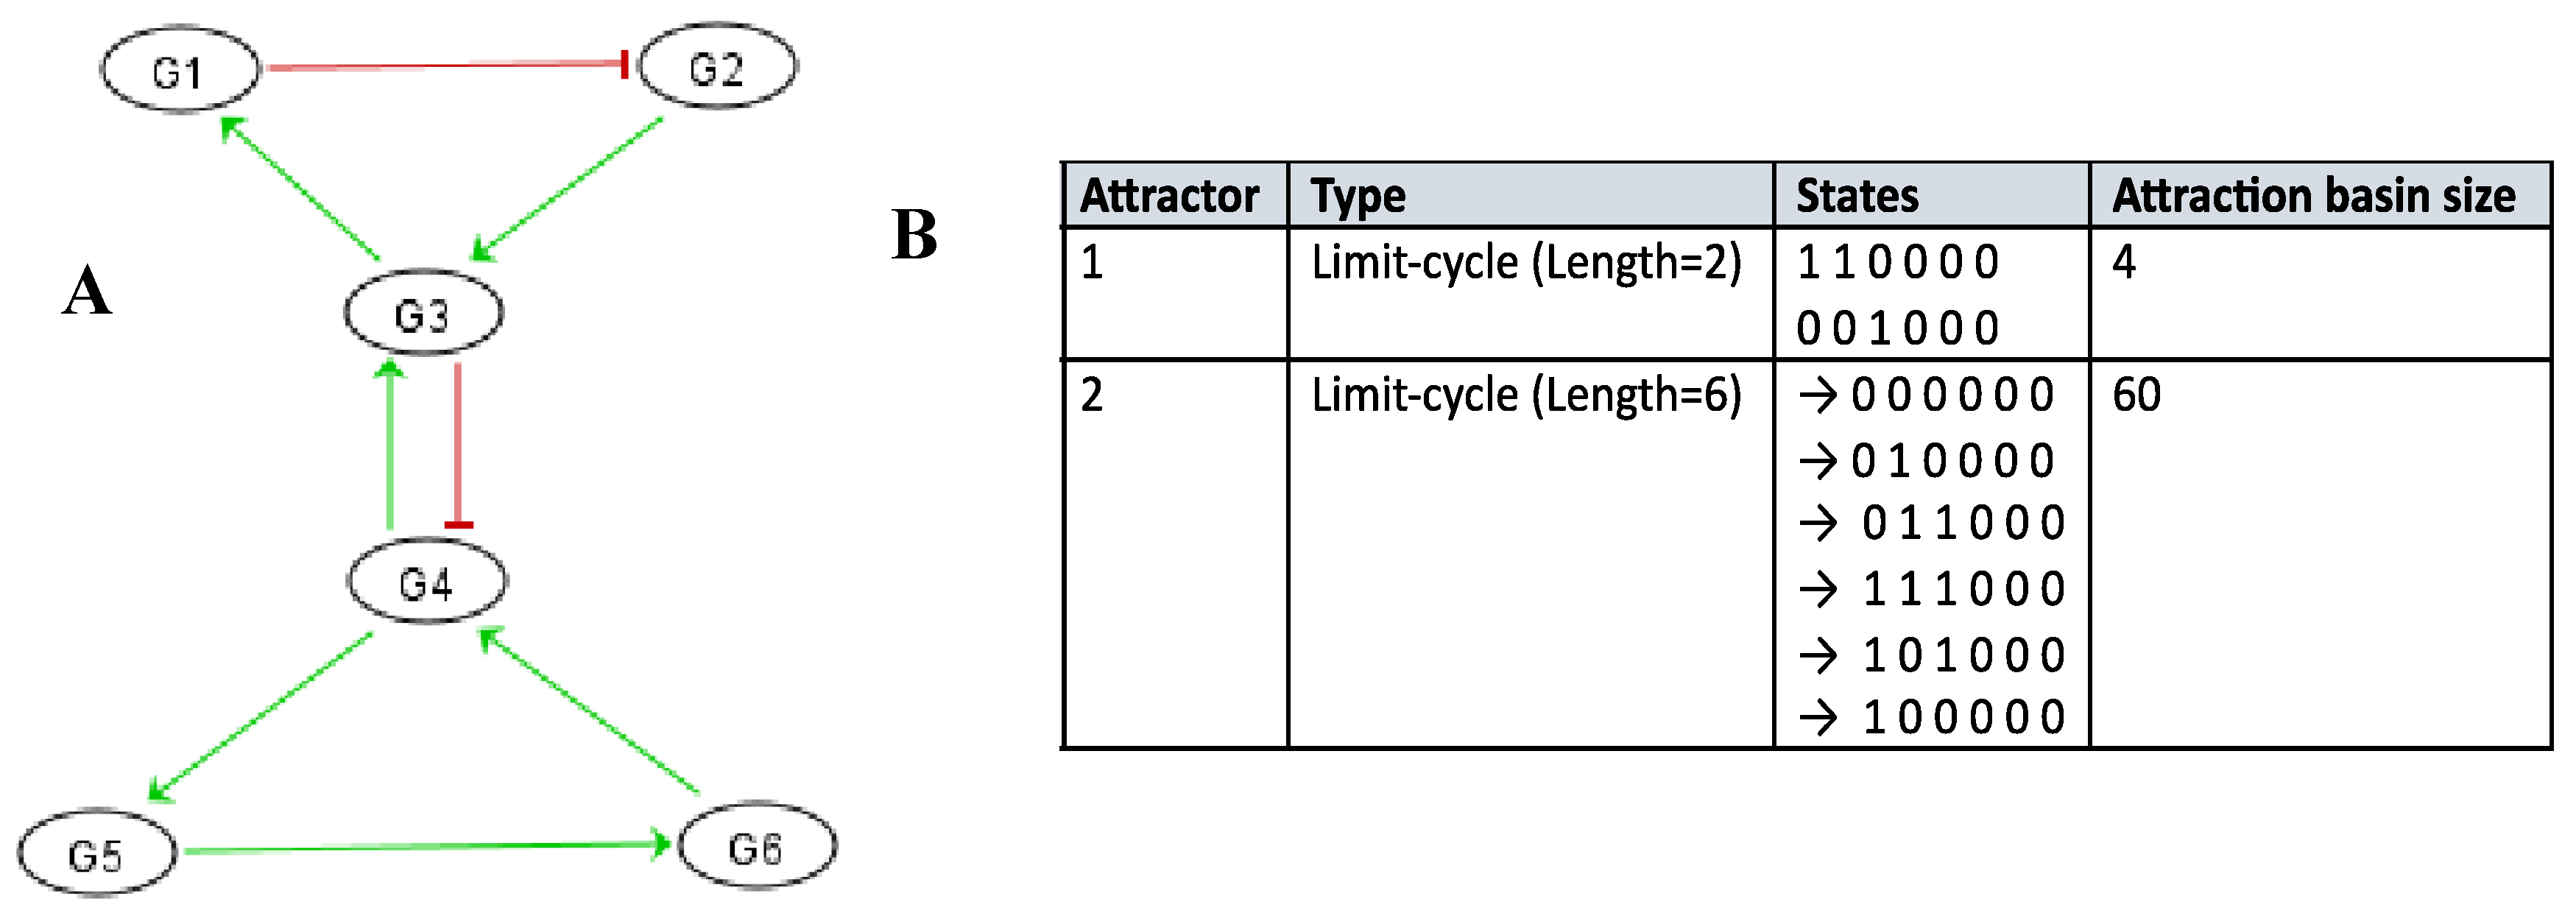

Table 1.
Simulations in parallel updating mode of the genetic network J regulating the gene expression in the osteogenesis imperfecta. They show two limit-cycles LC1 and LC2 as attractors.
Table 1.
Simulations in parallel updating mode of the genetic network J regulating the gene expression in the osteogenesis imperfecta. They show two limit-cycles LC1 and LC2 as attractors.
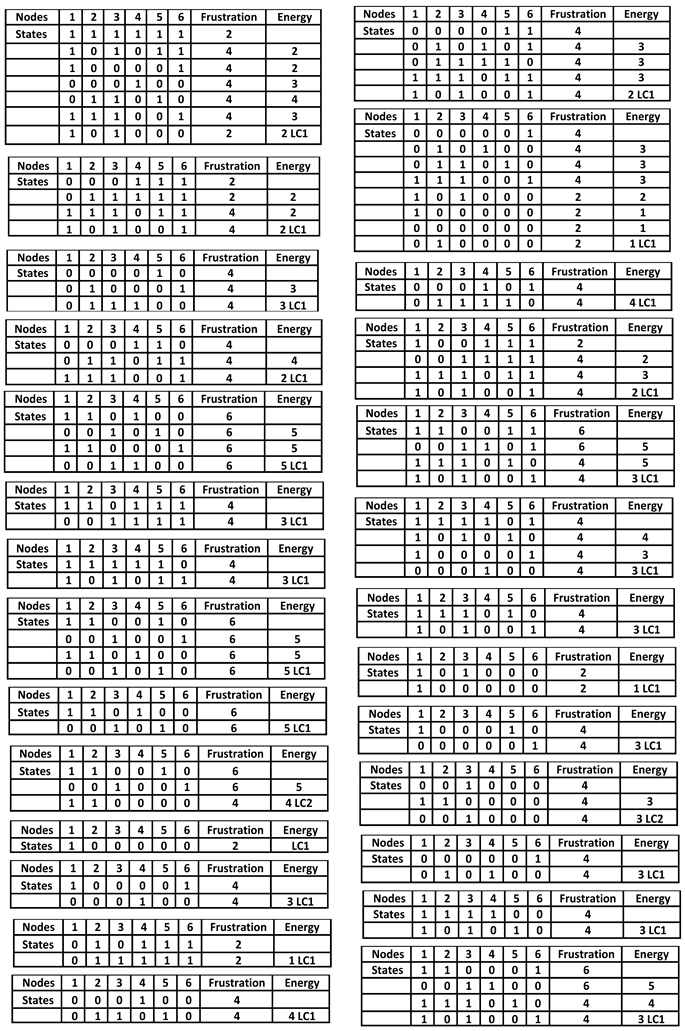
Table 2.
Simulations of J with the intricate block-sequential updating mode, showing only limit-cycle LC.
Table 2.
Simulations of J with the intricate block-sequential updating mode, showing only limit-cycle LC.
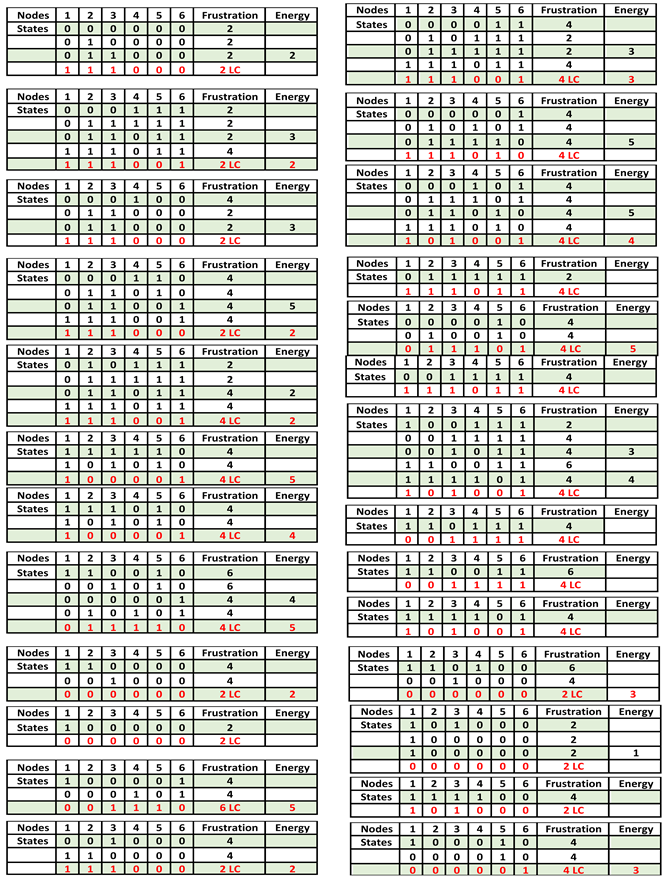
Table 3.
A) Description of the 7 attractors of the biliary atresia regulatory network (parallel updating). B) Expression values in normal and pathologic (BA) cases.
Table 3.
A) Description of the 7 attractors of the biliary atresia regulatory network (parallel updating). B) Expression values in normal and pathologic (BA) cases.
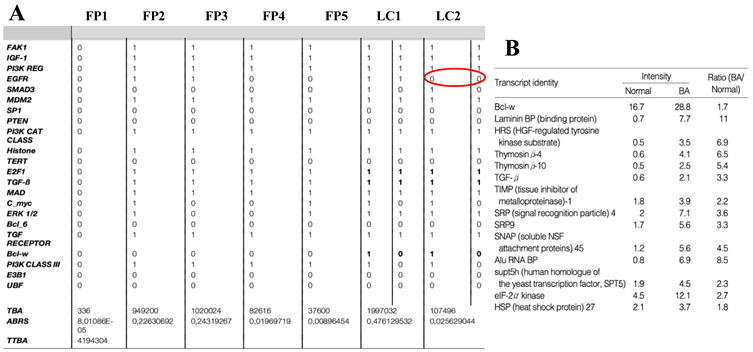
Table 4.
Calculation of the number of attractors of two tangent networks, one negative with length r = 5 and the other negative with length l = 11.
Table 4.
Calculation of the number of attractors of two tangent networks, one negative with length r = 5 and the other negative with length l = 11.
Disclaimer/Publisher’s Note: The statements, opinions and data contained in all publications are solely those of the individual author(s) and contributor(s) and not of MDPI and/or the editor(s). MDPI and/or the editor(s) disclaim responsibility for any injury to people or property resulting from any ideas, methods, instructions or products referred to in the content. |
© 2025 by the authors. Licensee MDPI, Basel, Switzerland. This article is an open access article distributed under the terms and conditions of the Creative Commons Attribution (CC BY) license (http://creativecommons.org/licenses/by/4.0/).
Copyright: This open access article is published under a Creative Commons CC BY 4.0 license, which permit the free download, distribution, and reuse, provided that the author and preprint are cited in any reuse.


