
Submitted:
27 April 2025
Posted:
28 April 2025
You are already at the latest version
Abstract
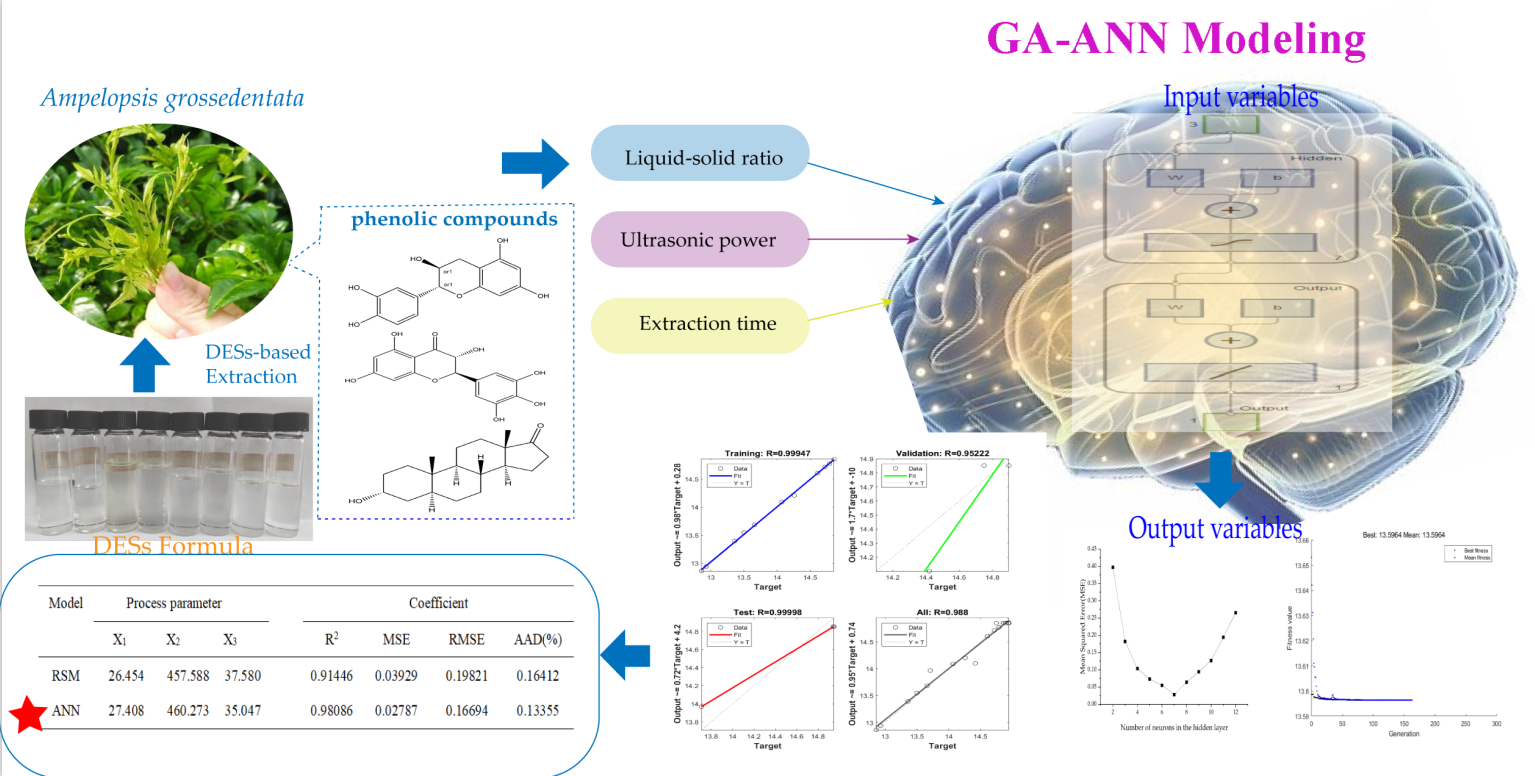
Polyphenols as second major components in the leaves of Ampelopsis grossedentata (AGPL) exhibit excellent antioxidant properties. This study aimed to optimize a novel deep eutectic solvents (DESs)-assisted extraction process for AGPL with response surface methodology (RSM) and genetic algorithm-artificial neural network (GA-ANN). Under the participation of ultrasonic waves, L-carnitine-1,4-butanediol system was selected for the phenolics extraction process. The ideal conditions for AGPL extraction were as following: liquid to solid ratio of 35.5 mL/g, ultrasonic power of 697 W and extraction duration of 46 min. Under those conditions, the actual AGPL yield was 15.32% ± 0.12%. The statistical analysis showed that both of models could predict AGPL yield well and GA-ANN had a relatively higher accuracy in the prediction of AGPL output, supported by coefficient of determination (R2=0.9809) in GA-based ANN compared to R2=0.9145 in RSM, as well as lower values for mean squared error (MSE=0.0279), root mean squared error (RMSE=0.1669) and absolute average deviation (AAD=0.1336) in GA-ANN model. Moreover, the extracted polyphenols were determined by HPLC-MS to have 23 phenolic compounds correspondingly by some bioactive acids such as nonadecanoic acid and neochlorogenic acid. The in vitro ORAC assay revealed that Carn-Bu4 assisted AGPL extract exhibited a notable antioxidant capacity of 275.3 ± 0.64 μmol TE/g. Our results provided a green extraction method to accumulate the polyphenols in the leaves of Ampelopsis grossedentata with more accurate ANN model.
Keywords:
Ampelopsis grossedentata leaves
; deep eutectic solvent
; extraction
; response surface methodology
; artificial neural network
1. Introduction
Vine tea (commonly referred to as "Mei tea," "Ratten tea," or "Teng cha") derived from the tender stems and leaves of Ampelopsis grossedentata Hand.-Mazz., VT, has been consumed as popular folk tea in China for more than 600 years [1]. As early documented in the Compendium of Materia Medica, vine tea has attracted many attentions due to its special mildly sweet flavor and cool properties compared to the prevailing traditional green tea, and is clinically used to treat many common diseased including anti-inflammatory and analgesic, anti-hypertension, anti-atherosclerosis as well as reducing blood lipid [2-4]. Moreover, a number of vine tea-related common foods and health foods have emerged increasingly after its legitimacy was identified by the Chinese regulatory authority two years ago. Concerning the famous pharmacological features, those are mainly attributed to its rich bioactive components inside, including highest flavonoids, polyphenols, polysaccharides, proteins, and volatile components [5,6]. Among them, flavonoids as the principal representative (accounting for 35~45% of dry constitutes) have been in-depth developed in the chemical compositions and nutritional attributes, especially dihydromyricetin which have garnered increasing scientific and public interest [7].
As the second components in the vine tea, the polyphenols from Ampelopsis grossedentata Hand.-Mazz. (AGPL) has been unfortunately far underestimated. Extensive studies have supported that polyphenols can take part into the normal regulation of surface membrane receptors and internal transcription factors to exert important pharmacological benefits including anti-oxidation, anti-inflammation, intestine amelioration and immune-regulation, etc [8,9]. Nevertheless, few attentions have been focused on the extraction process of AGPL yields, which comprises nearly 20% biomass based on dry materials. Some traditional techniques such as hot water extraction and ultrasonic assistance have been employed to obtain the target with limited extraction rates and relatively inefficiency [10]. Moreover, some types of phenolic compounds include ethyl gallate, epicatechin and neochlorogenic acid may not be influenced by such methods due to weak combination with the normal solvents. Deep eutectic solvents (DESs) as a promising green system have been widely applied in many fields of extracting process. It consists of two or more components to get eutectic mixture, which can be categorized as hydrogen bond receptors (HBA) and hydrogen bond donors (HBD) [11,12]. With unique biocompatibility, special tailorable solubility, excellent clearness and high efficiency, various procedures about DESs have been reported for the extraction of some natural polyphenols [13]. Liu et al. [14] prepared choline-lactic acid as a good candidate to extract polyphenols from Cosmos sulphureus with superior extraction performance. Huang et al. [15] made hydroxypropyl-cyclodextrin and L-lactic acid to achieve maximum extraction efficiency of tea phenols. In order to the collection of bioactive AGPL as many as possible, it’s urgent to develop new effective DESs formulation in the optimization of extraction process.
Response surface methodology (RSM) or artificial neural network have recently been conducted to the establishment modeling for the target yield prediction under various extraction conditions [16]. RSM is a statistical modelling tool to analyze the quantitative data by polynomial regression. Its advantages are to solve the optimal parameters by the analysis of multivariate equations after well-designed experiment with less time consuming and precision when compared to one-factor-at-a-time method [17]. While all the manipulation are just within the range of second quadratic model prediction [18]. ANN as one kind of AI intelligence learning approach has attracted great attention for its more suitable modeling. It is a cutting-edged multilayer perceptron network to search globally the ideal conditions with the help of multiple none-linear functions [19]. Usually, an optimum network is established after some of the input data are well-trained with back propagation algorithm. Then with the combination of genetic algorithm (GA), the simulated network would produce the satisfactory outputs by nonlinear mappings. This GA coupled with ANN has been promoted in many extraction processes with best performance. Ramírez-Brewer et al. [20] reported that the maximum of total phenolics content (121.3 mg GAE/g of extract) from mango peel was obtained using RSM and ANN prediction. Under the optimized output conditions by ANN, the total polyphenol content from Ecklonia radiata could peak at 10.836 GAE mg/g.
Herein, this study is to find a green and high-efficient solution to get the polyphenol-rich extract from Ampelopsis grossedentata Hand.-Mazz. Leaves. For that purpose, different DES constituents were initially employed to extract AGPL with ultrasonic assistance. A Box-Behnken experiment was then designed after the acquirement of single factor levels include water content, ultrasonic power, solid to liquid ratio and extraction temperature, etc. Based on the experimental data, a GA-ANN tool was conducted to optimize the simulated network by minimizing the squared errors. Moreover, the polyphenolic extract was subjected to the high-performance liquid chromatography combined with mass spectroscopy (HPLC-MS) for its component determination. Finally, the anti-oxidant activities of obtained AGPL under optimal conditions was evaluated by in-vitro ORAC free radical assay.
2. Results
2.1. Screening of Suitable DESs System for AGPL Extraction
2.1.1. The Optimal DESs System
Polyphenols derived from raw leaves of A.grossedentata were intended to be extracted by various DESs, which were designed to form a strong hydrogen bond in solution by different combination of HBA and HBD [21]. As we all know, some special properties including polarity, viscosity and solubility occurring to certain types of DESs would have remarkable differences and affect the final extraction efficiency [22,23]. With regards to this point, 12 DES solutions were prepared in this study to solubilize AGPL. Among them, choline chloride and L-carnitine were selected as two kinds of HBA, while 1,3-butanediol, urea, 1,4-butanediol, 1,2-propylene glycol, ethylene glycol, malonic acid stood in line for the HBD constituents. As shown in Figure 1A, the final AGPL yields fluctuated between 5.69%-13.36% under those 12 DES conditions. It seemed that L-carnitine as HBA made better performance on the AGPL extraction process than choline chloride no matter which procedure was used as HBD. That phenomenon might be explained that the Chcl-based solvents had relative weak hydrogen bonds with the phenolic hydroxyl groups inside polyphenol derivative, which were not appropriate for the phenolic compounds in vine tea. Moreover, the value of AGPL in Carn-Bu4 ranked the top with the highest production of 13.36% when compared with other formula. This may be attributed to the moderate viscosity and polarity in Carn-Bu4 for the extraction process and under such circumstance, the targets have reduced resistance out of the inner cell wall by hydrogen bonding forces. Consequently, the Carn-Bu4 system could promote the exposure of AGPL from the leaves with higher binding affinity and was determined as the ideal DES formula for the subsequent experiments.
2.1.2. Screening of Optimal Molar Ratio and Water Content
Some certain chemicals might be precipitated if the inappropriate molar ratio of HBA:HBD occurs [24]. So it’s important to get the proper molar composition for the used DES [25]. Figure 1B exhibited the highest AGPL yield (13.14%) was obtained when the molar ratio of L-carnitine to 1,4-butanediol was 1:4. The smaller or larger molar ratio than that had worse extraction rates for AGPL. This phenomenon can support the truth that the molar ratio could strongly affect the hydrogen bonding, Van Der Waals force and surface tension between all the phenolic fractions and extract in DES solvent. And the more stability of Carn-Bu4 under such molar ratio may promote the solubility of AGPL from the cell wall in the raw material.
Water content is another factor for DES to control the polarity and viscosity of solvent and then accelerate the velocity of mass transfer [26]. It was notable that the highest AGPL yield was achieved when the water content was 20% in Figure 1C. After that, the remarkable decrease of the production was found as the percentage of water content increased. Those could be explained that much water in DES would attenuate even break the hydrogen bond between HBD and HBA. From that point, getting an optimal water content of Carn-Bu4 system had relative lower viscosity to be beneficial for the liberation of target phenolic substances. Moreover, the similar polarity was formed to solubilize the phenolic derivatives [27]. Based on the above analysis, 20% of water content and 1:4 molar ratio was final determined as the suitable constituents of Carn-Bu4 during the AGPL extraction.
2.2. One-Factor-at-a time Evaluation
2.2.1. Screening of Liquid to Solid Ratio
A series of liquid to solid ratios from 10:1 mL/g to 50:1 mL/g on the extraction of AGPL were investigated in Figure 2A. The result indicated there was a maximum yield when the value of Carn-Bu4 to raw powder was 30:1 mL/g. Initially, the mass transfer and diffusion rate were sped up by fully explosion of material particles to solvent, resulting in the increment of the extraction yield up to 13.15%. Once the addition of solvent into the mixture, that value was kept to be relatively stable due to the insufficient solute. Too much solvent would cause time-consuming on the next concentration step and add more economic cost for industry. In order to reduce the follow-up cost, the range of 20:1- 40:1 was selected for subsequent experiments.
2.2.2. Screening of Duration Extraction
A prolonged extraction time indeed can enhance the final yield to some extent. Figure 2B revealed that AGPL yield went up to a higher value from 8.21% to 12.96% with the increase of the time. And then it dropped down slightly with extended process, which reflected that at some stages the Carn-Bu4 solvent made a continuous performance on the AGPL extraction. However, that balance was broken with the over-operation of process under the ultrasonic conditions, inducing the decomposition of extracted phenol compounds and DES system [28,29]. Hence, the extraction times for the AGPL preparation were set to be 30-50 min.
2.2.3. Screening of Ultrasonic Power
Ultrasonic technique has become an efficient and green tool to speed up the extraction process, which is popular in many fields of food, pharmaceuticals and cosmetics [30]. It can provide many beneficial functions such as powerful penetration of solvent, motion frequency of solute and high pressure. The formed cavity in the liquid by ultrasonics may generate great pressure on the surface of the bubble, which greatly lead to the liberation of target from the inner particles [31-32]. Figure 2C uncovered the dramatic increase of AGPL yield from 300 W to 600 W ultrasonic treatment. Nevertheless, that assistance took opposite effect on the extraction process. The reason for that may be ascribed to the decomposition of some unstable polyphenol substances and covalent combination of Carn-Bu4. So, it was noteworthy to investigate the exact value of ultrasonic power in the next RSM optimization.
2.2.4. Screening of Extraction Temperature
As the energy agitator, temperature is generally recognized as the key factor to strength the driving force of DES solvent on the solubility of purposed molecules [33]. This study searched five extraction temperatures on AGPL content and the results were shown in Figure 2D. Contrarily to the expectation, the target production had a steady plateau during the whole process, which were not increased significantly compared to the first value of 11.05%. Similar phenomenon has been found in other reports [34]. This finding further evidenced the function of ultrasonic waves in the process of extraction. Concerning the application of ultrasonics as the new promotor, it was inapparent to provide too much temperature. With respect to the double action of ultrasonics on the system, ie reducing the viscosity of DES and energy saving, the extraction temperature was kept at 60°C for the whole process.
2.3. Optimization by RSM
2.3.1. BBD Analysis
The BBD based on RSM was employed to analyze the influence of independent variables (Liquid to solid ratio, Duration of Extraction, Ultrasonic power) on the dependent target (AGPL yield). Table 1 described 17 combinations of experimental inputs based on a multilevel-factorial design and each output value was tested triplicate in parallel. By DesignExpert 12 analysis, a reliable polynomial equation was simulated to predict the final yield and correlated those data accurately, which was presented as following:
y= 14.88 + 0.6100X1 + 0.0600X2 + 0.1325X3 - 0.0625X1X2 - 0.0625X1X3 - 0.4925X2X3 - 0.3313X12 - 0.5013X22 – 6262X32
The statistical significance of Eq. (1) was checked using Fisher’s statistical ANOVA test (F-test) and results are shown in Table 2. The results indicated that the second model was well suited for the prediction of experimental data, supported by a high model F value of 8.92 and a low p value of p=0.0043. The value of R2 (0.9145) shows a close agreement between the experimental results and the theoretical values predicted by the polynomial model. The adjusted coefficient of determination (R2adj) indicated that the sample variation of 81.67% for the AGPL yield was attributable to the independent variables. Moreover, a relatively low value of CV (2.18) illustrated further the experiments were practical with a better precision and reliability [35]. The coefficient estimates of Eq. (2), along with the corresponding p-values are presented in Table 1 as well. It can be seen that the P values of X1, X2, X1X2, X1X3, and X32 were all less than 0.05, showing extremely significant level except X3 and X2X3 (P > 0.05). The effects of three parameters on the AGPL yield was following the order as ultrasonic power > liquid to solid ratio > duration of extraction.
2.3.2. Interactive Effects on AGPL Yield
The fitted response surface plots and their corresponding contour plots for DES-based extraction of AGPL by the BBD model were shown in Figure 1, in which it provides an opportunity to visualize the relation and interaction between the response and experimental levels of each variable. Figure 3A indicated the interaction between X1 and X2 had a pronounced contribution to the AGPL yield at a significant level (p=0.0082). It was evident that when the liquid to solid ratio was from 20 to 40 mL/g, and the ultrasonic power was from 450 to 630 W, the AGPL yield was over 13.67% and then decreased slowly beyond this range. The reason was ascribed to the enhancement of ultrasonic power at the initial stage could promote the process of extraction. While exposure to higher ultrasonic waves, the prepared DES system would be broken and cause lower efficiency on the process. Moreover, the increase of liquid to solid ratio to some extent could improve the concentration difference and promote the solubility of the target. Those facts were consistent with the results of Ilex latifolia polyphenols [36], in which the factors of ultrasonication and liquid to solid ratio could break down the plant cell wall and draw the flavonoids out of inner cell.
The interaction of increasing liquid to solid ratio and duration of extraction had obvious influence (p=0.0153) on the AGPL yield in Figure 3B when X2 was set to zero level. At the liquid to solid ratio of 30 mL/g, the duration of extraction was beneficial to the enhancement of AGPL yield. The highest yield was obtained to be 14.6% when the extraction time was less than 45 min. After that, the final outcome had a negative response as the increase of liquid to solid ratio and the extraction time. This result was consistent with the findings of Jiao et al. [37], who reported that a certain time for the process indeed would help Choline chloride-acetic acid to extract the flavonoids form Perilla frutescens leaves, a prolonged extraction time led to degradation of flavonoids by easily hydrolyzing the O-glycosidic bonds.
Figure 3C showed that the yield of AGPL climbed up continuously when the value of X2 increased from 450 W to 600 W and that of X3 extended from 30 min to 42 min. Then it went down dramatically outside that optimum point. The contour plot was diagonally elliptic, revealing mutual influence of ultrasonic power and duration of extraction had a relatively weak effect (p<0.6978). With the assistance of ultrasonic waves on the initial process of AGPL from leaves of A.grossedentata, it enhanced the diffusion process and provided a greater force of components into solvent during the extraction process. However, it had no effect on the yield of AGPL at relatively high power of ultrasonics and time, which might be explained by the solubility of impurities and decreasing the available surface area between Carn-Bu4 solvent and the cells. Those findings could also be found in the report made by Zhang et al. [21].
2.4. ANN Model Establishment
A three-layered neural network was constructed to simulate the extraction process of AGPL under various experimental conditions. To achieve that, the structure of the multilayer perceptron framework was the first step to establish, which was determined by the number of neurons in hidden layer. As depicted in Figure 4A, with the changes of the number hidden neurons, the MSE value tended to be concave during the training of various ANN topologies. The minimum value of MSE was 0.0256 when the number of neurons was 7. Hence the ANN topology of 3-7-1 was the ideal structure for that prediction. Prior to the manipulation of training, validation and testing datasets, the 3×7 of weight matrix of the input layer connected to the hidden layer and 7×1 of weight matrix of the hidden layer to output layer were assigned in the following w1 and w2, where the related bias matrixes of b1 and b2 were presented as well for the model calculation [38].
Figure 4B showed the best evaluation performance was 0.020187 of MSE value at 2 epochs. Then the model training stopped with the significant drop of MSE occurred in the training step but stability in validation and test steps, which meant the over fitting of network. Figure 4C presented a reasonable range for data fitting error with the highest instance near zero. The values of gradient, Mu and val fail were 1.1052×10⁻⁹, 1.0×10⁻⁷ and 3 at 6 epochs, respectively, supporting the well-trained ANN model (Figure 4D). The good correlation between predicted and actual values can be found by 4 linear relationships in Figure 4E, where the R values of training, validation, test and all were 0.99947, 0.95222, 0.99998 and 0.988.
2.5. GA-oriented Optimization
Renowned for its global search capability and adaptive control, the GA is widely employed in solving complex optimization problems [39]. In this study, the hybrid ANN-GA approach was utilized to determine the optimal extraction parameters of AGPL. The individual chromosome contained three input variables and the fitness function was employed to test the fitness of every solution when the chromosome population was enlarged to 1000. The selected chromosomes with high performance were sent to replicate new generations through crossover (0.8) and mutations (0.2). Those evolutional process was iterated until the optimal output emerged. As depicted in Figure 5A, the GA performed 100 iterations to identify the most efficient extraction conditions, ultimately yielding the highest AGPL content. During the first 20 generations, a substantial decrease in MSE was observed, demonstrating the algorithm’s ability to rapidly locate a superior candidate solution within the search space-a testament to its strong initial optimization performance. From the 20th to the 100th generation, the GA reached convergence, indicating that an optimal or near-optimal solution had been identified, with further iterations providing no significant enhancement. The ANN-GA model predicted the following optimal conditions: liquid to solid ratio of 35.4922 mL/g, ultrasonic power of 696.7965 W and extraction duration of 46.1238 min. For practical implementation, these parameters were adjusted to 35.5 mL/g, 697 W and 46 min, respectively. Experimental validation under these modified conditions yielded an AGPL content of 15.32% ± 0.12%, closely aligning with the model’s prediction (15.2822%). These findings confirmed that the ANN-GA model exhibited strong predictive accuracy and could reliably estimate AGPL yield based on specified extraction parameters.
2.6. Comparative Analysis of RSM and ANN
The plot tendency of predicted values and experimental data offered by RSM and ANN mathematical models indicated that both of the models have good fitness degree (the red linear line and black linear line) in Figure 5B. However, the higher value (0.9809) of coefficient of determination (R2) in GA-based ANN believed us its prediction ability was more accurate than that of RSM (R2=0.9145), which meant the former had 98.09% of confidence to explain the changes in the corresponding AGPL yield. It can be seen that all the predicted ANN points were easier to approach the actual data (Figure 5C). Moreover, the MSE, RMSE and AAD values were 0.0279, 0.1669 and 0.1336, respectively. All the values were lower than those in RSM model (0.0393, 0.1982 and 0.1641), demonstrating the GA-based ANN model could accurately simulate the relationship between AGPL yield and three selected variables. This prominent accuracy was ascribed to the excellent non-linear processing, fault tolerance, self-learning, self-training and global searching provided by the GA-ANN mathematical tool [40].

Table 3.
Summary of all statistical parameters of AGPL yield predicted by RSM and GA-ANN.
| Model | Process Parameter | AGPL Yield(%) | Coefficient | ||||||
| X1 | X2 | X3 | Actual | Predicted | R2 | MSE | RMSE | AAD(%) | |
| RSM | 39.170 | 595.054 | 40.736 | 14.83 | 14.9049 | 0.9145 | 0.0393 | 0.1982 | 0.1641 |
| ANN | 35.492 | 696.796 | 46.124 | 15.32 | 15.2822 | 0.9809 | 0.0279 | 0.1669 | 0.1336 |
2.7. The Qualitative Analysis of UPLC-ESI-QTOF-MS
The phenolic compositions of AGPL were qualitatively analyzed by UPLC-ESI-QTOF-MS. The molecular formula and fragmentation patterns were provided by MS/MS double detection with a comparison of MS databases including Human Metabolome Database (http://www.hmdb.ca), massbank (http://www.massbank.jp/), LipidMaps (http://lipidmaps.org), mzcloud (http://www.mzcloud.org) and KEGG (http://www.genome.jp/hegg). There were 23 phenolic compounds found in the leaves of Ampelopsis grossedentata in Figure 6 and listed in Table 4. Among them, 8 major phenolic items were identified with the help of positive and negative ionization mode. Those were Leucocyanidin (m/z=306), Quercetin (m/z=303), (-)-Epigallocatechin (m/z=307), Quercetin 3-O-rhamnoside 7-O-glucoside (m/z=609), Nonadecanoic acid (m/z=297), Quercetin 3-O-glucoside (m/z=463), Dihydromyricetin (m/z=319) and myricitrin (m/z=463). Dihydromyricetin was found to have a significant peak at RT=10.07 min, which agreed with the finding that it is most important symbol in vine tea. Besides, some bioactive acids were successfully liberated from the inner part of raw leaves due to the contribution of novel Carn-Bu4 system in the extracting process. And this can be addressed that this combination of two HBD-HBA may strengthen the hydrogen bonding force in solvent.
2.8. Antioxidant Activity Analysis of AGPL in Vitro
Oxygen radical absorbance capacity (ORAC) has been proved to effectively and tractably quantify the antioxidant capacity of drugs. It is conducted based on the chemical damage to β-PE caused by a peroxyl radical producing compound (AAPH), reducing the fluorescence emission of β-PE. During existence of antioxidants in the medium, the damage can be recovered to some extent and the reduction in the fluorescence emission is prolonged. In this study, a calibration curve was constructed with Trolox concentration (μmol/L) as the abscissa and NetAUC (net area under the curve) as the ordinate [41]. As shown in Figure 7, the linear regression equation was determined as y = 0.8981x + 2.8097 (R² = 0.9572), demonstrating satisfactory linearity. The NetAUC values of AGPL were interpolated into this standard curve to calculate corresponding Trolox-equivalent concentrations. The oxygen radical absorbance capacity (ORAC) was expressed as Trolox equivalents (μmol/g dry weight). Based on the calibration curve, the Carn-Bu4 assisted AGPL extract exhibited an ORAC value of 275.3 ± 0.64 μmol TE/g (mean ± SD, n = 6), indicating substantial antioxidant activity. These data suggest that AGPL extract could be an effective electron donor capable of reacting with free radicals to convert them into more stable products.
3. Materials and Methods
3.1. Materials and Reagents
The fresh leaves of Ampelopsis grossedentata Hand.-Mazz. were collected from the Dayang Mountain, Qingtian County, Zhejiang Province; All reactants and solvents were of analytical grade. The gallic acid standard (purity >98%) was purchased from Sigma-Aldrich (Shanghai, China). Choline chloride, L-carnitine, 1,4-butanediol, 1,3-butanediol, ethylene glycol and ethanol were provided from Sinopharm Chemical Reagent Co., Ltd; Distilled water was produced using a Kebang water treatment system (Kebang 210B, Hangzhou, China). Folin-Ciocalteu reagent, TPTZ [1,3,5-tri(2-pyridyl)-2,4,6-triazine], 2,2’-azino-bis-(3-ethylbenzothiazoline-6–sulfonic acid) diammonium salt (ABTS), 2,2’-azobis (2-methylpropionamidine)-dihydrochloride (AAPH), fluorescein sodium salt, 6-hydroxy-2,5,7,8 -tetramethylchroman-2-carboxylic acid (Trolox) were purchased from Sigma-Aldrich Chemical Co. (St. Louis, MO, USA). All other chemicals were at analytical grade.
3.2. Preparation Under DESs formula
Two kinds of formula were adopted to constitute the hydrogen bond acceptors and hydrogen bond donators of the DESs. Choline chloride and L-carnitine were selected for the HBAs parts while different alcohols, malonic acid and urea were chosen as the HBDs section. All the uniformed solution were strictly prepared by a constant stirring and heat in an oil bath at 80°C followed the procedures listed in Table 5. Then the transparent liquids were ready to be used in the following extraction process after cooling down.
3.3. DESs-Based Extraction and Contents Determination of AGPL
Prior to the extraction, the freeze-dried leaves of A.grossedentata were smashed into small particles through a 100-mesh sieve. Then 2.000 g of powder in a glass conical flask were mixed with various concentrations of DESs solvents or water content and treated with ultrasonication at various power levels (300-900 w) in a water bath of 40-60℃ for the extraction process. After 8000 g of centrifugation, the supernatant was transferred to a 100 mL volumetric flask and followed by a volume make-up to 100 mL.
For the content measurements of phenolic compound by Folin-Ciocalteu colorimetric method, a standard stock solution of gallic acid (0.234 mg/mL) was well prepared, and aliquots of 0.0, 0.1, 0.25, 0.5, 0.75, and 1.0 mL were accurately pipetted and diluted to 2 mL with deionized water. Subsequently, 0.5 mL of Folin-Ciocalteu reagent was added to each mixture, followed by thorough vortexing and incubation at room temperature for 3 min. Then, 4 mL of 7.5% (w/v) sodium carbonate (Na₂CO₃) solution was added, and the reaction mixture was vigorously mixed and allowed to stand for 60 min at ambient temperature. After the auto zero adjustment, a UV-Vis spectrophotometer (Hitachi 1000, Tokyto, Japan) was used to record the absorbance values (A) of all samples at 760 nm. Experimental data were analyzed to establish a linear regression equation (y = 16.784x - 0.0218, R²=0.9992), where the y-axis represents absorbance and the x-axis corresponds to gallic acid concentration. The percentage yield of polyphenols in leaves of A.grossedentata (Y,%) was calculated by the following equation:
Y= C×V ×r/ W
C means the tested polyphenol concentration in the tube (g/mL), V represents the volume of extraction (mL), r is the dilute ratio and W refers to the dry weight of raw material (g).
3.4. The Effects of Molar Ratio and Water Content on Polarity of DESs
In order to improve polar properties of DES system for maximum polar/nonpolar polyphenolics extraction, different molar ratios (1:1, 1:2, 1:3, 1:4 and 1:5) of the selected DES solvent and series of water contents (10%, 20%, 30%, 40%, and 50%) were carried out for the acquisition of the highest AGPL yields when the other conditions were constant.
3.5. RSM-Based Model of AGPL Extraction Process
For the optimization of the target extraction, four different single factors were immediately investigated before the RSM modeling, which were liquid-solid ratio (10:1 mL/g, 20:1 mL/g, 30:1 mL/g, 40:1 mL/g and 50:1 mL/g), duration of extraction (20 min, 30 min, 40 min, 50 min and 60 min), extraction temperature (50 °C, 60 °C, 70 °C, 80 °C and 90°C), and ultrasonic power (300 W, 450 W, 600 W,750 W and 900 W). Each experimental condition was tested 3 times for average value.
A Box-Behnken design (BBD) (Design Expert Software, trial version 7.1.3; Stat-Ease Inc., Minneapolis, MN, USA) was used to determine the best combination of extraction variables for production of AGPL from the leaves of A.grossedentata. 3 variables were established on the basis of “one-factor-at-a-time” trials for AGPL yield (Table 6). The design included 17 experimental trials (Table 2). A total of 5 replicates at the center of the design were used to allow for estimation of a pure error sum of squares. Each experiment was performed in triplicate and the yield of AGPL (%) was interpreted as the response (Y).
3.6. ANN Model
The matlab 2020a software was used to construct an ANN model based on the experimental results of AGPL yield designed by RSM. As depicted in the left frame of Figure 8, the architecture of the artificial neural network model was initially established to simulate the human being’s brain by training the independent variables and testing the dependent variables [42]. For this study, it consists of an input layer (X1, X2, X3), a hidden layer, and an output layer (MPTGL yield). Prior to the simulation, all the data sets were categorized into three parts: training (70%), validation (15%), and testing (15%). Then the neural network model was trained iteratively until the mean of error between the experimental and predicted values of AGPL yield reduced to its minimum. The hyperbolic tangent sigmoid function (tansig) was served for the communication between the input layer and hidden layer while the linear function (purelin) was selected for the combination of hidden layer and final outcomes. Among the ANN model, the hidden nodes were the crucial parameters which significantly affected its topology and predictive capacity. In this study, 10 neurons were examined to be suitable for the neural network prediction under the back-propagation Levenberg-Marquartd algorithm by controlling the weights and biases. Due to the discrepancy of actural values, the normal, all experimental results were standardized between -1 and 1 by Equation (3). These normalized values were subsequently converted back to actual values after processing through the output layer of the network [43].
Where Mi is the normalized value, Mmax and Mmin are the maximum and minimum values of the scaling range, Ni is the actual data to be normalized. Nmax and Nmin are the maximum and minimum values of the actual data.
After the modeling, the well-trained ANN was transformed into a mathematical equation by combining the transfer function:
where x and j are the experimental factors (the input variables) and the number of input variables, respectively. w1 and b1 are the weight and bias of hidden layer, respectively. w2 and b2 are the weight and bias of output layer, respectively.
3.7. Model Analysis
Four classical indicators were employed to evaluate the prediction performance of RSM and ANN, which were values of R2, mean squared error (MSE), root mean squared error (RMSE), and absolute average deviation (AAD) with the equations as following:
Where Xi is predicted APGL yield. Xik is the experimental or actual APGL yield. Xz is the mean of experimental APGL yield. n represents the number of parameters in each model.
3.8. Optimization of the Extraction Process
In order to avoid the dilemma of local optima, the method of genetic algorithm was introduced to develop the neural network for searching the optimal the extraction parameters of AGPL [44]. Like the learning principle of biological evolution, a series of manipulation of species reproduction, crossover, mutation and selection were conducted to vary the fitness values in the trained BP network. Then the maximum yield was achieved by converting a function to an inverse function or by changing the sign. Based on MATLAB 2020a, a GA toolbox was adopted to simulate those natural evolution process. The population size, crossover fraction, mutation ratio and generations were set as 100, 0.8, 0.2 and 300, respectively. Other parameters were selected as default value. The above ANN-derived Equation (3) was introduced as a fitness function. The higher AGPL production, the greater the function value of the individual.
3.9. Phenolic Composition Determination by UPLC/ESI-QTOF-MS/MS
According to the method reported by Wang et al. [45], AGPL solid extract was dissolved into 600 μL of methanol containing 2-chloro-L-phenylalanine (4 ppm), followed by vortex mixing for 30 seconds. The mixture was then sonicated at room temperature for 15 min and centrifuged at 12,000 rpm (4°C) for 10 min to get the supernatant. After filtration through 0.22 μm membrane, the sample was injected into an autosampler vial for the measurement by ACQUITY UPLC HSS T3 (50 mm×3.0 mm, 1.8 μm, Thermo Fishier Technologies Co., Massachusetts, USA) coupled with Triple-TOF 5600+ Mass Spectrometry (AB SCIEX CO., Framingham, USA). The detected conditions were as following: The column temperature was maintained at 40°C. The mobile phase consisted of acetonitrile (A) and 10 mM ammonium formate aqueous solution (0.1%, B) with a flow rate of 0.3 mL/min. The injection volume was set to 2 μL. The elution procedure was presented as following: 0-1 min, 0% to 8% B; 1-8 min, 8%-98% B, 8-10 min, 98% B; 10-10.1 min, 98%-8% B, 10.1-12 min, 8% B. The MS conditions was set as positive/negative ion sweeping mode: capillary voltage 4 KV, capillary temperature 325℃, scan range 100-1000 m/z with the sweep resolution 60000, ion source gas 1 and 2 (air) 55 psi, curtain gas (N2) 35 psi, ion source temperature 600℃ (positive) and 550℃ (negative), source voltage 3.5 kv (positive) and -2.5 kv (negative), collision energy was set to 20 eV. Data was processed using Analyst software version 4.1 (MassLynx).
3.10. In-Vitro ORAC Activities of AGPL
96-well fluorescent plates were prepared to examine the experimental samples according to the method described in reference [46]. All groups were simultaneously supplemented with 40 μL of fluorescein salt (700 nM). Subsequently, 20 μL of phosphate buffered saline (PBS) was added to the control group, 20 μL of water-soluble VE derivative Trolox (200 μM) to the standard curve group, and 20 μL of test sample to the sample group. The plate was incubated at 37°C for 15 minutes. Following incubation, 140 μL of PBS was added to the negative control group, while 140 μL of AAPH (12 mM) was added to all other test wells. Fluorescence intensity was immediately measured using a microplate reader under 485 nm excitation wavelength, with emission recorded at 538 nm. Measurements were conducted at 2-minute intervals from 0 to 120 minutes. The area under the curve (AUC) of the zero-order moment for fluorescence intensity changes was calculated using Equation (1). A Trolox standard curve was plotted to determine the oxygen radical absorbance capacity (ORAC) value of the samples.
Where f0 is the initial fluorescence value at 0 min and fi the fluorescence read at i min.
3.11. Statistical Analysis
The data were expressed as mean ± standard error. Differences were tested by ANOVA. Differences with P< 0.05 were considered significant and differences with P< 0.01 were considered extremely significant.
4. Conclusions
In this study, an ecofriendly and effective DES system consisting of L-carnitine-1,4-butanediol in the molar ratio of 1:4 with 20% water content was conducted to extract the polyphenols from the leaves of Ampelopsis grossedentata. In order to avoid the overfitting of searching the optimal solution, a genetic algorithm-artificial neural network was employed to make the prediction based on the reasonable experimental data designed by RSM. After the training, validation and test, the optimal conditions were achieved as following: liquid to solid ratio of 35.5 mL/g, ultrasonic power of 697 W and extraction duration of 46 min. With those parameters, the ideal AGPL yield was 15.32% ± 0.12% with higher R2=0.9809 in GA-based ANN model compared to R2=0.9145 in RSM. Considering the lower MSE (0.0279), RMSE (0. 1669) and AAD (0.1336), GA-ANN model exhibited a better performance on the prediction than RSM. Then some more bioactive acids including nonadecanoic acid and neochlorogenic acid were extracted correspondingly with other 21 phenolic substances by carn-but4 system, which were determined by HPLC-Q-TOF-MS/MS. And this kind of extract had potent antioxidant activity with ORAC value of 275.3 ± 0.64 μmol TE/g. Those findings would accelerate the application of polyphenols in the leaves of Ampelopsis grossedentata and highlight the advantages of nonlinear multilayer perception network for the process optimization.
Author Contributions
Conceptualization, C.L., and S.W.; methodology, Y.W.; software, M.L.; validation, W.W.; formal analysis, Y.W.; writing—original draft preparation, X.H.; writing—review and editing, L.H.; supervision, J.J. All authors have read and agreed to the published version of the manuscript.
Funding
This work was supported by financial grants from the project of Zhejiang Provincial Academy and Institute Corporation (No.2024HX09), the National Natural Science Foundation of China (No.31571795) and the research fellowship from the Key Laboratory of State Forest Food Resources Utilization and Quality Control (KLSFFR).
Institutional Review Board Statement
Not appliable.
Informed Consent Statement
Not appliable.
Data Availability Statement
Data are contained within the article.
Conflicts of Interest
The authors declare no conflict of interest.
References
- Zhang, Y.Q.; Wang, T.T.; Wu, S.S.; Zhang, Z.H.; Zhang, Y.; Liu, Q.; Gou, Y.X.; Guan, H.N.; Wang, D.X.; Dong, R.X.; Jiang, H. Vine Tea (Ampelopsis grossedentata)-A Different Kind of Tea Hidden Deep in the Mountains of China: A Comprehensive Review of the Nutritional Profile, Functional Effect, and Diverse Applications as A Novel Raw Material in Food Practices. Trends Food Sci Tech. 2025, 159, 104939. [Google Scholar] [CrossRef]
- Chen, L.; Yin, S.X.; Dong, S.Q.; Xu, P.; Liu, Y.L.; Xiang, X.L.; Huang, Q.; Ye, L. A New Insight into the Key Matrix Components for Aftertaste in Ampelopsis grossedentata (Vine Tea) Infusion: from the Intensity and Duration of Taste Profiles Using Non-targeted Metabolomics and Molecular Simulation. Food Chem. 2024, 450, 139236. [Google Scholar] [CrossRef] [PubMed]
- Chen, J.; Wu, Y.C.; Zou, J.W.; Gao, K. α-Glucosidase Inhibition and Antihyperglycemic Activity of Flavonoids from Ampelopsis grossedentata and the Flavonoid Derivatives. Bioorg. Med. Chem. 2016, 24, 1488–1494. [Google Scholar] [CrossRef] [PubMed]
- Carneiro, R.C.V.; Ye, L.Y.; Baek, N.; Teixeira, G.H.A.; O’Keefe, S.F. Vine Tea (Ampelopsis grossedentata): A Review of Chemical Composition, Functional Properties, and Potential Food Applications. J. Funct. Foods 2021, 76, 104317. [Google Scholar] [CrossRef]
- Jia, C.H.; Li, J.H.; Zhang, M.X.; Ma, W.B.; Zhao, S.M.; Liu, R.; Rong, J.H.; Li, X.H. Antioxidant Properties of the Extracts of Vine Tea (Ampelopsis grossedentata) with the Different Color Characteristics and Inhibition of Rapeseed and Sunflower Oil Oxidation. LWT 2020, 136, 110292. [Google Scholar] [CrossRef]
- Zeng, T.X.; Song, Y.J.; Qi, S.Y.; Zhang, R.Y.; Xu, L.J.; Xiao, P.G. A Comprehensive Review of Vine Tea: Origin, Research on Materia Medica, Phytochemistry and Pharmacology. J. Ethnopharmacol. 2023, 317, 116788. [Google Scholar] [CrossRef]
- Liu, C.Y.; Sun, Y.Y.; Wang, S.Q.; Jia, Y.Q.; Wang, H.X.; Pan, L.C.; Zhu, Z.Y. Dihydromyricetin from Ampelopsis grossedentata and Its Derivatives: Structural Characterization and Anti-hepatocellular Carcinoma Activity. J. Mol. Struct. 2022, 1258, 132677. [Google Scholar] [CrossRef]
- Saimaiti, A.; Huang, S.Y.; Xiong, R.G.; Wu, S.X.; Zhou, D.D.; Yang, Z.J.; Luo, M.; Gan, R.Y.; Li, H.B. Antioxidant Capacities and Polyphenol Contents of Kombucha Beverages Based on Vine Tea and Sweet Tea. Antioxidants 2022, 11, 1655. [Google Scholar] [CrossRef]
- Li, X.L.; Li, B.Y.; Meng, X.Y.; Yu, F.; Yu, X.; Zhao, W.Q.; Wang, Y.J.; Gao, H.Q.; Cheng, M.; Zhong, L.H. Integrating Network Pharmacology and Experimental Validation to Reveal the Mechanism of Vine Grape Tea Polyphenols on Hyperuricemia-Induced Renal Injury in Mice. J. Med. Food. 2024, 27, 312–329. [Google Scholar] [CrossRef]
- Wang, L.L.; Zhou, Y.F.; Wang, Y.B.; Qin, Y.C.; Liu, B.T.; Bai, M.G. Two Green Approaches for Extraction of Dihydromyricetin from Chinese Vine Tea Using β-Cyclodextrin-based and Ionic Liquid-based Ultrasonic-assisted Extraction Methods. Food Bioprod Process. 2019, 116, 1–9. [Google Scholar] [CrossRef]
- Makris, D.P.; Lalas, S. Glycerol and Glycerol-Based Deep Eutectic Mixtures as Emerging Green Solvents for Polyphenol Extraction: The Evidence So Far. Molecules 2020, 25, 5842. [Google Scholar] [CrossRef] [PubMed]
- Zannou, O.; Pashazadeh, H.; Ghellam, M.; Koca, I.; Kaddour, A.A.; Leriche, F. Appraisal of Phenolic Compounds, Antioxidant Activity and in Vitro Gastrointestinal Digestion of Borage (Echium amoenum) Flowers Using Natural Deep Eutectic Solvent (NADES). Biomass Convers. Biorefin. 2024, 14, 8523–8535. [Google Scholar] [CrossRef]
- Serna-Vázquez, J.; Ahmad, M.Z.; Boczkaj, G.; Castro-Muñoz, R. Latest Insights on Novel Deep Eutectic Solvents (DES) for Sustainable Extraction of Phenolic Compounds from Natural Sources. Molecules 2021, 26, 5037. [Google Scholar] [CrossRef]
- Liu, X.Y.; Ou, H.; Gregersen, H.; Zou, J. Deep Eutectic Solvent-based Ultrasound-assisted Extraction of Polyphenols from Cosmos Sulphureus. JARMAP. 2023, 32, 100444. [Google Scholar] [CrossRef]
- Huang, D.T.; Chen, L.R.; Chen, X.F.; Huang, X.Y.; Yang, Y.R.; Liu, J.; Lin, Y.; Liu, Y.J.; Li, H. Supramolecular Deep Eutectic Solvents as Green Media for Efficient Extraction of Tea Polyphenols and Its Application in Bio-active Film. Food Chem. 2025, 465, 141904. [Google Scholar] [CrossRef] [PubMed]
- Champati, B.B.; Padhiari, B.M.; Ray, A.; Halder, T.; Jena, S.; Sahoo, A.; Kar, B.; Kamila, P.K.; Panda, P.C.; Ghosh, B.; Nayak, S. Application of a Multilayer Perceptron Artificial Neural Network for the Prediction and Optimization of the Andrographolide Content in Andrographis paniculata. Molecules 2022, 27, 2765. [Google Scholar] [CrossRef] [PubMed]
- Alrugaibah, M.; Yagiz, Y.; Gu, L.W. Use Natural Deep Eutectic Solvents as Efficient Green Reagents to Extract Procyanidins and Anthocyanins from Cranberry Pomace and Predictive Modeling by RSM and Artificial Neural Networking. Sep. Purif. Technol. 2021, 255, 117720. [Google Scholar] [CrossRef]
- Yu, H.C.; Huang, S.M.; Lin, W.M.; Kuo, C.H.; Shieh, C.J. Comparison of Artificial Neural Networks and Response Surface Methodology towards an Efficient Ultrasound-Assisted Extraction of Chlorogenic Acid from Lonicera Japonica. Molecules 2019, 24, 2304. [Google Scholar] [CrossRef]
- Li, C.Q.; Cui, Y.P.; Lu, J.; Liu, C.Y.; Chen, S.T.; Ma, C.Y.; Liu, Z.H.; Wang, J.M.; Kang, W.Y. Ionic Liquid-Based Ultrasonic-Assisted Extraction Coupled with HPLC and Artificial Neural Network Analysis for Ganoderma lucidum. Molecules 2020, 25, 1309. [Google Scholar] [CrossRef]
- Ramírez-Brewer, D.; Quintana, S.E.; García-Zapateiro, L.A. Modeling and Optimization of Microwave-assisted Extraction of Total Phenolics Content from Mango (Mangifera indica) Peel Using Response Surface Methodology (RSM) and Artificial Neural Networks (ANN). Food Chem X 2024, 22, 101420. [Google Scholar] [CrossRef]
- Zhang, X.Y.; Su, J.Q.; Chu, X.L.; Wang, X.Y. A Green Method of Extracting and Recovering Flavonoids from Acanthopanax senticosus Using Deep Eutectic Solvents. Molecules 2022, 27, 923. [Google Scholar] [CrossRef]
- Dai, Y.T.; Witkamp, G.J.; Verpoorte, R.; Choi, Y.H. Tailoring Properties of Natural Deep Eutectic Solvents with Water to Facilitate Their Applications. Food Chem 2015, 187, 14–19. [Google Scholar] [CrossRef] [PubMed]
- Liu, Y.; Friesen, J.B.; Mcalpine, J.B.; Lankin, D.C.; Chen, S.N.; Pauli, G.F. Natural Deep Eutectic Solvents: Properties, Applications, and Perspectives. J. Nat. Prod. 2018, 679–690. [Google Scholar] [CrossRef] [PubMed]
- Martins, M.A.R.; Pinho, S.P.; Coutinho, J.A.P. Insights into the Nature of Eutectic and Deep Eutectic Mixtures. J. Solution Chem. 2019, 48, 962–982. [Google Scholar] [CrossRef]
- Li, Z.; Lee, P.I. Investigation on Drug Solubility Enhancement Using Deep Eutectic Solvents and Their Derivatives. Int. J. Pharm. 2016, 505, 283–288. [Google Scholar] [CrossRef]
- Zdanowicz, M.; Wilpiszewska, K.; Spychaj, T. Deep Eutectic Solvents for Polysaccharides Processing: A review. Carbohyd Polym. 2018, 200, 361–380. [Google Scholar] [CrossRef]
- Zhang, L.J.; Wang, M.S. Optimization of Deep Eutectic Solvent-based Ultrasound-assisted Extraction of Polysaccharides from Dioscorea opposite Thunb. Int. J. Biol. Macromol. 2017, 95, 675–681. [Google Scholar] [CrossRef]
- Montes, L.; Gisbert, M.; Hinojosa, I.; Sineiro, J.; Moreira, R. Impact of Drying on the Sodium Alginate Obtained after Polyphenols Ultrasound-assisted Extraction from Ascophyllum Nodosum Seaweeds. Carbohydr. Polym. 2021, 272, 118455. [Google Scholar] [CrossRef]
- Bashir, I.; Dar, A.H.; Dash, K.K.; Pandey, V.K.; Fayaz, U.; Shams, R.; Srivastava, S.; Singh, R. Deep Eutectic Solvents for Extraction of Functional Components from Plant-based Products: A Promising Approach. Sustainable Chem. Pharm. 2023, 33, 101102. [Google Scholar] [CrossRef]
- Vilkhu, K.; Mawson, R.; Simons, L.; Bates, D. Applications and Opportunities for Ultrasound Assisted Extraction in the Food Industry-A Review. IFSET. 2008, 9, 161–169. [Google Scholar] [CrossRef]
- Marianne, L.C.; Lucía, A.G.; de Jesús, M.S.M.; Leonardo, H.M.E.; Mendoza-Sánchez, M. Optimization of the Green Extraction Process of Antioxidants Derived from Grape Pomace. Sustainable Chem. Pharm. 2024, 37, 101396. [Google Scholar] [CrossRef]
- Chemat, F.; Huma, Z.; Khan, M.K. Applications of Ultrasound in Food Technology: Processing, Preservation and Extraction. Ultrason Sonochem. 2011, 18, 813–835. [Google Scholar] [CrossRef] [PubMed]
- Pätzold, M.; Siebenhaller, S.; Kara, S.; Liese, A.; Syldatk, C.; Holtmann, D. Deep Eutectic Solvents as Efficient Solvents in Biocatalysis. Trends Biotechnol. 2019, 37, 943–959. [Google Scholar] [CrossRef] [PubMed]
- Tang, Z.H.; Xu, Y.; Cai, C.Y.; Tan, Z.J. Extraction of Lycium barbarum Polysaccharides Using Temperature-switchable Deep Eutectic Solvents: A Sustainable Methodology for Recycling and Reuse of the Extractant. J. Mol. Liq. 2023, 383, 122063. [Google Scholar] [CrossRef]
- Suleiman, J.; Shamsudin, R.; Hamzah, M.H.; Basri, M.S.M.; Jimoh, K.A. Extraction Optimization and Characterization of Durian (Durio zibethinus) Rind Pectin Extracted by Subcritical Water. Food Chem. 2025, 474, 143123. [Google Scholar] [CrossRef]
- Chen, Y.; Sun, X.Q.; Fang, L.T.; Jiang, X.X.; Zhang, X.N.; Ge, Z.J.; Wang, R.B.; Wang, C.Q. Optimization of Ultrasound-Assisted Extraction of Polyphenols from Ilex latifolia Using Response Surface Methodology and Evaluation of Their Antioxidant Activity. Molecules 2022, 27, 3999. [Google Scholar] [CrossRef]
- Jiao, P.F.; He, X.M.; Ma, S.H.; Wang, S.P.; Niu, Q.H. Ultrasonic-Assisted Extraction of Antioxidants from Perilla frutescens Leaves Based on Tailor-Made Deep Eutectic Solvents: Optimization and Antioxidant Activity. Molecules 2023, 28, 7554. [Google Scholar] [CrossRef]
- Beeler, N.; Hühn, T.; Rohn, S.; Colombi, R. Development and Optimization of a Cocoa Extraction Treatment by Means of the Response Surface Methodology (RSM) and Artificial Neural Network (ANN). Ind. Crop Prod. 2024, 222, 119610. [Google Scholar] [CrossRef]
- Gammoudi, N.; Mabrouk, M.; Bouhemda, T.; Nagaz, K.; Ferchichi, A. Modeling and Optimization of Capsaicin Extraction from Capsicum annuum L. Using Response Surface Methodology (RSM), Artificial Neural Network (ANN), and Simulink Simulation. Ind. Crop Prod. 2021, 171, 113869. [Google Scholar] [CrossRef]
- Xue, H.K.; Xu, J.Q.; Zhang, J.L.; Wei, Y.N.; Cai, X.; Tan, J.Q. Modeling, Optimization, Purification, and Characterization of Polysaccharide from Lilium lancifolium Thunb. LWT 2022, 162, 113491. [Google Scholar] [CrossRef]
- Wu, J.K.; Yang, F.; Guo, L.Y.; Sheng, Z.L. Modeling and Optimization of Ellagic Acid from Chebulae Fructus Using Response Surface Methodology Coupled with Artificial Neural Network. Molecules 2024, 29, 3953. [Google Scholar] [CrossRef] [PubMed]
- Chen, H.Y.; Wang, B.; Li, J.P.; Xu, J.; Zeng, J.S.; Gao, W.H.; Chen, K.F. Comparative Study on the Extraction Efficiency, Characterization, and Bioactivities of Bletilla striata Polysaccharides Using Response Surface Methodology (RSM) and Genetic Algorithm-artificial Neural Network (GA-ANN). Int. J. Biol. Macromol. 2022, 226, 982–995. [Google Scholar] [CrossRef] [PubMed]
- Subramani, V.; Tomer, V.; Balamurali, G.; Mansingh, P. Artificial Neural Network in Optimization of Bioactive Compound Extraction: Recent Trends and Performance Comparison with Response Surface Methodology. Anal. Sci. 2025, 41, 101–117. [Google Scholar] [CrossRef]
- Xue, H.K.; Wang, W.L.; Wu, J.P.; Xie, K.F.; Ge, S.Q.; Tan, J.Q. Ultrasound Assisted Aqueous Two-phase Extraction of Polysaccharides from Corn Stigma: Process Optimization, Structure Characterization, and Immunomodulatory Activity. IFSET 2024, 91, 103531. [Google Scholar] [CrossRef]
- Wang, X.Y.; Liu, X.Y.; Shi, N.W.; Zhang, Z.Y.; Chen, Y.M.; Yan, M.Y.; Li, Y.P. Response Surface Methodology Optimization and HPLC-ESI-QTOF-MS/MS Analysis on Ultrasonic-assisted Extraction of Phenolic Compounds from Okra (Abelmoschus esculentus) and Their Antioxidant Activity. Food Chem. 2023, 405, 134966. [Google Scholar] [CrossRef]
- Cao, G.H.; Alessio, H.M.; Cutler, R.G. Oxygen-radical Absorbance Capacity Assay for Antioxidants. Free Radic Biol Med. 1993, 14, 303–311. [Google Scholar] [CrossRef]
Figure 1.
Comparative effect of different formula on the extraction yield of AGPL (A); Effect of molar ratio (B); Effect of DES water content (C). (Bars with different letters differ significantly at p<0.05).
Figure 1.
Comparative effect of different formula on the extraction yield of AGPL (A); Effect of molar ratio (B); Effect of DES water content (C). (Bars with different letters differ significantly at p<0.05).
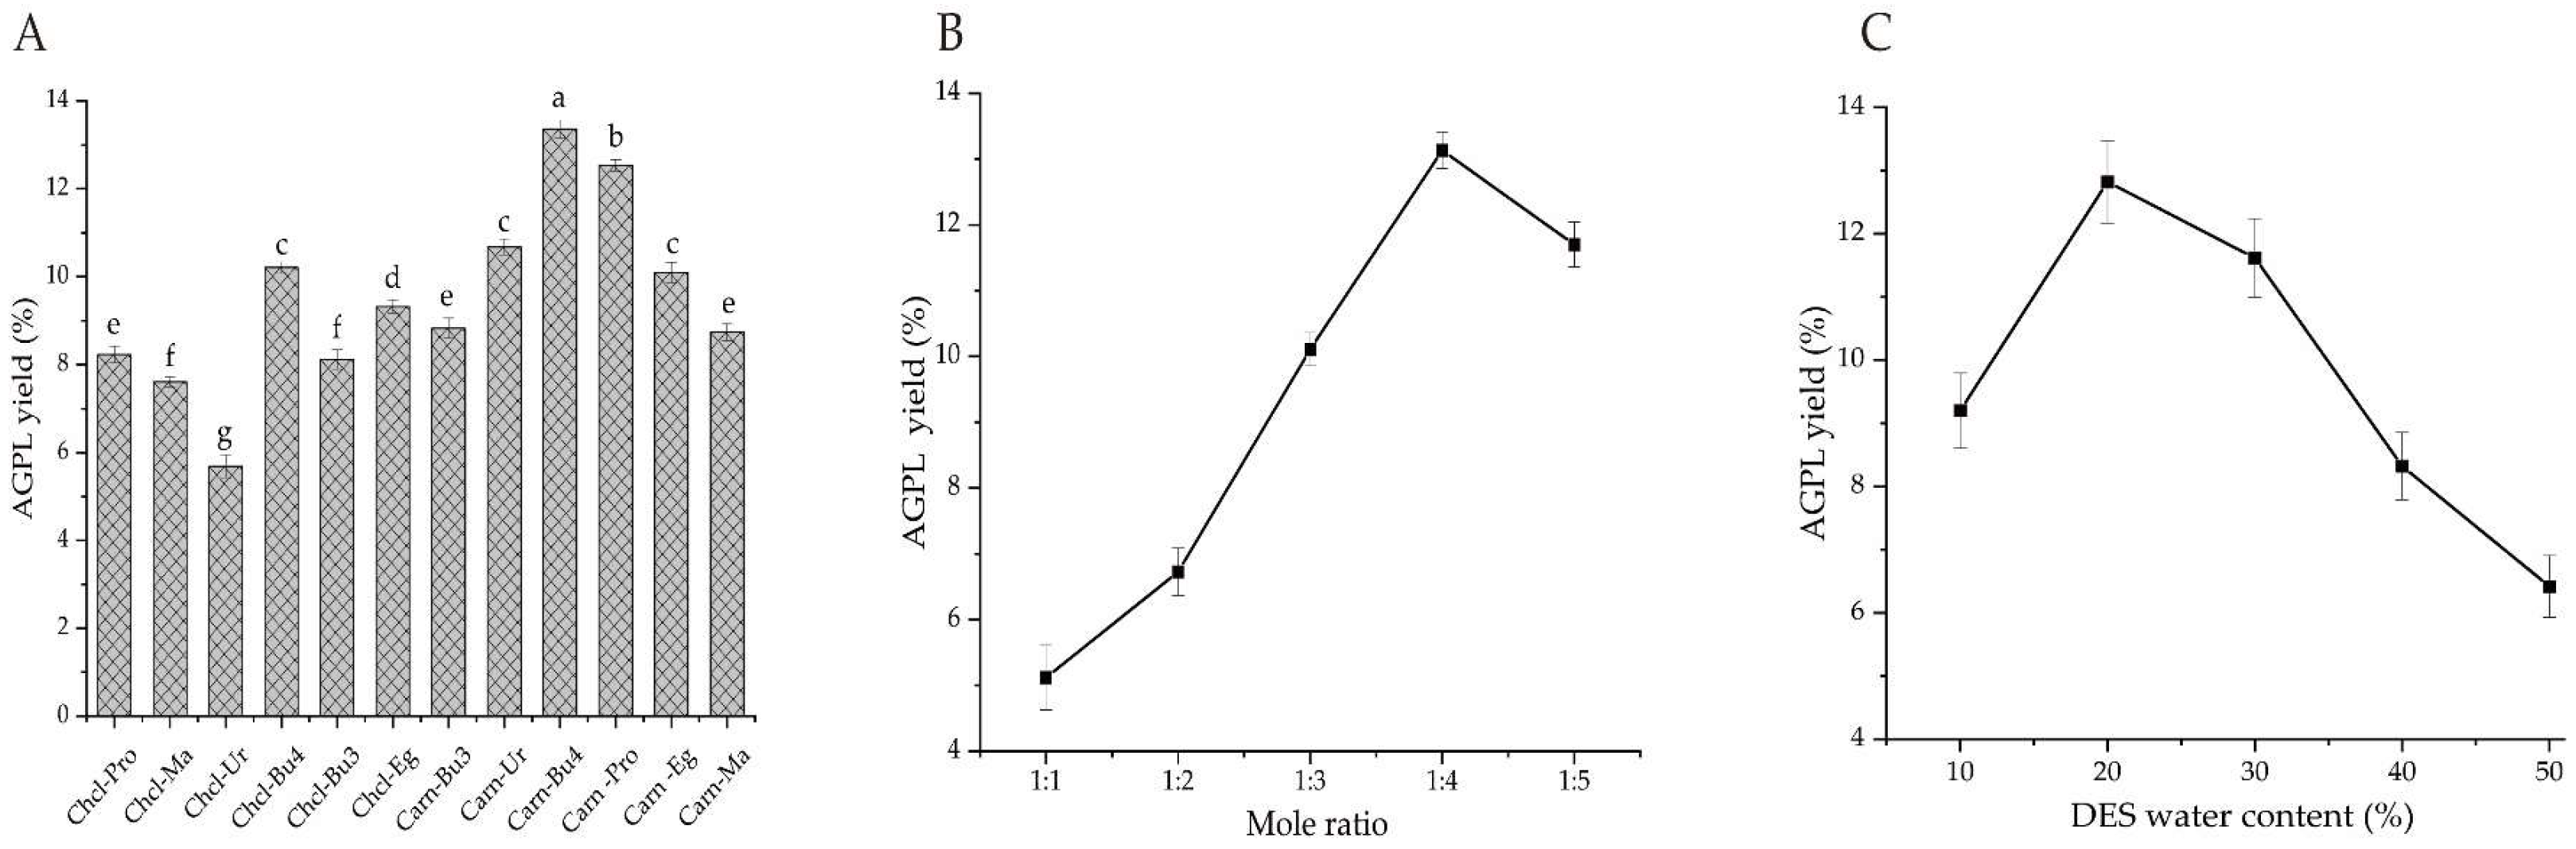
Figure 2.
Single factors on the AGPL yield by DES-based extraction. (A) Effect of liquid to solid ratio; (B) Effect of during of extraction; (C) Effect pf ultrasonic power; (D) Effect of extraction temperature.
Figure 2.
Single factors on the AGPL yield by DES-based extraction. (A) Effect of liquid to solid ratio; (B) Effect of during of extraction; (C) Effect pf ultrasonic power; (D) Effect of extraction temperature.
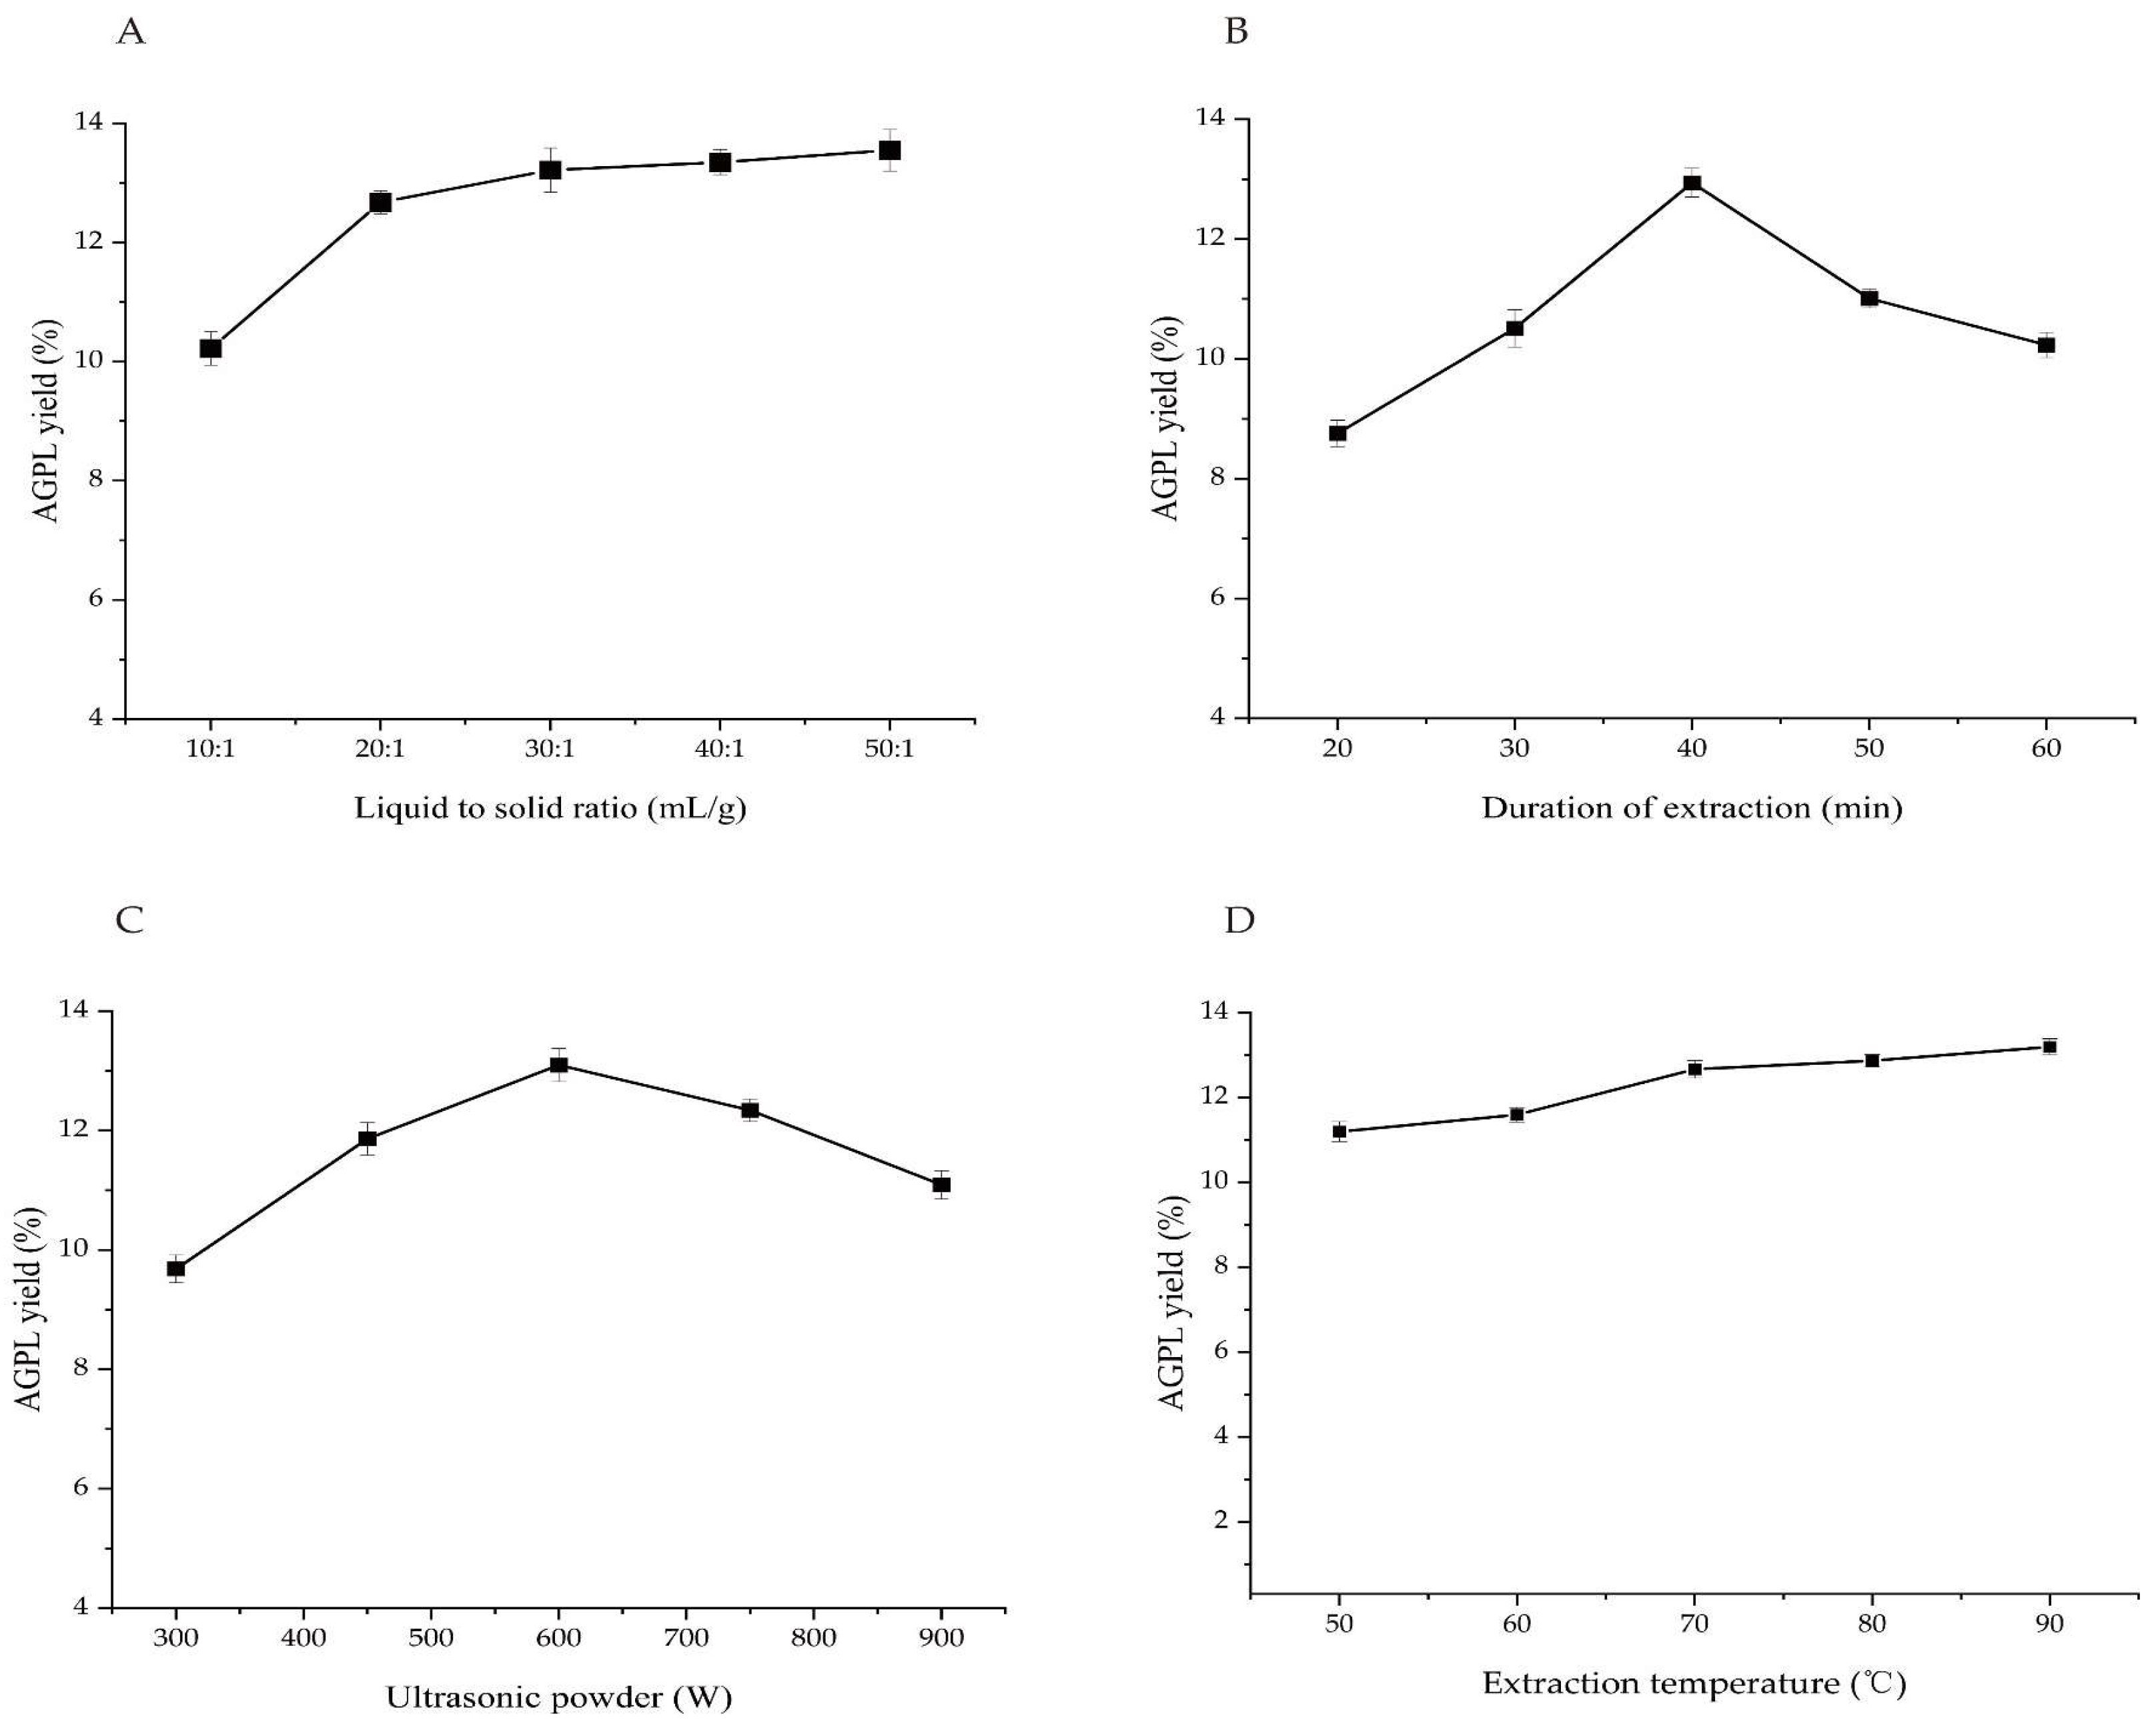
Figure 3.
The effects of the interactions among three experimental factors on AGPL yield: three-dimensional surface plots (A, C and E) and two-dimensional contour maps (B, D and F).
Figure 3.
The effects of the interactions among three experimental factors on AGPL yield: three-dimensional surface plots (A, C and E) and two-dimensional contour maps (B, D and F).
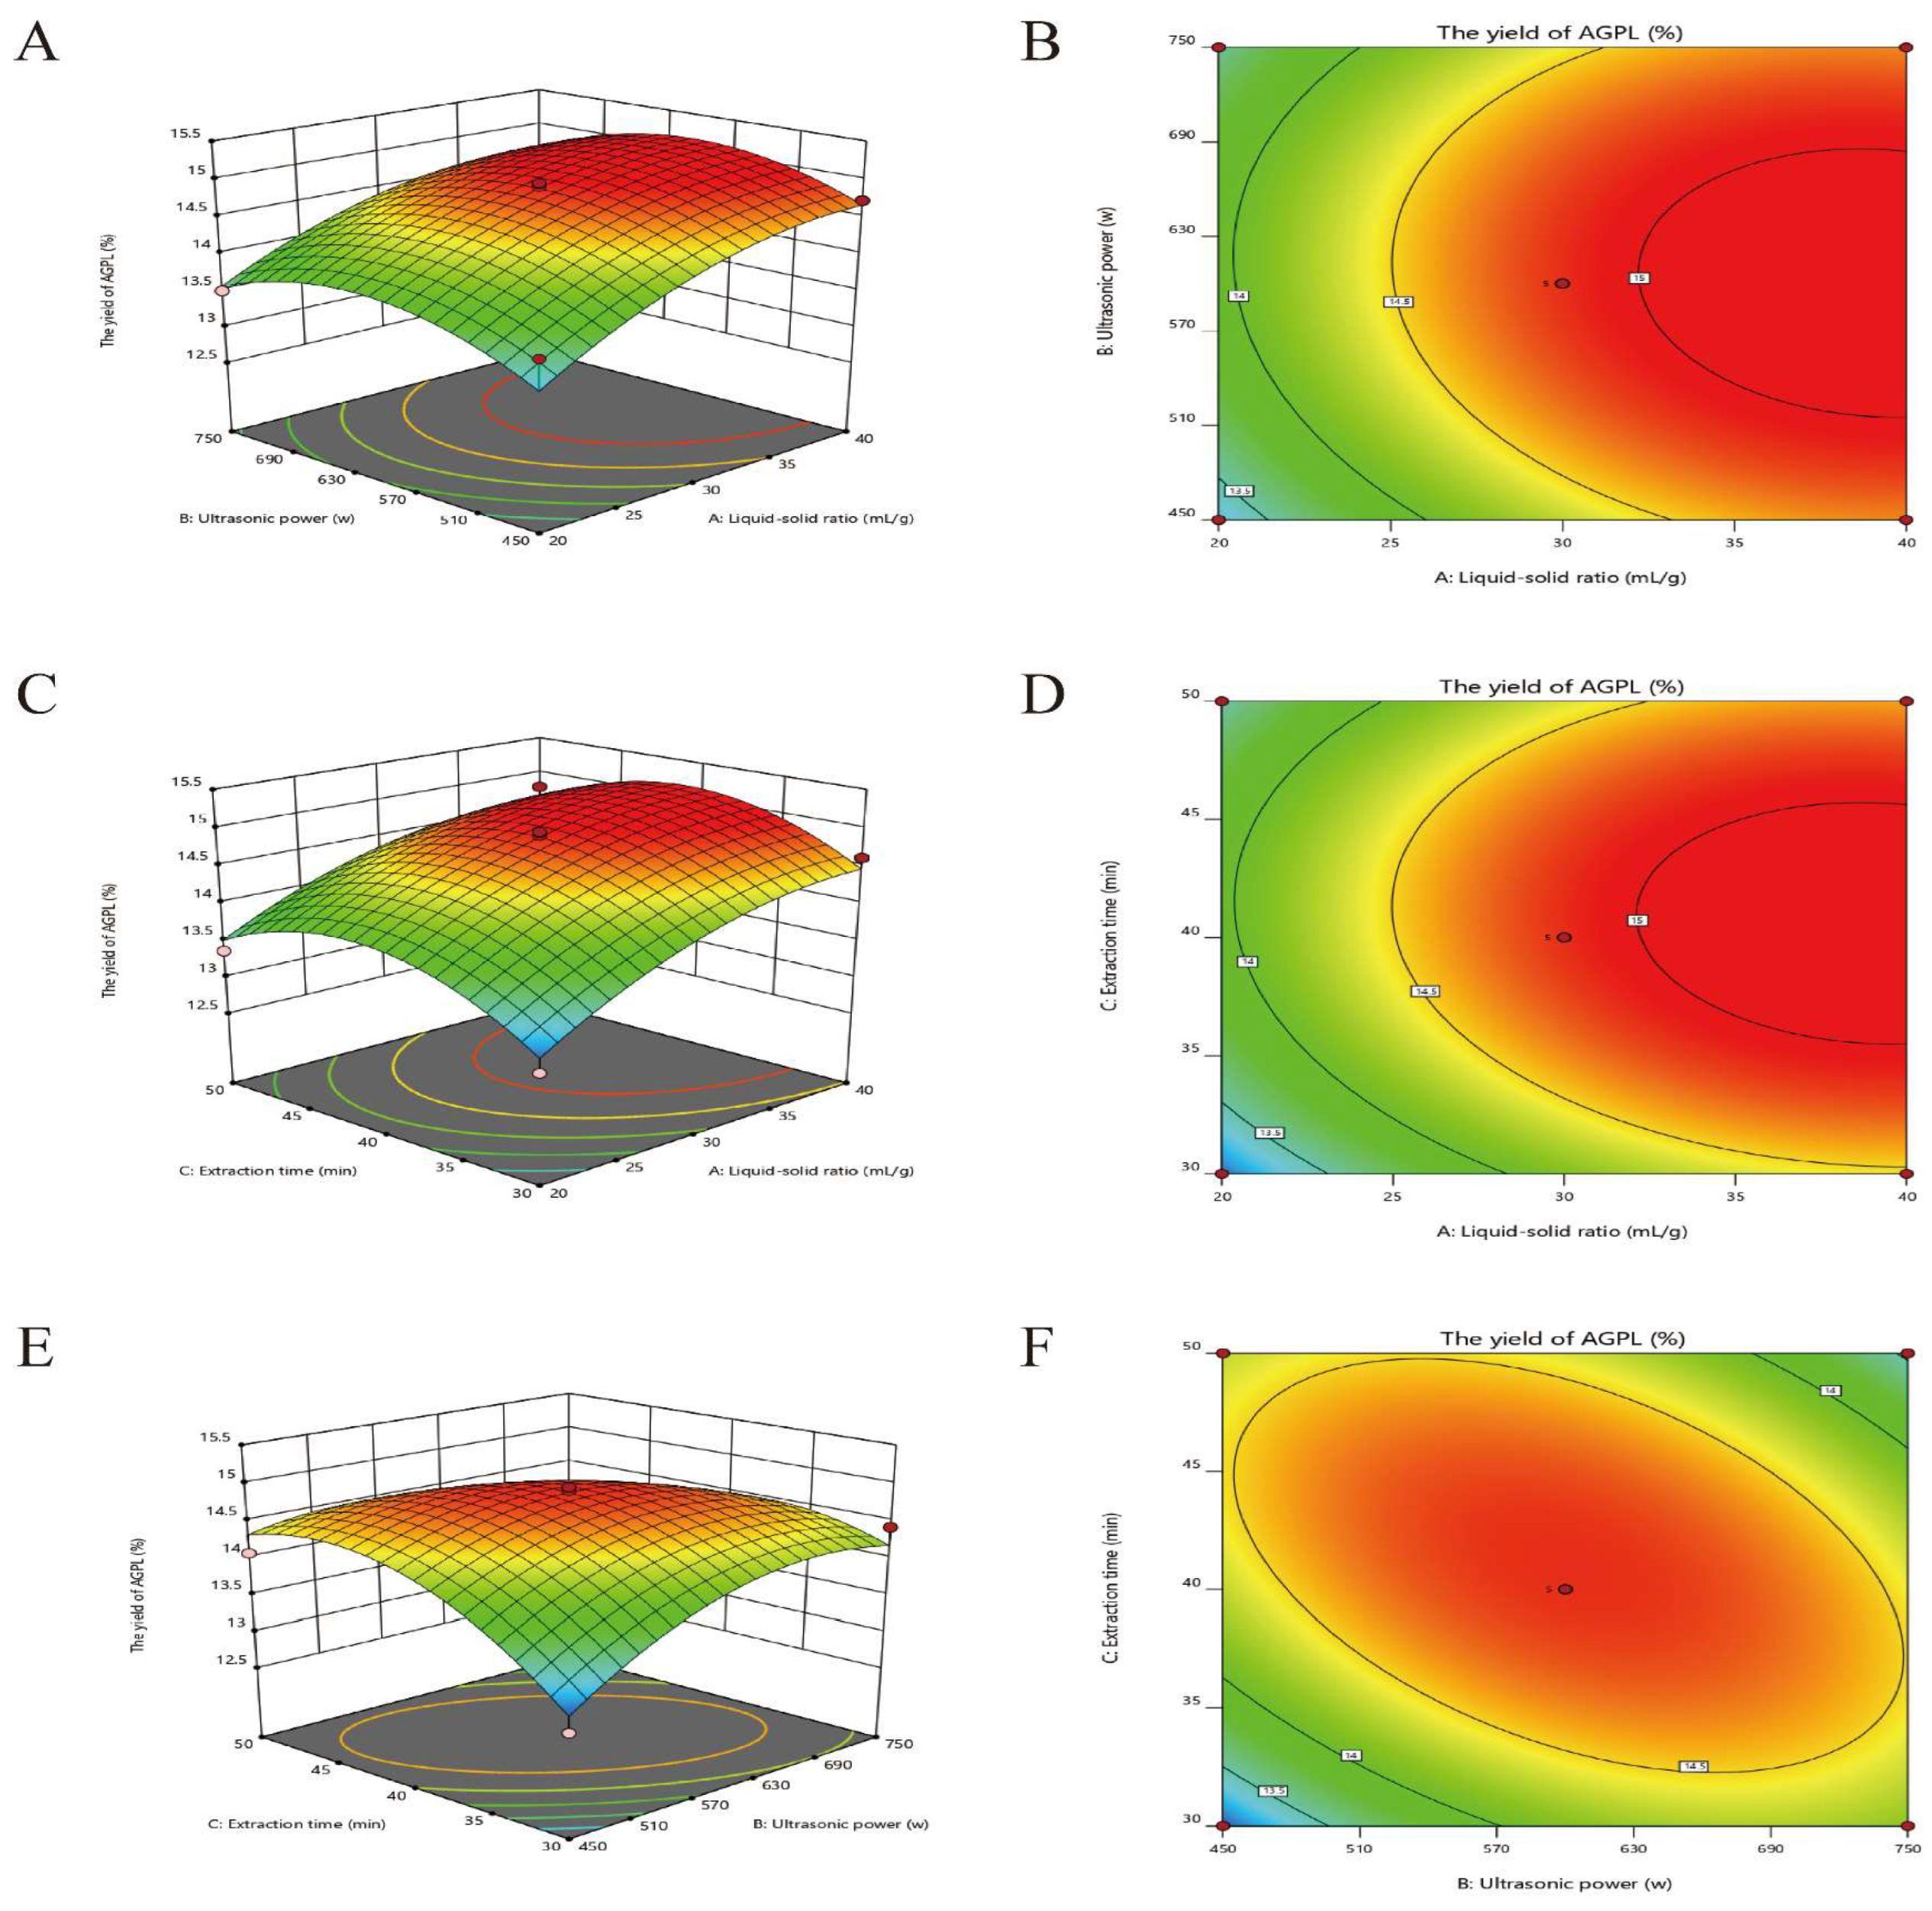
Figure 4.
The relationship between MSE and the number of hidden neurons (A), the performance of ANN model for training, validation and test (B), the error histogram with 20 bins (C), the training state (D) and regression analysis (E).
Figure 4.
The relationship between MSE and the number of hidden neurons (A), the performance of ANN model for training, validation and test (B), the error histogram with 20 bins (C), the training state (D) and regression analysis (E).
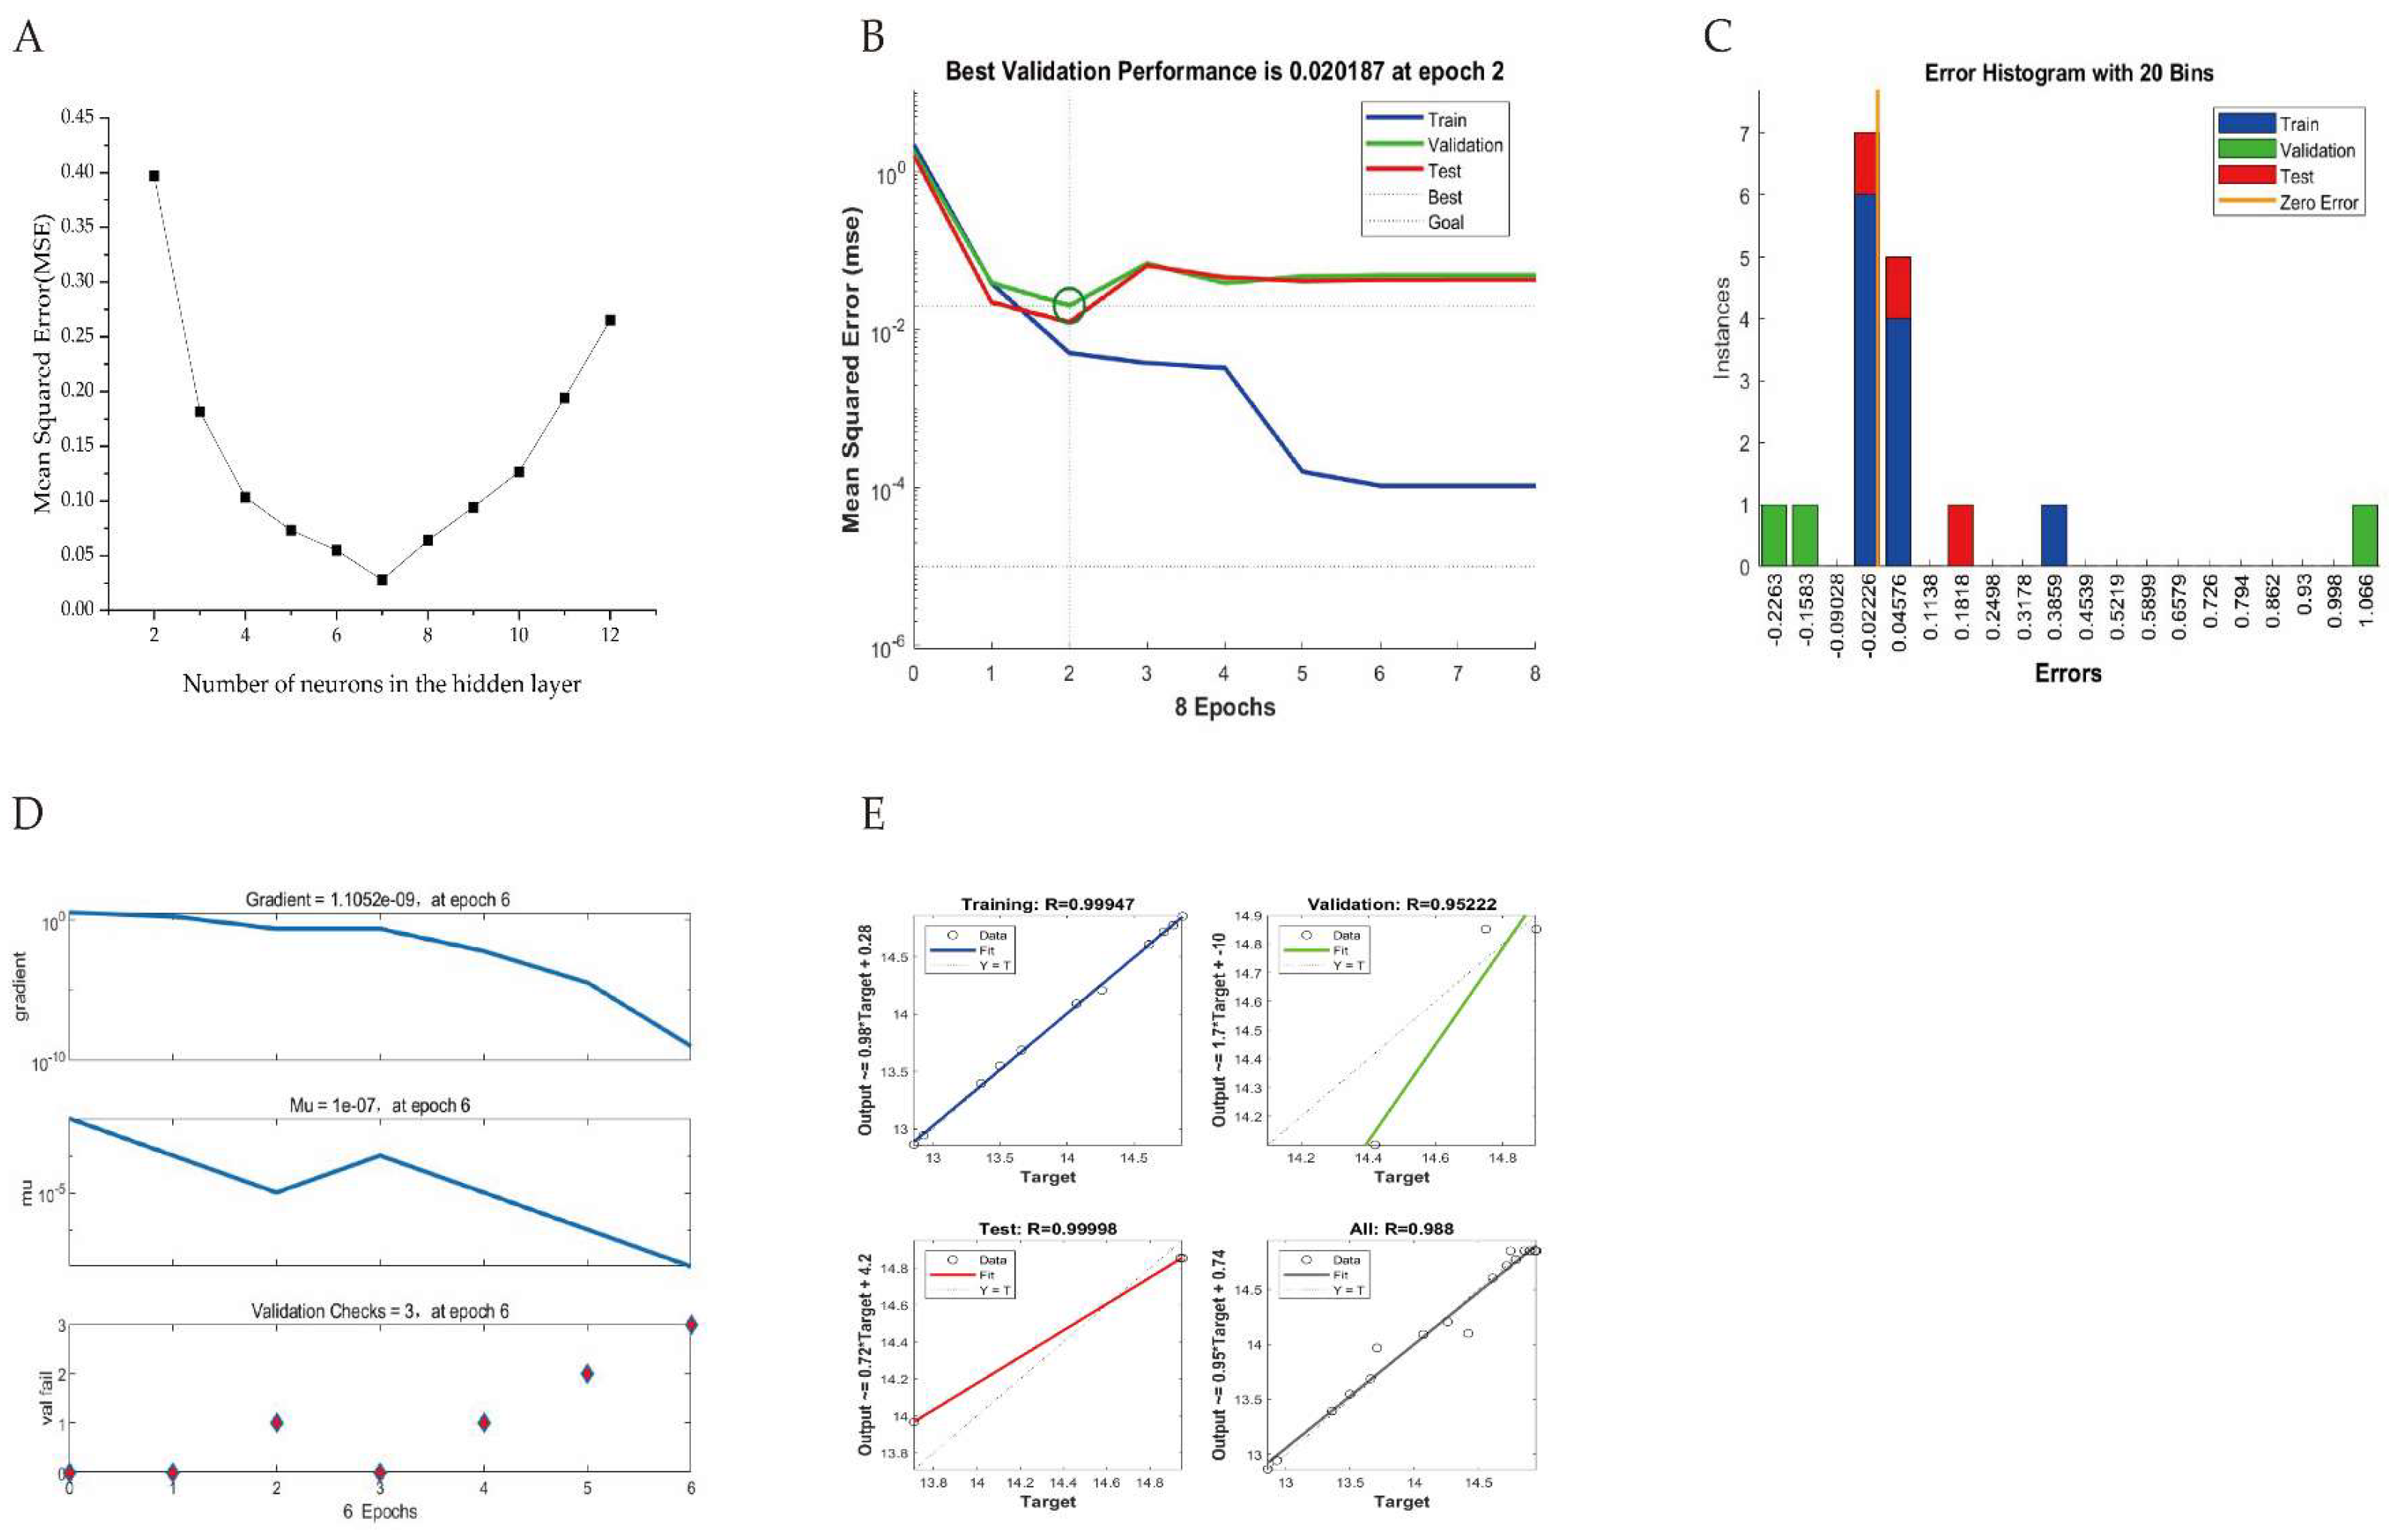
Figure 5.
The optimization process by GA-oriented ANN(A); the relationship between the predicted and actual values provided by RSM and ANN(B); the matching plot between two methods and all datasets (C).
Figure 5.
The optimization process by GA-oriented ANN(A); the relationship between the predicted and actual values provided by RSM and ANN(B); the matching plot between two methods and all datasets (C).
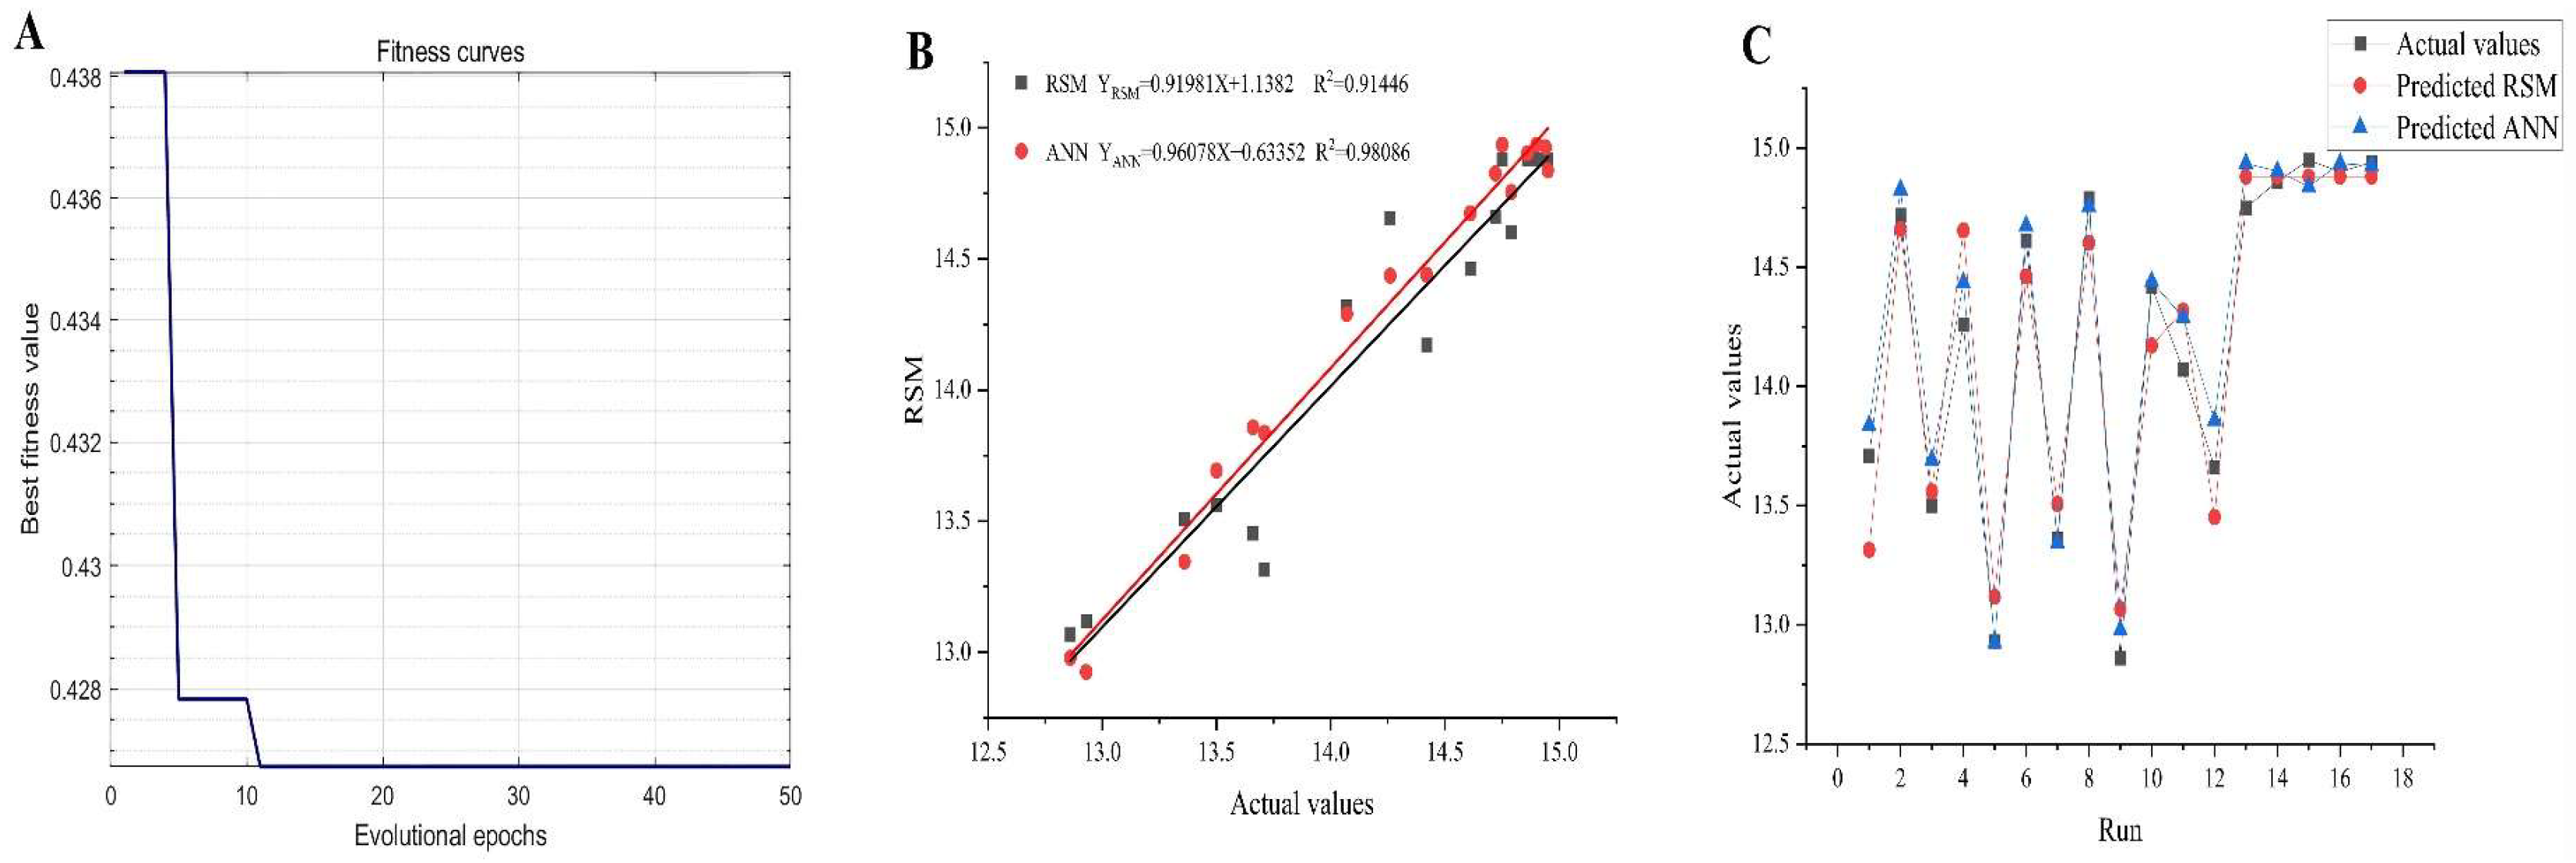
Figure 6.
Total ion profile of AGPL detected by UPLC-ESI-QTOF-MS/MS determination.
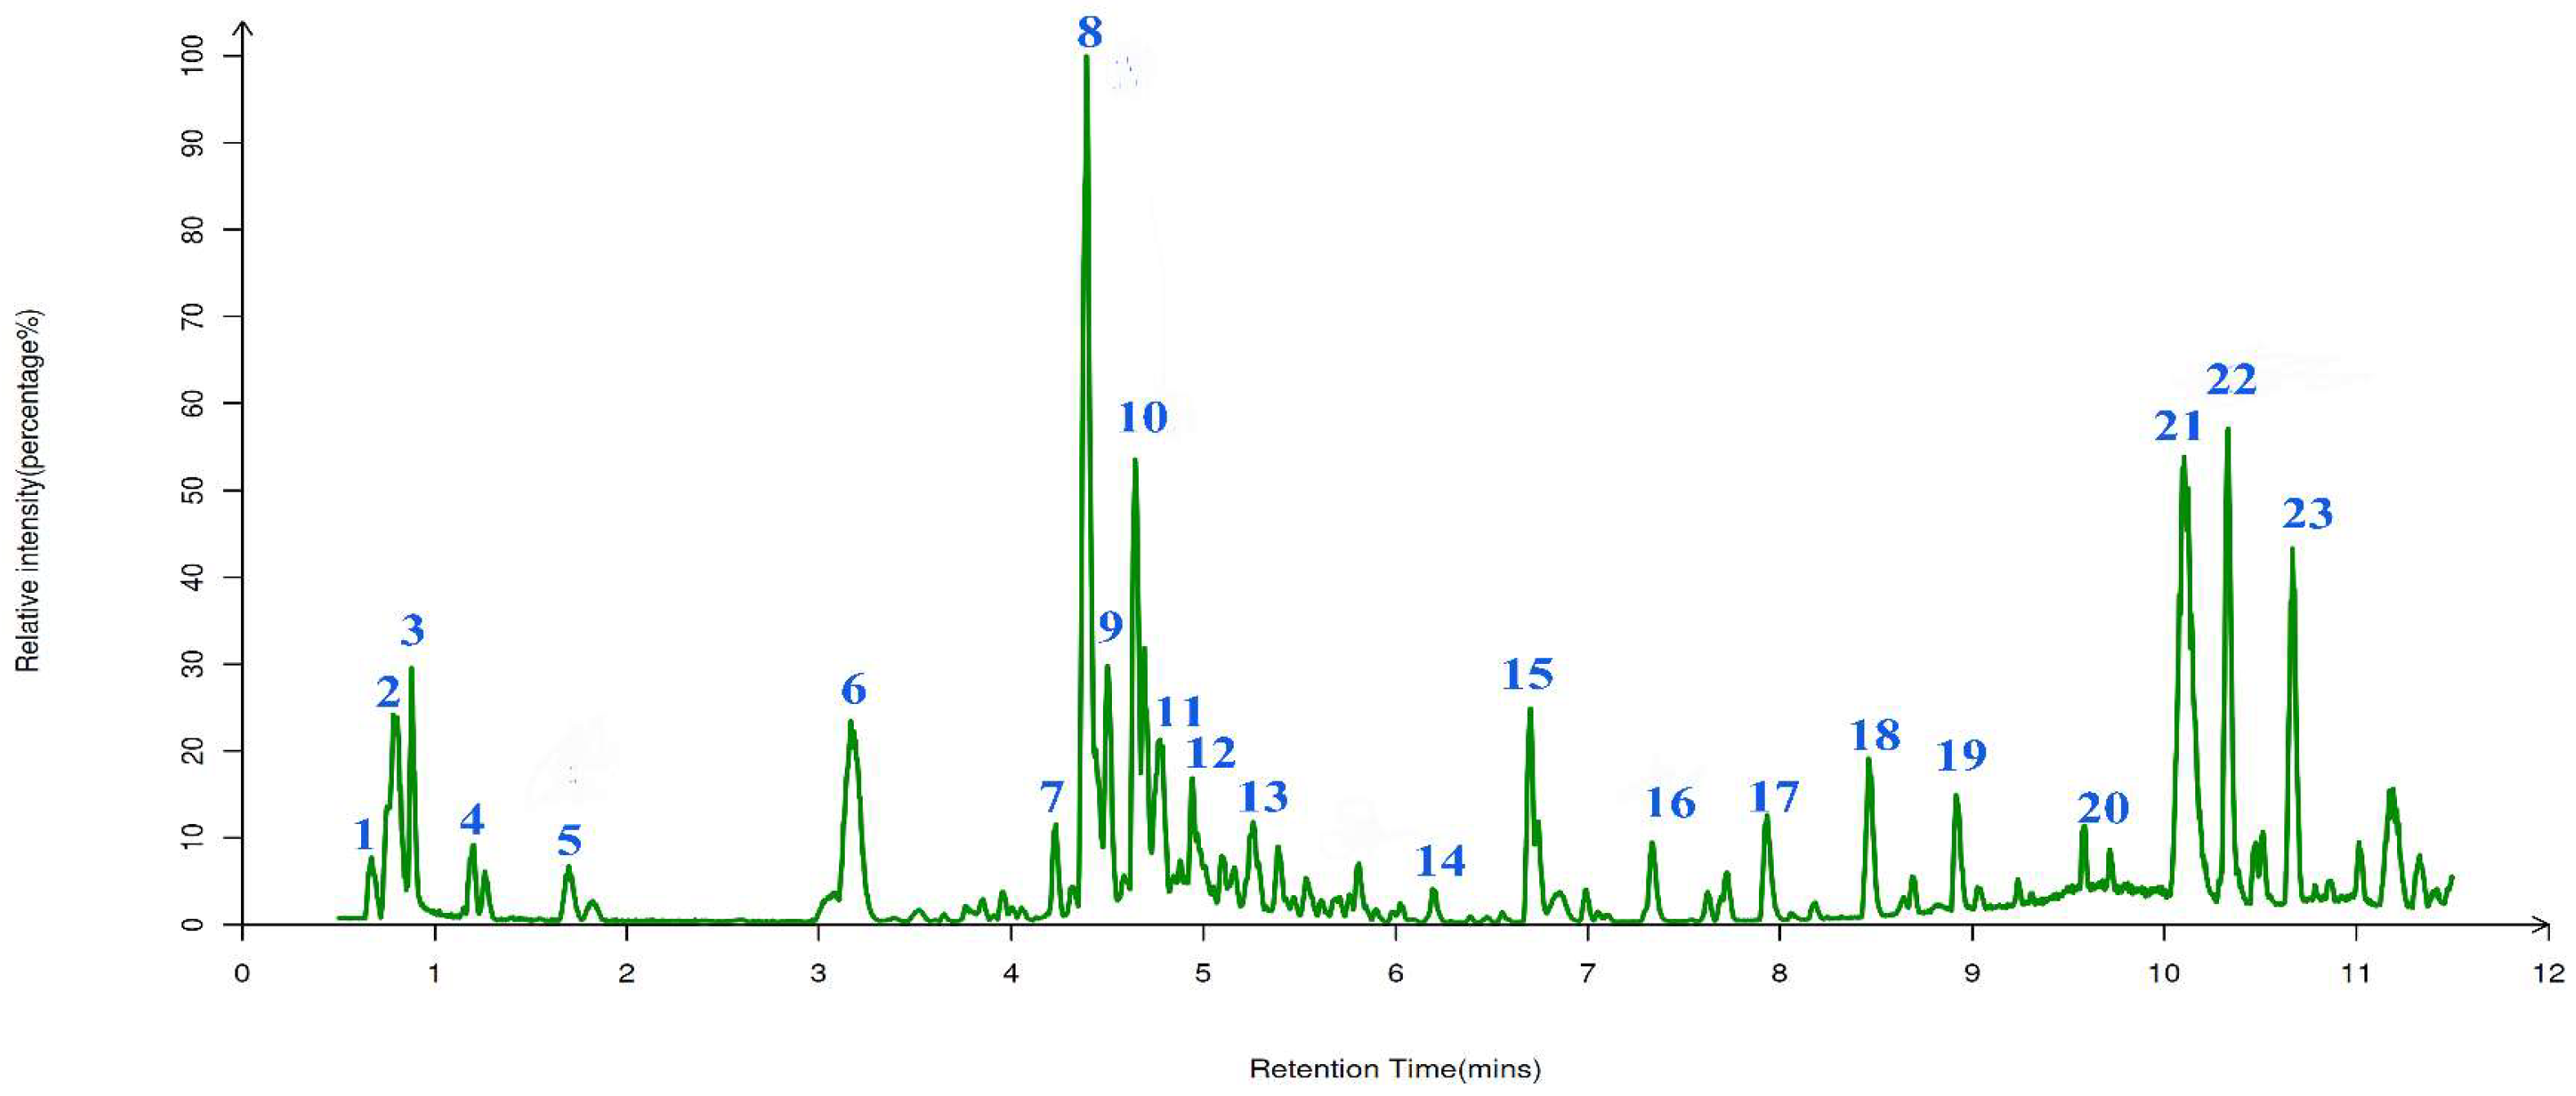
Figure 7.
Fluorescence consumption induced by AAPH-derived radicals in the presence of Trolox ranging from 6.25 to 50 μM and AGPL at pH 7.4 phosphate buffer.
Figure 7.
Fluorescence consumption induced by AAPH-derived radicals in the presence of Trolox ranging from 6.25 to 50 μM and AGPL at pH 7.4 phosphate buffer.
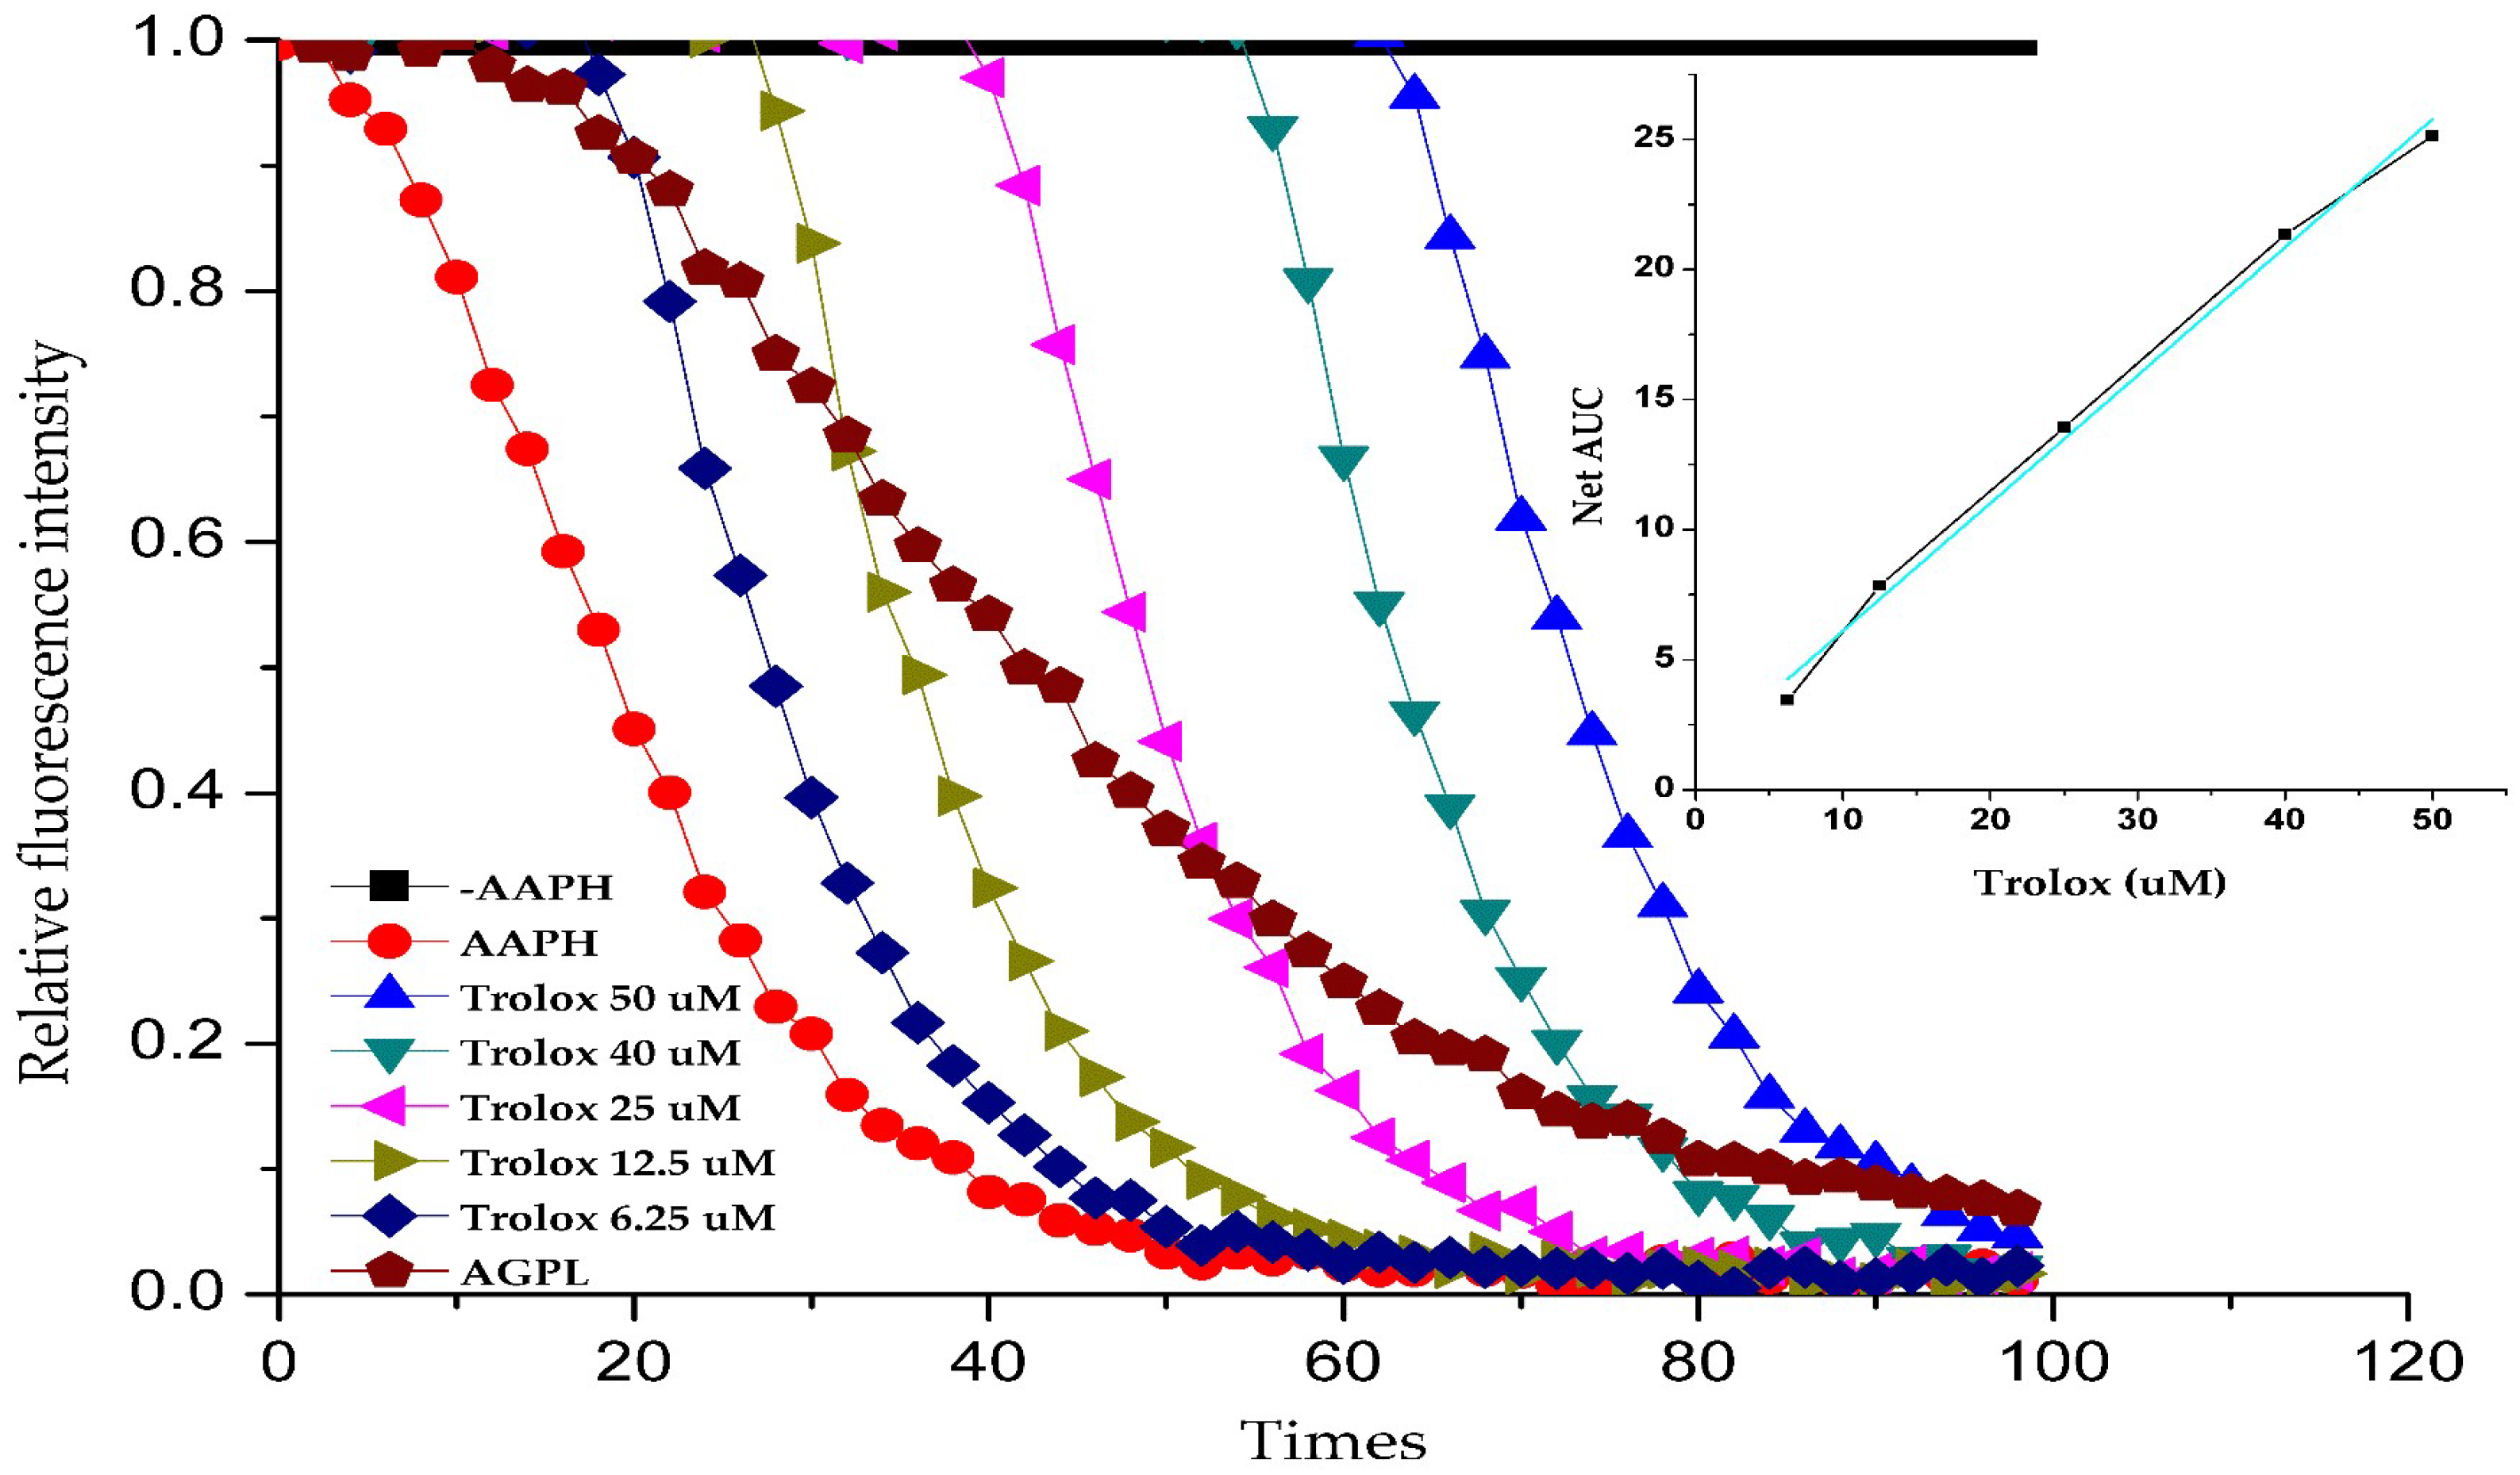
Figure 8.
The topology of ANN architecture (input layer, hidden layer and output layers) in red framework followed by the GA-based optimization (Blue parts).
Figure 8.
The topology of ANN architecture (input layer, hidden layer and output layers) in red framework followed by the GA-based optimization (Blue parts).
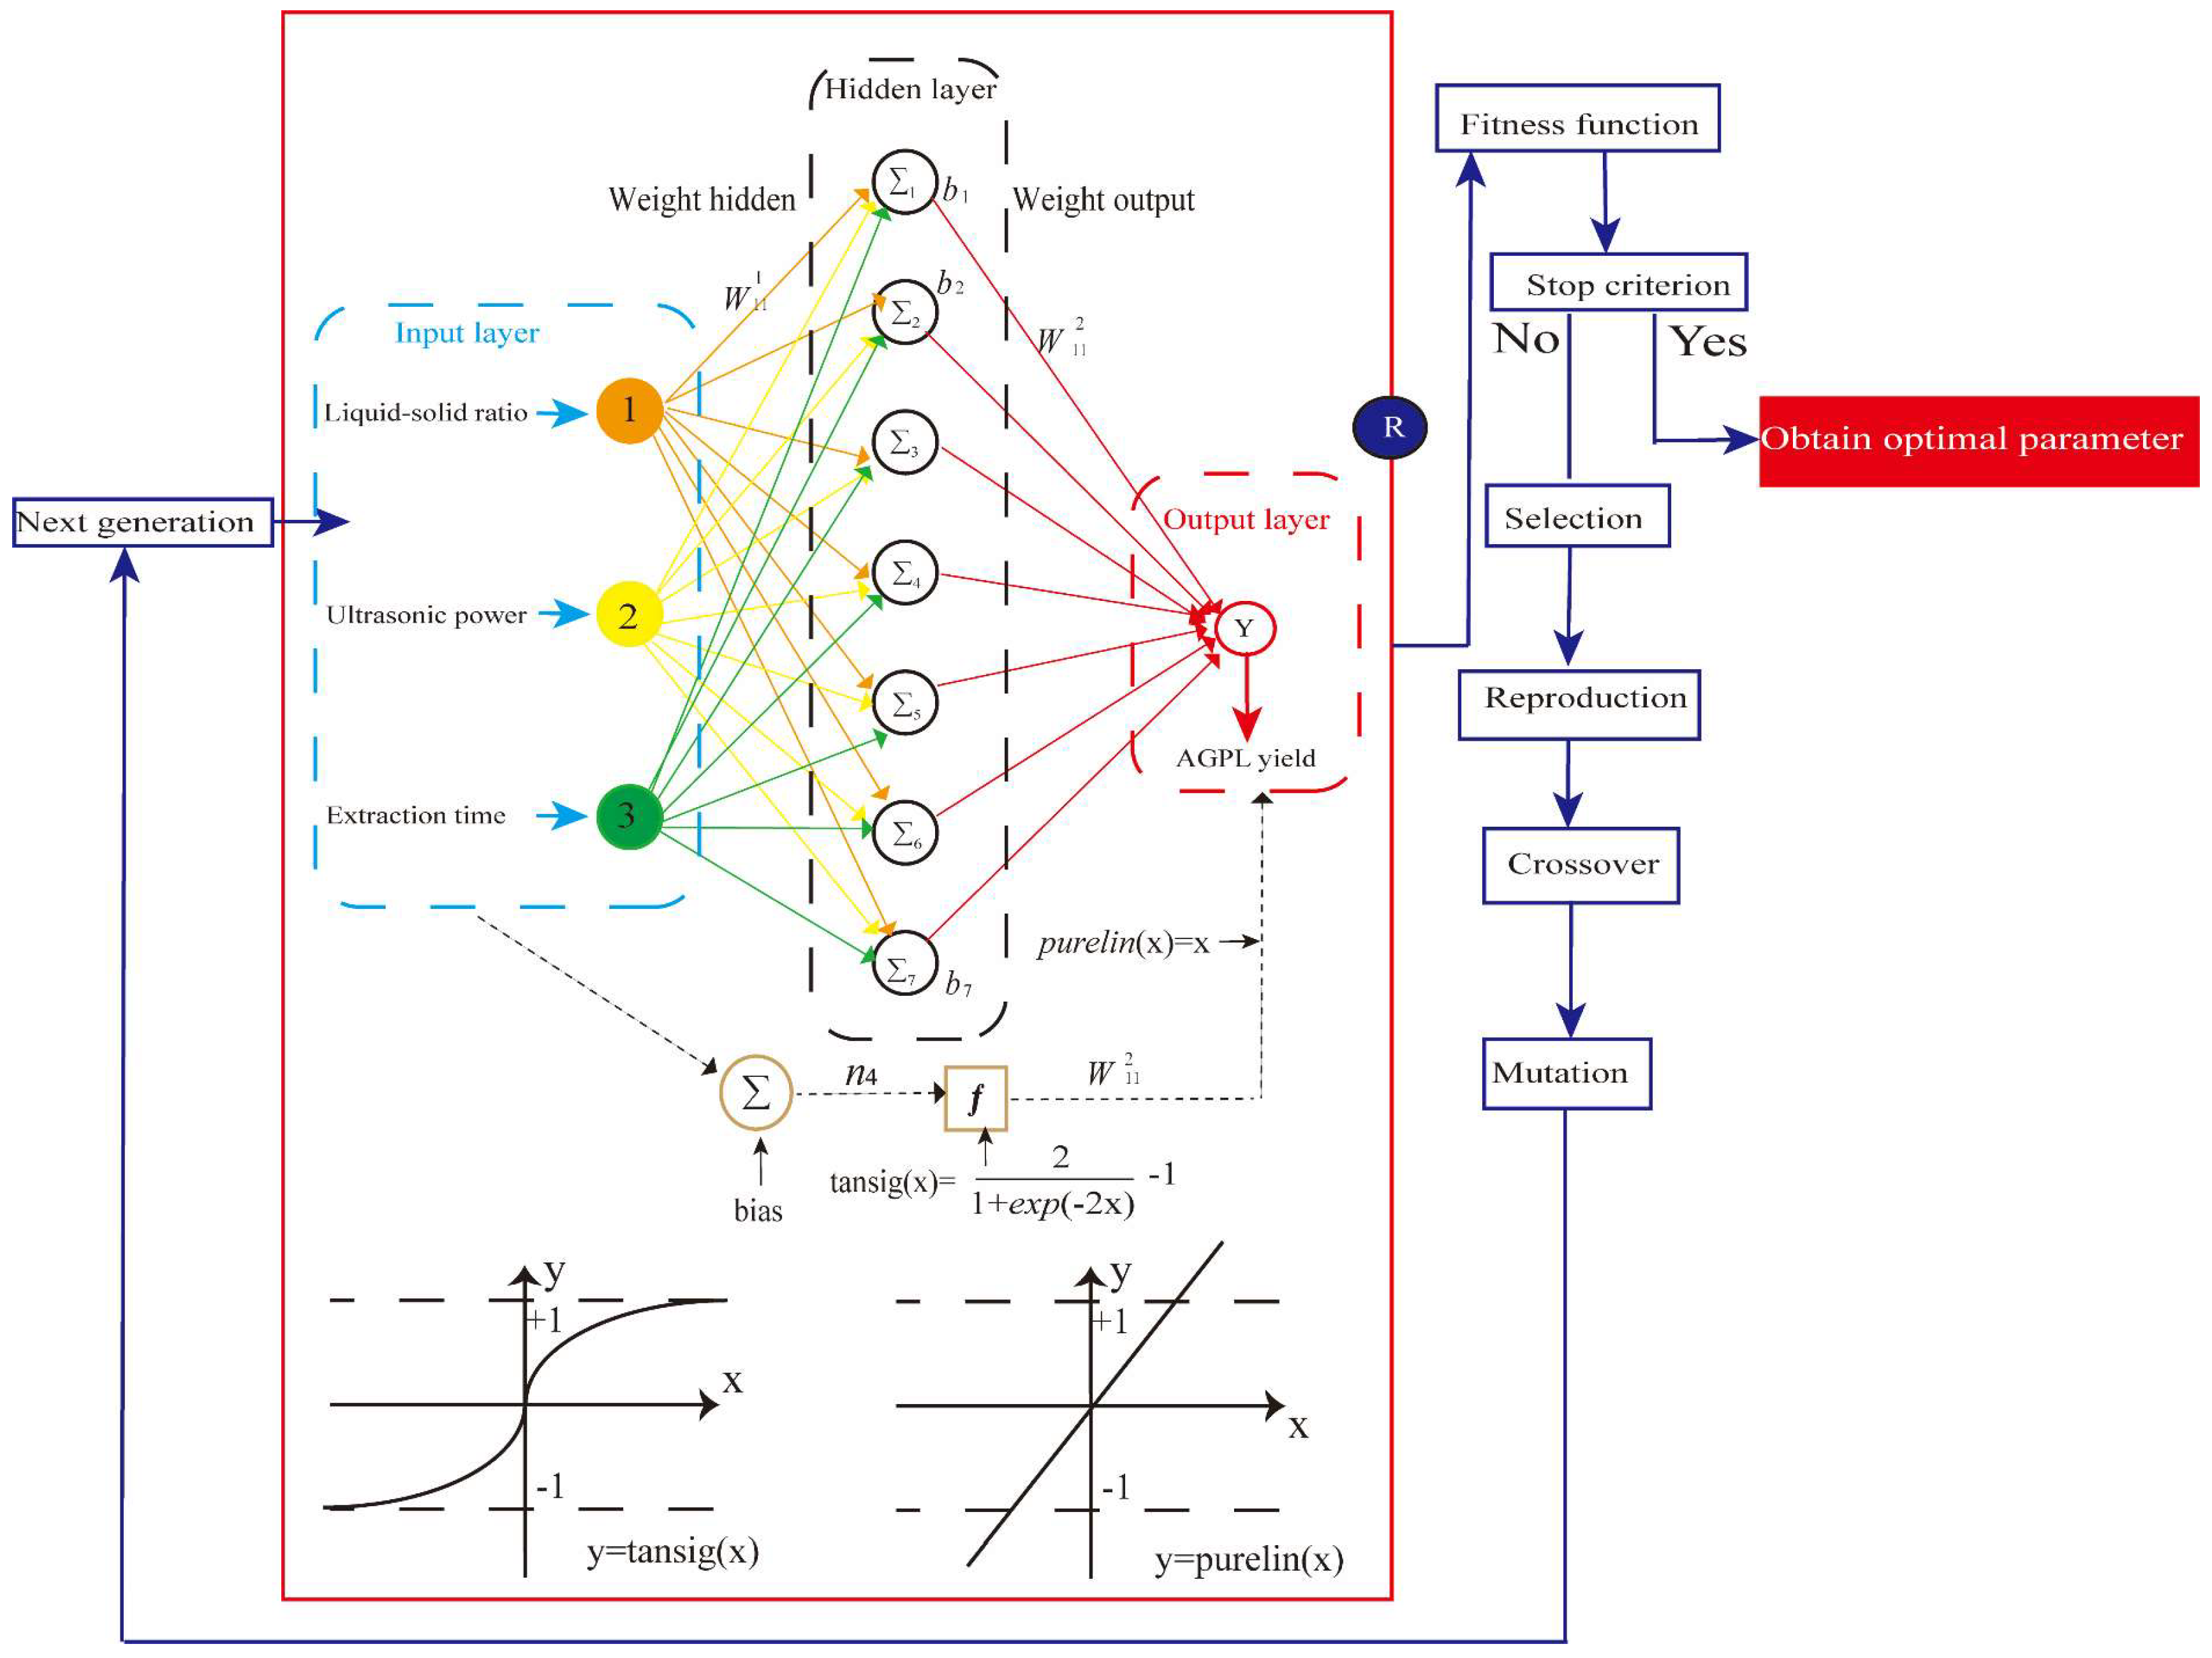
Table 1.
The experimental design and final results by RSM.
| No. | X1, Liquid to solid ratio(mL/g) | X2, Ultrasonic power(W) | X3, Duration of Extraction (min) | Y, AGPL yield(%) |
| 1 | 20 | 600 | 50 | 13.36 |
| 2 | 30 | 600 | 40 | 14.94 |
| 3 | 30 | 600 | 40 | 14.86 |
| 4 | 30 | 600 | 40 | 14.75 |
| 5 | 20 | 600 | 30 | 12.93 |
| 6 | 30 | 750 | 30 | 14.42 |
| 7 | 40 | 600 | 30 | 14.61 |
| 8 | 20 | 450 | 40 | 13.71 |
| 9 | 40 | 750 | 40 | 14.26 |
| 10 | 30 | 450 | 50 | 14.07 |
| 11 | 30 | 450 | 30 | 12.86 |
| 12 | 40 | 450 | 40 | 14.72 |
| 13 | 30 | 600 | 40 | 14.95 |
| 14 | 40 | 600 | 50 | 14.79 |
| 15 | 20 | 750 | 40 | 13.50 |
| 16 | 30 | 750 | 50 | 13.66 |
| 17 | 30 | 600 | 40 | 14.90 |
Table 2.
ANVOA result of quadratic polynomial regression.
| Source | Sum of Squares | Df | Mean Square | F-value | P-value | |
| Model | 7.66 | 9 | 0.8512 | 8.92 | 0.0043 | ** |
| X1-Liquid solid ratio | 2.98 | 1 | 2.98 | 31.20 | 0.0018 | ** |
| X2-Ultrasonic power | 0.4095 | 1 | 0.4095 | 23.66 | 0.0008 | ** |
| X3-Extraction time | 0.1405 | 1 | 0.1405 | 1.47 | 0.2644 | |
| X1X2 | 0.2256 | 1 | 0.2256 | 13.03 | 0.0086 | ** |
| X1X3 | 0.0156 | 1 | 0.0156 | 0.1638 | 0.0153 | * |
| X2X3 | 0.9702 | 1 | 0.9702 | 10.17 | 0.6978 | |
| X1² | 0.4620 | 1 | 0.4620 | 4.84 | 0.0637 | |
| X2² | 1.06 | 1 | 1.06 | 11.09 | 0.0126 | * |
| X3² | 1.65 | 1 | 1.65 | 17.31 | 0.0042 | ** |
| Residual | 0.6679 | 7 | 0.0954 | |||
| Lack of Fit | 0.0950 | 3 | 0.0317 | 4.83 | 0.082 | |
| Pure Error | 0.0262 | 4 | 0.0065 | |||
| Cor Total | 8.33 | 16 |
Table 4.
List of tentatively identified phenolic compounds in the extracts from leaves of A.grossedentata.
Table 4.
List of tentatively identified phenolic compounds in the extracts from leaves of A.grossedentata.
| Compound No. | RT (min) | Formula | Adduct (m/z) | Title |
| 1 | 0.652 | C15H14O8 | 305.0542 | Leucodelphinidin |
| 2 | 0.784 | C15H14O7 | 306.0674 | Leucocyanidin |
| 3 | 0.913 | C15H12O6 | 289.0706 | Aromadendrin |
| 4 | 1.251 | C17H22O10 | 369.1184 | 4-O-beta-D-Glucosyl-sinapate |
| 5 | 1.683 | C15H10O7 | 303.0491 | Quercetin |
| 6 | 3.116 | C15H10O6 | 287.0523 | Fisetin |
| 7 | 4.189 | C15H12O7 | 305.1982 | Taxifolin |
| 8 | 4.232 | C15H14O7 | 307.0832 | (-)-Epigallocatechin |
| 9 | 4.423 | C15H14O6 | 291.0844 | Epicatechin |
| 10 | 4.574 | C19H30O2 | 291.1961 | Androsterone |
| 11 | 4.722 | C27H30O16 | 609.1377 | Quercetin 3-O-rhamnoside 7-O-glucoside |
| 12 | 4.920 | C18H30O2 | 277.2247 | Alpha-Linolenic acid |
| 13 | 5.176 | C16H12O6 | 299.058 | Kaempferide |
| 14 | 6.088 | C20H32O2 | 303.2413 | Arachidonic acid |
| 15 | 6.674 | C19H38O2 | 297.2509 | Nonadecanoic acid |
| 16 | 7.231 | C20H28O2 | 300.2644 | all-trans-Retinoic acid |
| 17 | 7.930 | C21H20O10 | 431.0996 | Apigenin 7-O-beta-D-glucoside |
| 18 | 8.418 | C21H20O12 | 463.0815 | Quercetin 3-O-glucoside |
| 19 | 8.901 | C16H18O9 | 353.0882 | Neochlorogenic acid |
| 20 | 9.623 | C22H26O8 | 417.1609 | (+)-Syringaresinol |
| 21 | 10.075 | C15H12O8 | 319.04 | Dihydromyricetin |
| 22 | 10.114 | C21H20O12 | 463.0909 | Myricitrin |
| 23 | 10.678 | C15H14O8 | 305.0542 | Leucodelphinidin |
Table 5.
List of preparation of DESs employed in this study.
| NO. | HBA | HBD | Mole ratio | Water Content | Abbreviation |
| DES-1 | choline chloride | 1,2-propylene glycol | 1:2 | 10% | Chcl-Pro |
| DES-2 | choline chloride | malonic acid | 1:2 | 10% | Chcl-Ma |
| DES-3 | choline chloride | urea | 1:2 | 10% | Chcl-Ur |
| DES-4 | choline chloride | 1,4-butanediol | 1:2 | 10% | Chcl-Bu4 |
| DES-5 | choline chloride | 1,3-butanediol | 1:2 | 10% | Chcl-Bu3 |
| DES-6 | choline chloride | ethylene glycol | 1:2 | 10% | Chcl-Eg |
| DES-7 | L-carnitine | 1,3-butanediol | 1:2 | 10% | Carn-Bu3 |
| DES-8 | L-carnitine | urea | 1:2 | 10% | Carn-Ur |
| DES-9 | L-carnitine | 1,4-butanediol | 1:2 | 10% | Carn-Bu4 |
| DES-10 | L-carnitine | 1,2-propylene glycol | 1:2 | 10% | Carn -Pro |
| DES-11 | L-carnitine | ethylene glycol | 1:2 | 10% | Carn -Eg |
| DES-12 | L-carnitine | malonic acid | 1:2 | 10% | Carn -Ma |
Table 6.
Factors and levels of Box-Behnken response surface method.
| Variable | Units | Coded Levels | |||
| Symbol | -1 | 0 | 1 | ||
| Liquid-solid ratio | mL/g | X1 | 20 | 30 | 40 |
| Ultrosonic power | W | X2 | 450 | 600 | 750 |
| Extraction time | min | X3 | 30 | 40 | 50 |
Disclaimer/Publisher’s Note: The statements, opinions and data contained in all publications are solely those of the individual author(s) and contributor(s) and not of MDPI and/or the editor(s). MDPI and/or the editor(s) disclaim responsibility for any injury to people or property resulting from any ideas, methods, instructions or products referred to in the content. |
© 2025 by the authors. Licensee MDPI, Basel, Switzerland. This article is an open access article distributed under the terms and conditions of the Creative Commons Attribution (CC BY) license (http://creativecommons.org/licenses/by/4.0/).
Copyright: This open access article is published under a Creative Commons CC BY 4.0 license, which permit the free download, distribution, and reuse, provided that the author and preprint are cited in any reuse.


