
Submitted:
26 April 2025
Posted:
27 April 2025
You are already at the latest version
Abstract
Background: The SARS-CoV-2 and influenza A(H1N1)pdm09 pandemics have resulted in high numbers of ICU admis-sions with high mortality. Identifying risk factors for ICU mortality at the time of admission can help opti-mize clinical decision making. However, the risk factors identified may differ depending on the type of analysis used. Our aim is to compare the risk factors and performance of a linear model (multivariable lo-gistic regression, GLM) with a non-linear model (random forest, RF) in a large national cohort. Methods: A retrospective analysis was performed on a multicenter database including 8902 critical patients with influenza A(H1N1)pdm09 or COVID-19 admitted to 184 Spanish ICUs. Demographic, clinical, labora-tory and microbiological data from the first 24 hours were used. Prediction models were built using GLM and RF. The performance of the GLM was evaluated by area under the ROC curve (AUC), precision, sensi-tivity and specificity, while the RF by out-of-bag (OOB) error and accuracy. In addition, in the RF, the im-portance of the variables in terms of accuracy reduction (AR) and Gini index reduction (GI) was deter-mined. Results: Overall mortality in the ICU was 25.8%. Model performance was similar, AUC =76% for GLM and AUC 75.6% for RF. GLM identified 17 independent risk factors, while RF identified 19 for AR and 23 for GI. Thirteen variables were found to be important in both models. Laboratory variables such as procalcitonin, white blood cells, lactate or D-dimer were not significant in GLM but were significant in RF. On the contra-ry, acute kidney injury and the presence of Acinetobacter spp. were important variables in the GLM but not in the RF. Conclusions: Although the performance of linear and non-linear models was similar, different risk factors were determined depending on the model used. This alerts clinicians to the limitations and usefulness of studies limited to a single type of model.
Keywords:
ICU mortality
; pandemic viruses
; mortality risk factors
; random Forest
; generalized linear model
1. Introduction
Pandemics have historically been one of the greatest threats to public health, causing high mortality and having a significant impact on healthcare systems and society in general. Two recent pandemics have been particularly devastating: the 2009 influenza A (H1N1) virus pandemic and the 2019 SARS-CoV-2 pandemic. Both caused millions of deaths worldwide[1,2,3,4] and challenged the response capacity of healthcare systems, the pharmaceutical industry and governments. They also had ethical, economic and social consequences that are still being felt today [5,6].
Despite the knowledge and advances in biomedicine, there are still limitations in the ability to predict the outcome of critically ill patients with pandemic viral infections. Early identification of patients at increased risk of mortality is essential to optimize intensive care unit (ICU) resources and improve clinical outcomes. Several authors [7,8,9,10,11,12,13,14,15,16,17] have identified a large number of risk factors associated with mortality in critically ill patients with influenza A (H1N1) and SARS-CoV-2 that differ or overlap depending on the population studied, the country or the method of analysis used. Traditionally, statistical models such as logistic regression have been used to quantify the association between confounding variables and the dependent variable in a linear fashion. However, this approach has limitations in detecting non-linear relationships (perhaps the most common in medicine) and the complex interaction between multiple variables, which limits its predictive power in clinical scenarios with high-dimensional data [18,19]
In this context, new machine learning techniques have emerged as promising tools for predicting complex clinical outcomes. Among these, Random Forest, one of the most widely used techniques today, has shown significant advantages in identifying complex patterns in the data without the need for parametric assumptions. This algorithm, based on the combination of multiple decision trees, offers greater predictive accuracy and robustness to collinearity and heterogeneity of clinical data than linear models [20,21]
Our hypothesis is that different risk factors can be identified by applying different models of analysis. To test our hypothesis, the aim of our study is to identify risk factors associated with mortality in critically ill patients with Influenza A (H1N1) and SARS-CoV-2 infection by comparing the predictive ability of traditional logistic regression models with advanced machine learning techniques, specifically Random Forest. Our study aims to alert clinicians to the limitations of classical models and the need for more complex or multiple analyses to identify true risk factors and thus optimize decision-making in the management of ICU patients.
2. Materials and Methods
2.1. Design
This is a secondary analysis of 2 prospective, multicenter, cohort studies. The first database is the GETGAG registry, a voluntary registry created by the Spanish Society of Intensive Care Medicine (SEMICYUC) in 2009 during the A(H1N1)pdm09 influenza pandemic in which 184 Spanish ICUs participated between June 2009 and June 2019 (8,22,23). The study was approved by the Ethics Committee of the of the Joan XXIII University Hospital (CEI no. 11809) and by each of the participating centers. Informed consent informed consent was not obtained from the patients due to the observational nature of the study and data anonymity was guaranteed. The second database is the COVID-19 registry, a voluntary registry created by SEMICYUC in 2020 during the SARS CoV-2 pandemic in which 74 Spanish ICUs participated between 1 July 2020 and 31 December 2021 [10,14,15,24]. The study was retrospectively registered on Clinical-Trials.gov (NCT 04948242) on 30 June 2021. The need for informed consent was waived by the Institution's Internal Review Committee (Comitè Ètic d'Investigació amb Medicaments [CEIm] del Institut d'Investigació Sanitària Pere Virgili [IISPV]IRB# CEIM/066/2020]. Local researchers-maintained contact with a study team member, and participating hospitals obtained local ethics committee approval. The study was carried out according to the principles of the Declaration of Helsinki and the Clinical Trials Directive 2001/20/EC of the European Parliament relating to the Good Clinical Practice guidelines [25].
We reported results in accordance with the Strengthening the Reporting of Observational Studies in Epidemiology (STROBE) guidelines [26].
2.2. Study Population
A total of 8902 consecutive patients requiring ICU admission with a diagnosis of respiratory infection by influenza A (H1N1)pdm09, seasonal A, B (n= 3702) or SARS Cov-2 (n=5200) viruses were included during the two periods described. The presence of the virus was determined by performing real-time polymerase chain reaction (rt-PCR) in each hospital, according to Infectious Diseases Society of America (IDSA) recommendations for influenza [27] and World Health Organization (WHO) recommendations for SARS Cov-2 [28]. The follow-up of patients was scheduled until confirmed ICU discharge or death whichever occurred first.
2.3. Definitions
Co-infection was suspected if a patient presented with signs and symptoms of lower respiratory tract infection, with radiographic evidence of a pulmonary infiltrate with no other known cause [10,23,29]. Coinfection had to be confirmed by laboratory testing using Centers for Disease Control and Prevention (CDC) criteria [23,29]. Only respiratory infection microbiologically confirmed with a respiratory specimen or serology obtained within 2 days of ICU admission was considered community-acquired coinfection. The diagnosis of coinfection was considered “definitive” if respiratory pathogens were isolated from blood or pleural fluid and if serological tests confirmed a fourfold increase of atypical pathogens, including Chlamydia spp., Coxiella burnetti and Moraxella catarrhalis. Only patients with confirmed microbiologic diagnosis were included in the present analysis.
Acute Kidney injury (AKI): The diagnosis of AKI was considered according to the Acute Kidney Injury Network (AKIN) described in the international KDIGO guidelines [30].
Appropriate empiric antibiotic treatment (AEAT): Was defined as the administration of an antibiotic on admission to the ICU before the microbiological results are available and adjusted to the susceptibility of the pathogen when the microbiological results are available. AEAT was determined by the attending physician in each center.
Inappropriate empirical antibiotic treatment (IEAT): Was defined as antibiotic treatment administered on admission to the ICU that was not adapted to the susceptibility of the pathogen when microbiological results are available. In addition, the use of antibiotics at ICU admission in patients with no bacterial co-infection was also included in this definition.
GAP-UCI: was defined as the time elapsed between diagnosing pandemic viral infection and admission to ICU.
GAP-Diagnosis: Was defined as the period of time between the onset of clinical symptoms and the microbiological diagnosis of the pandemic viral infection.
2.4. Study Variables
Demographic data, comorbidities and clinical and laboratory findings were collected during the first 24 hours of ICU admission. In addition, the need for invasive mechanical ventilation and the presence of shock on admission to the ICU were recorded. Disease severity was determined using the Acute Physiology and Chronic Health Evaluation II (APACHE II) score [31] and the level of organ dysfunction using the SOFA score [32]. The variables controlled in the study can be seen in Table 1.
2.5. Analysis Plan and Statistical Analysis
First: We determined the crude ICU mortality in the general population and compared patient characteristics according to outcome. Qualitative variables were expressed as percentages while quantitative variables, as median and interquartile range Q1-Q3. In order to determine clinical differences among groups, the Chi-square and Fisher tests were used for categorical variables, and the student’s t or Mann-Whitney U test, for quantitative variables.
Second: A linear model (Binary logistic regression) was performed to determine which variables were independently associated with all-cause mortality in the ICU. All variables with statistical significance (p<0.05) in the bivariate comparison between groups were included in the GLM (generalized linear model). Only variables at the time of ICU admission were included to develop a model to predict mortality. To optimize the performance of the model, the continuous variables were included in the model in a categorized form. The cut-off point for the continuous variables was determined by taking the median of the surviving patients. Results are presented as odds ratios (OR) with a 95% confidence interval.
For internal validation of the model, the population was randomly divided into a development set (train) with 70% of the patients and a validation set (test) with the remaining 30%. The performance of the model was assessed by determining accuracy, precision, sensitivity, specificity and area under the ROC curve (AUC). The presence of collinearity between the explanatory variables was examined using variance inflation factors (VIF).
In addition, we perform a k-fold Cross Validation (K=10) which consists of taking the original data and creating from it two separate sets: a first training (and test) set, and a second validation set. The training set will then be divided into k subsets and, at the time of training, each k subset will be taken as the model test set, while the rest of the data will be taken as the training set. Once the iterations were completed, the accuracy and error were calculated for each of the models produced, and to obtain the final accuracy and error, the average of the k trained models was calculated.
Third: Due to the significant discrepancy between the two evolution groups, with only 25% of patients in the deceased group, it must be considered that this class imbalance may affect the performance of the model focused on mortality (minority class). To test whether there are differences in the performance of the linear model due to class imbalance, the ROSE (Random Over-Sampling Examples) package was implemented to deal with the imbalance between the groups. This statistical package provides functions to address binary classification issues in the context of unbalanced classes. Balanced samples are generated using a smoothed bootstrap approach, which allows the estimation and evaluation of the accuracy of a binary classifier in the presence of a rare class.
The package also includes functions that implement more traditional class imbalance remedies and various metrics for assessing accuracy. These are estimated using cross-validation, bootstrap or holdout [33,34]. We implemented the "under" option, which specifies subsampling without replacing the majority class until the specified sample size N is reached or the positive examples have a probability p of occurring. When the method is set to "under", the resulting sample is reduced. The ROSE software (version 0.0-4) was used only to process data from the training subset, leaving the test subset untouched. Once the model had been developed on the training set, it was applied to the test set and its performance evaluated. The results are presented as odds ratio (OR) with a 95% confidence interval, accuracy, sensitivity, specificity and AUC-ROC.
Fourth: To test our hypothesis, we developed a non-linear model (random forest classifier model [RFc]). Random forest models are a powerful non-linear tree-based machine learning technique. The developed model was configured to make 500 random trees, with a minimum number of 15 variables per tree. The performance of the RFc model was evaluated using out-of-bag (OOB) error. This method allows the prediction error of random forests, boosted decision trees and other machine learning models to be measured using bootstrap aggregation. We also plotted the importance of the different variables for the model, which is related to the average loss of accuracy and the Gini index for the classification model. The Gini index is a “measure of disorder”, represented as “MeanDecreaseGini”, which means that the higher the measure, the greater the importance in the generated models, since values close to 0 for the Gini index imply more disorder and values close to 1 imply less disorder. The higher this measure, the more variability it will contribute to the dependent variable. For the internal validation of the model, the population was randomly divided into a development (training) set with 70% of the patients and a validation (test) set with the remaining 30%. The performance of the model was evaluated by determining the accuracy.
Statistical analysis was performed with R statistical software (v 4.4.1) R: The R Project for Statistical Computing (r-project.org).
3. Results
3.1. Whole Population
A total of 8902 patients admitted to the ICU were included in the study, of whom 3702 (41.6%) had influenza and 5200 (58.4%) had coronavirus disease 2019 (Covid-19). The diagnosis was confirmed in all patients by means of polymerase chain reaction (PCR). Table 1 presents the general characteristics of the patients according to ICU outcome. The cohort was predominantly male (65.8%), with a mean age of 60 years and an intermediate level of severity, as indicated by a mean APACHE II score of 14 points and a mean SOFA score of 5 points. The most prevalent comorbidities were obesity, diabetes and chronic obstructive pulmonary disease (COPD), with a mean length of stay of 13 days and a crude ICU mortality of 25.8%.
Non-survivors were older, had greater severity of illness, more systemic inflammation, more major comorbidities, greater need for assistance and organ support, and longer ICU stay. The presence of coinfection at ICU admission was also more common in non-survivors, with significant differences in etiology for Pseudomonas aeruginosa, Aspergillus spp and Acinetobacter spp. (Table 1)
3.2. Factors Associated with ICU Crude Mortality According to General Linear Model (GLM)
The associations between crude ICU mortality (dependent variable) and the independent variables were examined using multiple logistic regression. The variables included in the model were male, age cut-off, APACHEII cut-off, SOFA cut-off, ICU GAP cut-off, GAP diagnosis cut-off, shock, asthma, COPD, chronic heart disease, chronic kidney disease, hematological disease, pregnancy, obesity, diabetes, HIV, immunosuppression, steroids, antibiotic treatment at ICU admission, mechanical ventilation at ICU admission, myocardial dysfunction, Acute kidney injury (AKI), > 2 areas of infiltration on chest X-ray, lactate dehydrogenase cut-off, creatine phosphokinase cut-off, WBC cut-off, CRP cut-off, PCT cut-off, lactate cut-off, D-dimer cut-off, Klebsiella spp, Acinetobacter spp, S. pneumoniae, methicillin-sensitive Staphylococcus aureus (MSSA), E. coli, methicillin-resistant Staphylococcus aureus (MRSA), Pseudomonas aeruginosa, Aspergillus spp and antiviral vaccine. Of the 39 variables included in the model, 17 showed an independent association with all-cause mortality in the ICU. The variables that reached significance are shown in Figure 1 and Table 2.
3.3. Linear Model (GLM) Validation
When the developed model was applied to the test subset, the model performed acceptably with an accuracy of 76%, a sensitivity of 61%, a specificity of 79% (Supplementary Table S1) and an AUC of 0.76 (95% CI 0.74-0.78) (supplementary Figure S1). No collinearity was observed between the variables included in the model (Supplementary Table S2).
Cross-validation (K = 10) did not improve the accuracy of the model (0.76%), but increased the sensitivity to 94% with decreased the specificity to 26% (Supplementary Table S3).
3.4. Development of the GLM Model with Correction of Class Imbalance
Applying the ROSE package to the training set reduced the population from 6232 patients to 3152 patients. Of these, 1606 died, giving an estimated mortality rate of 50.9%, twice the real rate (25%). The development of the linear GLM model with the balanced population showed no better performance with an AUC-ROC of 76% (74%-78%) and an accuracy of 68%. The full development of the balanced population model can be found in the Supplementary Figure S2, Figure S3 and Table S4. Due to the lack of optimization and the consequent reduction in the number of patients, we have maintained the original GLM model despite the imbalance, as it does not appear to affect the linear model used.
3.5. Factors Associated with ICU Mortality According to No-Linear Model (Random Forest)
A random forest classifier (RFc) model was developed to study the contributions of confounding variables to the dependent variable (ICU mortality) in a non-linear way. The independent variables included in both RFc models were the same as in the GLM to compare results. The RFc model had an OOB estimate of error rate of 25.3%.
Nineteen variables had an influence of more than 10% on the reduction in precision of the model (Table 2 and Figure 2). Obesity, AKI and the presence of Acinetobacter spp. were not important variables in the non-linear precision model, but they were in the GLM. On the other hand, COPD, lactate, procalcitonin, D-dimer and CPK were important variables for accuracy in the non-linear model that were not significant in the linear model.
Twenty-three variables were associated with a >50% reduction in GINI in the non-linear analysis. AKI, Acinetobacter spp. and Aspergillus spp., significant variables in the linear model (GLM), did not appear to be important for the GINI. On the contrary, GAP-diagnosis, GAP-ICU, male sex and WBC count were important for reducing the GINI in the non-linear RF model. (Table 2 and Figure 2)
3.6. Non-Linear Model (RFc) Validation
When the developed model was applied to the test subset, the model performed acceptably with an accuracy of 75.6%. This performance was similar to that observed in the linear model (GLM) despite using different covariates.
3.7. Patient Classification by Model
Of the 2670 patients included in the set test, GLM adequately classified 2035 patients (76.2%), while RF did so in 2018 patients (75.6%) (Figure 3 and supplementary Figure S4 A and B). Both models correctly classified 1872 patients (70.1%) and misclassified 489 patients (18.3%). Figure 4 shows the distribution of the probability generated by each model (Class) with respect to the observed (Real).
4. Discussion
To the best of our knowledge, this is the first study using machine learning techniques on a large number of critically ill patients affected by pandemic viruses, and our main finding was that using either a linear (generalized linear model, GLM) or non-linear (Random Forest, RF) technique to generate mortality prediction models was associated with similar performance, with an accuracy close to 80%.
However, the risk factors differed according to the type of analysis used. Although factors such as age, severity, degree of organ dysfunction, or need for mechanical ventilation were important in both models (major determinants), other laboratory variables such as procalcitonin, D-dimer or lactate were identified only in the RF model (minor determinants). Conversely, acute kidney injury (AKI) and the presence of Acinetobacter spp. were significant only in the GLM. These findings should alert clinicians to the limitations and implications of studies that rely exclusively on one methodological approach to identify prognostic factors.
The influenza A(H1N1) and COVID-19 pandemics have put enormous pressure on healthcare systems around the world, highlighting the urgent need for reliable and accurate methods to predict the potential severity and survival of patients in order to manage resources appropriately. Although pandemics might appear as past events, each winter hospitals are again overwhelmed by patients with respiratory failure due to viral infections, which generate seasonal surges in ICU admissions and resource demand.
Early identification of high-risk patients with viral infections is essential, as it allows for rapid triage, targeted intensive care, and optimized resource allocation, all of which can ultimately improve patient outcomes. In this context, our study aimed not only to evaluate and compare the performance of traditional statistical and machine learning models for mortality prediction, but also to explore how each method identifies different clinical predictors of outcome.
Several authors have used different types of ML analysis to identify risk factors and develop predictive models with COVID-19 patients, while we did not find any studies with influenza A H1N1. In addition, most of the studies include hospitalized patients, with few critically ill patients.
Huang H et al [35] have reported an AUC of 94.4%, sensitivity of 94.1% and specificity of 90.2% when using ML, but the population considered was only 127 patients and only 33 of these were critical. Meanwhile , Zhu et al [36] in 127 COVID-19 patients (16 severe), Gong et al [37]in 372 hospitalized COVID-19 patients, Aloisio et al [38] in 427 COVID-19 patients and Liu et al [39] in 336 severely ill COVID-19 patients (34 of whom died) showed excellent performance (AUC >90%) using linear logistic regression models. The small number of patients included in these studies limits the strength of the results and their generalizability.
In line with our research, an elegant study by Reina-Reina et al [40] on a population of 1200 COVID-19 patients, assessed the risk of death and ICU admission using different ML techniques (Support Vector Machine (SVM), LR, K-Neighbours, Decision Tree, Gaussian Naive Bayes, MLP, and ensemble methods such as Adaboost and bagging techniques). The authors found that there were no significant differences between the classification accuracies (>88%) of the different ML techniques. However, they chose LR as the algorithm to optimize due to the interpretability of the model, which is crucial in the medical field, although RF achieved a slightly better average result. The model finds that the most important variables are COPD, which increases the probability of death by 575%, age, which increases the probability by 145% every 10 years, and acute respiratory failure, with an increase of 513%. However, the authors do not report the differences between the predictor variables identified by each model and only a small percentage of patients were critical.
Pourhomayoun M et al.[41] applied different ML models (SVM, neural networks (NN), RF, decision tree and LR) to predict severity in a large number of patients with COVID-19 (more than 2,670,000 patients). The original dataset contained 32 data points for each patient, including demographic and physiological data, and the NN algorithm achieved the best performance and accuracy with an AUC of 89.98%, compared with an AUC of 87.93% for RF and an AUC of 87.91% for LR. The authors do not make a statistical comparison between the AUCs to assess significance and only present the predictive factors of NN in the form of a heat map, without making a comparison between the models. In addition, the severity of the patients' disease was not reported.
In an excellent review of ML techniques used for prognosis in COVID-19, Alballa N et al. [42] note that the most commonly used algorithm for COVID-19 diagnostic and prognostic models is LR, followed by XGBoost and finally SVM. The authors point out that most of the studies included in the review used unbalanced datasets. Those in which the majority of records in the training dataset represent the negative class (survivors) and the positive class (non-survivors) is under-represented. Therefore, the reported performance of various ML algorithms applied in the context of COVID-19 may have been affected by bias. A high accuracy score in such cases could be attributed to the model's ability to accurately identify negative samples and erroneously exclude all positive cases. In our study, this bias was recognized, and addressed by applying subsampling to the majority class. However, this action did not improve the performance of the balanced model over the unbalanced one, showing that the reliability of the model is not affected by class imbalance. This may be due to the fact that the mortality in our series of critically ill patients is 25%, whereas in most published studies it is around 10-15% [9,38,39,40,43] due to the absence of critical patients.
As we observed in our study, the linear model (GLM) has a similar performance to that of non-linear models in predicting mortality in patients with COVID-19, which has been confirmed in several studies [15,40,41,42,44]. However, despite the structural flexibility of machine learning models for predicting COVID-19, there are limitations to their practical use, such as the high heterogeneity between patients' clinical profiles and the small sample size, which may reduce the external validity and generalizability of the data. Most studies describe different risk factors and different performances depending on the inclusion of one or another factor. This is consistent with studies [40,44,45] that have reported modest performance of ML models when trained exclusively with baseline clinical data collected at the time of admission to the ICU. Most successful predictive models, such as those of Wang et al. [46] and Karasneh et al. [17] have incorporated dynamic, therapeutic or immunological variables that significantly improve model performance. However, these variables are not available in the first hours of care for critically ill patients, so their applicability to clinical practice is limited.
Our study has strengths that we would like to highlight. The first is the large number of critical patients included (n=8902), with more than 3000 patients affected by influenza A (H1N1)pdm09, which makes it unique in its results. It is a national multicenter study that includes more than 148 ICUs in Spain, so its results can be generalized to our country. In addition, it not only reports the performance of the models developed, but also describes the different risk factors identified and the correct classification of patients by each model. On this basis, our study allows us to classify the risk factors into those that are important in both models (major determinants) and those that are important in only one of the models (minor determinants). Recognition of these risk factors can add value in clinical practice for determining the prognosis in critically ill patients with pandemic virus infection. Finally, our study alerts clinicians to the limitations of using models developed using a single method of analysis.
However, our study has limitations that need to be recognized. First, despite the large number of patients and its multicenter nature, these findings cannot be extrapolated to other (non-critical) populations, other health systems and other continents before local validation. Second, although the potential bias due to class imbalance has been addressed, it is possible that other biases, such as those related to ethnicity or other confounding variables, cannot be ruled out, as these variables are not available in our data. Finally, it is possible that including data on ICU evolution in the models could improve performance. However, our aim was to identify early risk factors for mortality that could be modified by the clinician to improve prognosis.
5. Conclusions
Our study highlights the current value of linear models (GLM) in predicting mortality in the era of machine learning analysis. However, it alerts clinicians to the need for a heterogeneous approach of linear and non-linear (complementary) analysis to discover all the major and minor determinants of mortality with the aim of improving the prognosis of this group of critical patients.
Supplementary Materials
The following supporting information can be downloaded at the website of this paper posted on Preprints.org.
Author Contributions
Conceptualization, Elisabeth Papiol, Ricard Ferrer, Juan Ruiz-Rodríguez, Emili Díaz, Rafael Zaragoza, Marcio Borges-Sá, Josep Gómez, María Bodí, Susana Sancho, Borja Suberviola, Sandra Trefler and Alejandro Rodríguez; Data curation, Sandra Trefler; Formal analysis, Elisabeth Papiol, Ricard Ferrer, Juan Ruiz-Rodríguez, Emili Díaz, Marcio Borges-Sá, Julen Berrueta, Josep Gómez, María Bodí, Susana Sancho, Borja Suberviola, Sandra Trefler and Alejandro Rodríguez; Investigation, Elisabeth Papiol, Emili Díaz, Rafael Zaragoza, Julen Berrueta, Josep Gómez, Susana Sancho and Borja Suberviola; Methodology, Elisabeth Papiol, Ricard Ferrer, Juan Ruiz-Rodríguez, Emili Díaz, Rafael Zaragoza, Marcio Borges-Sá, Julen Berrueta, Josep Gómez, María Bodí, Borja Suberviola, Sandra Trefler and Alejandro Rodríguez; Project administration, Elisabeth Papiol; Resources, Sandra Trefler and Alejandro Rodríguez; Software, Julen Berrueta, Josep Gómez and Alejandro Rodríguez; Validation, Elisabeth Papiol, Juan Ruiz-Rodríguez, Marcio Borges-Sá, Julen Berrueta, Josep Gómez, María Bodí, Susana Sancho, Sandra Trefler and Alejandro Rodríguez; Writing – original draft, Elisabeth Papiol, Ricard Ferrer, Juan Ruiz-Rodríguez, Emili Díaz, Rafael Zaragoza, Marcio Borges-Sá, María Bodí, Susana Sancho, Borja Suberviola and Alejandro Rodríguez; Writing – review & editing, Elisabeth Papiol, Ricard Ferrer, Juan Ruiz-Rodríguez and Alejandro Rodríguez.
Funding
Barri Casanovas Private Foundation Scholarship (FBC02/2023) (AR; MB)
Institutional Review Board Statement
GETGAG registry was approved by the Ethics Committee of the of the Joan XXIII University Hospital (CEI no. 11809) and by each of the participating centers. Informed consent was not obtained from the patients due to the observational nature of the study and data anonymity was guaranteed. COVID-19 Registry was retrospectively registered on Clinical-Trials.gov (NCT 04948242) on 30 June 2021.
Informed Consent Statement
The need for informed consent was waived by the Institution’s Internal Review Committee (Comitè Ètic d’Investigació amb Medicaments [CEIm] del Institut d’Investigació Sanitària Pere Virgili [IISPV]IRB# CEIM/066/2020). Local researchers-maintained contact with a study team member, and participating hospitals obtained local ethics committee approval. Both studies were carried out according to the principles of the Declaration of Helsinki and the Clinical Trials Directive 2001/20/EC of the European Parliament relating to the Good Clinical Practice guidelines.
Data Availability Statement
The corresponding author (AR) had full access to all the data in the study and takes responsibility for the integrity of the data and the accuracy of the data analysis. All authors approved the final version of the manuscript. The views expressed in this article are those of the authors and not necessarily those of the SEMICYUC. The data supporting the conclusions of this study are available from the Spanish Society of Critical Care (SEMICYUC), but restrictions apply to the availability of these data, which were used under SEMICYUC authorization for the present study and are therefore not publicly available. However, the data can be obtained from the corresponding author (AR) upon reasonable request and with the permission of SEMICYUC.
Acknowledgments
The authors would like to thank the GETGAG and COVID-19 working group/SEMICYUC
Conflicts of Interest
The authors declare no conflicts of interest.
Appendix A
Supplementary material (Table S1: Performance of multivariate linear model (GLM) for ICU mortality; Table S2: Colinearity study by VIF (variance inflation factors) determination; Table S3: Cross-validation of multivariate linear (GLM) model; Table S4 : Performance of balanced linear model; Figure S1: Area under ROC curve (AUC) for multivariate lineal model for ICU mortality; Figure S2: Forest-Plot with the variables included in the balanced linear model with Odds Ratio; Figure S3: area under ROC curve of balanced mortality linear model; Figure S4: Categories profiles according to the model. A = linear model , B= no linear model)
References
- Centers for Disease Control and Prevention (CDC). COVID-19 Case Surveillance Public Use Data. [Internet] 2021. Available from: https://data.cdc.gov (access 24 April 2025).
- Viboud, C.; Simonsen, L. Global mortality of 2009 pandemic influenza A H1N1. Lancet Infect. Dis. 2012, 12, 651–653. [Google Scholar] [CrossRef] [PubMed]
- Simonsen, L.; Spreeuwenberg, P.; Lustig, R.; Taylor, R.J.; Fleming, D.M.; Kroneman, M.; et al. Global Mortality Estimates for the 2009 Influenza Pandemic from the GLaMOR Project: A Modeling Study. PLoS Med. 2013, 10, e1001558. [Google Scholar] [CrossRef]
- World Health Organization (WHO). WHO Coronavirus (COVID-19) Dashboard – Deaths. [Internet] 2023. Available from: https://data.who.int/dashboards/covid19/deaths (accessed on 24 April 2025).
- Mathieu, E.; Ritchie, H.; Rodés-Guirao, L.; Appel, C.; Gavrilov, D.; Giattino, C.; Hasell, J.; Macdonald, B.; Dattani, S.; Beltekian, D.; Ortiz-Ospina, E.; Roser, M. COVID-19 Pandemic. Our World in Data [Internet] 2020. https://ourworldindata.org/coronavirus (accessed on 24 April 2025).
- Ferrer, R. COVID-19 Pandemic: the greatest challenge in the history of critical care. Med. Intensiva 2020, 44, 323–324. [Google Scholar] [CrossRef] [PubMed]
- Díaz, E.; Martin-Loeches, I.; Canadell, L.; Vidaur, L.; Suárez, D.; Socias, L.; et al. Corticosteroid therapy in patients with primary viral pneumonia due to pandemic (H1N1) 2009 influenza. J. Infect. 2012, 64, 311–318. [Google Scholar] [CrossRef] [PubMed]
- Martin-Loeches, I.; Rodríguez, A.; Bonastre, J.; Zaragoza, R.; Sierra, R.; Marques, A.; et al. Severe pandemic (H1N1)v influenza A infection: Report on the first deaths in Spain. Respirology 2011, 16, 78–85. [Google Scholar] [CrossRef]
- Guan, W.J.; Ni, Z.Y.; Hu, Y.; Liang, W.H.; Ou, C.Q.; He, J.X.; et al. Clinical Characteristics of Coronavirus Disease 2019 in China. N. Engl. J. Med. 2020, 382, 1708–1720. [Google Scholar] [CrossRef]
- Carbonell, R.; Urgelés, S.; Rodríguez, A.; Bodí, M.; Martín-Loeches, I.; Solé-Violán, J.; et al. Mortality comparison between the first and second/third waves among 3,795 critical COVID-19 patients with pneumonia admitted to the ICU: A multicentre retrospective cohort study. Lancet Reg. Health Eur. 2021, 11, 100243. [Google Scholar] [CrossRef]
- Díaz, E.; Rodríguez, A.; Martin-Loeches, I.; Lorente, L.; Del Mar Martín, M.; Pozo, J.C.; et al. Impact of obesity in patients infected with 2009 influenza A(H1N1). Chest 2011, 139, 382–386. [Google Scholar] [CrossRef]
- Álvarez-Lerma, F.; Marín-Corral, J.; Vilà, C.; Masclans, J.R.; Martín-Loeches, I.; Barbadillo, S.; et al. Characteristics of patients with hospital-acquired influenza A (H1N1)pdm09 virus admitted to the intensive care unit. J. Hosp. Infect. 2017, 95, 200–206. [Google Scholar] [CrossRef]
- Martin-Loeches, I.; Papiol, E.; Rodríguez, A.; Díaz, E.; Zaragoza, R.; Granada, R.M.; et al. Acute kidney injury in critically ill patients affected by influenza A (H1N1) virus infection. Crit. Care 2011, 15, R66. [Google Scholar] [CrossRef]
- Oliva, I.; Ferré, C.; Daniel, X.; Cartanyà, M.; Villavicencio, C.; Salgado, M.; et al. Risk factors and outcome of acute kidney injury in critically ill patients with SARS-CoV-2 pneumonia: a multicenter study. Med. Intensiva 2024, 48, 1–10. [Google Scholar] [CrossRef]
- Rodríguez, A.H.; Ruiz-Botella, M.; Martín-Loeches, I.; Jiménez Herrera, M.; Solé-Violán, J.; Gómez, J.; et al. Deploying unsupervised clustering analysis to derive clinical phenotypes and risk factors associated with mortality risk in 2022 critically ill patients with COVID-19 in Spain. Crit. Care 2021, 25, 63. [Google Scholar] [CrossRef]
- Benítez, I.D.; de Batlle, J.; Torres, G.; González, J.; de Gonzalo-Calvo, D.; Targa, A.D.; et al. Prognostic implications of comorbidity patterns in critically ill COVID-19 patients: A multicenter, observational study. Lancet Reg. Health Eur. 2022, 18, 100422. [Google Scholar] [CrossRef] [PubMed]
- Karasneh, R.A.; Khassawneh, B.Y.; Al-Azzam, S.; Al-Mistarehi, A.H.; Lattyak, W.J.; Aldiab, M.; et al. Risk Factors Associated with Mortality in COVID-19 Hospitalized Patients: Data from the Middle East. Int. J. Clin. Pract. 2022, 2022, 9617319. [Google Scholar] [CrossRef] [PubMed]
- Ribas, V.J.; Vellido, A.; Ruiz-Rodríguez, J.C.; Rello, J. Severe sepsis mortality prediction with logistic regression over latent factors. Expert Syst. Appl. 2012, 39, 1937–1943. [Google Scholar] [CrossRef]
- Vellido, A.; Ribas, V.; Morales, C.; Ruiz-Sanmartín, A.; Ruiz-Rodríguez, J.C. Machine learning in critical care: State-of-the-art and a sepsis case study. Biomed. Eng. Online 2018, 17 (Suppl 1), 135. [Google Scholar] [CrossRef]
- Aushev, A.; Ripoll, V.R.; Vellido, A.; Aletti, F.; Pinto, B.B.; Herpain, A.; et al. Feature selection for the accurate prediction of septic and cardiogenic shock ICU mortality in the acute phase. PLoS ONE 2018, 13, e0199089. [Google Scholar] [CrossRef]
- Johnson, A.E.W.; Ghassemi, M.M.; Nemati, S.; Niehaus, K.E.; Clifton, D.A.; Clifford, G.D. Machine Learning and Decision Support in Critical Care. Proc. IEEE 2016, 104, 444–466. [Google Scholar] [CrossRef]
- Carbonell, R.; Moreno, G.; Martín-Loeches, I.; Gomez-Bertomeu, F.; Sarvisé, C.; Gómez, J.; et al. Prognostic Value of Procalcitonin and C-Reactive Protein in 1608 Critically Ill Patients with Severe Influenza Pneumonia. Antibiotics 2021, 10, 350. [Google Scholar] [CrossRef]
- Rodríguez, A.H.; Avilés-Jurado, F.X.; Díaz, E.; Schuetz, P.; Trefler, S.I.; Solé-Violán, J.; et al. Procalcitonin (PCT) Levels for Ruling-Out Bacterial Coinfection in ICU Patients with Influenza: A CHAID Decision-Tree Analysis. J. Infect. 2016, 72, 143–151. [Google Scholar] [CrossRef]
- Carbonell, R.; Urgelés, S.; Salgado, M.; Rodríguez, A.; Reyes, L.F.; Fuentes, Y.V.; et al. Negative Predictive Value of Procalcitonin to Rule Out Bacterial Respiratory Co-Infection in Critical COVID-19 Patients. J. Infect. 2022, 85, 374–381. [Google Scholar] [CrossRef] [PubMed]
- World Medical Association. World Medical Association Declaration of Helsinki: Ethical Principles for Medical Research Involving Human Subjects. JAMA 2013, 310, 2191–2194. [Google Scholar] [CrossRef]
- Cuschieri, S. The STROBE Guidelines. Saudi J. Anaesth. 2019, 13 (Suppl 1), S31–S34. [Google Scholar] [CrossRef]
- Uyeki, T.M.; Bernstein, H.H.; Bradley, J.S.; Englund, J.A.; File, T.M.; Fry, A.M.; et al. Clinical Practice Guidelines by the Infectious Diseases Society of America: 2018 Update on Diagnosis, Treatment, Chemoprophylaxis, and Institutional Outbreak Management of Seasonal Influenza. Clin. Infect. Dis. 2019, 68, 895–902. [Google Scholar] [CrossRef]
- World Health Organization. Clinical Management of Severe Acute Respiratory Infection (SARI) When COVID-19 Disease is Suspected: Interim Guidance, 13 March 2020. World Health Organization, 2020. Available online: https://apps.who.int/iris/handle/10665/331446 (accessed on 24 April 2025).
- Martin-Loeches, I.; Schultz, M.J.; Vincent, J.L.; Alvarez-Lerma, F.; Bos, L.D.; Solé-Violán, J.; et al. Increased Incidence of Co-Infection in Critically Ill Patients with Influenza. Intensive Care Med. 2017, 43, 48–58. [Google Scholar] [CrossRef] [PubMed]
- Kellum, J.A.; Lameire, N.; Aspelin, P.; Barsoum, R.S.; Burdmann, E.A.; Goldstein, S.L.; et al. Kidney Disease: Improving Global Outcomes (KDIGO) Acute Kidney Injury Work Group. KDIGO Clinical Practice Guideline for Acute Kidney Injury. Kidney Int. Suppl. 2012, 2, 1–138. [Google Scholar] [CrossRef]
- Knaus, W.A.; Draper, E.A.; Wagner, D.P.; Zimmerman, J.E. APACHE II: A Severity of Disease Classification System. Crit. Care Med. 1985, 13, 818–829. [Google Scholar] [CrossRef]
- Vincent, J.L.; Moreno, R.; Takala, J.; Willatts, S.; De Mendonça, A.; Bruining, H.; et al. The SOFA (Sepsis-Related Organ Failure Assessment) Score to Describe Organ Dysfunction/Failure. Intensive Care Med. 1996, 22, 707–710. [Google Scholar] [CrossRef]
- Menardi, G.; Torelli, N. Training and Assessing Classification Rules with Imbalanced Data. Data Min. Knowl. Discov. 2014, 28, 92–122. [Google Scholar] [CrossRef]
- Lunardon, N.; Menardi, G.; Torelli, N. ROSE: A Package for Binary Imbalanced Learning. R J. 2014, 6, 79–89. [Google Scholar] [CrossRef]
- Huang, H.; Cai, S.; Li, Y.; Li, Y.; Fan, Y.; Li, L.; et al. Prognostic Factors for COVID-19 Pneumonia Progression to Severe Symptoms Based on Earlier Clinical Features: A Retrospective Analysis. Front. Med. 2020, 7, 557453. [Google Scholar] [CrossRef] [PubMed]
- Zhu, Z.; Cai, T.; Fan, L.; Lou, K.; Hua, X.; Huang, Z.; et al. Clinical Value of Immune-Inflammatory Parameters to Assess the Severity of Coronavirus Disease 2019. Int. J. Infect. Dis. 2020, 95, 332–339. [Google Scholar] [CrossRef] [PubMed]
- Gong, J.; Ou, J.; Qiu, X.; Jie, Y.; Chen, Y.; Yuan, L.; et al. A Multicenter Study Using the Risk Nomogram in COVID-19 Patients. J. Med. Virol. 2020, 92, 2453–2461. [Google Scholar] [CrossRef]
- Aloisio, E.; Chibireva, M.; Serafini, L.; Pasqualetti, S.; Falvella, F.S.; Dolci, A.; et al. A Comprehensive Appraisal of Laboratory Biochemistry Tests as Major Predictors of COVID-19 Severity. Arch. Pathol. Lab. Med. 2020, 144, 1457–1464. [Google Scholar] [CrossRef] [PubMed]
- Liu, Q.; Song, N.C.; Zheng, Z.K.; Li, J.S.; Li, S.K. Laboratory Findings and a Combined Multifactorial Approach to Predict Death in Critically Ill Patients with COVID-19: A Retrospective Study. Epidemiol. Infect. 2020, 148, e129. [Google Scholar] [CrossRef]
- Reina Reina, A.; Barrera, J.M.; Valdivieso, B.; Gas, M.E.; Maté, A.; Trujillo, J.C. Machine Learning Model from a Spanish Cohort for Prediction of SARS-COV-2 Mortality Risk and Critical Patients. Sci. Rep. 2022, 12, 7736. [Google Scholar] [CrossRef]
- Pourhomayoun, M.; Shakibi, M. Predicting Mortality Risk in Patients with COVID-19 Using Machine Learning to Help Medical Decision-Making. Smart Health 2021, 20, 100178. [Google Scholar] [CrossRef]
- Alballa, N.; Al-Turaiki, I. Machine Learning Approaches in COVID-19 Diagnosis, Mortality, and Severity Risk Prediction: A Review. Inform. Med. Unlocked 2021, 24, 100622. [Google Scholar] [CrossRef]
- Hernández-Cárdenas, C.M.; Choreño-Parra, J.A.; Torruco-Sotelo, C.; Jurado, F.; Serna-Secundino, H.; Aguilar, C.; et al. Clinical Risk Factors for Mortality Among Critically Ill Mexican Patients with COVID-19. Front. Med. 2021, 8, 699607. [Google Scholar] [CrossRef]
- Cornelius, E. Covid-19 Mortality Prediction Using Machine Learning-Integrated Random Forest Algorithm under Varying Patient Frailty; Master's Thesis, Illinois State University, 2021. [CrossRef]
- Banoei, M.M.; Dinparastisaleh, R.; Zadeh, A.V.; Mirsaeidi, M. Machine-Learning-Based COVID-19 Mortality Prediction Model and Identification of Patients at Low and High Risk of Dying. Crit. Care 2021, 25, 328. [Google Scholar] [CrossRef]
- Wang, M.; Li, W.; Wang, H.; Song, P. Development and Validation of Machine Learning-Based Models for Predicting Healthcare-Associated Bacterial/Fungal Infections Among COVID-19 Inpatients: A Retrospective Cohort Study. Antimicrob. Resist. Infect. Control 2024, 13, 42. [Google Scholar] [CrossRef] [PubMed]
Figure 1.
Odds ratio (OR) plot of variables associated with ICU crude mortality in linear multivariate analysis(GLM). Abbreviations : cut: cut-off; APACHE II: Acute Physiology and Chronic Health Evaluation; SOFA: Sequential organ failure assessment; AB: antibiòtics; CPK: creatine phospokinase; DD: D dímer; MR_SA: methicillin-resistant S. Aureus; MV: invasive mechanical ventilation; WBC: White blood cells; COPD: chronic obstructive pulmonary disease; dis: disfunction; Chr_Card_dis; chronic cardiac disease; HIV: Human immunodeficiency virus; AKI: acute kidney injury; CRP:C-reactive protein; GAP_ICU_cut: time elapsed between diagnosing pandemic viral infection and admission to ICU; Chr_renal_dis: Chronic renal disease; ID: immunosuppression ; Rx-cutoff: > 2 fields with infiltrations in chest X-ray; PCT: procalcitonin; MS_SA: Methicillin-sensitive S. aureus; GAP_diagnsosis_cut: Time from symptoms onset to diagnosis; hematol_dis: Hematologic disease; LDH: Lactate dehydrogenase) .
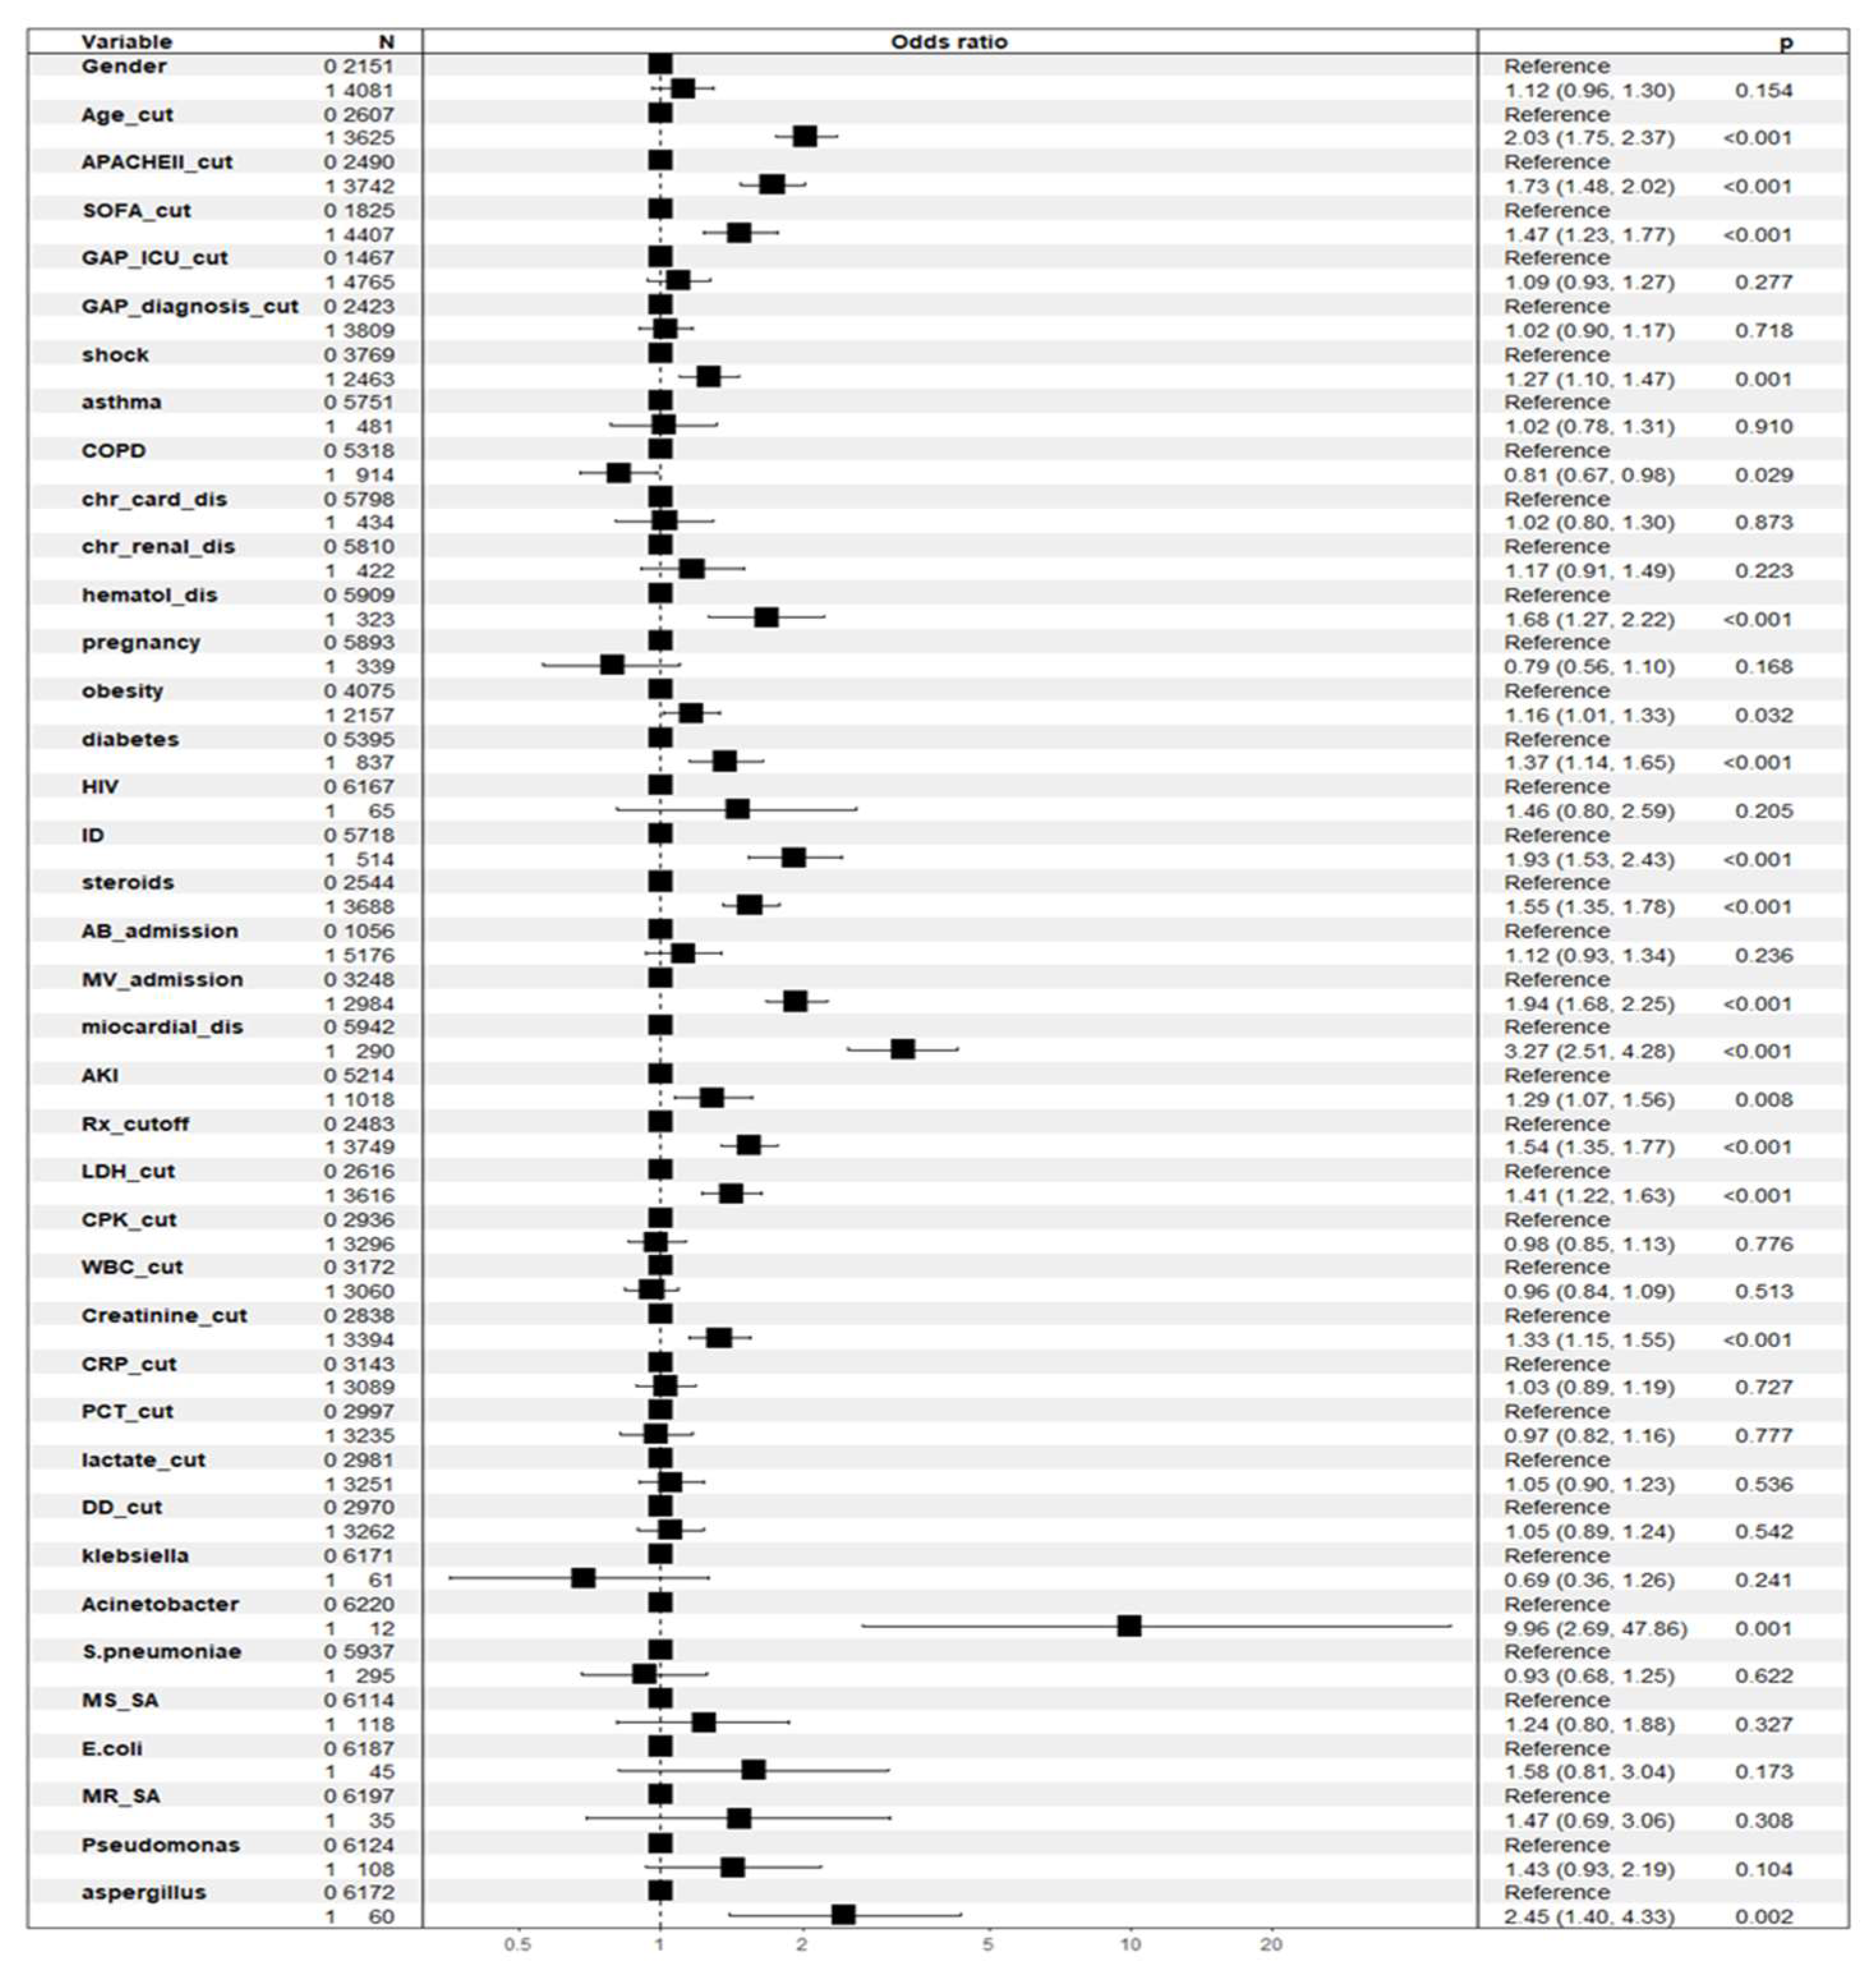
Figure 2.
Contribution of each confounding variable according to the Random Forest (RF) model for variables associated with the development of AKI with the total dose of L-AmB administered at day 3 (Model 1) or the total duration of L-AmB administration (Model 2). This RF model was applied to the whole population of patients. Abbreviations : cut: cut-off; APACHE II: Acute Physiology and Chronic Health Evaluation; SOFA: Sequential organ failure assessment; AB: antibiòtics; CPK: creatine phospokinase; DD: D dímer; MR_SA: methicillin-resistant S. Aureus; MV: invasive mechanical ventilation; WBC: White blood cells; COPD: chronic obstructive pulmonary disease; dis: disfunction; Chr_Card_dis; chronic cardiac disease; HIV: Human immunodeficiency virus; AKI: acute kidney injury; CRP:C-reactive protein; GAP_ICU_cut: time elapsed between diagnosing pandemic viral infection and admission to ICU; Chr_renal_dis: Chronic renal disease; ID: immunosuppression ; Rx-cutoff: > 2 fields with infiltrations in chest X-ray; PCT: procalcitonin; MS_SA: Methicillin-sensitive S. aureus; GAP_diagnsosis_cut: Time from symptoms onset to diagnosis; hematol_dis: Hematologic disease; LDH: Lactate dehydrogenase).
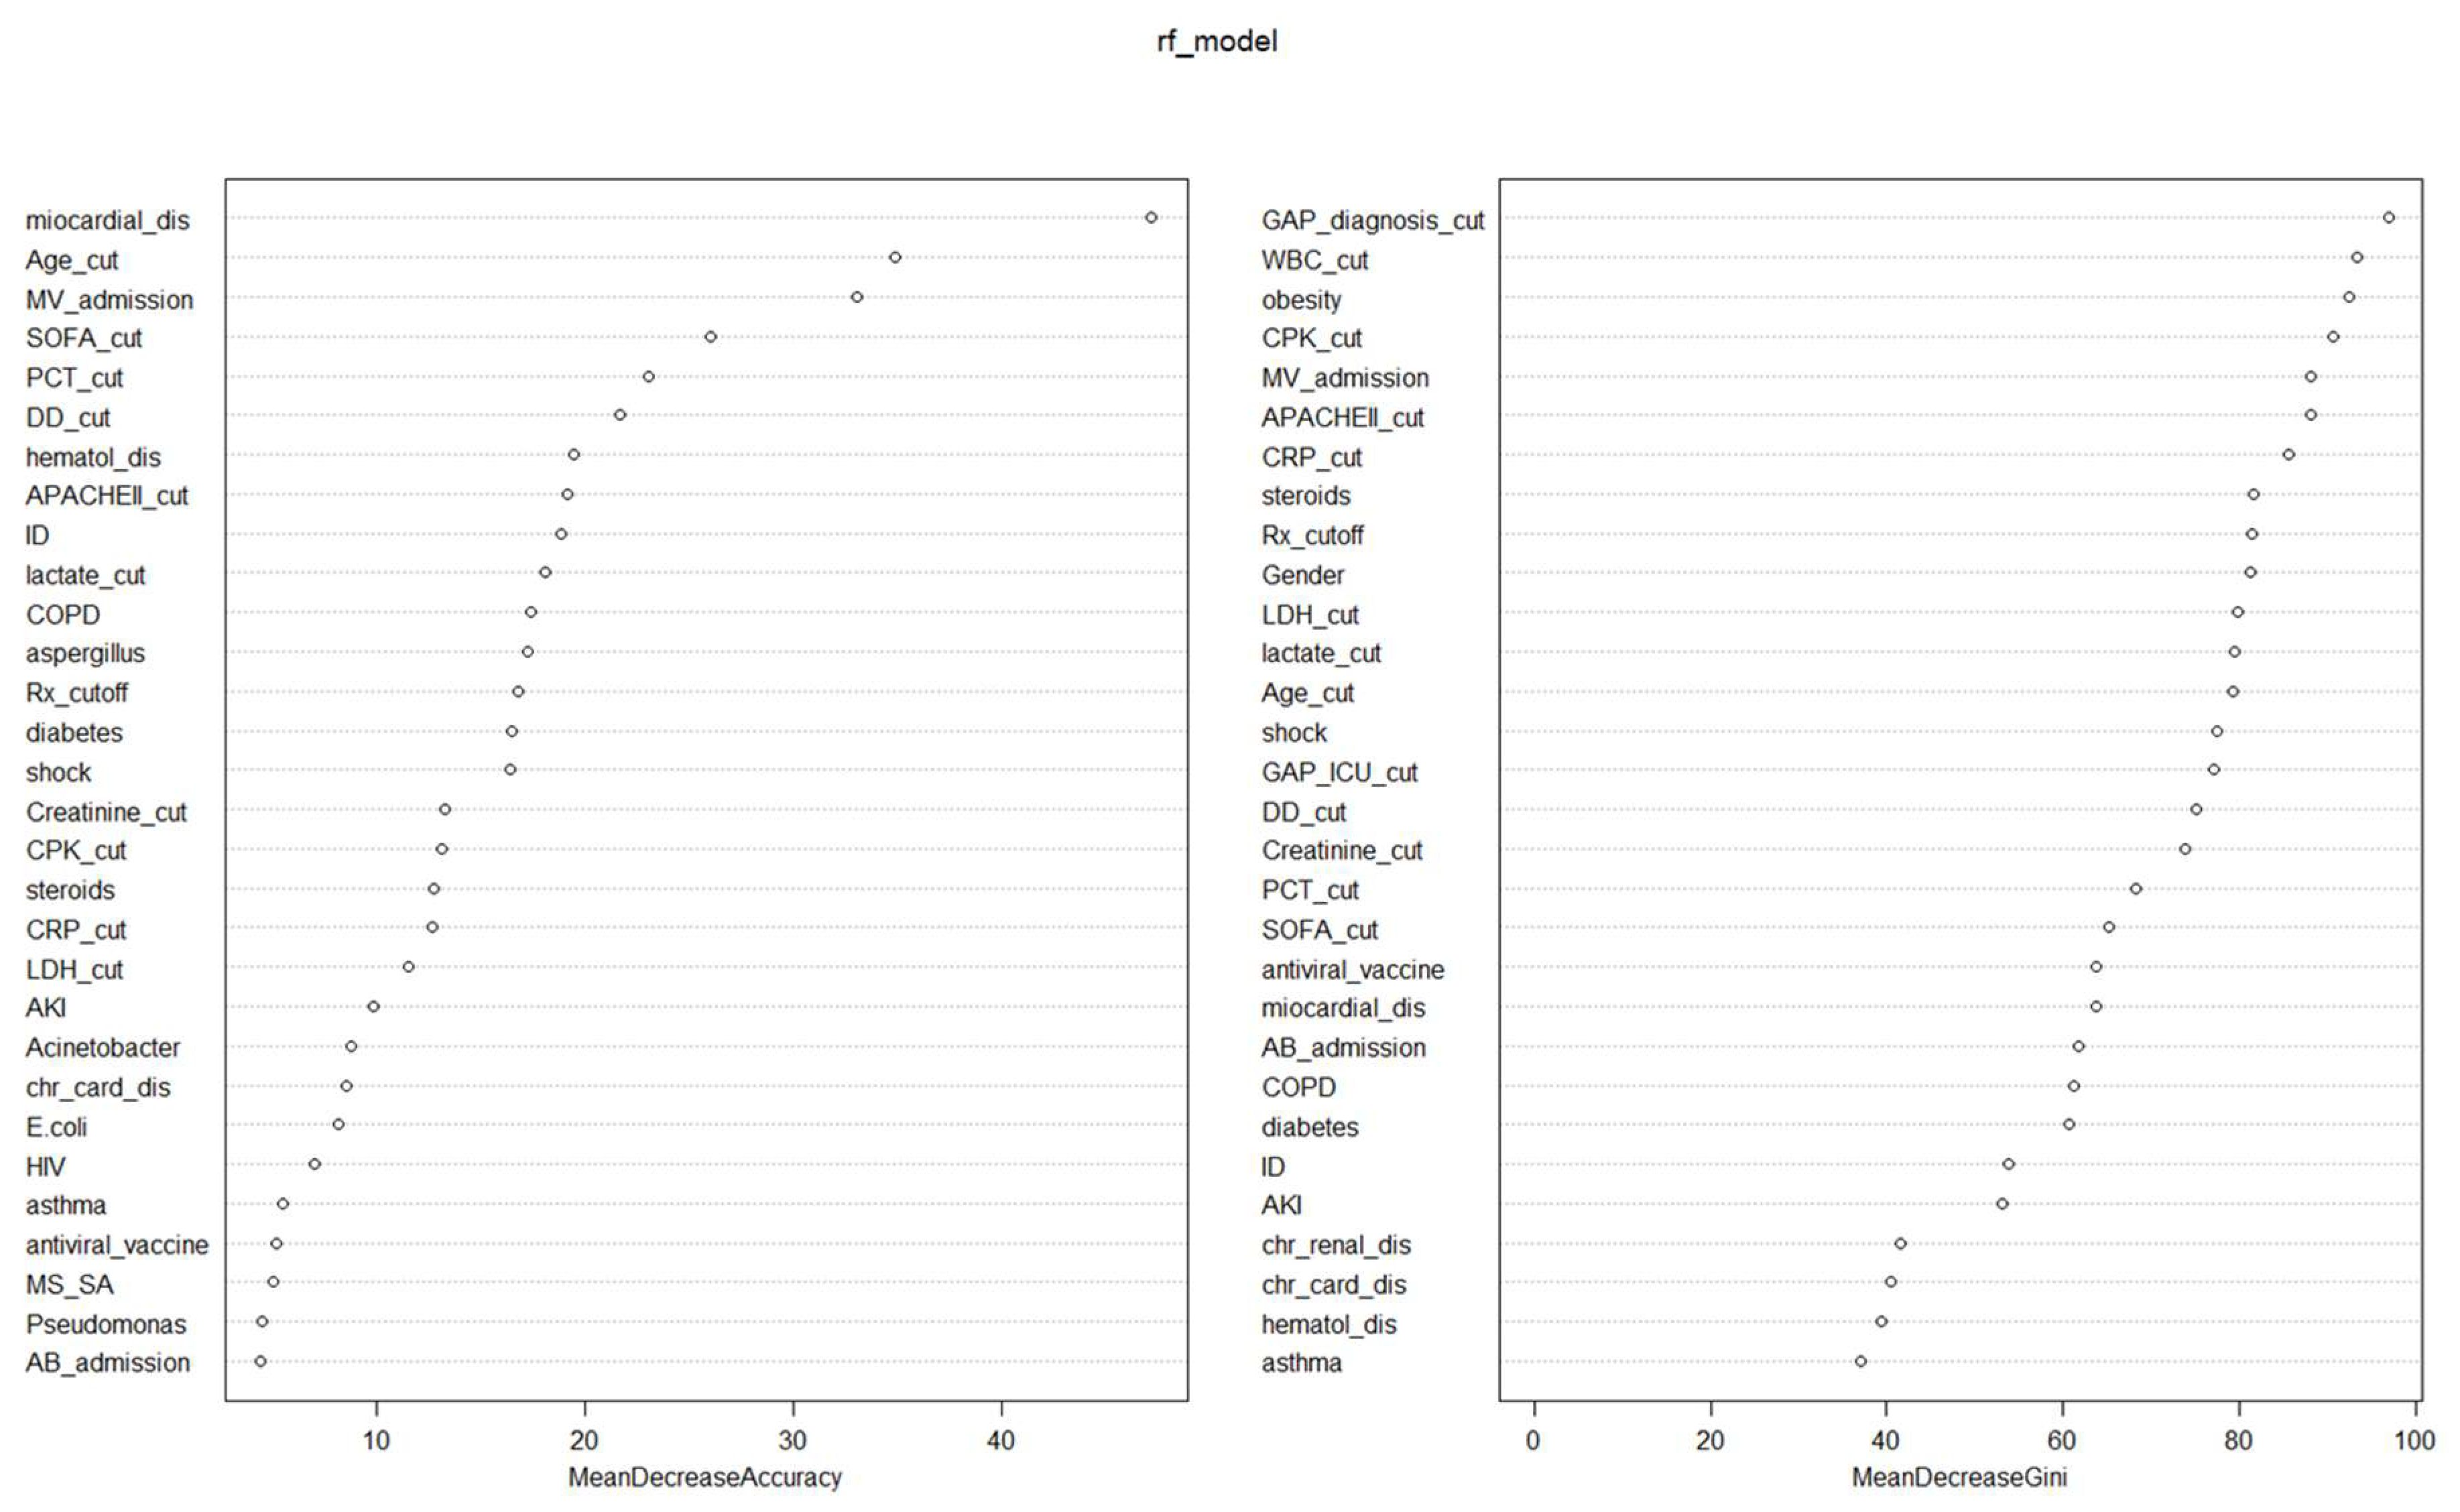
Figure 3.
Classification of patients according to the linear (Generalized Linear Model - GLM) and non-linear (Random Forest - RF) model.
Figure 3.
Classification of patients according to the linear (Generalized Linear Model - GLM) and non-linear (Random Forest - RF) model.
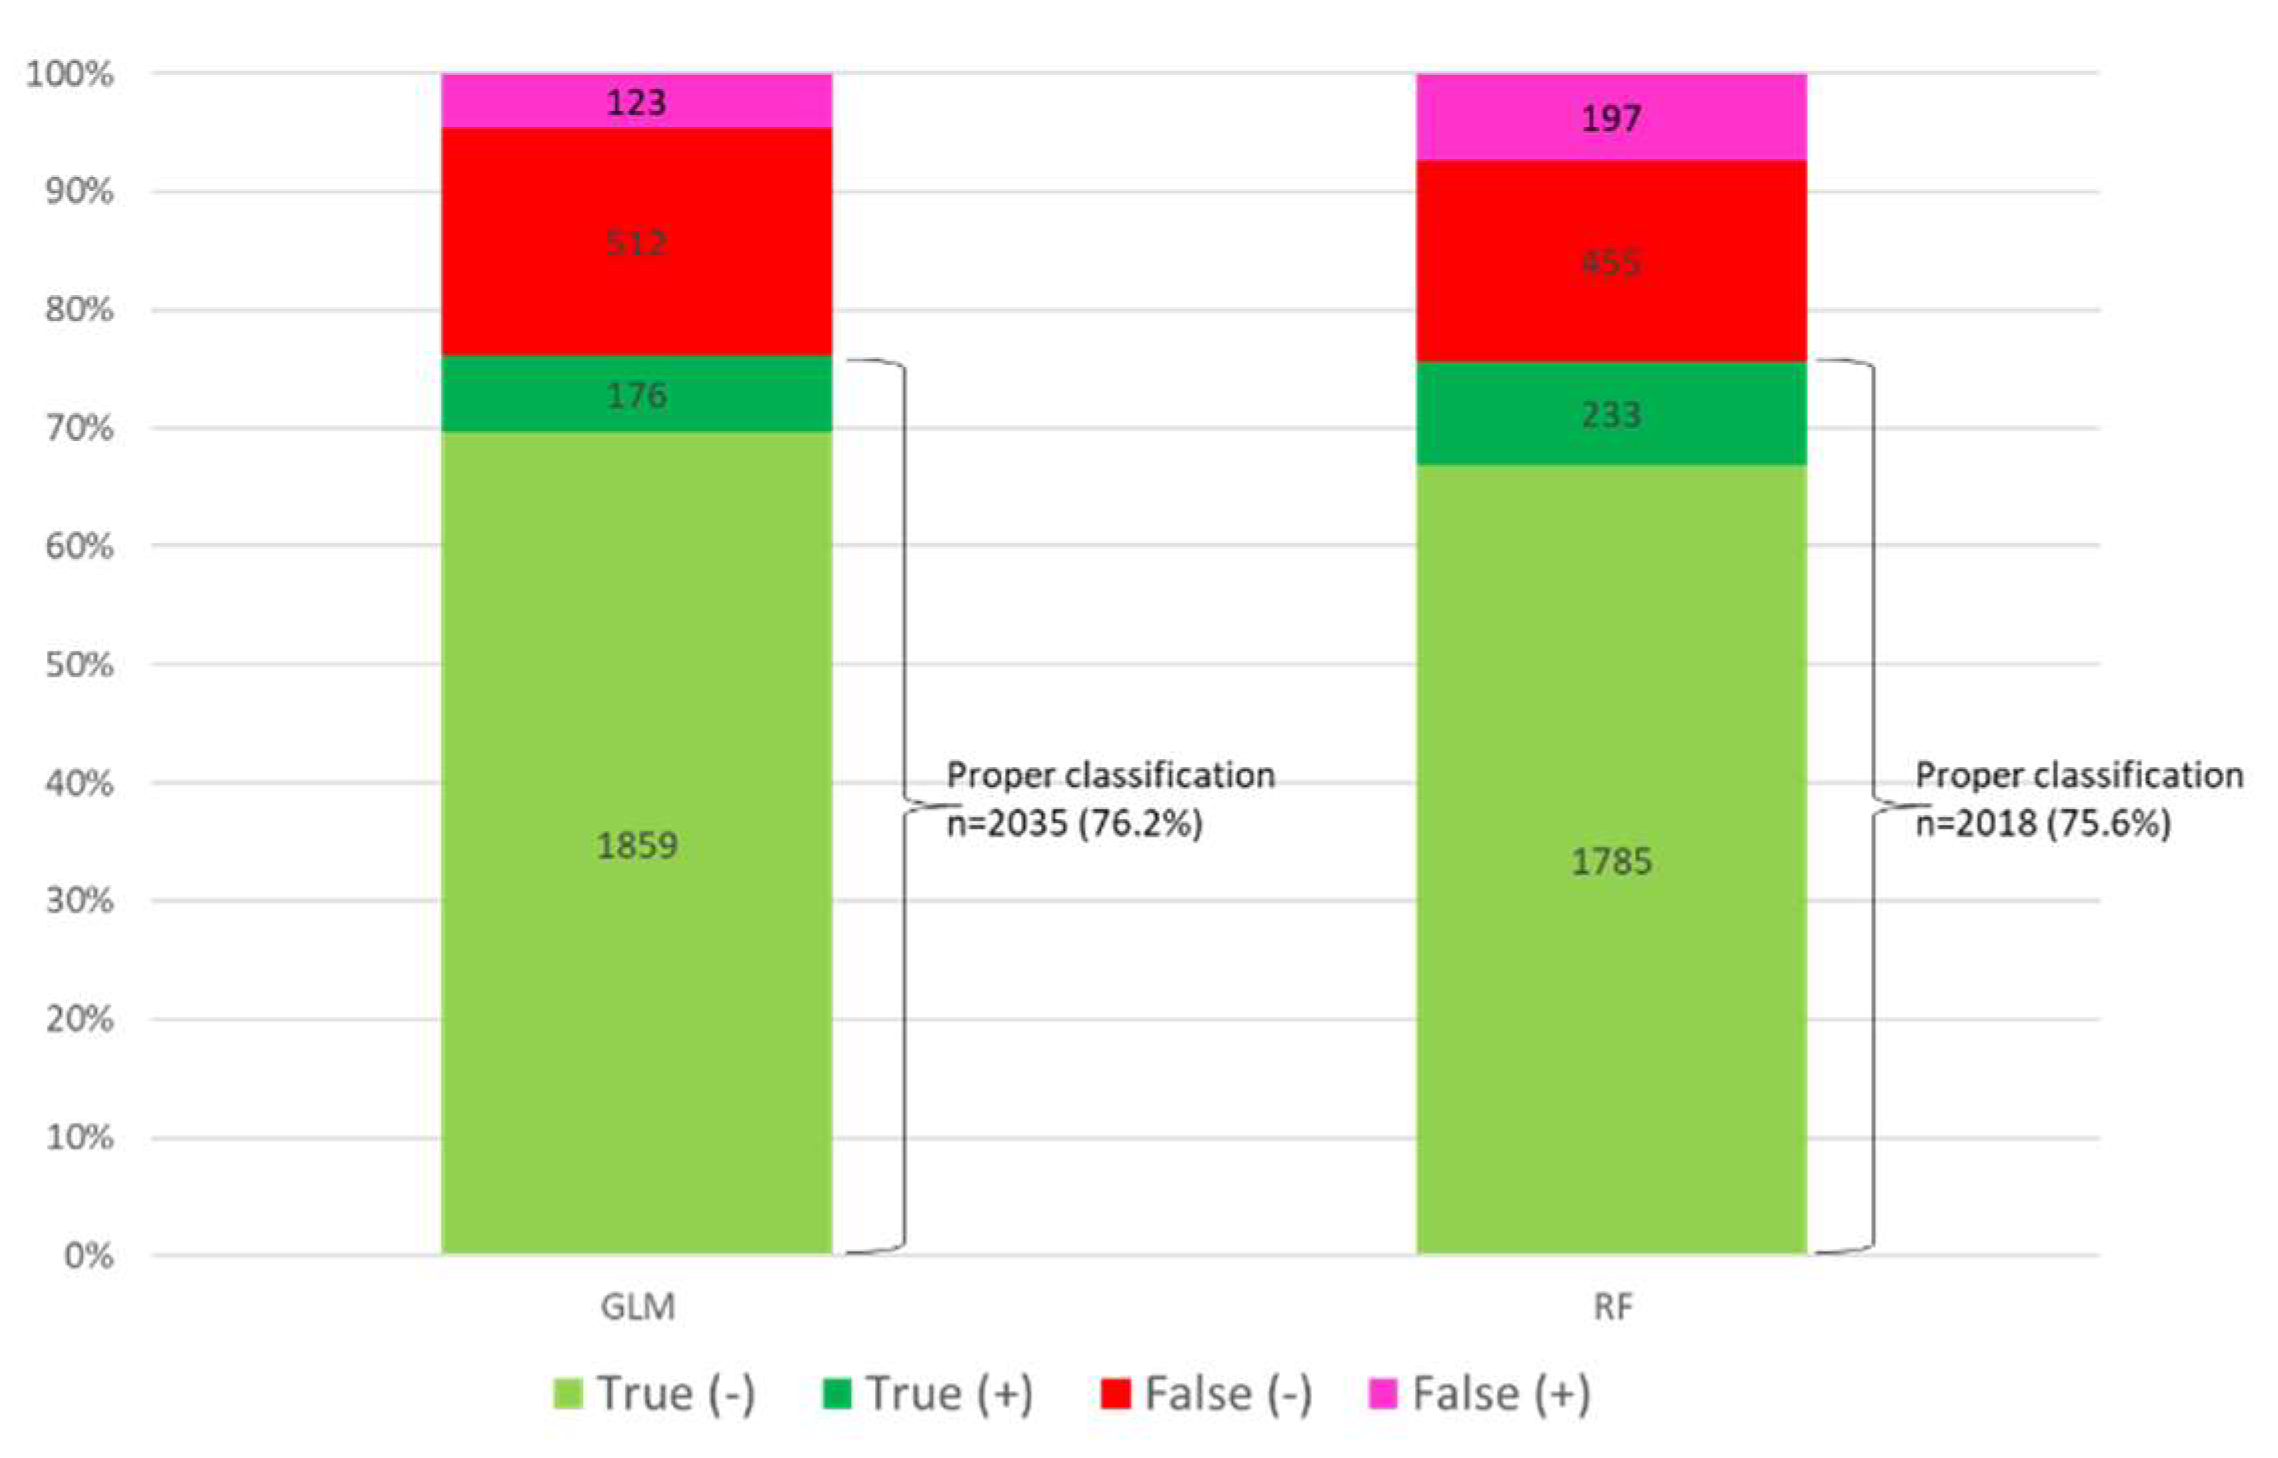
Figure 4.
Distribution of the probability generated by each model (Class) with respect to the observed (Real). (0= survivors; 1=Non-survivors).
Figure 4.
Distribution of the probability generated by each model (Class) with respect to the observed (Real). (0= survivors; 1=Non-survivors).
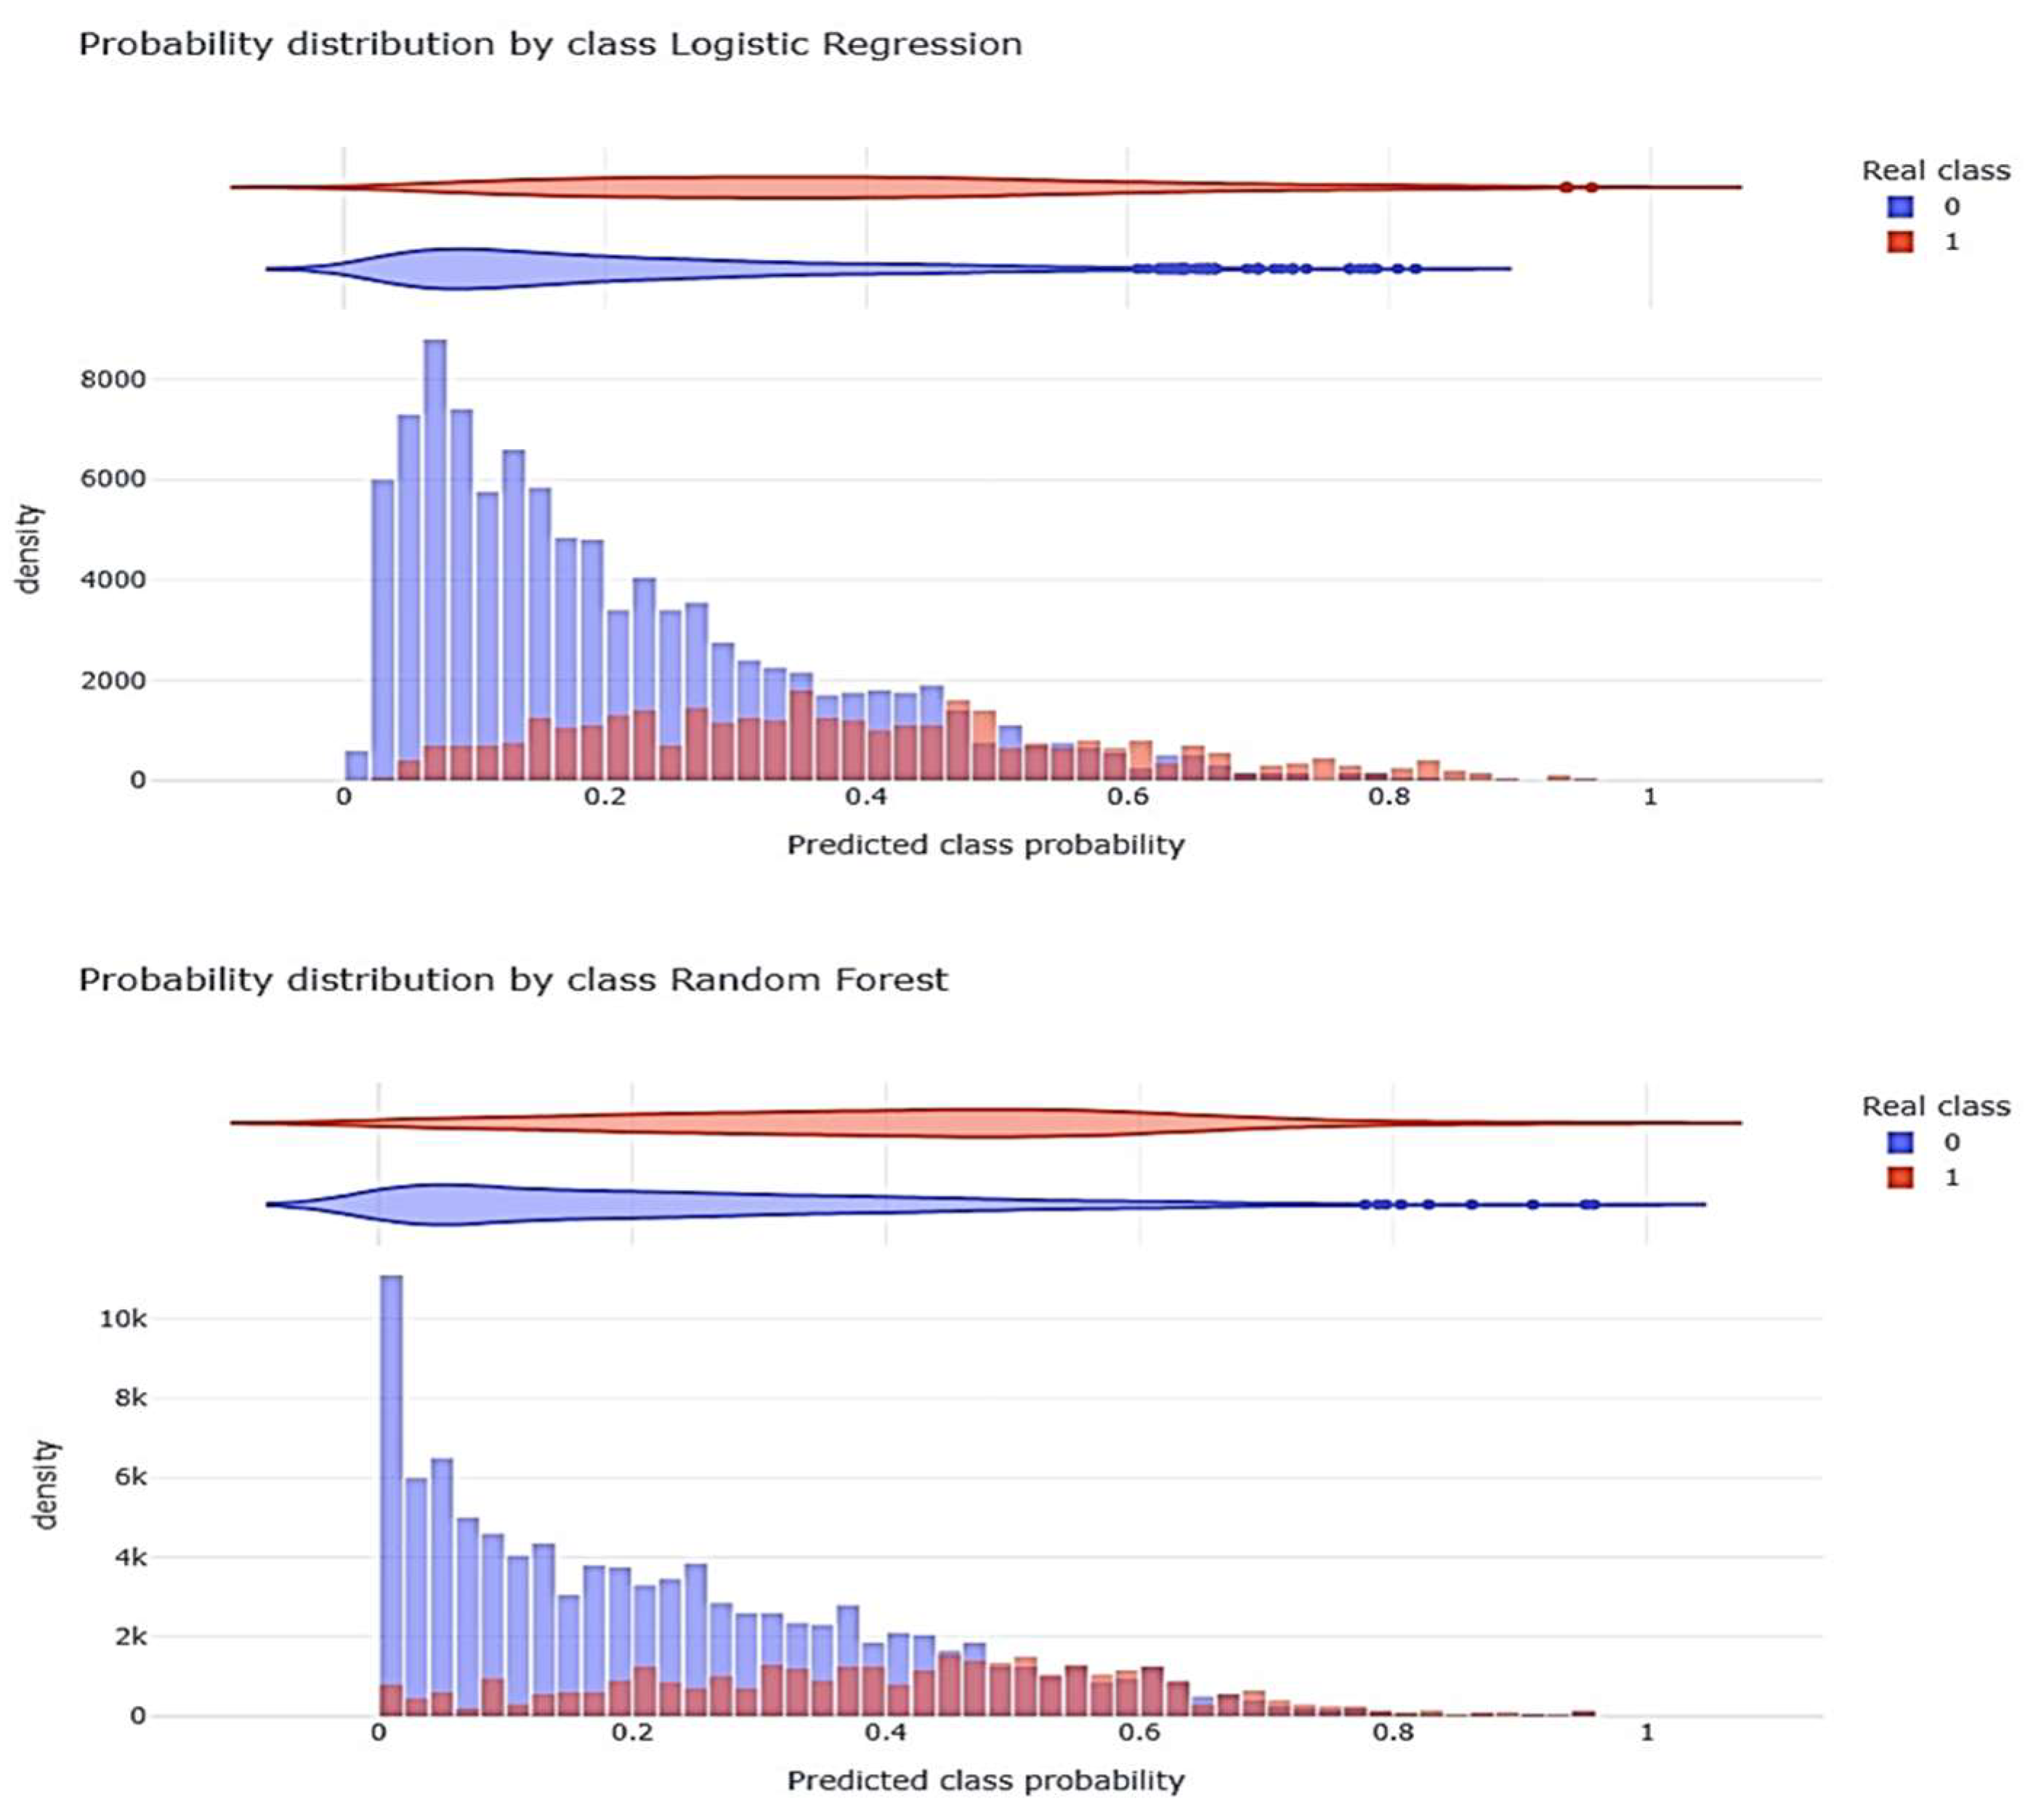

Table 1.
Baseline characteristics of the 8902 patients included in the analysis, categorized by ICU outcome with variable cut-off.
Table 1.
Baseline characteristics of the 8902 patients included in the analysis, categorized by ICU outcome with variable cut-off.
| Variable | Whole population (n= 8,902) |
Survival (n=6,608) |
Non-survival (n=2,294) |
p-value |
| General | ||||
| Age, median (Q1-Q3) years Age cut-off > 58 years, n (%) |
60 (49-70) 5177(58.1) |
58 (48-68) 3473 (52.6) |
67 (57-74) 1704 (74.3) |
<0.001 <0.001 |
| Male sex, n (%) | 5855 (65.8) | 4248 (64,3) | 1607 (70.1) | <0.001 |
| APACHE II, median (Q1-Q3) APACHE II cut-off > 13, n (%) |
14 (10-19) 5309 (59.6) |
13 (10-17) 3536 (53.5) |
17 (13-22) 1773 (77.3) |
<0.001 <0.001 |
| SOFA score, median (Q1-Q3) SOFA cut-off > 4, n (%) |
5 (3-7) 6274 (70.5) |
4(3-7) 4299 (65.1) |
6(4-9) 1975 (86.1) |
<0.001 <0.001 |
| GAP UCI, median (Q1-Q3) GAP UCI cut-off > 1 day, n (%) |
1 (1-3) 6804 (76.4) |
1 (1-3) 5085 (77.0) |
2 (0-4) 1719 (74.9) |
<0.001 0.053 |
| GAP Diagnosis, median (Q1-Q3) GAP diagnosis cut-off > 3 days, n (%) |
4 (1-7) 5413 (60.8) |
3 (1-7) 3943 (59.7) |
4 (1- 7) 1470 (64.1) |
0.012 <0.001 |
| > 2 fields with infiltrations in chest X-ray, n (%) | 5343 (60.0) | 3775 (57.1) | 1568 (68.4) | <0.001 |
| Antiviral vaccine, n (%) | 1333 (14.9) | 885 (13.4) | 448 (19.5) | <0.001 |
| Shock at ICU admission, n (%) | 3549 (39.9) | 2286 (34.6) | 1263 (55.1) | <0.001 |
| Laboratory | ||||
| White blood cells count, median (Q1-Q3) x103 White blood cells count cut-off < 8.5 x10³, n (%) |
8.6 (5.7-12.5) 4405 (49.5) |
8.5 (5.7-12.1) 3351 (50.7) |
9.0 (5.8-13.7) 1054 (45.9) |
<0.001 <0.001 |
| Lactate dehydrogenase, median (Q1-Q3) U/L Lactate dehydrogenase cut-off > 500 U/L, n (%) |
542 (403-687) 5157 (57.9) |
524 (378-665) 3593 (54.4) |
590 (458-749) 1564 (68.2) |
<0.001 <0.001 |
| C reactive protein, median (Q1-Q3) mg/dL C reactive protein cut-off >20 mg/dL , n (%) |
19.6 (9.8-34.7) 4387 (49.3) |
19.0(9.5-34.4) 3184 (48.2) |
21.1 (10.4-35.4) 1203 (52.4) |
0.001 <0.001 |
| Procalcitonin, median (Q1-Q3) ng/mL Procalcitonin cut-off >0.80 ng/mL, n (%) |
0.88 (0.20-5.67) 4606 (51.7) |
0.83 (0.20-5.08) 3350 (50.7) |
1.04 (0.23-8.20) 1256 (54.8) |
<0.001 0.001 |
| Lactate, median (Q1-Q3) mmol/L Lactate cut-off > 2mmol/L, n (%) |
2.0 (1-4-3.3) 4660 (52.3) |
2.0 (1.3-3.2) 3369 (51.0) |
2.2 (1.4-3.8) 1291 (56.3) |
<0.001 <0.001 |
| Creatinine, median (Q1-Q3) mg/dL Creatinine cut-off >0.85 mg/dL, n (%) |
0.89 (0.7-1.2) 4841 (54.4) |
0.85 (0.68-1.12) 3330 (50.4) |
1.01 (0.75-1.50) 1511 (65.9) |
<0.001 <0.001 |
| D dimer, median (Q1-Q3) ng/mL D dimer cut-off > 2700 ng/mL, n (%) |
3071 (971-6604) 4663 (52.4) |
2716 (900- 6000) 3314 (50.2) |
4180 (1200-8680) 1349 (58.8) |
<0.001 <0.001 |
| creatine phosphokinase, median (Q1-Q3) U/L creatine phosphokinase cut-off > 200 U/L, n (%) |
216 (100-420) 4707 (52.9) |
210 (97-414) 3433 (52.0) |
234 (111-442) 1274 (55.5) |
0.001 0.003 |
| Comorbidities | ||||
| Diabetes mellitus, n (%) | 1196 (13.4) | 756 (11.4) | 440 (19.2) | <0.001 |
| Asthma, n (%) | 698 (7.7) | 556 (8.4) | 142 (6.2) | 0.001 |
| COPD, n (%) | 1281 (14.4) | 936 (14.2) | 345 (15.0) | 0.32 |
| Chronic heart disease, n (%) | 623 (7.0) | 418 (6.3) | 205 (8.9) | <0.001 |
| Chronic liver disease, n (%) | 595 (6.7) | 357 (5.4) | 238 (10.4) | <0.001 |
| Pregnancy, n (%) | 480 (5.4) | 399 (6.0) | 81 (3.5) | <0.001 |
| Obesity, n (%) | 3046 (34.2) | 2256 (34.1) | 790 (34.4) | 0.81 |
| Human immunodeficiency virus, n (%) | 144 (1.6) | 107 (1.6) | 37 (1.6) | 1.00 |
| Hematologic disease, n (%) | 436 (4.8) | 237 (3.6) | 199 (8.7) | <0.001 |
| Immunosuppression, n (%) | 711 (8.0) | 401 (6.0) | 310 (13.5) | <0.001 |
| Treatment | ||||
| Steroids, n (%) | 5275 (59.2) | 3746 (56.7) | 1529 (66.7) | <0.001 |
| Antibiotics (AB) at ICU admission, n (%) | 7410 (83.2) | 5428 (82.1) | 1982 (86.4) | <0.001 |
| Appropriate empiric AB treatment, n (%) | 951 ((10.7) | 671 (10.2) | 280 (12.2) | 0.007 |
| High flow nasal cannula at admission, n (%) | 1438 (16.1) | 1138 (17.2) | 300 (13.1) | <0.001 |
| Invasive mechanical ventilation, n (%) | 4252 (47.8) | 2751 (41.6) | 1501 (65.4) | <0.001 |
| Most common aetiology of coinfection | ||||
| Coinfection, n (%) | 1211 (100) | 810 (12.3) | 401 (17.5) | <0.001 |
| Methicillin- sensitive S. aureus (MSSA), n (%) | 172 (14.2) | 111 (13.7) | 61 (15.2) | 0.47 |
| Pseudomonas aeruginosa, n (%) | 143 (11.8) | 82 (10.1) | 61 (15.2) | 0.01 |
| Klebsiella spp. N (%) | 85 (7.0) | 60 (7.4) | 25 (6.2)) | 0.45 |
| Aspergillus spp, n (%) | 78 (6.5) | 33 (4.0) | 45 (11.2) | <0.001 |
| E. coli, n (%) | 69 (5.7) | 43 (5.3) | 26 (6.3) | 0.40 |
| Methicillin- resistant S. aureus (MRSA). n (%) | 56 (4.6) | 33 (4.0) | 23 (5.7) | 0.19 |
| Acinetobacter spp, n (%) | 17 (1.4) | 4 (0.5) | 13 (3.2) | <0.001 |
| Outcomes | ||||
| ICU LOS, median (Q1-Q3) days | 13 (6-23) | 12 (6-23) | 14 (7-24) | 0.03 |
| Acute Kidney injury, n (%) | 1435 (16.1) | 855 (12.9) | 580 (25.3) | <0.001 |
(APACHE II: Acute Physiology and Chronic Health Evaluation, SOFA: Sequential Organ Failure Assessment, GAP-UCI: Time from diagnosis to ICU admission, GAP-Diagnosis: Time from symptoms onset to diagnosis, ICU: Intensive Care Unit, LOS: Length of stay.
Table 2.
Variables associated with ICU mortality in the linear multivariate analysis (GLM) and non-linear multivariate analysis (Random Forest). Significant variables in the linear model and those with a significance greater than 10% for the decrease in accuracy or greater than 50% for the decrease in GINI in the non-linear model are shown.
| GLM Model | Random Forest Model | |||
|---|---|---|---|---|
| Variable | OR | 95%CI | Decrease Accuracy | Decrease Gini |
| Age > 58 years | 2.03 | 1.74-2.36 | 34.9% | 79.2% |
| APACHE II > 13 points | 1.72 | 1.48-2.02 | 19.1% | 88.1% |
| SOFA > 4 points | 1.47 | 1.23-1.76 | 26.0% | 65.1% |
| Shock | 1.27 | 1.09-1.47 | 16.4% | 77.4% |
| Hematologic disease | 1.67 | 1.26-2.22 | 19.5% | 39.4% |
| Obesity | 1.16 | 1.01-1.32 | ----- | 92.4% |
| Diabetes | 1.37 | 1.14-1.65 | 16.5% | 60.6% |
| Immunosuppression | 1.92 | 1.53-2.42 | 18.9% | 53.0% |
| Steroids | 1.54 | 1.34-1.77 | 12.7% | 81.6% |
| Mechanical ventilation | 1.94 | 1.67-2.25 | 33.0% | 88.1% |
| Myocardial dysfunction | 3.27 | 2.53-4.28 | 47.2% | 63.6% |
| Acute kidney injury | 1.29 | 1.07-1.55 | ---- | ----- |
| > 2 fields with infiltrations in chest X-ray | 1.54 | 1.34-1.77 | 16.8% | 81.3% |
| LDH > 500 U/L | 1.41 | 1.22-1.63 | 11.5% | 79.7% |
| Creatinine > 0.85 mg/dL | 1.33 | 1.14-1.55 | 13.3% | 73.8% |
| Acinetobacter spp. | 9.95 | 2.61-47.8 | ---- | ---- |
| Aspergillus spp. | 2.45 | 1.39-4.33 | 11.2% | ---- |
| Procalcitonin >2ng/mL | ---- | ---- | 23.0% | 68.1% |
| D-dimer > 2700 ng/mL | ---- | ---- | 21.7% | 75.9% |
| Lactate > 2 mmol/L | ---- | ---- | 18.1% | 79.5% |
| COPD | ---- | ---- | 17.4% | 61.3% |
| CPK > 200 U/L | ---- | ---- | 13.1% | 90.6% |
| GAP-Diagnosis > 3 days | ---- | ---- | ---- | 96.9% |
| WBC count < 8.5 x10³ | ---- | ---- | ---- | 93.3% |
| Male | ---- | ---- | ---- | 81.3% |
| GAP-ICU < 1day | ---- | ---- | ---- | 77.1% |
Abbreviations: OR: Odds Ratio; CI: confidence interval; APACHE II: Acute Physiology and Chronic Health Evaluation; SOFA: Sequential organ failure assessment; LDH: lactate dehydrogenase; GAP-UCI: Time from diagnosis to ICU admission; GAP-Diagnosis: Time from symptoms onset the diagnosis; ICU: Intensive Care Unit; COPD: Chronic obstructive pulmonary disease; CPK: Creatine phosphokinase; WBC: white blood cells.
Disclaimer/Publisher’s Note: The statements, opinions and data contained in all publications are solely those of the individual author(s) and contributor(s) and not of MDPI and/or the editor(s). MDPI and/or the editor(s) disclaim responsibility for any injury to people or property resulting from any ideas, methods, instructions or products referred to in the content. |
© 2025 by the authors. Licensee MDPI, Basel, Switzerland. This article is an open access article distributed under the terms and conditions of the Creative Commons Attribution (CC BY) license (http://creativecommons.org/licenses/by/4.0/).
Copyright: This open access article is published under a Creative Commons CC BY 4.0 license, which permit the free download, distribution, and reuse, provided that the author and preprint are cited in any reuse.


