
Submitted:
13 May 2024
Posted:
14 May 2024
You are already at the latest version
Preprints on COVID-19 and SARS-CoV-2
Abstract
COVID-19 has substantially influenced healthcare systems, requiring early prognosis for innovative therapies and optimal results, especially in individuals with comorbidities. Healthcare practitioners have used AI systems for investigating, anticipating, and predicting diseases, through means including medication development, clinical trial analysis, and pandemic forecasting. This study proposes the use of AI to predict disease severity in terms of hospital mortality among COVID-19 patients.
Methodology: A cross-sectional study was conducted the approval from the Research Ethics Committee of King Abdulaziz University (KAU), Saudi Arabia. The study used sequential sampling approaches to include 50 Real-Time Polymerase Chain Reaction (RT-PCR) positive COVID-19 patients from KAU's coronavirus isolation wards. A pre-designed form was used to collect each patient's demographic information, including age and gender, signs and symptoms, illness severity (mild, moderate, severe), and laboratory findings. Furthermore, the length of the hospital stay and the result, whether the patient recovered or died, were reported.
Results: The study involved 50 patients with varying degrees of disease severity, most of whom suffered from fever, fatigue, cough, sore throat, and diarrhoea. Laboratory analysis of COVID-19 patients showed increased white blood cell and platelet counts, with C-reactive protein levels above normal. Elevated LDH levels indicated possible tissue damage, while ferritin levels were elevated. Other enzymes were in the normal range, but bilirubin levels were slightly elevated. Overall, the patient's lab results indicated inflammation and possible blood clot formation. The study evaluated the predictive accuracy for outcomes and mortality of COVID-19 patients based on factors such as CRP, LDH, Ferritin, ALP, Bilirubin, D-dimers, and hospital stay (p-value ≤0.05). The predictive accuracy mortality of patients with COVID-19 using AI showed Hospital stay, D-Dimers ALP, Bilirubin, LDH, CRP, and Ferritin significantly affected hospital mortality. (p ≤ 0.0001).
Conclusion: Artificial Intelligence is crucial for identifying early coronavirus infections and monitoring patient conditions. It improves treatment consistency and decision-making via the development of algorithms. AI can track the crisis at various scales, facilitate research, and aid in developing treatment regimens, prevention strategies, and drugs and vaccines. It also aids in monitoring health and facilitating research on the virus.
Keywords:
Artificial intelligence
; Clinical decision support systems
; Predictive tools
; Disease severity
; Mortality
Introduction
A virus is an infectious microbe with a unique genome and protein layer that can reproduce within live cells. By hijacking host cells, these tiny, potent viruses can cause significant health issues [1]. SARS-CoV-2, a new Coronavirus, belongs to a larger family of pathogenic viruses that target the respiratory system of humans. It was discovered in 2002 and caused mild infection in China [2]. The seventh strain of SARS-COV-2, COVID-19, emerged in December 2019, causing respiratory problems and having a high transmission rates among species [3]. In January 2020, the WHO labelled it a public health emergency of international concern (PHEIC) because of its lethal effect on human life [4].
Pandemics and epidemics are characterized by the spread of infectious diseases over a specific period, leading to significant morbidities and mortalities. The SARS epidemic, which infected over 8,096 individuals and resulted in over 770 deaths, had greatly devastating effects [5]. Over 213 nations and territories have been affected by the pandemic since its first outbreak in China, infecting more than 98,529,820 people and killing more than 2,116,101 people [6]. The World Health Organization has declared COVID-19 a pandemic, and experts are formulating measures to mitigate its impact on human health and the economy [7].
COVID-19 has a substantial impact on healthcare systems, particularly in patients with Acute Respiratory Syndrome (ARS), necessitating early prognosis for innovative therapies and better results, especially in those with comorbidities [8].
RT-PCR is the standard method for detecting COVID-19 patients as early as possible for effective therapy and containment [9]. Advances in alternative diagnostic technologies are required to speed up detection and treatment, as healthcare professionals and medical personnel are limited, leading to radiologists’ becoming overburdened [10]. AI specialists recommend creating ML and DL approaches to help radiologists anticipate and diagnose pneumonia using imaging modalities and chest scans, which would enable physicians to better combat the disease [11,12].
Classification and regression accuracy are improved with deep learning approaches because the latter have autonomous learning and feature representation capabilities, thereby eliminating the need for human expertise [13]. The development of auxiliary tools for detecting COVID-19-infected humans is crucial. Computer Tomography (CT) and Chest X-Ray (CXR) images of the lungs are linked to COVID-19 detection [14]. AI systems have been used by healthcare practitioners since 1976 for investigating, anticipating, and predicting diseases, including medication development, clinical trial analysis, and pandemic forecasting [15].
Despite advancements in COVID-19 detection, there is no risk prediction model for early disease severity identification. Recent models and artificial networks have high sensitivity and specificity for predicting morbidity and mortality, but they rely on genetic susceptibility, requiring screening for multiple mutations that are not applicable to the general population. The current study develops a risk prediction model for COVID-19 outcomes using artificial networks and minimal routine laboratory indices, focusing on admission to the Emergency Department to enhance its value in clinical practice.
Methodology
Research Ethics Committee boards approved a study, waived written informed consent, and de-identified patient data to avoid confidentiality breaches.
Patient Cohorts
A cross-sectional study was conducted after approval from the Research Ethics Committee of King Abdulaziz University (KAU), Saudi Arabia. The study used sequential sampling approaches to include 50 Real Time Polymerase Chain Reaction (RT-PCR)-positive COVID-19 patients from KAU's coronavirus isolation wards. Medical records were collected and analyzed by clinical teams. The results of RT-PCR were obtained from electronic medical records using approved TaqMan One-Step Kits. Positive results on the last-performed test confirmed diagnosis for patients with multiple assays.
Demographic and Clinical Information
Demographic information about each patient was gathered, including age, gender, symptoms, white blood cell and lymphocyte counts, comorbidity status, and history of COVID-19 exposure. Information on patients’ mechanical breathing, intense medical treatment, death progression, admission and discharge times, and illness severity were all recorded based on symptom records, clinical findings, and chest X-rays. A pre-designed form was used to record each patient's demographic information, including age and gender, signs and symptoms, illness severity (mild, moderate, severe), and laboratory findings. Furthermore, the length of the hospital stay and the outcome, whether the patient recovered or died, were reported. Treatment information and clinical results were tracked over the following weeks until discharge.
Predictive Analysis
Predictive analytics, a subset of advanced analytics, uses historical data, statistical algorithms, and machine learning techniques to forecast future occurrences or outcomes. Through the examination of data patterns, trends are identified and future behaviors or events are predicted. Historical data serves as the basis for training forecasting models in this area. These models are then used to extrapolate predictions from new or unpublished data. Predictions range from simple binary outcomes such as positive or negative responses to complex scenarios involving multiple possible outcomes.
In the current study, to predict disease severity in terms of hospital mortality among COVID-19 patients, the steps outlined in the following paragraphs were followed. The study recorded demographic details, signs and symptoms, disease severity (Table 1), as well as laboratory findings such as bilirubin, AST, ALT, phosphomonoesterases, GGT, protein, CRP, D-Diamers, white blood cell, platelets, LDH, prothrombin time, and ferritin (ng/mL) (Table 2).
Data Preprocessing
Data were cleaned through the handling of missing values, the categorical variables were coded according to categorical variables, and the quantitative variables’ missing values were replaced by their mean. The outcome variable (hospital mortality) was properly labelled as death=0 or survival=1. All the baseline investigations, clinical symptoms, and laboratory findings were labeled as predictors.
Statistical Analysis
Data were entered and analyzed in SPSS. Mean±SD was calculated for quantitative variables and Frequency/percentages for qualitative variables. The mean difference among laboratory findings for the outcome variables was calculated by means of an independent sample t-test. p-value<0.05 was significant.
Results
Demographics and Baselines of COVID-19 Patients
The study included 50 patients, with an average age of 50.9 years (SD=15.09). Patients stayed in the hospital for an average duration of 14.6 days (SD=2.8). Gender distribution revealed 56.0% male and 44.0% female participants. Disease severity varied, with 34.0% experiencing mild symptoms, 46.0% moderate, 14.0% severe, and 6.0% critical conditions. Common symptoms included fever (48.0%), fatigue (38.0%), cough (36.0%), sore throat (24.0%), and diarrhoea (24.0%). Less common symptoms were nausea (16.0%) and abdominal pain (10.0%). The majority of patients (88.0%) survived, while 12.0% unfortunately died due to COVID-19 (Table 1).
Laboratory Parameters in COVID-19 Patients
Analysis of laboratory parameters in the COVID-19 patients revealed significant details. The average white blood cell count was 11.91 × 10^9 /L, indicating a broad range, predominantly above the normal threshold. Platelet count averaged 220.0 × 10^9 /L, remaining within the expected range. However, C-reactive protein (CRP) levels were notably elevated, averaging 60.18 mg/L, suggesting heightened inflammation. Lactate dehydrogenase (LDH) levels exhibited a mean of 296.98 U/L, indicating potential tissue damage. Ferritin levels were also elevated, with a mean of 479.89 ng/mL, implying inflammation or iron overload. D-dimer levels showed an average of 438.59 mg/L, indicative of possible blood clot formation. While alkaline phosphatase (ALP), gamma-glutamyl transferase (GGT), alanine transaminase (ALT), and aspartate aminotransferase (AST) levels generally fell within normal ranges, bilirubin levels were slightly elevated, averaging 0.63 mg/dL. Prothrombin time and calcium levels remained within expected parameters, while potassium levels averaged 4.05 mEq/L, within normal limits (Table 2).
There was a significant difference in CRP, LDH, Ferritin, ALP, Bilirubin, D-Dimers and Hospital stay with a p-value <0.05 (Table 3).
Prediction of Mortality
Discussion
Early detection and treatment of COVID-19 disease is crucial for decreased mortality, especially for severely ill patients. Acute respiratory distress syndrome affects 15% of patients, and more than half of ICU admissions are due to hypoxia or respiratory fatigue. Analysis using AI systems based on clinical data can predict disease development more accurately than clinical data alone, improving patient care by combining information from different sources.
Computers are expected to play a crucial role in combating global health emergencies, with AI being extensively applied to predict clinical outcomes of hospitalization and mortality. AI is produced by computer systems capable of doing tasks that require human-like intellect, with machine learning playing a critical role in providing high prediction accuracy and scalability [16]. Substantial efforts from the scientific community have aimed to integrate AI, particularly machine learning, into predictive modeling for COVID-19-related outcomes [17].
Machine Learning (ML) and Deep Learning (DL) are key components of AI which use algorithms to learn and adapt from data. Deep learning (DL), a subset of machine learning, extracts complicated information using neural networks with numerous layers; it includes deep, deep belief, and recurrent learning.
A comprehensive overview in a study conducted in 2021 found AI applications in the field of COVID-19 address various areas and have many benefits. In disease diagnosis, AI helps in the interpretation of various tests and symptoms and facilitates the rapid and accurate identification of infections. AI also contributes to patient monitoring by enabling continuous assessment and timely intervention. It plays a crucial role in determining the severity of a patient's condition and helps healthcare providers prioritize treatment strategies effectively. When processing imaging tests related to COVID-19, AI algorithms improve the analysis of radiological scans and enable rapid detection of abnormalities indicative of infection by the virus. Epidemiology benefits from AI-driven predictive modeling, which helps to predict outbreaks, track transmission patterns, and develop targeted intervention strategies [18].
The study conducted by Hussain et al., in 2020 used AI tools to deduct range of ways to fight COVID-19. The study provides an overview of various techniques and methods applicable to different types of medical information-driven pandemic mitigation efforts. The report classifies AI approaches in clinical data analysis, such as neural networks, SVM, and edge significance learning and identifies locations that use AI-driven cloud computing to battle COVID-19 [19].
The other important study in 2020 conducted by Wynants et al., provided a detailed assessment of COVID-19 diagnosis and prognosis, assessing prediction models' accuracy and value in detecting suspected infections, forecasting patient outcomes, and identifying persons at increased risk of infection or hospitalization [20].
AI is currently being used to predict COVID-19 mortality and hospitalization by combining patient demographics, medical history, vital signs, and laboratory data. The objective is to identify high-risk individuals so that they can receive prompt medical treatment. Mortality studies employ comparable input factors, with an emphasis on illness severity and progression. Machine learning also predicts hospitalization and death, taking into account the interplay of these events [21,22,23].
Due to their excellent accuracy, machine learning algorithms, notably Random Forest, have been successful in predicting COVID-19-related hospitalization and mortality. Random Forest operates by constructing multiple decision trees and aggregating predictions, effectively capturing complex data relationships [24]. Its versatility allows for handling diverse input variables without extensive preprocessing. Additionally, Random Forest provides insights into feature importance, aiding in identifying key predictors of COVID-19 outcomes. These analytical advantages make Random Forest a valuable tool in medical research and decision-making processes surrounding COVID-19 [16].
Conclusions
The integration of artificial intelligence, particularly machine learning, has significantly advanced the fight against COVID-19. From diagnosis to predicting outcomes to modeling future trends, AI has played a crucial role in interpreting data, improving patient care, and predicting outbreak dynamics. In addition, the application of machine learning models has significantly improved predictive accuracy and provided valuable insights into COVID-19-related hospital admissions and mortality rates. During a global health crisis, AI can improve public health and solve pandemic-related issues by improving decision-making and patient outcomes.
Author Contributions
All Authors contributed equally to the work.
Conflicts of Interest
All authors declared no conflict of interest.
References
- Domingo EJVap. Introduction to virus origins and their role in biological evolution. 2020:1.
- Kang S, Peng W, Zhu Y, Lu S, Zhou M, Lin W, et al. Recent progress in understanding 2019 novel coronavirus (SARS-CoV-2) associated with human respiratory disease: detection, mechanisms and treatment. 2020;55(5):105950.
- Mohapatra RK, Pintilie L, Kandi V, Sarangi AK, Das D, Sahu R, et al. The recent challenges of highly contagious COVID-19, causing respiratory infections: Symptoms, diagnosis, transmission, possible vaccines, animal models, and immunotherapy. 2020;96(5):1187-208.
- Wilder-Smith A, Osman SJJotm. Public health emergencies of international concern: a historic overview. 2020;27(8):taaa227.
- Yang Y, Peng F, Wang R, Guan K, Jiang T, Xu G, et al. The deadly coronaviruses: The 2003 SARS pandemic and the 2020 novel coronavirus epidemic in China. 2020;109:102434.
- Mohan B, Nambiar VJJIDE. COVID-19: an insight into the SARS-CoV-2 pandemic originated at Wuhan City in Hubei Province of China. 2020;6(4):146.
- Adil MT, Rahman R, Whitelaw D, Jain V, Al-Taan O, Rashid F, et al. SARS-CoV-2 and the pandemic of COVID-19. 2021;97(1144):110-6.
- Mallah, S.; Ghorab, O.K.; Al-Salmi, S.; Abdellatif, O.S.; Tharmaratnam, T.; Iskandar, M.A.; Sefen, J.A.N.; Sidhu, P.; Atallah, B.; El-Lababidi, R.; et al. COVID-19: breaking down a global health crisis. Ann. Clin. Microbiol. Antimicrob. 2021, 20, 35. [Google Scholar] [CrossRef]
- Lan, L.; Xu, D.; Ye, G.; Xia, C.; Wang, S.; Li, Y.; Xu, H. Positive RT-PCR Test Results in Patients Recovered From COVID-19. Jama-Journal Am. Med Assoc. 2020, 323, 1502–1503. [Google Scholar] [CrossRef] [PubMed]
- Fields, B.K.; Demirjian, N.L.; Gholamrezanezhad, A. Coronavirus Disease 2019 (COVID-19) diagnostic technologies: A country-based retrospective analysis of screening and containment procedures during the first wave of the pandemic. Clin. Imaging 2020, 67, 219–225. [Google Scholar] [CrossRef] [PubMed]
- Aruleba, R.T.; Adekiya, T.A.; Ayawei, N.; Obaido, G.; Aruleba, K.; Mienye, I.D.; Aruleba, I.; Ogbuokiri, B. COVID-19 Diagnosis: A Review of Rapid Antigen, RT-PCR and Artificial Intelligence Methods. Bioengineering 2022, 9, 153. [Google Scholar] [CrossRef]
- Majumder DDJIs. A unified approach to artificial intelligence, pattern recognition, image processing and computer vision in fifth-generation computer systems. 1988;45(3):391-431.
- Elshawi R, Maher M, Sakr SJapa. Automated machine learning: State-of-the-art and open challenges. 2019.
- Gudigar, A.; Raghavendra, U.; Nayak, S.; Ooi, C.P.; Chan, W.Y.; Gangavarapu, M.R.; Dharmik, C.; Samanth, J.; Kadri, N.A.; Hasikin, K.; et al. Role of Artificial Intelligence in COVID-19 Detection. Sensors 2021, 21, 8045. [Google Scholar] [CrossRef]
- Yang, Y.; Lure, F.Y.M.; Miao, H.; Zhang, Z.; Jaeger, S.; Liu, J.; Guo, L. Using artificial intelligence to assist radiologists in distinguishing COVID-19 from other pulmonary infections. J. X-Ray Sci. Technol. 2021, 29, 1–17. [Google Scholar] [CrossRef] [PubMed]
- Shakibfar, S.; Nyberg, F.; Li, H.; Zhao, J.; Nordeng, H.M.E.; Sandve, G.K.F.; Pavlovic, M.; Hajiebrahimi, M.; Andersen, M.; Sessa, M. Artificial intelligence-driven prediction of COVID-19-related hospitalization and death: a systematic review. Front. Public Heal. 2023, 11, 1183725. [Google Scholar] [CrossRef]
- Bilinski A, Thompson K, Emanuel EJJ. COVID-19 and excess all-cause mortality in the US and 20 comparison countries, June 2021-March 2022. 2023;329(1):92-4.
- Tayarani MJC, Solitons, Fractals. Applications of artificial intelligence in battling against COVID-19: A literature review. 2020:110338.
- Hussain, A.A.; Bouachir, O.; Al-Turjman, F.; Aloqaily, M. Notice of Retraction: AI Techniques for COVID-19. IEEE Access 2020, 8, 128776–128795. [Google Scholar] [CrossRef] [PubMed]
- Wynants, L.; Van Calster, B.; Collins, G.S.; Riley, R.D.; Heinze, G.; Schuit, E.; Bonten, M.M.J.; Dahly, D.L.; Damen, J.A.; Debray, T.P.A.; et al. Prediction models for diagnosis and prognosis of covid-19: Systematic review and critical appraisal. BMJ 2020, 369, m1328. [Google Scholar] [CrossRef] [PubMed]
- Chen JH, Asch SMJTNEjom. Machine learning and prediction in medicine—beyond the peak of inflated expectations. 2017;376(26):2507.
- Polilli, E.; Frattari, A.; Esposito, J.E.; D’amato, M.; Rapacchiale, G.; D’intino, A.; Albani, A.; Di Iorio, G.; Carinci, F.; Parruti, G. Reliability of predictive models to support early decision making in the emergency department for patients with confirmed diagnosis of COVID-19: the Pescara Covid Hospital score. BMC Heal. Serv. Res. 2022, 22, 1–17. [Google Scholar] [CrossRef] [PubMed]
- Wang, A.; Li, F.; Chiang, S.; Fulcher, J.; Yang, O.; Wong, D.; Wei, F. Machine Learning Prediction of COVID-19 Severity Levels From Salivaomics Data. . 2022. [Google Scholar]
- Feng, C.; Kephart, G.; Juarez-Colunga, E. Predicting COVID-19 mortality risk in Toronto, Canada: a comparison of tree-based and regression-based machine learning methods. BMC Med Res. Methodol. 2021, 21, 1–14. [Google Scholar] [CrossRef] [PubMed]
Figure 1.
Predictive accuracy of mortality according to lab findings. Predictive accuracy of algorithms.
Figure 1.
Predictive accuracy of mortality according to lab findings. Predictive accuracy of algorithms.
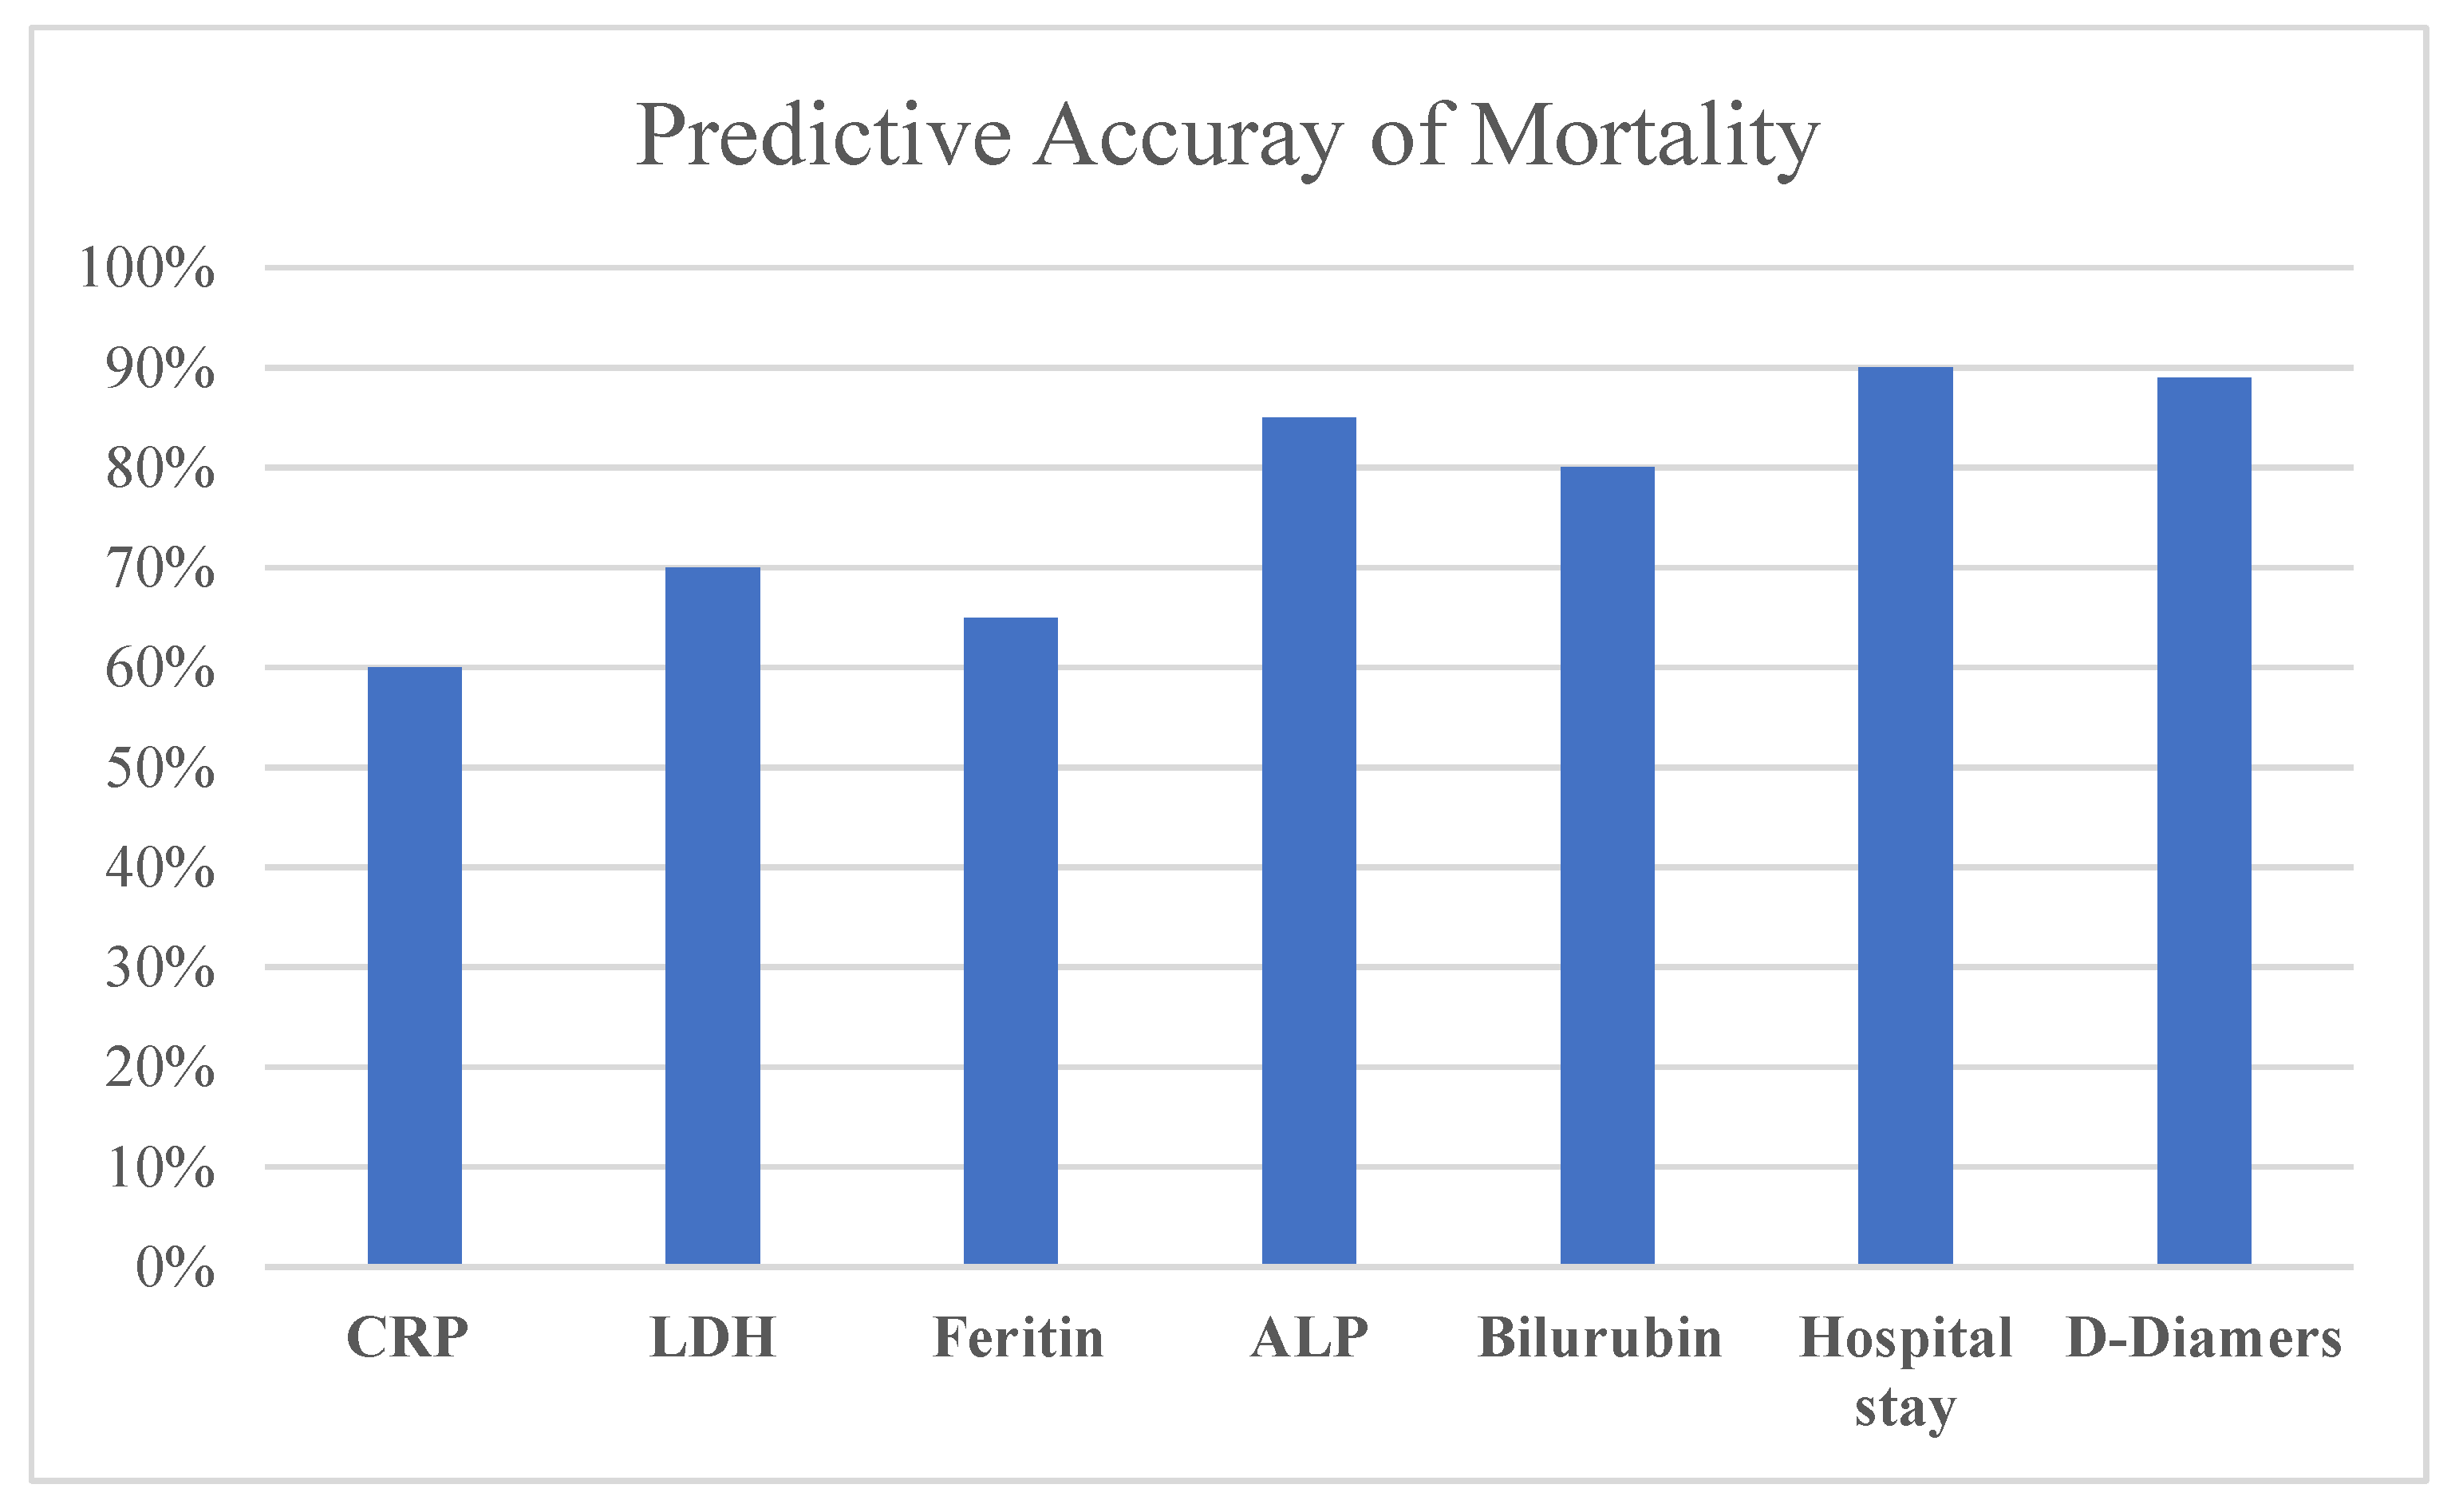

Table 1.
Covid-19 patients’ demographics and baseline characteristics.
| Variables | ||
| Age (Mean +SD) | 50.9+15.09 | |
| Hospital stay (Days) | 14.6+2.8 | |
| Frequency | Percentages (%) | |
| Gender | ||
| Male | 28 | 56.0 |
| Female | 22 | 44.0 |
| Disease Severity | ||
| Mild | 17 | 34.0 |
| Moderate | 23 | 46.0 |
| Severe | 7 | 14.0 |
| Critical | 3 | 6.0 |
| Sign & Symptoms | ||
| Fever | 24 | 48.0 |
| Cough | 18 | 36.0 |
| Sore throat | 12 | 24.0 |
| Diarrhea | 12 | 24.0 |
| Fatigue | 19 | 38.0 |
| Nausea | 8 | 16.0 |
| Abdominal pain | 5 | 10.0 |
| Outcome | ||
| Death | 6 | 12.0 |
| Survived | 44 | 88.0 |
Table 2.
Baseline Laboratory Parameters.
| Laboratory parameters | Normal Range | Mean± SD | Minimum | Maximum | Range |
| White Blood Cell×109 /L | 3.5-9.5 | 11.91±12.9 | 0.741 | 76.6 | 75.85 |
| Platelets ×109/L | 125-350 | 220.0±80.5 | 40.0 | 418.0 | 378.0 |
| CRP mg/L | <3 | 60.18±83.01 | 0.10 | 322.13 | 322.03 |
| LDH, (U/L) | 140 to 280 | 296.98±163.01 | 155.0 | 1044.0 | 889.0 |
| Ferritin, (ng/mL) | 12 to 300 | 479.89±436.07 | 8.0 | 1675 | 1667 |
| D-Diamers mg/L | > 0.5 | 438.59±443.0 | 0.2 | 1600.0 | 1599.8 |
| Alkaline phosphatase (ALP), (U/L) | 44-147 | 85.12±23.64 | 40.0 | 135.00 | 95.0 |
| Gamma-glutamyl transferase (GGT), (U/L) | 0-30 | 40.12±16.54 | 10.0 | 79.0 | 69.0 |
| Alanine Transaminase (ALT), U/L | 7-50 | 33.28±11.12 | 17.0 | 60.0 | 43.0 |
| Aspartate Aminotransferase (AST), U/L | 15-40 | 38.64±13.93 | 18.0 | 75.0 | 57.0 |
| Bilirubin, (mg/dL) | <0.3 | 0.63±0.32 | 0.2 | 1.4 | 1.2 |
| Prothrombin Time/ Sec | 10-13/sec | 11.6±1.47 | 8.0 | 14.0 | 6.0 |
| Calcium (mg/dL) | 8.5 to 10.2 | 8.8±0.33 | 8.0 | 9.6 | 1.6 |
| Potassium, (mEq/L) | 3.5-5 | 4.05±0.80 | 2.9 | 8.8 | 5.9 |
Table 3.
Mean difference of laboratory findings among outcome variables (survival/death).
| Laboratory Findings | Outcome | Mean± SD | P-value |
|---|---|---|---|
| WCC | Survival | 10.81±9.34 | 0.104 |
| Death | 19.99±28.37 | ||
| PLT | Survival | 222.25±72.39 | 0.605 |
| Death | 203.83±134.95 | ||
| CRP | Survival | 51.17±69.86 | 0.041* |
| Death | 124.80±139.48 | ||
| LDH | Survival | 271.52±102.10 | 0.002** |
| Death | 483.67±351.06 | ||
| Ferritin | Survival | 439.42±365.26 | 0.04* |
| Death | 835.98±819.24 | ||
| D-DIAMERS | Survival | 332.47395±345.07 | 0.000* |
| Death | 1216.8±271.52 | ||
| ALP | Survival | 81.73±22.25 | 0.00** |
| Death | 110.00±19.48 | ||
| GGT | Survival | 38.80±16.88 | 0.127 |
| Death | 49.83±10.21 | ||
| ALT | Survival | 32.68±11.53 | 0.308 |
| Death | 37.67±6.53 | ||
| _AST | Survival | 37.70±14.41 | 0.202 |
| Death | 45.50±7.31 | ||
| Bilirubin | Survival | 0.60±0.30 | 0.03* |
| Death | 0.88±0.39 | ||
| Prothrombin Time | Survival | 11.64±1.40 | 0.641 |
| Death | 11.33±2.07 | ||
| Calcium | Survival | 8.81±0.35 | 0.595 |
| Death | 8.73±0.23 | ||
| Potassium | Survival | 4.07±0.83 | 0.665 |
| Death | 3.92±0.62 | ||
| Hospital Stay | Survival | 14.57±2.96 | 0.000** |
| Death | 23.00±2.83 |
p-value ≤ 0.05* significant, p-value ≤0.01**strongly significant.
Table 4.
Algorithms accuracy.
| Algorithms | Accuracy (%) |
| Decision Tree | 76% |
| Random Forest | 80% |
| SVM | 82% |
Disclaimer/Publisher’s Note: The statements, opinions and data contained in all publications are solely those of the individual author(s) and contributor(s) and not of MDPI and/or the editor(s). MDPI and/or the editor(s) disclaim responsibility for any injury to people or property resulting from any ideas, methods, instructions or products referred to in the content. |
© 2024 by the authors. Licensee MDPI, Basel, Switzerland. This article is an open access article distributed under the terms and conditions of the Creative Commons Attribution (CC BY) license (http://creativecommons.org/licenses/by/4.0/).
Copyright: This open access article is published under a Creative Commons CC BY 4.0 license, which permit the free download, distribution, and reuse, provided that the author and preprint are cited in any reuse.


