
Submitted:
25 April 2025
Posted:
25 April 2025
You are already at the latest version
Abstract
Aragonite and calcite are important nutrients for bivalves who biomineralize calcium carbonate in the water to form their outer shells. Ocean acidification can lead to a decrease in carbonate ions making forming these shells difficult. When the saturation state falls below a certain threshold (Ω < 1), it can cause oyster shells to dissolve. Therefore, measuring the Aragonite Saturation State yields crucial insight into the suitability of habitats to support oyster growth and productivity. Physiochemical water quality parameters were monitored from May to October 2020-2023. Using Seacarb, the aragonite-calcite saturation state was calculated using the following water quality parameters: temperature, salinity, alkalinity, and pH as inputs. Calcium hardness and dissolved oxygen was also measured to determine whether values were at a recommended threshold for shellfish hatcheries. There were fluctuations in the saturation states at each site, and oftentimes the values were undersaturated, especially during the cooling months. Spearman heatmaps demonstrate significant positive correlations between temperature and salinity (p = 0.46); pH and aragonite (p = 0.72); and alkalinity and aragonite (p = 0.51). This project aimed to determine the feasibility of different sites in supporting the establishment of oyster farms and oyster restoration efforts based on water quality conditions.
Keywords:
aragonite saturation state
; oysters
; ocean acidification
; calcification
; Delaware
1. Introduction
Climate change is a significant challenge facing the modern world. Human activities have driven the increase in atmospheric carbon dioxide (CO₂), contributing to global climate shifts. One concerning consequence of these changes is ocean acidification, which poses serious threats to marine ecosystems, particularly shellfish populations. Estuarine ecosystems are especially susceptible to acidification [1]. In the Delaware Inland Bays, eutrophication has become a serious concern, largely driven by urbanization, agricultural activities such as poultry farming and low water flushing rates [2]. Excessive nutrient inputs have previously earned the Bays a “poor” rating, as they far exceeded healthy ecological limits [2]. Moreover, the intensification of agricultural practices in this region, combined with other anthropogenic factors, exacerbates CO₂ emissions, fueling climate change and amplifying concerns about its cascading effects on estuarine ecosystems, including those in the Delaware Inland Bays.
Eastern oysters (Crassostrea virginica) are a keystone species and are vital to the estuarine ecosystem. C. virginica provides many ecological services that benefit both humans and wildlife including filtration, nutrient removal, shoreline protection, and providing food and habitation to aquatic species [3,4,5]. In addition to the ecological benefits of C. virginica, they are an important commercial species that have significant economic value for coastal regions [6]. Consumption and sale of oysters dates back to pre-colonial times. The first commercial oyster fishery originated in the early 1800s and was a growing industry in the 1950s, with more than 4,000 acres of subaqueous land leased in Rehoboth Bay and Indian River Bay. However, the leased acreage and survivability of the oysters began to decline through the 1960s due to MSX and Dermo, which contributed to a 95% mortality. By 1978, there was no oyster production in the Inland Bays [7,8]. Shellfish aquaculture was once again allowed leasing and harvesting in the Delaware Inland Bays in 2017 when there was a re-emergence of the oyster population. In present day, the shellfish aquaculture industry accounts for over $100,000 annually in generated state revenue [7]. Shellfish aquaculture farms also provide ecological benefits as well. The complex structures that are associated with aquaculture farms (i.e. gear, oyster cages, and bags) can provide habitat and shelter from predators and can become an established feeding ground [9] for pelagic and benthic species.
Water quality is an important indicator of a healthy environment for bivalves. Temperature and salinity are both factors that can affect oyster growth and development. Although oysters are tolerant to fluctuating water temperatures and salinity levels [10,11], the ideal temperature for adult oyster’s ranges from 20 to 30ºC [12,13] and the optimal salinity range is around 14 to 28 ppt [3]. Dissolved oxygen (DO mg/L) is also necessary for oyster survival and 4 mg/L is considered the minimum level to maintain a healthy ecosystem [14] for oysters and other aquatic species. The pH measures the concentration of hydrogen in the water and is another important indicator of oyster health. As the concentration of hydrogen ions () increases, the pH decreases, and the water becomes more acidic. Eastern oysters can survive in pH levels between 6.75 to 8.75 [13] but the optimal value is 8.2 [15]. When pH levels drastically decrease due to ocean acidification, this can impact the oyster's ability to form their shells and can lead to poor survival. Alkalinity measures the capacity of water to buffer pH and neutralize acids. This can help prevent stress in oysters that result from rapid changes in pH. The recommended alkalinity level for shellfish hatcheries is between 150 to 180 mg/L [15]. Calcium hardness measures the amount of calcium ions in the water. Calcium binds with carbonate to form calcium carbonate (CaCO3), which is used by oysters to form their shells. The recommended calcium hardness level for shellfish hatcheries is around 200 mg/L CaCO3 [15]. Although Eastern oysters have a high tolerance and adaptability potential, optimal conditions are preferred to maximize growth and productivity.
Aragonite and calcite are one of the main calcium carbonate structures utilized by calcifying species to build their shells [16]. Aragonite is mainly utilized by oyster larvae, while juvenile and adult oyster shells are composed primarily of calcite. The Aragonite and Calcite Saturation State () is a measure of the carbonate ion concentration in the water. Although, the Aragonite Saturation State is considered a better indicator of ocean acidification due to its solubility [17,18]. In one study, a decline in long-term pH and Ar contributed in part to ocean acidification was observed [19]. In contrast, researchers observed an increase in long-term pH and Ar with increased alkalization [19]. Over the years, there has been a steady increase in the amount of carbon dioxide released through anthropogenic activities (i.e. fossil fuels, deforestation, and additional agricultural and industrial practices) [20], with at least 50% of the increase occurring in the past three decades [21]. The CO₂ reacts with seawater by increasing the concentration of , and this in turn reduces the pH of the water and makes it more acidic. Ocean CO₂ uptake also lowers carbonate ion (CO32-) concentrations and calcium carbonate (CaCO3) saturation state globally [22]. In a study, two oyster species were exposed to varying levels of CO₂ to simulate different atmospheric conditions and found that C. virginica grew slower and biomineralized less calcium carbonate at elevated CO₂ levels [18]. In a similar study, bivalve and larvae were exposed to past, present, and future CO₂ conditions and larvae demonstrated greater growth and survival under pre-industrial conditions compared to modern CO₂ levels [23]. Bivalve also demonstrated enhanced calcification under pre-industrial conditions, but experienced shell deformities when exposed to predicted future CO₂ levels [23]. Thus, understanding the aragonite saturation state can help to monitor the effects of climate change. The following formula is used to calculate the saturation state of seawater:
where [] is the calcium concentration and is the solubility product of aragonite [18,24]. Aragonite and calcite values greater than one are considered supersaturated > 1) and more favorable, while values under one are undersaturated ( < 1) and favor dissolution [18,22]. When the saturation state falls below one, this can cause calcifying organisms to become stressed due to the elevated metabolic cost of calcification under less favorable conditions and can also decrease the shell area and calcium content of the oysters’ shells. Undersaturated levels also have the potential to slow down the species' rate of calcification, so they have to remain in the water column for longer periods. With the integrity of their shells at odds, coupled with the slower rate of calcification, this makes them more susceptible to disease and predation [18]. These effects ultimately affect the ecosystem services that oysters provide and may hinder biodiversity.
The Aragonite Saturation State will help us to better understand the impacts of ocean acidification on the calcification process of C. virginica. Saturation states may lead to shifts in habitat function, composition, and the provision of ecosystem services provided by oysters since they are “ecosystem engineers” [24,25]. By presenting trends and site-specific variations, it will provide valuable insights into spatial and temporal dynamics, aiding in the assessment of environmental changes and potential impacts on marine ecosystems. The objectives of this study were to 1) monitor the physiochemical water quality conditions at different habitat types, 2) calculate the omega aragonite and calcite saturations states at each site, and 3) compare the saturation states with the collected in field water quality data to determine the suitability of different sites for oyster aquaculture and restoration efforts and address potential impacts of ocean acidification on calcifying organisms.
2. Materials and Methods
2.1. Study Sites
The Delaware Inland Bays is a natural estuary that covers 32 square miles of surface waters, located within a 320 square mile watershed [7,8]. The three systems that make up the Delaware Inland Bays include Rehoboth Bay, Indian River, and Little Assawoman. The Inland Bays account for over $4.5 billion in annual state income and supports over 35,000 jobs [7]. Rehoboth Bay is located in the northernmost part of the Inland Bays and is an important ecological and recreational region. There was a total of seven sites located in Rehoboth Bay, Delaware, USA that was monitored in this study. These sites are located on both the east and west side of Rehoboth Bay and are characterized as pilot artificial oyster reefs, private aquaculture farms, and control sites with no oysters or habitat structures (Figure 1). The artificial reefs are located at Camp Arrowhead (CAH, 38.65430°N, 75.12589°W) and Big Bacon Reef (BBR, 38.38007°N, 075.04866°W) and were created using recycled oyster shells and seeded with farm-grown oyster seeds through a program run by the Delaware Center for Inland Bays. The private aquaculture farms are located at Sally’s Cove (SC, 38.64877°N, 75.12870°W) and Rehoboth Bay Oyster Company (RBOC, 38.39549°N, 075.04797°W) and the majority of the cultured oysters are suspended within the water column using off-bottom cages. The control sites are Sally’s Cove Control (SCC, 38.64446°N, 75.12656°W), Redefer Control (RC, 3839.177°N, 07504.938°W), and Bay City (BC, 3837.857°N, 7507.382°W). SCC is a small beach area with little marsh grass coverage and is located adjacent to Sally’s Cove on the west side of Rehoboth Bay. RC is a former aquaculture site that is no longer operational and has little to no structure remaining. Lastly, BC is a residential inlet that is more heavily influenced by boating and recreational activities.
2.2. Water Quality Monitoring
Water quality was monitored from May to October 2020-2023. During the first three years, a YSI 556 Multiprobe was used to collect physical water quality parameters including temperature (°C), salinity (ppt), dissolved oxygen (mg/L), and pH. In 2023, the prior instrument was replaced by the newer modeled YSI ProDSS Multiprobe sensor. Triplicate water samples were also collected simultaneously to conduct nutrient analysis tests. Alkalinity and calcium hardness were tested in the lab following the protocol from Xylem/YSI Inc. To test for alkalinity (mg/L CaCO3), water samples were first transferred to a 10 mL test tube. Then, one Total Alkalinity (Alkaphot) Reagent (YSI Xylem Ca. No. YAP188) tablet was added and mixed until completely dissolved. The solution rested for one minute before it was placed into the 9500 photometer for analysis. To test for calcium hardness (mg/L CaCO3), water samples were first transferred to a 10 mL test tube. Then, one Calcicol No.1 (YSI Xylem Ca. No. YAP252) tablet was added to the sample and mixed until dissolved. After, one Calciol No.2 tablet was added to the solution and mixed until completely dissolved. The solution rested for two minutes before it was placed into the analyzing instrument.
2.3. Calculation of Aragonite Saturation State
The aragonite saturation state was calculated using the Seacarb program package in R (version 4.1.0). Seacarb is a package that is widely used for carbonate chemistry calculations. This package provides robust formulas and built-in algorithms for analyzing marine carbonate systems, making it an essential tool for oceanographic and water quality studies. To calculate the Ar, a set of water quality parameters – temperature, salinity, pH, total alkalinity, and calcium hardness – were inputted into the Seacarb program. The calculations leveraged Seacarbs’ built-in functions to determine the omega aragonite and calcite saturation state based on these inputs. To visualize the data, statistical graphs were developed in Rstudio (version 4.3.1) and Python, incorporating tools for advanced data visualization. These graphs demonstrated the average aragonite and calcite saturation states across multiple study sites over a temporal range from 2020 to 2023. Spearman correlation heatmaps were also developed in Rstudio to identify relationships between physiochemical water quality parameters and the saturation states.
3. Results
3.1. Physiochemical Water Quality Monitoring
The average water quality data is presented for temperature, salinity, pH, alkalinity, calcium hardness, and dissolved oxygen at all sites from May to October 2020-2023. There were no significant differences in temperature between the four years. The average temperature across sites for 2020 was 21.8°C ± 5.2°C, and 21.6°C ± 5.6°C for 2021. The mean temperature in 2022 was 23.0°C ± 4.8°C and 23.1°C ± 3.6°C in 2023. The site with the highest average temperature was BC in all years and the site with the lowest was BBR. Salinity was consistent throughout 2020-2021, with average salinity values of 29.0 ± 3.0 ppt and 28.5 ± 1.2 ppt, respectively. The salinity levels increased in 2022 with an average of 33.56 ± 2.0 ppt. However, there was a decrease in salinity levels in 2023 (26.50 ± 8.7 ppt), with the most notable shift during May and June. The site with the highest overall average salinity was BBR, while the site with the lowest was BC. There was no significant change in pH levels throughout the four years, with the averages being 7.96 ± 0.2 and 8.04 ± 0.1 for 2020-2021 and 7.83 ± 0.35 and 7.77 ± 0.46 for 2022-2023. The sites with the highest average pH was RBOC and RC, while the site with the lowest was BC. The average DO across sites was 8.61 ± 1.6 ppt in 2020; 5.84 ± 1.4 ppt in 2021; 7.52 ± 1.7 ppt in 2022; and 6.87 ± 1.5 ppt in 2023. The site with the overall highest average DO mg/L was RBOC, while the site with the lowest average was BC. Alkalinity had the greatest variation in readings. The average alkalinity (mg/L CaCO3) was 82.0 ± 27.4 and 92.3 ± 27.7 in 2020 and 2021, respectively. In 2022-2023, the average was 87.9 ± 25.7 and 86.0 ± 20.5, but there was a noticeable decrease in alkalinity levels in September of 2023 at SCC (44.7 mg/L). The site with the highest average alkalinity varied each year; but the site with the overall lowest was SCC. The calcium hardness (mg/L CaCO3) for 2020 and 2021 were similar, with averages of 254.41 ± 79.8 and 261.51 ± 59.4, respectively. The average calcium hardness for 2022 was 223.64 ± 60.7 and 221.31 ± 58.0 for 2023. The site with the highest overall average calcium hardness was CAH, while the site with the lowest varied each year.
3.2. Calculated Aragonite-Calcite Saturation States
The omega aragonite and calcite saturation state were calculated for each site during the four years. There were significant fluctuations in the omega aragonite and calcite throughout the different sites. There were certain months where the values were below 1 into the undersaturated zone. The average in 2020 for Big Bacon Reef was 0.72 ± 0.2; Bay City was 1.31 ± 0.4; Camp Arrowhead was 1.19 ± 0.5; Rehoboth Bay Oyster Company was 0.99 ± 0.5; Redefer Control was 0.49 ± 0.2; Sally’s Cove was 1.34 ± 0.4; and Sally’s Cove Control was 0.48 ± 0.3. In 2021, the average for Big Bacon Reef was 1.10 ± 0.5; Bay City was 1.05 ± 0.6; Camp Arrowhead was 1.16 ± 0.5; Rehoboth Bay Oyster Company was 1.20 ± 0.6; Redefer Control was 1.38 ± 0.6; Sally’s Cove was 1.10 ± 0.4; and Sally’s Cove Control was 0.88 ± 0.6. In 2022, Big Bacon Reef was 0.77 ± 0.1; Bay City was 0.58 ± 0.4; Camp Arrowhead was 0.86 ± 0.3; Rehoboth Bay Oyster Company was 1.02 ± 0.2; Redefer Control was 0.92 ± 0.4; Sally’s Cove was 0.80 ± 0.2; and Sally’s Cove Control was 0.90 ± 0.3. In 2023, there was a notable decrease in the aragonite-calcite saturation state throughout the sampling sites. This was also when there was a decrease in salinity levels. The average in 2023 for Big Bacon Reef was 0.90 ± 0.5; Bay City was 0.49 ± 0.3; Camp Arrowhead was 0.75 ± 0.4; Rehoboth Bay Oyster Company was 0.97 ± 0.4; Redefer Control was 0.87 ± 0.5; Sally’s Cove was 0.67 ± 0.3; and Sally’s Cove Control was 0.77 ± 0.5. The calcite saturation state demonstrated similar trends as the aragonite saturation state, with slightly higher values. The average in 2020 for Big Bacon Reef was 1.10 ± 0.3; Bay City was 1.80 ± 0.7; Camp Arrowhead was 1.80 ± 0.8; Rehoboth Bay Oyster Company was 1.50 ± 0.7; Redefer Control was 0.80 ± 0.3; Sally’s Cove was 2.10 ± 0.7; and Sally’s Cove Control was 0.80 ± 0.4. In 2021, Big Bacon Reef was 1.70 ± 0.7; Bay City was 1.60 ± 1.0; Camp Arrowhead was 1.80 ± 0.8; Rehoboth Bay Oyster Company was 1.80 ± 0.9; Redefer Control was 2.10 ± 0.9; Sally’s Cove was 1.70 ± 0.6; and Sally’s Cove Control was 1.40 ± 0.9. In 2022, Big Bacon Reef was 1.19 ± 0.2; Bay City was 0.88 ± 0.6; Camp Arrowhead was 1.31 ± 0.4; Rehoboth Bay Oyster Company was 1.56 ± 0.3; Redefer Control was 1.41 ± 0.6; Sally’s Cove was 1.22 ± 0.4; and Sally’s Cove Control was 1.38 ± 0.5. In 2023, the average for Big Bacon Reef was 1.40 ± 0.8; Bay City was 0.77 ± 0.5; Camp Arrowhead was 1.20 ± 0.7; Rehoboth Bay Oyster Company was 1.51 ± 0.6; Redefer Control was 1.37 ± 0.8; Sally’s Cove was 1.05 ± 0.5; and Sally’s Cove Control was 1.21 ± 0.8. Based on the four years data, Bay City had the lowest average aragonite-calcite saturation state in 2020, while Redefer Control had the highest; Sally’s Cove Control had the lowest average in 2021, while Camp Arrowhead had the highest; Bay City had the lowest average in 2022, while Redefer Control had the highest; and Bay City had the lowest average aragonite-calcite saturation state in 2023, while Sally’s Cove Control had the highest (Figure 2 and Figure S1).
3.3. Correlations Between Water Quality and Saturation States
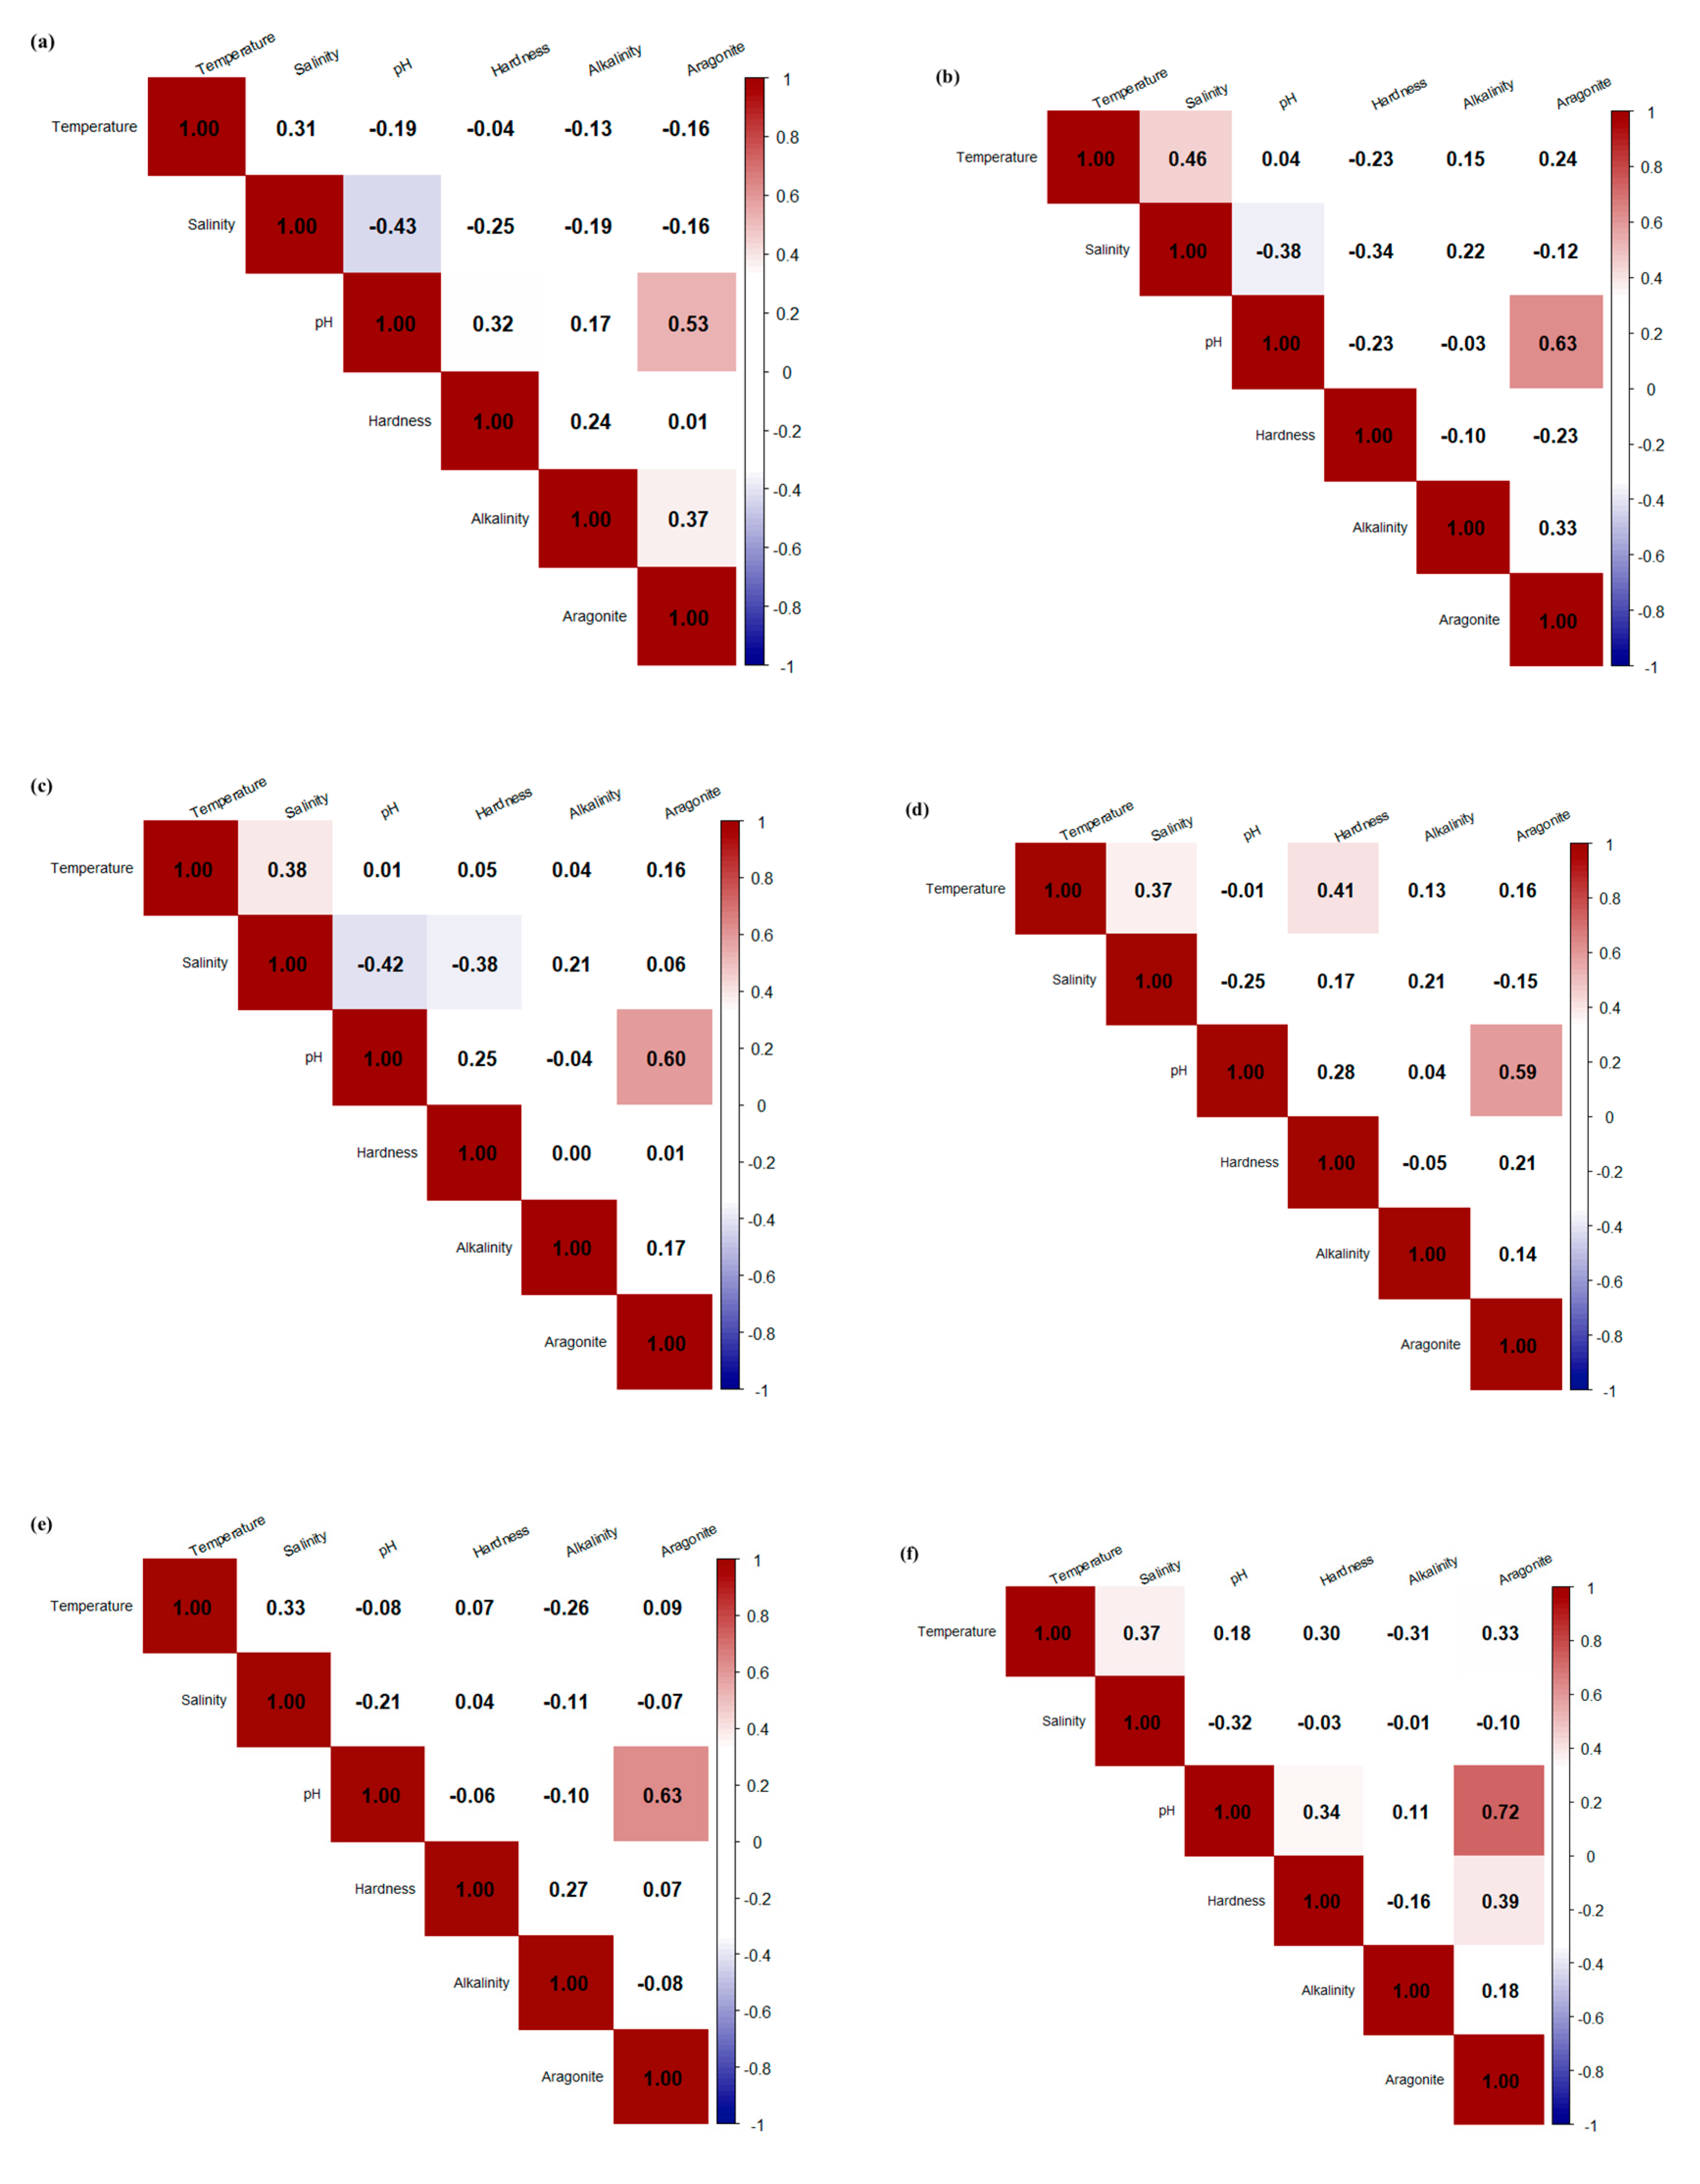
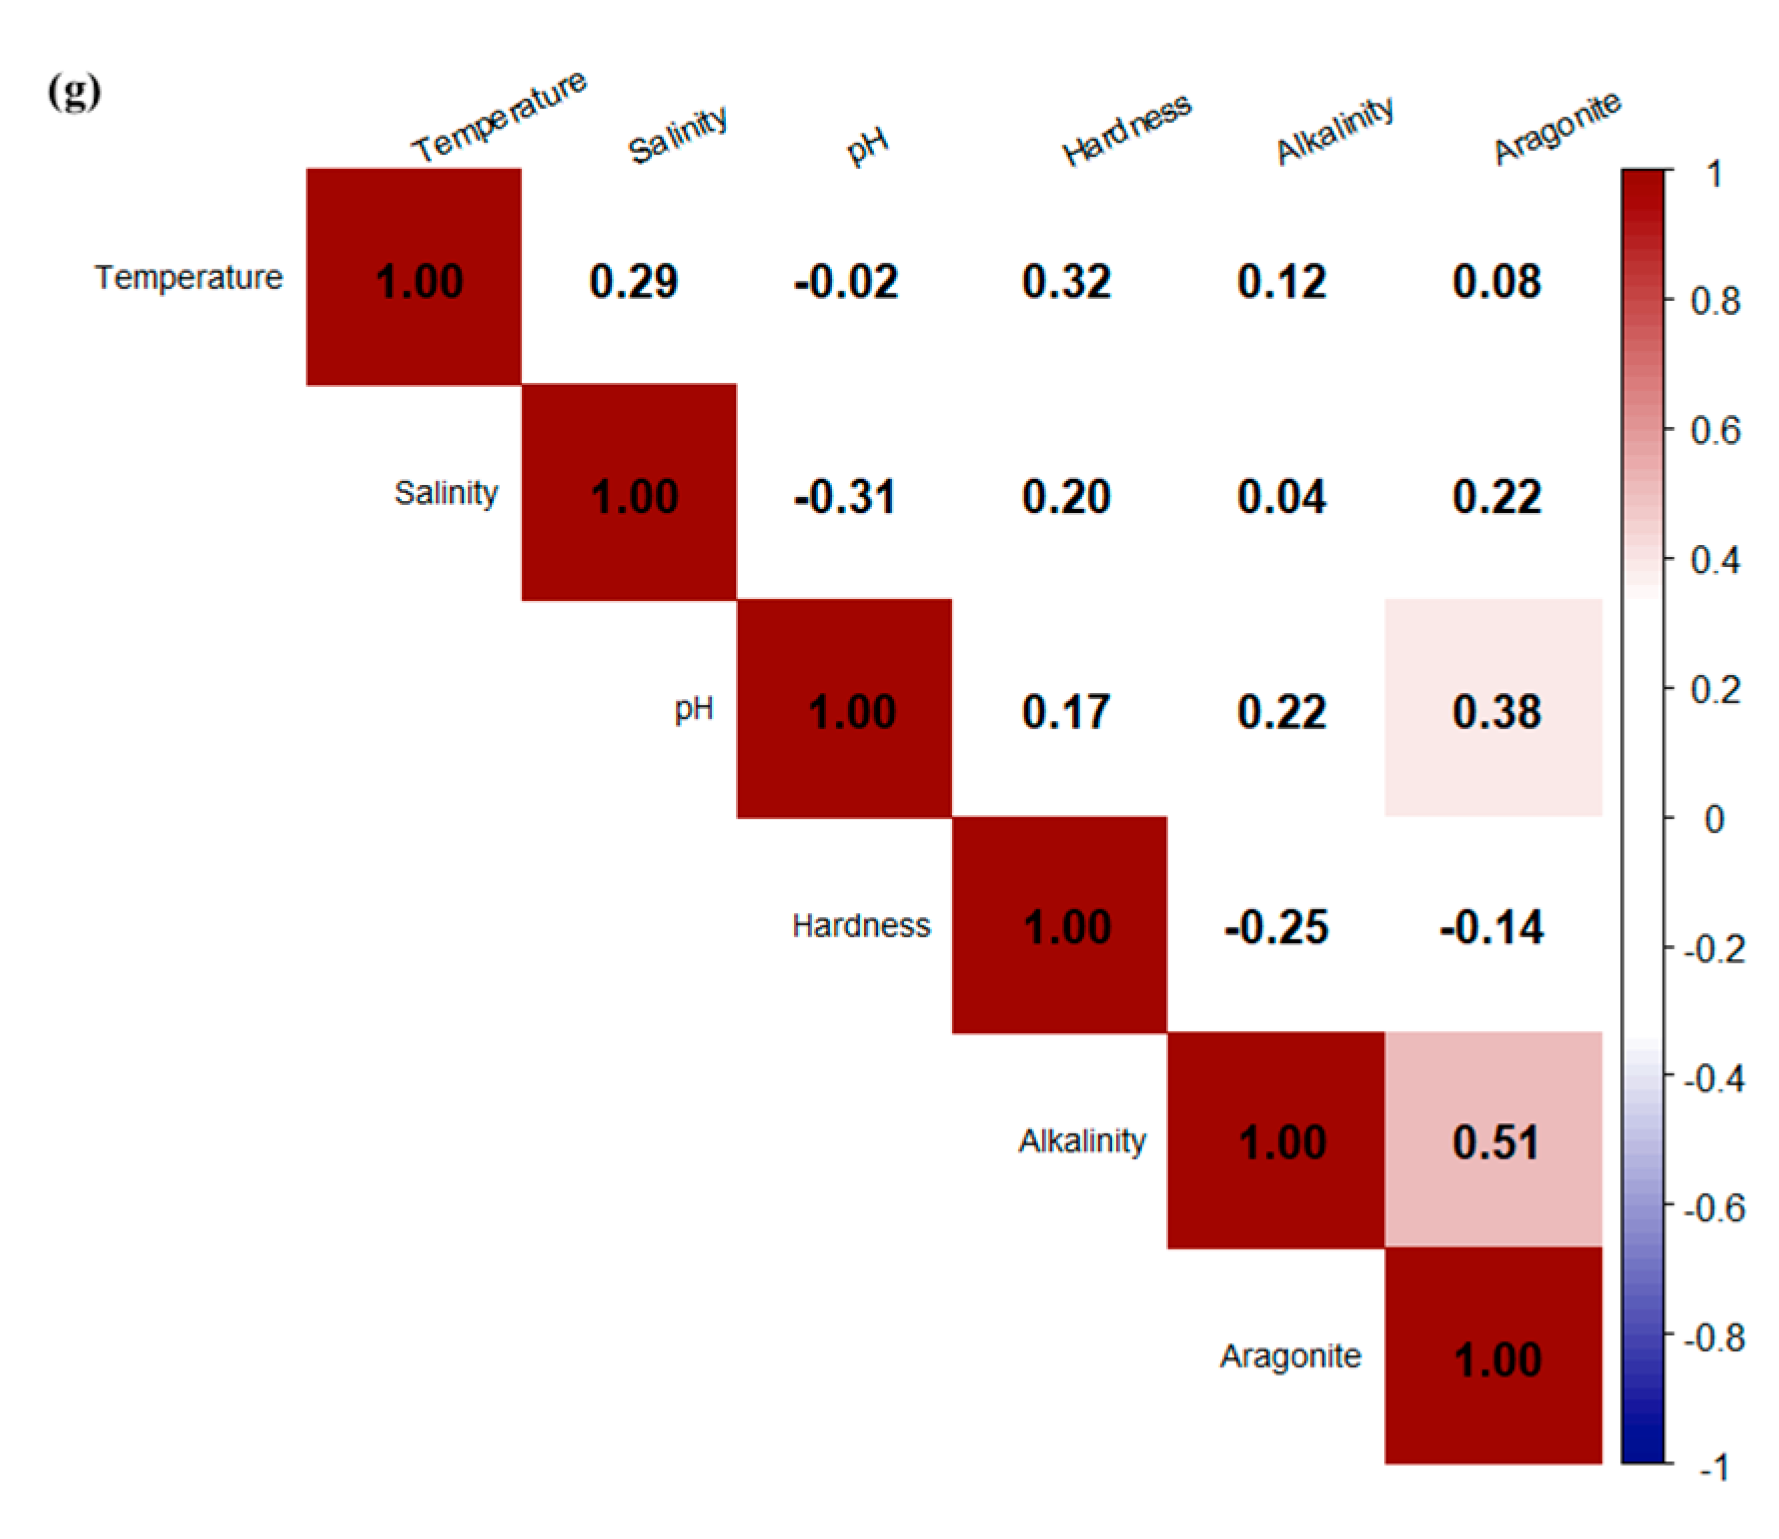
Spearman Correlation Heatmaps were used to understand the relationships between the different water quality parameters and the calculated Aragonite Saturation State at each site (Figure 3). The red boxes indicate significant positive correlations, while the blue boxes indicate significant negative correlations (the darker the color, the stronger the relationship). At Big Bacon Reef, there was a significant negative relationship between salinity and pH (p = -0.43), while there were significant positive relationships between alkalinity and aragonite (p = 0.37); pH and aragonite (p = 0.53). At Rehoboth Bay Oyster Company, there was also a negative relationship between pH and salinity (p = -0.38), and there were positive relationships between temperature and salinity (p = 0.46); pH and aragonite (p = 0.63). At Redefer control, there were negative relationships between salinity and pH (p = -0.42); salinity and calcium hardness (p = -0.38), and significant positive relationships again between temperature and salinity (p = 0.38); pH and aragonite (p = 0.60). At Sally’s Cove, there were no significant negative relationships, but there was a significant positive relationship between pH and aragonite (p = 0.63). At Camp Arrowhead, there were no significant negative relationships, but there was a significant positive relationship between temperature and salinity (p = 0.37); calcium hardness and aragonite (p = 0.39); pH and aragonite (p = 0.72). At Sally’s Cove Control, there were again no significant negative relationships, but there were significant positive relationships between pH and aragonite (p = 0.38); alkalinity and aragonite (p = 0.51). Lastly, at Bay City there were no significant negative relationships as well, but there were significant positive correlations between temperature and salinity (p = 0.37); temperature and calcium hardness (p = 0.41); pH and aragonite (p = 0.59). At a majority of sites, there were strong correlations between pH, alkalinity, and omega aragonite which demonstrates the relationships between these parameters and how they can impact the aragonite saturation state in the future.
4. Discussion
The monitored water quality parameters were relatively consistent between each site, especially temperature and pH. Salinity was also consistent between each site, but there were slight variations between the different years. Temperature, pH, salinity, and dissolved oxygen were all optimal for oyster growth. Calcium hardness values varied but overall meet hatchery recommendations (~200 mg/L). However, the average alkalinity values were less than the recommended levels for shellfish hatcheries (150-180 mg/L) [15]. This could potentially impact the ability of oysters to tolerate fluctuations in pH, making them more vulnerable to the effects of ocean acidification. There were fluctuations in both the aragonite and calcite saturation state levels. Oftentimes, the was falling below one and at these levels, there is a higher risk to the oysters and the overall health of the estuarine ecosystem. There was a notable decrease in both the aragonite and calcite saturation state throughout the sampling sites in 2023. During that same year, there was a high mortality event observed at our aquaculture site, Sally’s Cove, where approximately 85% of the oysters collected were dead. Overall, the site with the lowest average saturation state was Bay City. It is important to note that Bay City is close to a residential area where there is greater anthropogenic influence that impacts water quality. The heatmaps demonstrated significant positive relationships between pH, alkalinity, and the aragonite saturation state. This makes sense since the decrease in pH levels can lead to ocean acidification which is related to the aragonite saturation state. The relationship between temperature-salinity and saturation state is positively correlated because as temperature and salinity increases, the saturation state increases due to the release of CO₂ from seawater; and vice versa as the total dissolved CO₂ increases with depth due to biological respiration and decreasing temperatures, the saturation state of carbonate naturally decreases [21,27].
One thing to consider that was not monitored in this study is the potential impact oysters can have on the aragonite saturation state and the carbonate chemistry of the seawater. Since oysters biomineralize calcium carbonate to form their shells, they are simultaneously removing calcium from the water which can decrease the aragonite saturation state. In addition, the processes of respiration and calcification release into the water which can also impact the saturation states [28]. This is more relevant to aquaculture sites that have an abundance of oyster’s present. In one study, a predictive model was formulated to account for the impact of calcification on the estuarine carbonate system and estimated that oysters can decrease the aragonite saturation state by 3% during the growing season [28]. However, our results demonstrated in 2020-2021, that control sites with no oysters had lower aragonite and calcite values compared to aquaculture farms and reefs. Also, there were no significant positive correlations between calcium hardness and the aragonite saturation state based on the Spearman correlations. Nevertheless, the potential impacts oysters can have on the carbonate chemistry should be considered for future studies as this could impact oyster aquaculture and restoration practices [28] in Delaware.
5. Conclusions
Understanding the role of water quality and conducting continuous water quality monitoring is essential to maintaining a healthy environment for wildlife. Aragonite-calcite saturation state also shows a potential to better understand the effects of ocean acidification and climate change on oysters and our estuarine environments. In the future, predictive models can be formulated to monitor the aragonite-calcite saturation state to account for future trends that impact both larvae and juvenile-adult oysters. These considerations can help promote sustainable aquaculture practices, and understanding how oysters increase biodiversity and ecosystem function can promote continued reef restoration efforts in the Delaware Inland Bays.
Supplementary Materials
The following supporting information can be downloaded at: https://osf.io/pcrku/?view_only=45f335b3119d40e7a016516836c5ea37, Figure S1: The average omega Calcite Saturation States at each site over the span of four years. Note. This data is the mean of three replicates per site.
Author Contributions
Conceptualization, G.O.; methodology, T.A., A.B., and G.O..; software, A.B., and F.B.; validation, T.A., A.B. and G.O.; formal analysis, T.A.; investigation, T.A.; resources, G.O.; data curation, T.A., F.B., and A.B.; writing—original draft preparation, T.A.; writing—review and editing, T.A. and G.O.; visualization, T.A., and A.B.; supervision, G.O.; project administration, G.O.; funding acquisition, G.O. All authors have read and agreed to the published version of the manuscript.
Funding
This research was funded by Delaware EPSCoR-NSF, grant number 1301765 and USDA NIFA, grant number 2016-06642.
Institutional Review Board Statement
Not applicable.
Informed Consent Statement
Not applicable.
Data Availability Statement
The data generated in this article are openly available in OSF at https://osf.io/pcrku/?view_only=d0240d0c707646b086abd21828cc9264.
Acknowledgments
We acknowledge Delaware Cultured Seafood and Mark Casey for his in-field and scientific contributions. We recognize the Delaware’s Center for Inland Bays for their continued efforts towards oyster restoration. This research was made possible with the assistance from the Aquatic Science and One Health Lab at Delaware State University.
Conflicts of Interest
The authors declare no conflicts of interest.
References
- Waldbusser, G.G., Voigt, E.P., Bergschneider, H. et al. Biocalcification in the Eastern Oyster (Crassostrea virginica) in Relation to Long-term Trends in Chesapeake Bay pH. Estuaries and Coasts 34, 221–231 (2011). [CrossRef]
- Walch, M.A. McGowan, L. Swanger, C. Chaney, and M. Goss. (2023). State of the Delaware Inland Bays, 2021. Delaware Center for the Inland Bays, March 2023, 104 pp. inlandbays.org.
- Babb, R. (2018). Eastern Oysters of the Delaware Bay. New Jersey Department of Environmental Protection. Marine Issue. https://dep.nj.gov/wp-content/uploads/njfw/digest-marine-2018-eastern-oysters-of-the-delaware-bay-russ-babb.pdf.
- Raj, Sanjeeva P.J. (2008). Oysters in a new classification of keystone species. Reson 13, 648–654. [CrossRef]
- Coen, L. D., Brumbaugh, R. D., Bushek, D., Grizzle, R., Luckenbach, M. W., Posey, M. H., Powers, S. P., & Tolley, S. G. (2007). Ecosystem Services related to oyster restoration. Marine Ecology Progress Series, 341, 303–307. [CrossRef]
- Grabowski, J.H., Brumbaugh, R.D., Conrad, R.F., Keeler, A.G., Opaluch, J.J., Peterson, C.H., Piehler, M.F., Powers, S.P., Smyth, A.R. (2012). Economic Valuation of Ecosystem Services Provided by Oyster Reefs, BioScience, Volume 62, Issue 10, Pages 900–909. [CrossRef]
- Hauser, C. A., & Bason, C. W. (2020). The Economic Value of the Delaware Inland Bays. DE Center for the Inland Bays. Retrieved April 20, 2023, from https://www.inlandbays.org/about-the-bays/economic-value-of-the-inland-bays/.
- Ewart, W. J. (2013). Shellfish Aquaculture in Delaware’s Inland Bays: Status Opportunities, and Constraints. National Oceanic and Atmospheric Administration. https://repository.library.noaa.gov/view/noaa/38095.
- Callier MD, Byron CJ, Bengtson DA, Cranford PJ, and others. (2018). Attraction and repulsion of mobile wild organisms to finfish and shellfish aquaculture: a review. Rev Aquacult 10:924−949.
- Marshall, D.A., Coxe, N.C., La Peyre, M.K., Walton, W.C., Rikard, S.F., Pollack, J.B., Kelly, M.W., La Peyre, J.F. (2021). Tolerance of northern Gulf of Mexico eastern oysters to chronic warming at extreme salinities. Journal of Thermal Biology, vol.100, 2021, 0306-4565. [CrossRef]
- Hijuelos, A. C., Sable, S. E., O’Connell, A. M., and Geaghan, J. P. (2017). 2017 Coastal Master Plan: Attachment C3-12: Eastern Oyster, Crassostrea virginica, Habitat Suitability Index Model. Version Final. (pp. 1-23). Baton Rouge, Louisiana: Coastal Protection and Restoration Authority.
- Barnes, T. & Volety, Aswani & Chartier, K & Mazzotti, F. & Pearlstine, Leonard. (2007). A habitat suitability index model for the eastern oyster (Crassostrea virginica), a tool for restoration of the Caloosahatchee Estuary, Florida. Journal of Shellfish Research - J SHELLFISH RES. 26. 10.2983/0730-8000(2007)26[949:AHSIMF]2.0.CO;2.
- EOBRT (Eastern Oyster Biological Review Team). 2007. Status review of the Eastern Oyster (Crassostrea virginica), p. 7. Report to the National Marine Fisheries Service, Northeast Regional Office. Memo.NMFS F/SPO-88.
- Patterson HK, Boettcher A, Carmichael RH. Biomarkers of dissolved oxygen stress in oysters: a tool for restoration and management efforts. PLoS One. 2014 Aug 12;9(8):e104440. [CrossRef] [PubMed]
- Gaines, E., Sturmer, L., Anderson, N., Laramore, S., and Baker, S. (n.d.). The Role of pH, Alkalinity, and Calcium Carbonate in Shellfish Hatcheries. University of Florida. https://shellfish.ifas.ufl.edu/wp-content/uploads/pH-and-Alkalinity-Fact-Sheet-for-Hatcheries-Final-Draft.pdf.
- Turley, C.M., Roberts, J.M. & Guinotte, J.M. (2007). Corals in deep water: will the unseen hand of ocean acidification destroy cold-water ecosystems? Coral Reefs 26, 445–448. [CrossRef]
- Newton, Jan & Klinger, Terrie. (2015). Ocean Acidification in Pacific Northwest Coastal Waters: What Do We Know? College of the Environment.
- Miller, A. W., Reynolds, A. C., Sobrino, C., & Riedel, G. F. (2009). Shellfish face uncertain future in high CO2 World: Influence of acidification on oyster larvae calcification and growth in estuaries. PLoS ONE, 4(5). [CrossRef]
- Shen, C., Testa, J. M., Li, M., & Cai, W.-J. (2020). Understanding anthropogenic impacts on pH and aragonite saturation state in Chesapeake Bay: Insights from a 30-year model study. Journal of Geophysical Research: Biogeosciences, 125, e2019JG005620. [CrossRef]
- Nunes, L. J. R. (2023). The Rising Threat of Atmospheric CO2: A Review on the Causes, Impacts, and Mitigation Strategies. Environments, 10(4), 66. [CrossRef]
- Freely, R.A., S.C. Doney, and S.R. Cooley. 2009. Ocean acidification: Present conditions and future changes in a high-CO2 world. Oceanography 22(4):36–47, . [CrossRef]
- Jiang, L.-Q., R. A. Feely, B. R. Carter, D. J. Greeley, D. K. Gledhill, and K. M. Arzayus (2015), Climatological distribution of aragonite saturation state in the global oceans, Global Biogeochem. Cycles, 29, 1656–1673, doi:10.1002/2015GB005198.
- Talmage S.C. , & Gobler C.J. (2010). Effects of past, present, and future ocean carbon dioxide concentrations on the growth and survival of larval shellfish, Proc. Natl. Acad. Sci. U.S.A. 107 (40) 17246-17251, . [CrossRef]
- Xue, L., Yang, X., Li, Y., Li, L., Jiang, L.-Q., Xin, M., et al. (2020). Processes controlling sea surface pH and aragonite saturation state in a large northern temperate bay: Contrasting temperature effects. Journal of Geophysical Research: Biogeosciences, 125, e2020JG005805. [CrossRef]
- Lemasson, A.J., Fletcher, S., Hall-Spencer, J.M., Knights, A.M. (2017). Linking the biological impacts of ocean acidification on oysters to changes in ecosystem services: A review. Journal of Experimental Marine Biology and Ecology, vol.492, pp. 49-62, 2017, 0022-0981. [CrossRef]
- NOAA (National Oceanic and Atmospheric Association). (2023). Eastern Oyster. NOAA Fisheries.https://www.fisheries.noaa.gov/species/eastern-oyster#oyster-management-and-restoration.
- Xu, X., Hu, Y., He, Z., Wang, X., Chen, H., and Han, J. (2023). Processes controlling the aragonite saturation state in the North Yellow Sea near the Yalu River estuary: contrasting river input effects. Frontiers in Marine Science, vol. 10: 2296-7745. https://www.frontiersin.org/journals/marinescience/articles/10.3389/fmars.2023.1158896.
- Liberti, C.M., Gray, M.W., Mayer, L.M., Testa, J.M., Liu, W., Brady, D.C. (2022). The impact of oyster aquaculture on the estuarine carbonate system. Elementa: Science of the Anthropocene; 10 (1): 00057. [CrossRef]
Figure 1.
Locations of each of the monitoring sites in Rehoboth Bay, Delaware, USA. Note: The red shapes represent artificial reefs; green shapes represent on-going oyster aquaculture sites; and blue shapes represent control sites.
Figure 1.
Locations of each of the monitoring sites in Rehoboth Bay, Delaware, USA. Note: The red shapes represent artificial reefs; green shapes represent on-going oyster aquaculture sites; and blue shapes represent control sites.
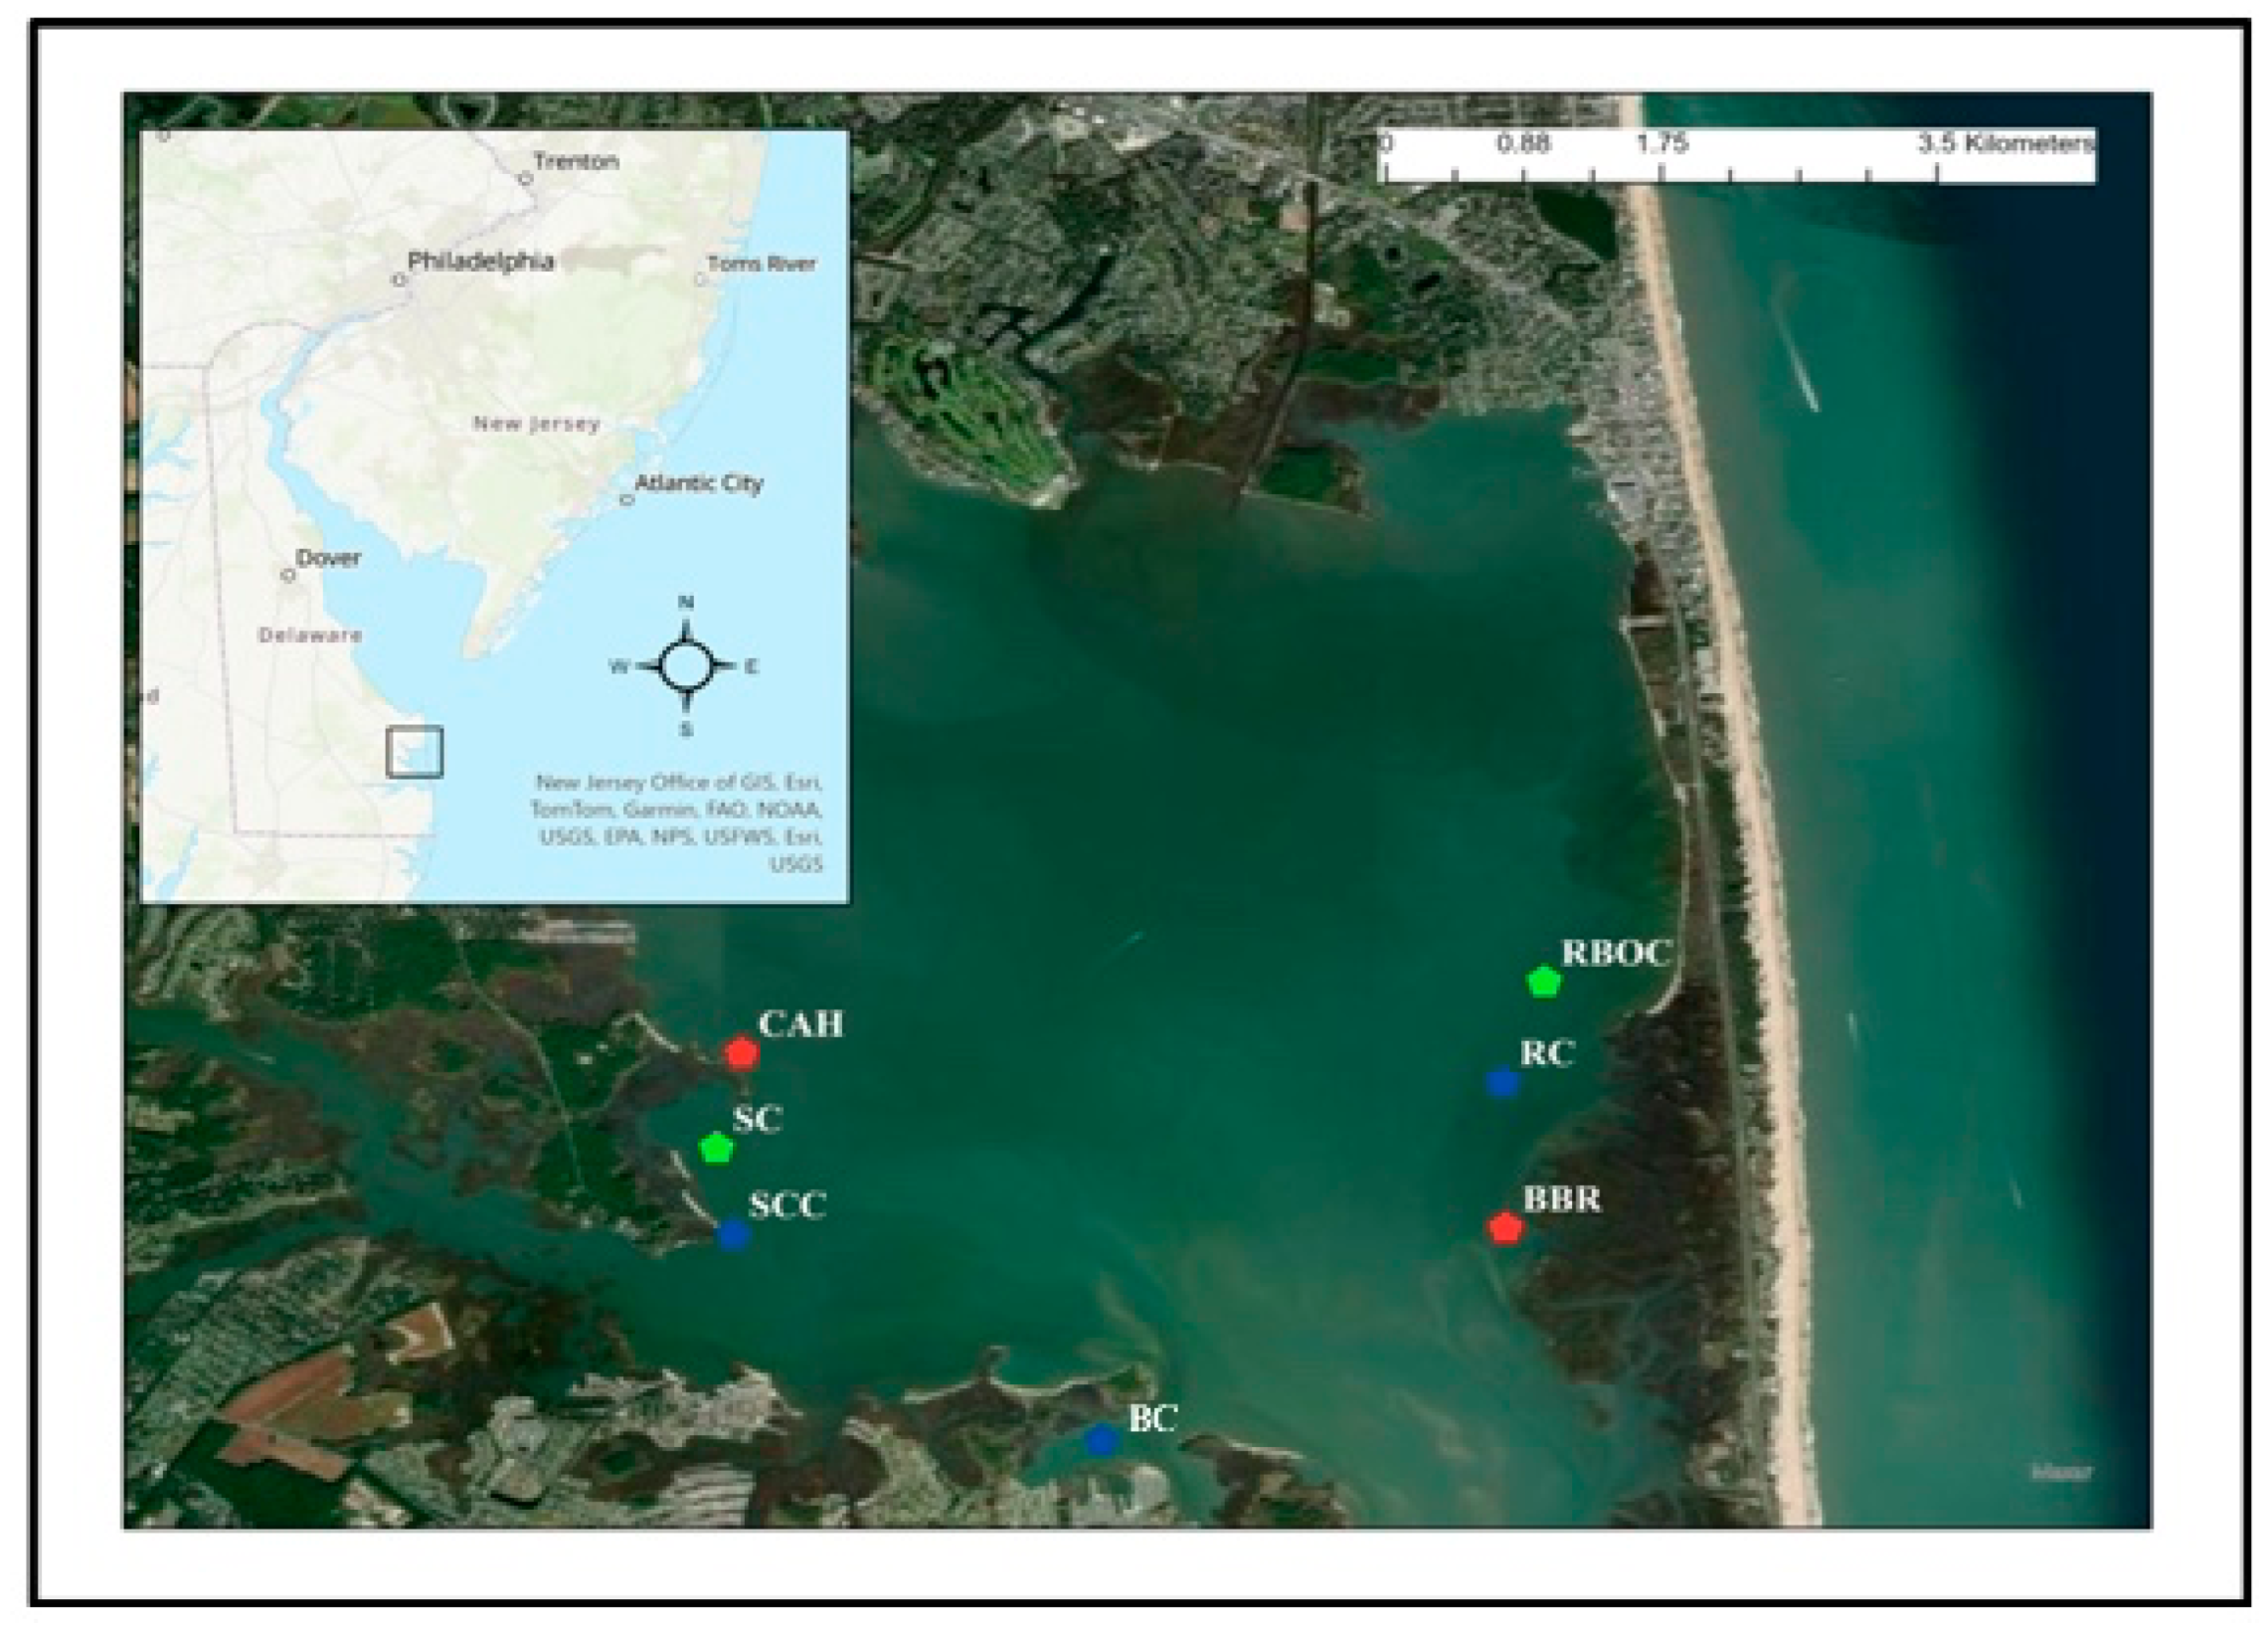
Figure 2.
The average omega Aragonite Saturation States at each site over the span of four years. Note. This data is the mean of three replicates per site.
Figure 2.
The average omega Aragonite Saturation States at each site over the span of four years. Note. This data is the mean of three replicates per site.
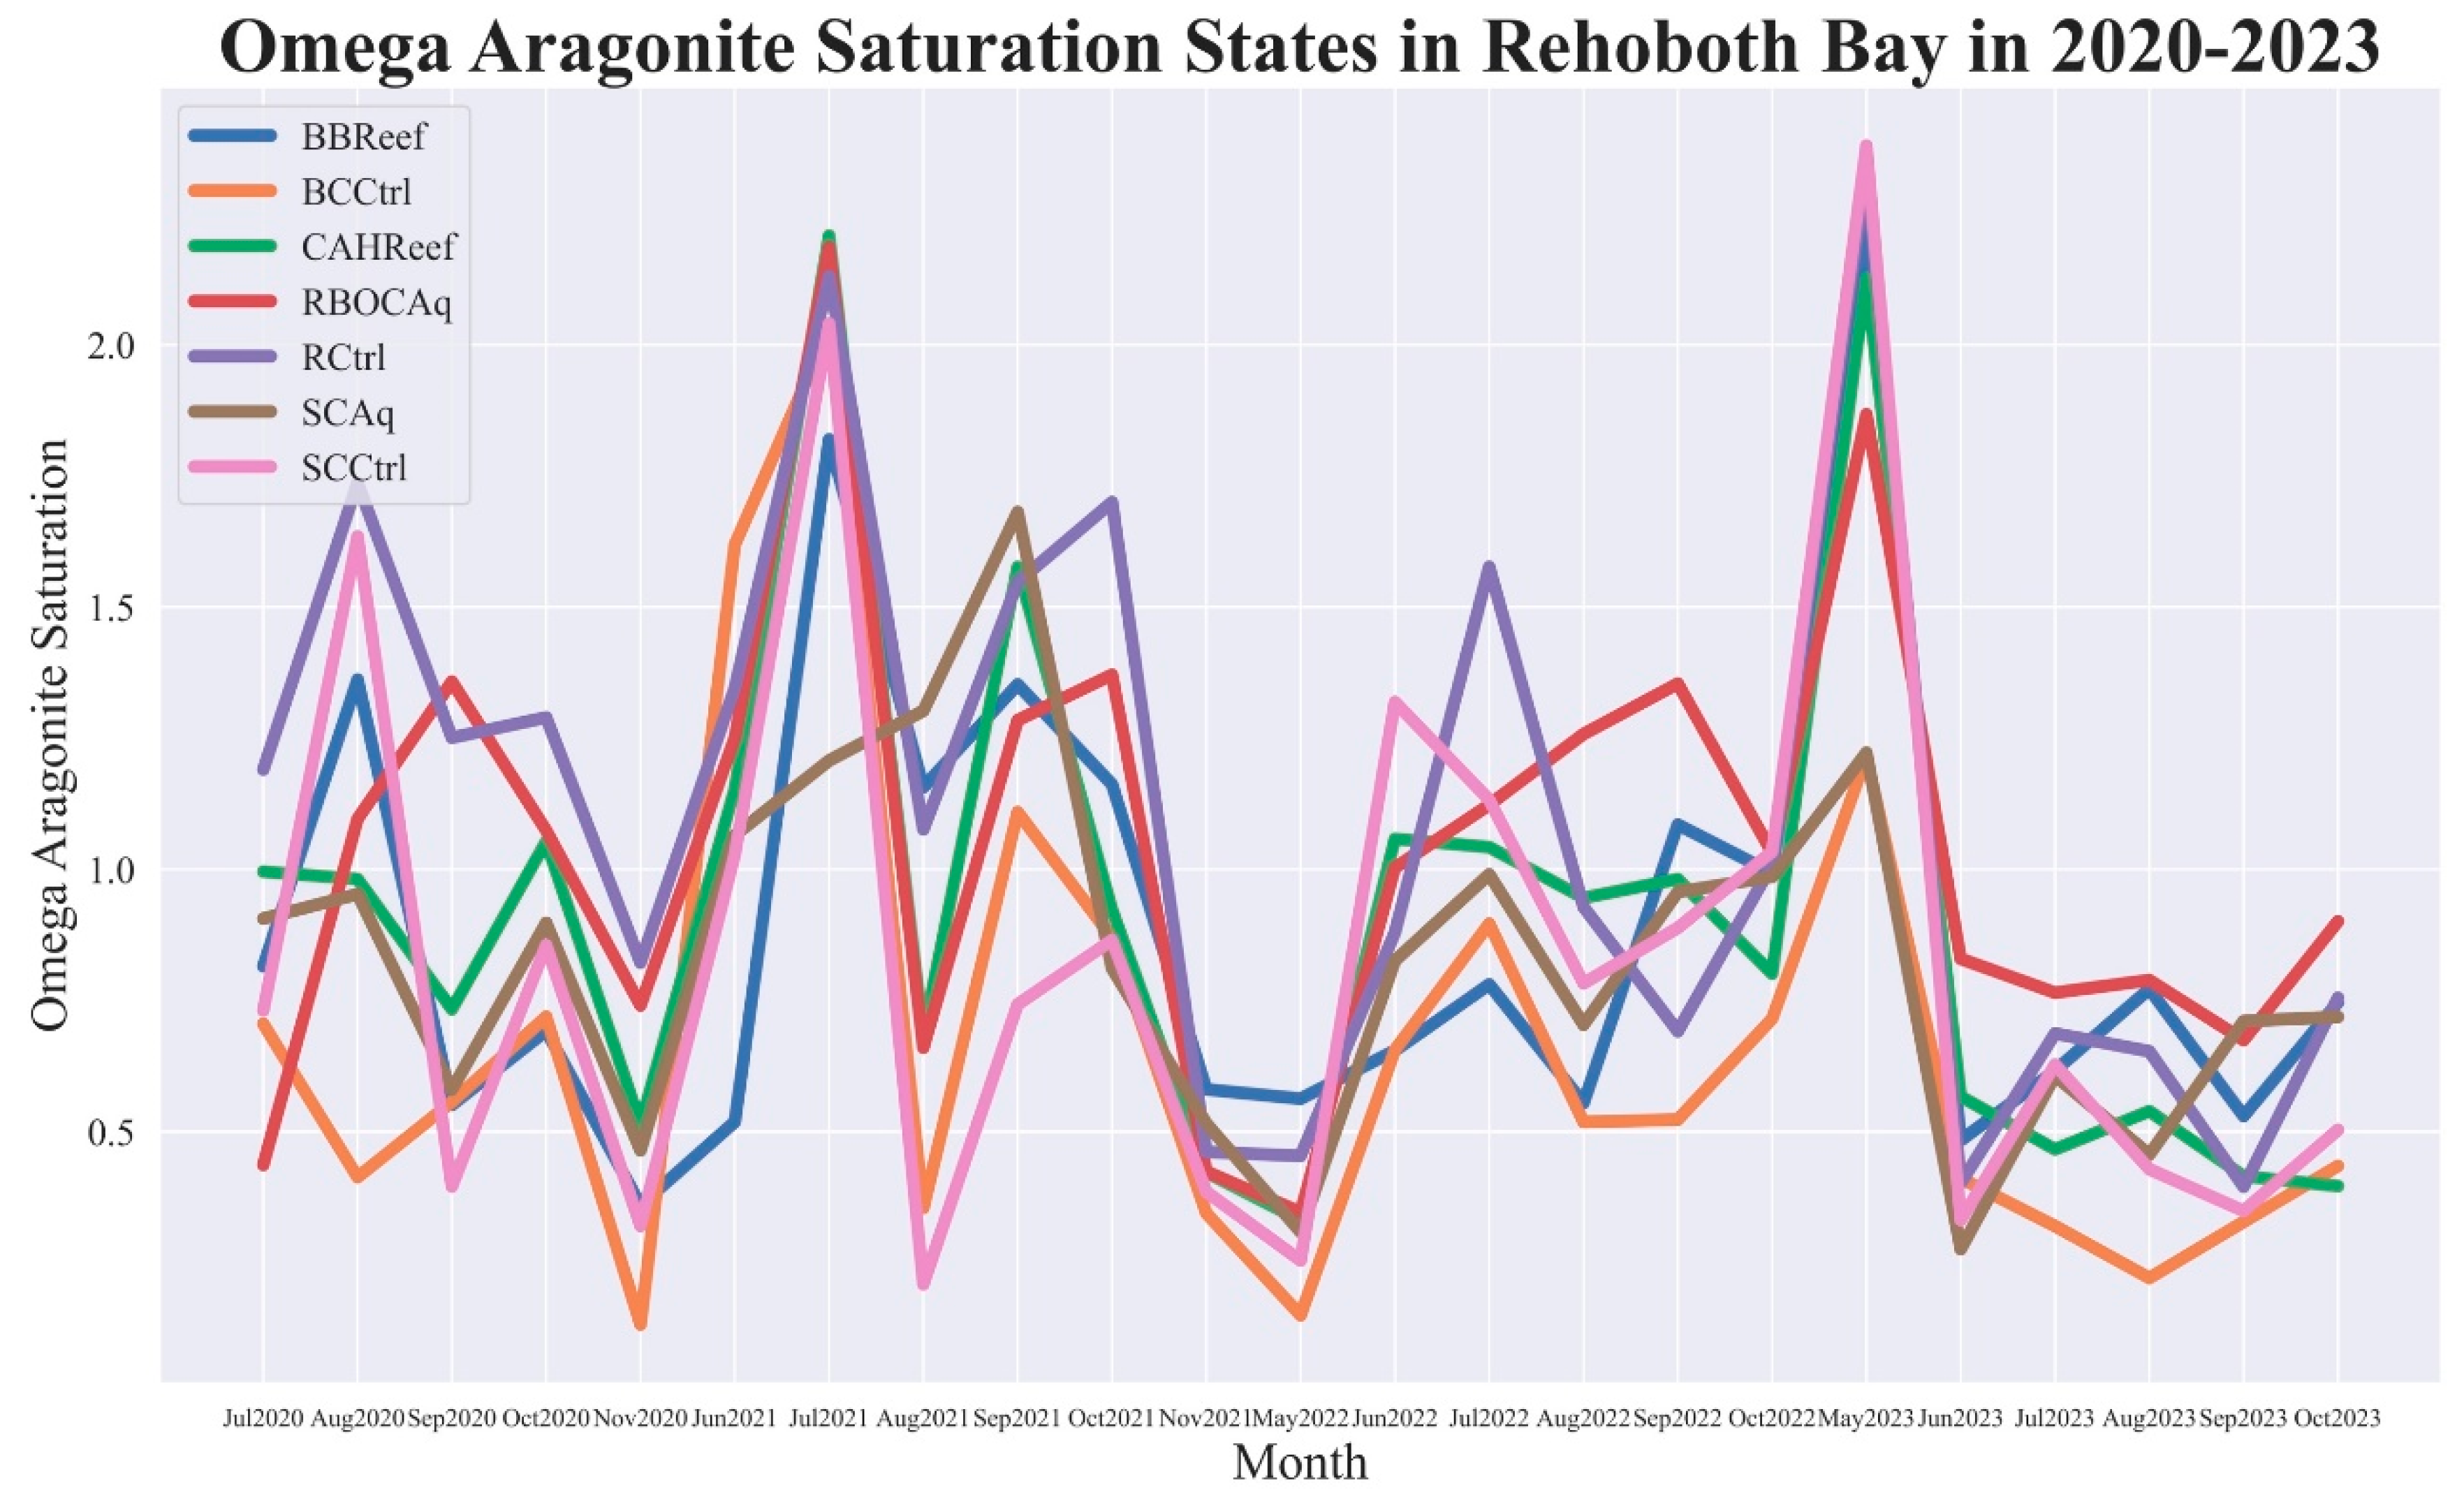
Figure 3.
(a-g). Spearman Correlation between physicochemical water quality parameters and the Aragonite Saturation State calculated at a) Big Bacon Reef, b) Rehoboth Bay Oyster Company, c) Redefer Control, d) Bay City, e) Sally’s Cove, f) Camp Arrowhead, and g) Sally’s Cove Control. Note. These heatmaps combine the average data from all four sampling years. Red boxes indicate a significant positive relationship, while blue boxes represent a significant negative relationship.
Disclaimer/Publisher’s Note: The statements, opinions and data contained in all publications are solely those of the individual author(s) and contributor(s) and not of MDPI and/or the editor(s). MDPI and/or the editor(s) disclaim responsibility for any injury to people or property resulting from any ideas, methods, instructions or products referred to in the content. |
© 2025 by the authors. Licensee MDPI, Basel, Switzerland. This article is an open access article distributed under the terms and conditions of the Creative Commons Attribution (CC BY) license (http://creativecommons.org/licenses/by/4.0/).
Copyright: This open access article is published under a Creative Commons CC BY 4.0 license, which permit the free download, distribution, and reuse, provided that the author and preprint are cited in any reuse.


