
Submitted:
24 April 2025
Posted:
25 April 2025
You are already at the latest version
Abstract
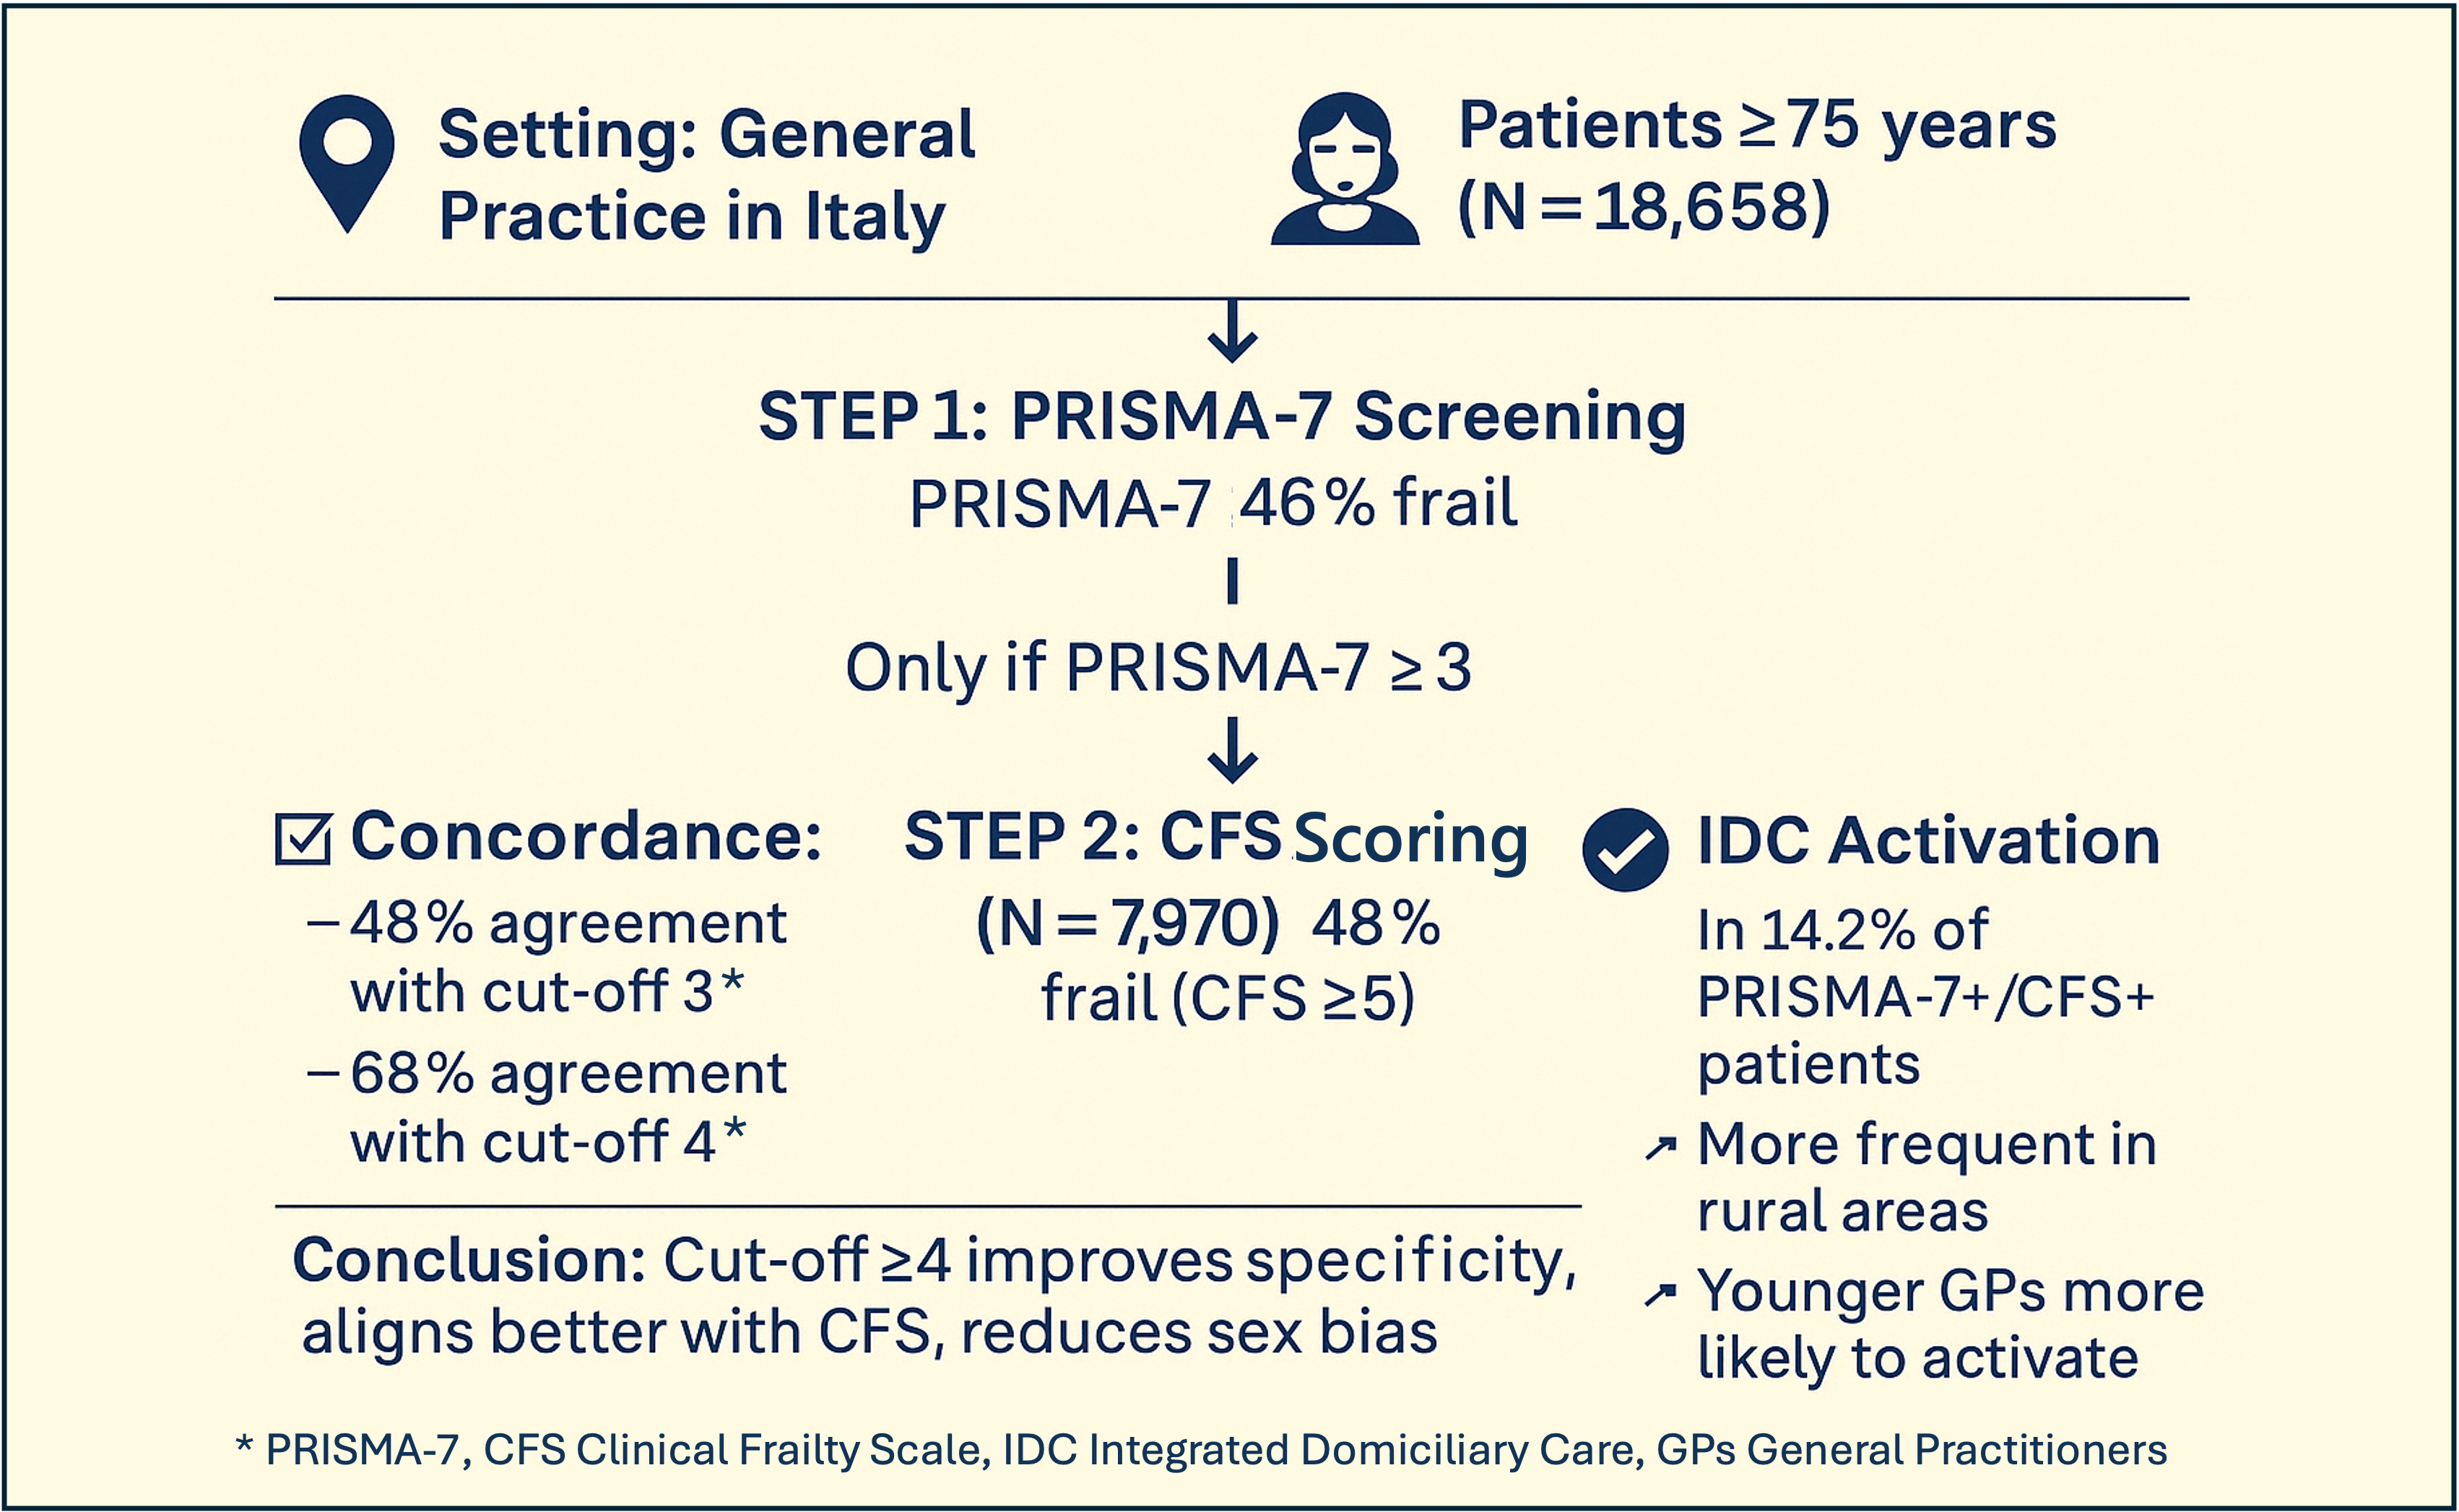
Background/Objectives: Frailty screening is crucial for identifying vulnerable older adults who may benefit from interventions. However, implementation of screening in primary care and integration into personalised care pathways remains limited. This study examined feasibility of a two-step frailty screening approach combining PRISMA-7 and Clinical Frailty Scale (CFS). The study assessed PRISMA-7 cut-offs’ impact on frailty classification, CFS agreement, and activation of integrated domiciliary care. Methods: This cross-sectional study was conducted in Northern Italy. General practitioners screened patients aged ≥75 years using the PRISMA-7 tool; if the result was positive (score ≥3), the Clinical Frailty Scale (CFS) was subsequently applied. Descriptive statistics, group comparisons, correlation analyses, and logistic regression models were employed to evaluate the predictors of frailty and activation of integrated domiciliary care. Comparisons were made for PRISMA-7 cut-off values ≥3 and ≥4. Results: Among the 18,658 patients evaluated using PRISMA-7, 46.0% were identified as frail with a threshold of ≥3 and 28.8% with ≥4. In a subset of 7,970 patients assessed using both the PRISMA-7 and Clinical Frailty Scale (CFS), CFS confirmed frailty (score ≥5) in 48.3% of patients at a PRISMA-7 cut-off of 3 and 68.2% at a cut-off of 4. Female sex predicted frailty by CFS, whereas male sex was correlated with frailty at the PRISMA-7 cut-off of 3. Rural location was correlated with frailty by PRISMA-7 but showed an inverse relationship with frailty by CFS. Integrated domiciliary care began in 14.2% of the patients meeting the clinical criteria, with a higher frequency in rural areas. Concordance between PRISMA-7 and CFS increased with patient age, and at a cut-off of 4. Conclusions: Two-step frailty screening using PRISMA-7 and CFS is viable for primary care. Using a PRISMA-7 cut-off score of ≥4 may reduce frailty overestimation, enhance congruence with clinical assessments, and reduce sex-related bias. These findings support incorporating structured screening into personalized care planning and refining frailty tools to improve equity and effectiveness.
Keywords:
frailty screening
; PRISMA-7
; clinical frailty scale
; primary care
; personalized medicine
; integrated domiciliary care
1. Introduction
The increasing proportion of older adults necessitates that primary healthcare systems prioritise the early and effective identification and management of frailty. Frailty, characterised as a multidimensional syndrome of diminishing physiological reserves, is linked to increased risks of adverse outcomes, including falls, disability, hospitalisation, and mortality [1,2,3]. The true clinical significance of identifying frailty extends beyond risk stratification, as it also holds the potential to inform personalised care strategies that address individual patient vulnerabilities and promote autonomy [4,5].
Recent health policy reforms, such as Italy’s Ministerial Decree 77/2022, have mandated the incorporation of frailty screening into routine general practice [6]. This development reflects the growing recognition of frailty as a fundamental aspect of person-centred care, enabling clinicians to tailor monitoring, prevention, and resource allocation to meet individual needs. However, the implementation of such measures in everyday primary care settings remains insufficiently explored, particularly concerning the translation of screening results into actionable interventions [7,8].
Among the various frailty assessment tools available, PRISMA-7 and the Clinical Frailty Scale (CFS) are frequently recommended because of their user-friendliness and clinical applicability [9,10]. The PRISMA-7 is a succinct self-reported questionnaire that evaluates mobility, support requirements, and social determinants, initially developed to identify individuals with disabilities at risk of functional decline [11]. Conversely, the CFS relies on physician judgment to assess overall functioning and frailty on a 9-point scale, and is well established in clinical environments [12]. A recent meta-analysis confirmed the diagnostic validity of PRISMA-7, with pooled sensitivity and specificity estimates of 73% and 86%, respectively [13]. Comparative studies have indicated that CFS provides higher specificity but lower sensitivity than PRISMA-7, supporting its complementary use in two-step screening models [10,14,15]. This study built on this framework. In a real-world primary care setting in Northern Italy, we implemented a structured two-step frailty screening strategy using the PRISMA-7 and CFS among community-dwelling adults aged 75 years and older. As a key innovation, we linked the screening results to integrated domiciliary care (IDC) activation, an established yet underutilised care pathway in Italy that facilitates multidisciplinary home-based interventions for frail patients [16].
We aimed to:
Two PRISMA-7 thresholds (cut-off ≥3 vs. ≥4) in terms of frailty classification and agreement with the CFS.
Demographic predictors of frailty were identified across both instruments.
We assessed the proportion of individuals for whom IDC was activated, and explored its association with frailty scores.
2. Materials and Methods
2.1. Study Design, Setting and Recruitment of Participants
This cross-sectional study was conducted between 1 October 2023 and 31 March 2024 in South Tyrol, Italy, and was scientifically designed by the Institute of General Practice and Public Health of Bolzano. The study was integrated into routine primary care by the local National Health Service as a project with voluntary adhesion of the general practitioners (GPs) and performance-based remuneration. All 295 practising GPs were eligible and invited to participate via email.
The participating GPs were instructed during online meetings and received written guidance on study procedures. They autonomously included eligible patients (community-dwelling adults aged ≥75 years) who provided consent to participate. The GPs were instructed not only to invite patients who already displayed clinical signs of frailty but also to all assisted patients aged ≥75 years. Residents of nursing homes and individuals with insufficient German/Italian language skills were also excluded.
2.2. Frailty Screening/Assessment and Collection of Data
The study procedure consisted of three steps.
Step 1. The GPs were asked to identify all their community-dwelling patients aged ≥75 years from their electronic medical records (EMR) and to invite them to a face-to-face visit, where the patients were informed about the study procedures and signed informed consent if they agreed to participate. The participating patients autonomously completed the PRISMA-7 questionnaire.
Step 2. All patients with a resulting PRISMA-7-score ≥3 were additionally assessed by the GPs using the Clinical Frailty Scale (CFS) during the same or additional face-to-face contact, and by consulting the GPs’ EMR. The available German [17,18] and Italian versions [19,20] of PRISMA-7 and CFS were used, as these are the two main languages spoken in the investigated (bilingual) region. Owing to the need for feasibility in daily practice, the second-step CFS assessment was limited to patients with PRISMA-7 ≥3. Therefore, measures of diagnostic accuracy (e.g. sensitivity, specificity, ROC curves) could not be computed using this study design.
Step 3. Patients with a CFS score ≥ 5 were potentially eligible for IDC activation if not already receiving structured home-based services. The concerned cases were evaluated by GPs in cooperation with the patients themselves, their relatives/caregivers, and the nurses of the healthcare district. Only newly activated IDC cases were recorded in this study. In uncertain cases, the research team contacted GPs for clarification.
All data (overall PRISMA-7-score and CFS-score per patient, newly activated IDC, and demographic characteristics) were pseudonymously recorded by the GPs in an Excel file and returned to the research team for analysis. The GPs had the time to submit their data files until 30 June 2024. Because the study was embedded into routine care, and the collected parameters could not be automatically extracted from the EMRs, a limited set of variables was assessed.
2.3. Statistical Analysis
Data were analysed using IBM SPSS Statistics 27.0. Descriptive statistics are presented as absolute/relative frequencies, medians, and interquartile ranges (IQR).
CFS results were categorised as ‘no frailty’ (score 4), ‘mild frailty’ (score 5), ‘moderate frailty’ (score 6) and ‘severe frailty’ (score 7-9) [12] and were additionally dichotomised into ‘not frail’ (score 1-4) and ‘frail’ (score 5-9). For PRISMA-7, a binary categorisation was used (‘not frail’: score 0-2, ‘frail’: score ≥3) [21] according to the literature which mostly applies a cut-off of 3 [22,23,24,25]. The PRISMA-7 user guide also mentions the possibility of using a cutoff of 4 [26], thus increasing specificity and lowering sensitivity [21]. We therefore additionally conducted the PRISMA-7 analyses with cut-off 4 (dichotomization: ‘not frail’: score 0-3, ‘frail’: score ≥4).
In cases of missing responses, the concerned patient or GP was excluded from the analysis of the respective variables. For the analyses of CFS and IDC, all patients were treated according to the study protocol (CFS score considered in case of PRISMA-7-score ≥3, IDC-activation considered in case of PRISMA-7-score ≥3 and CFS score ≥5). For the combined analyses of PRISMA-7 and CFS, the following cases were excluded: completely missing PRISMA-7-score and CFS-score, missing PRISMA-7 scores, missing CFS-scores, and PRISMA-negative and CFS-positive cases (Supplementary Table S1).
The rurality of the participating GP offices was defined according to the local official classification which identifies eight towns as urban and all other villages as rural areas. Owing to data protection constraints, the patient addresses were not collected. Therefore, rurality was approximated on the basis of the officially classified location of the GP office. Although not individually verified, this represents a valid proxy in our context, as South Tyrolean GPs typically assist patients from their surrounding geographic areas.
Chi-square tests, Fisher’s exact test, Mann-Whitney-U-tests and Kendall-Tau-b correlations (as appropriate) were used for univariate comparisons and correlation analyses. Kaplan-Meier estimates and accumulated Kaplan-Meier plots were used to assess the estimated prevalence of frailty over the years and to estimate the mean age at survival until frailty occurred for both sexes. Cox regression analysis was used to assess significant differences between the sexes. Due to the stepwise study design, where CFS was only applied in PRISMA-7-positive patients, diagnostic accuracy measures, such as sensitivity, specificity, and ROC analyses, could not be conducted.
Moreover, we used logistic regression models to investigate potential predictors of frailty and IDC activation (frailty: PRISMA-7 cut-off 3, PRISMA-7 cut-off 4, CFS, and comparison of three patient groups according to their combined PRISMA-7 and CFS frailty status). Variables that were significant in univariate analyses were included as independent variables (potential predictors). We explored the correlations between the dependent variables and possible predictors as well as associations between the independent variables using Kendall-Tau-b correlations; independent variables were excluded from the logistic regression model when they were highly correlated with another predictor (τ >0.3). For all significant independent variables, the odds ratios (OR) and corresponding 95% confidence intervals (CI) were presented. The model fit was assessed using Nagelkerke’s R2. Due to the large sample size, the significance level was set at p < 0.001 for all tests.
3. Results
3.1. Study Population and Screening Completion
Of the 295 GPs invited to participate, 142 (48.1%) participated in this study. The median age of the participating GPs was 47 years (IQR, 39–58 years), and 50.7% were female. GPs working in urban areas (52.8%) were more represented than those working in rural areas (47.2%). On average, participating GPs assisted approximately 1,600 inhabitants, including a median of 190 persons aged ≥75 years. Participating GPs were significantly younger than their non-participating colleagues (median age 58 years, IQR 45.5–64, p < 0.001), and more often worked in urban locations (52.8% vs. 36.6%, p = 0.007). No statistically significant differences were observed in the GP sex (Table S1).
A total of 19,501 community-dwelling older adults were enrolled, of whom 60.0% were female, with a median age of 81 years (IQR 78–85). This represents 67.3% of all inhabitants aged ≥75 years (n = 27,727) under the care of participating GPs and 32.6% of the entire ≥75-year-old population in South Tyrol (n = 57,190) [27].
Among the participants, 18,658 (95.7%) completed the PRISMA-7 questionnaire and were included in the frailty screening analysis. Missing PRISMA-7 and/or CFS scores occurred in 7.5% of cases. Specifically, 829 participants had missing scores (4.3%), 14 had only PRISMA-7 missing (0.1%), and 612 were PRISMA-positive, but had no documented CFS (3.1%) (Table S2). Based on the analysis protocol, 18,004 participants were included in analyses using a PRISMA-7 cut-off of 3 and 17,670 in analyses using a cut-off of 4. Table 1 summarises the characteristics of the participating GPs and individuals.
3.2. Frailty Classification and Agreement Between Tools
Frailty according to PRISMA-7 with a cut-off ≥3 was detected in 8,582 patients (46.0% of all screened patients). Among these, 7,970 patients were further assessed using the CFS, with 3,852 (48.3%) classified as frail (CFS score ≥5). When using the alternative PRISMA-7 cut-off ≥4, the frailty prevalence decreased to 5,372 patients (28.8%), while agreement with the CFS improved markedly; 68.2% of PRISMA-7-positive individuals were also rated as frail by CFS.
The median PRISMA-7 score was 4.0 (IQR 3.0–5.0) in the frail group, with cut-off values of 3, and 5.0 (IQR 4.0–6.0), cut-off 4. The median CFS score of frail individuals was 6.0 (IQR 5.0–7.0). For both instruments, the mildest frailty categories were most frequently observed: PRISMA-7 score, 3 (17.2%); PRISMA-7 score, 4 (10.5%); and CFS score, 5 (19.1%). The proportion of individuals rated in the most severe category was 2.2% for the PRISMA-7 (score 7) and 0.5% for the CFS (score 9). PRISMA-7 and CFS scores were significantly correlated (τ = 0.603, p < 0.001; Kendall-Tau-b). Table 2 summarises the frailty prevalence and score distributions for both tools.
Patients were classified into three frailty groups based on the combined PRISMA-7 and CFS results: not frail according to PRISMA-7, frail according to PRISMA-7 but not frail according to CFS, and frail according to both PRISMA-7 and CFS.
At a PRISMA-7 cut-off of 3, 55.7% of patients were classified as not frail, 22.9% as frail by PRISMA-7 only, and 21.4% as frail by both tools. When using cut-off 4, the proportion of non-frail individuals increased to 71.4%, and disagreement (PRISMA-frail, CFS-not-frail) decreased markedly to 9.1%. The group classified as frail using both tools remained relatively stable (19.5%) (Table 3).
3.3. Frailty Classification Patterns and Determinants
The frailty prevalence varied according to the assessment tool and threshold. Using a PRISMA-7 cut-off of ≥3, 46.0% of the patients were classified as frail. This decreased to 28.8% with cut-off ≥4. Among patients with PRISMA-7 ≥3 who also completed a CFS assessment, 48.3% were frail (CFS ≥5), showing moderate agreement between the tools. Concordance increased with age from 39.4% in patients aged 75–84 years to 56.2% in those aged ≥85 years.
3.3.1. Age-Related Patterns
Figure 1 (top row) illustrates the age-associated shift in the score distributions. PRISMA-7 showed a stronger correlation with age (τ = 0.390) than CFS (τ = 0.192), although CFS was only applied to PRISMA-positive cases.
Kaplan-Meier curves illustrate the mean age at frailty onset by sex and tool. For a PRISMA-7 cut-off score of 3, women became frail later than men (mean age 87.6 vs. 85.7 years, p < 0.001) (Figure 2). This difference was smaller with cut-off 4 and absent for CFS. Frailty prevalence increased with age across all tools and thresholds. The year-by-year evolution of frailty status for both PRISMA-7 cut-offs illustrated this trend in more detail (Supplementary Figure S1).
3.3.2. Sex-Related Differences
Figure 1 (middle row) shows that women tended toward higher CFS scores, whereas men peaked at a PRISMA-7 score of 3.PRISMA-7 cut-off 3 classified more men than women as frail (51.5% vs. 41.9%), whereas CFS identified more women (56.8% vs. 38.9%) This discordance declined with PRISMA cut-off 4.
Logistic regression confirmed that female sex was a predictor of frailty per CFS (OR 1.88, p < 0.001), but male sex was a predictor for PRISMA-7 frailty at cut-off 3 (OR for female sex 0.54, p < 0.001) (Table 4). Sex-based score disagreement was the most frequent among younger patients and was reduced using a cut-off of 4. The full stratifications are provided in Supplementary Tables S3–S6 and Supplementary Figure S2.
3.3.3. Geographic Trends
Frailty was more frequent in rural areas by PRISMA-7 cut-off 3 (48.0% vs. 44.7%, p < 0.001), but not with cut-off 4. In contrast, CFS indicated higher frailty in urban areas (50.7% vs. 45.1%, p < 0.001). As shown in Figure 1 (bottom row), PRISMA scores peaked at 3–4 in both settings, while CFS scores showed a broader spread in urban patients.
Regression models showed rural origin as a predictor of PRISMA-7 frailty at a cut-off of 3 (OR 1.19), but a negative predictor for CFS-based frailty (OR 0.83) (Table 4). The extended models are listed in Supplementary Table S6.
3.4. Clinical Implications: Integrated Care and Variability
3.4.1. Activation of Integrated Care
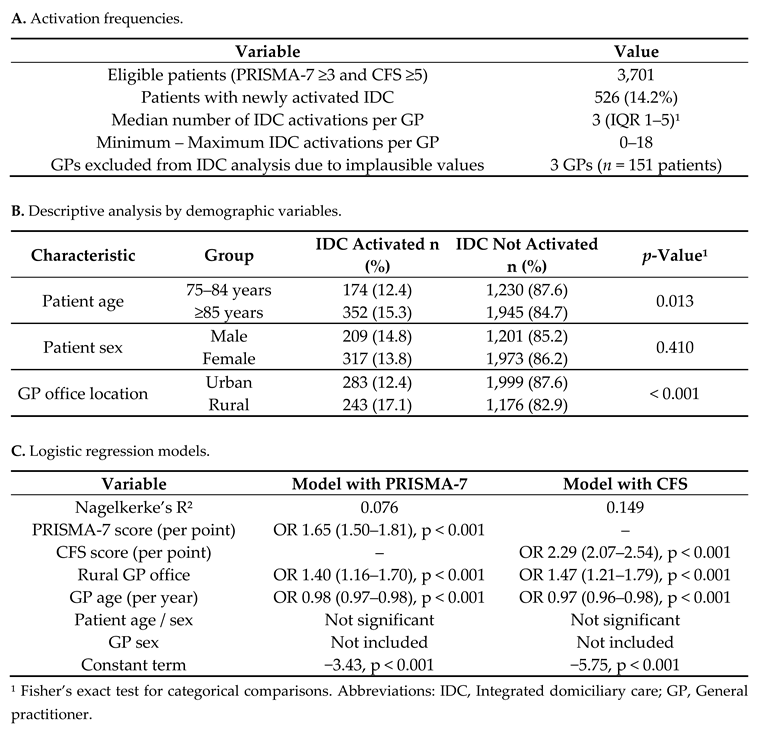
Among patients who met the criteria for care activation (PRISMA-7 score ≥3 and CFS score ≥5), IDC was initiated in 526 individuals, corresponding to 14.2% of eligible cases. The median number of IDC activations per GP was three (IQR, 1–5), ranging from 0 to 18. Three GPs with implausibly high IDC counts (n = 151 patients) were excluded from this analysis after failing to respond to the data validation requests (Table 5, panel A).
IDC activation occurred more frequently in rural areas (17.1%) than in urban areas (12.4%; p < 0.001). No significant differences were observed in patient sex (p = 0.410), whereas older patients (≥85 years) showed slightly higher IDC activation rates than those aged 75–84 years (15.3% vs. 12.4%, p = 0.013) (Table 5, panel B).
In the multivariable logistic regression models (Table 5, panel C), rural GP office location and frailty severity were both independently associated with an increased likelihood of IDC activation. Owing to the high collinearity between the PRISMA-7 and CFS scores (τ = 0.603, p < 0.001), two separate models were computed. The CFS-based model demonstrated better explanatory power (Nagelkerke’s R² = 0.149) than the PRISMA-7 model (R² = 0.076). In both models, younger age at GP was significantly associated with IDC activation, whereas GP sex, patient age, and sex were not significant predictors.
Notably, the CFS score was a stronger predictor of IDC activation (OR 2.29, 95% CI 2.07–2.54; p < 0.001) than the PRISMA-7 score (OR 1.65, 95% CI, 1.50–1.81; p < 0.001), underlining the relevance of physician-rated functional assessments in care decisions.
Despite the systematic frailty screening process, the relatively low IDC activation rate (14.2%) suggests possible barriers to translating frailty identification into coordinated care action.
3.4.2. Variability in Frailty Classification
We also explored the variability in frailty classification at the level of individual GPs. The median proportion of patients classified as frail per GP was 44% using a PRISMA-7 cut-off of 3 (IQR 40–52%) and 29% using a cut-off of 4 (IQR 24–34%). According to the CFS, the median GP-level frailty rate among PRISMA-positive patients was 46% (IQR, 35–60%). A few outlier GPs classified nearly all assessed patients as frail, with two GPs recording a 100% CFS-based frailty rate. These findings suggest heterogeneity in tool application and clinical interpretation. The full distribution details are provided in the Supplementary Figure S3.
To explore the variability in implementation, we analysed the distribution of frail patients per GP. According to the PRISMA-7 cut-off of 3, the median proportion of frail individuals per GP was 44% (IQR, 40–52%), which decreased to 29% (IQR, 24–34%) with a cut-off of 4. According to the CFS, the median proportion of frail individuals among the PRISMA-7-positive patients was 46% (IQR 35–60%). Some individual GPs exhibited unusually high classification rates; notably, two GPs rated 100% of their assessed PRISMA-7-positive patients as frail according to the CFS.
These findings highlight the variability in the clinical application of frailty tools, possibly reflecting differences in interpretation, experience, or documentation practices. The full distributions are presented in Table S3.
4. Discussion
This large-scale cross-sectional study provides a detailed overview of frailty in older adults in northern Italy using both the PRISMA-7 screening tool and the Clinical Frailty Scale (CFS) in a two-step approach. To our knowledge, this is the first study in Italy to comparatively analyze the two PRISMA-7 cut-offs (≥3 and ≥4) against CFS in routine primary care. The findings highlight key differences in frailty prevalence, classification concordance, and influence of sociodemographic factors on screening outcomes.
Using the commonly applied PRISMA-7 cut-off of ≥3, nearly half of the screened population (46.0%) was classified as frail. This proportion dropped to 28.8% with the higher cut-off ≥4, suggesting a substantial reduction in potential overclassification. Among patients assessed with both PRISMA-7 and CFS, only 48.3% were concordantly identified as frail using cut-off 3, whereas concordance rose to 68.2% with cut-off 4. These results support the interpretation that a higher threshold improves alignment with clinical judgment, as operationalised through CFS [21].
Despite this improvement in concordance, the subgroup of patients who were classified as frail by PRISMA-7 but not by CFS (“PRISMA+/CFS−”) remained sizable at cut-off 3 and was markedly reduced with a cut-off of 4. In contrast, the group “frail by both tools” remained stable across cut-offs, indicating that those with more manifest frailty were robustly detected regardless of the threshold. These findings suggest that a PRISMA-7 cut-off of 4 may provide better specificity for identifying individuals with clinically relevant frailty, particularly in settings where second-step assessments or care pathways depend on screening results [21,22].
Frailty classification was strongly age-dependent across both tools, with prevalence increasing steadily from 75 to 95 years and above, as supported in prior studies [28,29]. Sex-specific patterns differed between tools: PRISMA-7 identified more men as frail (especially at cut-off 3), while CFS more frequently classified women as frail [30,31,32,33]. These contrasting patterns are consistent with previous literature and underscore the importance of sex-sensitive frailty assessment.
Rural patients were more frequently classified as frail by PRISMA-7, whereas urban patients more often met the CFS criteria, reflecting potentially different social and environmental risk profiles [34,35,36]. These opposing trends may be partially explained by PRISMA-7 items referencing functional or social support (e.g. item 6) [37], which may behave differently across rural and urban contexts.
Finally, frailty was significantly associated with the activation of IDC, particularly among patients with concordant PRISMA-7 and CFS frailty classifications. IDC was more frequently initiated in rural areas and by younger general practitioners, possibly reflecting differing organizational contexts and professional attitudes [38,39,40]. These results highlight the relevance of frailty screening in promoting intensified care and the potential for targeted implementation strategies to improve equity and uptake.
4.1. Comparison with Other Studies
The frailty prevalence observed in this study is consistent with prior investigations in both Italian and international settings, although methodological differences complicate direct comparisons. A previous analysis in Italy using an electronic frailty index derived from general practitioners’ electronic medical records (EMRs) reported lower but increasing rates of moderate-to-severe frailty over the past decade (from 4.4% in 2011 to 8.1% in 2021) [16]. In a northern Italian region (Friuli-Venezia Giulia), population-level screening using PRISMA-7 in adults aged ≥75 years revealed a prevalence of 30% [19]. These findings fall within the range observed in the present study using cut-off 4 (28.8%).
PRISMA-7 prevalence estimates from primary care studies generally range between 25–35% using cut-off 3 and around 12% using cut-off 4 [25,41], indicating that the lower threshold may overclassify individuals, especially in younger age strata. Our findings corroborate this pattern, particularly among patients aged 75–84 years, where the prevalence dropped substantially with a cut-off of 4. This is in line with previous validation studies that have proposed a higher specificity at a cut-off of 4, especially for healthier or younger older adults [42,43,44].
Although direct comparisons with CFS are limited due to the tool’s selective application in our cohort, the observed CFS frailty prevalence (48.3% among PRISMA-7-positive patients) was higher than the 23–25% reported in two Italian primary care studies that applied CFS to unselected populations aged ≥65 years [45,46]. However, these differences likely reflect differences in the age composition and the two-step design used in our study. An emergency department study comparing PRISMA-7 and CFS reported an even higher prevalence (72% and 27%, respectively), likely because of clinical acuity and case selection [24].
International data show wide variability, depending on the population, instrument, and setting. A systematic review reported frailty prevalence rates ranging from 3.8% to 70.6% across older populations using different tools [47], while Italian cohort studies found rates between 4% and 45% depending on definitions [32,34,48,49,50]. In England, where frailty screening has been implemented nationally in primary care since 2017, using a variety of clinician-judged tools, the detected prevalence was 35.4% among adults aged ≥65 years [51]. An Australian study using the FRAIL scale found that 33% of patients aged ≥75 years were frail and 47% were pre-frail in general practice settings [52], confirming the high prevalence of at-risk individuals in community care.
Taken together, our findings contribute to the international literature by reinforcing that instrument choice and cut-off selection have a major impact on the measured frailty prevalence. They also confirm that PRISMA-7 cut-off 4 may strike a better balance between identifying clinically meaningful frailty and minimizing misclassification, as previously suggested in multiple international validations [42,43,44,53].
4.2. Equity and Implementation Considerations
The results of this study highlight equity considerations in frailty screening, particularly in terms of sex and geography. Although frailty is generally more prevalent in women because of their longer life expectancy and greater risk of multimorbidity and disability [16,30,32,33,54,55], we observed an inverse pattern with a PRISMA-7 cut-off of 3, which classified more men than women as frail. This discrepancy was reduced, but not eliminated, when a cut-off value of 4. In contrast, CFS classified more women as frail, which is consistent with previous studies [33,54].
These findings support earlier concerns that Item 2 of the PRISMA-7 (assigning one point for male sex) may introduce structural bias by inflating frailty scores in men [31,42,55]. While this item may have been intended to flag higher risk profiles among men, its effect appears to be a distortion of the sex-equitable frailty classification. Several authors have proposed removing item 2 to form a “PRISMA-6” version with improved internal consistency and reduced sex-related misclassification [55]. In our study, a PRISMA-7 cut-off of 4 was more effective in reducing the male overclassification effect but did not fully restore balance. These results further support the recommendation of adopting a modified PRISMA-6 or adjusting the scoring threshold based on sex-stratified performance metrics.
Geographic disparities have emerged in recent years. Patients from rural areas were more frequently identified as frail by PRISMA-7, particularly at a cut-off of 3, whereas CFS indicated higher frailty rates in urban areas. This contrast may be partly explained by social context: Item 6 of PRISMA-7 addresses social support (“can you count on someone if you need help?”) may yield higher frailty scores in urban settings, where social isolation is more prevalent [34,35,36,47]. However, the intent of the item is controversial: while a “no” answer may reflect autonomy and capability, it may also indicate vulnerability due to a lack of available support [26]. Prior studies from Brazil, China, and Greece have suggested that removing Item 6 improves scale performance and construct validity [37,42,43].
Variations in frailty classification across GPs were notable. While PRISMA-7 showed moderate variability across providers, CFS assessments were more dispersed, with some GPs classifying nearly all patients as frail, and others showing greater discrimination. This reflects both the semi-structured nature of the CFS and the influence of clinician judgment, which may differ by experience, comfort with geriatric concepts, or familiarity with the tool. Although PRISMA-7 has demonstrated strong inter-rater reliability in prior studies [42], the observed GP-level heterogeneity in frailty identification supports the need for consistent training, calibration, and possibly audit feedback strategies in scaling up screening programs.
Taken together, these findings suggest that frailty screening tools are not neutral. Their structure, scoring, and implementation context influence who is identified as frail and who gains access to further care. To ensure equitable detection and management, screening tools should be regularly validated across sociodemographic groups and their item composition should be revisited where structural bias is likely.
4.3. Integrated Domiciliary Care (IDC) Insights
The implementation of the IDC in this study setting provides insights into how frailty screening may translate into clinical action. Among patients classified as frail by both PRISMA-7 (cut-off ≥3) and CFS, IDC was activated in 14.2% of cases. While this figure may seem modest, it reflects real-world uptake in an existing regional model where integrated care is available, but not uniformly triggered by frailty.
Frailty status was the strongest predictor of IDC activation in both logistic regression models. CFS showed a higher predictive value (OR 2.29, 95% CI 2.07–2.54) than PRISMA-7 (OR 1.65, 95% CI 1.50–1.81), likely reflecting its closer alignment with clinician judgment of severity and functional decline. These findings reinforce the utility of two-step frailty models in clinical decision-making, in which a brief screener (e.g. PRISMA-7) is followed by a more nuanced clinical assessment (e.g. CFS) to guide intervention planning [4,56].
Interestingly, IDC was activated more often in rural areas than in urban settings (17.1% vs. 12.4%, p < 0.001). This disparity may reflect differences in care organisation; rural regions may benefit from closer interprofessional networks, stronger informal support systems, and simplified care coordination [35,36]. In contrast, urban areas—despite often having more resources—may face bureaucratic fragmentation, workforce shortages, and communication barriers that hinder care integration. These structural challenges warrant targeted health policy interventions to ensure equitable IDC access across geography.
GP-related factors also influence IDC uptake. Younger GPs were more likely to activate IDC, which may reflect generational differences in attitudes toward team-based care or greater receptiveness to integrated models. Alternatively, less-experienced GPs may feel a stronger need to involve multidisciplinary teams for reassurance and shared management. In contrast, the sex of the GP was not associated with IDC activation.
While the IDC model in this study region ensures continuity of medical care, it does not systematically include all components of a comprehensive geriatric assessment, such as structured medication reviews, nutritional optimisation, or physical activity promotion [5,23]. This may limit its potential impact on the reversal and mitigation of frailty. Nonetheless, its widespread availability and compatibility with routine practice make it a pragmatic choice for this study. Future enhancements could include more structured assessment modules or allied health involvement to strengthen their preventive and rehabilitative capacity.
Despite these strengths, the overall activation rate of IDC remained low in proportion to eligible patients, suggesting that additional barriers, such as unclear referral pathways, limited nursing capacity, or variation in GP engagement, may have contributed to underutilisation. These findings reflect a broader gap in the Italian primary care system, where frailty is recognised but not yet systematically addressed by structured care pathways [16].
A planned follow-up study will assess the impact of IDC activation on clinical outcomes including hospitalisation and mortality. These data will be essential to quantify the added value of frailty screening in directing patients toward intensified person-centred care.
4.4. Strengths and Limitations
This study had several strengths. First, it represents one of the largest population-level frailty-screening efforts conducted in Italian primary care. The prospective design and structured two-step assessment using both PRISMA-7 and CFS enhanced the reliability and depth of the findings. By integrating data from over 140 GPs and nearly 20,000 older adults, this study reflects the real-world diversity in practice settings and patient populations. The use of two validated tools also supports the growing recommendation for stepwise screening approaches to improve detection accuracy in primary care [22].
Importantly, the study leveraged an existing care pathway, IDC, which enabled the investigation of how frailty classification may influence care activation. The tools were implemented with minimal disruption to routine practice and without additional resources or equipment, demonstrating the feasibility of scalable frailty screening.
However, this study had some limitations. The participation rate among invited GPs was moderate (48.1%), and participating GPs differed from non-participants in terms of age and practice location. This raises the possibility of a selection bias and limits the generalisability of the findings beyond the study region. Furthermore, participating GPs may have been more motivated or more familiar with structured assessments, which could have influenced both the quality and consistency of the frailty classification.
CFS was only applied in patients with a PRISMA-7 score ≥3, precluding a full comparative analysis of test accuracy (for example, ROC curve analysis or sensitivity/specificity estimates). Additionally, only summary scores for PRISMA-7 were collected; item-level data were not available, which limits a more detailed psychometric analysis or exploration of specific sources of bias (e.g. items 2 or 6). The location of the patients was inferred from the GP office location, which may not always reflect the patient’s actual residential setting.
This cross-sectional design prevents the assessment of frailty progression, predictive validity, or clinical outcomes. Important frailty-related variables such as multimorbidity, polypharmacy, cognitive or affective status, and health literacy were not assessed and may have influenced the screening results. CFS assessments, guided by structured definitions, may also be influenced by subjective judgment, particularly in the absence of standardised functional or cognitive data.
Finally, alternative frailty identification methods such as electronic medical record (EMR)-derived indices or phenotype-based tools (for example, Fried frailty criteria) were excluded because of feasibility constraints in routine practice. These alternatives have shown utility in other studies [25,47,56,57] but require further evaluation regarding their practicality and diagnostic performance in primary care.
4.5. Implications for Practice and Future Research
The findings of this study offer several practical implications for frailty screening and management in primary care. Most importantly, they support the use of PRISMA-7 with a cut-off ≥4 in clinical settings. This threshold reduced overclassification, improved concordance with the CFS, and partially mitigated sex-related bias, particularly the disproportionate identification of men as frail at cut-off 3. At the same time, it maintained the ability to detect patients with more advanced frailty, as reflected by stable proportions in the group classified as “frail by both tools.”
While cut-off 3 may still be appropriate for use in preventive care or population health settings, where sensitivity is prioritised to capture early stage or pre-frail individuals, cutoff 4 appears better suited for contexts where resource allocation or care escalation decisions are based on screening results. These findings are consistent with international validation studies that proposed a cut-off of 4 for improved specificity in relatively healthier populations [42,43,44].
The persistent discrepancy in frailty classification between men and women at cut-off 3, linked to the scoring of male sex (item 2) in PRISMA-7, highlights the importance of refining existing tools to promote equity. Removal of this item (i.e. the PRISMA-6 variant) may reduce sex-related misclassification and enhance internal consistency, as previously proposed in the literature [42,43,55]. Further studies are required to evaluate the performance of PRISMA-6 versus PRISMA-7 across subgroups and settings.
IDC emerged as a responsive component of care once frailty was identified, but its activation remained limited and regionally variable. Health systems aiming to implement or scale up frailty screening must address barriers to IDC uptake, especially in urban areas, where care coordination may be more fragmented. Investments in community nursing, inter-professional collaboration, and simplified referral processes could help ensure that frailty screening leads to tangible care interventions.
Future research should focus on the following priorities.
Validation studies with complete PRISMA-7 and CFS assessments across the full sample will allow for ROC analyses and more robust cut-off calibration.
Longitudinal outcome studies examining frailty progression, care responsiveness, hospitalisation, institutionalisation, and mortality by frailty group and screening tools.
Equity-focused analyses of tool performance by sex, age, language, or social determinants can inform the refinement of existing tools.
Implementation science approaches to identify barriers and enablers of IDC activation and explore provider-level factors (e.g. GP engagement and readiness for interprofessional collaboration).
Comparative studies of PRISMA-7, PRISMA-6, and alternative instruments, such as the FRAIL scale [52,57] or EMR-derived frailty indices [16,58,59], including their acceptability, diagnostic accuracy, and feasibility in primary care.
Ultimately, systematic frailty screening and stratified care pathways, when designed with attention to tool validity, context, and equity, have the potential to improve patient outcomes and optimise healthcare resource use. As frail older adults represent the highest users of health services [4], investment in appropriate screening strategies is not only clinically but also economically justified.
5. Conclusions
This study demonstrates the feasibility and clinical value of systematic, two-step frailty screening in primary care using PRISMA-7 and the CFS. The use of a PRISMA-7 cut-off ≥4, rather than the commonly applied cut-off ≥3, improved concordance with clinical judgment, reduced sex-related misclassification, and more precisely identified patients with manifest frailty who may benefit from integrated care. The findings support the integration of validated frailty tools into routine general practice, particularly when combined with follow-up assessments and care pathways, such as IDC. However, disparities in frailty classification by sex and geography as well as variations in IDC activation highlight the need for targeted implementation strategies, tool refinement, and provider training. Future research should focus on validating modified frailty screening instruments, assessing clinical outcomes linked to frailty classification and care activation, and evaluating strategies to optimise equitable access to intensified care in vulnerable older adults. Frailty screening holds promise as a cornerstone of personalised and preventive care; however, its benefits depend on accuracy, equity, and actionable follow-up.
Supplementary Materials
The following supporting information can be downloaded at the website of this paper posted on Preprints.org, Table S1: Missing data overview for PRISMA-7 and Clinical Frailty Scale (CFS) screening results; Table S2: Comparison of demographic characteristics between participating and non-participating general practitioners (GPs); Table S3: Frailty prevalence according to age group, sex, and GP office location, using PRISMA-7 (cut-offs ≥3 and ≥4) and CFS (score ≥5); Table S4: Frailty classification combinations by subgroup: Comparison of PRISMA-7 (cut-off 3 and 4) with CFS; Table S5: Extended logistic regression models comparing combined frailty status groups (PRISMA-7 and CFS); Figure S1: Sex-specific frailty classification by age and PRISMA-7 cut-off. Figure S2: Evolution of frailty status by age and PRISMA-7 cut-off; Figure S3: Inter-GP variability in frailty classification using PRISMA-7 and CFS.
Author Contributions
Study conceptualization, G.P., C.J.W. and A.E.; methodology, G.P. and C.J.W.; investigation, G.P. and A.M.; data curation, A.M.; statistical analysis, A.M. and V.B.; writing – original draft preparation, A.M.; writing – review and editing, D.A., V.B., A.E., G.P., C.J.W; supervision, D.A., A.E.; project administration, A.M. and G.P. All authors read and agreed to the final version of the manuscript.
Funding
This research received no external funding.
Institutional Review Board Statement
The study was conducted according to the ethical guidelines for medical research involving human participants (Declaration of Helsinki) as part of routine healthcare in local general practice. The study was approved by the Institutional Review Board on 2023-02-13 (approval number: 2023-07) and the local health authority (‘Südtiroler Sanitätsbetrieb/Azienda Sanitaria dell’Alto Adige) on 2023-08-22 (approval number: 2023-A-001114).
Informed Consent Statement
Written informed consent was obtained from all participating patients prior to their inclusion.
Data Availability Statement
The data presented in this study are available on request from the corresponding author for ethical and privacy reasons.
Acknowledgments
We express our gratitude to the participating GPs and patients for their collaboration. Furthermore, we thank the members of the local health authority and Marialuise Obexer for their administrative support and contact with participating GPs.
Conflicts of Interest
The authors declare no conflict of interest. The funders had no role in the study design; collection, analyses, or interpretation of data; writing of the manuscript; or decision to publish the results.
Abbreviations
The following abbreviations are used in this manuscript:
| CFS | Clinical Frailty Scale |
| CI | Confidence interval |
| EMR | Electronic medical record |
| GP(s) | General practitioner(s) |
| IDC | Integrated domiciliary care |
| IQR | Interquartile range |
| OR | Odds ratio |
| PRISMA-7 | Program of Research to Integrate Services for the Maintenance of Autonomy 7 items |
| ROC | Receiver operating characteristic (curve) |
References
- Hoogendijk, E.O.; van der Horst, H.E.; Deeg, D.J.H.; Frijters, D.H.M.; Prins, B.A.H.; Jansen, A.P.D.; Nijpels, G.; van Hout, H.P.J. The Identification of Frail Older Adults in Primary Care: Comparing the Accuracy of Five Simple Instruments. Age Ageing 2013, 42, 262–265. [Google Scholar] [CrossRef]
- Doody, P.; Lord, J.M.; Greig, C.A.; Whittaker, A.C. Frailty: Pathophysiology, Theoretical and Operational Definition(s), Impact, Prevalence, Management and Prevention, in an Increasingly Economically Developed and Ageing World. Gerontology 2023, 69, 927–945. [Google Scholar] [CrossRef]
- Boucher, E.L.; Gan, J.M.; Rothwell, P.M.; Shepperd, S.; Pendlebury, S.T. Prevalence and Outcomes of Frailty in Unplanned Hospital Admissions: A Systematic Review and Meta-Analysis of Hospital-Wide and General (Internal) Medicine Cohorts. EClinicalMedicine 2023, 59, 101947. [Google Scholar]
- Kojima, G.; Liljas, A.E.M.; Iliffe, S. Frailty Syndrome: Implications and Challenges for Health Care Policy. Risk Manag Healthc Policy 2019, 12, 23–30. [Google Scholar] [CrossRef]
- Somagutta, M.R.; Uday, U.; Bathula, N.R.; Pendyala, S.; Mahadevaiah, A.; Jain, M.S.; Mahmutaj, G.; Gad, M.; Jean Baptiste, J. Diagnosing Frailty in Primary Care Practice. Cureus 2022, 3, 23329. [Google Scholar]
- Mauro, M.; Giancotti, M. The 2022 Primary Care Reform in Italy: Improving Continuity and Reducing Regional Disparities? Health Policy 2023, 135, 104862. [Google Scholar]
- Karunananthan, S.; Bergman, H. Managing Frailty in Primary Care: Evidence Gaps Cannot Be Ignored. CMAJ 2018, 190, E1122–E1123. [Google Scholar] [CrossRef]
- Roller-Wirnsberger, R.; Lindner, S.; Liew, A.; O’Caoimh, R.; Koula, M.L.; Moody, D.; Espinosa, J.M.; Durme, T.; Dimitrov, P.; Benjak, T. European Collaborative and Interprofessional Capability Framework for Prevention and Management of Frailty-a Consensus Process Supported by the Joint Action for Frailty Prevention (ADVANTAGE) and the European Geriatric Medicine Society (EuGMS. Aging Clin Exp Res 2020, 4, 561–570. [Google Scholar]
- Soulis, G.; Kyriakopoulou, E.; Leventouri, A.; Zigkiri, E.; Efthymiou, V.; Kentros, Z.; Koutsouri, A. Pilot Testing of Useful Tools’ Validity for Frailty Assessment in Greece: Translated PRISMA-7 Tool, Modified Fried Criteria and Clinical Frailty Scale. Healthcare (Basel, Switzerland) 2024, 12. [Google Scholar] [CrossRef]
- Sukkriang, N.; Punsawad, C. Comparison of Geriatric Assessment Tools for Frailty among Community Elderly. Heliyon 2020, 6, e04797. [Google Scholar] [CrossRef]
- Raiche, M.; Hebert, R.; Dubois, M.F. PRISMA-7: A Case-Finding Tool to Identify Older Adults with Moderate to Severe Disabilities. Arch Gerontol Geriatr 2008, 1, 9–18. [Google Scholar]
- Rockwood, K.; Theou, O. Using the Clinical Frailty Scale in Allocating Scarce Health Care Resources. Can Geriatr J 2020, 3, 210–215. [Google Scholar]
- Vo, N.T.; Tu, Y.-K.; Lin, K.-C.; Chiu, H.-Y.; Huang, H.-C. Diagnostic Accuracy of the FRAIL Scale, Groningen Frailty Indicator, Tilburg Frailty Indicator, and PRISMA-7 for Frailty Screening Among Older Adults in Community Settings: A Systematic Review and Network Meta-Analysis. Gerontologist 2024, 64, gnae008. [Google Scholar] [CrossRef]
- Abbasi, M.; Khera, S.; Dabravolskaj, J.; Garrison, M.; King, S. Identification of Frailty in Primary Care: Feasibility and Acceptability of Recommended Case Finding Tools Within a Primary Care Integrated Seniors’ Program. Gerontol Geriatr Med 2019, 5, 2333721419848153. [Google Scholar] [CrossRef]
- Clegg, A.; Rogers, L.; Young, J. Diagnostic Test Accuracy of Simple Instruments for Identifying Frailty in Community-Dwelling Older People: A Systematic Review. Age Ageing 2015, 44, 148–152. [Google Scholar] [CrossRef]
- Vetrano, D.L. 2023.
- Braun, T.; Grüneberg, C.; Thiel, C. German Translation, Cross-Cultural Adaptation and Diagnostic Test Accuracy of Three Frailty Screening Tools : PRISMA-7, FRAIL Scale and Groningen Frailty Indicator. Z Gerontol Geriatr 2018, 51, 282–292. [Google Scholar] [CrossRef]
- Kaeppeli, T.; Rueegg, M.; Dreher-Hummel, T.; Brabrand, M.; Kabell-Nissen, S.; Carpenter, C.R.; Bingisser, R.; Nickel, C.H. Validation of the Clinical Frailty Scale for Prediction of Thirty-Day Mortality in the Emergency Department. Ann Emerg Med 2020, 3, 291–300. [Google Scholar]
- Aziende del Servizio Sanitario Regionale PRISMA-7 - Progetto di screening per individuare la fragilità nelle persone anziane; Promozione della salute e prevenzione; Regione Autonoma Friuli Venezia Giulia: Trieste, Italia, 2022.
- Butzlaff, M.; Nonnenkamp, J.P.
- Vo, N.T.; Tu, Y.K.; Lin, K.C.; Chiu, H.Y.; Huang, H.C. Diagnostic Accuracy of the FRAIL Scale, Groningen Frailty Indicator, Tilburg Frailty Indicator, and PRISMA-7 for Frailty Screening Among Older Adults in Community Settings: A Systematic Review and Network Meta-Analysis. Gerontologist 2024, 64, 6. [Google Scholar]
- Clegg, A.; Rogers, L.; Young, J. Diagnostic Test Accuracy of Simple Instruments for Identifying Frailty in Community-Dwelling Older People: A Systematic Review. Age Ageing 2015, 1, 148–152. [Google Scholar]
- Abbasi, M.; Rolfson, D.; Khera, A.S.; Dabravolskaj, J.; Dent, E.; Xia, L. Identification and Management of Frailty in the Primary Care Setting. CMAJ 2018, 190, E1134–E1140. [Google Scholar] [CrossRef]
- Torun, E.; Az, A.; Akdemir, T.; Solakoglu, G.A.; Aciksari, K.; Gungorer, B. Evaluation of the Risk Factors for Falls in the Geriatric Population Presenting to the Emergency Department. Ulus Travma Acil Cerrahi Derg 2023, 8, 897–903. [Google Scholar]
- Ambagtsheer, R.C.; Thompson, M.Q.; Archibald, M.M.; Casey, M.G.; Schultz, T.J. Diagnostic Test Accuracy of Self-Reported Screening Instruments in Identifying Frailty in Community-Dwelling Older People: A Systematic Review. Geriatrics & Gerontology International 2020, 20, 14–24. [Google Scholar] [CrossRef]
- User Guide for the PRISMA-7 Questionnaire to Identify Older Adults with Significant Disabilities. 2021.
- Landesinstitut fur Statistik ASTAT Bevolkerung in Sudtirol.
- Thillainadesan, J.; Scott, I.A.; Le Couteur, D.G. Frailty, a Multisystem Ageing Syndrome. Age and Ageing 2020, 49, 758–763. [Google Scholar] [CrossRef]
- Gordon, E.H.; Hubbard, R.E. Frailty: Understanding the Difference between Age and Ageing. Age and Ageing 2022, 51, afac185. [Google Scholar] [CrossRef]
- O’Caoimh, R.; Sezgin, D.; O’Donovan, M.R.; Molloy, D.W.; Clegg, A.; Rockwood, K.; Liew, A. Prevalence of Frailty in 62 Countries across the World: A Systematic Review and Meta-Analysis of Population-Level Studies. Age Ageing 2021, 1, 96–104. [Google Scholar]
- Salminen, M.; Viljanen, A.; Eloranta, S.; Viikari, P.; Wuorela, M.; Vahlberg, T.; Isoaho, R.; Kivela, S.L.; Korhonen, P.; Irjala, K. Frailty and Mortality: An 18-Year Follow-up Study among Finnish Community-Dwelling Older People. Aging Clin Exp Res 2020, 10, 2013–2019. [Google Scholar]
- Galluzzo, L.; Noale, M.; Maggi, S.; Feraldi, A.; Baldereschi, M.; Carlo, A.; Onder, G.; Group, I.W. Frailty Prevalence, Incidence, and Association with Incident Disability in the Italian Longitudinal Study on Aging. Gerontology 2023, 3, 249–260. [Google Scholar]
- Ofori-Asenso, R.; Chin, K.L.; Mazidi, M.; Zomer, E.; Ilomaki, J.; Zullo, A.R.; Gasevic, D.; Ademi, Z.; Korhonen, M.J.; LoGiudice, D. Global Incidence of Frailty and Prefrailty Among Community-Dwelling Older Adults: A Systematic Review and Meta-Analysis. JAMA Netw Open 2019, 8, 198398. [Google Scholar]
- Liotta, G.; O’Caoimh, R.; Gilardi, F.; Proietti, M.G.; Rocco, G.; Alvaro, R.; Scarcella, P.; Molloy, D.W.; Orlando, S.; Mancinelli, S. Assessment of Frailty in Community-Dwelling Older Adults Residents in the Lazio Region (Italy): A Model to Plan Regional Community-Based Services. Arch Gerontol Geriatr 2017, 68, 1–7. [Google Scholar]
- Ji, D.; Guo, H.; Qiu, S.; Dong, L.; Shen, Y.; Shen, Z.; Xu, J. Screening for Frailty and Its Association with Activities of Daily Living, Cognitive Impairment, and Falls among Community-Dwelling Older Adults in China. BMC Geriatr 2024, 1, 576. [Google Scholar]
- Cohen, S.A.; Ahmed, N.; Brown, M.J.; Meucci, M.R.; Greaney, M.L. Rural-Urban Differences in Informal Caregiving and Health-Related Quality of Life. J Rural Health 2022, 2, 442–456. [Google Scholar]
- Soulis, G.; Kyriakopoulou, E.; Leventouri, A.; Zigkiri, E.; Efthymiou, V.; Kentros, Z.; Koutsouri, A. Pilot Testing of Useful Tools’ Validity for Frailty Assessment in Greece: Translated PRISMA-7 Tool, Modified Fried Criteria and Clinical Frailty Scale. Healthcare (Basel 2024, 12, 9. [Google Scholar]
- Groenewegen, P.P.; Bosmans, M.W.G.; Boerma, W.G.W.; Spreeuwenberg, P. The Primary Care Workforce in Europe: A Cross-Sectional International Comparison of Rural and Urban Areas and Changes between 1993 and 2011. European Journal of Public Health 2020, 30, iv12–iv17. [Google Scholar] [CrossRef]
- Chevillard, G.; Mousquès, J. Medically Underserved Areas: Are Primary Care Teams Efficient at Attracting and Retaining General Practitioners? Social Science & Medicine 2021, 287, 114358. [Google Scholar] [CrossRef]
- Hansen, H.; Pohontsch, N.J.; Bole, L.; Schäfer, I.; Scherer, M. Regional Variations of Perceived Problems in Ambulatory Care from the Perspective of General Practitioners and Their Patients - an Exploratory Focus Group Study in Urban and Rural Regions of Northern Germany. BMC Family Practice 2017, 18, 68. [Google Scholar] [CrossRef]
- Sutorius, F.L.; Hoogendijk, E.O.; Prins, B.A.H.; van Hout, H.P.J. Comparison of 10 Single and Stepped Methods to Identify Frail Older Persons in Primary Care: Diagnostic and Prognostic Accuracy. BMC Fam Pract 2016, 17, 102. [Google Scholar] [CrossRef]
- Yeung, M.T.; Gan, Y.; Teo, S.Q.; Lim, K.Q.; Leow, H.X.; Jbabdi, M.; Raiche, M.; Yang, M. The Chinese Translation and Cross-Cultural Adaptation of PRISMA-7 Questionnaire: An Observational Study to Establish the Accuracy, Reliability and Validity. BMC Geriatr 2024, 24, 204. [Google Scholar] [CrossRef]
- Saenger, A.L.F.; Caldas, C.P.; Raîche, M.; da Motta, L.B. Identifying the Loss of Functional Independence of Older People Residing in the Community: Validation of the PRISMA-7 Instrument in Brazil. Arch Gerontol Geriatr 2018, 74, 62–67. [Google Scholar] [CrossRef]
- Yaman, H.; Ünal, Z. The Validation of the PRISMA-7 Questionnaire in Community-Dwelling Elderly People Living in Antalya, Turkey. Electron Physician 2018, 10, 7266–7272. [Google Scholar] [CrossRef] [PubMed]
- Battaggia, A.; Scalisi, A.; Franco Novelletto, B.; Fusello, M.; Michieli, R.; Cancian, M. Prevalence of frailty in older people in Veneto (Italy. J Drug Assess 2019, 1, 1–12. [Google Scholar]
- Battaggia, A.; Scalisi, A.; Magliozzo, F.; Franco, B.N.; Fusello, M.; Michieli, R.; Cancian, M. The Burden of Frailty in Older People Visiting GPs in Veneto and Sicily, Italy. Journal of Drug Assessment 2019, 8, 87–96. [Google Scholar] [CrossRef] [PubMed]
- Liu, J.; Zhu, Y.; Tan, J.K.; Ismail, A.H.; Ibrahim, R.; Hassan, N.H. Factors Associated with Frailty in Older Adults in Community and Nursing Home Settings: A Systematic Review with a Meta-Analysis. J Clin Med 2024, 13, 8. [Google Scholar]
- Roppolo, M.; Mulasso, A.; Gobbens, R.J.; Mosso, C.O.; Rabaglietti, E. A Comparison between Uni- and Multidimensional Frailty Measures: Prevalence, Functional Status, and Relationships with Disability. Clin Interv Aging 2015, 10, 1669–1678. [Google Scholar] [PubMed]
- Perna, S.; Francis, M.D.; Bologna, C.; Moncaglieri, F.; Riva, A.; Morazzoni, P.; Allegrini, P.; Isu, A.; Vigo, B.; Guerriero, F. Performance of Edmonton Frail Scale on Frailty Assessment: Its Association with Multi-Dimensional Geriatric Conditions Assessed with Specific Screening Tools. BMC Geriatr 2017, 1, 2. [Google Scholar]
- Manfredi, G.; Midão, L.; Paúl, C.; Cena, C.; Duarte, M.; Costa, E. Prevalence of Frailty Status among the European Elderly Population: Findings from the Survey of Health, Aging and Retirement in Europe. Geriatr Gerontol Int 2019, 19, 723–729. [Google Scholar] [CrossRef] [PubMed]
- Alharbi, K.; Blakeman, T.; Marwijk, H.; Reeves, D. Identification and Management of Frail Patients in English Primary Care: An Analysis of the General Medical Services 2018/2019 Contract Dataset. BMJ Open 2021, 8, 041091. [Google Scholar]
- Job, J.; Nicholson, C.; Clark, D.; Arapova, J.; Jackson, C. The Feasibility, Acceptability and Appropriateness of Screening for Frailty in Australians Aged 75 Years and over Attending Australian General Practice. Aust J Prim Health 2024, 30. [Google Scholar]
- Celik, S.; Turkdogan, O.; Erdogan, T.; Celik, P. PRISMA-7 Is a Predictor of Intensive Care Unit Admission and Mortality in Older Patients in an Emergency Department. Geriatr Gerontol Int 2025, 1, 61–66. [Google Scholar]
- Perez Coello, L.; Bouza Bellas, L.; Veras Castro, R. Prevalence of Frailty in a Population Aged 70 and Older Who Pay a Visit to Health Center and Its Detection in Primary Care. Rev Esp Geriatr Gerontol 2024, 3, 101454. [Google Scholar]
- Ausserhofer, D.; Mahlknecht, A.; Barbieri, V.; Engl, A.; Piccoliori, G.; Wiedermann, C.J. Comparing the PRISMA-7 and a Modified Version (PRISMA-6) for Frailty Screening: Addressing Sex Bias in Community-Dwelling Older Adults. Geriatrics 2025, 10, 9. [Google Scholar] [CrossRef]
- Turner, G.; Clegg, A. ; British Geriatrics Society; Age UK; Royal College of General Practioners Best Practice Guidelines for the Management of Frailty: A British Geriatrics Society, Age UK and Royal College of General Practitioners Report. Age Ageing 2014, 43, 744–747. [Google Scholar] [CrossRef] [PubMed]
- Morley, J.E.; Malmstrom, T.K.; Miller, D.K. A Simple Frailty Questionnaire (FRAIL) Predicts Outcomes in Middle Aged African Americans. J Nutr Health Aging 2012, 7, 601–608. [Google Scholar]
- Luo, J.; Liao, X.; Zou, C.; Zhao, Q.; Yao, Y.; Fang, X.; Spicer, J. Identifying Frail Patients by Using Electronic Health Records in Primary Care: Current Status and Future Directions. Front Public Health 2022, 10, 901068. [Google Scholar] [CrossRef] [PubMed]
- Swart, K.M.; Heijden, A.A.; Blom, M.T.; Overbeek, J.A.; Nijpels, G.; Hout, H.P.; Elders, P.J.; Herings, R.M. Identification of Frailty in Primary Care: Accuracy of Electronically Derived Measures. Br J Gen Pract 2023, 735, 752–759. [Google Scholar]
Figure 1.
Distribution of PRISMA-7 and CFS scores by age, sex, and GP office location. Bar charts showing the distribution of PRISMA-7 (left panels) and Clinical Frailty Scale (CFS, right panels) scores among patients aged ≥75 years stratified by (top) age group (75–84 vs. ≥85 years), (middle) sex, and (bottom) rural vs. urban location of the general practitioner) office. Most patients aged 75–84 years scored ≤2 on PRISMA-7 and ≤4 on CFS, whereas those aged ≥85 years scored ≥4 on PRISMA-7 and ≥5 on CFS. Female patients showed higher frequencies of CFS scores ≥5, while male patients were more likely to score 3 on the PRISMA-7. Urban-rural differences in score distributions were modest but suggested slightly higher CFS scores in urban populations. Abbreviations: CFS, Clinical Frailty Scale; GP, General Practitioner.
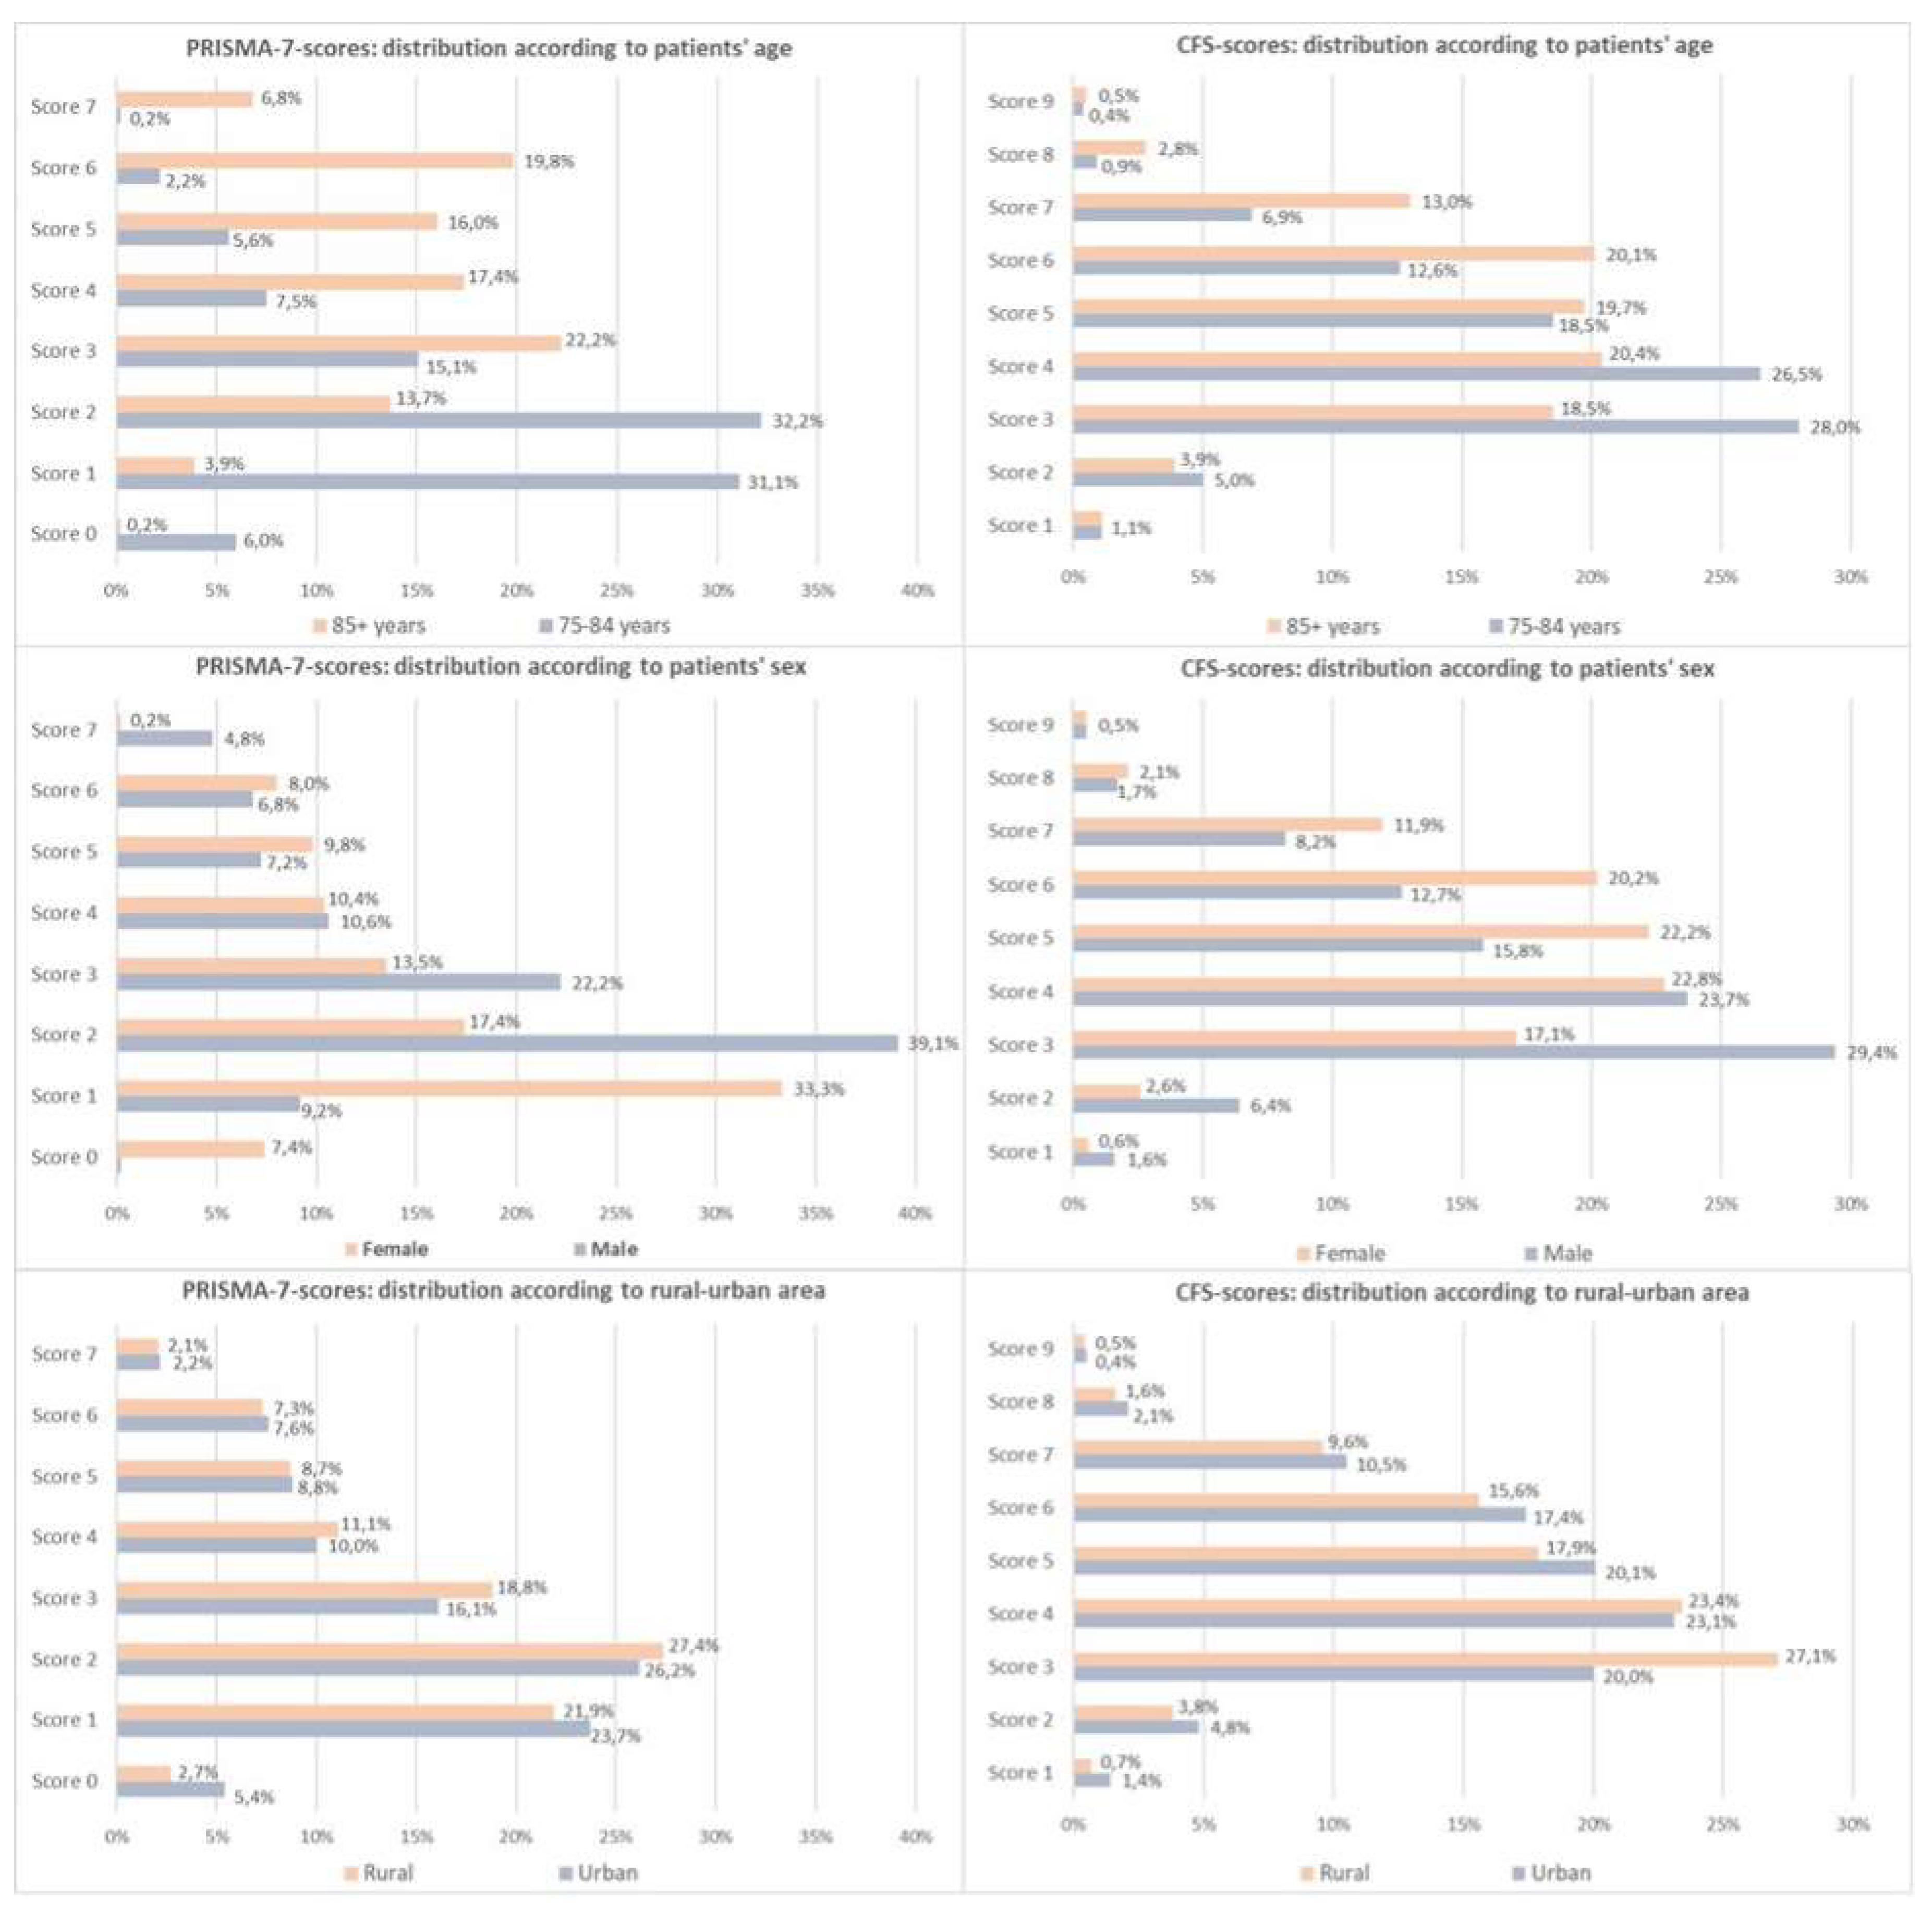
Figure 2.
Age of frailty onset by sex, Kaplan-Meier analysis for PRISMA-7, and Clinical Frailty Scale. Kaplan-Meier curves displaying cumulative frailty prevalence by patient age stratified by sex and frailty assessment tool: PRISMA-7 (cut-off 3 and 4) and Clinical Frailty Scale (CFS). With a PRISMA-7 cutoff of 3, men became frail earlier than women (mean age: 85.7 vs. 87.6 years; p < 0.001). This difference narrowed at a cut-off of 4 (88.1 vs. 89.2 years; p < 0.001). In contrast, CFS showed no significant sex difference in the age of frailty onset (89.2 vs. 88.8 years; p = 0.013). These findings highlight how cut-off selection affects sex-specific frailty classification in older adults. Abbreviations: CFS, Clinical Frailty Scale.
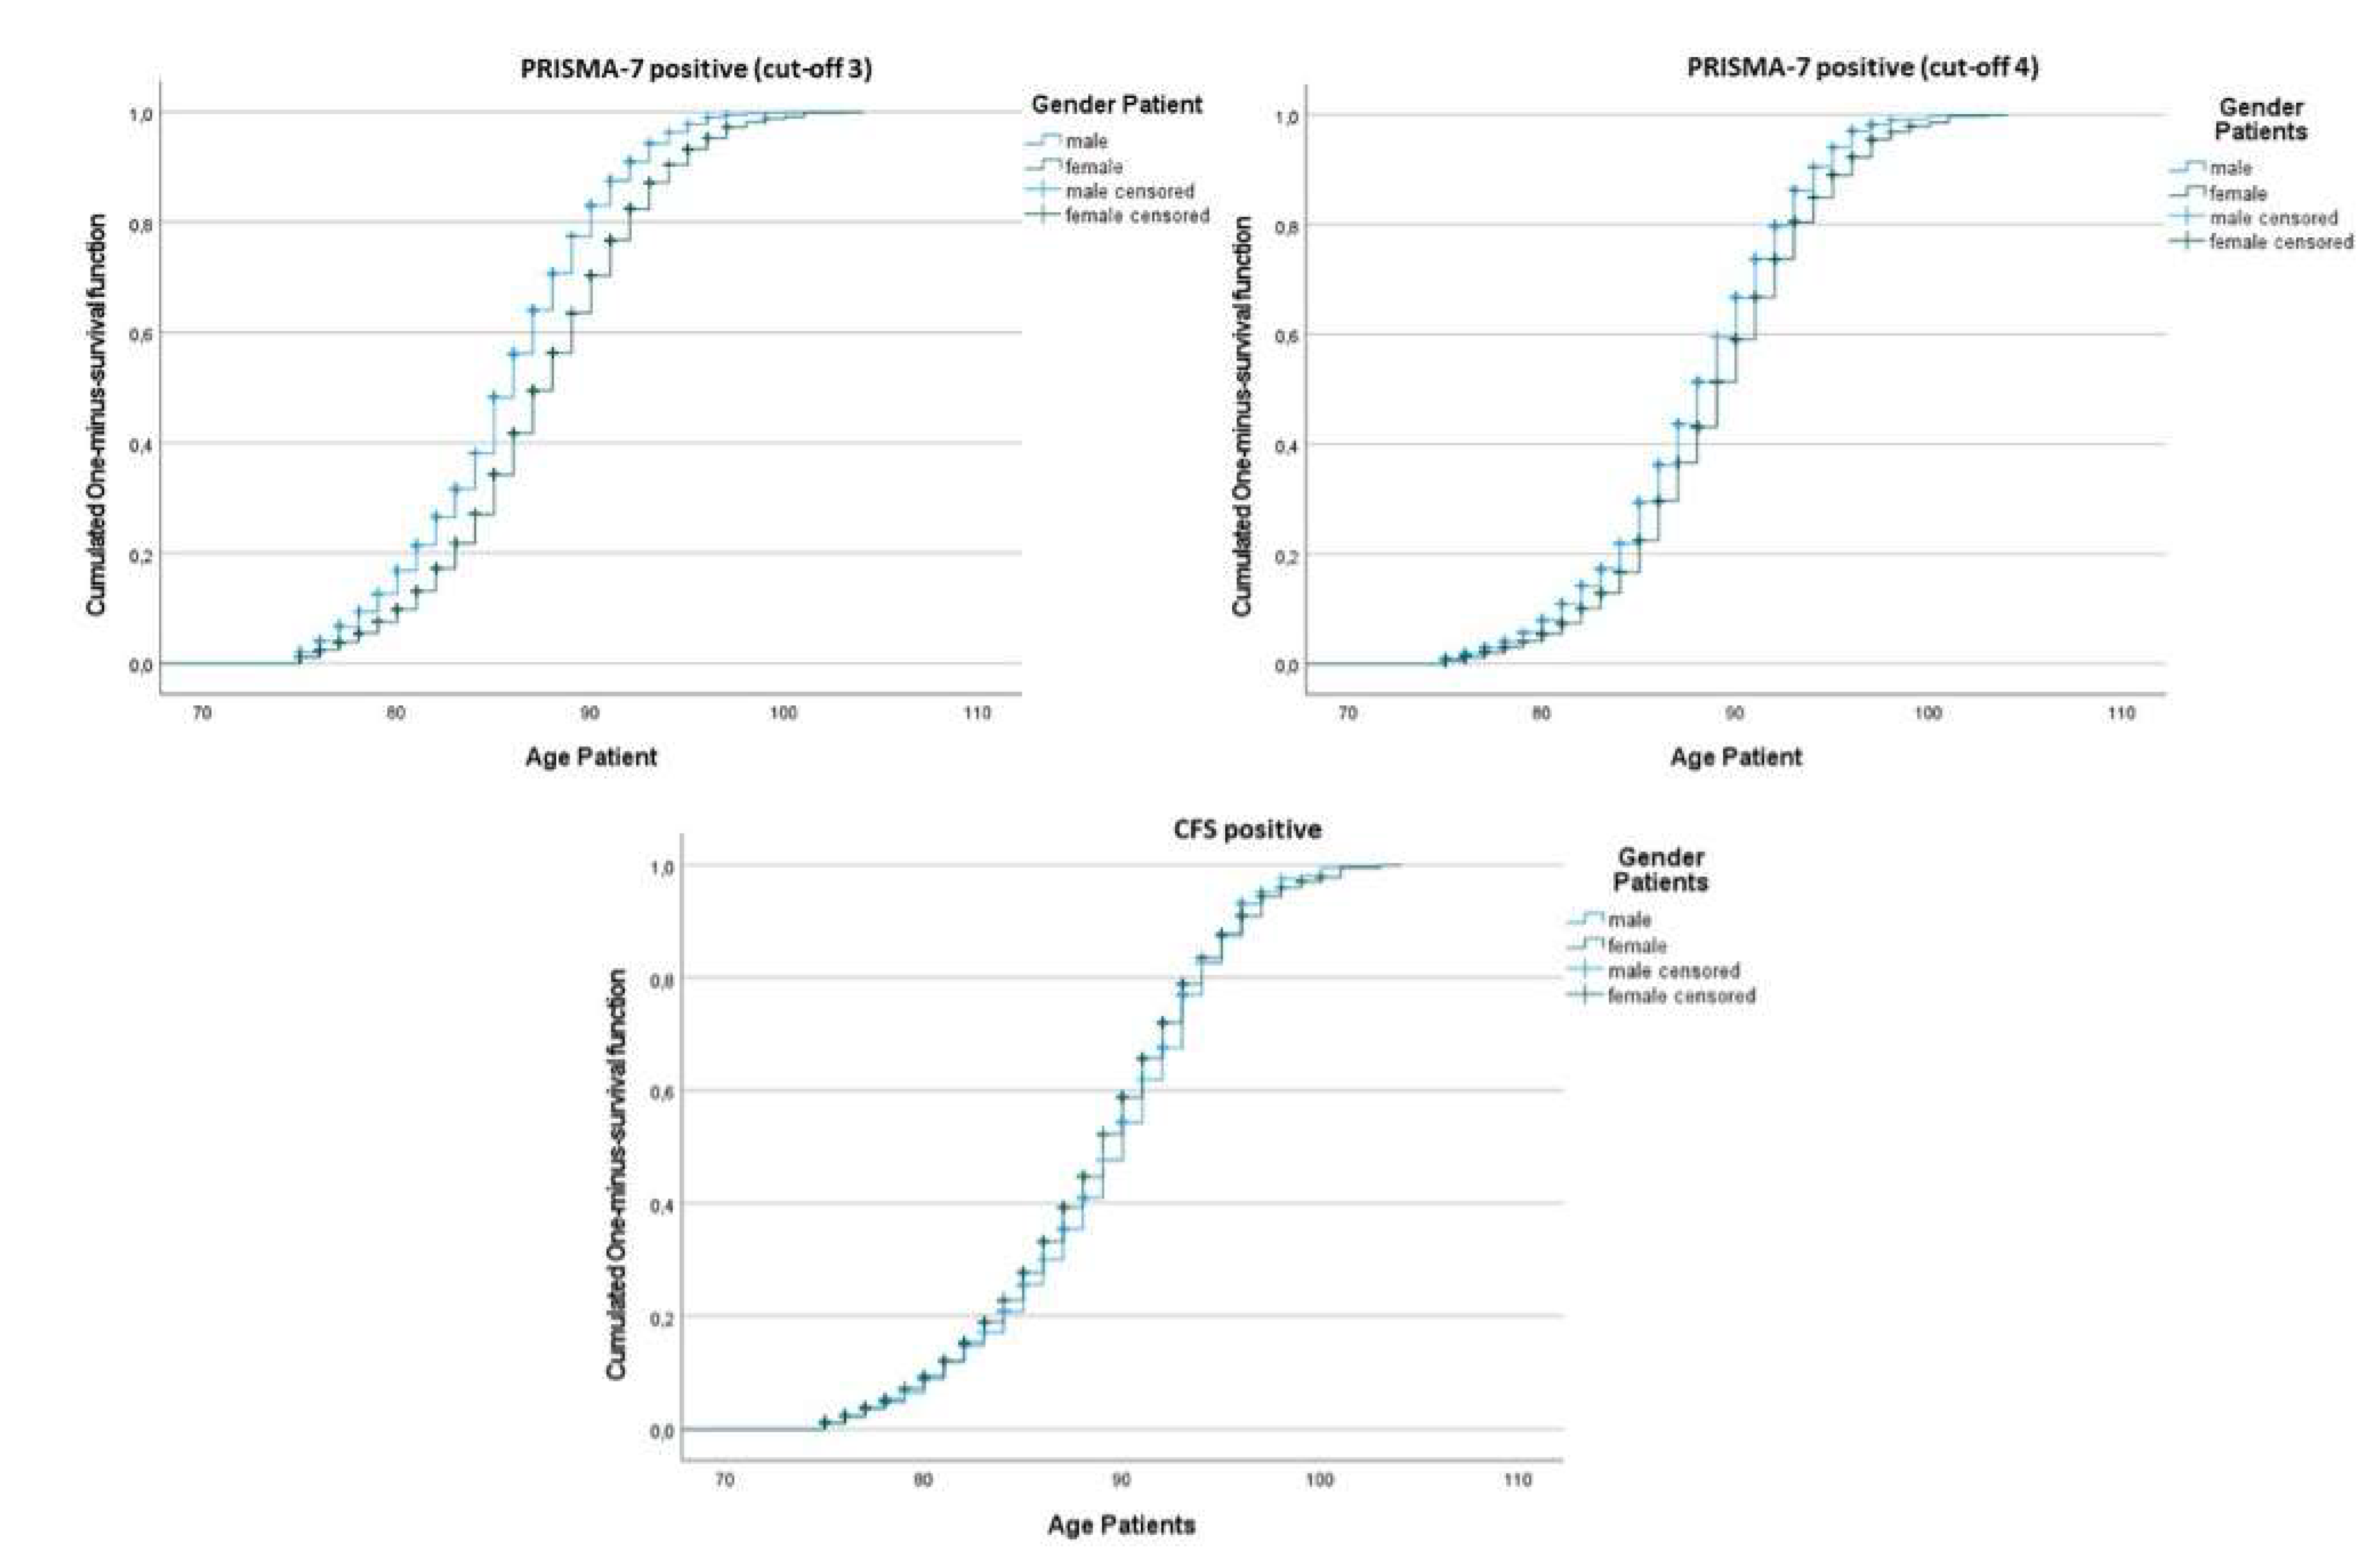

Table 1.
Characteristics of participating general practitioners and screened older adult patients.
| Variables | n (%) | Median (IQR) |
|---|---|---|
| GPs, n = 142 | ||
| Age, years | – | 47 (39–58) |
| Female sex | 72 (50.7) | – |
| Location of GP office | ||
| Urban area | 75 (52.8) | – |
| Rural area | 67 (47.2) | – |
| Patients, n = 19,501 | ||
| Age, years | – | 81 (78–85) |
| Female sex | 11,203 (60.0) | – |
| Number of screened patients (PRISMA-7) | 18,658 | 122 (3–173)11 |
1 Value per GP.
Table 2.
Frailty prevalence and score distributions according to the PRISMA-7 and Clinical Frailty Scale (CFS).
Table 2.
Frailty prevalence and score distributions according to the PRISMA-7 and Clinical Frailty Scale (CFS).
| Instrument | Measure | Value |
|---|---|---|
| PRISMA-7 (cut-off ≥3) | Frail patients, n (%) | 8,582 (46.0) |
| Median score – frail | 4.0 (3.0–5.0) | |
| Median score – non-frail | 1.0 (1.0–2.0) | |
| PRISMA-7 (cut-off ≥4) | Frail patients | 5,372 (28.8) |
| Median score – frail | 5.0 (4.0–6.0) | |
| Median score – non-frail | 2.0 (1.0–2.0) | |
| CFS | Screened patients | 7,970 |
| Frail (score ≥5) | 3,852 (48.3) | |
| Mild (score 5) | 1,526 (19.1) | |
| Moderate (score 6) | 1,326 (16.6) | |
| Severe+ (7–9) | 1,000 (12.5) | |
| Median score – frail | 6.0 (5.0–7.0) | |
| Median score – non-frail | 3.0 (3.0–4.0) |
Table 3.
Distribution of frailty classification according to PRISMA-7 and CFS at the two cut-off levels.
Table 3.
Distribution of frailty classification according to PRISMA-7 and CFS at the two cut-off levels.
| Combined Frailty Status | PRISMA-7 Cut-off ≥3n (%) | PRISMA-7 Cut-off ≥4n (%) |
|---|---|---|
| Not frail (PRISMA-7 negative) | 10,034 (55.7) | 12,910 (71.4) |
| Frail by PRISMA-7, not frail by CFS | 4,118 (22.9) | 1,640 (9.1) |
| Frail by both PRISMA-7 and CFS | 3,852 (21.4) | 3,518 (19.5) |
Table 4.
Predictors of frailty according to PRISMA-7 (cut-offs 3 and 4) and the Clinical Frailty Scale (CFS).
Table 4.
Predictors of frailty according to PRISMA-7 (cut-offs 3 and 4) and the Clinical Frailty Scale (CFS).
| Predictor | PRISMA-7 ≥3 | PRISMA-7 ≥4 | CFS ≥5 |
|---|---|---|---|
| n | 18,003 | 17,669 | 7,969 |
| Nagelkerke R² | 0.327 | 0.315 | 0.109 |
| Age (per year) | 1.27 (1.26–1.28)*** | 1.27 (1.26–1.28)*** | 1.09 (1.08–1.10)*** |
| Female sex | 0.54 (0.51–0.58)*** | 0.82 (0.76–0.88)*** | 1.88 (1.72–2.07)*** |
| Rural GP office | 1.19 (1.11–1.28)*** | n.s. | 0.83 (0.76–0.91)*** |
| Constant | −19.79 | −20.45 | −7.80 |
*** p < 0.001. Abbreviations: CFS, Clinical Frailty Scale; GP, General Practitioner.
Table 5.
Activation of Integrated Domiciliary Care (IDC) among Patients with PRISMA-7 ≥3 and CFS ≥5 (n = 3,701).
Table 5.
Activation of Integrated Domiciliary Care (IDC) among Patients with PRISMA-7 ≥3 and CFS ≥5 (n = 3,701).
 |
Disclaimer/Publisher’s Note: The statements, opinions and data contained in all publications are solely those of the individual author(s) and contributor(s) and not of MDPI and/or the editor(s). MDPI and/or the editor(s) disclaim responsibility for any injury to people or property resulting from any ideas, methods, instructions or products referred to in the content. |
© 2025 by the authors. Licensee MDPI, Basel, Switzerland. This article is an open access article distributed under the terms and conditions of the Creative Commons Attribution (CC BY) license (http://creativecommons.org/licenses/by/4.0/).
Copyright: This open access article is published under a Creative Commons CC BY 4.0 license, which permit the free download, distribution, and reuse, provided that the author and preprint are cited in any reuse.


