
Submitted:
28 March 2024
Posted:
28 March 2024
You are already at the latest version
Abstract
The importance of frailty in older people is getting constant recognition as an important aspect both in terms of public health, as well in personal level for the appropriate management of an older person health condition. This is reflected by the continuously increasing number of research studies carried out in several settings across different countries. Sometimes this is very solid, but in other cases there is a considerable gap in terms of accurate and well grounded documentation of frailty status. This is the case in Greece, where we are missing clinically validated tools to approach frailty. We are missing frailty screening tools, such as for instance PRISMA 7, the gold standard tool of Fried criteria is somehow problematic since the question referring to physical activity originates from a questionnaire that has not been translated and validated, while Clinical Frailty Scale has been validated for the translation but not for the capacity to detect frailty. Aim of this study is to validate these tools for their accuracy to detect frailty by using a measurable index of frailty, previously proposed for use in clinical studies: the Short Physical Performance Battery (SPPB). 74 male and female participants have been evaluated for their frailty status using different tools. We observed that PRISMA 7 translation detects frailty only when one question is removed at a cut-off of ≥ 2 and indicated a sensitivity of 88.1%, and specificity of 99.9% with a good correlation with SPPB measurements (r = 0.858; p < 0.001). When CFS was validated using SPPB it demonstrated a very good correlation (r = -0.838; p < 0.001 respectively) as it was the case for the modified Fried Criteria (r = -0.725; p < 0.001). All items demonstrated a good correlation between them. We can here propose that we can accurately assess frailty status in the community setting by using a modified version of Fried criteria, Clinical Frailty Scale translation in Greek and we can screen for frailty by using the Greek translation of PRISMA 7 only after removing the item 6 of the questionnaire.
Keywords:
Frailty
; Greek Translation of PRISMA-7
; Modified Fried criteria
; Greek version of Clinical Frailty Scale
1. Introduction
Population aging is rapidly increasing worldwide, while healthcare systems seem inadequate to deal with its multiple consequences. The number of people aged over 65 years old is estimated to reach 2 billion by 2050 [1]. Frailty remains a major challenge, closely associated with advanced age, affecting almost one out of five individuals over 65 years old [2], significantly increasing the risk of falls, disability and long-term care, and leading to high morbidity and mortality rates [1]. Its estimated prevalence varies greatly from 4 to 59.1% due to the variety of definitions and criteria used among the different studies [3]. However, frailty rates appear considerably higher in hospitalized geriatric patients and especially in elderly living in long-term care units [4].
Although the term “frailty” is not new in the field of geriatric medicine, its use is mainly based on clinical experience and healthcare providers have been unable to accurately define it until recently [5]. According to the World Health Organization, frailty describes an age-related, gradual decline in physiological systems’ function, indicating increased vulnerability to stressors and various adverse health outcomes, as a result of decreased reserves of an individual’s intrinsic capacity. It is a distinct clinical entity, often coexisting but differing from disability or comorbidities [1,6], and it can be prevented, reversed or partially controlled with the appropriate interventions [7]. As a result, frailty’s assessment should definitely be an integral part of elderly’s primary care and healthcare providers ought to be adequately qualified on its diagnosis and treatment [8].
Two major approaches regarding frailty have been developed: Frailty Phenotype (FP) and Frailty Index (FI) [5]. These two models seem to overlap, although FI may have a greater ability to predict frailty’s adverse health outcomes [9]. FP describes frailty as a clinical syndrome and its diagnosis is based on the presence of at least three of the following five phenotypical criteria: unintended weight loss, muscle weakness, fatigue, slowness and low physical activity. Individuals with the presence of only 1 or 2 criteria are considered to be in a prefrail stage, which almost doubles the possibility for the clinical manifestation of frailty in the following 3-4 years [6]. Although FP is concrete and reliable, it doesn’t take into consideration important parameters, such as the presence of cognitive decline. Also, FP serves mainly as a categorical and not a quantitative variable [1]. According to FI, frailty is a state of an age-related progressive deficit accumulation due to a decrease in multiple systems physiological reserve [10,11]. FI is a ratio which can be estimated by comparing the values of at least 30 different variables (symptoms and signs, comorbidities, laboratory tests and functional indicators) that may be present in an individual, with the mean values of these variables present in healthy individuals of the same age [10]. A value of 20% is crucial for frailty, whereas a value greater than 67% indicates an increased risk of collapse [1].
Frailty’s pathophysiology is not fully understood. The precise point to which age-related decline in multiple systems and deficits accumulation overcome an organism’s repairing ability and depleted homoeostatic reserves, is not yet determined [1]. Frailty is a disorder of various inter-related physiological systems, including immune, musculoskeletal, endocrine, cardiovascular, hematopoietic and neural [5]. The process of aging in combination with lifestyle choices, genetic, epigenetic and environmental risk factors, activate chronic inflammation pathways which negatively affect multiple system function, contributing to the development of a frail phenotype [1]. According to different studies, obesity or cachexia [5,12], lack of exercise [4], the presence of chronic diseases [6,8], polypharmacy [13], neoplasms [5], stress or depression [9,12], as well as certain demographic characteristics such as advanced age [6,12,14], female gender [3,5,6,14] and African American origin [6] have been associated with an increased risk of frailty. Frailty has also a strong financial and social dimension since low income at a certain life period has been demonstrated to predict the appearance of frailty later in life [15]. On the other hand, raised income, moderate alcohol consumption, elevated health status and high educational level possibly serve as protective factors against frailty or may simply indicate robust individuals [3,12].
Frailty’s major clinical significance includes risk assessment and prognosis estimation for community-dwelling or hospitalized older adults, leading to evidence-based decision making [5,8]. It is highly suggested that all patients over 70 years old should be evaluated for the presence of frailty in primary care [2]. Numerous frailty assessment tools have been developed, although their clinical use is not recommended unless they meet certain criteria: no need of any special equipment, possibility to be completed in less than 10 minutes, validation and appropriate design for the detection of frailty. The approved diagnostic tools for the initial detection of frailty are the following: Clinical Frailty Scale (CFS), Edmonton Frail Scale (EFS), FRAIL Index, INTER-FRAIL Questionnaire, PRISMA-7 tool, Sherbrooke Postal Questionnaire, Short Physical Performance Battery (SPPB) and Study of Osteoporotic (SOF) Index [2]. After their clinical application, an individual may be considered robust and so just be encouraged to follow preventive measures and adopt a healthy lifestyle, or the presence of frailty may be detected. In that case, the use of frailty phenotype or frailty index in addition with a complete geriatric assessment could lead to the definitive diagnosis of frailty requiring multicomponent interventions [2]. The 9-point Clinical Frailty Scale (CFS) remains one of the most widely used tools for the assessment of frailty in clinical practice as it appears simple, rapid and reliable [16]. It is a visual scale that summarizes the overall level of robustness or frailty of older adults, ranging from 1 (very fit) to 9 (terminally ill), taking into consideration their comorbidity, mobility and functional level [11,17]. It is a judgement-based scale, largely depending on clinicians’ experience [18], with a great prognostic value though and with the ability to predict frailty’s possible adverse health outcomes, such as hospitalization or death. Its good diagnostic accuracy can significantly aid frailty’s early identification thus contributing to a better quality of life [11,17]. Also FRIED criteria, based on frailty phenotype, have been widely used in clinical practice and remain a reference standard in research. However, further studies are required to assess their clinical application that may be limited by the fact that a level of fitness is required to perform the hand grip tests and the walking distance. [19]. In addition, the PRISMA-7 (Program of Research to Integrate the Services for the Maintenance of Autonomy- 7) yes/no questionnaire was developed in Canada in 2007 and includes 7 questions regarding older adults’ age, health status, activities and social support, receiving a score of one or zero. A score ≥ 3 is used as a threshold for frailty. It is a brief and easily applicable tool and its use is recommended in international guidelines [20].
Despite its clinical and predictive value, frailty has not been adequately investigated in Greece. The aim of this study is to assess the validity of several frailty tools, and more specifically to translate and validate the PRISMA – 7 tool in Greek, to validate the already translated Clinical Frailty Scale in a community dwelling population and to unlock the use of FRIED criteria by producing a modified version of them. Thus, we offer a variety of frailty screening and assessment tools that are easily applicable in everyday clinical practice as well as in research activities.
2. Materials and Methods
2.1. Design and Setting
The study was cross-sectional and observational. Participants were evaluated at the Outpatient Geriatric Assessment Unit of Henry Dunant Hospital Center in Athens from 22/02/2023 to 31/05/2023. We targeted to recruit male and female participants ≥65 years old, especially aiming to include as many participants as possible aging over 85 years old. People included were community dwellers either visiting outpatient Internal or Geriatric medicine consultation center at Henry Dunant Hospital, or volunteers following suggestion from people that had already participated in the study. People with diagnosis of dementia that could not communicate and complete the assessment were excluded. Seventy-four older people participated in the present study. The sample size was determined during the study design following three criteria; i) 51 more cases than the number of variables [21] ii) at least 10 cases for each item and subjects-to-variables [STV] ratio no lower than 5 [22], iii) at least 100 cases and a STV ratio of no less than 5 [23].
2.2. Translation
After obtaining official approval by the holders of the copyright of the PRISMA-7 tool, we translated it using the standard steps of establishing an expert committee, proceeding to forward translation by two independent translators, deciding a common text and then moving to the backward translation by two independent translators [24]. Instructions accompanying the tool were also translated but only by two separate translators that had concluded to the final text. The translation was then compiled into a final text and compared with the original text. A test re-test reliability survey was carried out in 10 people not included in the core study with 10 days interval between the separate evaluations. Test re-test scores were the same at 10 days interval. The final form (Supplement 1) has been used for this study. Two experts in this field established face validity.
2.3. Statistical Analysis
Demographic data have been recorded for all participants. We evaluated frailty status of participants by using several approaches. The translated PRISMA- 7, the Greek translation of Clinical Frailty Scale [25] and the modified Fried criteria, while Short Physical Performance Battery was used as an objective tool for measuring frailty status. The study protocol has been approved by the institutional Ethics Committee (21/3/2023). All participants have signed written informed consent prior to inclusion. The study followed the intentions of the Declaration of Helsinki and the Standard Ethical Principles. Data were analyzed by IBM© SPSS© version 25 (IBM Statistical Package for Social Sciences for Windows, Version 25.0. Armonk, NY: IBM Corp). The statistical techniques used were descriptive analysis, internal consistency (Kuder-Richardson formula 20 and Cronbach’s alpha), convergent validity (Pearson and Spearman correlation coefficients), factor analysis (Principal Component Analysis with Varimax Rotation Method) and Receiver Operating Characteristic (ROC) analysis. Establishing state variables “Frail” and “Not Frail” from SPPB questionnaire, ROC curves were generated and area under the ROC curve (AUC) was used for study outcomes. An index test AUC of at least 0.8 is considered to indicate good discriminative ability [26]. Cohen's kappa (κ) was conducted in order to check agreement between two categories (frail, non-frail) between FRIED and SPPB questionnaires. The level of significance was set at 0.05.
3. Results
Seventy-four participants were included in this study. Their sociodemographic characteristics are shown in Table 1. The majority of the participants were female (n=44, 59.5%) while 30 (40.5%) were men. Patients’ mean age was 80.47 years (SD=7.45 years, minimum - maximum age=65-95). The age group with highest frequency was the age category of 76-80 years (n=21, 28.4%). The sample was gender-age matched (p-value=0.298). Moreover, the majority of the participants were married (n=49, 66.2%), graduated from junior/high school (n=31, 41.9%). Almost half of the participants were non-smokers (n=36, 48.6%), ex-smokers (n=26, 35.1%) and the rest of them current smokers (n=12, 16.2%). Approximately 1 out of 10 patients had orthostatic hypotension (n=11, 14.9%).
Construct validity was conducted using factor analysis with principal component extraction method as presented in Table 2. Kaiser-Meyer-Olkin Measure (KMO) of Sampling Adequacy was found as 0.750 and Bartlett's Test of Sphericity as 158.440 (p-value<0.001). All items had acceptable Measures of Samling Adequacy (MSA) over the value of 0.7 except item 6 (0.282). Because of the low MSA in item 6, which was lower than 0.5 [27], it was decided to be removed from the analysis. A new factor analysis was assessed with a higher KMO equal to 0.783. All items now had acceptable MSA. Two components were extracted after varimax rotation; both had eigen values over 1 (3.089 and 1.010 respectively for two components) and the explained variance was 51.48% and 16.83% respectively (cumulative explained variance for both components was found as 68.31%). Scree plot (Supplementary File), Kaiser criterion eigen values which were greater than to one [28] and minimum 50% explained variance resulted that the optimum number of factors are two as seen in Table 2.
Descriptive statistics of all variables extracted after scoring the tools of the present study are shown in Table 3. Kuder-Richardson formula 20 for the PRISMA scale was found as 0.778.
Using the SPPB questionnaire (1-9 score was categorized frail) as a reference (gold) standard, PRISMA 7 showed an excellent discrimination (AUC=0.915, 95% CI=0.848-0.981). A cut- off point of 2 or higher for PRISMA was applied, and indicated the sensitivity of 88.1%, and specificity of 99.9% as presented in Figure 1.
The convergent validity for the PRISMA Scale and the other administrated tools was adequate as seen in Table 4. More specifically, the greater correlated scale was between PRISMA 7 and SPPB scale as well as CFS (r = 0.858; p < 0.001 and r = -0.838; p < 0.001 respectively). In order to check the validity between SPPB and FRIED criteria, a high correlation was revealed (r = -0.725; p < 0.001). Also, Cohen's kappa (κ) was conducted between frail and non-frail categories in both tools. It was showed that there is statistically significant agreement between them (κ = 0.563, p < 0.001) and the respective percentages for frail and non-frail categories were 78.6% and 78.1%.
4. Discussion
After translating the PRISMA-7 tool according to ordinary procedures elsewhere described [24], we concluded to the final document of PRISMA-7 questionnaire that was going to be validated. PRISMA-7 is a very useful screening tool at primary care level that was developed in Canada [29]. We found that the full version of the translated tool does not adequately and accurately describe people that may be classified as frail when assessed by SPPB score lower than 10, which is used as a gold standard tool to characterize baseline physical frailty [30]. Only after removing question 6 that refers to the possibility of having a person that may provide help in case of need (“If you need help, can you count on someone close to you?”) we obtained a good correlation between the estimation of frailty status by PRISMA 7 with a cut-off point of >2 with the measurement of physical frailty (KMO equal to 0.783). This may be due to cultural particularities in Greece, that may exist in other countries as well. People from Greece are more likely to report increased support which can be explained by the strong family ties and the cultural values of the country [31].
The study of frailty is continuously increasing but in order to do it accurately we need validated tools in as many languages possible, adjusted to the real-life circumstances and conditions of its country. Fried criteria are the cornerstone of the available tools used to define frailty but in some cases are not applicable, since the original studies used to define some of the aspects that are assessed were not translated and validated in the respective countries. This poses burdens in the study of frailty since using a reference tool in which some dimensions may not be validated renders a study doubtful. This has already triggered researchers in the field to modify Fried criteria in order to make them usable in country level [32,33,34]. The fact that the Minnesota Leisure Time Activity questionnaire was used to estimate physical inactivity in the original Fried study [6], that is not translated or validated in Greek and that there are no other tools specifically designed to evaluate physical activity levels of older adults in order to classify them as active or inactive accordingly, renders it important to assess physical inactivity by using a cut-off value and then evaluate its accuracy.
The Modified Fried criteria that we used concerned Physical Activity, for which we set less than 10 minutes continuous walk per day as a cut-off for physical inactivity. The International Physical Activity Questionnaire (IPAQ) is designed for people up to 69 years old (IPAQ) and they are using 10 minutes as the minimum time to count physical activities [35]. This modification seems to accurately and adequately describe the community-based population of the study in terms of recognition of frailty status as this was estimated with an objective measurement: SPPB score. We understand that PA is a multi-dimensional construct and thus, there is no measure that can assess all facets of PA [36], but sometimes we need to be practical. Since our modification works for the community, we propose to use our Modified Fried Criteria as a reference tool to evaluate frailty when performing studies in Greece. It is true that this arbitrary approach may underestimate other physical activities, such as gardening, but this may be quenched considering that the population studied lives in an urban setting where access to a garden is almost impossible.
Clinical Frailty Scale translation in Greek has been validated by using the Barthel Index as comparator, an index that measures the extent to which somebody can function independently and has mobility in their activities of daily living (ADL) while it also indicates the need for assistance in care [37]. We cannot easily claim that Barthel Index describes frailty status. It may describe a part of the frailty status, but it is also true that it may be less reliable in patients with cognitive impairment while it is affected by the degree of disability in the population examined [38]. We decided to evaluate the validity of the CFS translation in Greek by directly comparing it to a tool proposed as a measurement of frailty in clinical studies [30], the Short Physical Performance Battery and then with other tools linked with frailty evaluation and screening. It seems that it works well with our community dwelling population so one can use it to classify frailty status of a similar population as well.
To our knowledge this is the first study in Greece trying to validate a translated version of the PRISMA 7 frailty screening tool with frailty status assessed by using the SPPB tool. At the same time, we validated the capacity of the Greek translation of CFS scale to detect frailty status in the community and we modified Fried criteria to make them usable according to country specificities and burdens that render them usable. We compared different frailty tools (screening, measuring, evaluation, classification) and we observed a significant statistical correlation among them.
One major disadvantage of the study is the relatively small size of the sample. It happens in some studies when a tool is used to test a slightly different outcome, that an item or few items perform in a poorer than expected way. Our approach to take an existing tool and remove one item poses certain limitations. Since we lose comparison capacity and we develop in a way, a kind of new tool we need a greater sample. So, we are facing the challenge of either modifying the existing PRISMA – 7 tool by removing one item and lose certain dimensions of the tool (comparability with other countries, creating a new tool that needs to be evaluated in larger studies) – and this is what we suggest – or exclude the use of this tool in Greece.
Existence of practical and validated frailty screening tools is a cornerstone for the detection of frailty even after a short term training of health care professionals as it has been shown in a feasibility and impact study in Greece where following a short term training resulted in increased awareness of healthcare professionals in the use of screening tools in their everyday practice [39]
5. Conclusions
We demonstrate here an excellent matching between several frailty tools (Greek versions of PRISMA-7 and CFS and Modified Fried criteria) and measurements of frailty which were assessed using Short Physical Performance Battery scores. We were obliged to exclude one item from the PRISMA-7 questionnaire, due to cultural reasons. The different tools demonstrated excellent correlation among them, a fact that renders them usable and valid for the assessment, characterization and investigation of frailty status in Greece. We propose the use of the Greek version of PRISMA 7 without the item 6 that refers to the possibility of having a person that may provide help in case of need due to cultural particularities. A modified version of FRIED criteria proposed here for reasons of practicality seems an accurate adaptation that can describe frailty status in the community dwelling population. Clinical Frailty Scale that has been previously translated and validated for its usability is also an efficient and credible tool for frailty assessment in the same population.
Supplementary Materials
The following supporting information can be downloaded at the website of this paper posted on Preprints.org. Supplementary file: Prisma 7 Translation in Greek.
Author Contributions
Conceptualization, George Soulis; Data curation, Efstathia Kyriakopoulou; Formal analysis, George Soulis, Efstathia Kyriakopoulou and Vasiliki Efthymiou; Investigation, George Soulis, Efstathia Kyriakopoulou and Eleni Zigkiri; Methodology, George Soulis and Efstathia Kyriakopoulou; Project administration, George Soulis; Resources, Zikos Kentros and Anastasia Koutsouri; Software, Vasiliki Efthymiou; Validation, Eleni Zigkiri; Visualization, Vasiliki Efthymiou; Writing – original draft, George Soulis and Aristea Leventouri; Writing – review & editing, George Soulis, Efstathia Kyriakopoulou, Aristea Leventouri, Eleni Zigkiri, Zikos Kentros and Anastasia Koutsouri.
Funding
This research received no external funding.
Institutional Review Board Statement
The study was conducted in accordance with the Declaration of Helsinki and followed Standard Ethical Principles. The study protocol has been approved by the Ethics committee of Henry Dunant Hospital Center (approval date: 21/3/2023).
Informed Consent Statement
Informed consent was obtained from all subjects involved in the study. Written informed consent has been obtained from the patients to publish this paper.
Acknowledgments
We would like to thank for their contribution in the translation process of PRISMA 7 in Greek Angeliki Kyriakakou, Eleni Gymnopoulou and Elias Kyriakopoulos.
Conflicts of Interest
G.S Has received funding by Reckitt Benkiser for Advisory Board Participation, Z.K has received honoraria by IPSEN and Abbvie. The funders had no role in the design of the study; in the collection, analyses, or interpretation of data; in the writing of the manuscript; or in the decision to publish the results.
References
- Clegg, A.; Young, J.; Iliffe, S.; Rikkert, M.O.; Rockwood, K. Frailty in Elderly People. The Lancet 2013, 381, 752–762. [Google Scholar] [CrossRef] [PubMed]
- Rodríguez Mañas, L.; García-Sánchez, I.; Hendry, A.; Bernabei, R.; Roller-Wirnsberger, R.; Gabrovec, B.; Liew, A.; Carriazo, A.M.; Redon, J.; Galluzzo, L.; Viña, J.; Antoniadou, E.; Targowski, T.; di Furia, L.; Lattanzio, F.; Bozdog, E.; Telo, M. Key Messages for a Frailty Prevention and Management Policy in Europe from the Advantage Joint Action Consortium. The journal of nutrition, health & aging 2018, 22, 892–897. [Google Scholar] [CrossRef]
- Santos-Eggimann, B.; Cuenoud, P.; Spagnoli, J.; Junod, J. Prevalence of Frailty in Middle-Aged and Older Community-Dwelling Europeans Living in 10 Countries. The Journals of Gerontology Series A: Biological Sciences and Medical Sciences 2009, 64A, 675–681. [Google Scholar] [CrossRef] [PubMed]
- Gabrovec, B.; Antoniadou, E. European Guide for Management of Frailty at Individual Level Including Recommendations and Roadmap. ADVANTAGE project, 2019; ISBN 978-961-7002-88-1. [Google Scholar]
- Leng, S.; Chen, X.; Mao, G. Frailty Syndrome: An Overview. Clinical Interventions in Aging 2014, 9, 433–441. [Google Scholar] [CrossRef] [PubMed]
- Fried, L.P.; Tangen, C.M.; Walston, J.; Newman, A.B.; Hirsch, C.; Gottdiener, J.; Seeman, T.; Tracy, R.; Kop, W.J.; Burke, G.; McBurnie, M.A. Frailty in Older Adults: Evidence for a Phenotype. The journals of gerontology. Series A, Biological sciences and medical sciences 2001, 56, M146–M156. [Google Scholar] [CrossRef] [PubMed]
- Dupoux, F. World Report on Ageing and HeAltH; 2015. Available online: http://apps.who.int/iris/bitstream/10665/186463/1/9789240694811_eng.pdf?ua=1.
- Morley, J.E.; Vellas, B.; Abellan van Kan, G.; Anker, S.D.; Bauer, J.M.; Bernabei, R.; Cesari, M.; Chumlea, W.C.; Doehner, W.; Evans, J.; Fried, L.P.; Guralnik, J.M.; Katz, P.R.; Malmstrom, T.K.; McCarter, R.J.; Gutierrez Robledo, L.M.; Rockwood, K.; von Haehling, S.; Vandewoude, M.F.; Walston, J. Frailty Consensus: A Call to Action. Journal of the American Medical Directors Association 2013, 14, 392–397. [Google Scholar] [CrossRef] [PubMed]
- Kojima, G.; Iliffe, S.; Walters, K. Frailty Index as a Predictor of Mortality: A Systematic Review and Meta-Analysis. Age and Ageing 2017, 47, 193–200. [Google Scholar] [CrossRef] [PubMed]
- Mitnitski, A.B.; Graham, J.E.; Mogilner, A.J.; Rockwood, K. ; Frailty, Fitness and Late-Life Mortality in Relation to Chronological and Biological Age. BMC Geriatrics 2002, 2. [Google Scholar] [CrossRef]
- Rockwood, K. A Global Clinical Measure of Fitness and Frailty in Elderly People. Canadian Medical Association Journal 2005, 173, 489–495. [Google Scholar] [CrossRef]
- Fugate Woods, N.; LaCroix, A.Z.; Gray, S.L.; Aragaki, A.; Cochrane, B.B.; Brunner, R.L.; Masaki, K.; Murray, A.; Newman, A.B. Frailty: Emergence and Consequences in Women Aged 65 and Older in the Women’s Health Initiative Observational Study. Journal of the American Geriatrics Society 2005, 53, 1321–1330. [Google Scholar] [CrossRef]
- Gutiérrez-Valencia, M.; Izquierdo, M.; Cesari, M.; Casas-Herrero, Á.; Inzitari, M.; Martínez-Velilla, N. The Relationship between Frailty and Polypharmacy in Older People: A Systematic Review. British Journal of Clinical Pharmacology 2018, 84, 1432–1444. [Google Scholar] [CrossRef] [PubMed]
- Song, X.; Mitnitski, A.; Rockwood, K. Prevalence and 10-Year Outcomes of Frailty in Older Adults in Relation to Deficit Accumulation. Journal of the American Geriatrics Society 2010, 58, 681–687. [Google Scholar] [CrossRef]
- Watts, P.N.; Blane, D.; Netuveli, G. Minimum Income for Healthy Living and Frailty in Adults over 65 Years Old in the English Longitudinal Study of Ageing: A Population-Based Cohort Study. BMJ Open 2019, 9, e025334. [Google Scholar] [CrossRef]
- Shrier, W.; Dewar, C.; Parrella, P.; Hunt, D.; Hodgson, L.E. Agreement and Predictive Value of the Rockwood Clinical Frailty Scale at Emergency Department Triage. Emergency Medicine Journal 2020, 38. [Google Scholar] [CrossRef]
- Church, S.; Rogers, E.; Rockwood, K.; Theou, O. A Scoping Review of the Clinical Frailty Scale. BMC Geriatrics 2020, 20. [Google Scholar] [CrossRef]
- Basic, D.; Shanley, C. Frailty in an Older Inpatient Population. Journal of Aging and Health 2014, 27, 670–685. [Google Scholar] [CrossRef] [PubMed]
- Szewieczek, J.; Bieniek, J.; Wilczyński, K. Fried Frailty Phenotype Assessment Components as Applied to Geriatric Inpatients. Clinical Interventions in Aging 2016, 11, 453–459. [Google Scholar] [CrossRef] [PubMed]
- Higginbotham, O.; O’Neill, A.; Barry, L.; Leahy, A.; Robinson, K.; O’Connor, M.; Galvin, R. The Diagnostic and Predictive Accuracy of the PRISMA-7 Screening Tool for Frailty in Older Adults: A Systematic Review Protocol. HRB Open Research 2020, 3, 26. [Google Scholar] [CrossRef]
- Lawley, D.N.; Maxwell, A.E. Factor Analysis as a Statistical Method, 2nd ed.; Butterworths: London, 1971. [Google Scholar]
- Bryant, F.B.; Yarnold, P.R. Principal-components analysis and exploratory and confirmatory factor analysis. In Reading and understanding multivariate statistics; Grimm, L.G., Yarnold, P.R., Eds.; American Psychological Association, 1995; pp. 99–136. [Google Scholar]
- Suhr, D. Exploratory or Confirmatory Factor Analysis. In SAS Users Group International Conference, San Fransisco, March 2006, Cary: SAS Institute Inc, pp. 1–17.
- Tsang, S.; Royse, C.; Terkawi, A. Guidelines for Developing, Translating, and Validating a Questionnaire in Perioperative and Pain Medicine. Saudi Journal of Anaesthesia 2017, 11, 80. [Google Scholar] [CrossRef]
- Vrettos, I.; Voukelatou, P.; Panayiotou, S.; Kyvetos, A.; Kalliakmanis, A.; Makrilakis, K.; Sfikakis, P.P.; Niakas, D. Validation of the Revised 9-Scale Clinical Frailty Scale (CFS) in Greek Language. BMC Geriatrics 2021, 21. [Google Scholar] [CrossRef]
- Li, F.; He, H. Assessing the Accuracy of Diagnostic Tests. Shanghai Archives of Psychiatry 2018, 30, 207–212. [Google Scholar] [CrossRef] [PubMed]
- Hair, J.F. Multivariate Data Analysis; Prentice-Hall: Upper Saddle River, Nj, Englewood Cliffs, 1998. [Google Scholar]
- Costello, A.B.; Osborne, J.W. Best practices in exploratory factor analysis: four recommendations for getting the most from your analysis. Practical Assessment. Research & Evaluation 2005, 10, 1–9. [Google Scholar]
- Raîche, M.; Hébert, R.; Dubois, M.-F. PRISMA-7: A case-finding tool to identify older adults with moderate to severe disabilities. Archives of Gerontology and Geriatrics 2008, 47, 9–18. [Google Scholar]
- EMA. Available online: https://www.ema.europa.eu/en/documents/scientific-guideline/reflection-paper-physical-frailty-instruments-baseline-characterisation-older-populations-clinical-trials-first-version_en.pdf (accessed on 12 Marrch 2024).
- Melchiorre, M.G.; Chiatti, C.; Lamura, G.; Torres-Gonzales, F.; Stankunas, M.; Lindert, J.; Ioannidi-Kapolou, E.; Barros, H.; Macassa, G.; Soares, J.F.J. Social Support, Socio-Economic Status, Health and Abuse among Older People in Seven European Countries. PLoS ONE 2013, 8, e54856. [Google Scholar] [CrossRef] [PubMed]
- Bahat, G.; Ilhan, B.; Erdogan, T.; Catikkas, N.M.; Karan, M.A.; Drey, M.; Gasowski, J.; Kotsani, M.; Piotrowicz, K.; Morley, J. Simpler Modified Fried Frailty Scale as a Practical Tool to Evaluate Physical Frailty: Methodological Report for Its Cross-Cultural Adaptation and Validation. Experimental Gerontology 2022, 166, 111887. [Google Scholar] [CrossRef] [PubMed]
- Fairhall, N.; Aggar, C.; Kurrle, S.E.; Sherrington, C.; Lord, S.; Lockwood, K.; Monaghan, N.; Cameron, I.D. Frailty Intervention Trial (FIT). BMC Geriatrics 2008, 8. [Google Scholar] [CrossRef]
- Van der Elst, M.C.J.; Schoenmakers, B.; Op Het Veld, L.P.M.; De Roeck, E.E.; Van der Vorst, A.; Schols, J.M.G.A.; De Lepeleire, J.; Kempen, G.I.J.M. D-SCOPE Consortium. Validation of replacement questions for slowness and weakness to assess the Fried Phenotype: a cross-sectional study. Eur Geriatr Med. 2020, 11, 793–801. [Google Scholar] [CrossRef] [PubMed]
- IPAQ - . Available online: https://sites.google.com/view/ipaq/download?authuser=0. (accessed on 12 March 2024).
- Sylvia, L.G.; Bernstein, E.E.; Hubbard, J.L.; Keating, L.; Anderson, E.J. Practical guide to measuring physical activity. J Acad Nutr Diet. 2014, 114, 199–208. [Google Scholar] [CrossRef] [PubMed]
- Barthel Index (BI) – Strokengine. Available online: https://strokengine.ca/en/assessments/barthel-index-bi. (accessed on 12 March 2024).
- Sainsbury, A.; Seebass, G.; Bansal, A.; Young, J.B. Reliability of the Barthel Index when used with older people. Age Ageing. 2005, 34, 228–232. [Google Scholar] [CrossRef] [PubMed]
- Kotsani, M.; Avgerinou, C.; Haidich, A.B.; Smyrnakis, E.; Soulis, G.; Papageorgiou, D.I.; Andreou, M.; Zeimbekis, D.; Kokkali, S.; Gavana, M. Aristotle University of Thessaloniki Primary Health Care Research Network. Feasibility and impact of a short training course on frailty destined for primary health care professionals. Eur Geriatr Med. 2021, 12, 333–346. [Google Scholar] [CrossRef] [PubMed]
Figure 1.
PRISMA 7 Receiver Operating Characteristic (ROC) curve.
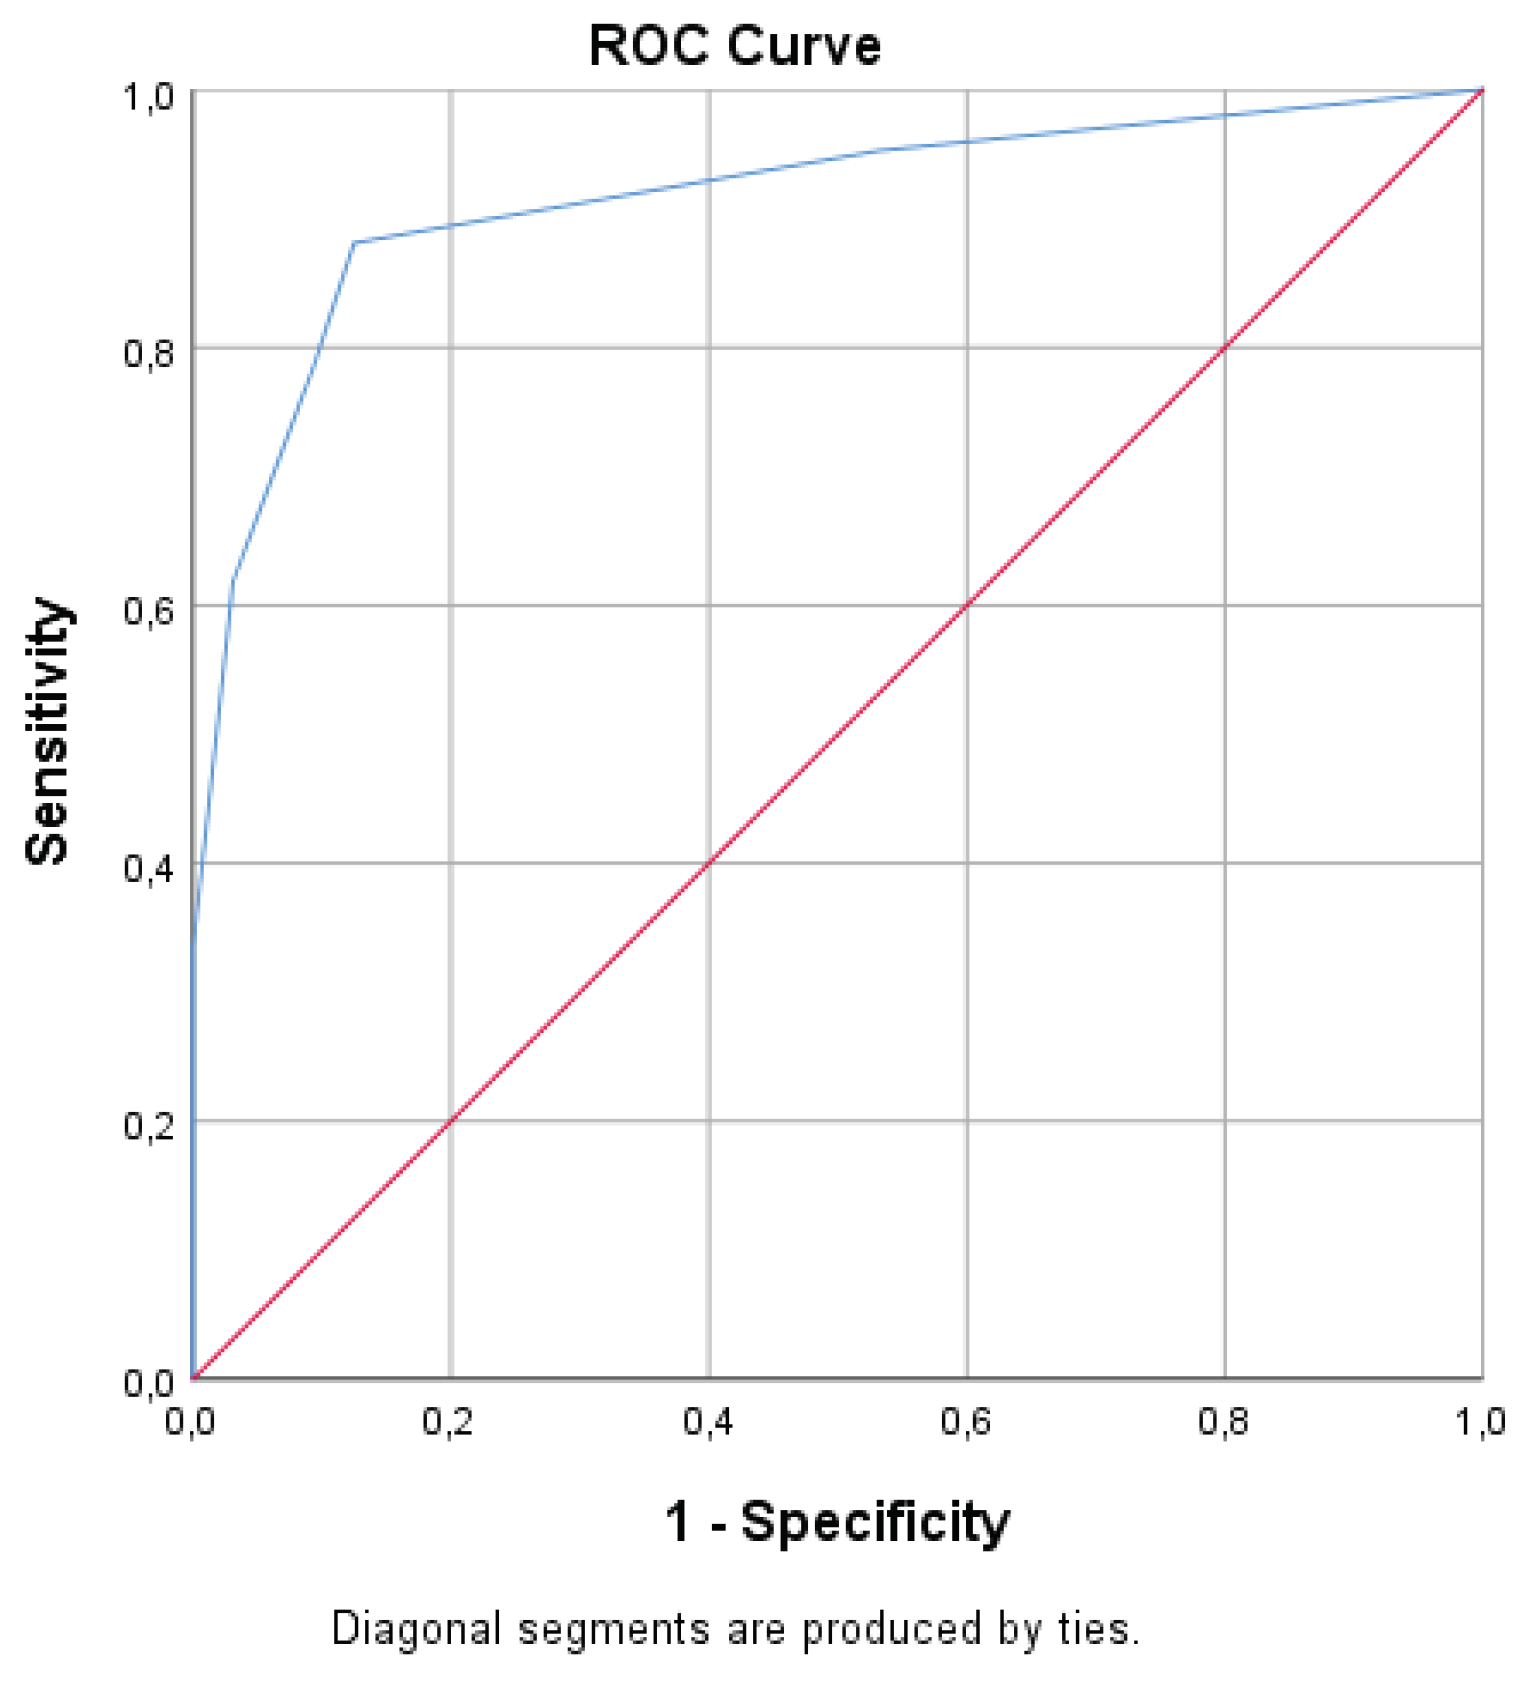

Table 1.
Sociodemographic characteristics of the participants (N=74).
| Characteristics | n (%) | |
| Sex | Male | 30 (40.5) |
| Female | 44 (59.5) | |
| Age (mean±SD; 80.47±7.45 years) | 65-70 | 8 (10.8) |
| 71-75 | 11 (14.9) | |
| 76-80 | 21 (28.4) | |
| 81-85 | 13 (17.6) | |
| 86-90 | 13 (17.6) | |
| >90 | 8 (10.8) | |
| Marital status | Single | 3 (4.1) |
| Married | 49 (66.2) | |
| Widowed | 20 (27.0) | |
| Divorced | 2 (2.7) | |
| Educational level | Primary school | 16 (21.6) |
| Junior/High school | 31 (41.9) | |
| Higher (Technical school) | 7 (9.5) | |
| Highest (University) | 16 (21.6) | |
| Post graduate/PhD | 4 (5.4) | |
| Smoking | Never | 36 (48.6) |
| Ex | 26 (35.1) | |
| Current | 12 (16.2) | |
| Orthostatic hypotension | Yes | 11 (14.9) |
| No | 63 (85.1) | |
Table 2.
Factor analysis of PRISMA-7 (N=74).
| Rotated Component Matrix | ||
| Component | ||
| 1 | 2 | |
| Prisma1 | 0.675 | |
| Prisma3 | 0.837 | |
| Prisma4 | 0.855 | |
| Prisma5 | 0.727 | |
| Prisma7 | 0.818 | |
| Prisma2 | 0.995 | |
Notes. Extraction Method: Principal Component Analysis. Rotation; Method: Varimax with Kaiser Normalization.
Table 3.
Frailty measures for the sample (N=74).
| Measures | Mean | SD | Min-Max |
|---|---|---|---|
| PRISMA 7 | 2.43 | 2.00 | 0 – 6 |
| CFS | 3.68 | 1.07 | 1 – 7 |
| FRIED | 1.11 | 1.28 | 0 – 5 |
| SPPB | 7.89 | 3.70 | 1 – 12 |
Notes. Values are referred to mean and standard deviation (SD).
Disclaimer/Publisher’s Note: The statements, opinions and data contained in all publications are solely those of the individual author(s) and contributor(s) and not of MDPI and/or the editor(s). MDPI and/or the editor(s) disclaim responsibility for any injury to people or property resulting from any ideas, methods, instructions or products referred to in the content. |
© 2024 by the authors. Licensee MDPI, Basel, Switzerland. This article is an open access article distributed under the terms and conditions of the Creative Commons Attribution (CC BY) license (http://creativecommons.org/licenses/by/4.0/).
Copyright: This open access article is published under a Creative Commons CC BY 4.0 license, which permit the free download, distribution, and reuse, provided that the author and preprint are cited in any reuse.


