Submitted:
23 April 2025
Posted:
27 April 2025
You are already at the latest version
Abstract
Axis definition is of primordial importance for embryogenesis. During regeneration of Hydra vulgaris from a random cell aggregate or a sufficiently small fragment of tissue, a hollow cell spheroid emerges that undergoes symmetry breaking and axis definition. In the past, we published related work in a physics journal, difficult to read for scientists from other disciplines. Here we review our work for readers with a low mathematical background. Our model is based on fluctuations of gene expression that are triggered by mechanical signaling, leading to increasingly large groups of cells acting in sync. With a single free parameter, the model quantitatively reproduces the experimentally observed expression pattern of the gene ks1, a marker for ‘head forming potential’. We observed that Hydra positions its axis as a function of a weak temperature gradient, but in a non-intuitive way. Supposing that a large fluctuation including ks1 expression is locked to define the head position, the model reproduces this behavior as well - without further changes. We explain why we believe that the proposed fluctuation-based symmetry breaking process agrees well with recent experimental findings where actin filament organization or anisotropic mechanical stimulation act as axis positioning events. The model suggests that the Hydra spheroid exhibits huge sensitivity to external perturbations that will eventually position the axis.
Keywords:
Hydra
; Cnidaria
; Hydrozoa
; Hydroida
; polyp
; ks1
; Wnt
; gene expression
; Olami-Feder-Christensen model
; power law
; symmetry breaking
; fractal
; regeneration
; spatial distribution
; promoting factor
; body axis
; axis formation
; temperature gradient
; hypostome
; scale-free
; molecular network
; avalanche-like dynamics
; embryogenesis
; nearest-neighbor interaction
; head organizer
; animal development
; organogenesis
; coordinated response
; spatial correlation
; criticality
; self-organized criticality
1. Introduction
Hydra (Figure 1a) is a simple freshwater organism known for its unique regenerative abilities. It is able to reorganize from a disordered cell aggregate into a fully formed structure. As Hydra regenerates, it first forms an isotropic, hollow cell spheroid that evolves through a symmetry-breaking event defining the future axis. Research has shown that Wnt signaling is responsible for maintaining Hydra’s body axis [1]. Disruptions in this pathway lead to abnormalities in axis formation [2].
ks1 is a Hydra specific gene known as a marker for the ‘head forming potential’ of a cell [3]. To understand the underlying principles of the observed patterns of ks1 expression on a Hydra cell spheroid, we proposed a mathematical model based on the production and exchange of a hypothetical ks1-expression promoting factor, “X”, which transfers between neighboring cells [4]. The transfer mechanism was taken from the Olami-Feder-Christensen (OFC) model [5], originally developed to simulate earthquakes. The excellent agreement between experiment and model, extending even to the behavior in a temperature gradient, suggests that local cellular interactions drive the observed self-organizing patterns of ks1 expression.
This paper reviews a few facts about Hydra biology before presenting our model, published in a specialized physics journal. Here we present it in a way that is accessible to readers with a low mathematical background. We also discuss the model in the light of recent findings exploring the influence of mechanical stimulation and the actin cytoskeleton on the position of the future axis.
2. Hydra: An Overview
Cnidarians, which include corals, sea anemones, sea pens, sea fans, jellyfish and hydroids, are among the simplest living metazoans [6,7,8,9,10,11,12,13]. The molecular evidence suggests that cnidarians appeared around 741 million years ago, before the Cambrian radiation, a period marked by the rapid emergence of most major animal phyla [14]. Most Cnidarians alternate between two forms: the sessile polyp stage and the free-swimming medusa stage. Their defining characteristic is the stinging cell, the nematocyte (also known as cnidocyte), which contains a unique toxin-producing organelle called nematocyst (also known as cnidocyst), used for predation, defense, and locomotion [12,15,16,17,18,19,20]. The phylum Cnidaria includes more than 9000 animal species, grouped into approximately 7 classes and 25 orders.
Hydra (see Figure 1), a member of phylum Cnidaria, class Hydrozoa, and order Hydroida, is a fresh-water polyp. It was first described in 1702 by Antonie van Leeuwenhoek and studied in more detail by Abraham Trembley [21]. At present, Hydra has become a major model organism studied, among others, for its regeneration property [22,23,24,25,26,27,28,29]. A comprehensive timeline of 300 years of Hydra research can be found in Galliot [30]. The genus Hydra consists of a few dozen species, recent studies suggesting their phylogenetic placement [31]. Hydra is estimated to have originated around 60 million years ago [32], and the most common diploid chromosome number is 30 [33]. The genome of Hydra magnipapillata was published (Chapman, et al. [22]), and the complete mitochondrial genomes of Hydra vulgaris and Hydra sinensis are known (Pan, et al. [34,35]). The Hydra genome contains approximately 20,000 protein-coding genes, excluding transposable elements [22,36], and includes orthologues of genes known to play key developmental roles in bilaterian developmental models [36].
An adult Hydra is usually a few milimeters long. It consists of approximately 100,000 cells. Its body wall, like that of other cnidarians, is composed of two germ layers: the ectoderm (outer cell layer) and endoderm (inner cell layer) separated by mesoglea, a non-cellular, jelly-like substance [37]. Each of these two layers is a single cell thick. Hydra has a mainly cylindrical shape with a head, a body column serving as gastric cavity, and a sticky foot for attachment. The head features a mouth opening, surrounded by typically three to six tentacles used for catching small aquatic invertebrates such as Daphnia and Cyclops, which Hydra feeds on. All Hydra body parts are aligned along a single oral-aboral axis [38].
Hydra can reproduce both, sexually or asexually [39]. Under normal conditions, Hydra reproduces asexually by budding, however, it tends to reproduce sexually if the environment becomes unfavorable [40]. Budding occurs about two thirds of the way down the body column. This is where the body wall evaginates to form a new column that will develop a head at the end. This column eventually detaches as a new, small Hydra [41].
In the adult, new cells constantly emerge within the center column of Hydra, becoming terminally differentiated only when they migrate to either end, where cells are lost. It has been suggested that Hydra escapes senescence and may be potentially immortal [42,43,44,45,46,47]. The genome of Ctenophora Mnemiopsis leidyi was sequenced [48], revealing that ctenophores are the earliest diverging animal lineage. This finding strongly supports a sister relationship between Cnidaria and Bilateria [48]. Consequently, the axial organization of Hydra provides important insights into the transition from radial to bilateral body plans and the evolution of the bilaterian body plan [44,45,46]. The Hydra foot, which pumps gastrovascular fluid, and the blood-pumping vertebrate heart were proposed to have a common ancestry [49], with the foot-to-head extension in Hydra corresponding to the anterior-posterior axis in higher organisms [50].
3. Hydra Regeneration
Due to its simple body plan and its remarkable regenerative ability, Hydra is a frequently considered model organism in developmental biology [7,51,52,53,54,55,56,57]. A small fragment of tissue excised from an adult Hydra is sufficient to regenerate an entire organism within a few days (Figure 1b). Hydra can even reform from a heap of disordered cells [58]. In both situations Hydra will first form a hollow cell ball. Only cells from the body column contribute to regeneration, highlighting their multipotent properties [58,59]. Since the body axis is lost in the disordered cell ball, approximately 10,000 multipotent cells must break the initial isotropy, define a single oral-aboral axis and organize as a function of it.
The study of regeneration is of significant biomedical interest, since it may ultimately lead to the development of therapies for replacing old and damaged tissues with new ones [60]. Regeneration - the regrowth or repair of cells, tissues or body parts - is widespread but highly variable among animal phyla [60,61,62,63,64,65,66,67]. Regeneration may well be a fundamental trait of metazoans, rather than mechanisms that evolved independently for that purpose in various contexts [68]. Similarities between regeneration and post-embryonic development suggest that regeneration may well have originated as a by-product, or epiphenomenon, of development [64,65]. In highly regenerative animals like Hydra and planarians, there is no evidence of frequent amputations occurring in the wild. This implies that their extraordinary regenerative capabilities may be maintained predominantly by mechanisms other than direct selection [64]. According to the phylogenetic inertia hypothesis, the ability to regenerate is an ancestral trait retained for historical reasons; it is not selectively advantageous but persists because it has not been eliminated from the species’ developmental repertoire [64].
4. Hydra Genes Related to Axis Definition
We present genes and pathways involved in defining and maintaining the oral-aboral axis. Among the critical genes involved in early axis definition are β-catenin [69,70,71] and Wnt [1,2,70]. Wnt genes play axis-related roles in many animal species, including sponges. However, unicellular organisms do not contain these genes, suggesting that Wnt signaling played a crucial role in the origin of multicellular animals [72,73,74,75,76,77,78,79,80]. The absence of Wnt signaling mechanism in thale cress (Arabidopsis thaliana), a model organism in plant biology, and in fungi [78] underscores its role specific to multicellular animals. The multicellular organization of plants indeed evolved independently of animals [81,82]. The Wnt gene family in Hydra is comparable in size to those in bilaterian animals [83], suggesting that the diversification of this gene family occurred before the cnidarian-bilaterian split [36].
Hydra expresses Wnt genes only in the organizer region. The organizer is part of the hypostome, located at the tip of the head (see Figure 1). The organizer is the first structure to be restored during regeneration [84]. It guides the fate of all other cells [85,86]. Vogg, et al. [87] demonstrated that a conserved Wnt 3/β-catenin/Sp5 feedback loop restricts head organizer activity in Hydra, highlighting the role of Wnt 3 in axis formation. Studies have shown that disruptions in Wnt signaling pathways can lead to abnormalities in axis formation, underscoring their importance in Hydra development [1,2,69].
The complexity of Wnt intracellular signaling pathways in Hydra is reflected by the diversity of Wnt receptors [84]. These receptors can be categorized into 15 receptors and coreceptors from seven protein families [76], the Fizzled family the most prominent one [88].
The canonical Wnt pathway is characterized by the preservation of β-catenin from degradation in the cytoplasm. β-catenin eventually translocates into the nucleus, where it coactivates the TCF/LEF transcription factor family [89]. The non-canonical pathways include the planar cell polarity (PCP) pathway and the Wnt/calcium pathway, where alterations in gene expression are not mediated via β-catenin [89]. All three pathways, the canonical one, PCP, as well as Wnt/calcium, have roles in Hydra regeneration. For instance, treatment of Hydra cells with a GSK-3β inhibitor (alsterpaullone) leads to β-catenin translocation into the nucleus, causing head formation [90]. This translocation of β-catenin into the nucleus as a downstream step of Wnt pathway has been extensively studied [91,92,93]. Two members of the Dickkopf (Dkk) family—Dkk1/2/4-A and Dkk1/2/4-C—have been identified and shown to be expressed in specific patterns consistent with a role in axial patterning. These Dkks are considered potential Wnt antagonists due to their homology with known Dkk proteins in other animals. However, their precise functional role during regeneration remains only partially understood, with limited direct experimental validation to date [94]. Notably, the Dickkopf (DKK) family is recognized as one of the key inhibitors of the canonical Wnt signaling pathway. DKKs exert their inhibitory function by binding to the Wnt co-receptor LRP5/6, thereby blocking the formation of the Wnt–Frizzled–LRP complex. This prevents β-catenin stabilization and its subsequent translocation to the nucleus, effectively downregulating Wnt-dependent gene transcription. [95].
The study of molecular pathways in Hydra has been undertaken by differential gene expression and single cell expression data analysis [96,97]. This led, among others, to the discovery of ks1, a Hydra specific gene. ks1 is permanently expressed in the adult, just below tentacles and hypostome, that is, before these cells differentiate irreversibly as part of the head. Because ks1 is upregulated in response to early signals of head formation, it has been termed a marker of “cell head forming potential” [3,98,99]. Its specific function remains unknown.
5. Hydra Regeneration Requires Mechanical Stimulation
As a first step of Hydra regeneration, a hollow sphere made of a cell bilayer forms (Figure 1b). This is regardless, whether starting with a cell aggregate or a small piece of tissue. Subsequently, due to osmosis [100,101,102], cycles of steady inflation terminated by bursts are observed (Phase I, Figure 2a). The frequency and amplitude of these cycles abruptly change after about 18 hours (Figure 2a). At this point the release of pressure occurs at a decreased threshold without rupture and increased frequency (Phase II) as if a weak spot in the Hydra cell bilayer had emerged [100,103]. Futterer, et al. [100] showed that this point in time goes along with a transition of the cell spheroid from elastic isotropy to anisotropy (Figure 2b). Moreover, the transition occurs around the time point where Wnt is supposed to be expressed, suggesting a potential connection between Wnt expression, cell adhesion and tissue elasticity [101]. Chiou and Collins [104] showed that indeed the emergence of an early mouth was responsible for the diminished pressure release threshold that induces the sudden change in the inflation burst cycles [101,105]. Soriano, et al. [101] showed that axis definition is delayed by the same time interval as the inflation-burst cycles are prolonged due to changes in osmotic pressure, suggesting the osmotical inflation to be the driving force in the process. Duclut, et al. [106] studied mechanical stimulation from osmotic pressure in cell spheroids in detail. Ferenc, et al. [107] showed that mechanical oscillations orchestrate axial patterning through Wnt activation in Hydra. HyWnt3 is more affected than other Wnt genes by the lack of spheroid inflation in an isotonic environment, indicating its sensitivity to mechanical cues. Wnt 3 overexpression in Hydra spheroids under isotonic conditions was able to rescue the regeneration process, highlighting its pivotal role in response to mechanical stimulation [107]. These observations point towards the role of the cell cytoskeleton as the force sensitive structure of the cell.
The role of mechanical stimulations in conjunction with the cytoskeleton during development has also been observed in other model organisms. For instance, in Drosophila embryogenesis, actomyosin contractions have been shown to generate mechanical stress that regulates apical constriction and cell shape changes during the process of gastrulation [108,109]. Similarly, in Xenopus laevis, mechanical forces play a significant role in convergence and extension movements essential for gastrulation. Here, the cytoskeletal dynamics and cell-cell adhesion are regulated by the non-canonical Wnt/PCP signaling pathway, which is crucial for tissue elongation and axis formation [110]. In mammalian systems, mechanical forces transmitted via the cytoskeleton have been shown to influence stem cell lineage specification. The YAP/TAZ signaling pathway responds to substrate stiffness and cytoskeletal tension, directing mesodermal differentiation [111,112]. These examples across various organisms illustrate the conserved role of mechanical forces and cytoskeletal interactions in regulating development and signaling pathways.
6. Symmetry Breaking in Physics and Biology
In physics, symmetry breaking in non-equilibrium has been studied in physics at length [113,114,115,116]. To make a transition to asymmetry these systems tend to generate transient asymmetries by fluctuations. This is still a symmetric situation. Only if the asymmetric fluctuation reaches critical size so that it becomes locked, the symmetry is considered broken. As an example, consider a vortex as it may appear in a sink. Initially, when the liquid starts to drain, there will be no vortex, but increasingly large fluctuations due to the large flow of liquid create transient asymmetry. Only when these fluctuations reach a sufficient (critical) amplitude to become self-amplifying, the symmetry is broken and the vortex will increase in strength. At that point the vortex will not reverse course if left to itself. It will resist increasingly large perturbations in the opposite direction, even if these would have been large enough to impose a direction if they had been applied from start. In other words, these perturbations can be larger than the initial fluctuation spectrum and still have no effect at this point. At the same time, by very violently spinning the entire mass of fluid in the opposite direction the direction of any vortex can be changed – but this does not mean that the vortex did not undergo symmetry breaking earlier, or that there was no clearly defined direction. We understand that for a study, the magnitude of the applied perturbations matters a lot.
If we ask, how we can show that the vortex broke symmetry in the beginning, it becomes clear that two features are important: initially the direction of rotation will be imposed by perturbations that create rotational flow at the critical fluctuation level – this is still very small compared to an established vortex. Once a direction is chosen, there must be an amplification and stabilization of the movement (Chapter 10.2 “Critical Precursory Fluctuations”).
The same idea is found in Biology. Alberts, et al. [82] (Chapter 22 “Development of Multicellular Organisms”) regarding external influences on developmental decisions says: “The choice between the alternative outcomes can be dictated by an external signal that gives one of the cells a small initial advantage. But once the positive feedback has done its work, this external signal becomes irrelevant. Broken symmetry, once established, is very hard to reverse: positive feedback makes the chosen asymmetric state self-sustaining, even after the biasing signal has disappeared. In this way, positive feedback provides the system with a memory of past signals”.
Transferred to Hydra, this means that we have to show that once a direction is chosen, it amplifies (and as discussed in chapter 11, this seems to be the case). However, the property that small perturbations or advantages are sufficient to direct the axis remains largely unexplored except for the following.
7. A Weak Temperature Gradient Can Direct the Future Axis of a Regenerating Hydra Spheroid
The above can be applied to developing Hydra spheroids that are exposed to a temperature gradient. If the temperature gradient of typically less than a degree was applied early, during phase I (high amplitude, low frequency oscillations), it would set the axis. However, if applied during phase II (low amplitude, high frequency oscillations), the gradient could no longer change the direction of the axis. Soriano, et al. [103] concluded that the axis direction of the regenerating Hydra spheroid becomes irreversibly locked during the transition from phase I to phase II (Figure 2). Larger fragments that retain a certain degree of asymmetry were found to switch to phase II much faster [101].
Naively, one might expect the head to appear on the warmer side, given that the organizer is the first structure to emerge during regeneration. This is because the increased temperature accelerates the development, and this creates the ‘small advantage’ (see above) that can be expected to propagate to axis positioning. However, in cases where the temperature difference between the cold and hot sides was ΔT=0.6°C, the head formed on the cold or the hot side with about equal probability (Figure 3). However, if the gradient was increased to ΔT=0.9°C, a tendency for the head to form on the cold side became apparent [4]. Not only the direction of a temperature gradient imposed the position of the axis, but the magnitude of the gradient had an effect on the orientation – not an intuitive result.
8. Ks1 Expression Patterns at the Axis Defining Moment Are Devoid of a Characteristic Size
Usually, we define our surroundings using specific scales, such as the typical size of organisms or their typical lifespans. However, some phenomena do not fit into this kind of description. Since they lack a characteristic size or scale — they are called scale-free. Mathematically, the absence of scale corresponds to a power law, which is surprisingly common in nature [118]. A power law can be expressed as:
f(x)=b⋅xa
Here x is the input, for instance the scale of a map, and f(x) the output, for instance the length of the coastline of Britain taking a map at that scale. If the exponent a is one, the two quantities are just proportional. An exponent different from one means that one grows faster or slower than the other. Doubling the scale of the map does not necessarily double the length of the coastline because of its rough, intricate shape. “a” is the exponent of the power law that defines the quantitative connection between the input, the scale of the map, and the output, here the length of the coast. a is called the fractal dimension. More precisely, a is called the “perimeter fractal dimension” of the coastline of Britain. Its value is estimated to be around 1.25 according to Mandelbrot's original analysis. [117]
One key feature of a power law is that if you scale the input x0 by a factor of k, the output of the function f(k⋅x0) will be increased by ka with respect to f(x0):
f(k⋅x0) = b (k⋅x0)a= b⋅ka⋅x0a= ka⋅f(x0).
Since this applies to any x0, regardless of its precise value, the function f(x) is scale-free: at whatever scale you look at the function, its shape remains the same. Scale-free can be shown to indeed be equivalent to a power-law description [118].
Non-trivial scale-free objects are known as fractals. The term “fractal” was first used by Benoît Mandelbrot in 1975. He derived it from the Latin word "frāctus", meaning broken or irregular. Fractal analysis has been shown to be useful in the biological sciences, helping to describe complex patterns and structures in nature [119,120,121,122,123,124,125,126,127], including investigation of cnidarians [128,129]. Fractal properties of gene expression were reported by Manoel, et al. [130], Ghorbani, et al. [131], and Waliszewski [132].
Fractals are fragmented geometric shapes that can be broken down into smaller parts, each of which is a reduced copy of the whole [126,127,128]. If you take photos with different magnifications of the same fractal, these photos will, again, look strictly the same. An example of this in nature is Romanesco broccoli (Figure 4), where each floret looks like a miniature version of the whole vegetable.
If you cover a straight line with a grid of square boxes (imagine pixels of a camera), the number of boxes N(δ) required is inversely proportional to the box size δ. Mathematically, this is expressed as N(δ)=constant/ δ, leading to a slope of 1 when plotting ln(N(δ)) against (- ln(δ)). The perimeter fractal dimension of a straight line equals 1. Indeed, a line is one-dimensional object. A more complex line shape such as coast of Britain, however, will most likely lead to a different slope, when plotting the logarithms. The slope represents the fractal dimension (Figure 5).
For a simple, two-dimensional shape like a square, the area fractal dimension would be 2, indicating that it fully occupies a flat geometric plane, corresponding to the geometric dimension of flat shapes. This is because the number of boxes needed, N(δ), is inversely proportional to the area of the box δ2. This leads to a slope of 2 in the plot of ln(N(δ)) versus -ln(δ). For a more complex shape, again, the fractal dimension is likely to be different from 2.
In the study by Soriano, et al. [103], the spatial distribution of ks1 gene expression on the surface of the Hydra was examined using in situ hybridization. There were domains (or clusters) of cells expressing the ks1 gene. These domains were analyzed to check if they were fractal objects. This was done using the grid (or box-counting) technique as outlined above (see Figure 5).
The perimeter fractal dimension Dper of the ks1-expressing domains was determined for three culture times [101]. The results are given in Figure 6. The fractal dimensions reached a maximum above 1.3 after about 25 h, which suggests that the spatial distribution of ks1 expression exhibits fractal properties throughout the critical period of symmetry-breaking and axis definition. Similarly, the area fractal dimension Darea was determined as 1.7, using the grid method [133].
Besides studying the shape of the ks1-expressing domains, Soriano, et al. [103] also studied their size distribution. A domain size s means that it contains s cells. To diminish the noise in the analysis, for each value of s, the probability P(s) of observing a domain with a size equal to or larger than s was extracted from the data and plotted as a function of s (Figure 8). Around the transition to phase II, point from which the axis appears locked in a temperature gradient (at a culture time of 25 hours), the relationship between P(s) and s appears linear on a log-log scale. The slope of this relationship corresponds to the scaling exponent -τ, which is close to -0.8. Therefore, the probability P(s) as a function of domain size s can be described by a power law P(s)∼s−τ. Since the domains scale in size as well as in their shape, which is fractal, one can say that the spatial gene expression pattern of ks1 on the spheroid becomes scale free at the axis locking moment. For the other culture times (16 h and 48 h), the distribution does not fit a power law: here characteristic scales are present in P(s). The observation of scale-free properties often allows one to isolate possible underlying mechanisms because they are unusual. We present a hypothetical model that considers that in the following.
9. Model Based on Production and Exchange of ks1-Promoting Factor
Cells communicate with each other through different types of signaling, such as endocrine, paracrine, and juxtacrine communication [82]. In the case of Hydra, there is currently no evidence for endocrine signaling during axis definition, which raises the question of how the Wnt-expressing organizer communicates with other regenerating cells within the organism. Paracrine signaling is well-documented in other animal developmental processes [134,135,136,137,138,139,140] as well as plant developmental processes [141,142]. Paracrine factors, signaling molecules that diffuse over short distances, can regulate gene expression in neighboring cells [143,144].
Epithelial cells are often connected by gap junctions, microscopic channels that enable transport and communications of signaling molecules between adjacent cells [145,146,147]. In Hydra, the cells in the body column are extensively connected by these gap junctions, facilitating intercellular communication. Their role in intercellular signaling suggests that they could contribute to nearest neighbor signaling during axis definition [148].
Cellular functions often arise from the interactions among neighboring cells, leading to synchronized responses [149,150]. This aligns well with the formation of ks1 expression domains on the Hydra cell spheroids. ks1 expression is either fully turned on or off, resulting in synchronized ks1 expression among neighboring cells that lead to the observed domains.
Nearest neighbor signaling in only one dimension will always lead to exponential decay in that direction. In two dimensions, however, since the signaling may find new directions so that it spreads exponentially, there is a chance that the result obeys to a power law, becomes scale-free. Nevertheless, the probability of signaling to the nearest neighbor needs to be tuned to a precise value for that to happen. Self-organized critical models tune to that parameter by themselves. This often occurs in a robust way, meaning that the result is only slightly changed by reasonable changes in the interaction between neighbors [118]. We therefore searched for a self-critical model that could reflect the situation in Hydra.
The model relies on the production of a hypothetical ks1-promoting factor, “X,” which is transferred between directly neighboring cells [4]. The exact contributors to X remain undefined, however, the concentration of X in a cell integrates various signaling inputs, including paracrine factors or other elements in the surrounding environment, affecting the likelihood of ks1 expression of a given cell. β-catenin, which must be released from the cell junctions into the cell nuclei under the mechanical stretch from the osmotic inflation, may well be the most important contributor to X. Initially, each cell has a concentration of X that is attributed at random between zero and just below [X]c. Since the osmotic inflation slowly drives the cells to increasingly express ks1, we impose that X increases slowly but steadily at a rate ν = d[X]/dt, which means that in the simulation the [X]i are increased one by one, each by adding a small amount in random order. As [X]i in the i-th cell reaches [X]c, a determined fraction of [X]i is distributed evenly to its six neighboring cells. [X]i is set to zero and ks1 is expressed by the i-th cell. As X is shared among neighboring cells, the concentration in these cells may also reach the threshold, in turn initiating expression. This process creates a chain reaction, or avalanche, of ks1 expression that spreads across cells, forming a ks1 expression domain (Figure 7a).
The larger the avalanche, the larger the domain of ks1-expressing cells formed by this process. Once an avalanche concludes, the ks1 expression domain disappears. Eventually, a new avalanche begins, usually at a different location of the sphere. Throughout the simulation, ks1 expression in each cell starts and stops multiple times. For the model to function correctly, the avalanche spreading rate must be much faster than the rate of production of the ks1-promoting factor X [4]. This makes the ks1 expression pattern evolve slowly, leading to progressively larger avalanches. The result is stable if a certain degree of randomness in X production across cells introduces variability in avalanche initiation, reflecting “natural” fluctuations to ks1 expression.
10. Analysis of the Model: Results of Simulations
In the study by Gamba, et al. [4], numerical simulations were carried out to test the proposed model for ks1 expression. Although the body wall of Hydra consists of two cell layers (ectoderm and endoderm), ks1 is expressed exclusively in the ectodermal (outer) layer [3]. Therefore, the simulations modeled the Hydra ball as a single-layered structure representing only the ectoderm. This simplification was justified by additional analyses showing that introducing a second layer did not significantly alter the overall model dynamics [4]. A Hydra spheroid was modeled as a spherical lattice of approximately 10,000 hexagons, each representing a cell (see Figure 7a). Simulations showed the best match to experimental data occurred if 95% of X was conserved during transfer to neighboring cells.
Following the rules outlined above, only small avalanches of X-releasing cells were observed initially. On the sphere, they appeared at random locations. Over time, the domains increased in size, and after approximately 2,000 avalanches, the system reached almost a steady state where domains of all sizes were observed.
Examples of typical domains of cells expressing ks1, emerging from the avalanche mechanism of the model, are shown in Figure 7b. The three domains in Figure 7b represent independent events: each domain emerged and disappeared before the next appeared. To make them appear at the same time, one would have to keep the black color for longer. This would not affect the results in any way.
The simulated expression domains were described by examining the distribution of avalanche sizes, P(s), which represents the probability of observing an avalanche (or domain) of ks1-expressing cells larger than size s. Initially, P(s) displayed a more or less exponential decay. Over time, the distribution evolved to a power-law, indicating that the size distribution of the ks1 expression domains became scale-free. Moreover, at this point (time T), the expression domains formed fractal-like patterns. The model yielded a perimeter fractal dimension Dper≈1.28 and an area fractal dimension Darea≈1.75. The power law of P(s) disappeared for longer times (2T).
11. Comparison of Numerical Simulations with Experimental Data
Figure 7b compares typical shapes of main sizes. Figure 8 shows the size distribution of avalanches (corresponding to the domains of ks1-expressing cells) that appeared at simulation times T/2, T and 2T, where T denotes the time until emergence of a power law P(s)~s-τ). These results were compared to the equivalent experimentally observed distribution, P(s), of ks1-expressing domains (as described above) for the three culture times of 16 h, 25 h, and 45 h. A strong correspondence appeared between the numerical simulations and experimental data: for both, the linearity of ln(P(s)) vs. ln(s) extends over two orders of magnitude (decades), with an identical exponent of τ≈0.8.
The values of perimeter fractal dimension and area fractal dimension (Dper=1.28±0.05 and Darea=1.75±0.05) obtained from numerical simulations for the conservation level C~0.95 at simulation time T closely match the experimental data, where the perimeter fractal dimension is approximately Dper~1.3 at 25 h and the area fractal dimension is Darea~1.7. This similarity indicates that the time T associated with the emergence of the power law P(s)~s-τ in the simulations is likely close to the experimental time t≈25 h of the Hydra axis formation.
As described above, experiments demonstrated that a temperature gradient could direct the position of the emerging axis, if applied sufficiently early. Increasing temperature corresponds to accelerating the rates, which is simple to do in the simulation. Usually, the acceleration in rates as a function of temperature in biology follows a Boltzmann description [151,152]. which was realized in the simulation. Supposing that an overcritical, large avalanche of ks1 expression, above a certain threshold, is locked to define the axis, the head emerged at the cold and hot side of the spheroid with about equal probability [4]. However, the head had an increased tendency to appear at the cold side for larger temperature gradients. This corresponds to what was observed experimentally.
12. Mechanical Stimulation and the Actin Cytoskeleton
Since our initial work regarding osmotic inflation and burst cycles of a regenerating Hydra spheroid [100], quite an amount of work has focused on the connections between mechanical stimulation, Hydra axis definition and Wnt expression.
Adult Hydra exhibits filamentous actin, oriented in concentric rings in the endoderm and in direction of the axis in the ectoderm [153]. Braun and Keren [57] found that asymmetry and defects in nematic actin fiber orientation of the cell spheroid correlate with the position of the future axis. An interesting study on regeneration under constrained conditions in narrow tubes of Hydra spheroids with an inherited axis [154]. If the inherited axis did not follow the axis of the tube, multiaxial Hydra emerged that the authors link to multiple defects that occur in actin fiber orientation. Accordingly, the initial direction of the axis can be reversed, however, with difficulty. In our example of vortex formation (section 5), this corresponds to an almost fully developed vortex that is reversed. Ravichandran, et al. [155] showed that toroidal Hydra tissue does not regenerate unless a suitable defect in the actin cytoskeleton rescued the situation.
Through which pathway exactly actin is linked to directional signaling in Hydra remains elusive. However, actin is connected to the cell junctions, where β-catenin is located. Moreover, actin is the force generating structure of cells. Active contraction of cells occurs in the direction of actin [156]. It may well be that the increased stretch of the tissue occurs predominantly at the locations where a defect is located, leading to the result above [154,155,157]. At the same time, the situation may be more complex. Microtubules are connected to actin via the Rho signaling pathway [158]. Both elements are known to act in concert [159]. Often microtubules generate directional information in cells during development [160,161,162,163,164]. We showed that Hydra regeneration is prevented by nocodazole, unless it is rescued by exchanging nocodazole for paclitaxel. The delay in regeneration corresponds to the moment of rescue [165].
Asymmetric mechanical constraints can set the axis [159,160]. The feedback between stretch induced Wnt expression, β-catenin nuclear presence and decreased tissue stiffness has been clearly evidenced [107,166]. During osmotic inflation, this is likely to produce instabilities where elastic weakness entails faster stretching, meaning increased probability of Wnt expression in turn translating to increased elastic weakness. This mechanism successfully explained the experimental data in in Weevers, et al. [166] without the need to consider defects in the actin filament network. Bailles, et al. [167] studied regenerates from single cells where supracellular actin organization was absent at the beginning. The actin fibers gradually self-organized, however, it was not clear whether this structural emergence was functionally relevant in terms of axis definition. Actin organization could not be linked to the emergence of Wnt expression.
One may ask how all the data on mechanical signaling can be linked to the model that we presented earlier. If mechanical stretching increases the probability of Wnt expression and head formation (and by extension ks1), this simply means increased production of the X factor in our model. Obviously, large, avalanche-like, synchronized expression patterns would preferentially appear at the location of increased production. Following this interpretation, stimulation through mechanics means that the imposed stimulus is substantially above the natural fluctuation level, so that it will eventually direct the symmetry breaking process. Compared to the analogy of vortex formation, this means that the liquid is actively stirred in a given direction, above the natural fluctuation level, and before vortex formation so that the emerging vortex just follows this direction.
In the shape analysis of a Hydra spheroid during regeneration [100,157], we did not detect elastic tissue anisotropy before the appearance of the early mouth, in excellent agreement with Bailles, et al. [167]. However, this does not mean that externally applied anisotropic stretch will not translate to asymmetry before that time point. Following our interpretation, it just means that the system does not have to generate by itself a large fluctuation of the X factor that will break the symmetry.
13. Conclusions
We discussed results on the expression of the ‘marker of head forming potential’ ks1 [103] and a proposed model [4] that will produce the results quantitatively. A temperature gradient as a non-molecular parameter changes the biochemical rates on both sides of a regenerating spheroid. Supposing that an overcritical (sufficiently strong to break the symmetry) fluctuation is locked to break symmetry, the intricate behavior of Hydra axis positioning as the animal is exposed to a (decidedly weak!) temperature gradient is predicted by the model. Quoting von Neumann’s saying “with four parameters I can fit an elephant, and with five I can make him wiggle his trunk” [168], one cannot stress enough that this model quantitatively produces all the results with only a single adjustable parameter. We suggest that the gene expression patterns of the cells that form the regenerating Hydra sphere increasingly synchronize until a supercritical fluctuation, that is, a fluctuation that eventually leads to stable Wnt expression emerges. This interpretation is supported by observations that, during axis formation, Wnt-expressing cells can emerge in very limited numbers—too few to give rise to a stable organizer. We interpret this phenomenon as the result of subcritical fluctuations, of insufficient magnitude to break symmetry [169,170].
We show how mechanical perturbations that increase the probability of Wnt expression naturally become part of the model, however, we argue that mechanics is likely to be a strong perturbation overriding the natural fluctuations in an unperturbed setting. A competition between at least two different stimuli that can be varied in magnitude, may offer a better view on the contributions to the symmetry breaking process in the future.
The OFC model is part of so-called self-critical models. They evolve towards a critical state on an infinite lattice. By definition, these states not only scale, but they provide infinite sensitivity towards perturbation [118]. This is because of the absence of characteristic scales. Although Hydra is finite, some of the sensitivity can be expected to remain present. This may offer a lever to test the proposed model.
Acknowledgements
This work benefitted from funding by Deutsche Forschungsgemeinschaft (DFG) through the collaborative research center (CRC) 1027 as well as from funding by PNRR “National Center for Gene Therapy and Drugs based on RNA Technology” (Project no. CN00000041 CN3 RNA).
References
- Hobmayer, B.; Rentzsch, F.; Kuhn, K.; Happel, C.M.; Laue, C.C.V.; Snyder, P.; Rothbächer, U.; Holstein, T.W. WNT signalling molecules act in axis formation in the diploblastic metazoan Hydra. Nature 2000, 407, 186–189. [Google Scholar] [CrossRef] [PubMed]
- Broun, M.; Gee, L.; Reinhardt, B.; Bode, H.R. Formation of the head organizer in hydra involves the canonical Wnt pathway. Development 2005, 132, 2907–2916. [Google Scholar] [CrossRef]
- Weinziger, R.; Salgado, L.M.; David, C.N.; Bosch, T.C.G. Ks1, an epithelial cell-specific gene, responds to early signals of head formation in Hydra. Development 1994, 120, 2511–2517. [Google Scholar] [CrossRef]
- Gamba, A.; Nicodemi, M.; Soriano, J.; Ott, A. Critical behavior and axis defining symmetry breaking in Hydra embryonic development. Phys Rev Lett 2012, 108, 158103. [Google Scholar] [CrossRef]
- Olami, Z.; Feder, H.J.S.; Christensen, K. Self-Organized Criticality in a Continuous, Nonconservative Cellular Automaton Modeling Earthquakes. Physical Review Letters 1992, 68, 1244–1247. [Google Scholar] [CrossRef] [PubMed]
- Kayal, E.; Roure, B.; Philippe, H.; Collins, A.G.; Lavrov, D.V. Cnidarian phylogenetic relationships as revealed by mitogenomics. BMC Evolutionary Biology 2013, 13, 5–22. [Google Scholar] [CrossRef] [PubMed]
- Galliot, B.; Schmid, V. Cnidarians as a model system for understanding evolution and regeneration. The International Journal of Developmental Biology 2002, 46, 39–48. [Google Scholar]
- Daly, M.; Brugler, M.R.; Cartwright, P.; Collins, A.G.; Dawson, M.N.; Fautin, D.G.; France, S.C.; Mcfadden, C.S.; Opresko, D.M.; Rodriguez, E.; et al. The phylum Cnidaria: A review of phylogenetic patterns and diversity 300 years after Linnaeus. Zootaxa 2007, 1668, 127–182. [Google Scholar] [CrossRef]
- Holstein, T.W.; Hobmayer, E.; Technau, U. Cnidarians: an evolutionarily conserved model system for regeneration? Dev Dyn 2003, 226, 257–267. [Google Scholar] [CrossRef]
- Siebert, S.; Farrell, J.A.; Cazet, J.F.; Abeykoon, Y.; Primack, A.S.; Schnitzler, C.E.; Juliano, C.E. Stem cell differentiation trajectories in Hydra resolved at single-cell resolution. Science 2019, 365. [Google Scholar] [CrossRef]
- Technau, U.; Schwaiger, M. Recent advances in genomics and transcriptomics of cnidarians. Mar Genomics 2015, 24 Pt 2, 131–138. [Google Scholar] [CrossRef] [PubMed]
- Technau, U.; Steele, R.E. Evolutionary crossroads in developmental biology: Cnidaria. Development 2011, 138, 1447–1458. [Google Scholar] [CrossRef] [PubMed]
- Zapata, F.; Goetz, F.E.; Smith, S.A.; Howison, M.; Siebert, S.; Church, S.H.; Sanders, S.M.; Ames, C.L.; Mcfadden, C.S.; France, S.C.; et al. Phylogenomic Analyses Support Traditional Relationships within Cnidaria. PLoS One 2015, 10, e0139068. [Google Scholar] [CrossRef] [PubMed]
- Park, E.; Hwang, D.S.; Lee, J.S.; Song, J.I.; Seo, T.K.; Won, Y.J. Estimation of divergence times in cnidarian evolution based on mitochondrial protein-coding genes and the fossil record. Mol Phylogenet Evol 2012, 62, 329–345. [Google Scholar] [CrossRef]
- Goodheart, J.A.; Bely, A.E. Sequestration of nematocysts by divergent cnidarian predators: mechanism, function, and evolution. Invertebrate Biology 2016, 136, 75–91. [Google Scholar] [CrossRef]
- Jouiaei, M.; Sunagar, K.; Federman Gross, A.; Scheib, H.; Alewood, P.F.; Moran, Y.; Fry, B.G. Evolution of an ancient venom: recognition of a novel family of cnidarian toxins and the common evolutionary origin of sodium and potassium neurotoxins in sea anemone. Mol Biol Evol 2015, 32, 1598–1610. [Google Scholar] [CrossRef]
- Beckmann, A.; Ozbek, S. The nematocyst: a molecular map of the cnidarian stinging organelle. Int J Dev Biol 2012, 56, 577–582. [Google Scholar] [CrossRef] [PubMed]
- Balasubramanian, P.G.; Beckmann, A.; Warnken, U.; Schnolzer, M.; Schuler, A.; Bornberg-Bauer, E.; Holstein, T.W.; Ozbek, S. Proteome of Hydra nematocyst. J Biol Chem 2012, 287, 9672–9681. [Google Scholar] [CrossRef]
- Fautin, D.G. Structural diversity, systematics, and evolution of cnidae. Toxicon 2009, 54, 1054–1064. [Google Scholar] [CrossRef]
- Podobnik, M.; Anderluh, G. Pore-forming toxins in Cnidaria. Semin Cell Dev Biol 2017, 72, 133–141. [Google Scholar] [CrossRef]
- Trembley, A. Translation of a letter from Mr. Abraham Trembley, F. R. S. to the President, with observations upon several newly discovered species of fresh-water Polypi. Philosophical Transactions. [CrossRef]
- Chapman, J.A.; Kirkness, E.F.; Simakov, O.; Hampson, S.E.; Mitros, T.; Weinmaier, T.; Rattei, T.; Balasubramanian, P.G.; Borman, J.; Busam, D.; et al. The dynamic genome of Hydra. Nature 2010, 464, 592–596. [Google Scholar] [CrossRef] [PubMed]
- Hemmrich, G.; Miller, D.J.; Bosch, T.C. The evolution of immunity: a low-life perspective. Trends Immunol 2007, 28, 449–454. [Google Scholar] [CrossRef]
- Deines, P.; Lachnit, T.; Bosch, T.C.G. Competing forces maintain the Hydra metaorganism. Immunol Rev 2017, 279, 123–136. [Google Scholar] [CrossRef]
- Wang, A.T.; Deng, L.; Liu, H.T. A new species of hydra (Cnidaria: Hydrozoa: Hydridae) and molecular phylogenetic analysis of six congeners from China. Zoolog Sci 2012, 29, 856–862. [Google Scholar] [CrossRef]
- Gierer, A. The Hydra model - a model for what? Int J Dev Biol 2012, 56, 437–445. [Google Scholar] [CrossRef] [PubMed]
- Kawaida, H.; Shimizu, H.; Fujisawa, T.; Tachida, H.; Kobayakawa, Y. Molecular phylogenetic study in genus Hydra. Gene 2010, 468, 30–40. [Google Scholar] [CrossRef]
- Glauber, K.M.; Dana, C.E.; Steele, R.E. Hydra. Curr Biol 2010, 20, R964–965. [Google Scholar] [CrossRef]
- Vogg, M.C.; Galliot, B.; Tsiairis, C.D. Model systems for regeneration: Hydra. Development 2019, 146. [Google Scholar] [CrossRef] [PubMed]
- Galliot, B. Hydra, a fruitful model system for 270 years. Int J Dev Biol 2012, 56, 411–423. [Google Scholar] [CrossRef]
- Nawrocki, A.M.; Collins, A.G.; Hirano, Y.M.; Schuchert, P.; Cartwright, P. Phylogenetic placement of Hydra and relationships within Aplanulata (Cnidaria: Hydrozoa). Mol Phylogenet Evol 2013, 67, 60–71. [Google Scholar] [CrossRef]
- Martinez, D.E.; Iniguez, A.R.; Percell, K.M.; Willner, J.B.; Signorovitch, J.; Campbell, R.D. Phylogeny and biogeography of Hydra (Cnidaria: Hydridae) using mitochondrial and nuclear DNA sequences. Mol Phylogenet Evol 2010, 57, 403–410. [Google Scholar] [CrossRef] [PubMed]
- Zacharias, H.; Anokhin, B.; Khalturin, K.; Bosch, T.C. Genome sizes and chromosomes in the basal metazoan Hydra. Zoology (Jena) 2004, 107, 219–227. [Google Scholar] [CrossRef] [PubMed]
- Pan, H.C.; Fang, H.Y.; Li, S.W.; Liu, J.H.; Wang, Y.; Wang, A.T. The complete mitochondrial genome of Hydra vulgaris (Hydroida: Hydridae). Mitochondrial DNA 2014, 25, 418–419. [Google Scholar] [CrossRef]
- Pan, H.C.; Qian, X.C.; Li, P.; Li, X.F.; Wang, A.T. The complete mitochondrial genome of Chinese green hydra, Hydra sinensis (Hydroida: Hydridae). Mitochondrial DNA 2014, 25, 44–45. [Google Scholar] [CrossRef]
- Steele, R.E. The Hydra genome: insights, puzzles and opportunities for developmental biologists. Int J Dev Biol 2012, 56, 535–542. [Google Scholar] [CrossRef]
- Sarras, M.P., Jr. Components, structure, biogenesis and function of the Hydra extracellular matrix in regeneration, pattern formation and cell differentiation. Int J Dev Biol 2012, 56, 567–576. [Google Scholar] [CrossRef]
- Bode, H. Axis formation in hydra. Annu Rev Genet 2011, 45, 105–117. [Google Scholar] [CrossRef] [PubMed]
- Littlefield, C.L.; Finkemeier, C.; Bode, H.R. 1991. [CrossRef]
- Nishimiya-Fujisawa, C.; Kobayashi, S. Germline stem cells and sex determination in Hydra. Int J Dev Biol 2012, 56, 499–508. [Google Scholar] [CrossRef]
- Wolpert, L. Principles of development, 3rd ed.; Oxford University Press: Oxford, 2007. [Google Scholar]
- Martínez, D.E. Mortality Patterns Suggest Lack of Senescence in Hydra. Experimental Gerontology 1998, 33, 217–225. [Google Scholar] [CrossRef]
- Tomczyk, S.; Fischer, K.; Austad, S.; Galliot, B. Hydra, a powerful model for aging studies. Invertebr Reprod Dev 2015, 59, 11–16. [Google Scholar] [CrossRef]
- Schaible, R.; Scheuerlein, A.; Danko, M.J.; Gampe, J.; Martinez, D.E.; Vaupel, J.W. Constant mortality and fertility over age in Hydra. Proc Natl Acad Sci U S A 2015, 112, 15701–15706. [Google Scholar] [CrossRef]
- Nebel, A.; Bosch, T.C.G. Evolution of human longevity: lessonsfrom Hydra. Aging 2012, 4, 730–731. [Google Scholar] [CrossRef]
- Boehm, A.M.; Bosch, T.C. Migration of multipotent interstitial stem cells in Hydra. Zoology (Jena) 2012, 115, 275–282. [Google Scholar] [CrossRef]
- Martinez, D.E.; Bridge, D. Hydra, the everlasting embryo, confronts aging. Int J Dev Biol 2012, 56, 479–487. [Google Scholar] [CrossRef] [PubMed]
- Ryan, J.F.; Pang, K.; Schnitzler, C.E.; Nguyen, A.D.; Moreland, R.T.; Simmons, D.K.; Koch, B.J.; Francis, W.R.; Havlak, P.; Program, N.C.S.; et al. The genome of the ctenophore Mnemiopsis leidyi and its implications for cell type evolution. Science 2013, 342, 1242592. [Google Scholar] [CrossRef] [PubMed]
- Shimizu, H.; Fujisawa, T. Peduncle of Hydra and the heart of higher organisms share a common ancestral origin. Genesis 2003, 36, 182–186. [Google Scholar] [CrossRef]
- Meinhardt, H. Modeling pattern formation in hydra: a route to understanding essential steps in development. Int J Dev Biol 2012, 56, 447–462. [Google Scholar] [CrossRef] [PubMed]
- Krahe, M.; Wenzel, I.; Lin, K.-N.; Fischer, J.; Goldmann, J.; Kastner, M.; Futterer, C. Fluctuations and differential contraction during regeneration of Hydra vulgaris tissue toroids. New Journal of Physics 2013, 15, 035004–035021. [Google Scholar] [CrossRef]
- Krishna, S.; Nair, A.; Cheedipudi, S.; Poduval, D.; Dhawan, J.; Palakodeti, D.; Ghanekar, Y. Deep sequencing reveals unique small RNA repertoire that is regulated during head regeneration in Hydra magnipapillata. Nucleic Acids Res 2013, 41, 599–616. [Google Scholar] [CrossRef]
- Tanaka, E.M.; Reddien, P.W. The cellular basis for animal regeneration. Dev Cell 2011, 21, 172–185. [Google Scholar] [CrossRef]
- Bonfanti, L. From hydra regeneration to human brain structural plasticity: a long trip through narrowing roads. ScientificWorldJournal 2011, 11, 1270–1299. [Google Scholar] [CrossRef]
- Watanabe, H.; Fujisawa, T.; Holstein, T.W. Cnidarians and the evolutionary origin of the nervous system. Dev Growth Differ 2009, 51, 167–183. [Google Scholar] [CrossRef] [PubMed]
- Hoffmeister-Ullerich, S.A. Hydra--ancient model with modern outfit. Cell Mol Life Sci 2007, 64, 3012–3016. [Google Scholar] [CrossRef]
- Braun, E.; Keren, K. Hydra Regeneration: Closing the Loop with Mechanical Processes in Morphogenesis. Bioessays 2018, 40, e1700204. [Google Scholar] [CrossRef] [PubMed]
- Bosch, T.C. Hydra and the evolution of stem cells. Bioessays 2009, 31, 478–486. [Google Scholar] [CrossRef] [PubMed]
- David, C.N. Interstitial stem cells in Hydra: multipotency and decision-making. Int J Dev Biol 2012, 56, 489–497. [Google Scholar] [CrossRef]
- Sanchez Alvarado, A.; Tsonis, P.A. Bridging the regeneration gap: genetic insights from diverse animal models. Nat Rev Genet 2006, 7, 873–884. [Google Scholar] [CrossRef]
- Fumagalli, M.R.; Zapperi, S.; La Porta, C.a.M. Regeneration in distantly related species: common strategies and pathways. NPJ Syst Biol Appl 2018, 4, 5. [Google Scholar] [CrossRef]
- Slack, J.M. Animal regeneration: ancestral character or evolutionary novelty? EMBO Rep 2017, 18, 1497–1508. [Google Scholar] [CrossRef]
- Ninov, N.; Yun, M.H. Current advances in tissue repair and regeneration: the future is bright. Regeneration (Oxf) 2015, 2, 84–91. [Google Scholar] [CrossRef]
- Bely, A.E.; Nyberg, K.G. Evolution of animal regeneration: re-emergence of a field. Trends Ecol Evol 2010, 25, 161–170. [Google Scholar] [CrossRef]
- Brockes, J.P.; Kumar, A. Comparative aspects of animal regeneration. Annu Rev Cell Dev Biol 2008, 24, 525–549. [Google Scholar] [CrossRef] [PubMed]
- Birnbaum, K.D.; Sanchez Alvarado, A. Slicing across kingdoms: regeneration in plants and animals. Cell 2008, 132, 697–710. [Google Scholar] [CrossRef] [PubMed]
- Maginnis, T.L. The costs of autotomy and regeneration in animals: a review and framework for future research. Behavioral Ecology 2006, 17, 857–872. [Google Scholar] [CrossRef]
- Brockes, J.P.; Kumar, A.; Velloso, C.P. Regeneration as an evolutionary variable. Journal of Anatomy 2001, 199, 3–11. [Google Scholar] [CrossRef]
- Gee, L.; Hartig, J.; Law, L.; Wittlieb, J.; Khalturin, K.; Bosch, T.C.; Bode, H.R. beta-catenin plays a central role in setting up the head organizer in hydra. Dev Biol 2010, 340, 116–124. [Google Scholar] [CrossRef]
- Iachetta, R.; Ambrosone, A.; Klimovich, A.; Wittlieb, J.; Onorato, G.; Candeo, A.; D'andrea, C.; Intartaglia, D.; Scotti, N.; Blasio, M.; et al. Real time dynamics of beta-catenin expression during Hydra development, regeneration and Wnt signalling activation. Int J Dev Biol 2018, 62, 311–318. [Google Scholar] [CrossRef]
- Gufler, S.; Artes, B.; Bielen, H.; Krainer, I.; Eder, M.K.; Falschlunger, J.; Bollmann, A.; Ostermann, T.; Valovka, T.; Hartl, M.; et al. beta-Catenin acts in a position-independent regeneration response in the simple eumetazoan Hydra. Dev Biol 2018, 433, 310–323. [Google Scholar] [CrossRef]
- Kusserow, A.; Pang, K.; Sturm, C.; Hrouda, M.; Lentfer, J.; Schmidt, H.A.; Technau, U.; Haeseler, A.V.; Hobmayer, B.; Martindale, M.Q.; et al. Unexpected complexity of the Wnt gene family in a sea anemone. Nature 2005, 433, 156–160. [Google Scholar] [CrossRef]
- Wiese, K.E.; Nusse, R.; Van Amerongen, R. Wnt signalling: conquering complexity. Development 2018, 145. [Google Scholar] [CrossRef]
- Steinhart, Z.; Angers, S. Wnt signaling in development and tissue homeostasis. Development 2018, 145. [Google Scholar] [CrossRef] [PubMed]
- Saito-Diaz, K.; Chen, T.W.; Wang, X.; Thorne, C.A.; Wallace, H.A.; Page-Mccaw, A.; Lee, E. The way Wnt works: components and mechanism. Growth Factors 2013, 31, 1–31. [Google Scholar] [CrossRef]
- Niehrs, C. The complex world of WNT receptor signalling. Nat Rev Mol Cell Biol 2012, 13, 767–779. [Google Scholar] [CrossRef] [PubMed]
- Willert, K.; Nusse, R. Wnt proteins. Cold Spring Harb Perspect Biol 2012, 4, a007864. [Google Scholar] [CrossRef]
- Holstein, T.W. The evolution of the Wnt pathway. Cold Spring Harb Perspect Biol 2012, 4, a007922. [Google Scholar] [CrossRef]
- Clevers, H.; Nusse, R. Wnt/beta-catenin signaling and disease. Cell 2012, 149, 1192–1205. [Google Scholar] [CrossRef] [PubMed]
- Petersen, C.P.; Reddien, P.W. Wnt signaling and the polarity of the primary body axis. Cell 2009, 139, 1056–1068. [Google Scholar] [CrossRef]
- Niklas, K.J.; Newman, S.A. The origins of multicellular organisms. Evol Dev 2013, 15, 41–52. [Google Scholar] [CrossRef]
- Alberts, B.; Johnson, A.; Lewis, J.; Raff, M.; Roberts, K.; Walter, P. Molecular biology of the cell., 5th ed.; Anderson, M., Granum, S., Eds.; Garland Science: New York, 2008; pp. 1315–1316. [Google Scholar]
- Lengfeld, T.; Watanabe, H.; Simakov, O.; Lindgens, D.; Gee, L.; Law, L.; Schmidt, H.A.; Ozbek, S.; Bode, H.; Holstein, T.W. Multiple Wnts are involved in Hydra organizer formation and regeneration. Dev Biol 2009, 330, 186–199. [Google Scholar] [CrossRef]
- Steele, R.E. Developmental signaling in Hydra: what does it take to build a "simple" animal? Dev Biol 2002, 248, 199–219. [Google Scholar] [CrossRef]
- Brooun, M.; Manoukian, A.; Shimizu, H.; Bode, H.R.; Mcneill, H. Organizer formation in Hydra is disrupted by thalidomide treatment. Dev Biol 2013, 378, 51–63. [Google Scholar] [CrossRef] [PubMed]
- Bode, H.R. The head organizer in Hydra. Int J Dev Biol 2012, 56, 473–478. [Google Scholar] [CrossRef] [PubMed]
- Vogg, M.C.; Beccari, L.; Iglesias Olle, L.; Rampon, C.; Vriz, S.; Perruchoud, C.; Wenger, Y.; Galliot, B. An evolutionarily-conserved Wnt3/beta-catenin/Sp5 feedback loop restricts head organizer activity in Hydra. Nat Commun 2019, 10, 312. [Google Scholar] [CrossRef]
- Minobe, S.; Fei, K.; Yan, L.; Sarras, M.P., Jr.; Werle, M.J. Identification and characterization of the epithelial polarity receptor “Frizzled” in Hydra vulgaris. Developmental Genes and Evolution 2000, 210, 258–262. [Google Scholar] [CrossRef] [PubMed]
- Holstein, T.W. Wnt Signaling; Vincan, E. (Eds.) ; 2009; Volume 2.
- Bode, H.R. Head regeneration in Hydra. Dev Dyn 2003, 226, 225–236. [Google Scholar] [CrossRef]
- Vincan, E.; Barker, N. The upstream components of the Wnt signalling pathway in the dynamic EMT and MET associated with colorectal cancer progression. Clin Exp Metastas 2008, 25, 657–663. [Google Scholar] [CrossRef]
- Komiya, Y.; Sato, A.; Habas, R. Characterization of a novel regulator of canonical Wnt signaling. Developmental Biology 2008, 319, 578–578. [Google Scholar] [CrossRef]
- Mercker, M.; Kazarnikov, A.; Tursch, A.; Özbek, S.; Holstein, T.; Marciniak-Czochra, A. How Dickkopf molecules and Wnt/β-catenin interplay to self-organise the Hydra body axis. bioRxiv, 4601; .25. [Google Scholar] [CrossRef]
- Guder, C.; Pinho, S.; Nacak, T.G.; Schmidt, H.A.; Hobmayer, B.; Niehrs, C.; Holstein, T.W. An ancient Wnt-Dickkopf antagonism in Hydra. Development 2006, 133, 901–911. [Google Scholar] [CrossRef]
- Glinka, A.; Wu, W.; Delius, H.; Monaghan, A.P.; Blumenstock, C.; Niehrs, C. Dickkopf-1 is a member of a new family of secreted proteins and functions in head induction. Nature 1998, 391, 357–362. [Google Scholar] [CrossRef]
- Tsiairis, C.; Grosshans, H. Gene expression oscillations in C. elegans underlie a new developmental clock. Curr Top Dev Biol 2021, 144, 19–43. [Google Scholar] [CrossRef]
- Moneer, J.; Siebert, S.; Krebs, S.; Cazet, J.; Prexl, A.; Pan, Q.; Juliano, C.; Bottger, A. Differential gene regulation in DAPT-treated Hydra reveals candidate direct Notch signalling targets. J Cell Sci 2021, 134. [Google Scholar] [CrossRef] [PubMed]
- Endl, I.; Lohmann, J.U.; Bosch, T.C.G. Head-specific gene expression in Hydra: Complexity of DNA–protein interactions at the promoter of ks1 is inversely correlated to the head activation potential. Proc Natl Acad Sci U S A 1999, 96, 1445–1450. [Google Scholar] [CrossRef] [PubMed]
- Lohmann, J.U.; Endl, I.; Bosch, T.C.G. Silencing of Developmental Genes in Hydra. Developmental Biology 1999, 214, 211–214. [Google Scholar] [CrossRef] [PubMed]
- Futterer, C.; Colombo, C.; Julicher, F.; Ott, A. Morphogenetic oscillations during symmetry breaking of regenerating Hydra vulgaris cells. Europhysics Letters 2003, 64, 137–143. [Google Scholar] [CrossRef]
- Soriano, J.; Rudiger, S.; Pullarkat, P.; Ott, A. Mechanogenetic coupling of Hydra symmetry breaking and driven Turing instability model. Biophys J 2009, 96, 1649–1660. [Google Scholar] [CrossRef]
- Kucken, M.; Soriano, J.; Pullarkat, P.A.; Ott, A.; Nicola, E.M. An osmoregulatory basis for shape oscillations in regenerating hydra. Biophys J 2008, 95, 978–985. [Google Scholar] [CrossRef]
- Soriano, J.; Colombo, C.; Ott, A. Hydra molecular network reaches criticality at the symmetry-breaking axis-defining moment. Phys Rev Lett 2006, 97, 258102. [Google Scholar] [CrossRef]
- Chiou, K.; Collins, E.S. Why we need mechanics to understand animal regeneration. Dev Biol 2018, 433, 155–165. [Google Scholar] [CrossRef]
- Chan, C.J.; Hiiragi, T. Integration of luminal pressure and signalling in tissue self-organization. Development 2020, 147. [Google Scholar] [CrossRef]
- Duclut, C.; Prost, J.; Juelicher, F. Hydraulic and electric control of cell spheroids. P Natl Acad Sci USA 2021, 118. [Google Scholar] [CrossRef]
- Ferenc, J.; Papasaikas, P.; Ferralli, J.; Nakamura, Y.; Smallwood, S.; Tsiairis, C.D. Mechanical oscillations orchestrate axial patterning through Wnt activation in. Sci Adv 2021, 7. [Google Scholar] [CrossRef] [PubMed]
- Sawyer, J.M.; Harrell, J.R.; Shemer, G.; Sullivan-Brown, J.; Roh-Johnson, M.; Goldstein, B. Apical constriction: a cell shape change that can drive morphogenesis. Dev Biol 2010, 341, 5–19. [Google Scholar] [CrossRef]
- Martin, A.C.; Kaschube, M.; Wieschaus, E.F. Pulsed contractions of an actin-myosin network drive apical constriction. Nature 2009, 457, 495–499. [Google Scholar] [CrossRef]
- Shindo, A. Models of convergent extension during morphogenesis. Wiley Interdiscip Rev Dev Biol 2018, 7. [Google Scholar] [CrossRef]
- Tang, Y.; Rowe, R.G.; Botvinick, E.L.; Kurup, A.; Putnam, A.J.; Seiki, M.; Weaver, V.M.; Keller, E.T.; Goldstein, S.; Dai, J.; et al. MT1-MMP-dependent control of skeletal stem cell commitment via a beta1-integrin/YAP/TAZ signaling axis. Dev Cell 2013, 25, 402–416. [Google Scholar] [CrossRef] [PubMed]
- Dupont, S.; Morsut, L.; Aragona, M.; Enzo, E.; Giulitti, S.; Cordenonsi, M.; Zanconato, F.; Le Digabel, J.; Forcato, M.; Bicciato, S.; et al. Role of YAP/TAZ in mechanotransduction. Nature 2011, 474, 179–183. [Google Scholar] [CrossRef]
- Tizon-Escamilla, N.; Perez-Espigares, C.; Garrido, P.L.; Hurtado, P.I. Order and Symmetry Breaking in the Fluctuations of Driven Systems. Phys Rev Lett 2017, 119, 090602. [Google Scholar] [CrossRef]
- Crawford, J.D. Introduction to bifurcation theory. Reviews of Modern Physics 1991, 63, 991–1037. [Google Scholar] [CrossRef]
- Gaeta, G. Bifurcation and symmetry breaking. Physics Reports 1990, 189, 1–87. [Google Scholar] [CrossRef]
- Sornette, D. ; Springerlink Critical phenomena in natural sciences : chaos, fractals, selforganization, and disorder : concepts and tools, 2nd; Springer: Berlin, 2006. [Google Scholar]
- Mandelbrot, B. How Long Is the Coast of Britain? Statistical Self-Similarity and Fractional Dimension. Science 1966, 156, 363–365. [Google Scholar] [CrossRef]
- Jensen, H.J. Self-organized criticality : emergent complex behavior in physical and biological systems; Cambridge University Press: Cambridge ; New York, 1998; pp. xiii, 153 p.
- Kenkel, N.C.; Walker, D.J. Fractals in the Biological Sciences. COENOSES 1996, 11, 77–100. [Google Scholar]
- Losa, G.A. Fractals in Biology and Medicine. In Meyers: Encyclopedia of Molecular Cell Biology and Molecular Medicine: Systems Biology, Second Edition ed.; Meyers, R.A., Ed.; 2011.
- Glenny, R.W.; Lamm, W.J.E.; Albert, R.K.; Robertson, H.T. 1991; 71. [CrossRef]
- Sugihara, G.; May, R.M. 1990. [CrossRef]
- Thamrin, C.; Stern, G.; Frey, U. Fractals for physicians. Paediatr Respir Rev 2010, 11, 123–131. [Google Scholar] [CrossRef]
- Captur, G.; Karperien, A.L.; Hughes, A.D.; Francis, D.P.; Moon, J.C. The fractal heart - embracing mathematics in the cardiology clinic. Nat Rev Cardiol 2017, 14, 56–64. [Google Scholar] [CrossRef]
- Lennon, F.E.; Cianci, G.C.; Cipriani, N.A.; Hensing, T.A.; Zhang, H.J.; Chen, C.T.; Murgu, S.D.; Vokes, E.E.; Vannier, M.W.; Salgia, R. Lung cancer-a fractal viewpoint. Nat Rev Clin Oncol 2015, 12, 664–675. [Google Scholar] [CrossRef]
- Todoroff, N.; Kunze, J.; Schreuder, H.; Hessler, G.; Baringhaus, K.H.; Schneider, G. Fractal Dimensions of Macromolecular Structures. Mol Inform 2014, 33, 588–596. [Google Scholar] [CrossRef] [PubMed]
- Di Ieva, A.; Grizzi, F.; Jelinek, H.; Pellionisz, A.J.; Losa, G.A. Fractals in the Neurosciences, Part I: General Principles and Basic Neurosciences. Neuroscientist 2014, 20, 403–417. [Google Scholar] [CrossRef]
- Marcelino, L.A.; Westneat, M.W.; Stoyneva, V.; Henss, J.; Rogers, J.D.; Radosevich, A.; Turzhitsky, V.; Siple, M.; Fang, A.; Swain, T.D.; et al. Modulation of light-enhancement to symbiotic algae by light-scattering in corals and evolutionary trends in bleaching. PLoS One 2013, 8, e61492. [Google Scholar] [CrossRef]
- Burlando, B.; Cattaneo-Vietti, R.; Parodi, R.; Scardi, M. Emerging Fractal Properties in Gorgonian Growth Forms (Cnidaria: Octocorallia). Growth, Development & Aging 1991, 55, 161–168. [Google Scholar]
- Manoel, E.T.M.; Costa, L.D.F.; Streicher, J.; Müller, G.B. Multiscale Fractal Characterization of Three-Dimensional Gene Expression Data. Proceedings of the XV Brazilian Symposium on Computer Graphics and Image Processing 2002. [Google Scholar] [CrossRef]
- Ghorbani, M.; Jonckheere, E.A.; Bogdan, P. Gene Expression Is Not Random: Scaling, Long-Range Cross-Dependence, and Fractal Characteristics of Gene Regulatory Networks. Frontiers in Physiology 2018, 9, 1446–1457. [Google Scholar] [CrossRef]
- Waliszewski, K. On the relationship between fractal geometry of space and time in which a system of interacting cells exists and dynamics of gene expression. Acta Biochimica Polonica 2001, 48, 209–220. [Google Scholar] [CrossRef]
- Aschwanden, M.J.; Aschwanden, P.D. Solar Flare Geometries. I. The Area Fractal Dimension. The Astrophysical Journal 2008, 674, 530–543. [Google Scholar] [CrossRef]
- Michelson, A.M.; Kopan, R. Differentiation and gene regulation Toward a holistic understanding of animal development: intercellular communication and transcriptional regulation are two sides of the same coin. Current Opinion in Genetics & Development 2002, 12, 499–502. [Google Scholar] [CrossRef]
- Schier, A.F.; Needleman, D. Rise of the source–sink model. Nature 2009, 461, 480–481. [Google Scholar] [CrossRef]
- Klotz, L.O.; Giehl, K. Special Issue: cell-cell communication in development and disease. Arch Biochem Biophys 2012, 524, 1. [Google Scholar] [CrossRef] [PubMed]
- Maduro, M.F. Cell fate specification in the C. elegans embryo. Dev Dyn 2010, 239, 1315–1329. [Google Scholar] [CrossRef] [PubMed]
- Van Amerongen, R.; Nusse, R. Towards an integrated view of Wnt signaling in development. Development 2009, 136, 3205–3214. [Google Scholar] [CrossRef]
- Jiang, J.; Hui, C.C. Hedgehog signaling in development and cancer. Dev Cell 2008, 15, 801–812. [Google Scholar] [CrossRef]
- Bolos, V.; Grego-Bessa, J.; De La Pompa, J.L. Notch signaling in development and cancer. Endocr Rev 2007, 28, 339–363. [Google Scholar] [CrossRef]
- Van Norman, J.M.; Breakfield, N.W.; Benfey, P.N. Intercellular communication during plant development. Plant Cell 2011, 23, 855–864. [Google Scholar] [CrossRef]
- Lau, S.; Ehrismann, J.S.; Schlereth, A.; Takada, S.; Mayer, U.; Jurgens, G. Cell-cell communication in Arabidopsis early embryogenesis. Eur J Cell Biol 2010, 89, 225–230. [Google Scholar] [CrossRef] [PubMed]
- Van Themsche, C.; Chaudhry, P.; Leblanc, V.; Parent, S.; Asselin, E. XIAP gene expression and function is regulated by autocrine and paracrine TGF-beta signaling. Mol Cancer 2010, 9, 216. [Google Scholar] [CrossRef] [PubMed]
- Freitas, B.C.; Gereben, B.; Castillo, M.; Kallo, I.; Zeold, A.; Egri, P.; Liposits, Z.; Zavacki, A.M.; Maciel, R.M.; Jo, S.; et al. Paracrine signaling by glial cell-derived triiodothyronine activates neuronal gene expression in the rodent brain and human cells. J Clin Invest 2010, 120, 2206–2217. [Google Scholar] [CrossRef]
- Maeda, S.; Nakagawa, S.; Suga, M.; Yamashita, E.; Oshima, A.; Fujiyoshi, Y.; Tsukihara, T. Structure of the connexin 26 gap junction channel at 3.5 A resolution. Nature 2009, 458, 597–602. [Google Scholar] [CrossRef]
- Mese, G.; Richard, G.; White, T.W. Gap junctions: basic structure and function. J Invest Dermatol 2007, 127, 2516–2524. [Google Scholar] [CrossRef]
- Wei, C.J.; Xu, X.; Lo, C.W. Connexins and cell signaling in development and disease. Annu Rev Cell Dev Biol 2004, 20, 811–838. [Google Scholar] [CrossRef]
- Fraser, S.E.; Green, C.R.; Bode, H.R.; Gilula, N.B. Selective Disruption of Gap Junctional Communication Interferes with a Patterning Process in Hydra. Science 1987, 237, 49–52. [Google Scholar] [CrossRef] [PubMed]
- Roth, G.; Misailidis, G.; Pappa, M.; Ferralli, J.; Tsiairis, C.D. Unidirectional and phase-gated signaling synchronizes murine presomitic mesoderm cells. Dev Cell 2023, 58, 967–980. [Google Scholar] [CrossRef]
- Zinani, O.Q.H.; Keseroglu, K.; Ozbudak, E.M. Regulatory mechanisms ensuring coordinated expression of functionally related genes. Trends Genet 2022, 38, 73–81. [Google Scholar] [CrossRef]
- Winkelmann, D.A.; Bourdieu, L.; Ott, A.; Kinose, F.; Libchaber, A. Flexibility of myosin attachment to surfaces influences F-actin motion. Biophys J 1995, 68, 2444–2453. [Google Scholar] [CrossRef]
- Gillooly, J.F.; Charnov, E.L.; West, G.B.; Savage, V.M.; Brown, J.H. Effects of size and temperature on developmental time. Nature 2002, 417, 70–73. [Google Scholar] [CrossRef] [PubMed]
- Seybold, A.; Salvenmoser, W.; Hobmayer, B. Sequential development of apical-basal and planar polarities in aggregating epitheliomuscular cells of Hydra. Dev Biol 2016, 412, 148–159. [Google Scholar] [CrossRef]
- Maroudas-Sacks, Y.; Garion, L.; Suganthan, S.; Popović, M.; Keren, K. Confinement Modulates Axial Patterning in Regenerating Hydra. PRX Life 2024, 2. [Google Scholar] [CrossRef]
- Ravichandran, Y.; Vogg, M.; Kruse, K.; Pearce, D.J.G.; Roux, A. Topology changes of Hydra define actin orientation defects as organizers of morphogenesis. Sci Adv 2025, 11, eadr9855. [Google Scholar] [CrossRef]
- Liang, T.; Li, B. Mechanotransduction in distinct F-actin architectures: a novel molecular tension sensor revealing cellular mechanical anisotropy. Mechanobiology in Medicine 2024, 2. [Google Scholar] [CrossRef]
- Maroudas-Sacks, Y.; Suganthan, S.; Garion, L.; Ascoli-Abbina, Y.; Westfried, A.; Dori, N.; Pasvinter, I.; Popovic, M.; Keren, K. Mechanical strain focusing at topological defect sites in regenerating. Development 2025, 152. [Google Scholar] [CrossRef]
- Waterman-Storer, C.M.; Salmon, E.D. Positive feedback interactions between microtubule and actin dynamics during cell motility. Curr Opin Cell Biol 1999, 11, 61–67. [Google Scholar] [CrossRef] [PubMed]
- Etienne-Manneville, S. Actin and microtubules in cell motility: Which one is in control? Traffic 2004, 5, 470–477. [Google Scholar] [CrossRef]
- Zumbrunn, J.; Kinoshita, K.; Hyman, A.A.; Näthke, I.S. Binding of the adenomatous polyposis coli protein to microtubules increases microtubule stability and is regulated by GSK3 beta phosphorylation. Current Biology 2001, 11, 44–49. [Google Scholar] [CrossRef]
- Zhou, F.Q.; Zhou, J.; Dedhar, S.; Wu, Y.H.; Snider, W.D. NGF-induced axon growth is mediated by localized inactivation of GSK-3beta and functions of the microtubule plus end binding protein APC. Neuron 2004, 42, 897–912. [Google Scholar] [CrossRef]
- Booth, A.J.R.; Blanchard, G.B.; Adams, R.J.; Roper, K. A dynamic microtubule cytoskeleton directs medial actomyosin function during tube formation. Dev Cell 2014, 29, 562–576. [Google Scholar] [CrossRef] [PubMed]
- Kwan, K.M.; Kirschner, M.W. A microtubule-binding Rho-GEF controls cell morphology during convergent extension of Xenopus laevis. Development 2005, 132, 4599–4610. [Google Scholar] [CrossRef]
- Jesuthasan, S.; Strahle, U. Dynamic microtubules and specification of the zebrafish embryonic axis. Current Biology 1997, 7, 31–42. [Google Scholar] [CrossRef]
- Sander, H.; Pasula, A.; Sander, M.; Giri, V.; Terriac, E.; Lautenschlaeger, F.; Ott, A. Symmetry breaking and de-novo axis formation in hydra spheroids: the microtubule cytoskeleton as a pivotal element. bioRxiv, 2001. [Google Scholar] [CrossRef]
- Weevers, S.L.; Falconer, A.D.; Mercker, M.; Sadeghi, H.; Ferenc, J.; Ott, A.; Oelz, D.B.; Marciniak-Czochra, A.; Tsiairis, C.D. Mechanochemical Patterning Localizes the Organizer of a Luminal Epithelium. bioRxiv, 6208; .41. [Google Scholar] [CrossRef]
- Bailles, A.; Serafini, G.; Andreas, H.; Zechner, C.; Modes, C.; Tomancak, P. Anisotropic stretch biases the self-organization of actin fibers in multicellular Hydra aggregates. bioRxiv, 6162; .20. [Google Scholar] [CrossRef]
- Dyson, F. A meeting with Enrico Fermi. Nature 2004, 427, 297. [Google Scholar] [CrossRef] [PubMed]
- Technau, U.; Cramer Von Laue, C.; Rentzsch, F.; Luft, S.; Hobmayer, B.; Bode, H.R.; Holstein, T.W. Parameters of self-organization in Hydra aggregates. Proc Natl Acad Sci U S A 2000, 97, 12127–12131. [Google Scholar] [CrossRef]
- Narayanaswamy, S.; Technau, U. Self-organization of an organizer: Whole-body regeneration from reaggregated cells in cnidarians. Cells Dev 2025, 204024. [Google Scholar] [CrossRef] [PubMed]
- Bancaud, A.; Lavelle, C.; Huet, S.; Ellenberg, J. A fractal model for nuclear organization: current evidence and biological implications. Nucleic Acids Res 2012, 40, 8783–8792. [Google Scholar] [CrossRef]
- Florindo, J.B.; Bruno, O.M. Closed contour fractal dimension estimation by the Fourier transform. Chaos Soliton Fract 2011, 44, 851–861. [Google Scholar] [CrossRef]
Figure 1.
(a) Adult Hydra vulgaris. (b) Sketch of the regeneration procedure. A ring is cut out of the middle of an adult, non-budding Hydra. The ring is cut into 4 pieces of equal size. These fragments of tissue close and form a hollow spheroid. The spheroid defines an axis first to form a complete animal of reduced size following the chosen direction. Reprinted from Soriano, et al. [103].
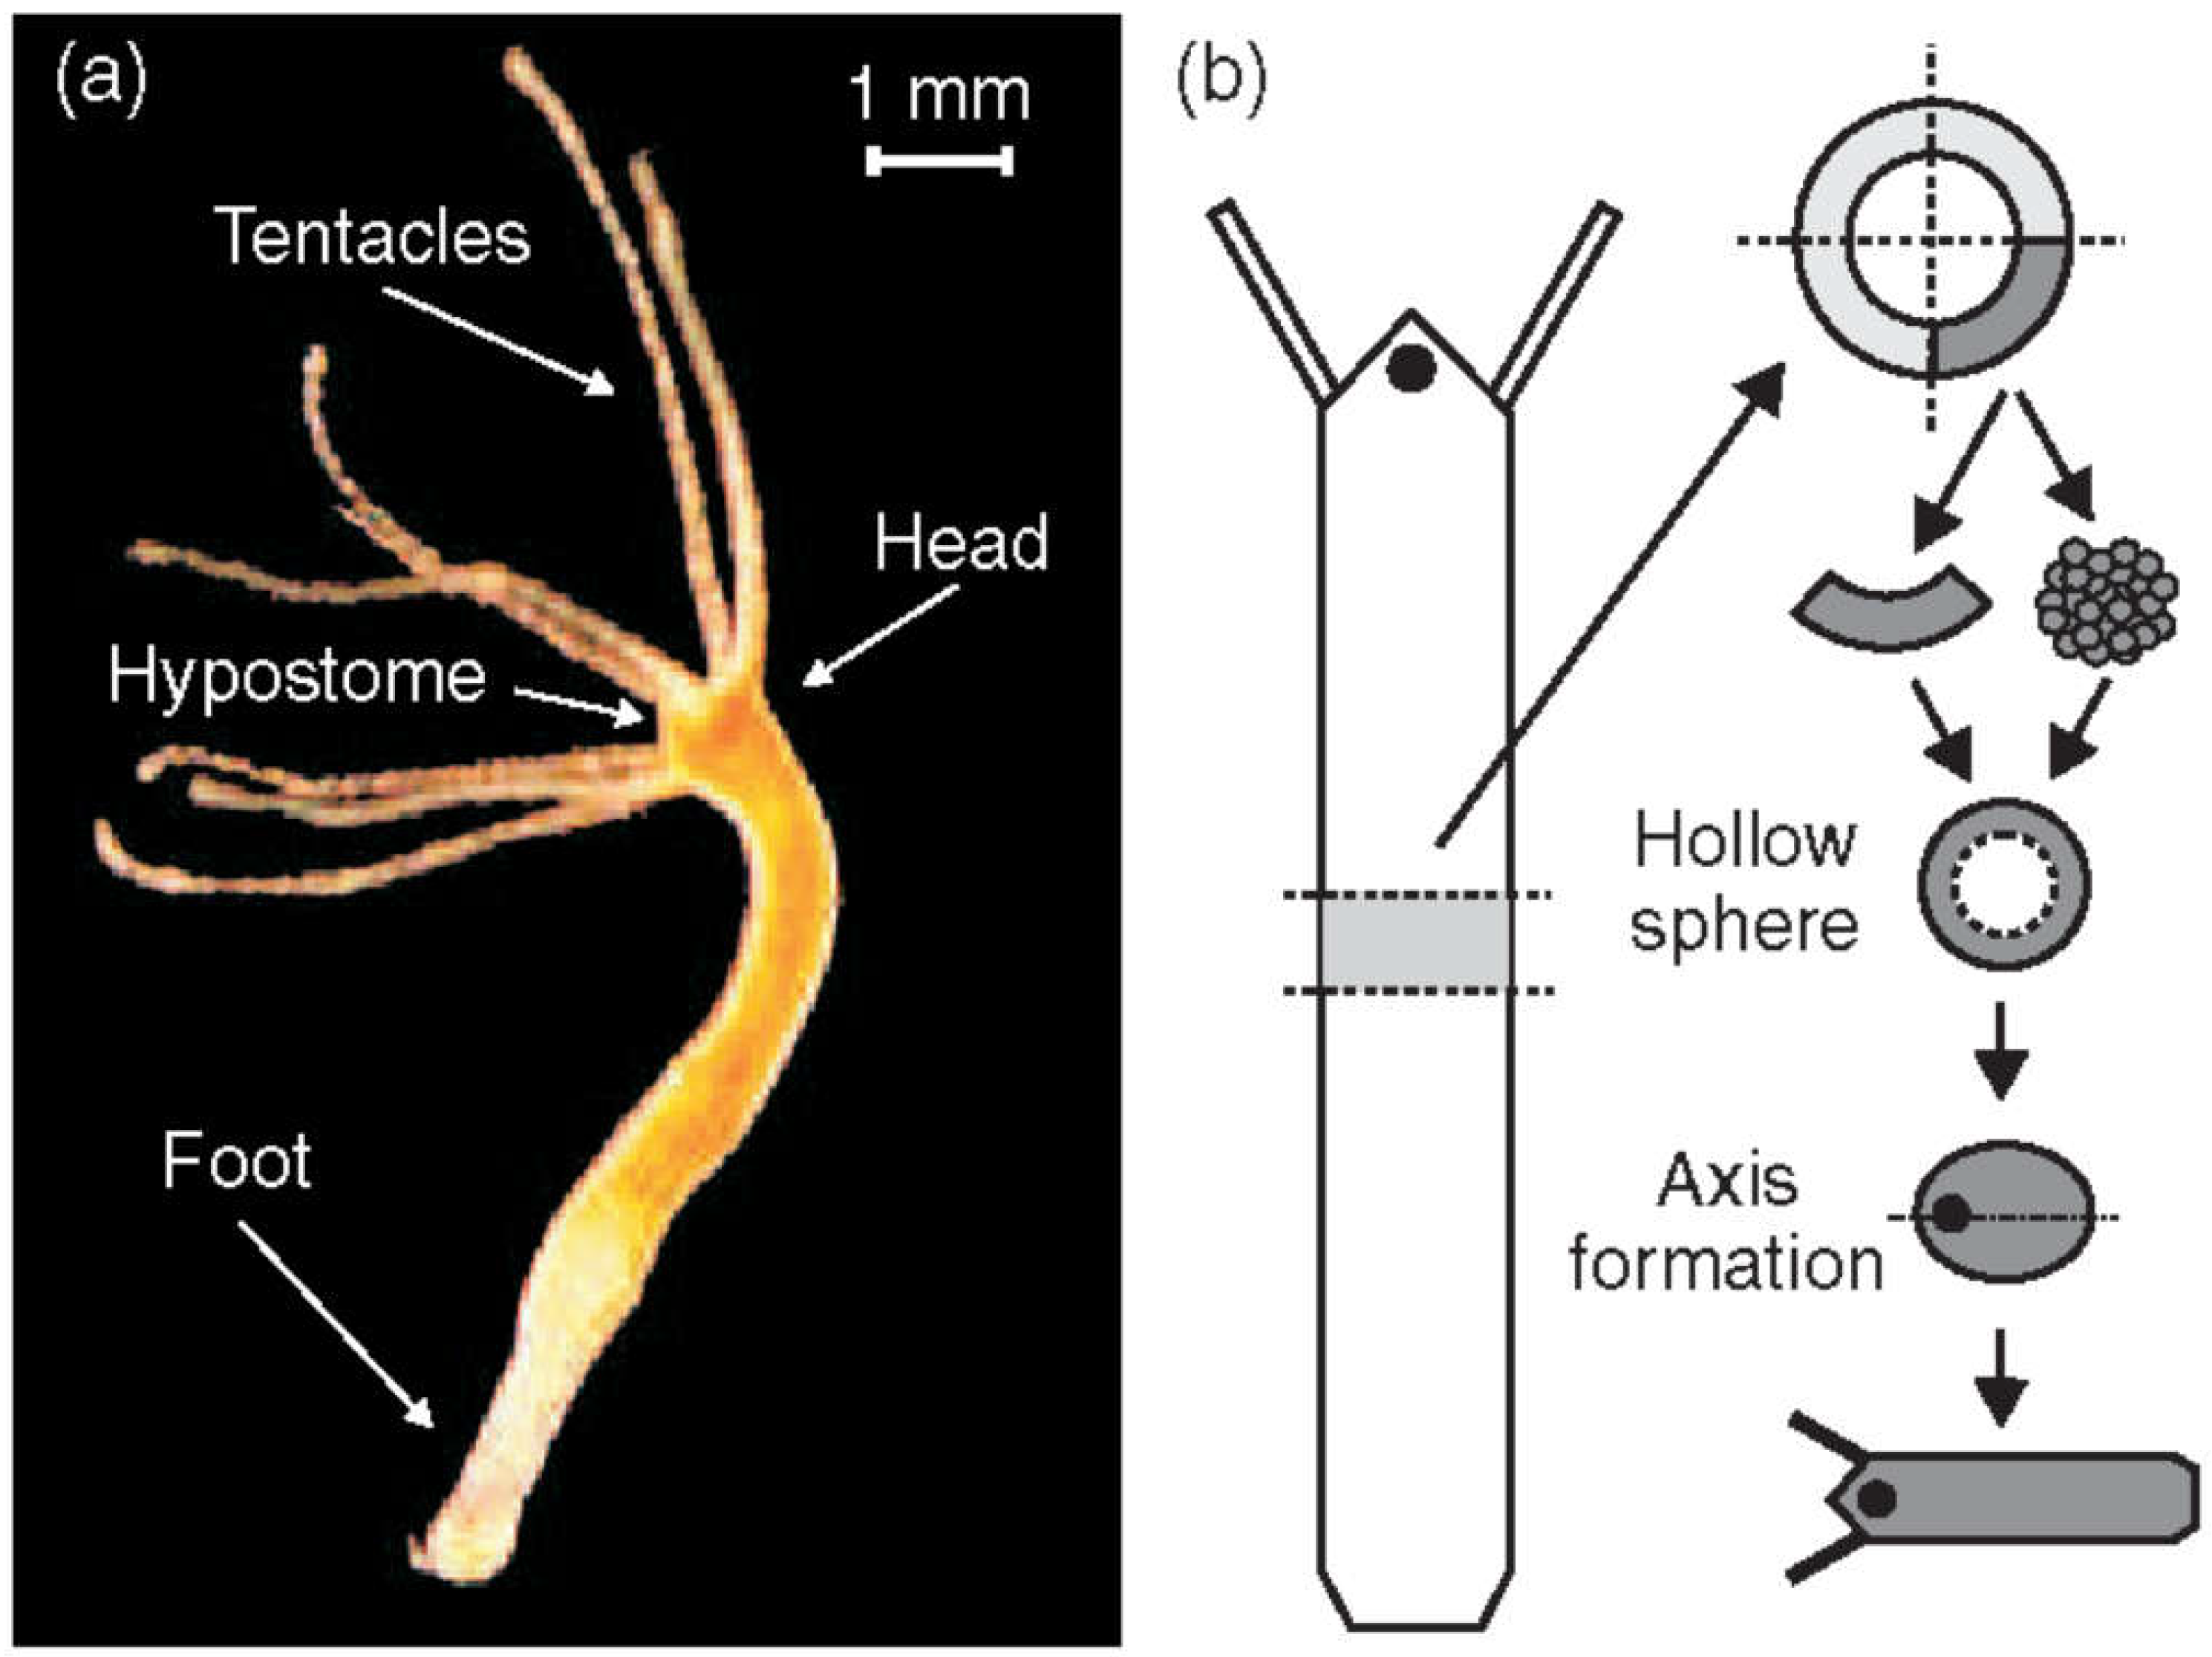
Figure 2.
(a) Mechanical oscillations during Hydra regeneration of a spheroid. Volume as a function of observation time with pictures taken at time points as identified. We call phase I the high amplitude, low frequency inflation-burst cycles, the following low amplitude and high frequency oscillations phase II (b) Temporal evolution of shape deformation modes by Fourier transform during Hydra spheroid regeneration. The 0th mode represents isotropic size changes (the average radius), while higher modes (2nd and 3rd) capture anisotropic deformations as shown. Green arrows mark instants where the second mode increases as a result of sudden pressure release; red arrows mark instants where the second mode decreases as a result of pressure release. It can be easily spotted that in phase II the 0th and the 2nd mode go increasingly in sync. Note that the behavior following the green arrows corresponds to elastic isotropy of the tissue while the behavior of the red arrows corresponds to elastic anisotropy (the spheroid becomes more oblong upon inflation). We understand that after early mouth formation the tissue changes its elastic properties following an axis that has been set.
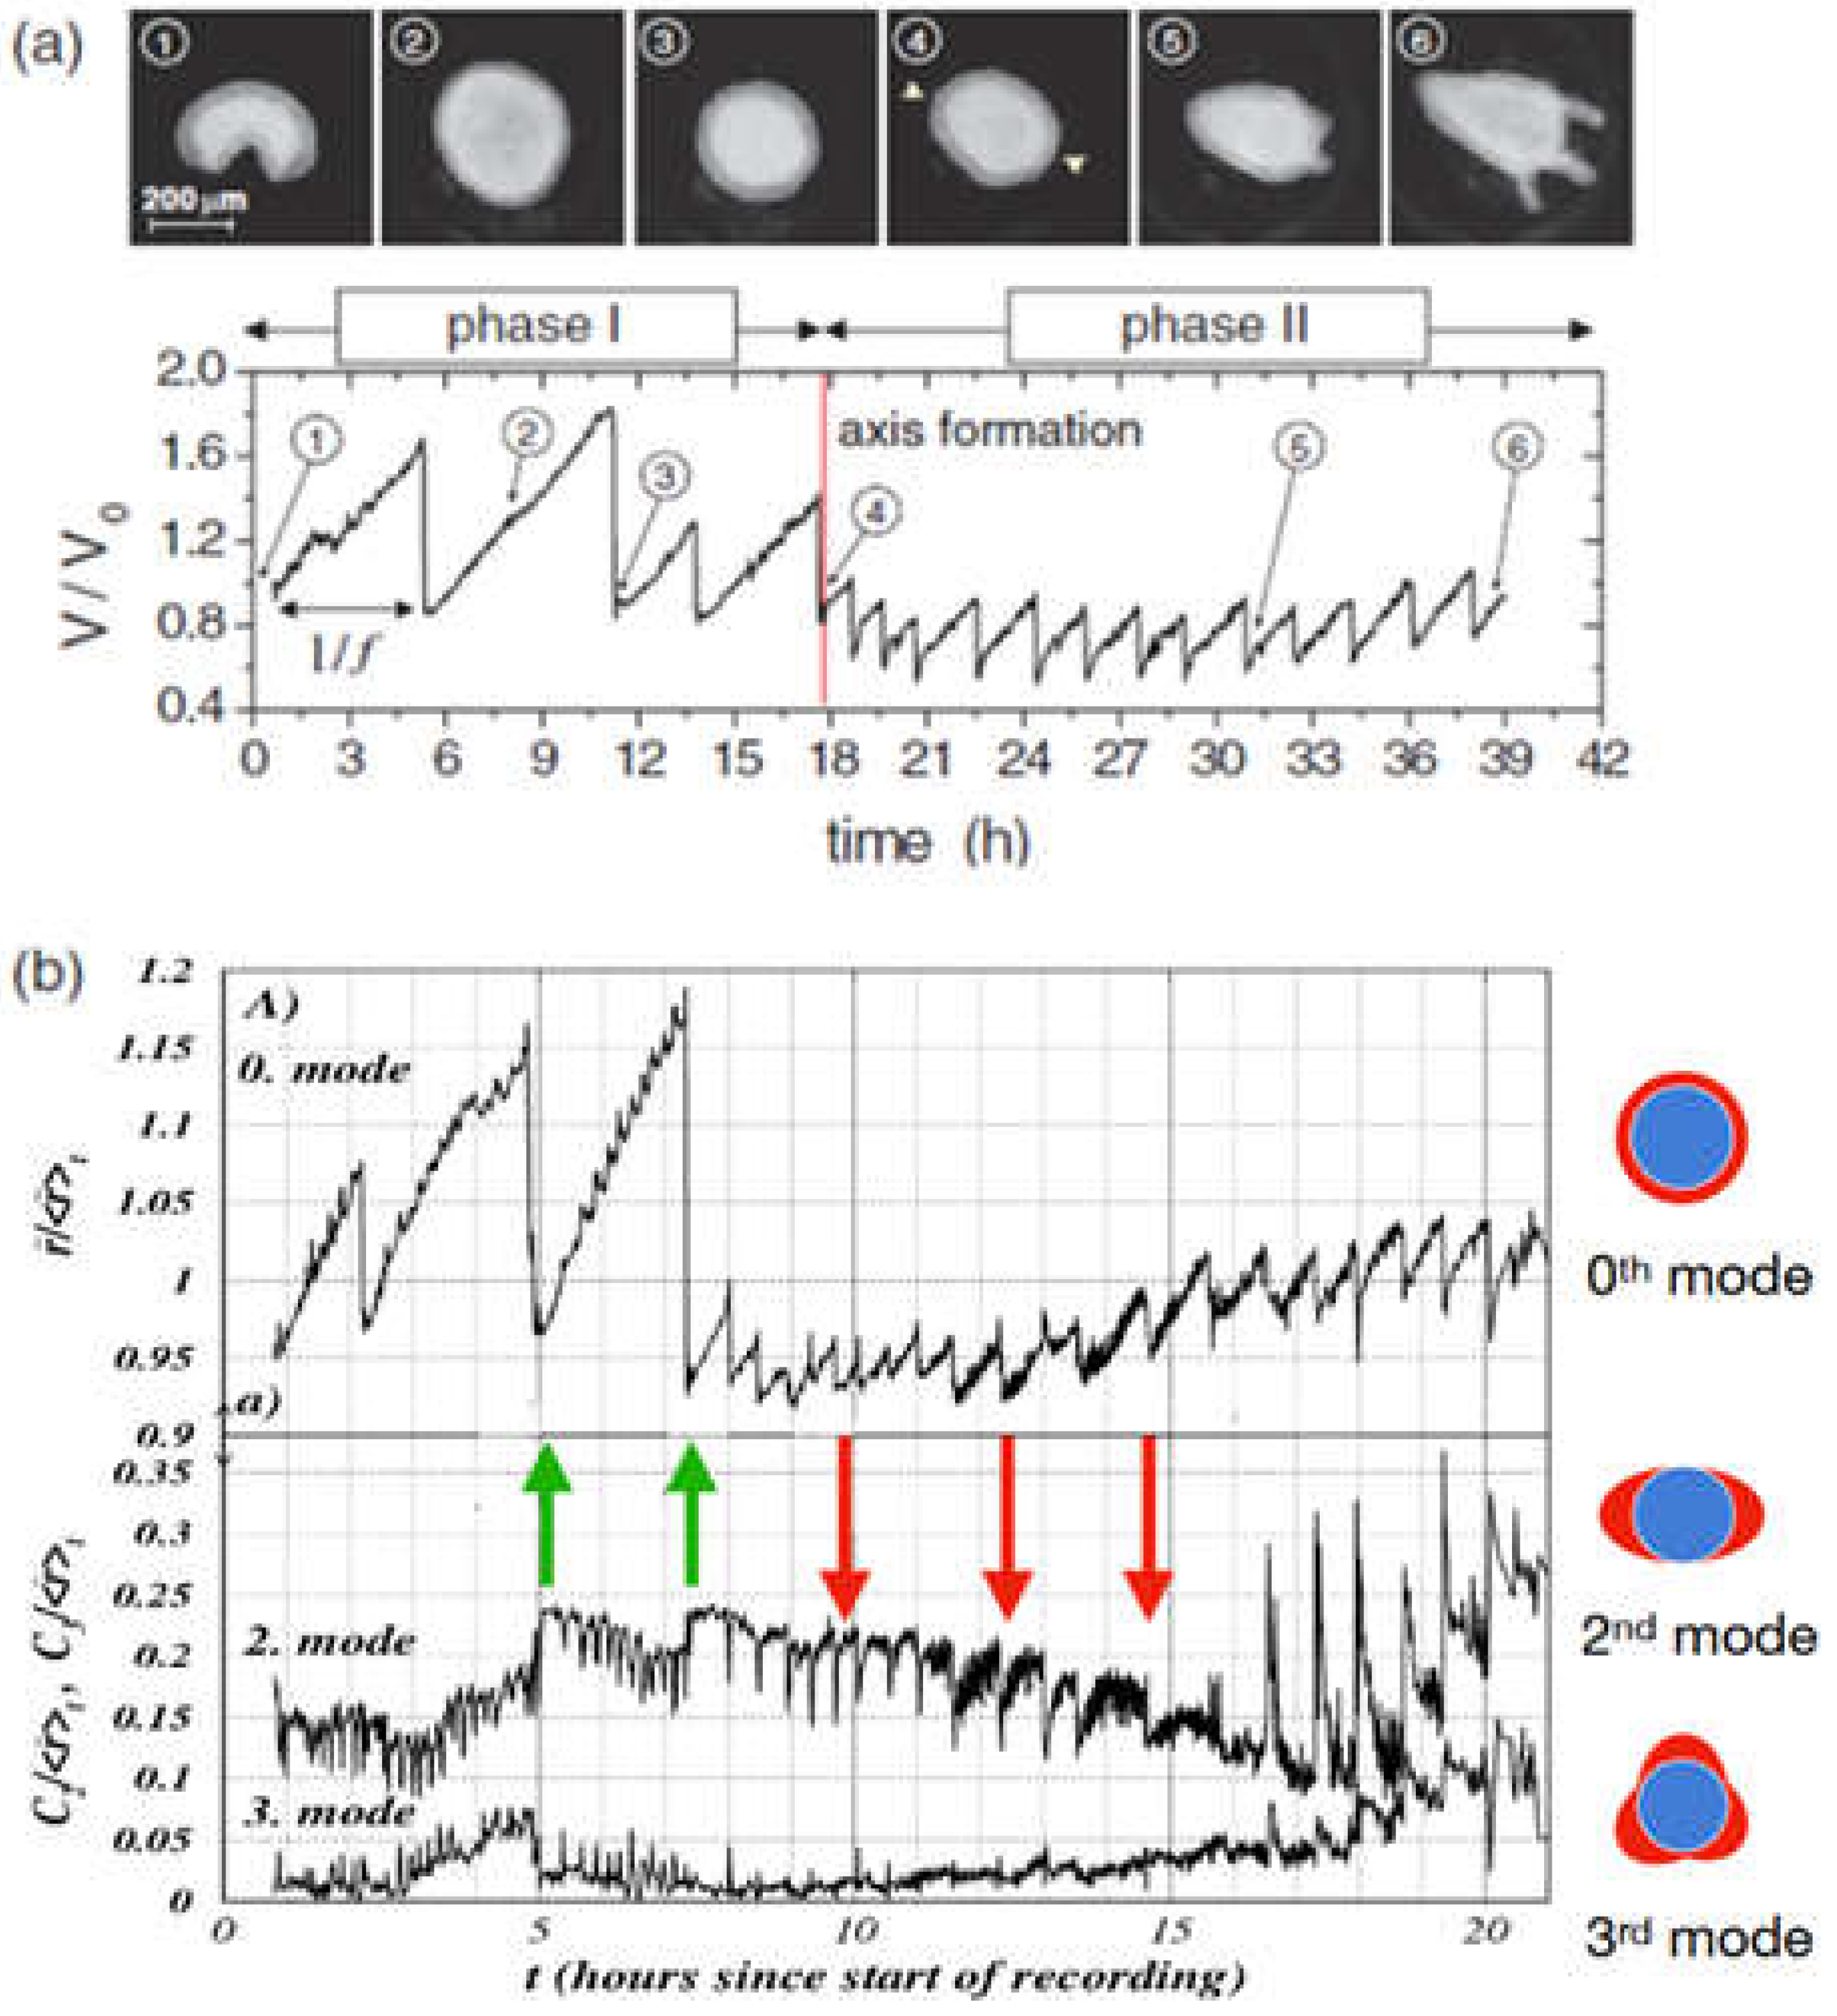
Figure 3.
Angular distribution of the Hydra head orientation with respect to the direction of a temperature gradient. The temperature difference ΔT across the spheroid is an estimation from the temperature set on the sapphire plates and the distance between them. Reprinted from Soriano, et al. [103].
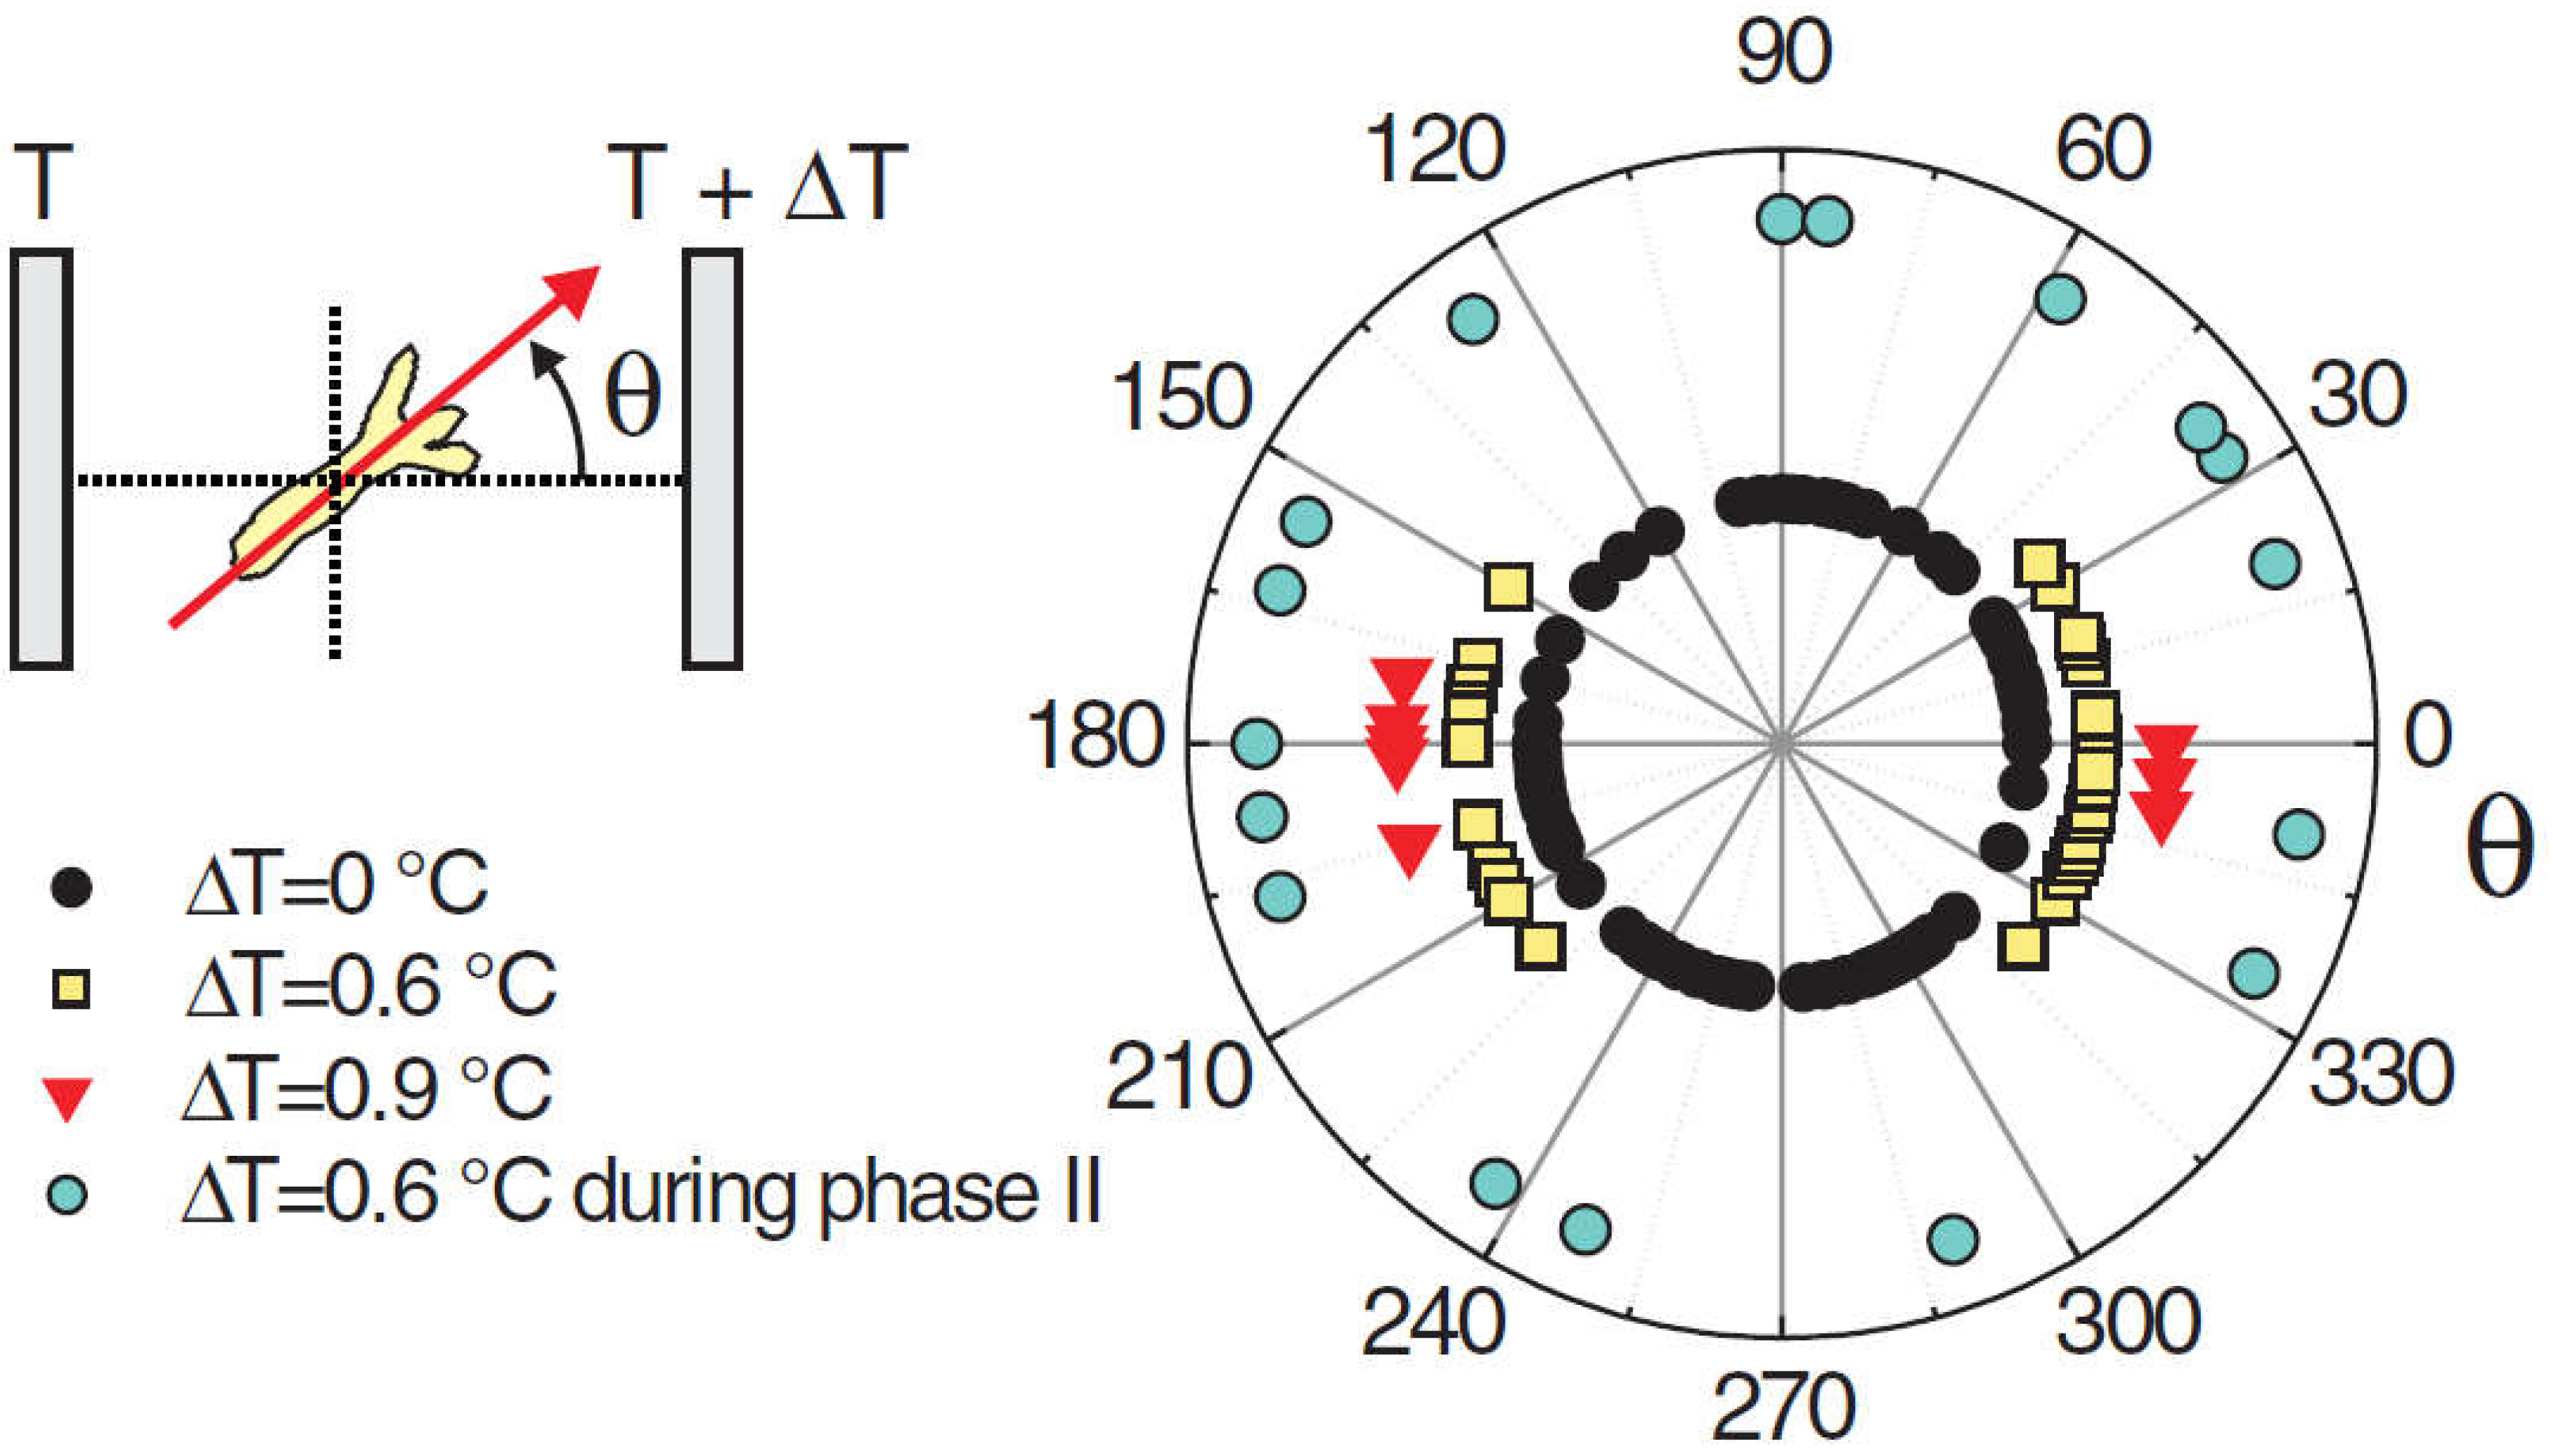
Figure 4.
The Romanesco broccoli, a natural approximation of a fractal. Reprinted from Bancaud, et al. [171].
Figure 4.
The Romanesco broccoli, a natural approximation of a fractal. Reprinted from Bancaud, et al. [171].
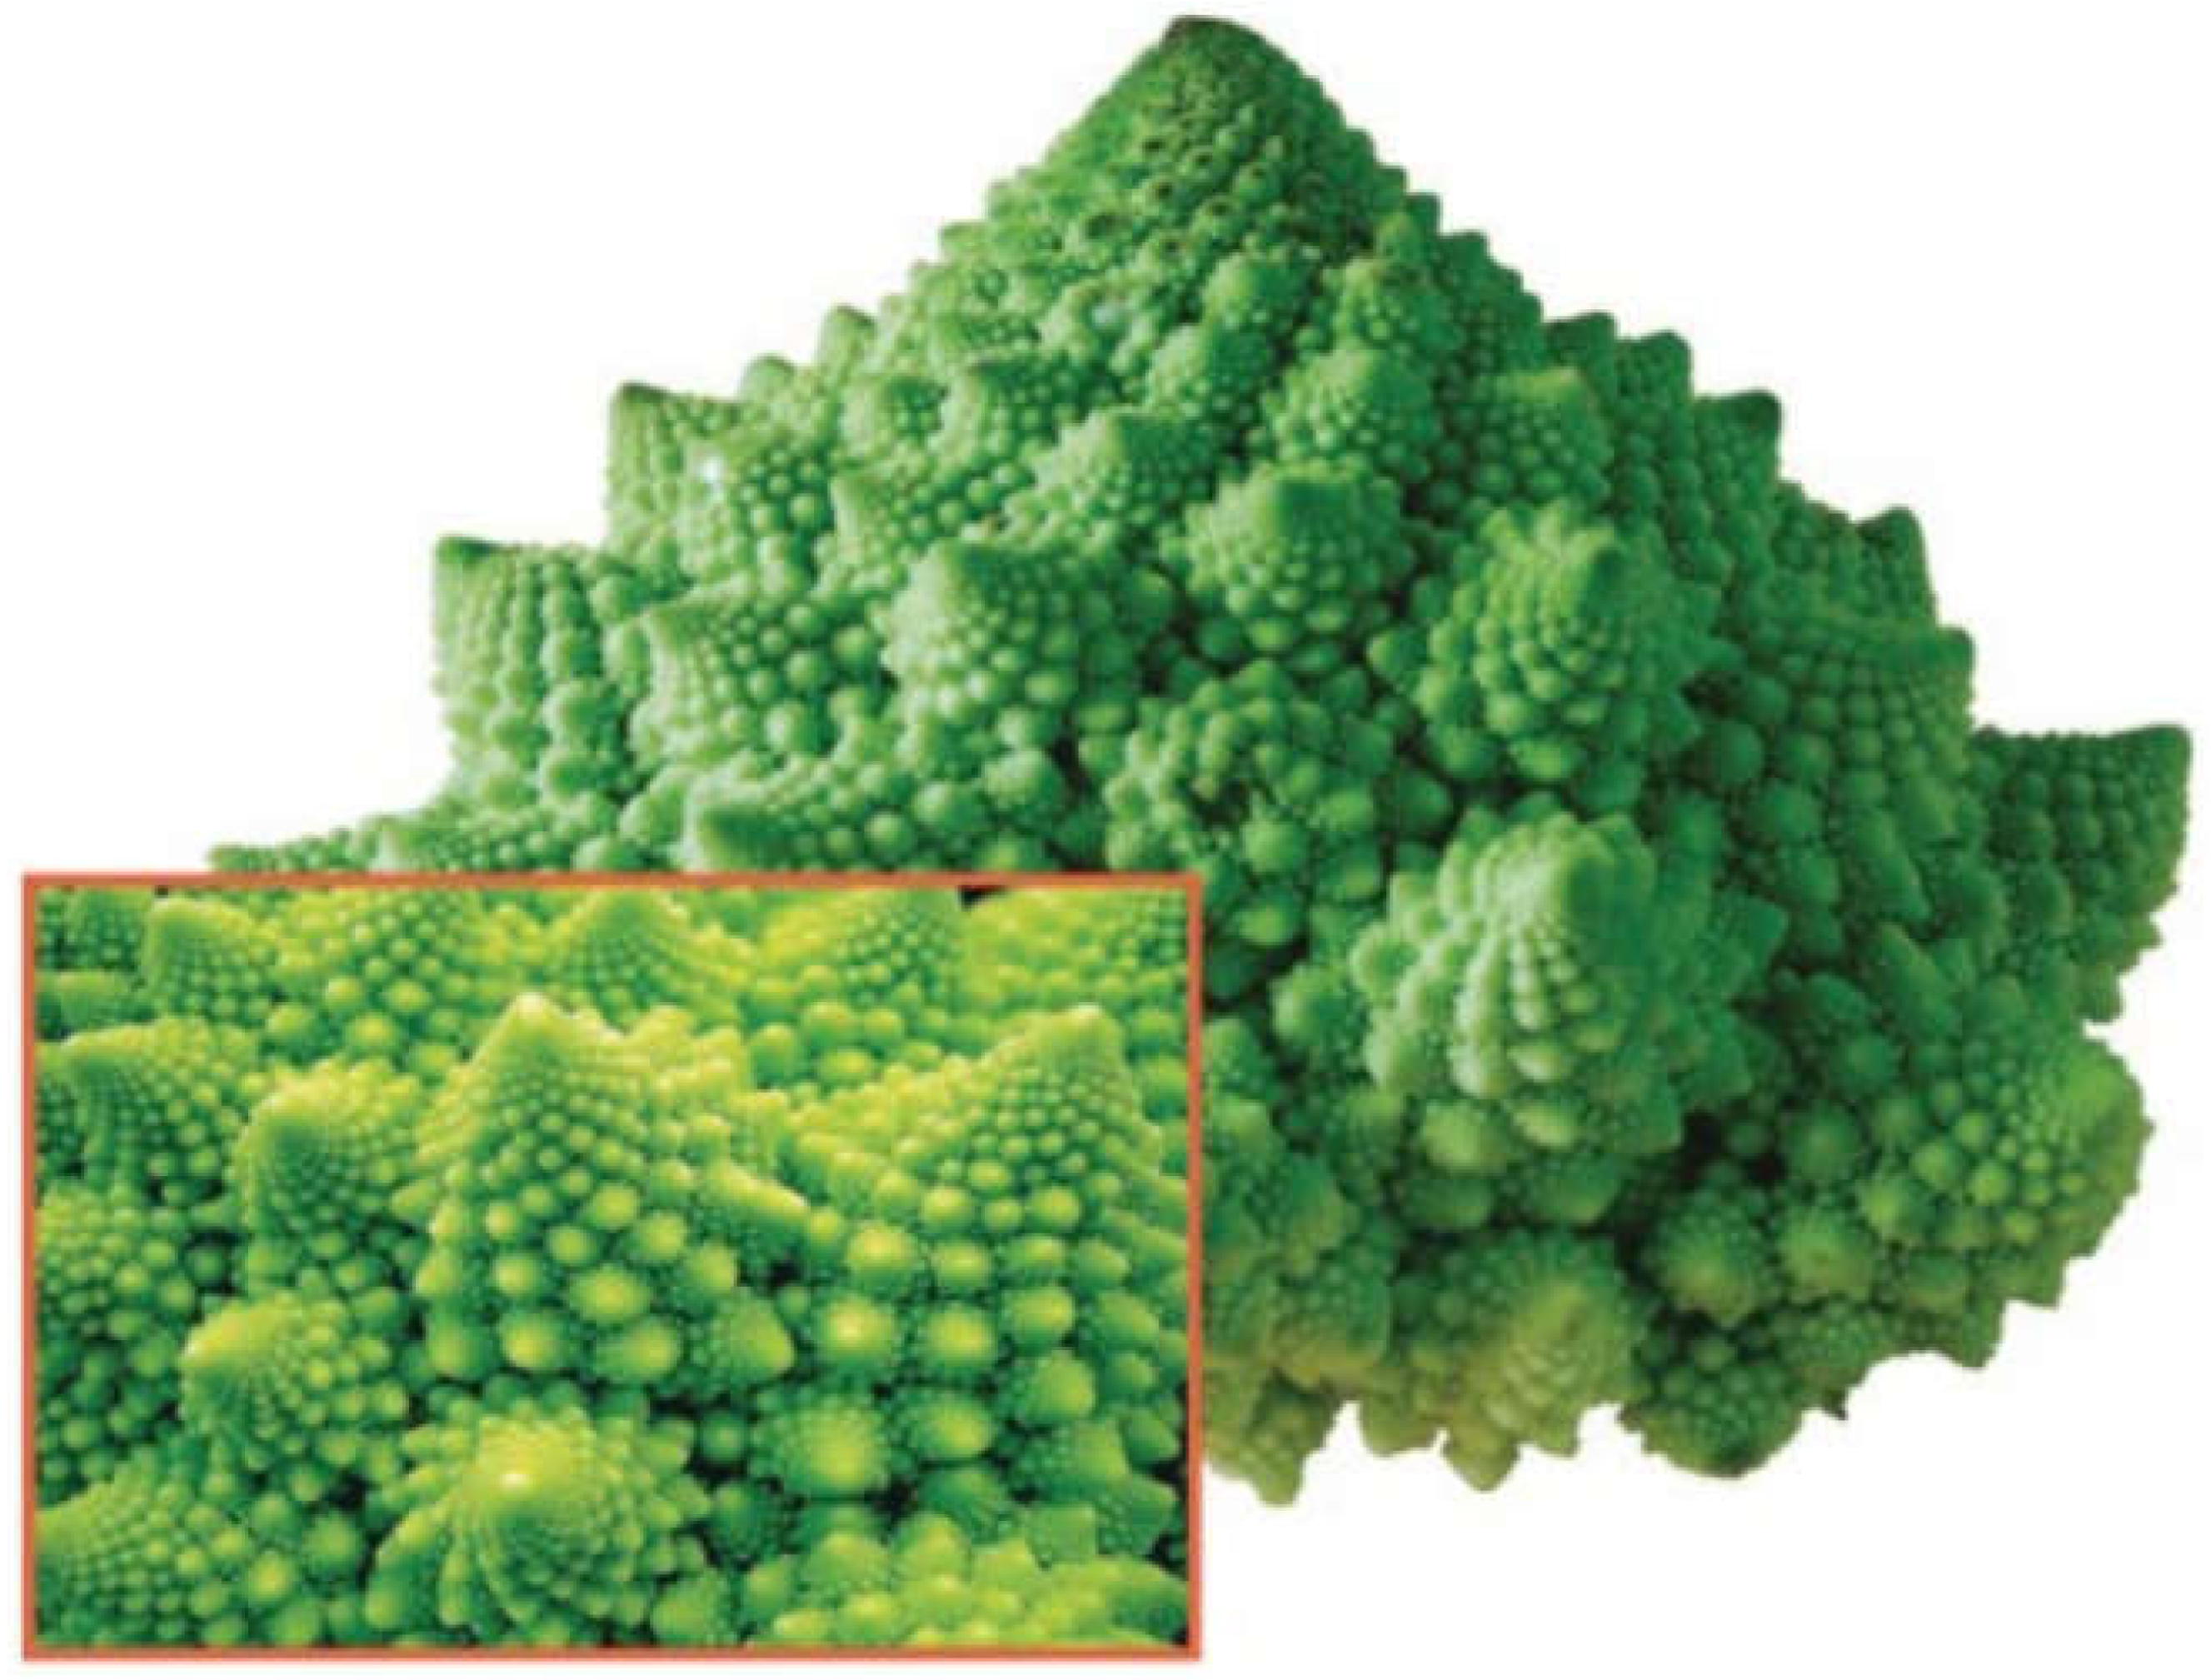
Figure 5.
Box-counting method for the calculation of perimeter fractal dimension. Boxes decrease in size by a factor of two between neighboring images (from left to right). A straight vertical line would require a proportional increase in box number (4, 8 and 16), leading to a fractal dimension of one. However, the irregular perimeter here requires 12,32,72 boxes respectively, indicating a deviation from linear scaling. If we obtain a straight line on a log-log plot (of the number of boxes as a function of grid size), fractal dimension is given by its slope. Reprinted from Florindo and Bruno [172].
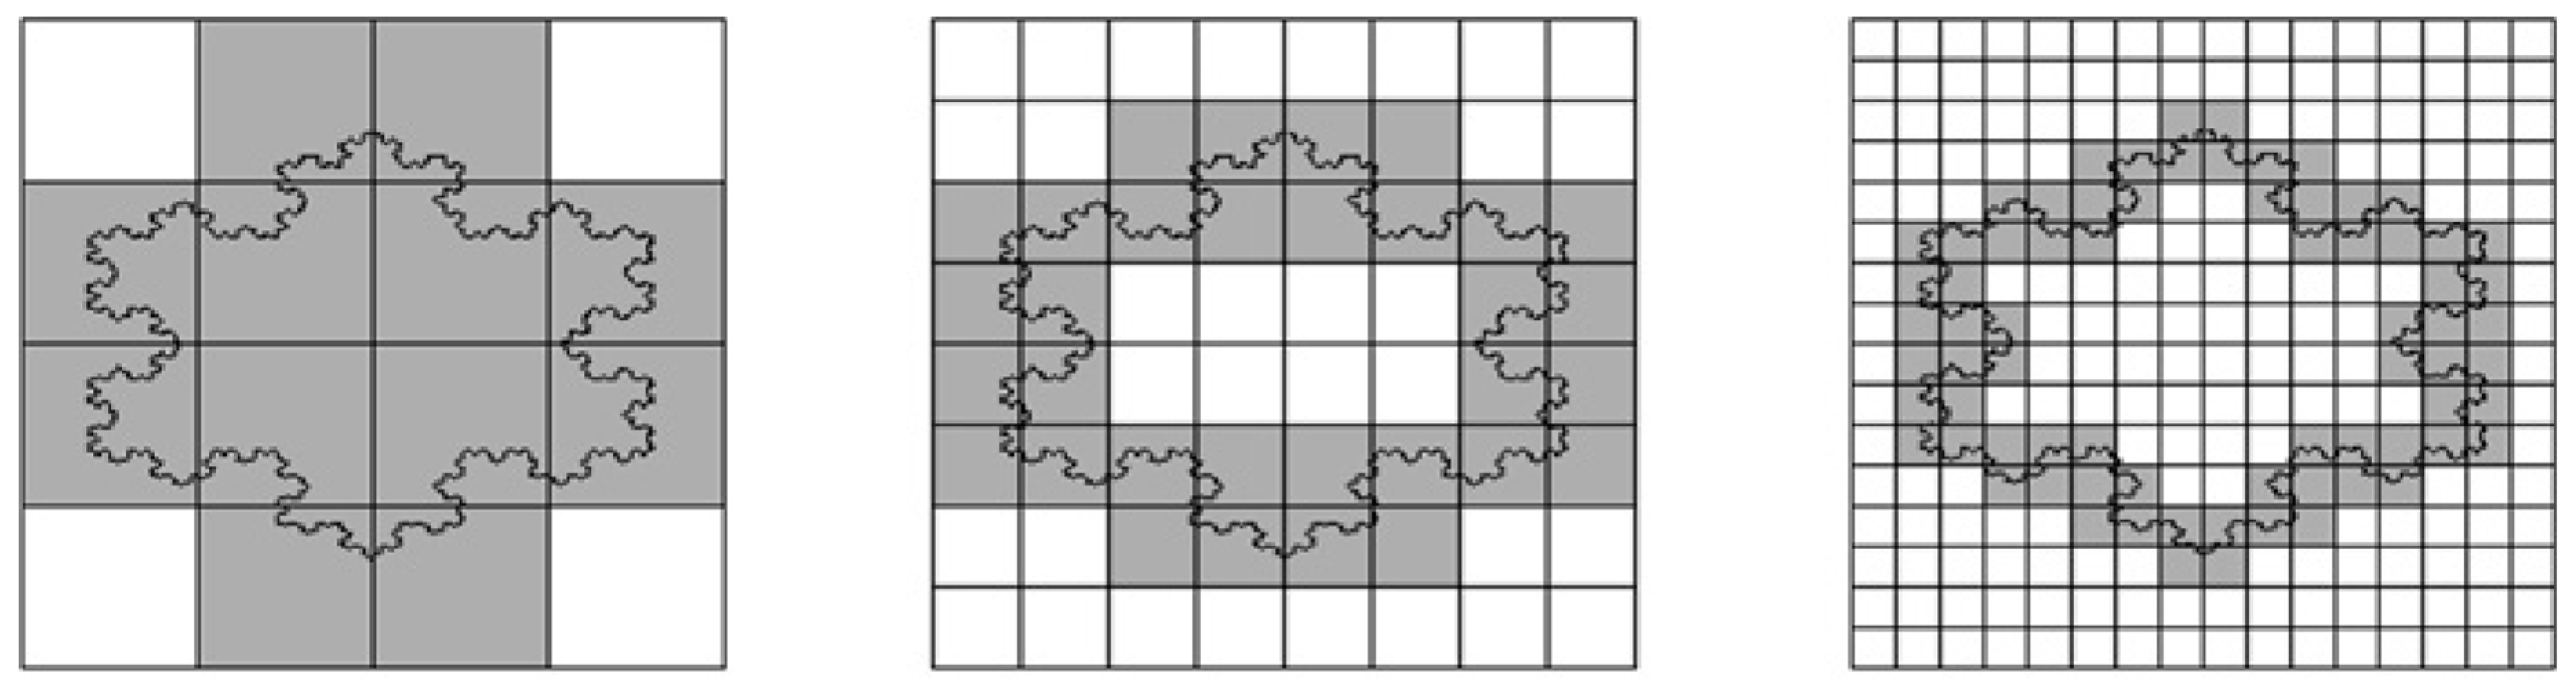
Figure 6.
Perimeter fractal dimension of ks1 expression as a function of time. Each point represents the average of 6 analyzed patterns. Inset: Examples of log-log fits to determine the perimeter fractal dimension of a pattern. Reprinted from Soriano, et al. [103].
Figure 6.
Perimeter fractal dimension of ks1 expression as a function of time. Each point represents the average of 6 analyzed patterns. Inset: Examples of log-log fits to determine the perimeter fractal dimension of a pattern. Reprinted from Soriano, et al. [103].
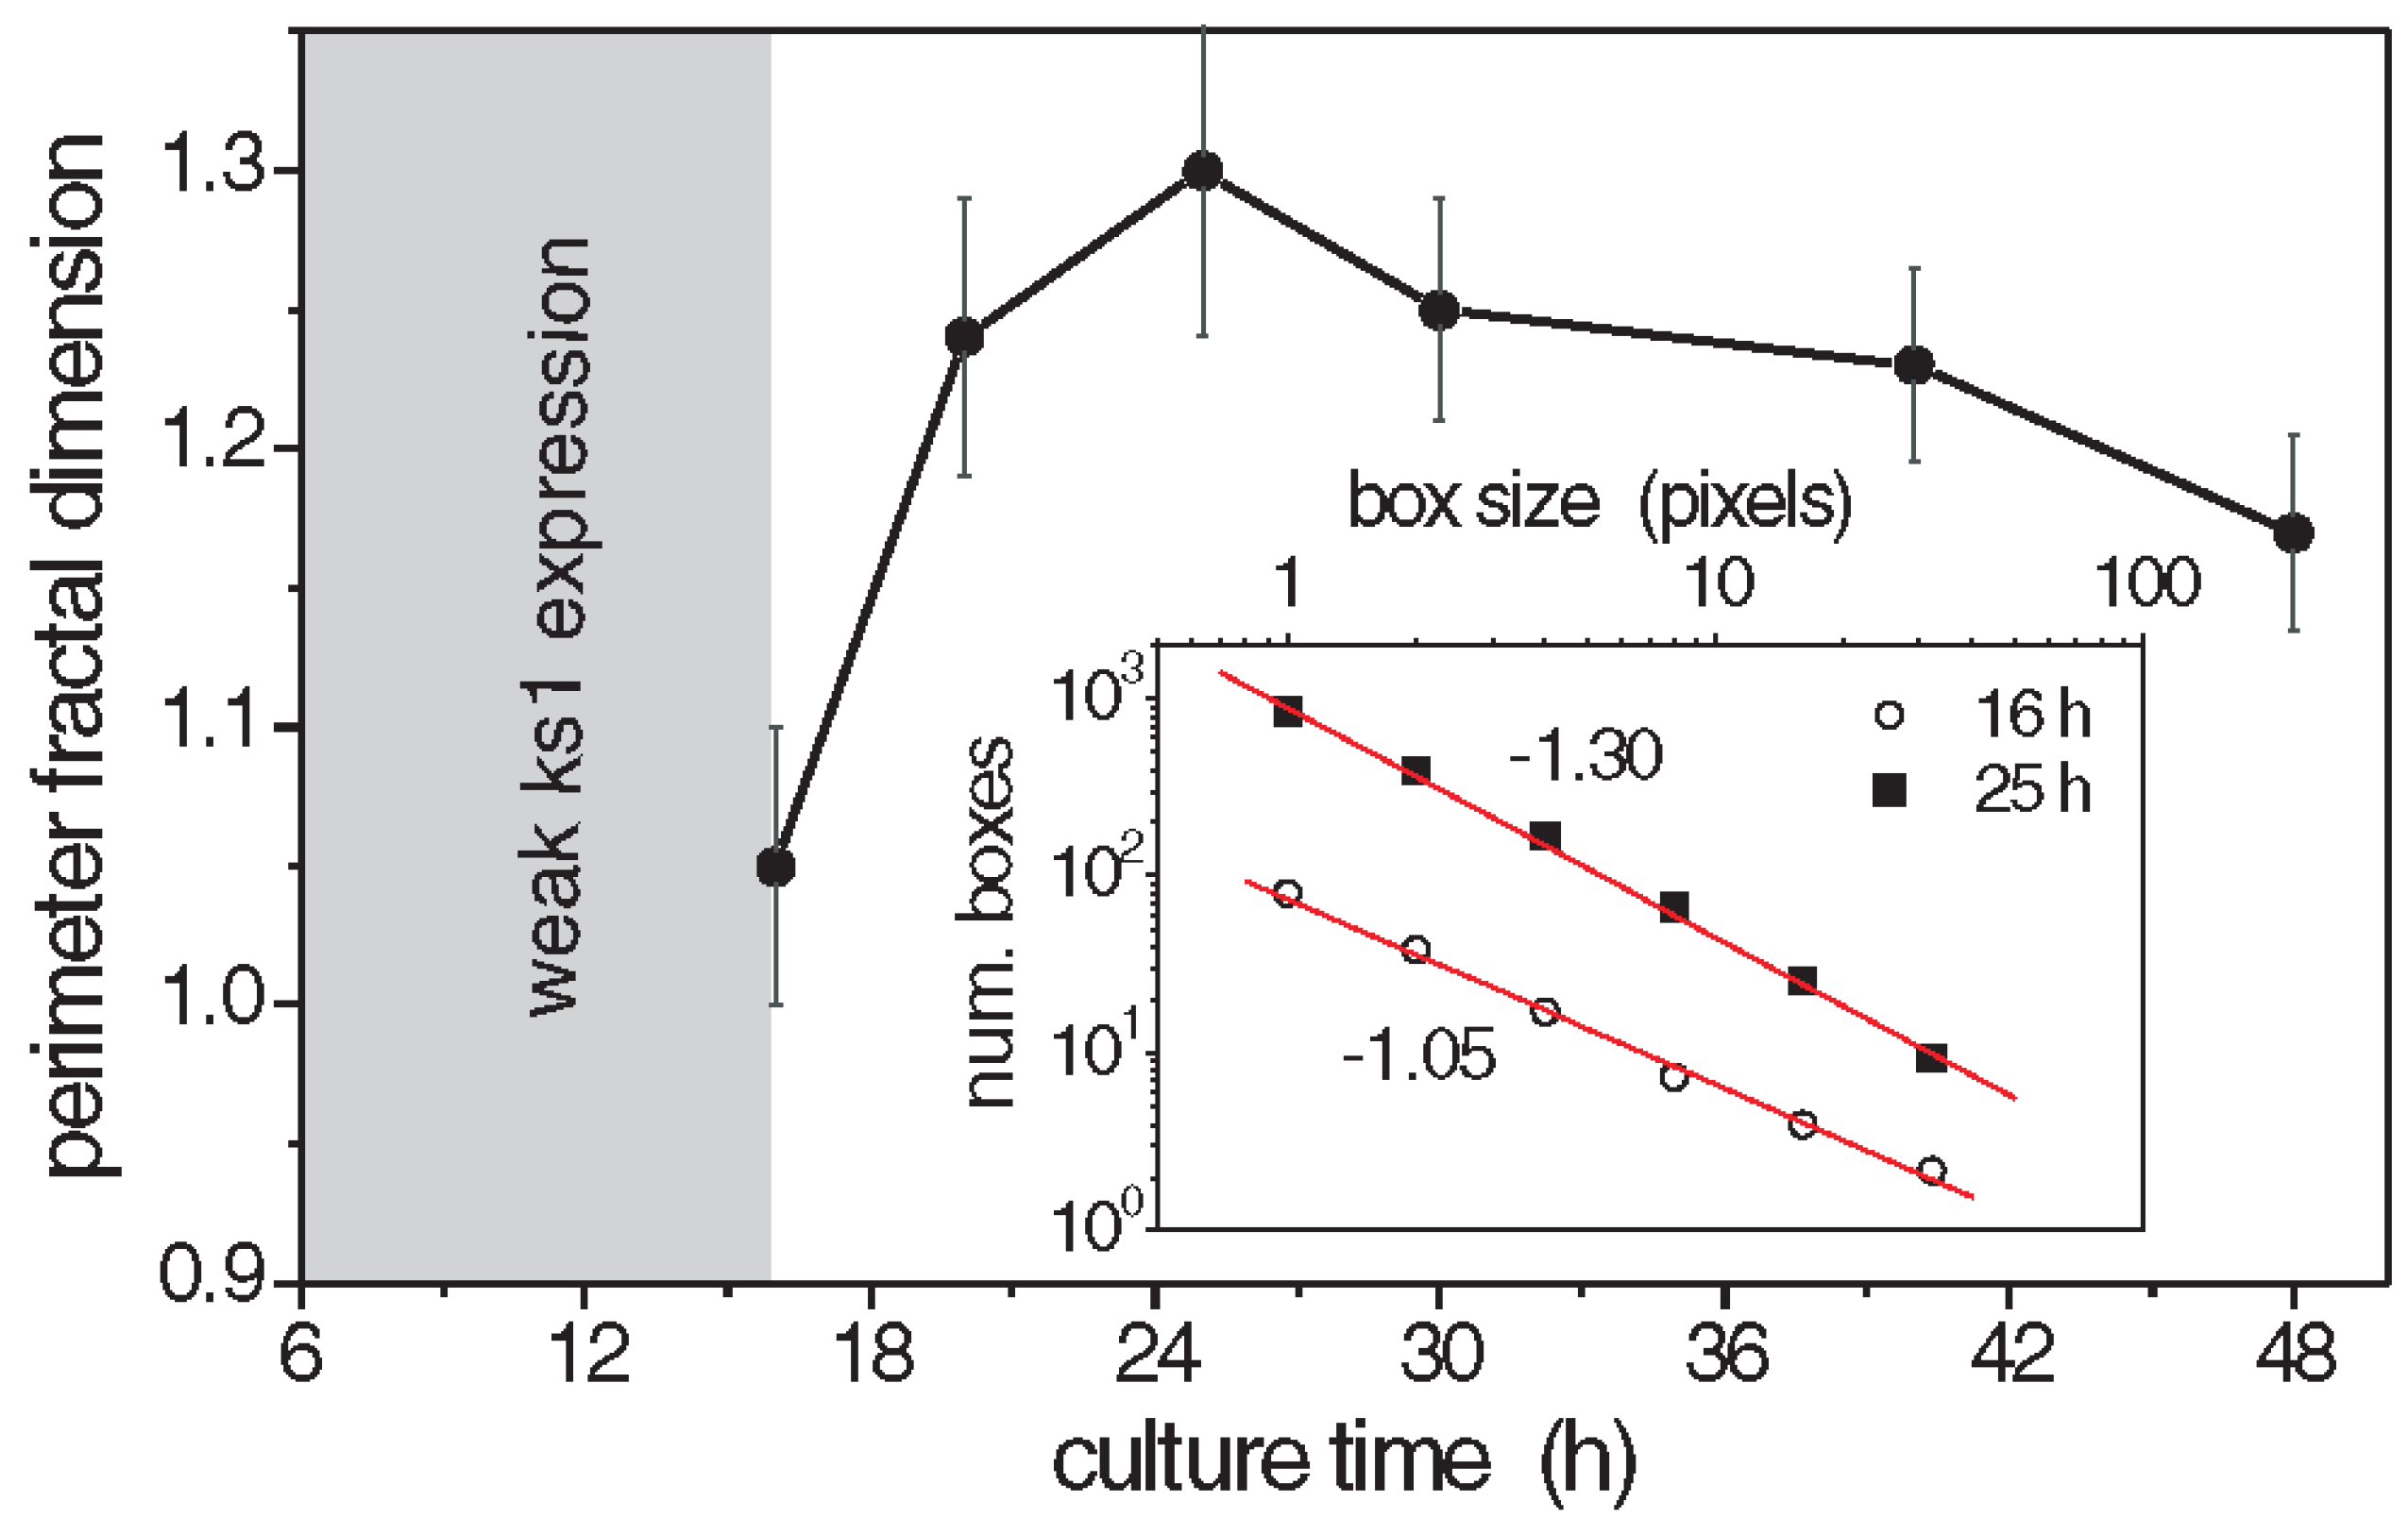
Figure 7.
Avalanches of ks1 activation in Hydra. Reprinted from Gamba, et al. [4]. In this model, each cell produces a hypothetical ks1-promoting factor X over time. When X exceeds a threshold [X]c in a cell, the cell expresses ks1, resets its X level to zero, and distributes 95% (given by the conservation level C, here 95%) of its X equally to six neighbors. This may trigger a cascade avalanche of ks1 activation if neighboring cells also reach the threshold. (b) Comparison of ks1 expression (black spots) in numerical simulations and experiment, at three different development times. T is the simulation time associated with the emergence of a power law P(s)~s-τ, which takes approximately 25 h in the experiment.
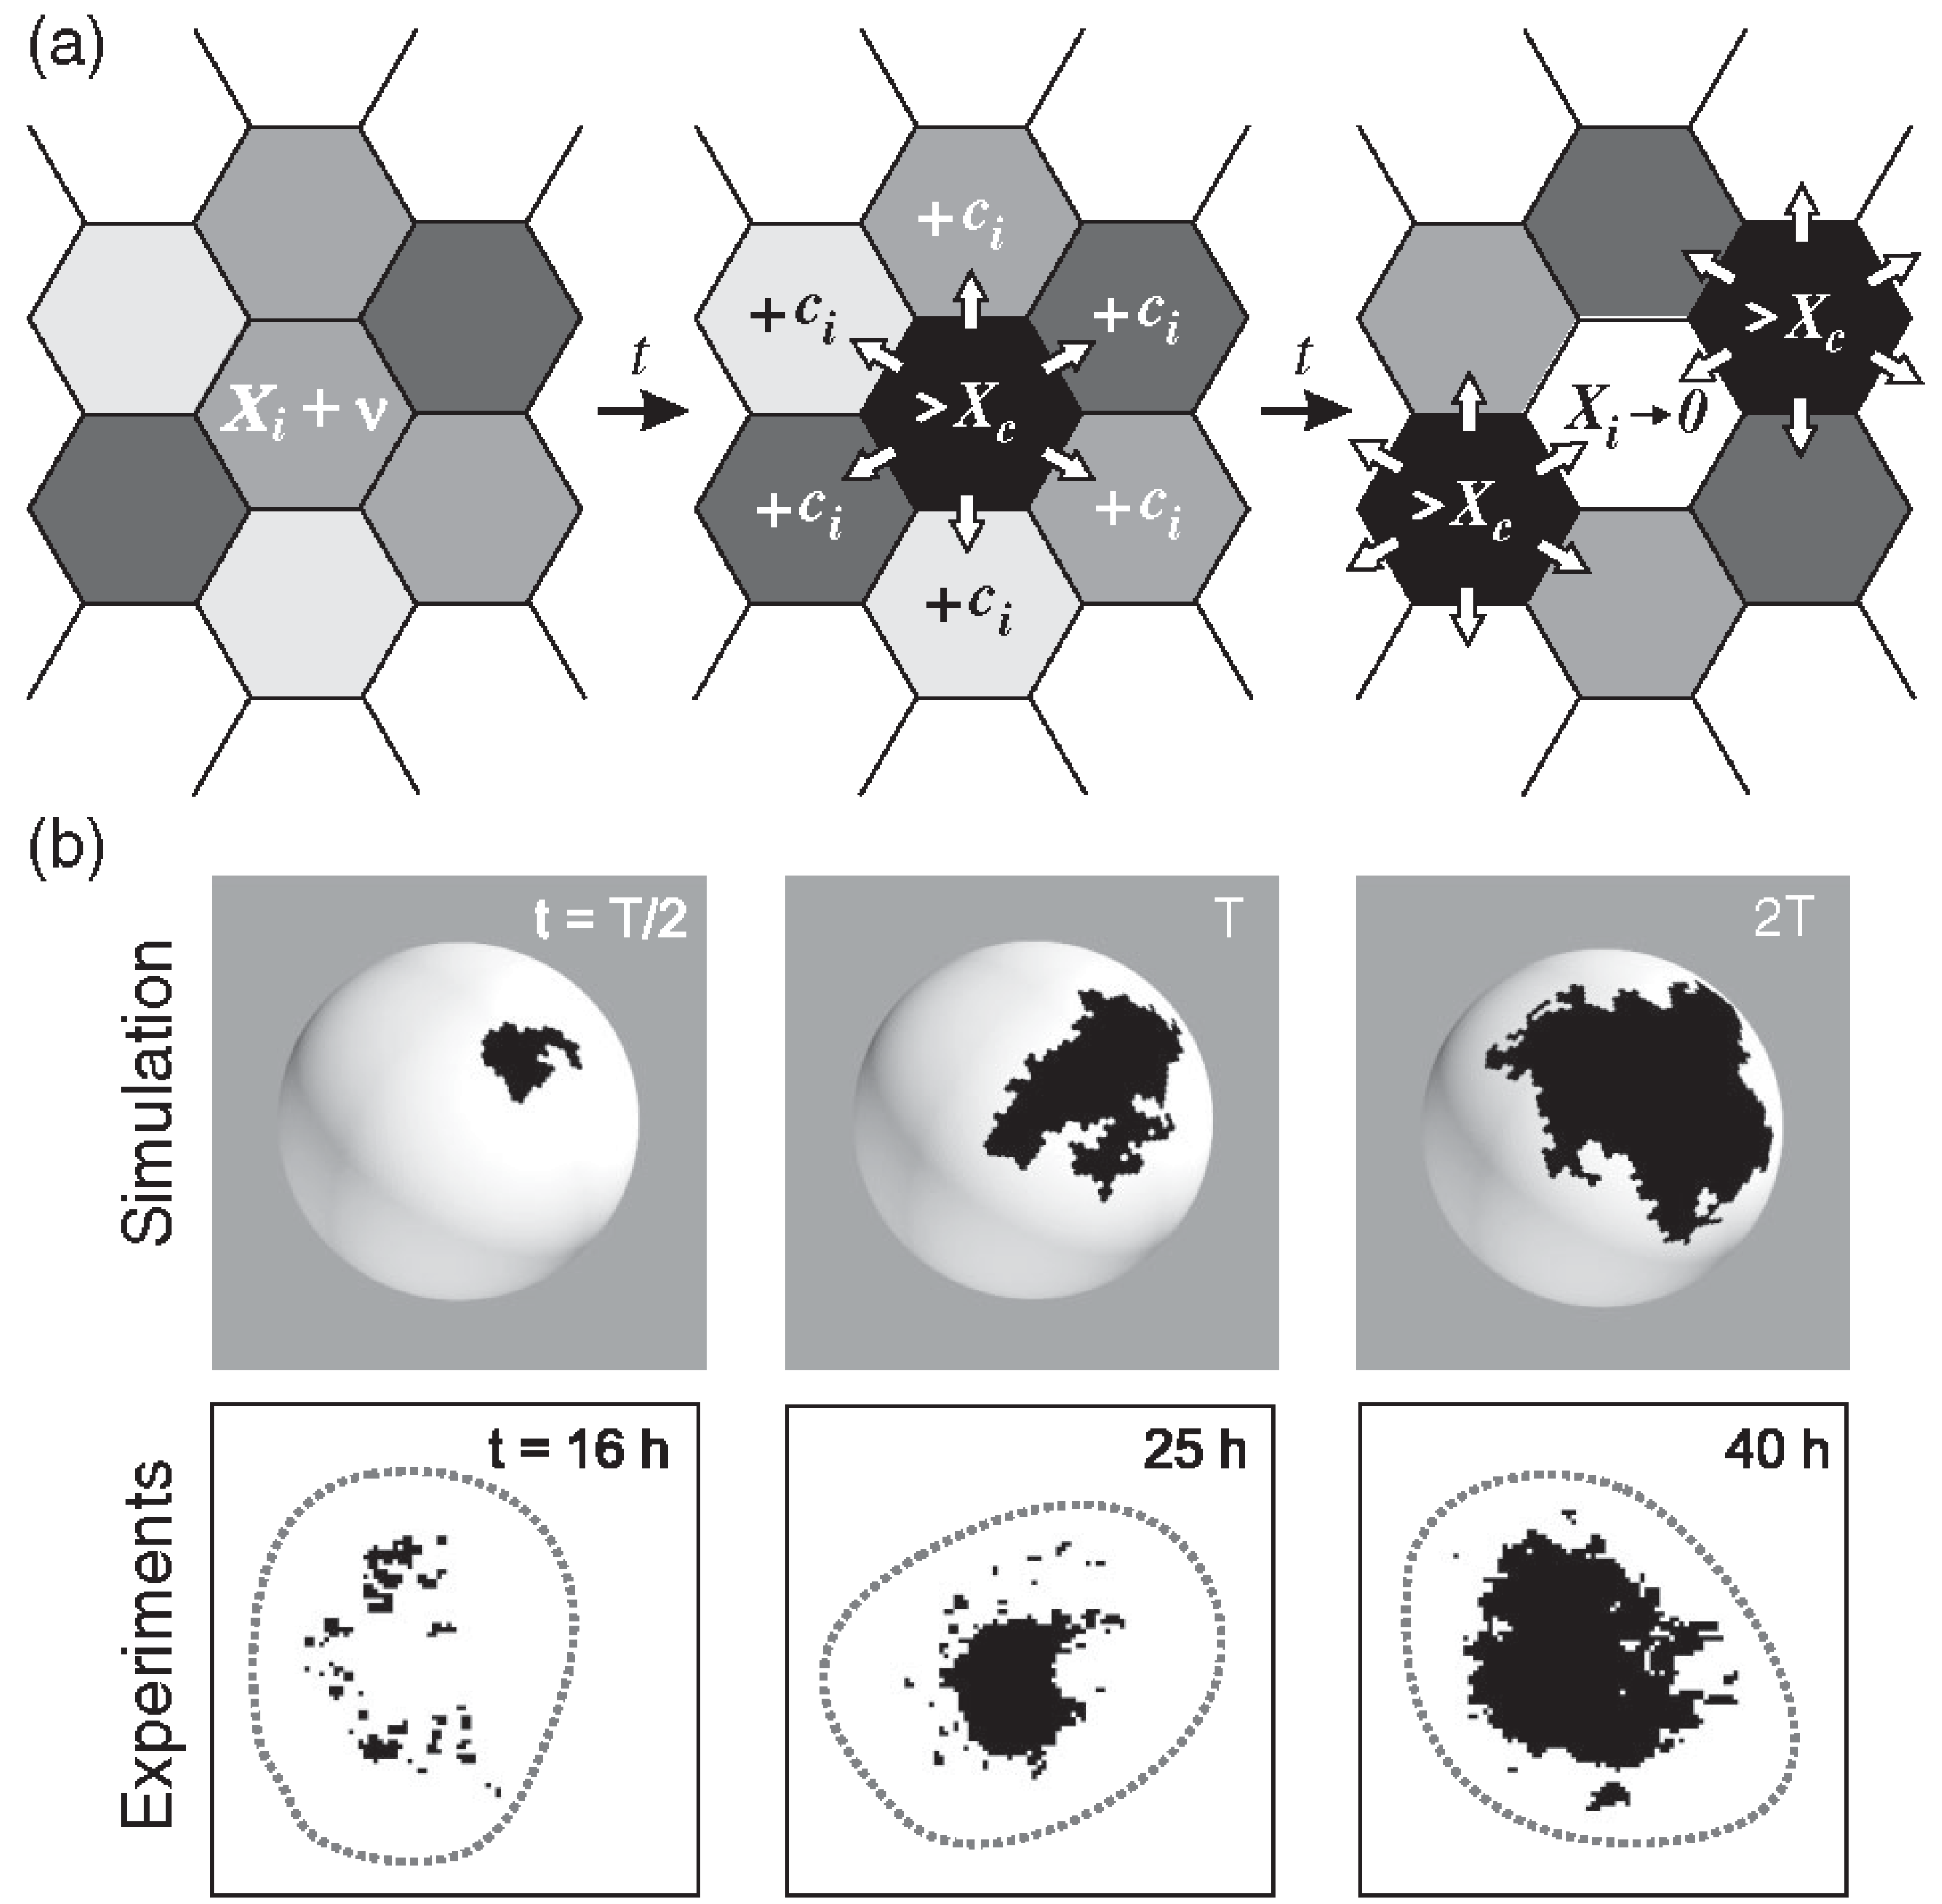
Figure 8.
The probabilities P(s) to observe a ks1-expressing domain with size equal or larger than s, for various culture times (dots, the thin line represents a guide for the eye). This is compared to the size distribution of avalanches appearing at three time points, fat curves (for a conservation level of C=0.95). For better visualization the curves were shifted vertically. The straight thin, light green line is a power-law fit to the experimental data, yielding an exponent of -0.8, equal to the result from the simulation. Reprinted from Gamba, et al. [4].
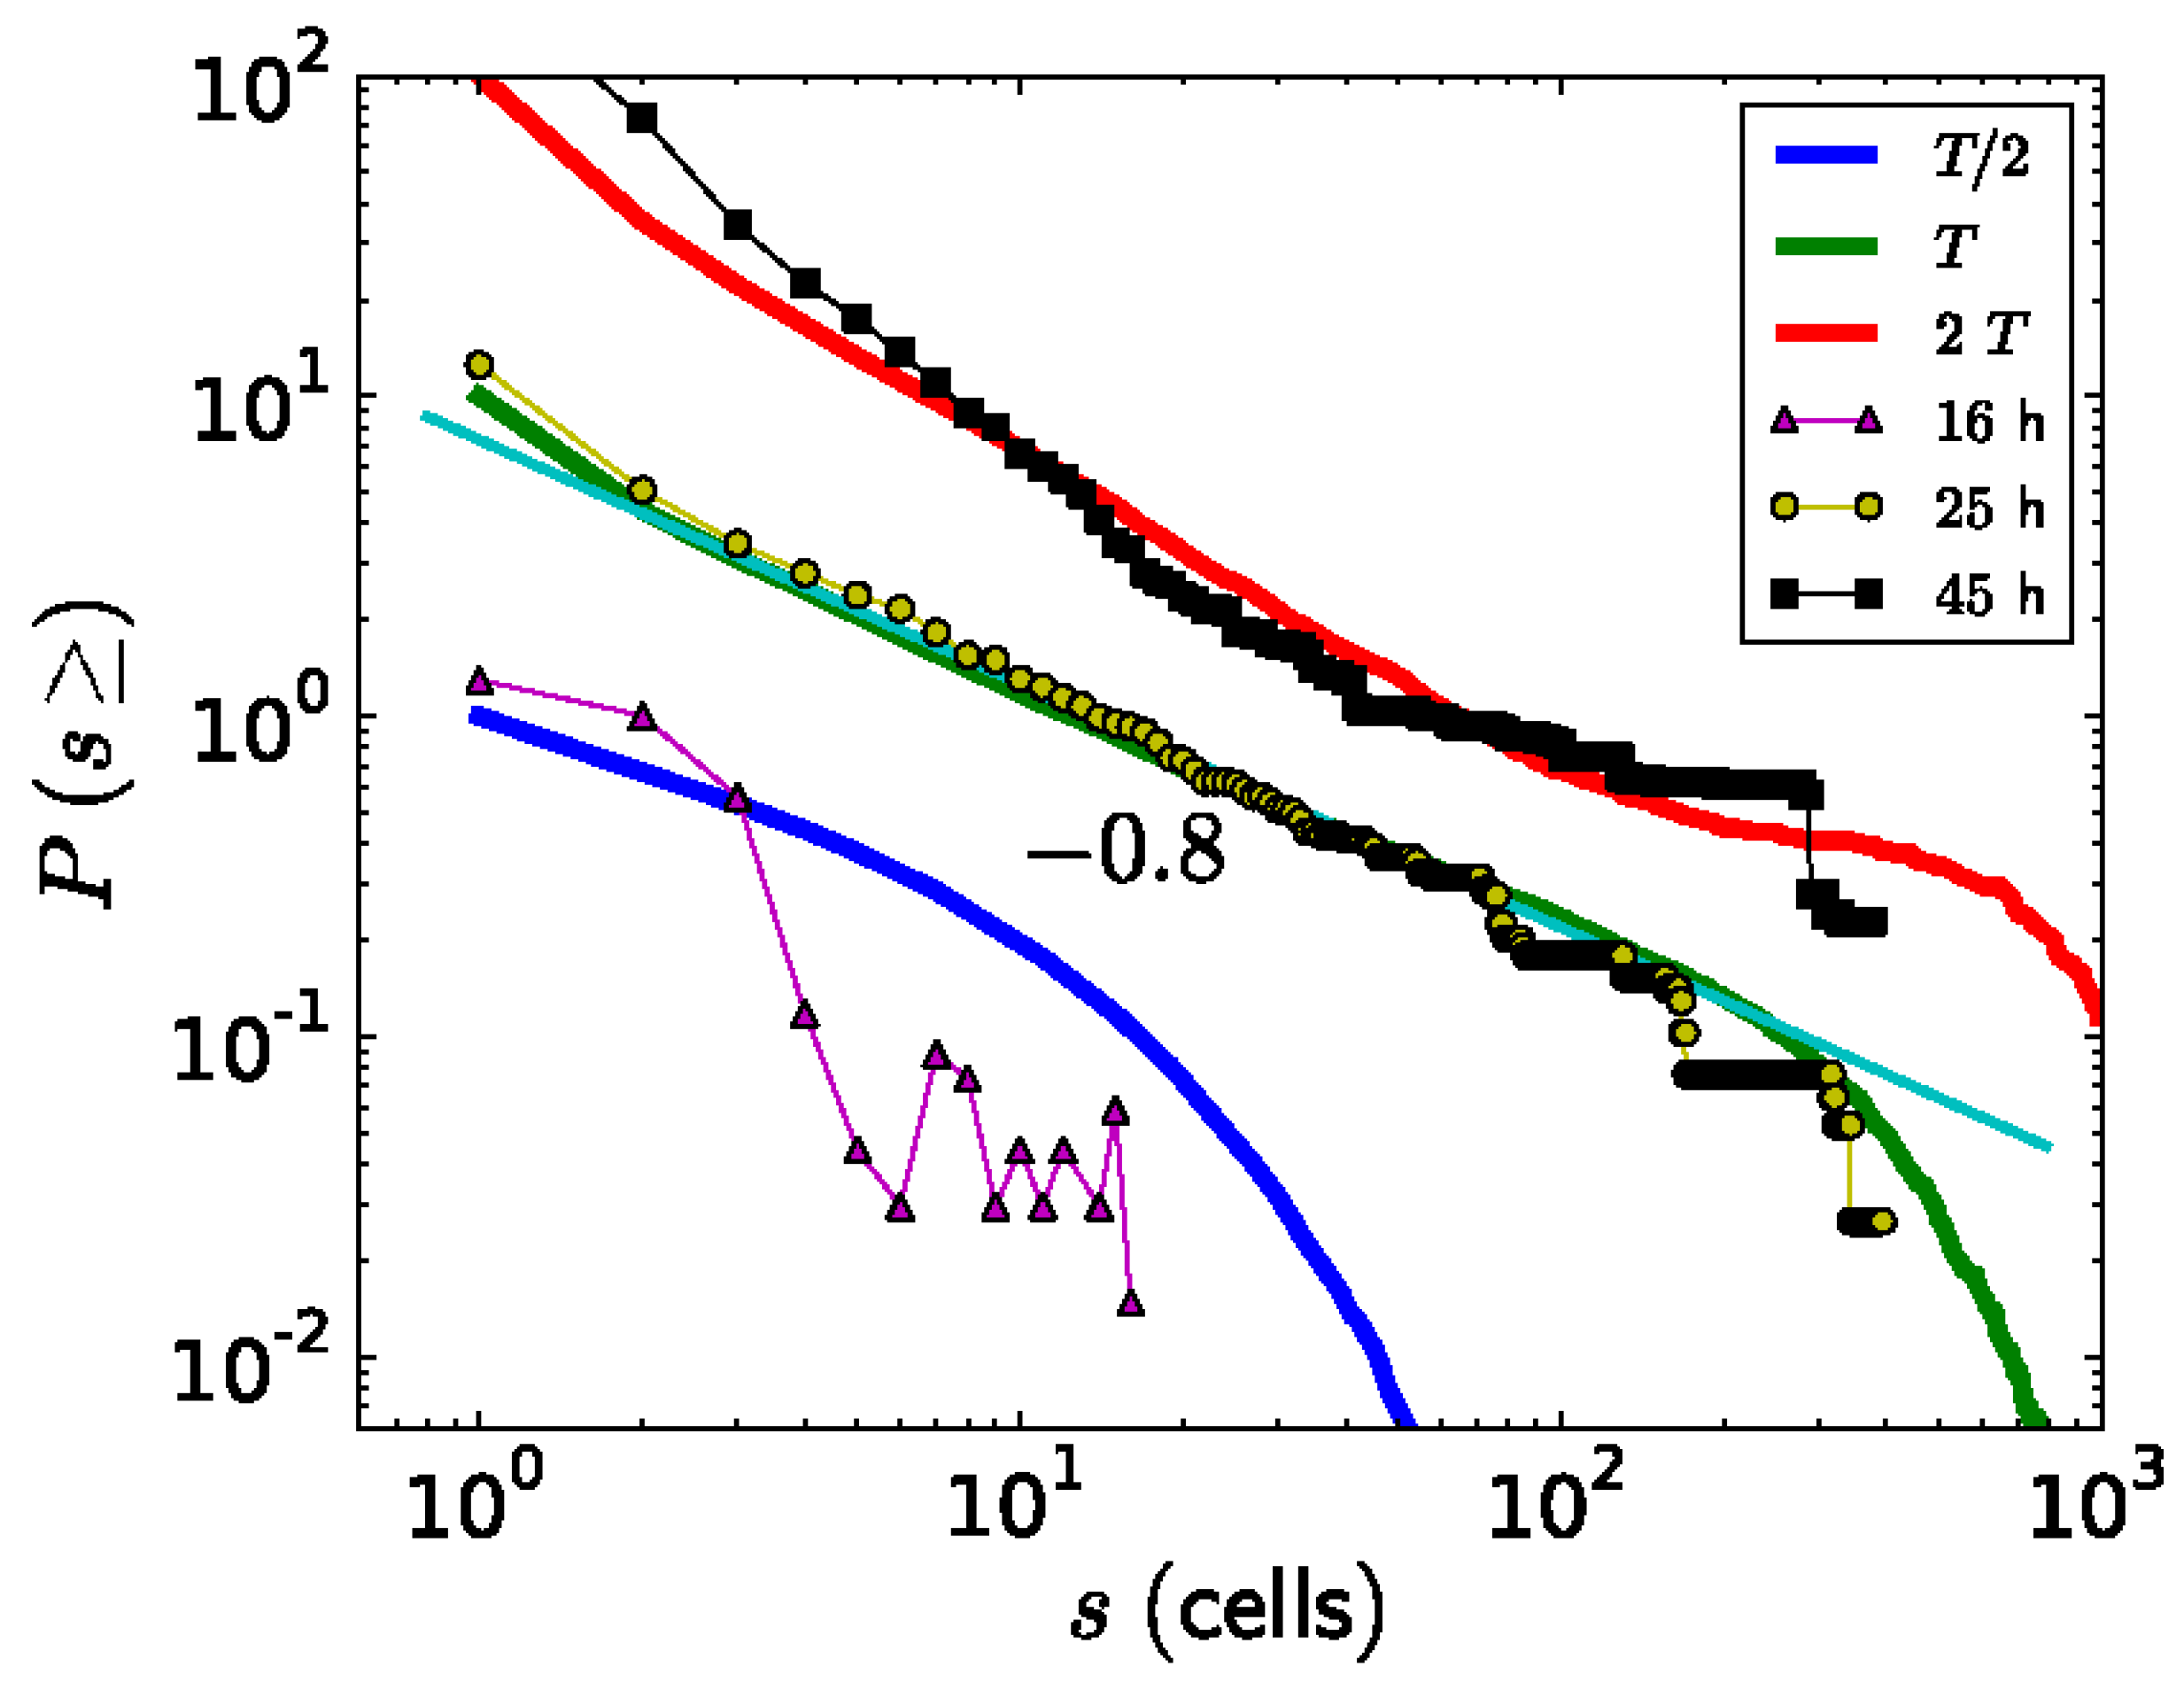
Disclaimer/Publisher’s Note: The statements, opinions and data contained in all publications are solely those of the individual author(s) and contributor(s) and not of MDPI and/or the editor(s). MDPI and/or the editor(s) disclaim responsibility for any injury to people or property resulting from any ideas, methods, instructions or products referred to in the content. |
© 2025 by the authors. Licensee MDPI, Basel, Switzerland. This article is an open access article distributed under the terms and conditions of the Creative Commons Attribution (CC BY) license (http://creativecommons.org/licenses/by/4.0/).
Copyright: This open access article is published under a Creative Commons CC BY 4.0 license, which permit the free download, distribution, and reuse, provided that the author and preprint are cited in any reuse.


