
Submitted:
22 April 2025
Posted:
23 April 2025
You are already at the latest version
Abstract
Objectives: Diabetes Mellitus involves demanding challenges that interfere with family functioning and routines and expose family members to additional and continuous distress, that requires problem solving. This study aims to identify mutual influences of family systems and diabetes management.
Design: Data was collected through a cross-sectional design comparing patients, aged 22-55, with and without metabolic control.
Methods: Participants filled out a set of self-report measures of sociodemographic, clinical and family systems assessment. Patients (91) were also invited to describe their perception about disease management interference regarding family functioning. We first examined the extent to which family variables grouped dataset to determine if there were similarities and dissimilarities that fit with our initial diabetic groups’ classification.
Results: Cluster analysis results identify a two-cluster solution validating initial classification of two groups of patients: 49 with metabolic control (MC) and 42 without metabolic control (NoMC). Independent sample tests suggested statistically significant differences between groups in some family subscales. Binary logistic regression shed light on specific predictors of explained variance to no metabolic control. Furthermore, groups differ on family support, level and sources of family conflict caused by diabetes management issues. Considering only patients who co-habit with a partner for more than one year (N=44), NoMC patients score lower on marital functioning.
Discussion: Family-Chronic illness interaction plays a significant role in a patient’s adherence to treatment. This study highlights the Standards of Medical Care for Diabetes, considering caregivers and family members on diabetes care.
Keywords:
Type 1 Diabetes in adults
; Management of chronic illness
; Family and marital functioning
; eating behavior
1. Introduction
Family system is multidimensional and self-organized [1], so that “individuals with diabetes and their families are challenged with complex, multifaceted issues when integrating diabetes care into daily life” [2], forcing a continuous disorder on dynamic stability in a coherent whole. Diabetes management requires repeated daily behaviors that interfere with the family’s routines, especially meals, glycemic monitoring and symptomatic expression on biochemical changes, such as a hypoglycemia crisis [3]. This continuous and mutual interchange between illness management and psychosocial factors presents challenges to research, such as identifying adequate measures and methodologies that mirror this circular causality.
In terms of methodology, family assessment in research on adults with T1DM and their families [4] has been conducted via observational rating scales, clinical semi-structured interviews or self-report instruments related to diabetes social support [5], through individual [6,7] or dyadic studies with couples [8]. Several authors [9,10,11,12] suggest a combination of quantitative and qualitative analysis to “assist the research in understanding the relations between different family dimensions”.
Extensive literature corroborates the impacts of diabetes on different systemic levels, such as marital interaction [13,14,15,16], family, work and social network [17] and psychosocial well-being [18,19,20,21,22,23,24,25,26,27].
For their part, several studies have focused on how the individual and the family can predict effective diabetes management, as family and social support [28,29,30,31], coping styles [32], individual attributes of a partner’s illness [33], diabetes knowledge [19], health-related social control strategies such as overprotection [34], or individual traits/perceptions [35,36,37].
However, little attention has been directed to the relationship-based approach for T1DM exclusively in adulthood [38,39]. And this is important for two reasons. First, T1DM onset can start in childhood or adolescence, revealing a shared history of interrelated meanings about diabetes management [40,41,42,43,44]. Second, the onset of T1DM may also appear later, in adulthood, after one’s relationship or employment status has become consolidated, which involves family actors in a different way [17]. Unfortunately, the broader research that includes T1DM [45] focuses in other stages of development (childhood or young adult) and examines parent-child interactions. Studies with couples, families and multi group interventions have been mostly carried out only with T2DM [46,47]. Finally, family studies with adults with T1DM embody this pathology in global studies about multiple chronic illness [48,49].
Systems Theory provides a theoretical framework to look at chronic illness as a developmental process over time through Biopsychosocial [50,51] and Complexity [52] lenses. The Family Systems-Illness Model (FSIM) [53,54,55] addresses the illness, the individual and family developments by claiming that an individual’s adjustment to illness depends on the good fit between the demands of the illness over time and family functioning, considering its life cycle and an individual member’s development. Highlighting interaction and context, the FSIM depicts the family as an interactive system within itself and integrating other systems. This comprehensive model emphasizes the relevance of narratives about disease experience provided by families and their members on dealing with individual maladaptive behavior [56,57]. Once “humans (…) can be defined as language-generating, meaning-generating systems engaged in an activity that is intersubjective and recursive” [58] understanding family dynamics is deeply attached to Human Communication and Cybernetics Theories.
This article supports the research findings on how the family and diabetes management exert mutual influence on each other (Figure 1). It also highlights the features of family conflict that arise due to the patient’s viewpoint of the illness. We hypothesized that differences between MC and NoMC groups are explained by how the demands of diabetes may have a negative effect on the family dynamic, which recursively presents challenges to effective diabetes management.
2. Materials and Methods
2.1. Overview
After receiving an explanation of the nature and duration of the study, all subjects signed an informed consent document as approved by the Ethics Committee of (…) in accordance with the Declaration of Helsinki.
2.2. Participants
The study involved 91 adults with T1DM, aged 22-55 (mean age: 36.74±9.08). They were divided into two groups according to Glycated Hemoglobin (Hba1c) values over time: 49 (MC group) mean age: 37.20 ± 9.47, [21,55] and 42 (NoMC group) mean age: 36.19 ± 8.67 [20,55]. Fifty-three volunteers without diabetes (27 males and 26 females, mean age: 35.66± 8.51) were also recruited, but given that metabolic status in healthy population is by definition stable and not disrupted (unlike the clinical control group), the value of these data are normative and presented as supplemental material.
The same procedures were applied to all eligible participants: i) referral to clinical assessment for at least one year at the Department of Endocrinology, Diabetes and Metabolism (EDM, Public Hospital), grouped by HbA1c values over time ii) no other current major chronic disease in the nuclear family, including Diabetes iii) no cognitive impairments. Participants were excluded if they reported past or current history of neurological and psychiatric disorders, recent diseases, major medical illness (cancer, anemia and thyroid dysfunction) or severe visual or hearing loss. In total, two patients were excluded by presenting a history of psychiatric disorder.
2.3. Sociodemographic, Cognitive and Clinical Features Characteristics
Participants filled out a demographic survey and a cognitive protocol (Table 1) [59,60]. Participants with more than 50 filled out MoCA (Mont Real Cognitive Assessment), [61]. Body Mass Index (BMI), values of Hba1c and current symptoms or complications were evaluated by clinicians directly or indirectly consulting the patient’s process. Patients fit in the Metabolic Control Group if they present Continuous Descendent values of HbA1c, low invariable values that did not change beyond 0.5mm/mmol or values that varied more than 0.5mm/mmol, but the maximum value of this Oscillation was lower than 8.0mm/mmol. The inverse pattern characterized the No Metabolic Control Group (NoMC).
2.4. From Family to Diabetes Management
Implications of Family in diabetes management were evaluated by applying four questionnaires with adequate psychometric (validity and reliability) properties for the Portuguese population. They covered three levels of systemic evaluation. If any participants had been living in a situation of a couple cohabitation for more than one year, they also completed the marital functioning subscale [62], a 44-item self-report subdivided into two subscales, Marital Functioning and Love. For our research purposes, the Love subscale was not administered.
2.4.1. Individual Level as a Whole
The Congruence Scale (CS) [63] -Portuguese version [64] - evaluates individual functioning and its adaptability in holistic dimensions such as individual connection with the universe/transcendence (the Universal), between people (Interpersonal) and within oneself (Intrapsychic) [65,66]. It is organized into two subscales (Universal and Interpersonal/Intrapsychic) for a total of 16 items answered on a 7-point Likert scale, ranging from 1 (Strong Disagreement) to 7 (Total Disagreement).
2.4.2. Intrafamily Level
Family Functioning was assessed by the Systemic Clinical Outcome and Routine Evaluation (SCORE-15) [67]; Portuguese version [68], a self-report measure (for family members up to 12 years of age) developed to assess outcomes of family functioning in clinical settings. SCORE-15 items are given on a 6-point Likert scale ranging from 1= “describes us: extremely well”, to 6= “describe us: not at all” in three subscales: family strengths, family difficulties and family communication.
2.4.3. Extrafamily Level
The Inventory of Family Quality of Life (QOL),- Portuguese version- [69], a 40-item instrument, marked 1 (Not Satisfied) to 5 (Completely Satisfied) on a 5-point Likert-scale, covering 11 general areas of individual life satisfaction.
2.5. From Diabetes Demands to Family Conflict
To assess how the demands of diabetes affect their family, patients completed a survey, based on two instruments: the Diabetes Family Support and Conflict Scale [70,71] and The Diabetes Family Behavior Checklist [68]. Briefly, it comprises three parts:
1. The question, “How does diabetes management contribute to family conflict?”
2. A list of Sources of conflict/support between the patient and the family due to diabetes, such as physical exercise, food restrictions, mealtime, glycemic results and medical advice;
3. Patients’ perception about their disease self-management (physical exercise, food, glycemic control, smoking habits), critical problems (food choice, future complications, lack of social support, hypoglycemic episodes, constant efforts to deal with disease) and Eating Behavior, assessed through Portuguese validation of Dutch Eating Behavior Questionnaire, DEBQ [72,73]. It is a 33-item instrument which evaluates three types of eating styles such as restrained (avoid eating more than initially defined), external (eating motivated by external factors such as the food’s good smell and appearance) and emotional (eating in response to emotions).
2.6. Data Analysis
We used IBM SPSS Statistics (version 24) to conduct data analysis. Descriptive statistics are reported as mean ± SEM. Prior to analysis, raw data were examined for normality by the Shapiro-Wilk goodness-of-fit test [74]. Firstly, we examined the extent to which family variables grouped dataset in order to determine if there were similarities and dissimilarities that fit with our initial diabetic groups’ classification. Instead of one multivariate method, we calculated K-means and two-steps algorithms so that consistent results could be achieved, as proposed by Kos and Psenicka [75]. No hierarchical cluster analysis was used given that we would like to test the two-cluster hypothesis. We introduced only continuous variables because K-means cluster analysis does not support categorical ones. Previously the cluster analysis, variables were standardized to minimize dimensional statistical errors [76]. Both K-means and Two steps methods used centroid distance with Squared Euclidean distance as the similarity measure. For K-means measure we calculate Chi-squared statistics to determine the percentage of correspondence between clusters found and dynamic HbA1c categories. Continuous variables were analyzed using a series of independent-samples t-tests, if normality and variances homogeneity was assumed. To examine the main predictors of barriers to diabetes management, we carried out a binary logistic regression, choosing dynamic variable of Hba1c as the dichotomous dependent variable (MC and NoMC). We examined intercorrelations (Pearson’s) to accomplish the assumption of no multicollinearity to regression analysis, with 0.8 meaning a huge correlation [77]. We conducted four regressions, each one related to a group of distinct variables such as sociodemographic data (1), clinical features (2), family (3) and eating behavior (4), resulting in four final models. Statistics are reported with 95% confidence intervals [95% CIs]). Null-hypothesis statistical tests were evaluated according to an alpha value of 0.05. The chi-squared test was used to compare categorical variables, and nonparametric tests (Kruskal-Wallis) were used to compare ordinal variables.
3. Results
- 1.
- Two cluster solution and metabolic control bipartition
The two-cluster solution was verified at both cluster analysis methods, matching each cluster with diabetic group’s bipartition in similar proportions (MC and NoMC). We introduced only continuous variables: general results of 1) family functioning, 2) quality of life and 3) congruence, since data reduction could be achieved. These three general results are significantly (p<0.01) and moderately correlated: SCORE-15 with QoL (r=-0.57) and CE (r=-0.471) and QoL with CE (r=0.34). K-means cluster analysis indicate that all variables have a significant weight to the formation of a two solution clusters agglomeration, p<.001, by ANOVA output: SCORE-15 [F(89)=102.54]; CE [F(89)=52.83] and QoL General [F(89)=73.19]. X2(1)=26.05, p<.001 informs that 76.9% (40/52) of MC group belongs to cluster 1 and 76.9% (30/39) of NoMC group belongs to cluster 2, supporting our group classification. Two-steps cluster analysis showed a high silhouette coefficient (=0.5) and a size ratio of 1.39 (53/38), near the size ratio of the dataset (1.22; 49/42). Posterior inclusion of dynamic variable of HbA1c related cluster 1 with the MC group and cluster 2 with the other group. The positive or negative direction of each variable was obtained in cluster comparison, which confirms the correlations results. The MC group is characterized by lower results on SCORE-15 (indicating high family functioning) and higher on General Quality of Life and General Congruence. For the NoMC group, the other cluster, we observed the opposite direction (Figure 2).
- 2.
- From Family to Diabetes Management
Forward analysis with independent sample parametric and non-parametric tests allowed us to deep dive on group differences. Table 2 summarizes the results. The group with NoMC scored higher on Family Difficulties and Family Communication, presented low Quality of Life (QoL) and less connection with themselves, others and the context.
Knowing the group differences, we studied which variables explained the variance of no metabolic control. The results are summarized in Table 3. Income, Educational level (first model), HbA1c values (second model), SCORE-15 & CE (third model) and Emotional Eating Behavior (fourth model) proved to be significant predictors of lower metabolic control. Participants with diabetes that cohabit for longer than one year also filled out the subscale Marital Functioning of EASAVIC, N=44 (18, NoMC; 27, MC). The group with MC scored higher than the other group for all variables studied (see Table 4).
The model containing Income and Educational Level was statistically significant (X2 (2)=16.28, p<0.001, R2 Negelkerke=0.22). The model related to clinical features was significant (X2 (2)=43.17, p<0.001, R2 Negelkerke=0.51) being reduced from Distance to Health Services, Length of disease, disease onset, IMC, Smoking Habits to HbA1c values as predictor variable and explained 81.3% of the variance of risk to NoMC. The third model explains 77.4% of variance of NoMC in PWD (X2 (2)=28.87, p<0.001, r2=0,393. The fourth model explaining 70.3% of the variance to NoMC, remaining Emotional Ingestion (X2 (1)= 8.07, p=0.005, R2Negelkerke=0.11.
- 3.
- From the Demands of Diabetes to Family Conflict
According to question 1 “How does diabetes management contribute to family conflict”, NoMC showed a moderate level of conflict (47.6%) while MC perceived low level of family conflict (71%). This difference was statistically significant [X2 (2) =11.74, p=0.003], indicating an association between group and perception of family conflict. We found similar results related to family support [X2 (2) =9.54, p=0.002], given that 87.8% of people with MC reported having support as compared with 59.5% of the NoMC group. The first major source of conflict for NoMC was “annoying me to follow the doctor’s advice” (23.8%) while MC group 36.7% pointed out “no sources of conflict” (36.7%). The second source of conflict was “when they tell me what I can’t eat” (18.4% for MC and 21.4% for NoMC). Mealtime is a major concern, so the person preparing the meal plays an important role. In our sample, there was no association between groups and who cook at home [X2 (2) = 0.84, p>0.05]. However, it is related to gender since 91.4% of females cook by themselves whereas males relegate this task to their mothers (44.6%) or their wives (26.8%), thus presenting a statistically significant difference [X2 (2)=34.15, p<0,001]. Finally, the MC group worried more about future complications (69.4%) than the NoMC (33.3%), which is also focused on daily, present and permanent efforts required by disease.
4. Discussion
Three main conclusions can be drawn. First, this study found a coherent meaning in family to binary characterization of diabetes management based on a related biological variable (dynamic values of HbA1c). Second, findings supporting group differences are consistent with many previous studies reinforcing the recursive interplay of family variables and diabetes management. Third, even though this study does not focus on intervention, it points to specific information that may help to design interventions in a “simple, easily operational and clinically relevant” manner [78].
As for the first statement, a two solutions cluster analysis based on self-report measures encourages family assessment of adults with T1DM in health and clinical settings. SCORE-15 is a promising candidate to take part in an interdisciplinary protocol assessment by the health team. As recommended by American Diabetes Association, “providers should consider an assessment (…) in the initial visit, at periodic intervals, and when there is a change in disease, treatment, or life circumstance. Including caregivers and family members on this assessment is recommended” [2].
Concerning the second conclusion, previous literature [8,39,76] is consistent with the connection between communication patterns, overwhelming feelings or thoughts, congruence and poor diabetes management. Individual mental health well-being should be done carefully and monitored in a timely fashion to avoid symptomatic evolution to complex levels of interventions with cost effects. Psychosocial interventions should take into account sociodemographic data (financial concerns and education level), once it is related to reports of unstable values of HbA1c (unemployment, particularly) perhaps because it limits individual choice. Besides repercussions on family dynamics [79], it exhibits biological direct interference for patients. A pattern of hopelessness and exhaustion on results from sources of family conflict and low congruence seems to be consistent with emotional eating as a major predictor, instead of restrained or external eating behavior. This can encourage a deeper review of nutritional interventions based on adherence to regimen changes, family meal routines or food habits related to feelings [80].
Meal preparation is one of the most frequent sources of family conflict for both groups. It is a mark of gender regardless of marital status (mothers and sons). Family life cycle, individual development, or disease challenges are all present in several domains in the patient description. So, Rolland’s Family Systems-Illness Model fits for theoretical and practical comprehension of relationship-based approaches to health and illness management and should be adopted for clinical interventions.
Additionally, patients’ reports of others support could be a source of conflict, translating into annoying but well-intentioned expressions of concern. Controlling health behaviors such as overprotection may damage a patient’s management in both parental and couple relationships in adulthood [81]. Thus, mutual perceptions of caregiver and patient should be considered. As Martire & Helgeson [49] states “parent or spouse involvement in illness management can be viewed as ranging from under involvement to over-involvement, with the extremes being associated with poorer management.”
The present study has some limitations. First, depression, anxiety or other emotional problems were not verified. The prevalence of depression among adults with diabetes is higher than in adults without diabetes [58,79]. Second, once the population of the study has diabetes in a chronic phase [54], conclusions should be not extended to diagnosis or the terminal phase.
Future family research studies could focus on several issues. 1) narratives built around growing up with diabetes offered by patients, their caregivers and people without diabetes (“what is transformed or preserved through time”, Melo & Alarcão [10]); in order to understand the disease’s impact on future choices, such as careers and close relationships; 2) family assessment, as SCORE-15, helping to improve family assessment screening to evaluate therapeutic process evolution; 3) mixed methodologically are recommended, such as self-report measures and interviews with circular questioning techniques, dyadic problem-solving interactions, or observations at different times and integrating different family members.
Our findings inform prevention and intervention programs based on “four interlocking triangles” made up of the four components of the “Therapeutic Quadrangle”: the illness, the family, the patient and the health-care system” framed in the context [54]. Placed within multidisciplinary teams, design of theory-based interventions should outline social, family and marital support and their perceptions; caregivers and their role in diabetes management at home; communication patterns and problem-solving skills for family members and couples; individual and family developmental life cycle considering life transitions and its normative and unpredictable tasks; family history of coping with the illness; shared disease knowledge and illness management skills; beliefs systems related to health care, the health system, health providers and medicines [82]; eating behavior considering emotional assessment and workplace conditions. Training psychologists to specifically provide psychosocial care for patients with diabetes is inherent to intervention programs of which there are too few [83,84,85]
5. Conclusion
In this study, we divided a sample of 91 adults with type 1 diabetes into two groups concerning metabolic control over time to explore the recursive interplay between biological, family and social dynamics within diabetes management. Despite a notable absence of studies that address adults with T1DM and their families, existing literature highlights enough evidence of this recursive play on different theoretical and practical approaches. This study revealed considerable transversal results from individual to family and large contextual systems that are interconnected and include all diabetes management stakeholders. However, family-based intervention approaches, their evaluation in terms of efficacy, and family and psychosocial assessment through the diagnosis phase in a collaborative multidisciplinary team face a slow process on the path to rooting themselves in the health system.
Author Contributions
H.J researched/analyzed data and wrote the manuscript B.R.C. did statistical review. M.C.B. contributed to review the manuscript. A.P.R contributed to designing the protocol, discussion and reviewing the manuscript.
Funding
This study was supported by the Foundation for Science and Technology Portugal under Grants [SFRH/BD/132881/2017], INFARMED, Clinical Research Fund, FIS-FIS-2015-01_DIA, European Association for the Study of Diabetes, Innovative Outcomes - Sanofi-EFSD, FCT UID/4950/2020, CONECT-BCI | POCI-01-0145-FEDER-030852, PCIF/SSO/0082/2018. This study was carried out at Department of Endocrinology, Diabetes and Metabolism (EDM, Coimbra Public Hospital), in articulation with Faculty of Medicine, University of Coimbra (IBILI).
Conflicts of Interest
No potential conflicts of interest relevant to this article are present. We have no conflicts of interest to disclose. Special thanks are due to the staff of SEMD for their clinical assistance and the patients and health participants whose cooperation made this study possible.
References
- Maturana, H, Varela, F. A árvore do conhecimento: [The tree of knowledge] (trad.) Jonas Pereira dos Santos. Workshopsy.2015; São Paulo. https://pt.scribd.com/document/56555504/Arvore-Do-Conhecimento-Maturana-e Varela.
- Young-Hyman, D, De Groot, M, Hill-Brigg, F, Gonzalez, J, Hood, K, Peyrot, M. Psychosocial care for people with diabetes: A position statement of American Diabetes Association. Diabetes Care. 2016; 39: 2126-2140. [CrossRef]
- American Diabetes Association. Lifestyle management: Standards of medical care in diabetes. Diabetes Care. 2019; 42: 46-60. [CrossRef]
- Latham, K. Chronic illness and families. Encyclopedia of Family Studies. 2016; 1–5. [CrossRef]
- Hamilton, E, Carr, A. Systematic review of self-report family assessment measures. Family Process. 2016; 55: 16-30. [CrossRef]
- Smith, D, Donnelly, P, Howe, J, Mumford, T, Campbell, A, Ruddock, A, Wearden, A. A qualitative interview study of people living with well-controlled type 1 diabetes. Psychology & Health. 2018; 33: 872–887. [CrossRef]
- McCarthy, M, Grey, M. Type 1 diabetes self-management from emerging adulthood through older adulthood. Diabetes Care. 2018; 1-7. [CrossRef]
- Lister, Z, Fox, C, Wilson, C. Couples and diabetes: A 30-year narrative review of dyadic relation research. Contemporary Family Therapy. 2013; 35: 613-638. [CrossRef]
- Steinglass, P, Horan, M. Families and chronic medical illness. In F. Walsh, & C. Anderson. Chronic disorders and the families. New York: The Hayworth Press. 1988; 127-142.
- Melo, A, Alarcão, M. Beyond the family cycle: Understanding family development in the twenty-first century through complexity theories. Family Science. 2014, 5: 55-59. [CrossRef]
- Relvas, A, Major, S. (Coord.). Instrumentos de Avaliação Familiar – Funcionamento e Intervenção (Vol.I) [Family Assessment Instruments–Functioning and Intervention (Vol.I)]. Coimbra, Portugal: Imprensa da Universidade de Coimbra. 2014. https://estudogeral.uc.pt/bitstream/10316/41517/1/Avalia%C3%A7%C3%A3o%20Familiar.pdf.
- Walsh, F. Applying a family resilience framework in training, practice, and research: Mastering the art of the possible. Family Process. 2016; 55: 616-632. [CrossRef]
- Franks, M, Sahin, Z, Seidel, A, Shields, C, Oates, S, Boushey, C. Table for two: Diabetes distress and diet-related interactions of married patients with diabetes and their spouses. Families, Systems, & Health. 2012; 30: 154– 165. [CrossRef]
- Ritholz, M, Beste, M, Edwards, S, Beverly, E, Atakov-Castillo, A, Wolpert, H. Impact of continuous glucose monitoring on diabetes management and marital relationships of adults with type 1 diabetes and their spouses: a qualitative study. Diabetic Medicine. 2014; 31: 47–54. [CrossRef]
- Lister, Z, Wilson, C, Fox, C, Herring, R, Simpson, C, Smith, L. Partner expressed emotion and diabetes management among spouses living with Type 2 diabetes. Families, Systems, & Health. 2016; 34: 424– 428. [CrossRef]
- Litchman, M, Wawrzynski, S, Allen, N, Tracy, E, Kelly, C, Helgeson, et al. Yours, mine, and ours: A qualitative analysis of the impact of type 1 diabetes management in older adult married couples Diabetes Spectrum. 2019; 32: 239-248. [CrossRef]
- Due-Christensen, M, Willaing, I, Ismail, K, Forbes, A. Learning about type 1 diabetes and learning to live with it when diagnoses in adulthood: Two distinct but interrelated psychological processes of adaptation: a qualitative longitudinal study. Diabetic Medicine. 2018 ; 1-11. [CrossRef]
- Metsch, J, Tillil, H, Köbberling, J, Sartory, G. On the relation among psychological distress, diabetes-related health behavior, and level of glycosylated hemoglobin in type 1 diabetes. International Journal of Behavioral Medicine. 1995; 2:104-117. [CrossRef]
- Taylor, M, Frier, B, Gold, A, Deary, I. Psychosocial factors and diabetes-related outcomes following diagnosis of type 1 diabetes in adults: The Edinburgh prospective diabetes study. Diabetic Medicine. 2003; 20: 135-146. [CrossRef]
- Sultan, S, Epel, E, Sachon, C, Vaillant, G, Hartemann-Heurtier, A. A longitudinal study of coping, anxiety and glycemic control in adults with type 1 diabetes. Psychology & Health. 2008; 23: 73–89. [CrossRef]
- Watts, S, O’Hara, L, Trigg, R, Living with type 1 diabetes: A by-person qualitative exploration. Psychology & Health. 2010; 25: 491–506. [CrossRef]
- Strandberg, R, Graue, M, Wentzel-Larsen, T, Peyrot, M, Thordarson, H, Rokne, B. Longitudinal relationship between diabetes-specific emotional distress and follow-up HbA1c in adults with type 1 diabetes mellitus. Diabetic Medicine. 2015; 32: 1304–1310. [CrossRef]
- De Groot, M, Gold, S, Wagner, S. Psychological conditions in adults with diabetes. American Psychologist. 2016; 71: 552-562. [CrossRef]
- Hessler, D, Fisher, L, Polonsky, W, Strycker, L, Perters, A et al. Diabetes distress is linked with worsening diabetes management over time in adults with Type 1 diabetes. Diabetes Medicine. 2017. 34: 1228-1234. [CrossRef]
- Anderbro, T, Amsberg, S, Moberg, E, Gonder-Frederick, L, Adamson, U, Lins, E, et al. A longitudinal study of fear of hypoglycaemia in adults with type 1 diabetes. Endocrinology, Diabetes & Metabolism. 2018; 1: 1-5. [CrossRef]
- Dunicheva, M, Zagorovskaya, T., Patrakeeva, E. The role of psychological features in management of patients with type 1 diabetes (case report). Georgian Medicine News. 2018; 67-70. PMID:29745918.
- Rancourt, D, Foster, N, Bollepalli, B, Fitterman, H, Powers, M, Clements, M, Smith, L. Test of the modified dual pathway model of eating disorders in individuals with type 1 diabetes. International Journal of Eating Disorders. 2019; 52: 630–642. [CrossRef]
- Trief, P, Sandberg, J, Greenberg, R, Graff, K, Castronova, N, Yoon, M, et al. Describing support: A qualitative study of couples living with diabetes. Families, Systems, & Health. 2003; 21: 57–67. [CrossRef]
- Helgeson, V, Berg, C, Kelly, C, Van Vleet, M, Zajdel, M, Tracy, E, et al. Patient and partner illness appraisals and health among adults with type 1 diabetes. Journal of Behavioral Medicine. 2019; 42: 480–492. [CrossRef]
- Hill, K, Ward, P, Gleadle, J. "I kind of gave up on it after a while, became too hard, closed my eyes, didn't want to know about it"-adults with type 1 diabetes mellitus describe defeat in the context of low social support. Health Expectations. 2018; 22: 254-261. [CrossRef]
- Roberson, P, Fincham, F. Is relationship quality linked to diabetes risk and management? It depends on what you look at. Families, Systems, & Health. 2018; 36: 315-326.
- Karlsen, B, Bru, E. Coping styles among adults with type 1 and type 2 diabetes. Psychology, Health & Medicine. 2002; 7: 245–259. [CrossRef]
- Wearden, A, Ward, J, Barrowclough, C, Tarrier, N. Attributions for negative events in the partners of adults with type 1 diabetes: Associations with partners’ expressed emotion and marital adjustment. British Journal of Health Psychology. 2006, 11: 1– 21. [CrossRef]
- Schokker, M, Links, T, Bouma, J, Keers, J, Sanderman, R, Wolffenbuttel, B. The role of overprotection by the partner in coping with diabetes: A moderated mediation model. Psychology & Health. 2011; 26: 95– 111. [CrossRef]
- Peyrot, M, Rubin, R, Lauritzen, T, Snoek, F, Matthews, D, Skovlund, S. Psychosocial problems and barriers to improved diabetes management: results of the Cross-National Diabetes Attitudes, Wishes and Needs (DAWN) Study. Diabetic Medicine: a journal of the British Diabetic Association. 2005; 22: 1379–1385. [CrossRef]
- Ridge, K, Treasure, J, Forbes, A, Thomas, S, Ismail, K. Themes elicited during motivational interviewing to improve glycaemic control in adults with type 1 diabetes mellitus, Diabetic Medicine. 2011; 29: 148-152. [CrossRef]
- Spek, V, Nefs, G, Mommersteeg, P, Speight, J, Pouwer, F, Denollet, J. Type D personality and social relations in adults with diabetes: results from diabetes MILES - The Netherlands. Psychology & Health. 2018; 33: 1456–1471. [CrossRef]
- White, P, Smith, S, O’Dowd, T. The role of the family in adult chronic Illness: A review of the literature on type 2 diabetes. The Irish Journal of Psychology. 2005; 26: 9–15. [CrossRef]
- Rintala, T, Paavilainen, P, Åstedt-Kurki, D. Everyday life of a family with diabetes as described by adults with type 1 diabetes. European Diabetes Nursing. 2013; 10: 86-90. [CrossRef]
- Jacobson, A, Hauser, S, Cole, C, Willett, J, Wolfsdorf, J, Dvorak, R, et al. Social relationships among young adults with Insulin-dependent diabetes mellitus: Ten-year follow-up of an onset cohort. Diabetic Medicine. 1997; 14: 73-79. [CrossRef]
- Pinhas-Hamiel, O, Tish, E, Levek, N, Bem-David, R, Graf-Bar-El, C, Yaron, M, et al. Sexual lifestyle among young adults with type 1 diabetes. Diabetes Metabolism Research and Review. 2010; 33: 1-6. [CrossRef]
- Palladino, D, Helgeson, V, Reynolds, K, Becker, D, Siminerio, L, Escobar, O. Emerging adults with type 1 diabetes: A comparison to peers without diabetes. Journal of Pediatric Psychology. 2013; 38: 506-517. [CrossRef]
- Schabert, J, Browne, J, Mosely, K, Speight, J. Social stigma in diabetes. The Patient-Patient Centered Outcomes Research. 2013; 6: 1–10. [CrossRef]
- Helgeson, V, Mascatelli, K, Reynolds, K, Becker, D, Escobar, O, Siminerio, L. Friendship and romantic relationships among emerging adults with and without type 1 diabetes. Journal of Pediatric Psychology. 2015; 40: 359–372. [CrossRef]
- Dickinson, J, Maryniuk, M. Building therapeutic relationships: Choosing words that put people first. Clinical Diabetes Journals. 2017 ; 35: 51-54. [CrossRef]
- López-Larrosa, S. Quality of life, treatment adherence, and locus of control: Multiple family groups for chronic medical illness. Family Process. 2013; 52:, 685-696. [CrossRef]
- Baig, A, Benitez, A, Quinn, M, Burnet, D. Family interventions to improve diabetes outcomes for adults. Annals of the New York Academy of Sciences. 2015; 1353: 89-112. [CrossRef]
- Robinson, C. Families living well with chronic illness: The healing process of moving on. Chronicity, 2017; 27: 447-461. [CrossRef]
- Martire, L, Helgeson, V. Close relationships and management of chronic illness: Associations and interventions. American Psychologist. 2017; 72: 601-612. [CrossRef]
- Engel, G. The Biopsychosocial model and the education of health professionals? Annals of the New York Academy of Sciences. 1978; 310: 169–181. [CrossRef]
- Institute of Medicine. Health and behavior: The interplay of biological, behavioral, and societal influences. Washington, DC: The National Academies Press. 2001. [CrossRef]
- Morin, E. Introdução ao pensamento complexo. (4th ed.). Epistemologia e Sociedade: Instituto Piaget. 2003.
- Rolland, J. Chronic illness and the life cycle: A conceptual framework. Family Process. 1987; 26: 203-221. [CrossRef]
- Rolland, J. Families, illness, and disability: An integrative treatment model. New York, Basic Books.1994.
- Rolland, J. Mastering family challenges in serious illness and disability. In F. Walsh. (4th ed.). Normal Family Process. 2012; 452-482. New-York, N.Y.: Guildford Press.
- White, M, Epston, D. Narrative means to therapeutic ends. New York: W. W. Norton. 1990.
- Rolland, J. A family psychosocial map with chronic conditions. In J. Rolland. Helping couples and families navigate illness and disability: An integrated approach. 2018; 3-18. New York, N.Y.: Guilford Press.
- Anderson, R, Freelan, K, Clouse, R, & Lustman, P (2001). The prevalence of comorbid depression in adults with diabetes: a meta-analysis. Diabetes Care; 2001. 24: 1069-1078. [CrossRef]
- Wechsler, D. Escala de inteligência de Wechsler para adultos-Terceira Edição (WAIS-III [WAIS- Wechsler Adult Intelligence Scale (3rd. Ed.)]. Adaption, validation and normative study for Portuguese population by C. Ferreira, M. Machado, & A. Rocha. Lisbon: Cegoc. 2008.
- Raven, J, Raven, J, Court, J. Matrizes Progressivas Coloridas de Raven, CPM-P. Lisboa: Cegoc. 2009.
- Freitas, S, Simões, M, Alves, L, Santana, I. Montreal Cognitive Assessment (MoCA): Normative study for the portuguese population. Journal of Clinical and Experimental Neuropsychology. 2011; 33: 989-996. [CrossRef]
- Narciso, I, Costa, M. Amores Satisfeitos, mas não perfeitos [Pleased but not perfect loves]. Cadernos de Consulta Psicológica. 1996; 12: 115-130. https://repositorio-aberto.up.pt/handle/10216/15550.
- Lee, B. Development of a congruence scale based on the Satir model. Contemporary Family Therapy. 2002; 24: 217-239. [CrossRef]
- Cunha, D, Silva, J, Relvas, A. Congruence scale (CS). In A.P. Relvas & S. Major (Coord.), Instrumentos de Avaliação Familiar – Funcionamento e Intervenção (Vol. I) [Family Assessment Instruments – Functioning and Intervention (Vol. I)] (pp. 23–41). Coimbra, Portugal: Imprensa da Universidade de Coimbra.2014 https://estudogeral.uc.pt/bitstream/10316/41517/1/Avalia%C3%A7%C3%A3o%20Familiar.pdf.
- Wretman, C. Saving Satir: Contemporary perspectives on the change process model. Social Work. 2015; 61: 61–68. [CrossRef]
- Walsh, F. Spiritual diversity: Multifaith perspectives in family therapy. Family Process. 2010. 49: 330-348. [CrossRef]
- Stratton, P, Bland, J, Janes, E, Lask, J. (2010). Developing an indicator of family function and a practicable outcome measure for systemic family and couple therapy: The SCORE. Journal of Family Therapy. 2010; 32: 232–258. [CrossRef]
- Vilaça, M, Silva, J, Relvas, A. Systemic clinical outcome routine evaluation (SCORE-15). In A. P. Relvas & S. Major (Coord.), Instrumentos de Avaliação Familiar – Funcionamento e Intervenção (Vol. I) [Family Assessment Instruments – Functioning and Intervention (Vol. I)] (pp. 23–41). Coimbra, Portugal: Imprensa da Universidade de Coimbra. 2014. https://estudogeral.uc.pt/bitstream/10316/41517/1/Avalia%C3%A7%C3%A3o%20Familiar.pdf.
- Simões, J. Qualidade de vida. Estudo de validação para a população portuguesa. [Quality of life: Validation study for Portuguese population] (No published thesis master). Faculty of Psychology and Educational Sciences: University of Coimbra. 2008 https://estudogeral.uc.pt/bitstream/10316/17369/3/Joana%20Sim%c3%b5es.pdf.
- Paddison, C. Family support and conflict among adults with type 2 diabetes. European Diabetes Nursing. 2010; 7: 29–33. [CrossRef]
- Lewin, A., Geffken, G., Heidgerken, A., Duke, D. , Novoa, W., Williams, L., Storch, E. The diabetes family behavior checklist: A psychometric evaluation. Journal of Clinical Psychology in Medical Settings. 2005; 12: 315–322. [CrossRef]
- Van Strien, T, Frijters, J , Bergers, G, Defares, P. The Dutch Eating Behavior Questionnaire (DEBQ) for assessment of restrained, emotional, and external eating behavior. International Journal of Eating Disorders. 1986; 5: 295–315. [CrossRef]
- Viana, V, Sinde, S. Estilo alimentar: adaptação e validação do questionário holandês do comportamento alimentar [Eating style: adaptation and validation of the Dutch Eating Behavior Questionnaire]. Psicologia: Teoria, Investigação e Prática. 2003. 8: 59-71. https://www.researchgate.net/publication/236649218_ESTILO_ALIMENTAR_Adaptacao_e_validacao_do_Questionario_Holandes_do_Comportamento_Alimentar.
- Ghasemi, A, Zahediasl, S. Normality tests for statistical analysis: A guide for non-statisticians. International Journal of Endocrinology & Metabolism. 2012; 10: 486-489.
- Kos, A, Psenicka, C. Measuring cluster similarity across methods. Psychological Reports. 2000; 86: 858-862. [CrossRef]
- Maroco, J. Análise estatística com utilização do SPSS [Statistical analysis using SPSS] (3rd ed.). Lisboa: Edições Sílabo. 2007.
- Cohen, J. Statistical Power Analysis. Current Directions in Psychological Science. 1992; 1: 98–101. [CrossRef]
- Fisher, L. Research on the family and chronic disease among adults: Major trends and directions. Families, Systems & Health. 2006; 24: 373– 380. [CrossRef]
- Fonseca, G, Cunha, D, Crespo, C, Relvas, A. Families in the context of macroeconomic crises: A systematic review. Journal of Family Psychology. 2016; 30: 687-697. [CrossRef]
- Broadley, M, Bishop, T, M, Andrew, B. The relationship between attentional bias to food and disordered eating in females with type 1 diabetes. Appetite. 2019; 140: 269-276. [CrossRef]
- Schafer, L, McCaul, K, Glasgow, R. (1986). Supportive and nonsupportive family behaviors: relationships to adherence and metabolic Control in persons with type I diabetes. Diabetes Care. 1986. 9: 179–185. [CrossRef]
- Jacobson, A, Samson, J, Weinger, K, Ryan, C. Diabetes, the brain, and behavior: Is there a biological mechanism underlying the association between diabetes and depression? Glucose Metabolism in the Brain. 2002; 455–479. [CrossRef]
- Pereira, M, Pedras, S, Machado, J. Family variables as moderators between beliefs towards medicines and adherence to self-care behaviors and medication in type 2 diabetes. Families, Systems, & Health. 2014; 32: 198-206. [CrossRef]
- Hunter, C. Understanding diabetes and the role of psychology in its prevention and treatment. American Psychologist. 2016; 71: 515-525. [CrossRef]
- Jonhson, S. Increasing psychology`s role in health research and health care. American Psychologist. 2013; 311-321. [CrossRef]
- Jonhson, S, Marrero, D. Innovations in healthcare delivery and policy: Implications for the role of the psychologist in preventing and treating diabetes. American Psychologist. 2016; 71: 628-637. [CrossRef]
Figure 1.
Study Conceptual Map of illness characteristics, family and social reciprocal influences in diabetes management, based on Family System Illness Model (FSIM).
Figure 1.
Study Conceptual Map of illness characteristics, family and social reciprocal influences in diabetes management, based on Family System Illness Model (FSIM).
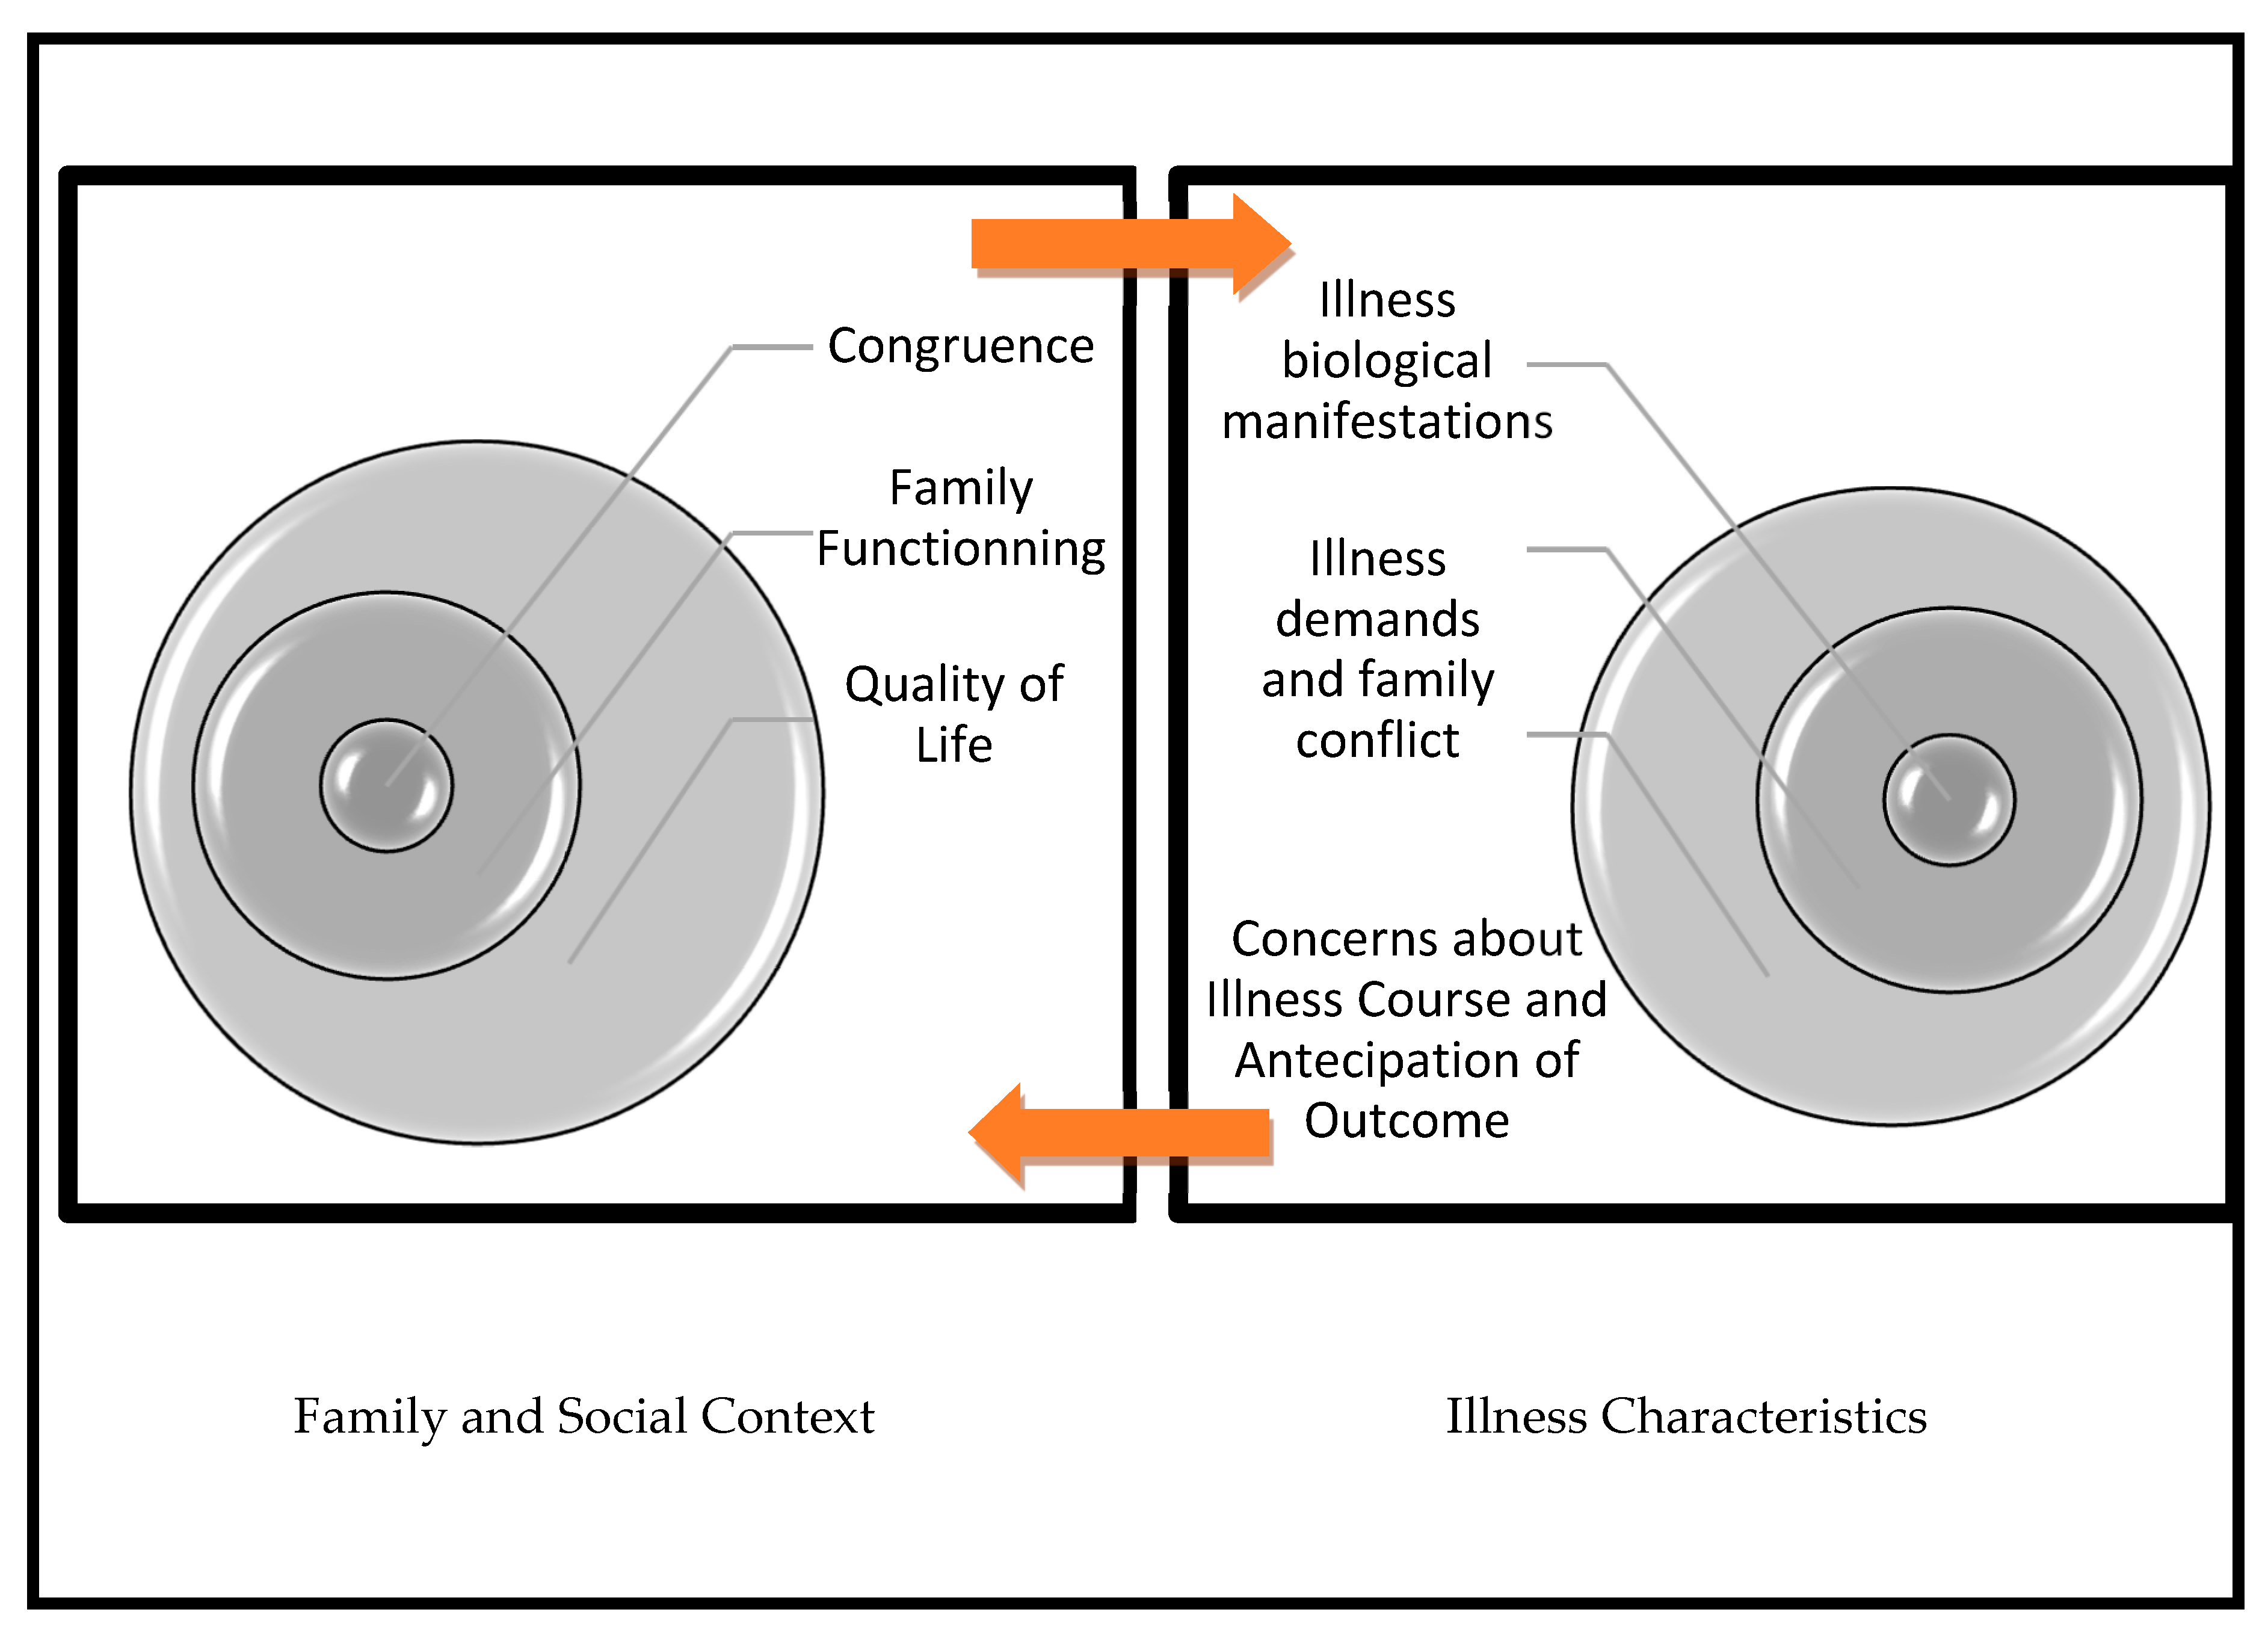
Figure 2.
On the right. Weight of each introduced variable for cluster formation: SCORE-15, Quality of Life and Congruence. On the left, direction of each variable for Cluster 1 (MC group) and Cluster 2 (NoMC group) through cluster comparison.
Figure 2.
On the right. Weight of each introduced variable for cluster formation: SCORE-15, Quality of Life and Congruence. On the left, direction of each variable for Cluster 1 (MC group) and Cluster 2 (NoMC group) through cluster comparison.
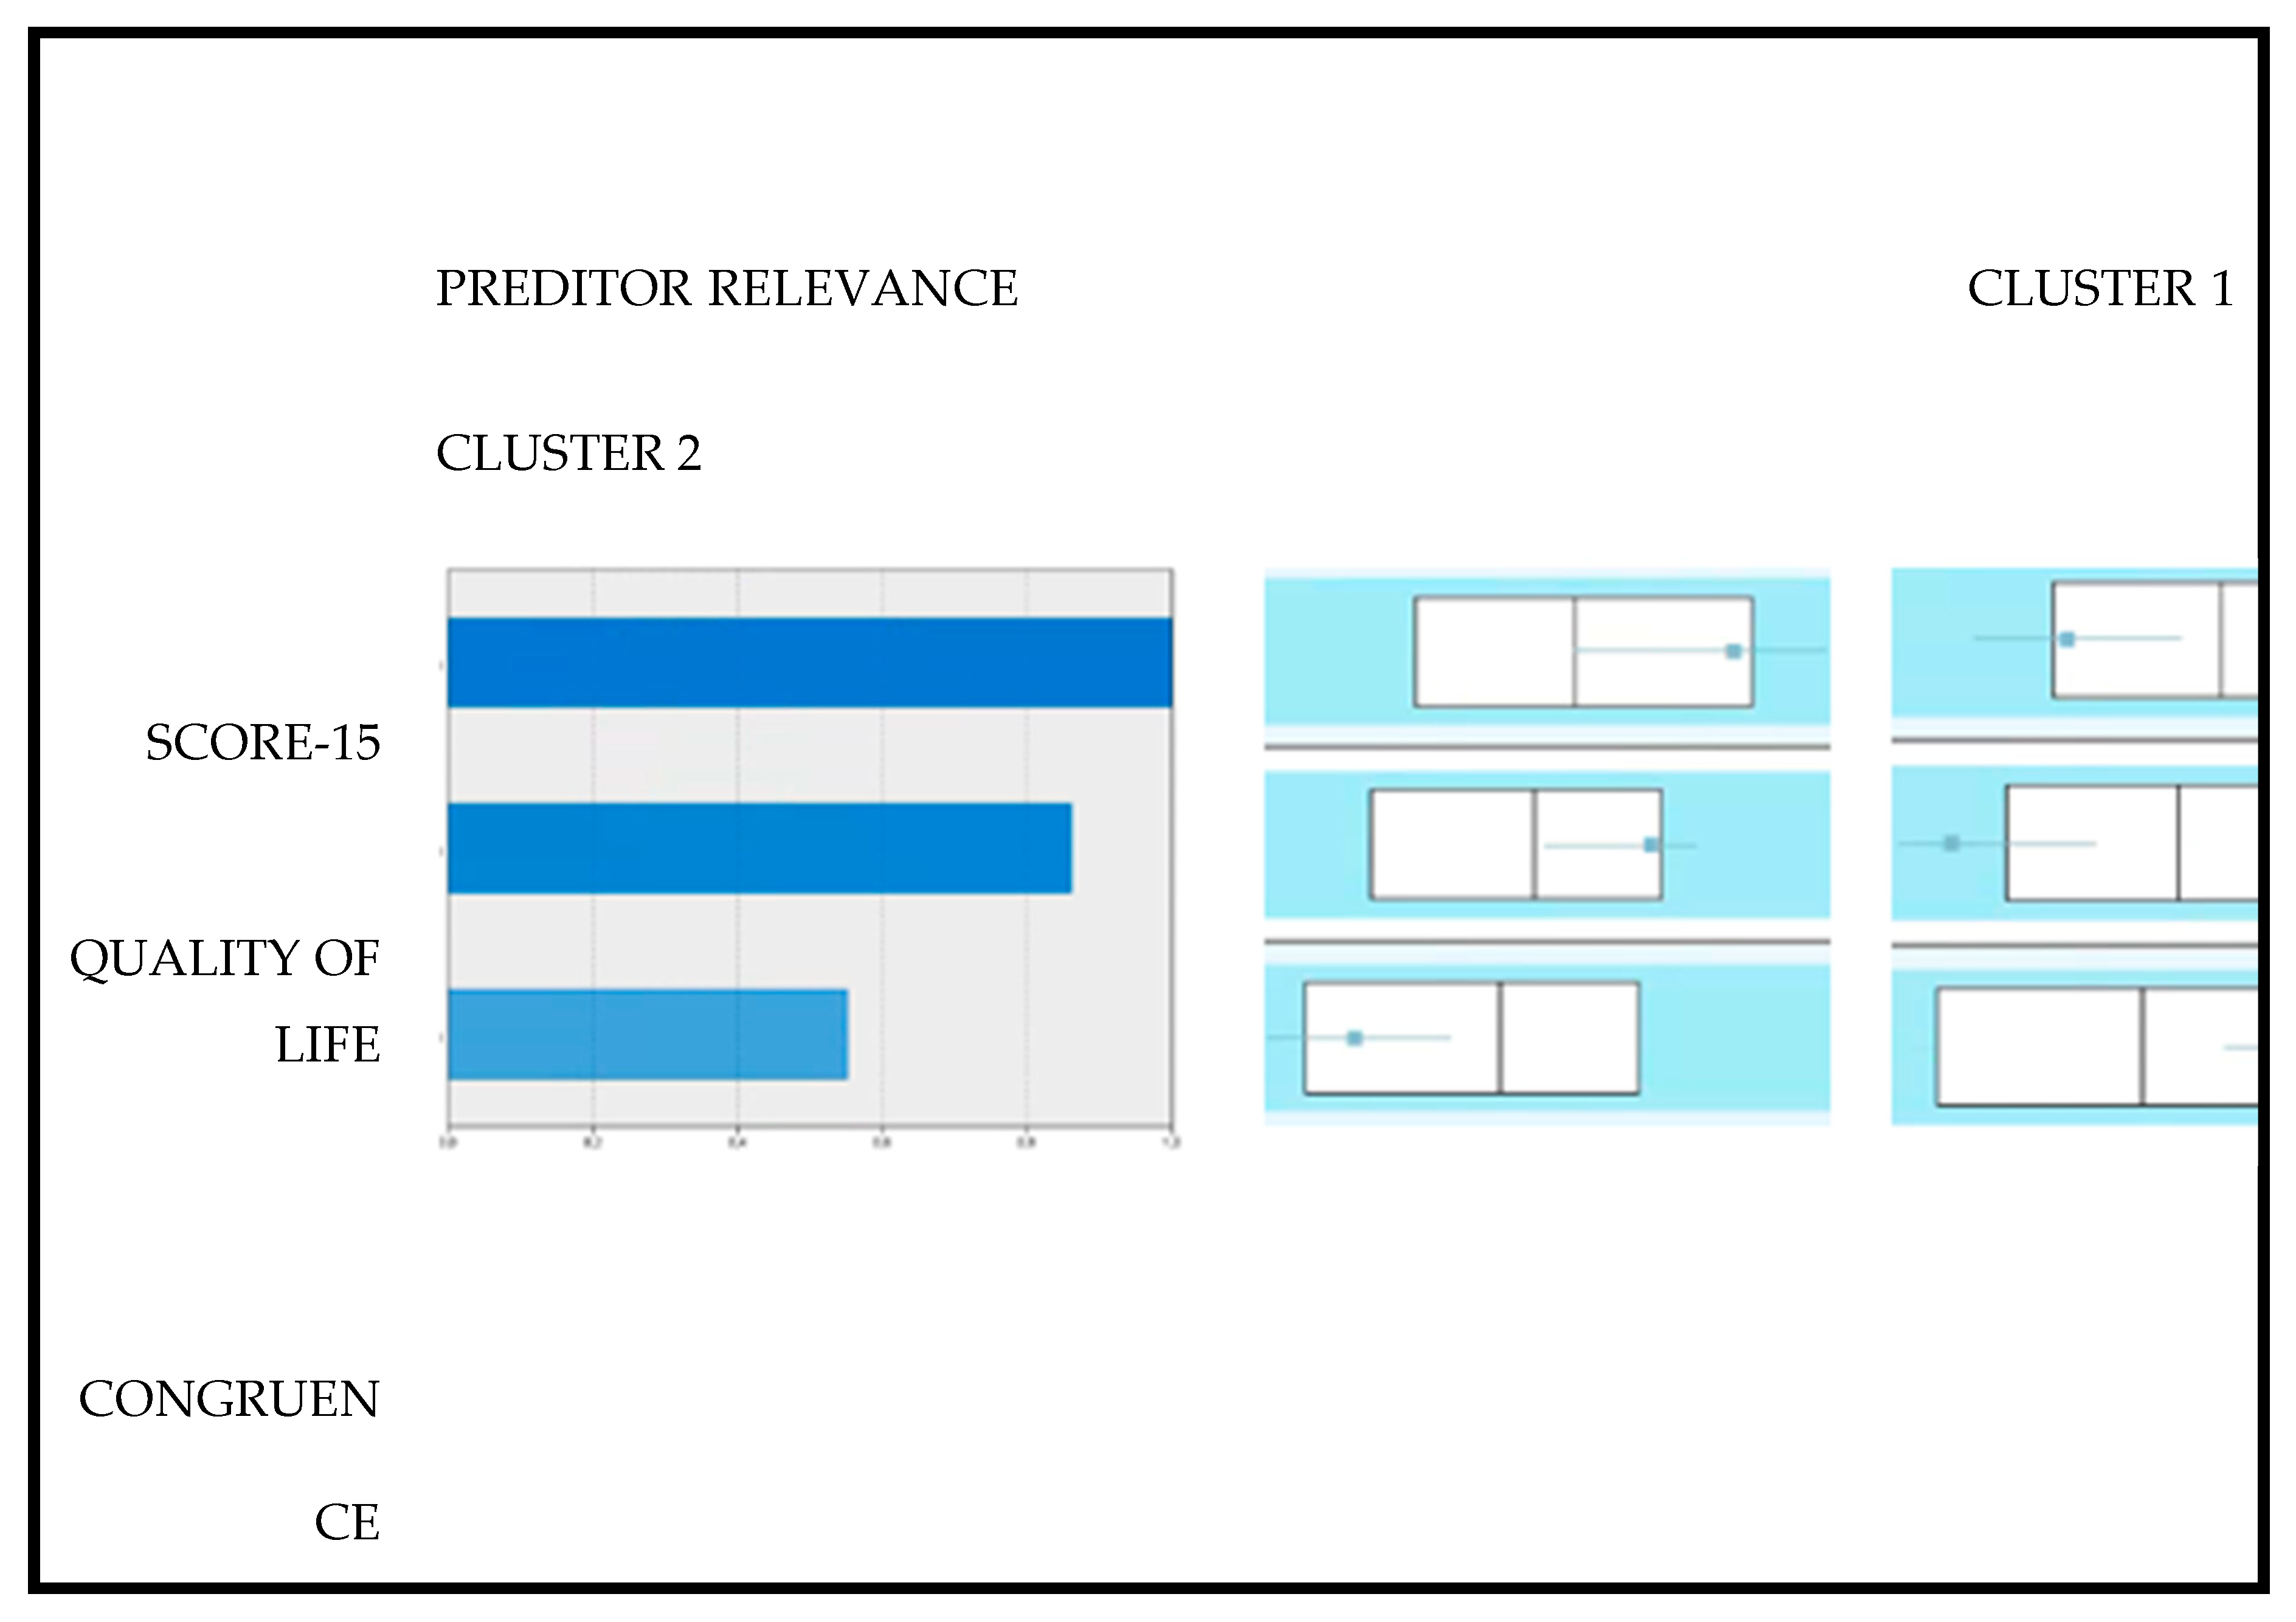

Table 1.
Demographic Characteristics, Cognitive and clinical features for MC and NoMC groups in mean and standard deviation (N=91).
Table 1.
Demographic Characteristics, Cognitive and clinical features for MC and NoMC groups in mean and standard deviation (N=91).
| Variables |
MC (N=49) |
NoMC (N=42) | X2 | t | U | gl | p | d |
| Gender (males/females) | 31/18 | 25/17 | 0.134 | ----- | ----- | ----- | 0.824 | 0.07 |
| Age (in years) | 37.20 (9.47) | 36.19 (8.67) | ----- | 0.529 | ----- | 89 | 0.59 | -0.11 |
| Marital Status (Single/Couple) | 22/27 | 24/18 | 1.367 | ----- | ----- | 1 | 0.244 | 0.07 |
| Members of the Household (1/2/3)** | 17/28/3 | 16/21/5 | 1.695 | ----- | ----- | 1 | 0.428 | 0.08 |
| Household income B (1/2) | 33/15 | 16/26 | 8.94 | ----- | ----- | 1 | 0.003 | 0.66 |
| Residence (1/2/3) | 20/12/16 | 16/17/9 | 2.97 | ----- | ----- | 2 | 0.226 | 0.36 |
| Area of Residence (1/2/3) | 38/8/3 | 28/8/6 | 1.98 | ----- | ----- | 2 | 0.372 | 0.06 |
| Educational level* (1/2) | 17/32 | 27/15 | 7.93 | ----- | ----- | 1 | 0.005 | 0.61 |
| Vocabulary | 32.33 (3.47) | 33.60 (2.81) | ----- | ----- | 807 | ----- | 0.075 | 0.034 |
| Digit Memory | 14.73(2.08) | 14.10 (1.92) | ----- | ----- | 1273 | ----- | 0.05 | 0.416 |
| RPMT | 8.04(0.90) | 8.05 (1.01) | ----- | ----- | 981 | ----- | 0.688 | 0.08 |
| Disease onset (<18;>18 years) | 24/25 | 24/18 | 0.605 | ------- | ------ | 1 | 0.382 | 0.16 |
| Dealing Time with Disease | 17.56 (10.38) | 17.21 (9.58) | ------- | -0.161 | ------ | 89 | 0.870 | -0.034 |
| HbA1c | 7.19 (0.65) | 8.52 (1.22) | ------- | 6.329 | ---------- | 89 | <0.001*** | 0.07 |
| BMI | 24.95 (3.31) | 25.20 (3.81) | ------ | ------- | 989 | ---- | 0.750 | 0.067 |
| Complications (Yes/No) | 21/28 | 30/12 | 7.94 | ------ | ------- | 1 | 0.006** | 0.62 |
| Smoking status (Yes/No) | 11/38 | 7/35 | 0.48 | ------ | ------- | 1 | 0.49 | 0.14 |
Educational level (1= 12 years, secondary education) 2= university degree or higher; Household income (1=stable; 2= unstable); Members of the Household (1= living alone 2=living as a couple 3=living with children);Residence as distance to health services, in travel time (1=Coimbra; 2= <1h; 3= >1h; Area of Residence (1=Urban; 2=Semi-Urban; 3= Rural); RPMT Raven's Progressive Matrices Tests; BMI body mass index.
Table 2.
Descriptive statistics and results of mean comparison between groups for subscales of SCORE-15, Quality of Life and Congruence Scale (N=91).
Table 2.
Descriptive statistics and results of mean comparison between groups for subscales of SCORE-15, Quality of Life and Congruence Scale (N=91).
| Variables | Participants with MC (n=49) | Participants with NoMC (n=42) | U | t | gl | p | d | ||||||||
| M | SD | 1stQ | 2ndQ | 3rdQ | M | SD | 1stQ | 2ndQ | 3rdQ | ||||||
| SCORE-15 | |||||||||||||||
| Family Strengths | 1.65 | 0.64 | 1.40 | 1.80 | 2.13 | 1.86 | 0.65 | 1.20 | 1.40 | 2.00 | 1141.5 | --- | -- | 0.002 | 0.33 |
| Family Difficulties | 1.63 | 0.60 | 1.80 | 2.60 | 2.85 | 2.43 | 0.71 | 1.20 | 1.60 | 2.00 | 411 | --- | -- | <0.001 | 1.22 |
| Family Communication | 1.87 | 0.65 | 2.20 | 2.80 | 3.20 | 2.68 | 0.74 | 1.40 | 1.80 | 2.15 | 423 | --- | -- | <0.001 | 1.16 |
| CONGRUENCE SCALE | |||||||||||||||
| Intra/Interpersonal | 48.57 | 7.37 | 45.50 | 50.00 | 53.50 | 42.81 | 8.33 | 37.75 | 42.00 | 48.00 | 1495.5 | --- | -- | <0.001 | -0.73 |
| Universal Congruence | 33.76 | 10.78 | 28.50 | 35.00 | 42.00 | 25.45 | 9.25 | 17.00 | 25.00 | 32.00 | 1504 | --- | -- | <0.001 | -0.83 |
| QUALITY OF LIFE Scale | |||||||||||||||
| Financial | 22.37 | 4.81 | 19.00 | 22.00 | 27.00 | 19.07 | 4.34 | 16.00 | 19.00 | 22.00 | 1430.5 | --- | -- | <0.001 | -0.72 |
| Time | 12.43 | 2.98 | 11.00 | 13.00 | 15.00 | 11.57 | 2.08 | 10.00 | 11.50 | 13.00 | --- | -1.56 | 89 | 0.120 | -0.33 |
| Neighborhood | 20.35 | 3.74 | 18.00 | 20.00 | 23.00 | 18.33 | 3.33 | 16.00 | 18.00 | 21.00 | --- | -2.69 | 89 | 0.009 | -0.57 |
| Home Conditions | 18.22 | 3.32 | 16.00 | 18.00 | 20.00 | 18.33 | 3.06 | 16.00 | 18.50 | 20.25 | --- | 0.16 | 89 | 0.870 | 0.03 |
| Mass Media | 9.22 | 2.18 | 8.00 | 9.00 | 10.00 | 9.24 | 2.58 | 7.00 | 9.00 | 11.00 | --- | 0.027 | 89 | 0.978 | 0.01 |
| Social/Health Relationships | 14.90 | 2.48 | 14.00 | 15.00 | 16.00 | 12.81 | 2.38 | 11.00 | 13.00 | 14.00 | 1553 | --- | -- | <0.001 | -0.86 |
| Job | 9.90 | 2.73 | 8.50 | 10.00 | 11.50 | 8.62 | 2.19 | 7.00 | 8.00 | 10.00 | --- | 2.44 | 89 | 0.017 | -0.51 |
| Religion | 6.39 | 1.90 | 6.00 | 6.00 | 8.00 | 5.05 | 2.28 | 3.00 | 5.00 | 7.00 | 1365 | --- | -- | 0.006 | -0.64 |
| Family/Marital | 8.24 | 1.70 | 8.00 | 8.00 | 10.00 | 6.95 | 1.89 | 6.00 | 7.00 | 8.00 | 1447.5 | --- | -- | 0.001 | -0.72 |
| Children | 6.94 | 2.18 | 5.00 | 7.00 | 9.00 | 7.00 | 2.07 | 5.00 | 7.50 | 8.25 | 1026 | --- | -- | 0.981 | 0.03 |
| Education | 7.49 | 1.48 | 7.00 | 8.00 | 8.00 | 6.40 | 1.49 | 5.00 | 6.00 | 8.00 | 1411.5 | --- | -- | 0.002 | -0.73 |
Table 3.
Summary of binary logistic regression analyses of four categories of variables (Sociodemographic, Relevant Clinical Features, Family Systems and Eating Behavior) predicting participants’ NoMC.
Table 3.
Summary of binary logistic regression analyses of four categories of variables (Sociodemographic, Relevant Clinical Features, Family Systems and Eating Behavior) predicting participants’ NoMC.
| Variables | Binary Logistic Regression for NoMC | |||||
| B | Exp(B) | 95%IC | p | |||
| Sociodemographic data | ||||||
| Income | -1.22 | 0.29 | 0.12-0.74 | 0.009 | ||
| Level of education | -1.29 | 0.27 | 0.11-0.68 | 0.005 | ||
| Clinical Features | ||||||
| HbA1c Values | 1.73 | 5.62 | 2.59-12.24 | <0.001 | ||
| Family Systems | ||||||
| SCORE-15 | 1.43 | 4.17 | 1.15-11.27 | 0.005 | ||
| ECongruence | -0,05 | 0.96 | 0.92-0.99 | 0.01 | ||
| Eating Behavior | ||||||
| Emotional Ingestion | 0..69 | 2.27 | 1.24-4.13 | 0.008 | ||
Table 4.
Marital functioning (EASAVIC subscale) results for participants with diabetes (N=45).
| Variables | Couples with MC (n=27) | Couples NoMC (n=18) | U | p | d | ||||||||
| M | SD | 1stQ | 2ndQ | 3rdQ | M | SD | 1stQ | 2ndQ | 3trQ | ||||
| MARITAL FUNCTIONING | |||||||||||||
| Total | 3.86 | 0.78 | 3.40 | 3.80 | 4.35 | 2.88 | 0.63 | 2.25 | 2.77 | 3.45 | 406 | <0.001 | 1.21 |
| FF | 4.76 | 1.09 | 3.75 | 4.75 | 6.00 | 3.61 | 1.03 | 2.50 | 3.35 | 4.50 | 376.5 | 0.002 | 1.29 |
| FT | 3.97 | 1.16 | 3.00 | 4.00 | 5.00 | 2.94 | 0.92 | 2.00 | 3.00 | 3.63 | 365.5 | 0.004 | 1.33 |
| AUT | 3.95 | 1.03 | 4.00 | 4.75 | 5.50 | 4.76 | 0.86 | 3.00 | 3.75 | 4.75 | 353 | 0.010 | 1.36 |
| EFR | 3.75 | 0.88 | 4.30 | 4.75 | 6.00 | 4.95 | 0.84 | 3.00 | 3.63 | 4.17 | 408 | <0.001 | 1.21 |
| CC | 3.56 | 1.02 | 4.52 | 5.00 | 5.70 | 4.91 | 1.05 | 3.00 | 3.14 | 4.53 | 400 | <0.001 | 1.23 |
Marital Functioning Dimensions: FF (familiar functioning); FT (free time); AUT (Autonomy); EFR (Extra-familiar relationships); CC(communication and conflicts).
Disclaimer/Publisher’s Note: The statements, opinions and data contained in all publications are solely those of the individual author(s) and contributor(s) and not of MDPI and/or the editor(s). MDPI and/or the editor(s) disclaim responsibility for any injury to people or property resulting from any ideas, methods, instructions or products referred to in the content. |
© 2025 by the authors. Licensee MDPI, Basel, Switzerland. This article is an open access article distributed under the terms and conditions of the Creative Commons Attribution (CC BY) license (http://creativecommons.org/licenses/by/4.0/).
Copyright: This open access article is published under a Creative Commons CC BY 4.0 license, which permit the free download, distribution, and reuse, provided that the author and preprint are cited in any reuse.


