Submitted:
21 April 2025
Posted:
21 April 2025
You are already at the latest version
Abstract
This study explores the use of geometric progression as a mathematical tool to analyze and predict the growth behavior of renewable energy systems, such as hydropower and ocean energy. Such forms of energy have shown increased uptake due to technological advancements and the global push towards sustainability. The paper analyzes the use of geometric progression in describing historical energy output and projecting future capacity using actual data. However, findings indicate towards the limitation in geometric progression's predictive accuracy in the long term due to the nonlinear and complex nature of the impacts from technology, economics, and the environment. Findings emphasize the need for more secure, multi-variable models while forecasting the trajectory of renewable energy systems.
Keywords:
Geometric Progression
; Forecasting
; Hydropower
; Ocean Energy
1. Introduction
The need to abate climate change and reduce carbon emissions has swung the world toward clean energy alternatives such as ocean energy and hydropower. Not only is this clean energy sustainable, but it is essential to achieving ultimate energy security over the long run. One compelling aspect of developing them is in the geometric form of growth the development has achieved—exemplified in exponentially increasing technological advance, capacity installations, and share of the market over time [1,2].
This research utilizes geometric progression to assess the extent to which it can describe the past and future trends of hydropower and ocean energy development. Geometric progression is a method of quantifying the exponential growth seen in such industries, enabling us to calculate future output based on past data. The article critically evaluates the usefulness and reliability of such a mathematical technique in capturing the dynamic nature of renewable energy development [3].
Hydropower is one of the oldest renewable technologies, and it makes electricity using the energy of running water. It has evolved with improvements in turbine efficiency and in infrastructure (Figure 1). Ocean energy, comprising wave and tidal power, has only recently begun to go large-scale [21,22,23], with the spur of technologies such as the Waveline Magnet (Figure 2), which converts sea wave energy into electrical power. Knowledge and forecasting of energy production patterns are crucial in planning, investment, and policymaking. As energy demand continues to rise, forecasting the possibility of hydropower and marine systems is imperative to minimize fossil fuel reliance [24,25,26]. This research analyzes whether geometric progression can provide such forecasting data, along with demonstrating the limitations and implications of the approach [4,5,6].
Hydropower, which extracts energy from flowing water, has long been a part of the worldwide energy mix. Its expansion has been characterized by advances in turbine technology (see Figure 1), better efficiency, and the creation of new projects worldwide [7,8].
Ocean energy, although a new topic, has experienced a surge of interest due to its immense potential. Tidal and wave energy technologies (see Figure 2) are developing fast, with pilot schemes becoming business initiatives at a record rate. The economic contribution of such fast development is significant. It has contributed to higher investment, employment, and market reorientation in the energy sector [27,28]. However, this development is not without challenges. It is necessary for the proper development of such industries to achieve economic objectives while maintaining environmental sustainability and social implications [8].
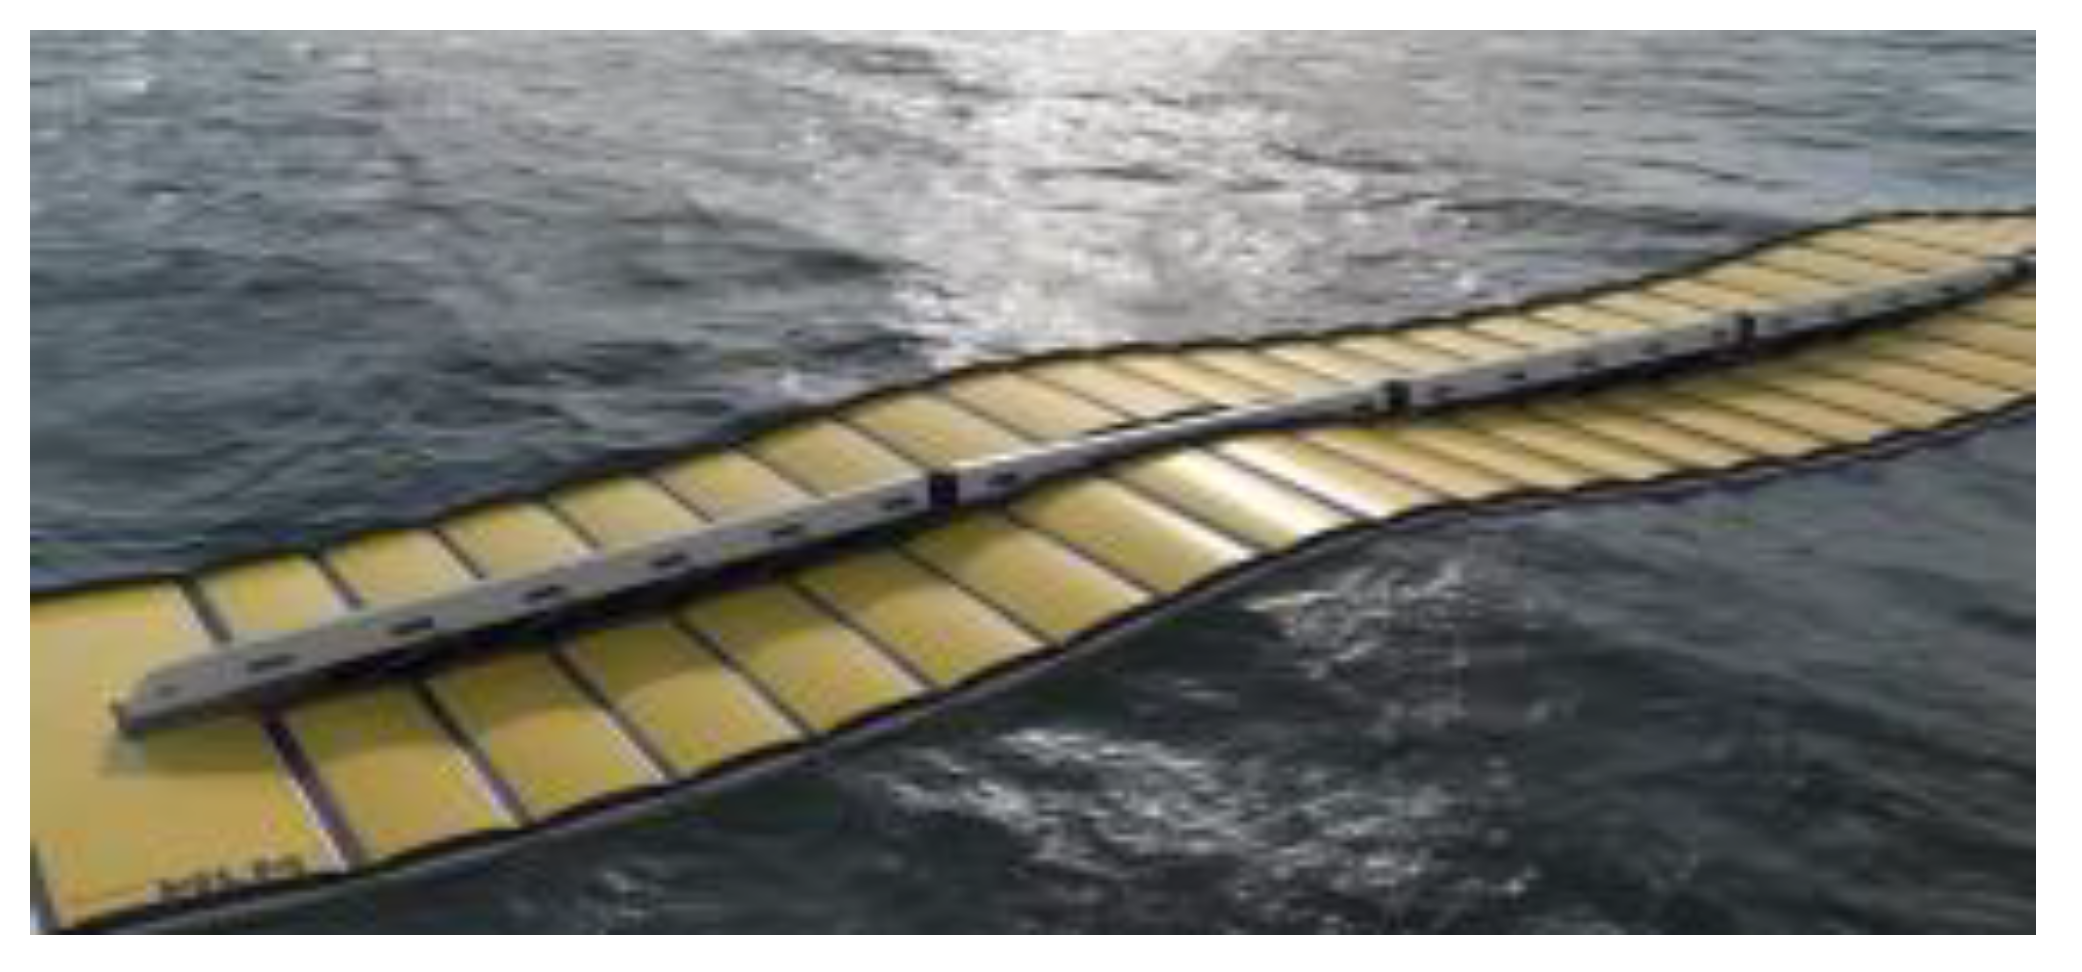
Figure 2.
Cyprus-based Sea Wave Energy Limited’s Waveline Magnet Prototype (Joaquin Victor Tacla, 2022).
Figure 2.
Cyprus-based Sea Wave Energy Limited’s Waveline Magnet Prototype (Joaquin Victor Tacla, 2022).
1.2. Problem Statement
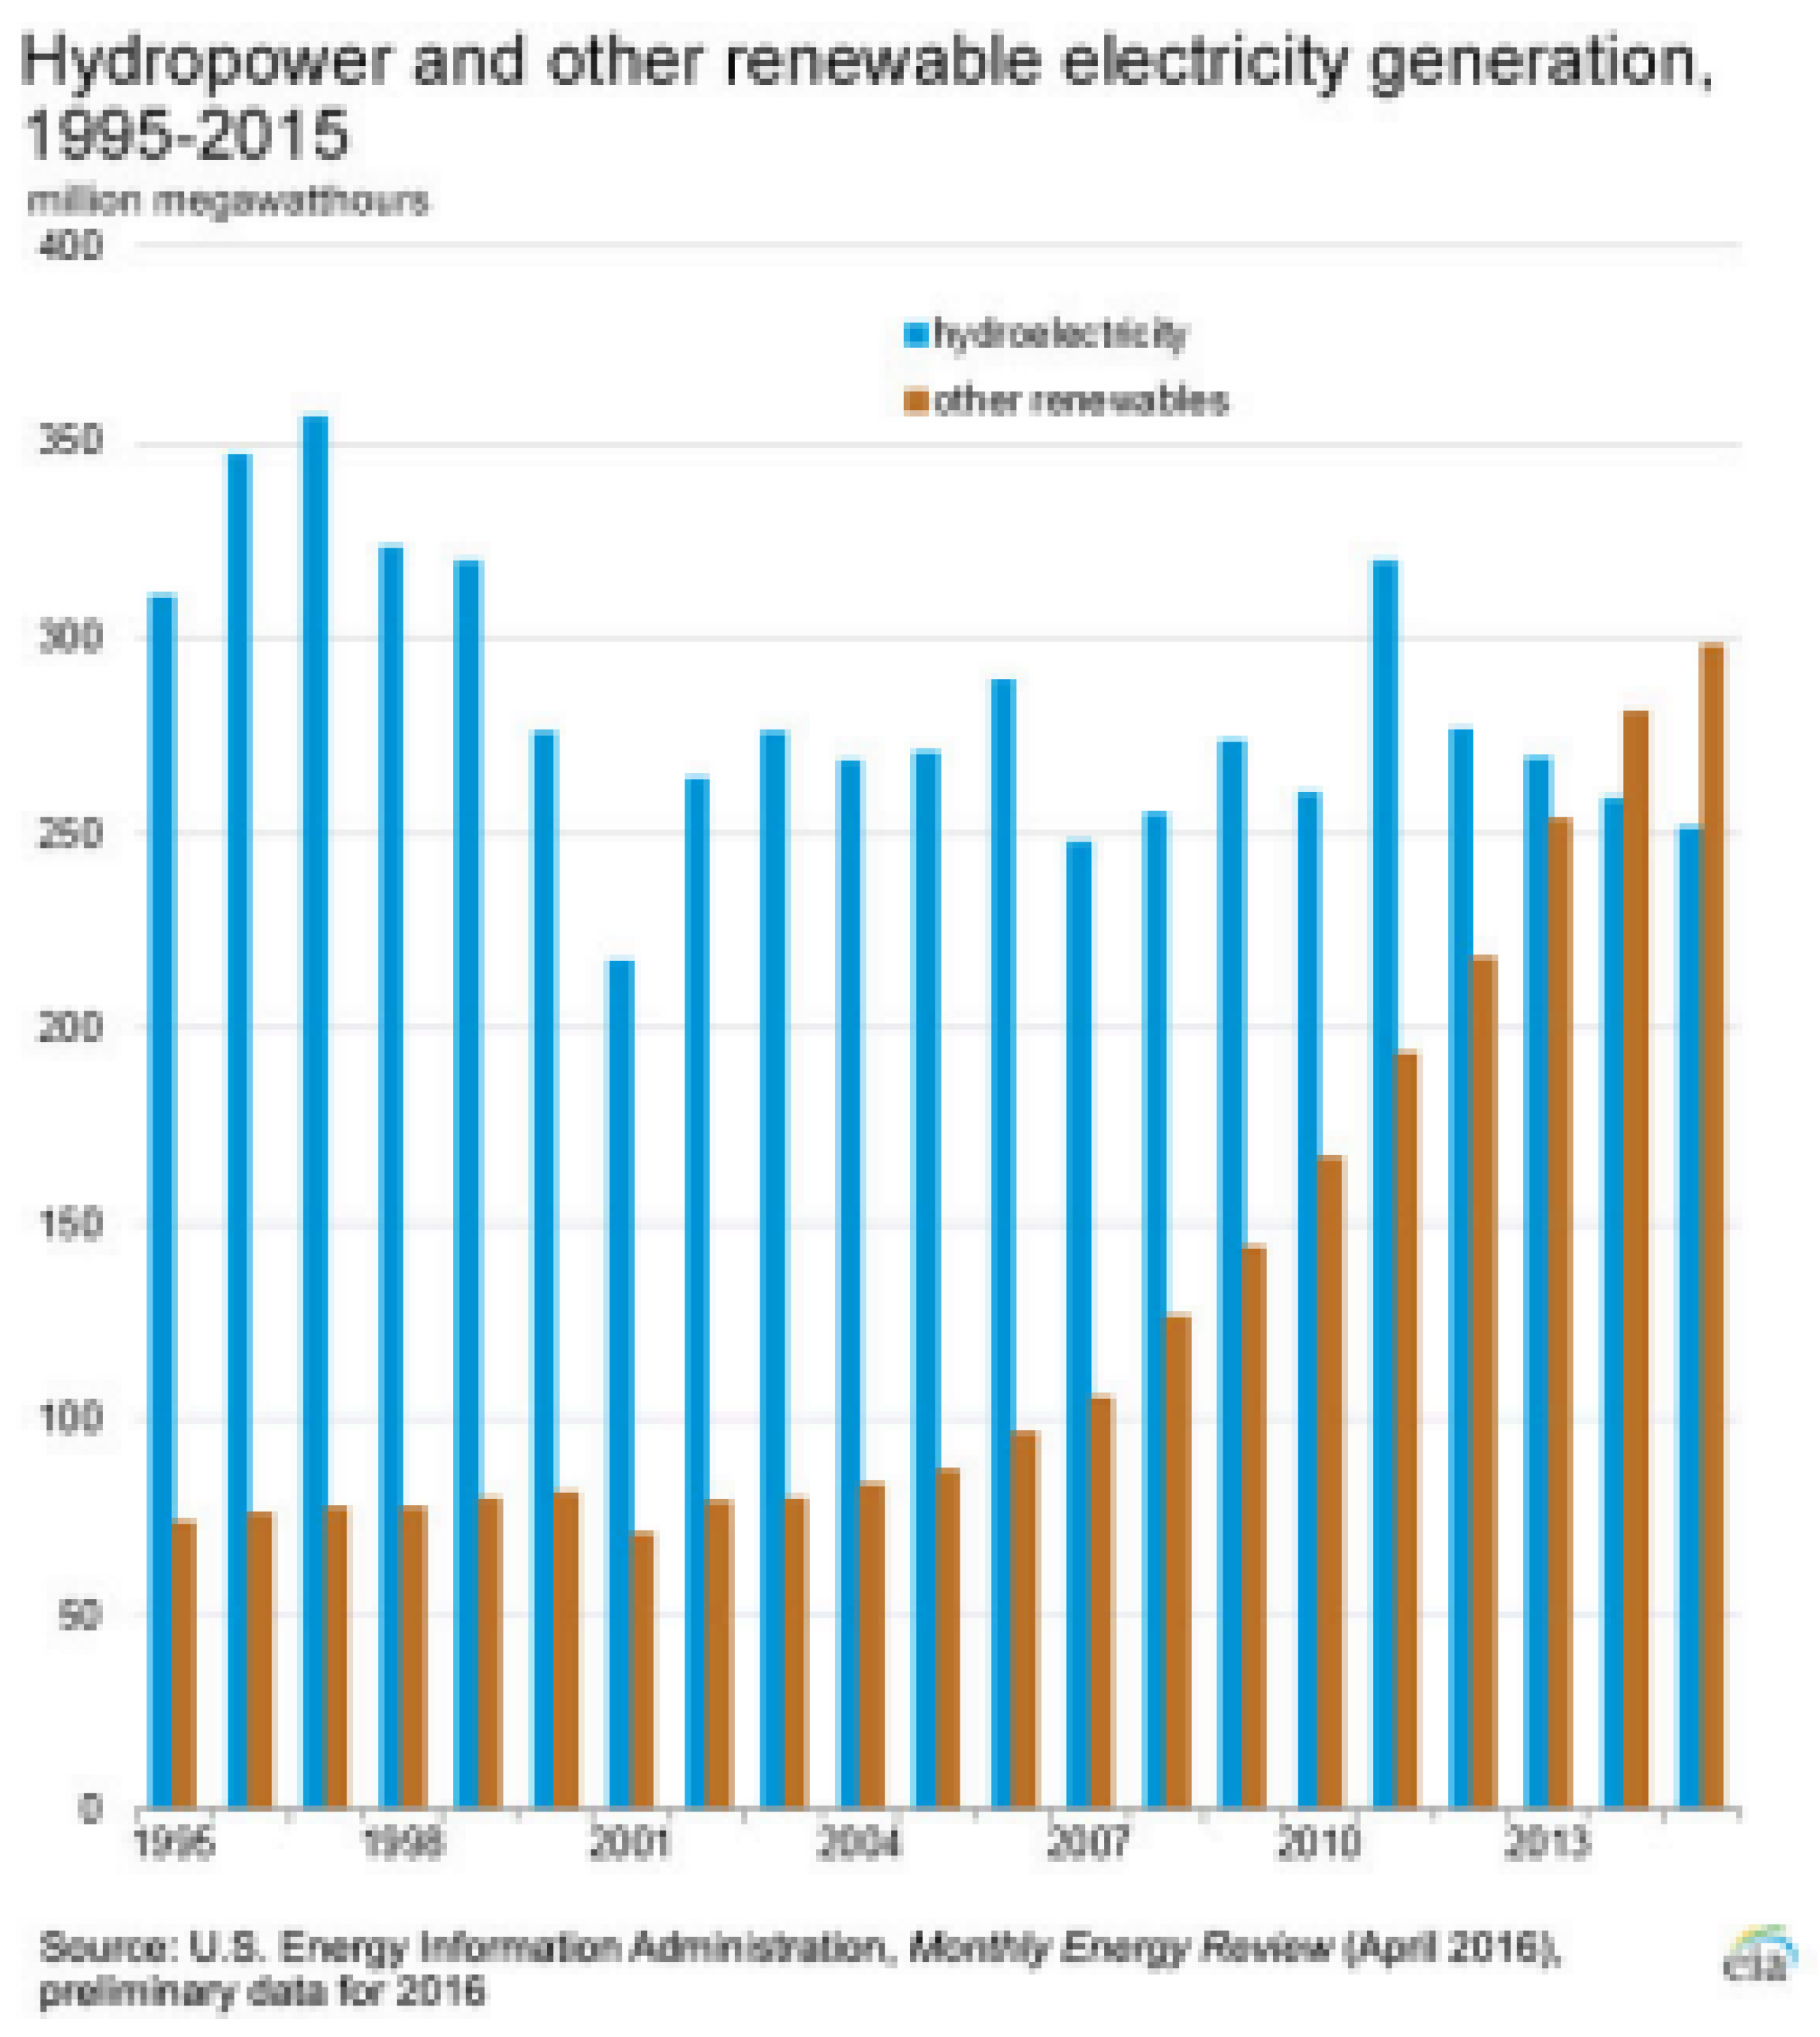
Unpredictability of energy production with hydropower and marine energy resources (see Figure 3) is the biggest hindrance in terms of their utilization in the renewable energy context. From the bar chart, the produced energy fluctuates between 360 million megawatt hours and 220 million megawatt hours. The main problem is the uncertainty that energy created by power generation through hydro energy technologies will be inadequate to address the demands of the world. This uncertainty has the potential to cause volatility in power grids that raises the cost of storing energy and backup units.
1.3. Parties Affected by Research
In the scenario of variable energy generation via hydropower and ocean energy plants, an extended list of stakeholders is affected. Energy consumers—domestic, industrial, and commercial users—depend on an uninterrupted and credible power supply for day-to-day business. Variability in energy generation can affect these operations and increase dependence on alternative, often non-renewable, sources of energy. Renewable energy companies, who finance, construct, and operate such systems, suffer from profitability and contract compliance if energy production varies. This, in turn, can harm their reputation and long-term viability. Governments and policy makers are similarly hindered by the issue that variability of energy output presents for the integration of renewables into a country’s power grid and diverting from the effort to cut greenhouse gas emissions.
Environmentalists, who actively advocate for a shift towards sustainable energy, can have their initiatives undermined by the intermittency of renewable output. Meanwhile, research and development hubs are also obliged to reinvent technologies in order to address this uncertainty, while investors and the financial markets are influenced by the changing risk-reward dynamic of fluctuating energy output. Grid managers and power companies, responsible for allocating energy, are confronted by operating issues and increased costs because of volatility. Solving these issues using the concept of geometric progression has several benefits. Through facilitating more accurate forecasting of hydropower and ocean energy generation, energy resource planning and management become efficient, leading to a more stable and secure power supply (Trueworthy & DuPont, 2020). Accurate energy output also allows for minimizing operational costs by decreasing the need for expensive storage facilities and backup systems, hence becoming more attractive for investment in renewable energy ventures. Also, improved reliability and efficiency allow integrating such sources with existing energy infrastructures, accelerating the shift to clean energy worldwide. Most importantly, more predictability of renewable generation enables the reduction of greenhouse gas emissions because it allows for less use of fossil fuels and aids in the fight against climate change.
2. Literature Review
This research draws on a variety of pre-existing work to examine the applicability of geometric progression to forecast trends in hydropower and ocean energy systems. The starting point foundation study of [9], provides a worldwide outline of hydropower potential from both a geographical and hydrological viewpoint like river discharge and slope. Their findings, such as the ranked list of top 20 countries by per capita hydropower potential, are a basis for experimentation with correlations to geometric progression models. In this paper, a generalized formula was derived from hydropower potential, current energy production, and a shared growth ratio from [10]. The modern-day energy production was calculated as a product of per capita energy production and the 2010 population statistics. The model was subsequently verified against real-time reported hydropower generation data supplied by [11]. for the purpose of comparing the theoretical projection to what has been realized.
The second study reviewed is an annual report by the International Hydropower Association (IHA), reporting on technological advances in hydropower with a particular focus on growth trends in installed capacity since 1900 [12]. Historical data from such reports, specifically in the 2019 report (Sector Trends and Insights, n.d.), were employed in constructing another geometric progression model to project future capacity growth. This allowed for a sustained investigation of hydropower technology’s scaling efficiency and growth trend.
Independent data from the same study by [12,13,14,15], published in PLOS ONE, was also utilized here since it had a decelerating graphical trend. The graphic values followed a consistent numerical trend, so they were geometrically interpretable and hence another dimension to consider energy development trends.
Finally, a case study from the United States using a real-world situation from the American Rivers database analyzed the past and future removal of small dams in the United States. The database, which shows dam removal by year, was used to produce a generalized geometric equation to predict future dam demolition trends. Its validity was cross-checked by using real up-to-date data of 2016 dam removal activities (72 Dams Removed to Restore Rivers in 2016, n.d.; Dams Are Problem Creators, Not Problem Solvers, n.d.). This section of the literature gives an appreciation of the infrastructural growth of hydro energy schemes as well as its potentiality for natural rejuvenation through sequential dam removal [16,17]. Together, these studies provide an in-depth examination of the applicability and shortcomings of geometric progression in modeling growth, capacity, and infrastructure developments in the hydropower and ocean energy sectors
3. Methodology
To examine the future trends of ocean energy and the development of hydropower, the study employs mathematical modeling through geometric progression as the basis for analysis [19,20]. Geometric progression, or geometric sequences, is a sequence in which each term results from multiplying or dividing the previous term by a certain value known as the common ratio (r). This technique is used to estimate energy growth patterns, determine hydropower capacity, and forecast dam removal patterns. The general term of a geometric sequence is provided by the formula an=ar(n−1) where a is the initial term, r is the common ratio, and n represents the number of time periods. The methodology also includes the sum of a geometric series, which is most useful for the estimation of cumulative values like the total removals of dams or cumulative energy production.
The first application of the method is in projecting future hydropower production through energy output per capita. From Hoes et al. (2017) provided data, Iceland’s energy output in 2010 was achieved through the multiplication of the population and per capita energy output. Having a provided common ratio of 4.82% annual growth in energy (Ritchie, 2023), a geometric equation was developed to forecast future energy output. For instance, to forecast the 2022 output.
A second method employed historical data of the International Hydropower Association (2022) for hydropower installed capacity development. The capacity figures from the 1950s to the 1970s showed a consistent growth pattern, and thus a general expression of a12=12.6×(1.0482)11 could be derived. Using the same to project 2019 capacity (n = 6), the model calculated 2,555.74 GW while actual capacity was a mere 1,292 GW—again showing the misalignment between theory and real numbers. Still, the model was then utilized to estimate when hydropower would likely be capable of meeting the world’s energy needs. Using 25,343,000 GW global energy use in 2021 as the assumption, geometric estimation predicted hydropower alone to achieve this by the year 2189, albeit under assumed idealized growth. The other component of the method tested hydropower by location. Hoes et al. (2017) reported that energy potential per locations was a geometric series decreasing according to the equation n=180×(1.7)(n−1) With a = 100 and r = 10, the model was employed to estimate the potential rise in output as the number of viable locations decreased.
Lastly, geometric progression modeled the removal of the United States’ small hydroelectric dams. Using figures between 2000 and 2010, which showed removals increasing from 50 to 144.5 dams, the formula for it was established. When applied to real 2016 statistics, which put only 72 dams removed, the formula result of ~161 indicated overestimation. Such a discrepancy proves the insufficiency of the geometric model’s application to dams removal, an activity controlled by political, ecological, and financial factors rather than constant exponential growth. However, when applied hypothetically, the model estimated complete removal of all 83,700 small dams by 2070 according to the formula of geometric sum Sn=r−1a(rn−1). In general, while geometric progression provides a theoretical approach to modeling energy development and infrastructure growth, this approach reveals its shortcomings when applied to represent real-world situations. The exponential nature of geometric sequences is prone to underestimating the actuality of energy systems whose development is constrained by physical, political, and economic factors. Therefore, while helpful for exploring tentative estimates and theoretical ceilings, geometric progression must be complemented with more advanced, reality-based data-driven models for accurate prediction.
4. Geometric Sequence
Number sequences are lists of numbers in which there exists a pattern or rule. Also, a geometric sequence is one in which the rule is that it should be multiplied or divided by a predetermined amount each time. Upon establishing the pattern within these terms, we find term-to-term rule through which the series can be continued with. The common ratio of a geometric sequence is found by dividing or multiplying the last number by the same amount for each term. Begin by finding each set of values, progressing from the first term to the next, in order to calculate the common ratio. The geometric sequence can also be called geometric progression.
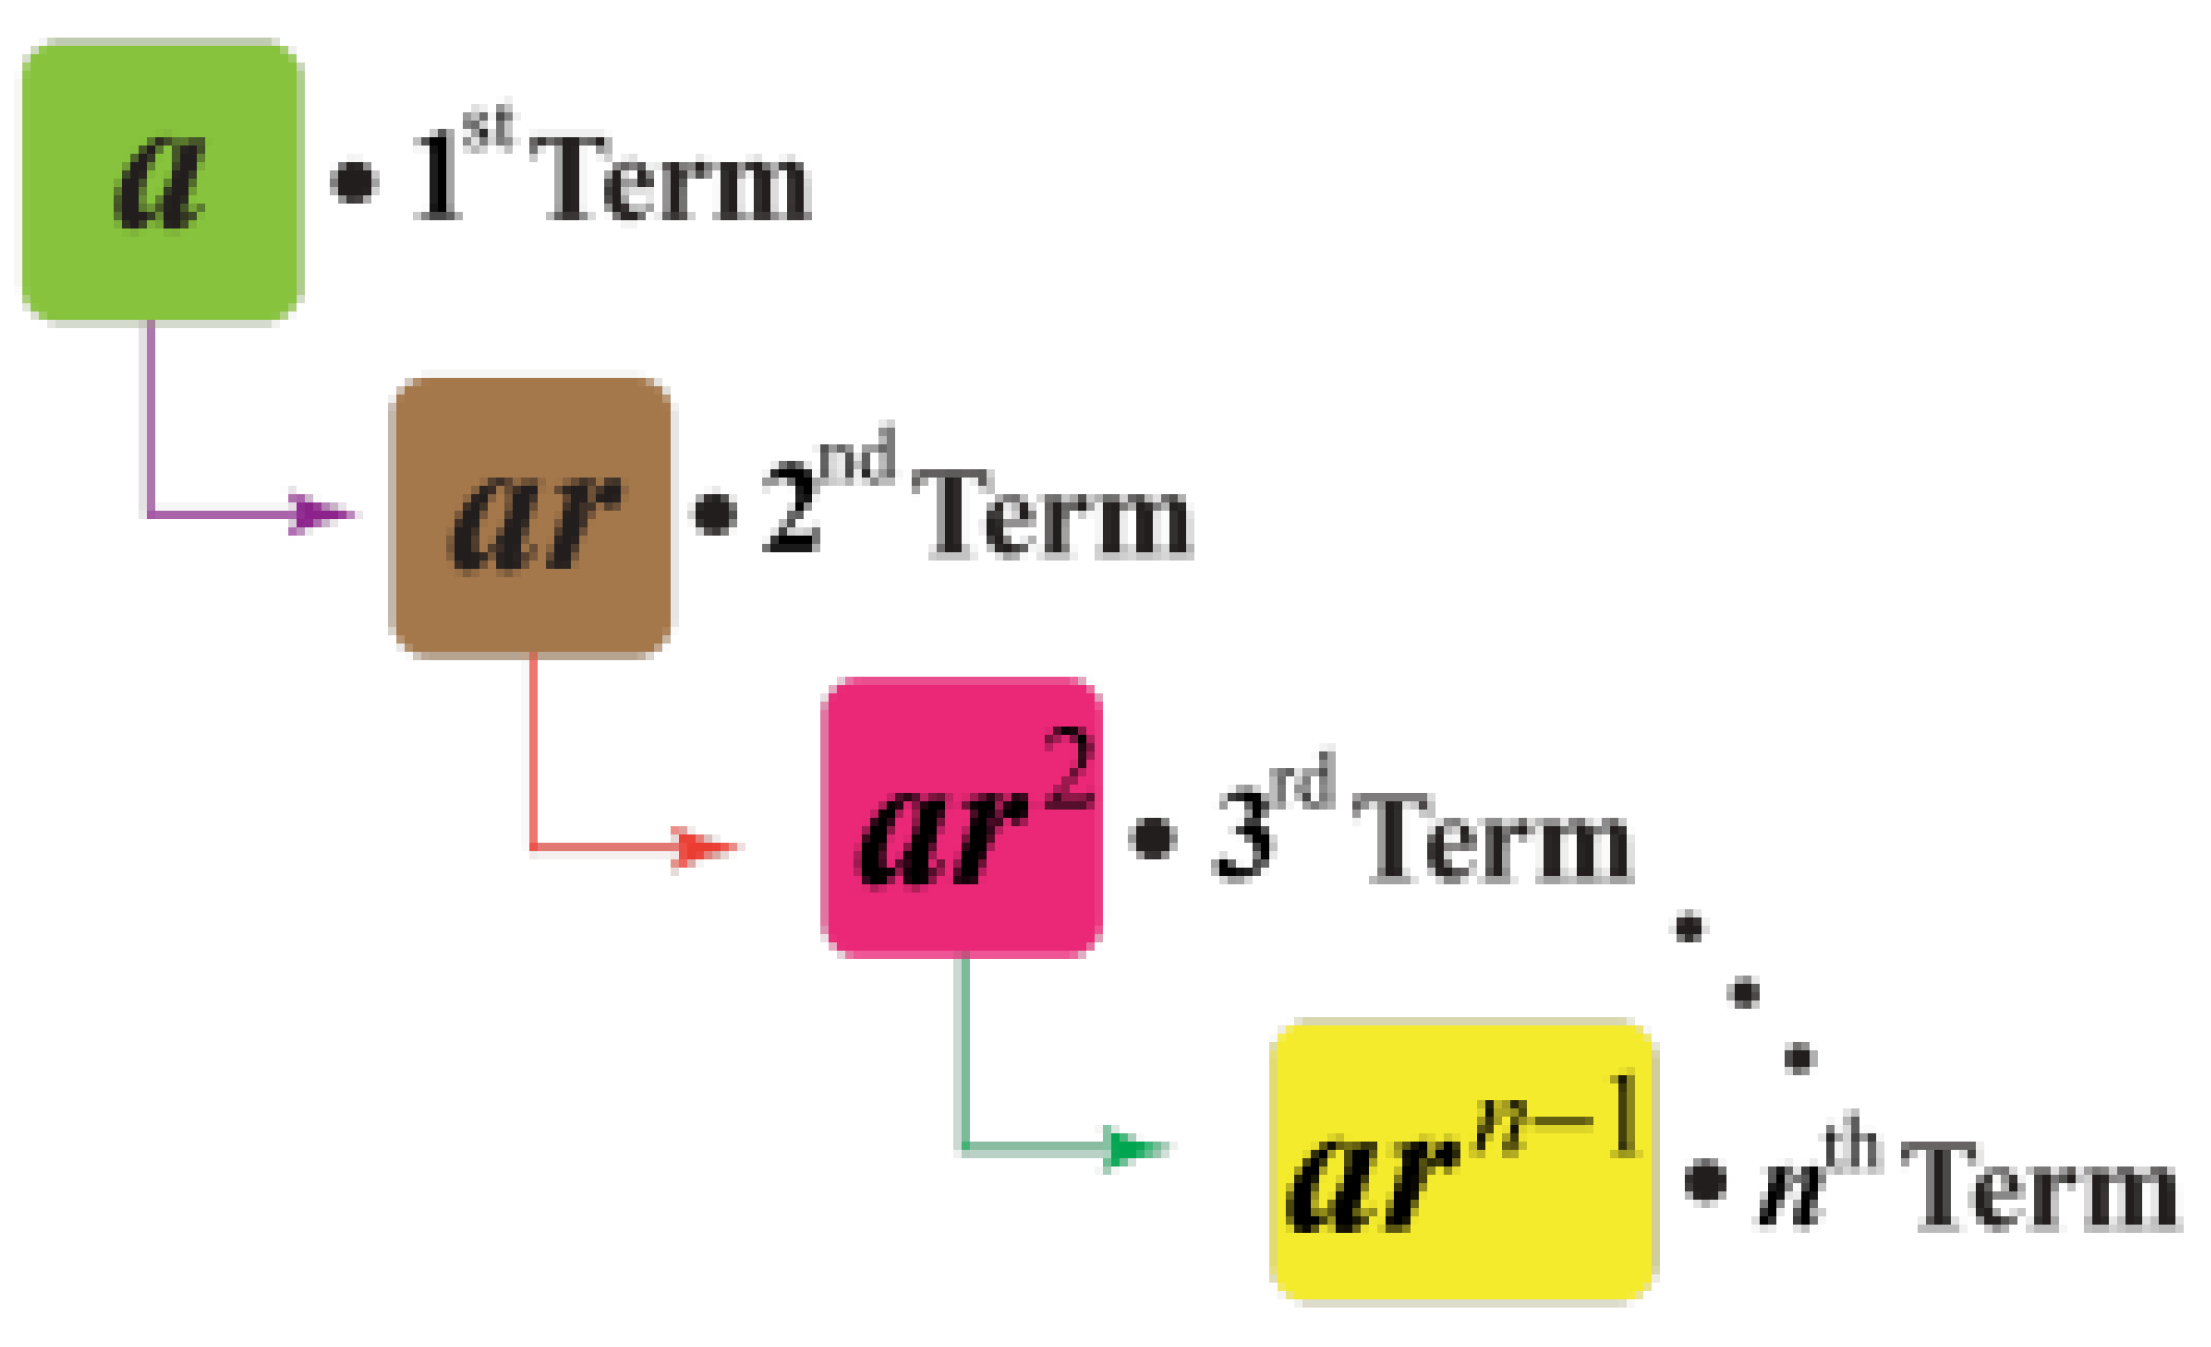
Figure 4.
Geometrical Sequence Diagram (Nth Term of GP | Geometric Progression | Solved Examples, n.d.).
Figure 4.
Geometrical Sequence Diagram (Nth Term of GP | Geometric Progression | Solved Examples, n.d.).
3.1. Geometric Progression - General Term (Nth Term)
The formula that can be used to find the value of any particular term is a as follows: an= arn-1
The first term of the progression is denoted by ’a’, the required term is denoted by ’n’ and ’r’ is referred to as the common ratio.
For example, if the given sequence is: 1, 2, 4, 8, …. To find the Nth term for this geometric sequence, we would first need to identify that the first term is 1 and the common ratio is found by dividing two sets of consecutive terms: (2 ÷ 1) = 2 or (4 ÷ 2) = 2. Thus, the Nthterm for this sequence is (1) x (2)(n-1).
3.2. Geometric Progression - Partial Sum
The geometric series sum formula, Sn, provides the sum of a geometric sequence of the first n terms. The formula varies with the values of the common ratio in the form of ’r’:
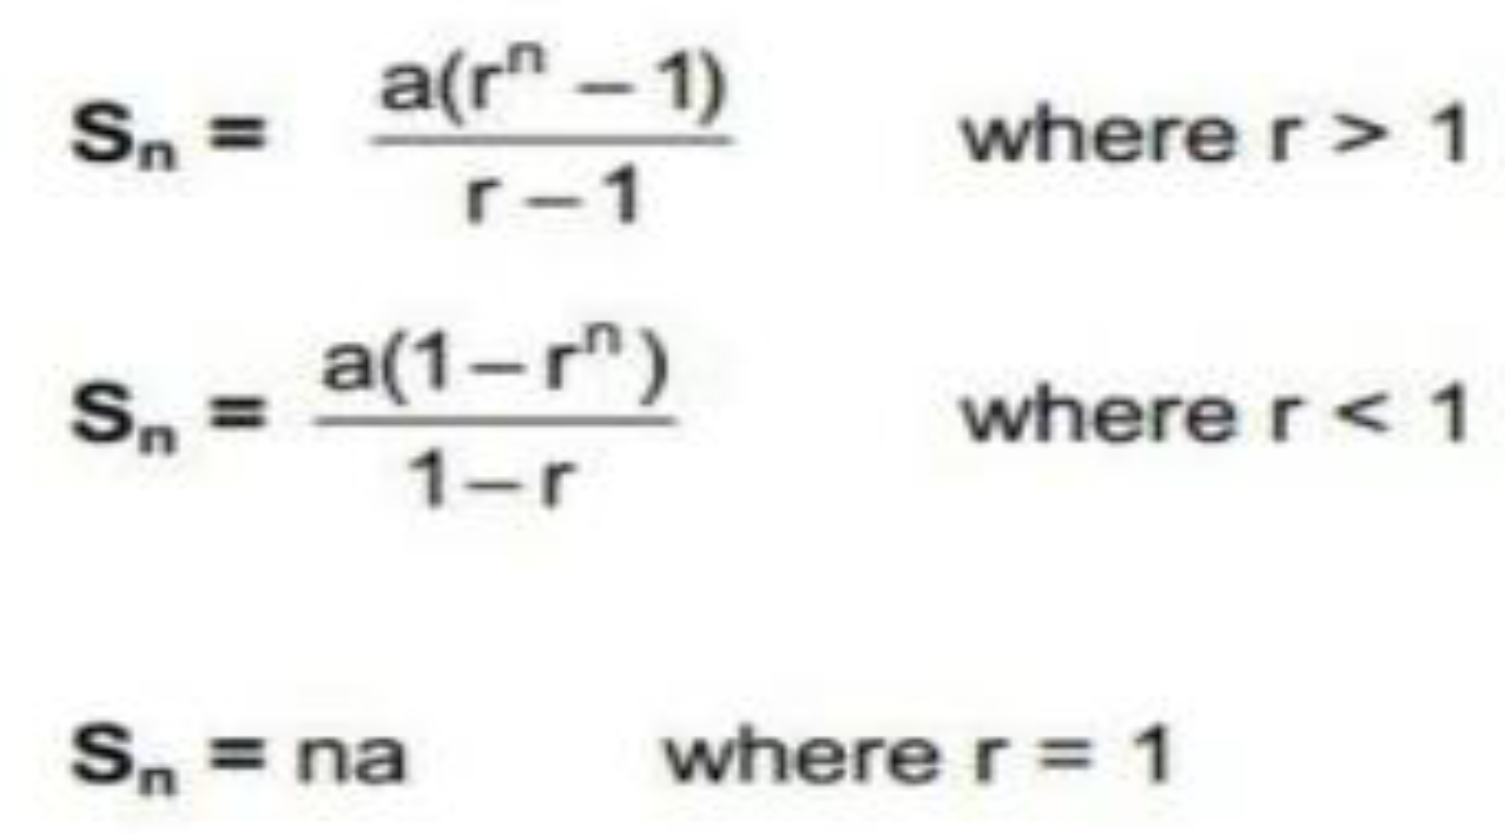
Figure 5.
Geometric Summation Formula (Geometric Series - Formula, Examples, Convergence, n.d.).
When r > 1, it indicates growth and when r < 1, it indicates decay. However, then r = 1, it becomes an arithmetic progression because of its linear increase or decrease. In this study, we will be focusing more on the relationship of data when r is larger than or smaller than 1.
4. Experimental Results
In Order to ascertain the relevance of geometric progression in simulating energy development, a number of experiments were conducted using real data. In one analysis, Iceland was targeted, where present energy production was calculated by multiplying the population of 318,000 in 2010 with the energy production per capita, i.e., 52,374 kWh or 5.2374 × 10⁻⁵ TWh. This results in total energy production of approximately 16.65 TWh. Hydropower generated 12.592 TWh in the year 2010, roughly 75.6% of the energy generated in Iceland (Fernández, 2023). To calculate the projected growth in a geometric progression model, the starting term was set to 12.6 TWh and a common ratio to 4.82% yearly increase (Ritchie, 2023). The used formula is an=12.6×(1.0482)n−1 the estimated production in 2022 (the 12th term) was 21.15 TWh. However, real figures for 2022 indicated Iceland only produced 14.195 TWh, which was a huge overestimation. This discrepancy shows the insufficiency of geometric progression in estimating real growth patterns in energy, not only for Iceland but also for other nations.
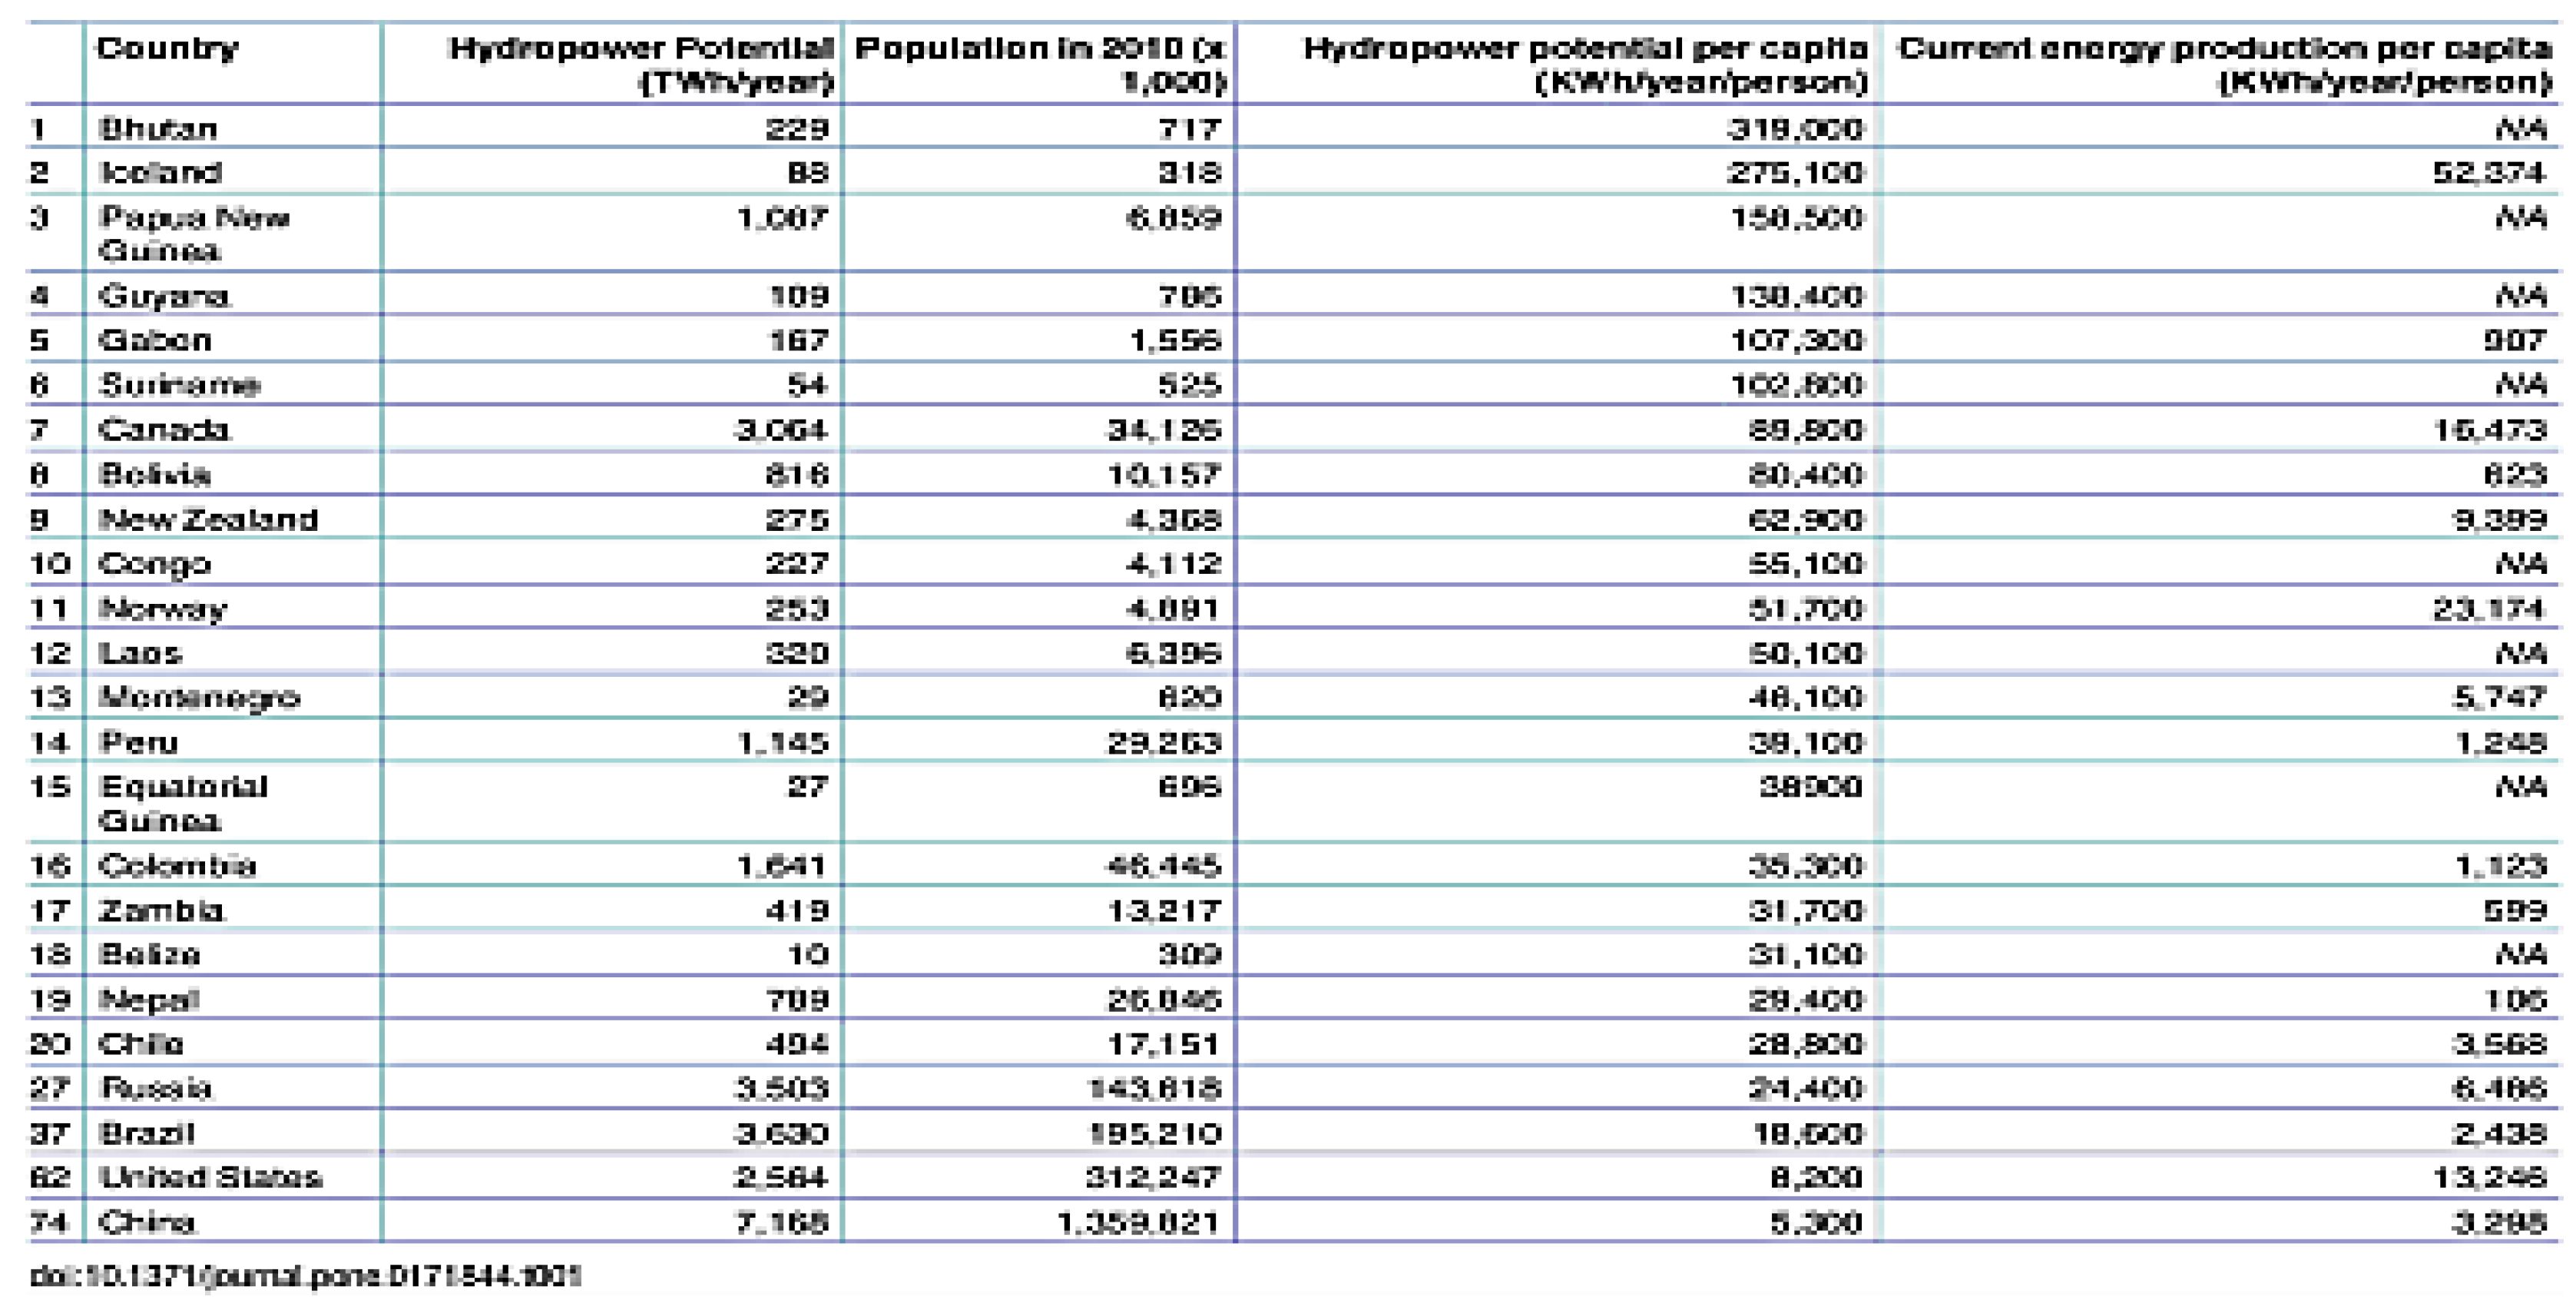
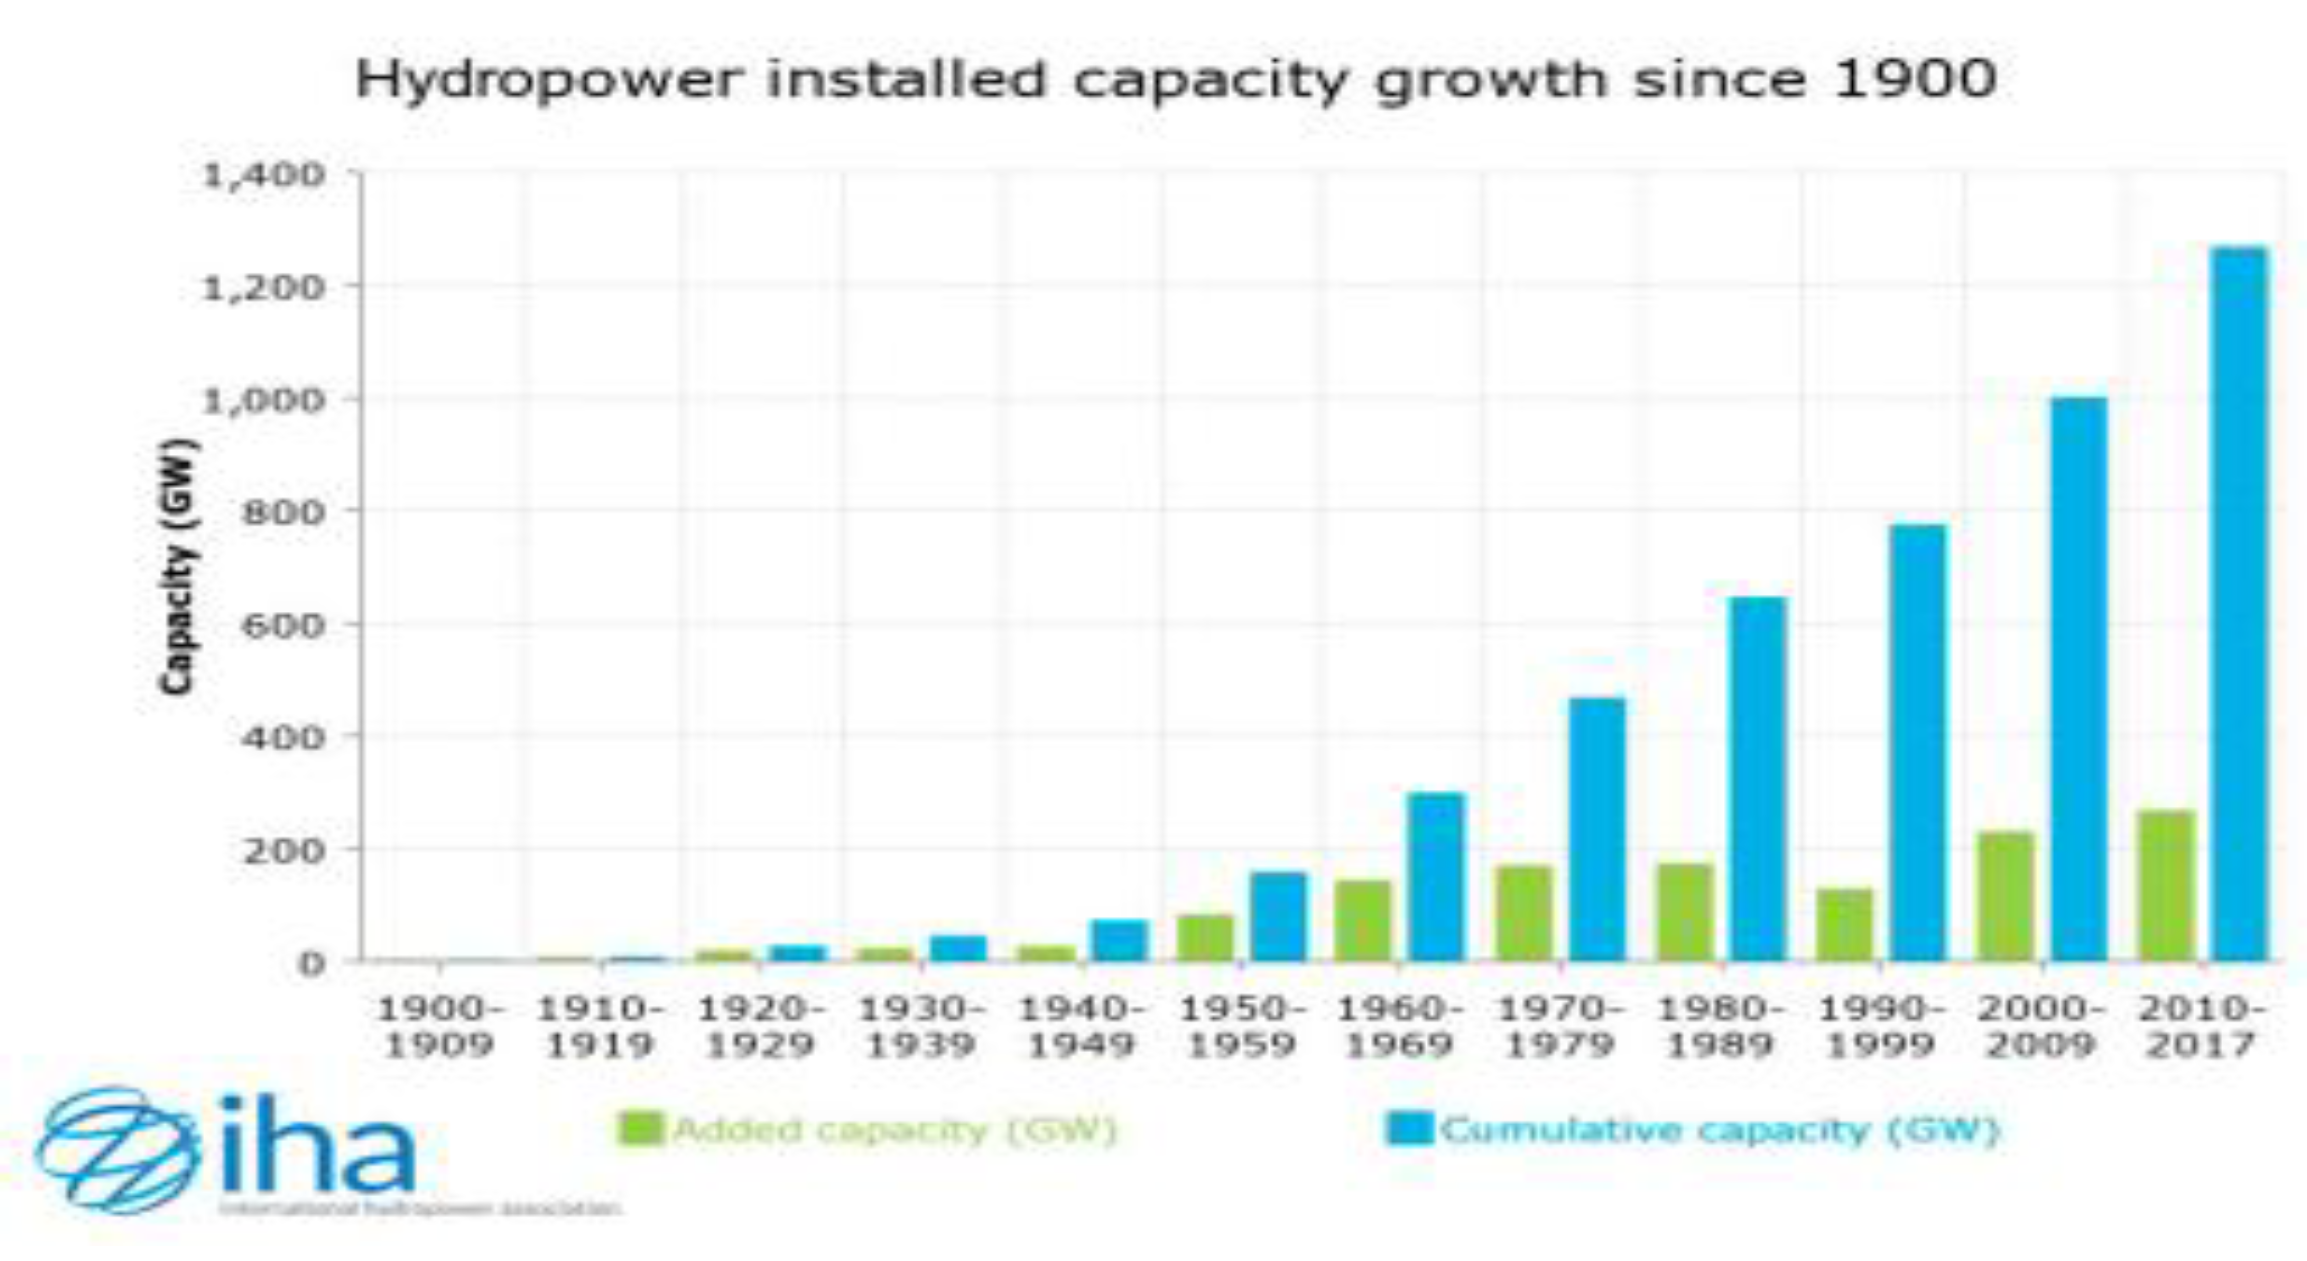
Figure 6.
Estimate the Future Hydropower Generation - Using Energy Production Per Capita.
Figure 7.
International Hydropower Association.
Another experiment was conducted using hydropower capacity growth between decades, using historical data from the International Hydropower Association (2022). Capacity grew from 180 GW to 520.2 GW between 1950 and 1979, using a typical ratio of 1.7. A geometric formula was derived as an=180×(1.7)n−1where n is every decade since 1959. Applying this model to estimate capacity in 2019 (n = 6) gave an estimated value of some 2,555.74 GW. The actual capacity reported, however, was only 1,292 GW, again demonstrating that the exponential model overstates growth. Despite being incorrect, the formula was applied speculatively to determine when global hydropower capacity would be equal to total electricity demand, an estimated 25,343,000 GW in 2021. Solving the equation for an=25,343,000a_n = 25,343,000an=25,343,000 led to an estimate that hydropower could power the world by 2189, if there was ongoing technological progress.
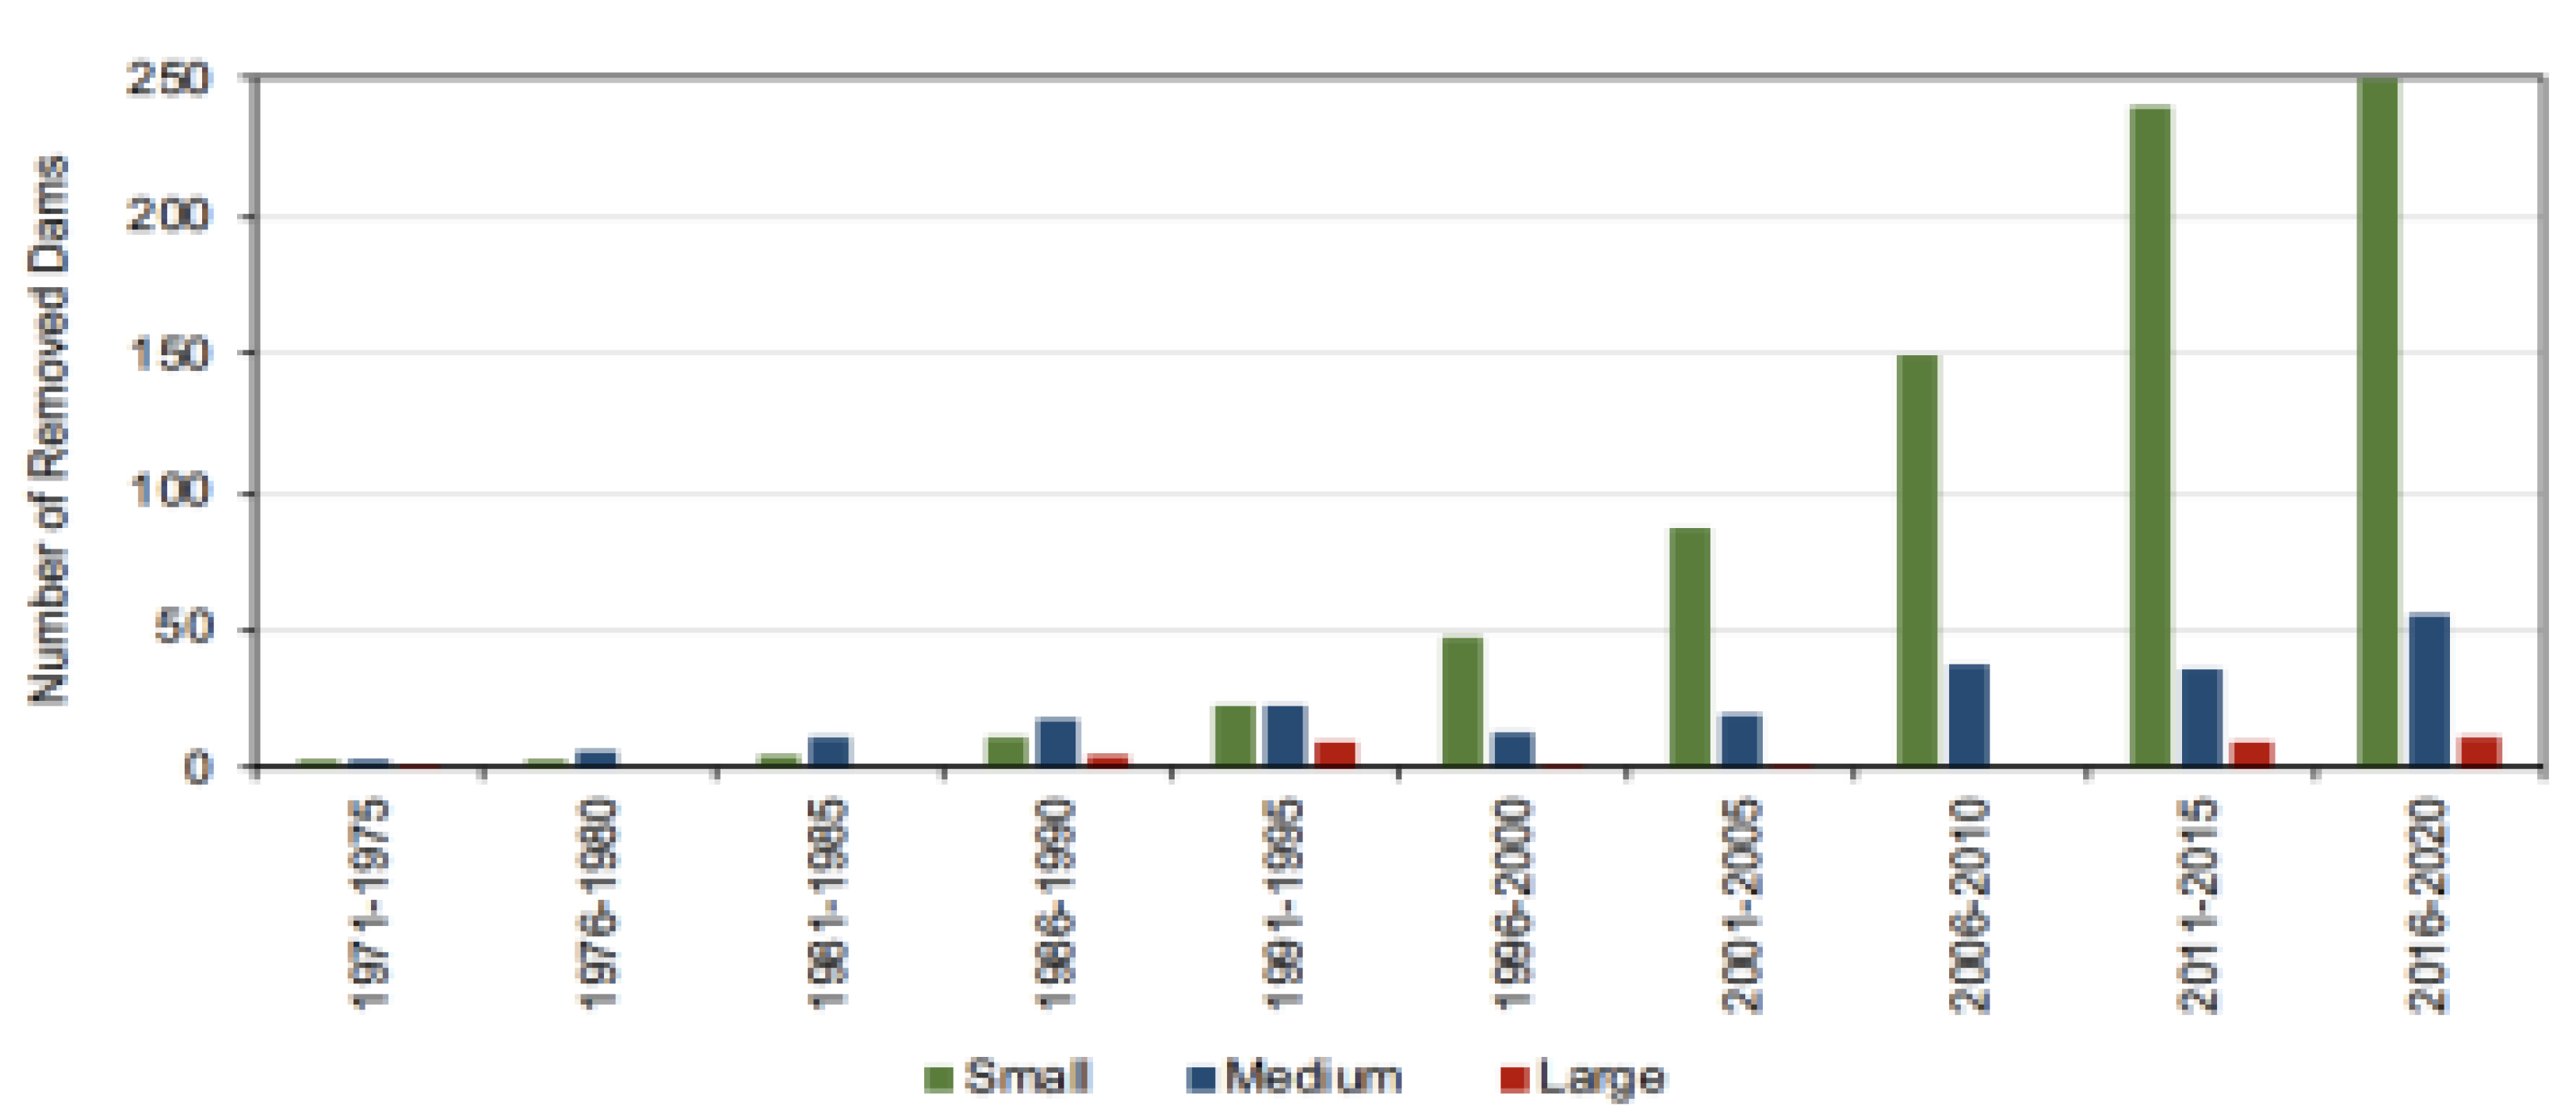
Figure 8.
Approximation on The Number of Water Dams in the Future.
Further experimentation was carried out by trying out hydropower potential at global sites with the help of geometric sequences. According to patterns from the study of Hoes et al. (2017), the number of successful energy-producing sites was approximated as a diminishing geometric series. The figures here displayed a pattern where fewer sites yielded more kWh/year output. Using the formula Un=a⋅rn−1r−1U_n = a \cdot \frac{r^n - 1}{r - 1}Un=a⋅r−1rn−1 with a=100a = 100a=100, r=10r = 10r=10, and n=4n = 4n=4onwards, projected outputs increased.
5. Conclusions
The purpose of this study was to explore the potential for the use of geometric progression (GP) as a forecasting tool for the future of hydropower development within the framework of SDG 2030 and the Fourth Industrial Revolution. Specifically, the research tried to establish the gross potential of hydropower by the evolution of technologies and assess economic growth trends from a geometric progression point of view.It is evident from our analyses that geometric progression, although mathematically feasible, is not a realistic or helpful model for forecasting the future of developments in the hydropower sector. Its intrinsic limitation is the assumption of continued exponential growth, which is inconsistent with the irregular and frequently leveling nature of real technological, economic, and environmental progressions. The record demonstrated that prediction using GP consistently overestimated both real energy generation and infrastructure change, as revealed through case studies of hydropower generation in Iceland and dam removal trends in the United States. These errors are a consequence of the fact that the development of hydropower is influenced by a range of drivers, including policy change, availability of finance, environmental regulations, and global events such as pandemics, that are not captured in a geometric model.
Aside from these constraints, the research provides valuable insights into energy prediction and how methodology can be improved upon. One of them is to use more dynamic prediction models with more than a single variable—i.e., logistic growth models or machine learning models—that better reflect the dynamics of renewable energy trends. In addition, utilizing cumulative energy calculation through the power formula P=t/Emight enhance precision in the estimation of long-term energy supply potential. Overall conclusions of this study are that geometric progression is not suitable as an independent means of predicting technological advances in hydropower. Also, it emphasizes the need for continuous innovation of clean energy technology, greater government engagement in policy and funding, and strategic decommissioning of unproductive small dams to make way for more efficient infrastructure. As energy requirements rise and environmental concerns loom larger, the need to look to prediction and planning with tools that reflect the richness of real-world energy systems is greater than ever.
5.1. Future Work
Subsequent research should investigate other mathematical and computational formulations that better describe the nonlinear and adaptive nature of hydropower and ocean energy systems. Exploring statistical model methods, artificial intelligence, and hybrid systems that combine economic, environmental, and engineering data may lead to more accurate and generalizable forecasts. Additionally, including climate change projections, population projections, and resource constraints in forecasting models would enable more realistic and policy-relevant scenarios. Lastly, additional interdisciplinary research is required to comprehend how infrastructure transformations—i.e., dam building and removal—are determined by political, environmental, and technological factors in order to provide more comprehensive planning in sustainable energy development.
References
- Joensen, B., & Bingham, H. B. (2024). Economic feasibility study for wave energy conversion device deployment in Faroese waters. Energy, 295, 130869.
- Kelly, A. M., & Radler, R. D. N. N. (2024). Does energy consumption matter for climate change in Africa? New insights from panel data analysis. Innovation and Green Development, 3(3), 100132.
- Alferidah, D. K., & Jhanjhi, N. Z. (2020, October). Cybersecurity impact over big data and IoT growth. In 2020 International Conference on Computational Intelligence (ICCI) (pp. 103–108). IEEE. https://doi.org/10.1109/ICCI51257.2020.9247742 (Add DOI if available).
- Jena, K. K., Bhoi, S. K., Malik, T. K., Sahoo, K. S., Jhanjhi, N. Z., Bhatia, S., & Amsaad, F. (2022). E-learning course recommender system using collaborative filtering models. Electronics, 12(1), 157. [CrossRef]
- Aherwadi, N., Mittal, U., Singla, J., Jhanjhi, N. Z., Yassine, A., & Hossain, M. S. (2022). Prediction of fruit maturity, quality, and its life using deep learning algorithms. Electronics, 11(24), 4100. [CrossRef]
- Kumar, M. S., Vimal, S., Jhanjhi, N. Z., Dhanabalan, S. S., & Alhumyani, H. A. (2021). Blockchain-based peer-to-peer communication in autonomous drone operation. Energy Reports, 7, 7925–7939. [CrossRef]
- Jhanjhi, N. Z., Humayun, M., & Almuayqil, S. N. (2021). Cybersecurity and privacy issues in industrial Internet of Things. Computer Systems Science & Engineering, 37(3), 357–368.
- Lee, S., Abdullah, A., & Jhanjhi, N. Z. (2020). A review on honeypot-based botnet detection models for smart factory. International Journal of Advanced Computer Science and Applications, 11(6), 319–326. [CrossRef]
- Hassan, Q., Viktor, P., Al-Musawi, T. J., Ali, B. M., Algburi, S., Alzoubi, H. M., ... & Jaszczur, M. (2024). The renewable energy role in the global energy Transformations. Renewable Energy Focus, 48, 100545.
- Das, N., Hossain, M. E., Bera, P., Gangopadhyay, P., Cifuentes-Faura, J., Aneja, R., & Kamal, M. (2025). Decarbonization through sustainable energy technologies: Asymmetric evidence from 20 most innovative nations across the globe. Energy & Environment, 36(1), 374-390.
- Ozkan, O., Eweade, B. S., & Usman, O. (2024). Assessing the impact of resource efficiency, renewable energy R&D spending, and green technologies on environmental sustainability in Germany: evidence from a wavelet quantile-on-quantile regression. Journal of Cleaner Production, 450, 141992.
- Hidayat, M., Rangkuty, D. M., & Ferine, K. F. (2024). The influence of natural resources, energy consumption, and renewable energy on economic growth in ASEAN region countries. International Journal of Energy Economics and Policy, 14(3), 332-338.
- Estevão, J., & Lopes, J. D. (2024). SDG7 and renewable energy consumption: The influence of energy sources. Technological Forecasting and Social Change, 198, 123004.
- Ghenai, C., & Bettayeb, M. (2025). Data analysis of the electricity generation mixes for clean energy transition during COVID-19 lockdowns. Energy Sources, Part A: Recovery, Utilization, and Environmental Effects, 47(1), 4845-4864.
- Agyemang, P., Kwofie, E. M., Baum, J. I., Wang, D., & Kwofie, E. A. (2025). Environmental-Health Convergence: A deep learning-oriented decision support system for catalyzing sustainable healthy food systems. Environmental Modelling & Software, 185, 106309.
- Yang, T., Yao, W., Lei, T., Cao, J., & Dewancker, B. J. (2025). Study on the impact of land-sea distribution on future building energy consumption in Chinese cities under the background of climate change. Energy and Buildings, 115434.
- Jia, Z., Yin, J., Cao, Z., Wu, L., Wei, N., Zhang, Y., ... & Mao, H. (2025). Regional vehicle energy consumption evaluation framework to quantify the benefits of vehicle electrification in plateau city: A case study of Xining, China. Applied Energy, 377, 124626.
- Ashfaq, F., Jhanjhi, N. Z., & Khan, N. A. (2023, April). Badminton player’s shot prediction using deep learning. In Innovation and Technology in Sports: Proceedings of the International Conference on Innovation and Technology in Sports,(ICITS) 2022, Malaysia (pp. 233-243). Singapore: Springer Nature Singapore.
- Ashfaq, F., Jhanjhi, N. Z., Khan, N. A., & Das, S. R. (2023, February). Synthetic crime scene generation using deep generative networks. In International Conference on Mathematical Modeling and Computational Science (pp. 513-523). Singapore: Springer Nature Singapore.
- Alourani, A., Ashfaq, F., Jhanjhi, N. Z., & Ali Khan, N. (2023). BiLSTM-and GNN-Based Spatiotemporal Traffic Flow Forecasting with Correlated Weather Data. Journal of Advanced Transportation, 2023(1), 8962283.
- Saeed, S., Abdullah, A., Jhanjhi, N. Z., Naqvi, M., & Humayun, M. (2020). Statistical analysis of the pre-and post-surgery in the healthcare sector using high dimension segmentation. In Machine Learning for Healthcare (pp. 159-174). Chapman and Hall/CRC.
- Saleh, M., Jhanjhi, N., & Abdullah, A. (2020, February). Fatima-tuz-Zahra,‘‘Proposing a privacy protection model in case of civilian drone,’’. In Proc. 22nd Int. Conf. Adv. Commun. Technol.(ICACT) (pp. 596-602).
- Kaur, N., Verma, S., Jhanjhi, N. Z., Singh, S., Ghoniem, R. M., & Ray, S. K. (2023). Enhanced QoS-aware routing protocol for delay sensitive data in Wireless Body Area Networks. IEEE Access, 11, 106000-106012.
- Singh, T., Solanki, A., Sharma, S. K., Jhanjhi, N. Z., & Ghoniem, R. M. (2023). Grey Wolf Optimization-Based CNN-LSTM Network for the Prediction of Energy Consumption in Smart Home Environment. IEEE Access, 11, 114917-114935.
- Saeed, S., Jhanjhi, N. Z., Naqvi, S. M. R., & Khan, A. (2022). Analytical Approach for Security of Sensitive Business Cloud. Deep Learning in Data Analytics: Recent Techniques, Practices and Applications, 257-266.
- Srinivasan, K., Garg, L., Chen, B. Y., Alaboudi, A. A., Jhanjhi, N. Z., Chang, C. T., ... & Deepa, N. (2021). Expert System for Stable Power Generation Prediction in Microbial Fuel Cell. Intelligent Automation & Soft Computing, 30(1).
- Javed, D., Jhanjhi, N. Z., Khan, N. A., Ray, S. K., Al Mazroa, A., Ashfaq, F., & Das, S. R. (2024). Towards the future of bot detection: A comprehensive taxonomical review and challenges on Twitter/X. Computer Networks, 254, 110808.
- Aldughayfiq, B., Ashfaq, F., Jhanjhi, N. Z., & Humayun, M. (2023, April). Yolo-based deep learning model for pressure ulcer detection and classification. In Healthcare (Vol. 11, No. 9, p. 1222). MDPI.
Figure 1.
Hydraulic Turbine and Electrical Generator, cutaway view (Wikipedia Contributors, 2019).
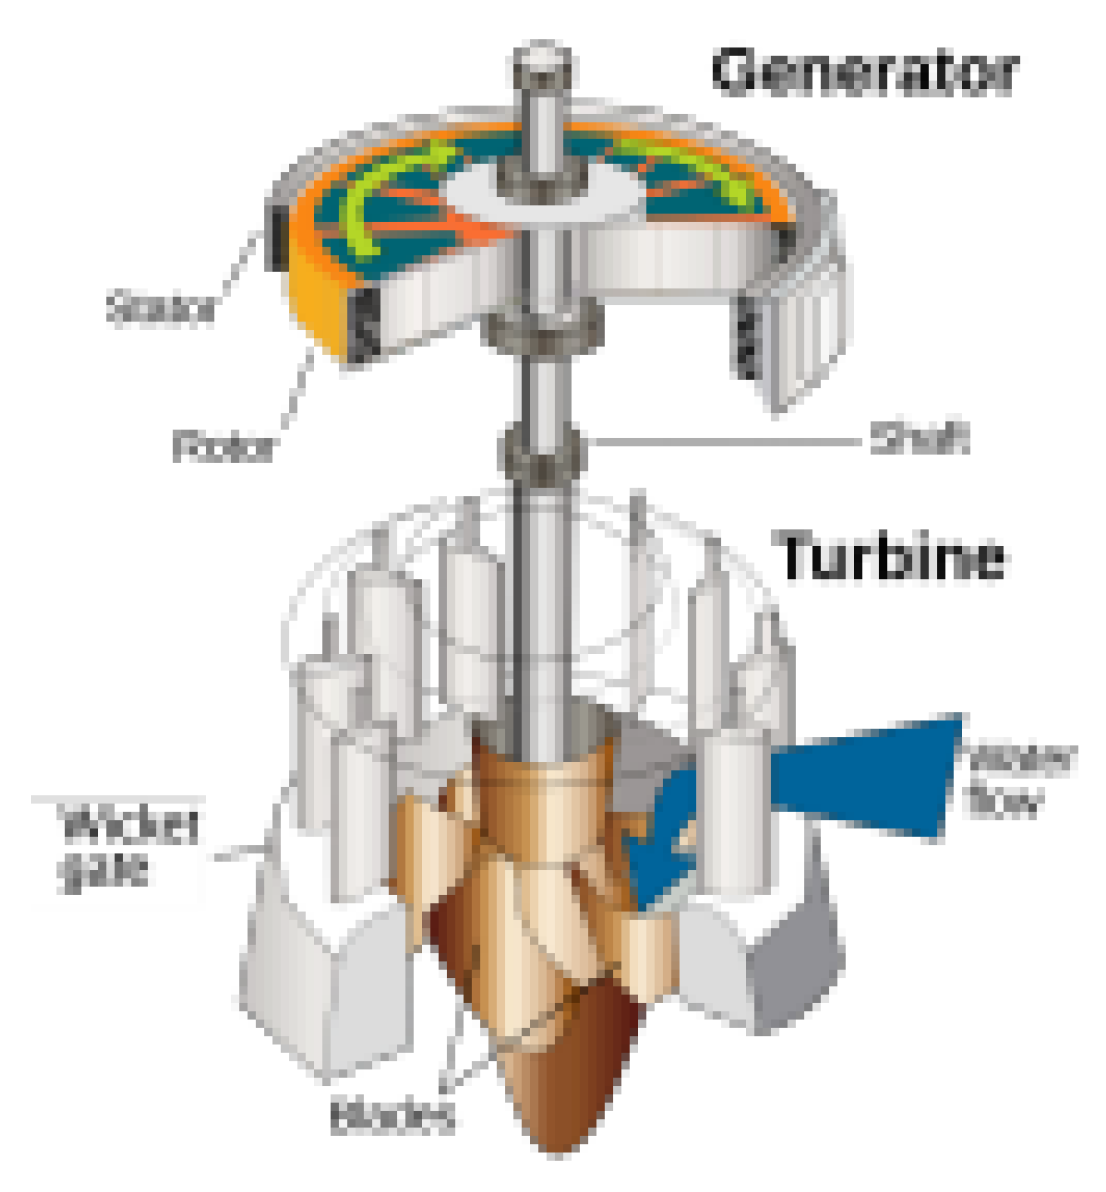
Figure 3.
Hydroelectric power generation compared to other renewable energy sources from 1995 to 2015 (Hydroelectric Energy, n.d.).
Figure 3.
Hydroelectric power generation compared to other renewable energy sources from 1995 to 2015 (Hydroelectric Energy, n.d.).
Disclaimer/Publisher’s Note: The statements, opinions and data contained in all publications are solely those of the individual author(s) and contributor(s) and not of MDPI and/or the editor(s). MDPI and/or the editor(s) disclaim responsibility for any injury to people or property resulting from any ideas, methods, instructions or products referred to in the content. |
© 2025 by the authors. Licensee MDPI, Basel, Switzerland. This article is an open access article distributed under the terms and conditions of the Creative Commons Attribution (CC BY) license (http://creativecommons.org/licenses/by/4.0/).
Copyright: This open access article is published under a Creative Commons CC BY 4.0 license, which permit the free download, distribution, and reuse, provided that the author and preprint are cited in any reuse.


