Submitted:
20 April 2025
Posted:
21 April 2025
You are already at the latest version
Abstract
Photosynthetically active radiation (PAR) is crucial for plant growth, influencing photosynthesis efficiency and crop yield. The increasing adoption of controlled-environment agriculture (CEA) necessitates precise PAR monitoring. Commercial PAR sensors are expensive, however, limiting their accessibility. Recent research has explored low-cost alternatives using multi-channel spectral sensors like AS7341 and AS7265. This study develops the electronics for an AS7341-based open-source, cost-effective (~US$50) PAR sensor validated across a broad PPFD range and conditions, ensuring reliability and ease of replication. It uses relatively simple multi-linear regression, that offers real-time applications without energy intensive machine learning. The developed sensor is calibrated against the industry-standard Apogee SQ-500SS PAR sensor in four distinct farming environments: i) horizontal grow lights , ii) vertical agrotunnel lighting, iii) agrivoltaics, and iv) in greenhouses. A mean error ranging from 1-5% indicates its suitability for controlled environment farming and continuous data logging. The open-source hardware design and systematic installation guidelines enable users to replicate, calibrate, and integrate the sensor with minimal background in electronics and optics.
Keywords:
photosynthetically active radiation
; PAR
; photosynthetic photon flux density
; PPFD
; multiple linear regression
; controlled environmental agriculture
; agrivoltaics
; agriculture
; greenhouses
; vertical agriculture
1. Introduction
Photosynthetically active radiation (PAR) refers to the spectral range of solar radiation between 400 and 700 nanometers (nm) that is utilized by plants for photosynthesis [1]. Unlike general sunlight, which encompasses a broader range of wavelengths, PAR specifically denotes the portion of the electromagnetic spectrum that excites chlorophyll molecules, driving the photochemical reactions essential for the plant [2]. The rate of photosynthesis and the production of starch and other carbohydrates are directly correlated with the quantity of incident PAR [3,4]. This is quantified in terms of photosynthetic photon flux density (PPFD), which measures the number of photons (µmol·m⁻²·s⁻¹) reaching a given surface per unit time [5].
The increasing adoption of controlled-environment agriculture (CEA), including greenhouse cultivation, hydroponics, vertical farming, and agrivoltaics, has necessitated precise PAR monitoring to optimize plant growth and productivity [6]. Agrivoltaics systems, which integrate photovoltaic (PV) modules with agricultural land, introduce an additional layer of complexity due to dynamic shading, variable light transmission [7,8], and potential spectrum modification by partially-transparent solar panels [9]. The interaction between plant canopy architecture, PV module configurations, and light availability requires robust, real-time PAR measurement to ensure optimal plant development while maximizing energy yield [10]. PAR measurements are thus useful for a wide range of farming techniques summarized in Figure 1.
Moreover, in indoor farming systems that rely on artificial lighting such as light-emitting diode (LED) grow lights, the spectral composition and intensity must be carefully controlled to match plant-specific PPFD requirements. Figure 2 illustrates the PPFD ranges and photoperiod optimal for various crops grown under CEA conditions. The selection of appropriate crop varieties [11], adjustment of light spectra, and development of smart, adaptive lighting environments depend on precise PAR quantification [12].
Commercial PAR sensors are typically expensive, proprietary, and often lack seamless compatibility with open-source data monitoring and logging systems (see Table 1). Most commercially available models are full-spectrum quantum PAR sensors, designed to provide high-precision measurements with an accuracy of within 5%. This level of accuracy comes at a significant cost, with standalone sensors priced above CAD$600 and complete monitoring systems reaching around CAD$1,000. The high cost of these sensors poses a challenge for researchers and agricultural practitioners seeking cost-effective solutions for large-scale deployment. As the demand for precision agriculture and controlled-environment farming increases, the development of affordable, reliable, and easily integrable PAR measurement systems are essential to enable broader adoption and optimization of sustainable agricultural practices.
To develop low-cost PAR sensors, alternatives to quantum sensors and expensive spectrometers have been explored. The availability of cost-effective microcontrollers, amplifiers, and IoT devices has facilitated the development of PAR sensors using silicon (Si) photodiodes such as the TSL250, VTB8440BH [22], BPW34 [23] and gallium arsenide (GaAs)-based photodiodes, such as the G2711-01 and G1118 [24], have been widely used in combination with optical filters that selectively pass 400–700 nm wavelengths to enhance PAR measurement accuracy. Relying on a single photodiode for PPFD estimation under varying lighting conditions poses challenges, however. Furthermore, system performance is heavily dependent on the quality of the optical filter employed with these types of PAR sensors, which further increases the overall cost.
To address these limitations, multi-channel light sensors have been introduced for PPFD estimation, leveraging multiple spectral channels to improve accuracy while eliminating the need for external optical filters. A commonly used sensor in this category is the TCS34715FN [25,26], a four-channel RGBW (red, green, blue, and white) sensor that enables PPFD prediction across different lighting conditions at a lower cost and with improved reliability.
With advances in optical sensing technology, new multi-channel spectral sensors have emerged, significantly enhancing PAR measurement capabilities. Sensors such as the AS7341 (11-channel) feature 4x4 photodiode arrays covering a broad spectral range from 350 nm to 1000 nm [27] and AS7265 (18-channel) consists of three sensor chips (AS72651, AS72652, and AS72653) that collectively provide 18 spectral channels, spanning from 410 nm to 940 nm [28]. These sensors have been integrated into recent research efforts, employing advanced calibration techniques such as vector quantization [29], machine learning algorithms [30,31], and multilinear regression for PPFD estimation [30,32,33,34]. Comparative analyses of these approaches, including their accuracy, cost, and calibration complexity, are summarized in Table 2.
While machine learning-based models offer high accuracy, multilinear regression provides a more practical solution for real-time monitoring applications due to its ease of calibration and implementation [31]. Therefore, in this study, a multilinear regression-based approach is adopted to develop a cost-effective and reliable PAR sensor for real-time agricultural monitoring.
While previous studies using multi-channel optical sensors have explored cost-effective techniques for developing lab-scale PAR sensors, these methods often involve complex computational models or extensive calibration procedures, limiting their practicality for widespread adoption. Furthermore, the reliability of many of these sensors remains limited, as their accuracy is often validated using small datasets and within a restricted range of PPFD. Additionally, only a few of these sensors have been developed as fully integrated devices with standardized guidelines for replication, calibration, and deployment. The lack of well-documented methodologies and open-source implementation frameworks [35,36] further hinders their widespread adoption and practical usability in real-world agricultural applications. To address these limitations, it is crucial to develop an open-source PAR sensor that is not only easy to construct, but also highly reliable, with validation across the full PPFD range (0–2000 µmol/m²/s). Additionally, an integrated data logging system should be capable of continuously recording PAR values over extended periods to support long-term monitoring and analysis. In this study, an open-source PAR sensor system using AS7341 is designed, developed, and rigorously tested under four distinct lighting environments: a green house, with grow lights (Mars Hydro TS-1000), in an agrotunnel with high efficiency LEDs (Better Grow Lights), and outdoor agrivoltaics systems. The sensor is calibrated and validated using a commercial Apogee SQ-500SS Quantum PAR sensor. A comparative analysis is conducted to evaluate sensor performance, highlighting key trade-offs between cost, accuracy, and application feasibility.
2. Materials and Methods
2.1. AS7341 Sensor Description and Parameters Extraction
The AS7341 sensor [27] is 11 channel optical sensor with a measuring light intensity of 8 optical channel within visible range (415 nm; 445 nm; 480 nm; 515 nm; 555 nm; 590 nm; 630 nm; 680 nm which is the PAR range as well), and three extra channels, one near infrared (NIR) (910nm) and one for white light measurement and another one is for flicker. The sensor operates around 1.8V and it can communicate with any microcontroller using I2C protocol but the I2C voltage level is limited to 1.7V-1.9V, so a level shifter is required between the I2C of AS7341 and microcontroller (3.3V for ESP32). To utilize the AS7341 sensor for PAR estimation, raw sensor values from eight optical channels with-in the 415–685 nm range will be monitored. The sensor is set to operate with a gain setting of 1 and a total integration time of 100 ms, achieved using ATIME = 35 and ASTEP = 999. The spectral response of the sensor under a grow light is illustrated in Figure 3(b), while Figure 3(a) presents a re-constructed visualization of the spectral distribution of the grow light source (Mars Hydro TS-1000) [37].
2.2. Features and Components of the Sensor
The ESP32-based PAR sensor integrates the AS7341 optical sensor for accurate PAR measurement across various agricultural environments. It employs I2C communication for spectral data acquisition and an onboard multi-linear regression (MLR) model for real-time PAR estimation. The system supports SPI-based SD card logging for long-term data storage and features a web-based dashboard for remote monitoring via Wi-Fi. For power efficiency, the sensor operates on a rechargeable battery, with optimized consumption in data logging mode.
The custom-designed sensor PCB integrates an ESP32-based data logger on one side and an AS7341 spectral sensor module on the other. The ESP32 [38] data logger includes essential circuit components such as a lithium battery charging module (supporting a single-cell 3.7V battery), a MAX17048 fuel gauge IC for real-time battery voltage monitoring and state-of-charge (SOC) estimation, a microSD card slot for data storage, and a USB-to-serial converter for boot loading shown in Figure 5(a-b). The AS7341 sensor module shown in Figure 5(c-d) is equipped with a dual-voltage regulator (3.3V and 1.8V), an I2C level shifter, and the AS7341 IC for spectral data acquisition. A detailed bill of materials is available in the Appendix where (Table A1) lists all required components and Table A2 provides the PCB Gerber files and open-source design files created using KiCad (V8.1) [39]. Additionally, 3-D-printable enclosure STL files are available in the Open Science Framework (OSF) repository [40]. These files are all open source and licensed under GNU General Public License (GPL) 3.0 [41] and the hardware is released under CERN OHLv2S [42]. The printing parameters are summarized in Table A3 and can be printed on any RepRap class [43,44] fused filament fabrication-based 3-D printer [45]. Commercial filament was used here, however, costs could be further reduced with distributed recycling and additive manufacturing (DRAM)-based feedstock [46].
2.3. Assembly of PAR Sensor
Assembly process of the device shown in Figure 5(e). The final assembled device and its feature is shown in Figure 6. The sensor's front case features an opening to allow light to reach the AS7341, covered with a circular acrylic sheet to permit full-spectrum transmission while protecting against dust and water. For direct sunlight deployment where light intensity exceeds 1,000 µmol/m²/s, a diffuser is recommended instead of acrylic to prevent sensor saturation. The back case houses a battery compartment with a secure battery holder and a power switch for on/off operation. The sensor also includes an SD card slot, a USB Type-C port for boot loading and charging, and an I2C port for display connectivity or calibration with the SQ-500SS reference sensor.
2.4. Calculation of PAR Using Multilinear Regression
The AS7341 optical sensor comprises 11 spectral channels, 8 of which fall within the visible light spectrum (415–685 nm), coinciding with the PAR range. The raw sensor data from these 8 channels (S1 to S8) is recorded continuously under a predefined gain setting (G=1) and a fixed integration time of 100ms. To estimate the PAR value, a MLR model is employed, which establishes a linear relationship between the spectral sensor readings and the actual PAR values obtained from a reference Apogee SQ-500SS sensor [47]. In the MLR model, the predicted PAR value is expressed as [48,49]:
where:
is the estimated PAR value.
x1, x2, ..., x8 represent the recorded raw sensor values from channels within the PAR range,
b0 is the intercept term, and
b1, b2, ..., b8 are the regression coefficients corresponding to each spectral channel.
The regression coefficients (bi) are computed using the least squares method, which minimizes the sum of squared errors (SSE) between the predicted and actual PAR values (y) obtained from the reference sensor. And the regression coefficients and model evaluation metrics can be easily computed using tools like a spreadsheet program in Libre Office [50] , Python (NumPy [51], SciPy [52]), or MATLAB [53]. In this research, the raw data is stored in the SD card in a .txt file and later for calibration they will be analyzed using excel where the regression tool is used to find the co-efficient. In Excel, the ToolPak add-in allows users to perform multiple regression analysis (Uses the worksheet function LINEST) without requiring programming expertise [54].
2.5. Modes of Operation and Corresponding Core and Setup Instruction:
2.5.1. Calibration Mode
The calibration process involves simultaneously collecting spectral data from the AS7341 sensor and reference PAR measurements from the Apogee SQ-500SS sensor under varying lighting conditions. To achieve this, the developed device incorporates an I2C communication port, which serves dual purposes. In deployment mode, this port is used to connect an OLED display for real-time monitoring. In calibration mode, however, the same I2C port is repurposed to interface with the SQ-500SS sensor, enabling simultaneous data acquisition which is shown in Figure 7 (a). To accurately measure the low voltage output (0–40 mV) of the SQ-500SS sensor, an ADS1115 16-bit analog-to-digital converter (ADC) is integrated into the system. This high-resolution ADC, which operates via I2C protocol, ensures precise voltage measurements, allowing for reliable sensor data logging through the device's I2C interface.
The calibration and deployment procedures are used across different farming environments, including i) horizontal grow lights, ii) vertical Better Grow Lights [55] in an agrotunnel for CEA [56], iii) agrivoltaics greenhouses [57], and outdoor crop-based agrivoltaics systems [58], are shown in Figure 7 (b-e). The collected dataset from these calibration experiments is subsequently used to train the MLR model, where the optimal regression coefficients are determined through statistical analysis. This process enhances the sensor's ability to predict PAR values with high accuracy. By leveraging an open-source hardware platform and a systematic calibration methodology, this approach ensures easy replication and integration, even for users with minimal expertise in electronics and optical sensing.
2.5.2. Deployment of Sensor
Once the MLR model is trained and the regression coefficients are determined, the derived equation can be integrated into the ESP32 firmware to enable real-time estimation of PAR values from AS7341 spectral readings. The ESP32 continuously acquires raw data from the sensor, applies the regression model, and stores the computed PAR values along with spectral readings onto an SD card for offline analysis in .txt file.
For real-time monitoring of PAR and spectral data, a web-based dashboard can be integrated into the ESP32 firmware. When the Web dashboard feature is enabled (Webdashboard = 1), the ESP32 connects to a designated Wi-Fi network. A built-in HTTP server runs on the ESP32, providing a real-time dashboard that displays PAR and spectral data, which can be accessed from any device on the same network by entering the ESP32’s assigned local IP address in a web browser and the dashboard is shown in Figure 7 (f). This functionality enables wireless monitoring of environmental conditions, making it particularly useful for applications such as precision agriculture and controlled-environment farming. Continuous Wi-Fi transmission in this mode, however, increases power consumption, which may result in faster battery depletion, making it less suitable for long-term field deployments without an external power source.
3. Results
3.1. Calibration and Results with Grow Lights and Agrotunnel
Both sensors were positioned under the grow light, as illustrated in Figure 7(b) and placed vertically in front of vertical farming wall in an agrotunnel as illustrated in figure 7(c). PAR values were recorded from both the Apogee SQ-500SS and the AS7341 sensor over a period of 84 minutes across various PAR levels, which were adjusted using the grow light's intensity control knob and for 158 minutes in the agrotunnel. Following data collection, a multilinear regression (MLR) model was applied to establish a calibration relationship between the sensors. The regression analysis demonstrated excellent performance, with both the correlation coefficient (R) and the coefficient of determination (R²) approaching 1, indicating a strong linear relationship. The calibration results are shown in Table 6.
To further validate sensor performance, the derived MLR coefficients were used to predict PAR values for an additional 75-minute test under the same grow light conditions. The results, presented in Figure 8a,b, confirm that the PAR values predicted by the AS7341 sensor closely align with the actual measurements from the Apogee quantum sensor. The mean error between the two sensors was found to be less than 1%, demonstrating the accuracy and reliability of the developed calibration model under grow light exhibiting a consistent spectral distribution at different intensity levels, as shown in Figure 8(a). And in the agrotunnel which uses better grow light (360A) the error found is around 1.11%.
3.2. Calibration and Results in Greenhouse
For outdoor calibration, both sensors were deployed in a greenhouse and an agrivoltaics site, as illustrated in Figure 7(d–e). PAR values were recorded simultaneously using the Apogee SQ-500SS and the AS7341 sensor over a continuous period of 1,390 minutes across both locations. Following data acquisition, a multilinear regression (MLR) model was applied to establish a calibration relationship between the AS7341 sensor outputs and reference measurements. The corresponding MLR coefficients and performance parameters are presented in Table 7. To further validate the sensor’s performance, the derived MLR coefficients were used to predict PAR values. The comparison results for the greenhouse and agrivoltaics site are shown in Figure 9(a–c) and Figure 9(d–f), respectively. The mean absolute error between the two sensors was found to be within the range of 2–5%.
3.3. Battery Charging Duration and Impact of WiFi Dashboard on Backup Duration
The performance of 1,300 mAh battery backup for the PAR sensor is illustrated in Figure 10. The battery management IC, MP73831, charges the battery with a maximum current of 500 mA, enabling a full charge within approximately 150 minutes, as shown in Figure 10(a). The sensor's battery performance was evaluated under two scenarios: with the Wi-Fi-based web dashboard enabled and disabled. During both test conditions, the sensor recorded PAR values at one-minute intervals and logged the data to an SD card. Figure 10(b–c) indicate that the sensor operated for approximately 20 hours without the web dashboard, which is 5 hours longer than the 15-hour runtime observed when the dashboard was active. Battery life can be further extended by reducing the data logging frequency and utilizing the ESP32’s internal RTC to place the system in deep sleep mode between logging intervals. These optimizations can be implemented through the device firmware.
4. Discussion
This article presents the development of a low-cost, handheld PAR measurement device featuring a web-based dashboard, SD card data logging, calibration against an analog quantum sensor, and communication capability with smart greenhouse lighting control systems to enable optimized and cost-effective lighting management. The sensor supports continuous monitoring in outdoor environments and records PAR values at user-defined intervals. The total cost of the device is approximately one-tenth that of commercially available PAR sensors, while offering additional functionalities not typically found in commercial quantum sensors. These results are thus in line with other applications of open hardware that are economically beneficial [59,60].
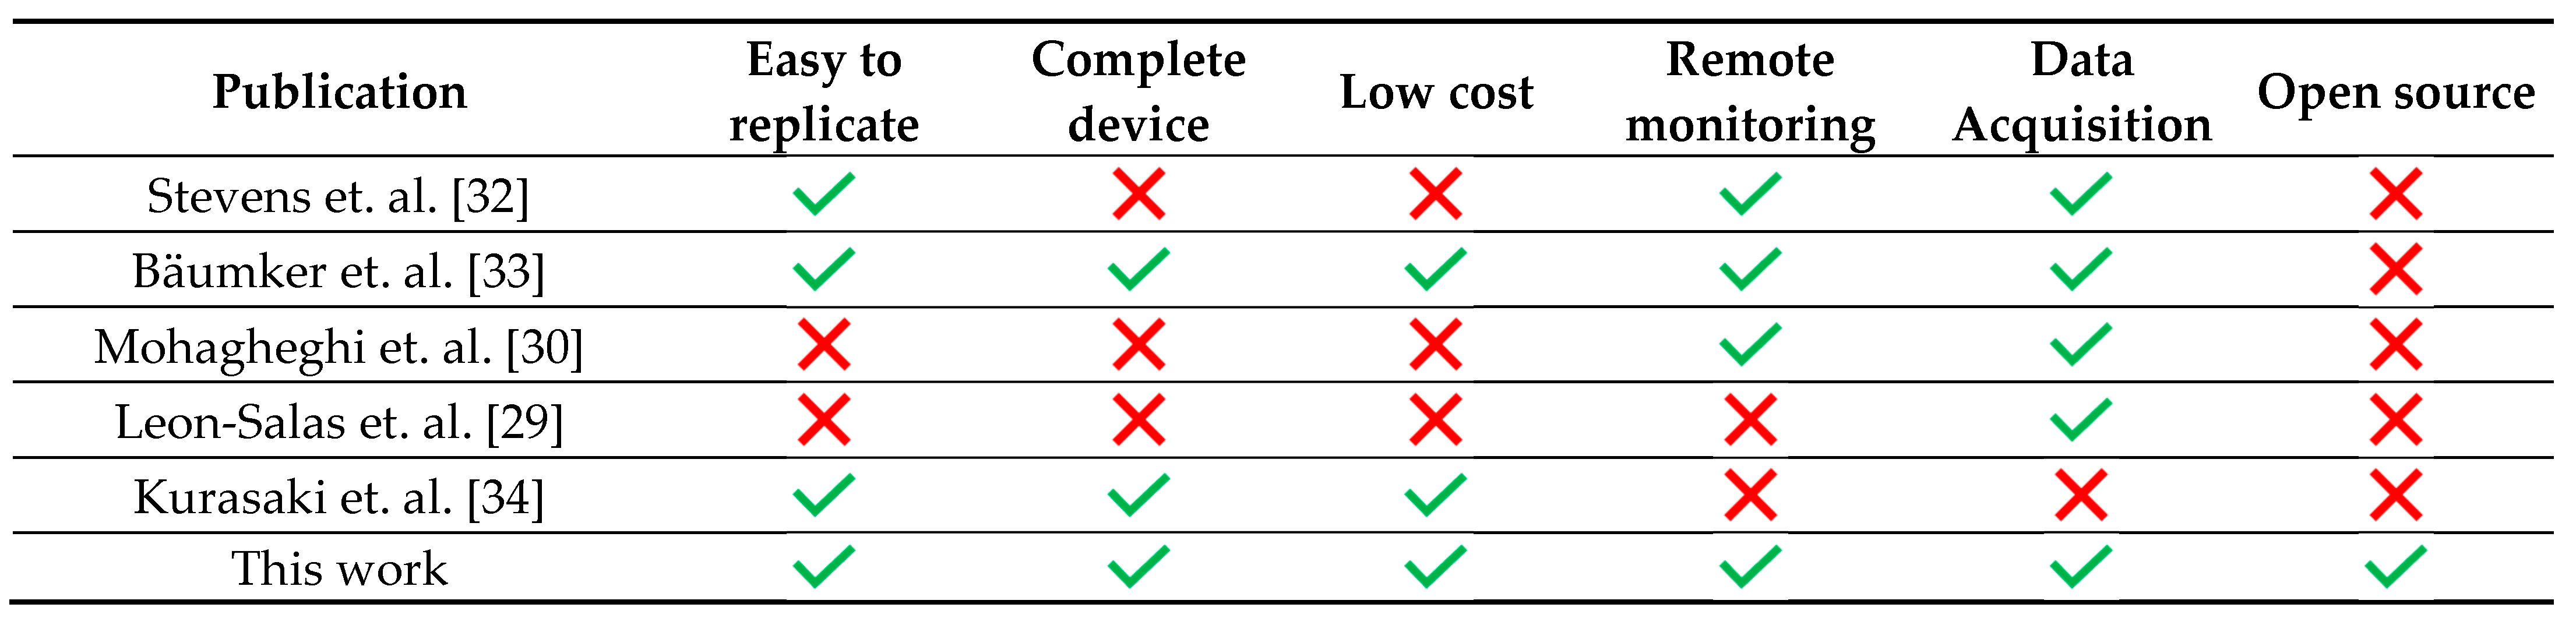
Compared to previously published solutions summarized in Table 8, this device offers a compact, low-cost, and open-source alternative that integrates all essential features while remaining accessible to users with limited expertise in optics or electronics. The complete hardware and firmware are available in the Open Science Framework (OSF) repository [40], enabling further customization and seamless integration into existing smart greenhouse or horticultural systems. Other open hardware is already available for farms [61,62], which is particular mature for farm robotics [63,64].
During validation, the sensor demonstrated a mean error of 2–5% under outdoor lighting conditions, and an even lower error—approximately 1%—under indoor artificial lighting. This error, however, is in addition to the intrinsic error of the reference quantum sensor. As such, while the device may not be suitable for highly precision-dependent applications, it is well-suited for use cases such as smart greenhouse lighting control and continuous, low-cost PAR monitoring in agrivoltaics environments.
Beyond PPFD monitoring, the sensor also enables real-time assessment of spectral intensity distribution. This functionality is particularly valuable in controlled environment agriculture, where different crops respond to specific wavelengths at different times in the lifecycle. The sensor can help detect spectral shifts caused by for example dynamic greenhouse glazing or photovoltaic panels (e.g., trackers) and support adaptive lighting strategies to maintain optimal growing conditions. Therefore, in integrated agrivoltaic systems, this PAR sensor can play a critical role in optimizing crop yield beneath solar installations.
5. Conclusions
In recent years, research on PAR sensors has gained significant momentum, particularly with the advent of low-cost, multi-channel light sensors becoming commercially available. Various methodologies have been proposed for PAR estimation, ranging from advanced artificial intelligence and machine learning models to simpler approaches like linear regression. Among these, the use of multi-channel sensors such as the AS7341 has demonstrated strong potential to serve as a cost-effective alternative to traditional quantum PAR sensors. There remained a gap in the availability of a comprehensive, easy-to-calibrate, and ready-to-deploy device that combines hardware, firmware, and a practical calibration approach. This study addresses that gap by introducing a compact, open-source PAR sensor system that not only rivals the performance of high-cost commercial sensors and dedicated data loggers but does so at a significantly reduced cost (~CAD$70 or US$50). This makes the device an attractive solution for widespread adoption in smart lighting and spectral control applications within agriculture and horticulture. Validation results show a mean error of 2–5% under outdoor lighting and approximately 1% under indoor artificial lighting. With a battery backup of 15–20 hours per charge, the device supports remote, untethered deployment. Local SD card-based logging enables its use in locations without Wi-Fi connectivity, while the inclusion of I2C and USB-C interfaces ensures seamless integration with existing smart farming and environmental control systems.
Author Contributions
Conceptualization, M.M.R., J.M.P.; methodology, M.M.R., U.J., J.M.P.; software, M.M.R.; validation, M.M.R., U.J.,; formal analysis, M.M.R., U.J., J.M.P.; investigation, M.M.R., U.J.; resources, J.M.P.; data curation, M.M.R., U.J., J.M.P.; writing—original draft preparation, M.M.R., U.J., J.M.P.; writing—review and editing, M.M.R., U.J., J.M.P.; visualization, M.M.R.; supervision, J.M.P.; funding acquisition, J.M.P. All authors have read and agreed to the published version of the manuscript. .
Funding
This research was supported by the Thompson Endowment and the Natural Sciences and Engineering Research Council of Canada.
Data Availability Statement
All source code for this project is available: https://osf.io/vxarp/.
Acknowledgments
None.
Conflicts of Interest
The authors declare no conflicts of interest.
Abbreviations
The following abbreviations are used in this manuscript:
| PAR | Photosynthetically active radiation |
| PPFD | Photosynthetic Photon Flux Density |
| MLR | Multiple linear regression |
| I2C | Inter Integrated Circuit |
Appendix A

Table A1.
Table of bill of materials.
| No. | Ref | Name | Product detail (Model) | Package | Vendor | Number | Price (CAD)/ Parts | Price (CAD) | Links (all visited on April 17, 2025) |
|---|---|---|---|---|---|---|---|---|---|
| 1 | C1, C4, C8, C9, C11 | 10uF | 10uF | 0805 | Digikey | 5 | $0.06 | 0.292 | https://www.digikey.ca/en/products/detail/samsung-electro-mechanics/CL21A106KOQNNNE/3886754 |
| 2 | C2, C5, C12, C15 | 0.1uF | 0.1uF | 0805 | Digikey | 4 | $0.04 | 0.1584 | https://www.digikey.ca/en/products/detail/samsung-electro-mechanics/CL21B104KCFNNNE/5961324? |
| 3 | C3, C7, C10 | 1.0uF | 2.2uF | 0805 | Digikey | 3 | $0.19 | 0.576 | https://www.digikey.ca/en/products/detail/samsung-electro-mechanics/CL21B225KAFNFNE/3888611 |
| 4 | C6, C19 | 4.7uF | 4.7uF | 0805 | Digikey | 2 | $0.06 | 0.1168 | https://www.digikey.ca/en/products/detail/samsung-electro-mechanics/CL21A475KAQNNNE/3886902 |
| 5 | R2, R7, R8, R17, R18, R5, R11, R12, R13, R14 | 10k | 10kOhm | 0805 | Digikey | 10 | $0.02 | 0.192 | https://www.digikey.ca/en/products/detail/stackpole-electronics-inc/RMCF0805FT10K0/1760676 |
| 6 | R3, R4, R34 | 1k | 1k ohm | 0805 | Digikey | 3 | 0.013 | 0.039 | https://www.digikey.com/en/products/detail/stackpole-electronics-inc/RNCP0805FTD1K00/2240229 |
| 8 | R6 | 2.0k | 2kohm | 0805 | Digikey | 1 | 0.012 | 0.012 | https://www.digikey.com/en/products/detail/stackpole-electronics-inc/RMCF0805FT2K00/1760249 |
| 9 | JP1, JP2 | 0 k | 0 ohm jumper | 0805 | Digikey | 2 | $0.01 | 0.0296 | https://www.digikey.ca/en/products/detail/stackpole-electronics-inc/RMCF0805ZT0R00/1756901 |
| 10 | R9, R10 | 5.1k | 5 kOhm | 0805 | Digikey | 2 | $0.02 | 0.0384 | https://www.digikey.ca/en/products/detail/stackpole-electronics-inc/RMCF0805FT5K10/1760394 |
| 12 | Memory Card Slot | MEM2061-01-188-00-A | 10 (8 + 2) Position microSD™ | 10 (8+2) position | Digikey | 1 | 1.69 | 1.69 | https://www.digikey.ca/en/products/detail/gct/MEM2061-01-188-00-A/9859612 |
| 13 | U7 | CH340C | USB to Serial Adapter Chip | SOP-16 | Amazon | 1 | 3.768 | 3.768 | https://www.amazon.ca/JESSINIE-CH340C-SOP-16-Adapter-Oscillator/dp/B0BK991VVV/ |
| 14 | U6 | Voltage regilator for AS7341 | AP7312-1833W6-7 | SOT-26 | Digikey | 1 | $1.78 | 1.78 | https://www.digikey.ca/en/products/detail/diodes-incorporated/AP7312-1833W6-7/2901062 |
| 15 | Q1, Q4 | N-MOS | BSS138 | SOT-23-3 | Digikey | 2 | $0.25 | 0.502 | https://www.digikey.ca/en/products/detail/onsemi/BSS138/244210 |
| 16 | X1 | AS7341 | AS7341-DLGM | 8-TFLGA | Digikey | 1 | $12.37 | 12.37 | https://www.digikey.ca/en/products/detail/ams-osram-usa-inc/AS7341-DLGM/9996230 |
| 17 | U1 | battery charger | MCP73831T-2ACI/OT | SOT-23-5 | Digikey | 1 | $1.23 | 1.23 | https://www.digikey.ca/en/products/detail/microchip-technology/MCP73831T-2ACI-OT/964301 |
| 18 | U2 | ESP32 WROOM 32E | ESP32-WROOM-32E-H4 | 38-SMD Module | Digikey | 1 | $4.34 | $4.34 | https://www.digikey.ca/en/products/detail/espressif-systems/ESP32-WROOM-32E-H4/12696413 |
| 19 | U3, U5 | 3.3V regulator | XC6222B331MR-G | SOT25 | Digikey | 2 | $1.28 | $2.55 | https://www.digikey.ca/en/products/detail/torex-semiconductor-ltd/XC6222B331MR-G/2138187 |
| 20 | U4 | Battery monitoring | MAX17048G+T10 | 8-TDFN-EP | Digikey | 1 | $8.13 | $8.13 | https://www.digikey.ca/en/products/detail/analog-devices-inc-maxim-integrated/MAX17048G-T10/3758921 |
| 21 | USB1 | USB Type C | USB4105-GF-A-120 | SMD | Digikey | 1 | $1.19 | $1.19 | https://www.digikey.ca/en/products/detail/gct/USB4105-GF-A-120/14559037 |
| 22 | Q2 | nMOS | MBT3904DW1T1G | SOT-363 | Digikey | 1 | $0.29 | $0.29 | https://www.digikey.ca/en/products/detail/onsemi/MBT3904DW1T1G/918648 |
| 23 | Q3 | P-MOS | DMG2305UX-7 | SOT-23-3 | Digikey | 1 | $0.44 | $0.44 | https://www.digikey.ca/en/products/detail/diodes-incorporated/DMG2305UX-7/4340667 |
| 24 | D5 | RGB LED | COM-16347 | 5.00mm L x 5.00mm W | Digikey | 1 | $0.83 | $0.83 | https://www.digikey.ca/en/products/detail/sparkfun-electronics/COM-16347/11630204 |
| 25 | - | Lithium Battery | HXJNLDC 3.7V 503759 1300mAh | 5×37×59mm | Amazon | 1 | $22.00 | $22.00 | https://www.amazon.ca/3000mAh-103665-Lithium-Replacement-Bluetooth/dp/B08MPLHH32/?th=1 |
| 26 | SW1, SW2 | Button | KMR231NG ULC LFS | 4.60mm x 2.80mm | Digikey | 2 | $0.89 | $1.78 | https://www.digikey.ca/en/products/detail/c-k/KMR231NG-ULC-LFS/2176541 |
| 27 | LED2, LED3 | BLUE LED | 150080BS75000 | 0805 | Digikey | 2 | 0.28 | 0.56 | https://www.digikey.ca/en/products/detail/w%C3%BCrth-elektronik/150080BS75000/4489912 |
| 28 | LED4 | RED LED | 150060RS75000 | 0603 (1608 Metric) | Digikey | 1 | $0.23 | $0.23 | https://www.digikey.ca/en/products/detail/w%C3%BCrth-elektronik/150060RS75000/4489901 |
| 29 | D4 | Diode | BAT60AE6327HTSA1 | SOD323-3D | Digikey | 1 | $0.62 | $0.62 | https://www.digikey.ca/en/products/detail/infineon-technologies/BAT60AE6327HTSA1/1280934 |
| 30 | - | PCB | - | - | JLCPCB | 1 | $5.00 | $5.00 | https://jlcpcb.com/ |
| Total= | $70.7 |
Table A2.
ESP32 codes, PCB Gerbers and 3D printed parts repository.
| Parts name | Quantity | File type | license | Location of file |
| PCB_gerbers | 1 | STEP/stl | CERN OHL-S 2.0. | https://osf.io/vxarp/ |
| PCB_KiCad | 1 | STEP/stl | CERN OHL-S 2.0. | https://osf.io/vxarp/ |
| 3D_printed_parts_Onshape | 5 | STEP/stl | CERN OHL-S 2.0. | https://osf.io/vxarp/ |
| ESP32_calibration_firmware | 1 | .ino | GNU GPL v3 | https://osf.io/vxarp/ |
| ESP32_deployment_firmware | 1 | .ino | GNU GPL v3 | https://osf.io/vxarp/ |
Table A3.
3-D printing parameters.
| Parameter | Value |
| Filament | PLA |
| Layer Height | 0.3 mm |
| Initial Layer Height | 0.2 mm |
| Infill Density | 15 % |
| Printing Temperature | 210 ˚C |
| Build Plate Temperature | 60 ˚C |
| Print Speed | 60 mm/s |
| Travel Speed | 175 mm/s |
References
- McCree, K.J. The Action Spectrum, Absorptance and Quantum Yield of Photosynthesis in Crop Plants. Agricultural Meteorology 1971, 9, 191–216. [Google Scholar] [CrossRef]
- Björkman, O.; Demmig, B. Photon Yield of O2 Evolution and Chlorophyll Fluorescence Characteristics at 77 K among Vascular Plants of Diverse Origins. Planta 1987, 170, 489–504. [Google Scholar] [CrossRef]
- Yunus, M.; Pathre, U.; Mohanty, P. Probing Photosynthesis: Mechanism, Regulation & Adaptation; CRC Press, 2014; ISBN 978-1-4822-6801-0.
- Niinemets, Ü.; Valladares, F. Photosynthetic Acclimation to Simultaneous and Interacting Environmental Stresses Along Natural Light Gradients: Optimality and Constraints. Plant Biol (Stuttg) 2004, 6, 254–268. [Google Scholar] [CrossRef] [PubMed]
- Ritchie, R.J. Fitting Light Saturation Curves Measured Using Modulated Fluorometry. Photosynth Res 2008, 96, 201–215. [Google Scholar] [CrossRef] [PubMed]
- Graamans, L.; Baeza, E.; van den Dobbelsteen, A.; Tsafaras, I.; Stanghellini, C. Plant Factories versus Greenhouses: Comparison of Resource Use Efficiency. Agricultural Systems 2018, 160, 31–43. [Google Scholar] [CrossRef]
- Jamil, U.; Pearce, J.M. Experimental Impacts of Transparency on Strawberry Agrivoltaics Using Thin Film Photovoltaic Modules under Low Light Conditions. Solar Energy 2025, 290, 113375. [Google Scholar] [CrossRef]
- Jamil, U.; Rahman, M.; Pearce, J.M. Complexities in Agrivoltaic Policy Mandates Illustrated with Semitransparent Photovoltaic Yields 2024.
- Barron-Gafford, G.A.; Pavao-Zuckerman, M.A.; Minor, R.L.; Sutter, L.F.; Barnett-Moreno, I.; Blackett, D.T.; Thompson, M.; Dimond, K.; Gerlak, A.K.; Nabhan, G.P.; et al. Agrivoltaics Provide Mutual Benefits across the Food–Energy–Water Nexus in Drylands. Nat Sustain 2019, 2, 848–855. [Google Scholar] [CrossRef]
- Dupraz, C.; Marrou, H.; Talbot, G.; Dufour, L.; Nogier, A.; Ferard, Y. Combining Solar Photovoltaic Panels and Food Crops for Optimising Land Use: Towards New Agrivoltaic Schemes. Renewable Energy 2011, 36, 2725–2732. [Google Scholar] [CrossRef]
- Jamil, U.; Hickey, T.; Pearce, J.M. Solar Energy Modelling and Proposed Crops for Different Types of Agrivoltaics Systems. Energy 2024, 304, 132074. [Google Scholar] [CrossRef]
- Nelson, J.A.; Bugbee, B. Economic Analysis of Greenhouse Lighting: Light Emitting Diodes vs. High Intensity Discharge Fixtures. PLoS One 2014, 9, e99010. [Google Scholar] [CrossRef]
- Optimizing Light Use Efficiency and Quality of Indoor Organically Grown Leafy Greens by Using Different Lighting Strategies. Available online: https://www.mdpi.com/2073-4395/13/10/2582 (accessed on 11 March 2025).
- Park, Y.; Sethi, R.; Temnyk, S. Growth, Flowering, and Fruit Production of Strawberry ‘Albion’ in Response to Photoperiod and Photosynthetic Photon Flux Density of Sole-Source Lighting. Plants 2023, 12, 731. [Google Scholar] [CrossRef] [PubMed]
- Baligar, V.C.; Elson, M.K.; He, Z.; Li, Y.; Paiva, A. de Q.; Almeida, A. a. F.; Ahnert, D. Light Intensity Effects on the Growth, Physiological and Nutritional Parameters of Tropical Perennial Legume Cover Crops. Agronomy 2020, 10, 1515. [Google Scholar] [CrossRef]
- Hole, C.C.; Dearman, J. The Effect of Photon Flux Density on Distribution of Assimilate between Shoot and Storage Root of Carrot, Red Beet and Radish. Scientia Horticulturae 1993, 55, 213–225. [Google Scholar] [CrossRef]
- MQ-500: Full-Spectrum Quantum Meter. Available online: https://www.apogeeinstruments.com/mq-500-full-spectrum-quantum-meter/ (accessed on 7 March 2025).
- MQ-510: Full-Spectrum Underwater Quantum Meter. Available online: https://www.apogeeinstruments.com/mq-510-full-spectrum-underwater-quantum-meter/ (accessed on 7 March 2025).
- SQ-520: Full-Spectrum Smart Quantum Sensor (USB). Available online: https://www.apogeeinstruments.com/sq-520-full-spectrum-smart-quantum-sensor-usb/ (accessed on 7 March 2025).
- LI-COR Environmental. Available online: https://www.licor.com/products/light/quantum (accessed on 7 March 2025).
- Seeed Studio-Industrial PAR Sensor (PAR-2.5V). Available online: https://www.seeedstudio.com/PAR-2-5V-p-4831.html (accessed on 7 March 2025).
- Caya, M.V.C.; Alcantara, J.T.; Carlos, J.S.; Cereno, S.S.B. Photosynthetically Active Radiation (PAR) Sensor Using an Array of Light Sensors with the Integration of Data Logging for Agricultural Application. In Proceedings of the 2018 3rd International Conference on Computer and Communication Systems (ICCCS); April 2018; pp. 377–381.
- Rajendran, J.; Leon-Salas, W.D.; Fan, X.; Zhang, Y.; Vizcardo, M.A.; Postigo, M. On the Development of a Low-Cost Photosynthetically Active Radiation (PAR) Sensor. In Proceedings of the 2020 IEEE International Symposium on Circuits and Systems (ISCAS); October 2020; pp. 1–5.
- Fielder, P.; Comeau, P. Construction and Testing of an Inexpensive PAR Sensor; Ministry of Forests Research Program: British Columbia, 2000. [Google Scholar]
- Kutschera, A.; Lamb, J.J. Light Meter for Measuring Photosynthetically Active Radiation. American Journal of Plant Sciences 2018, 9, 2420–2428. [Google Scholar] [CrossRef]
- Jiang, J.; Moallem, M.; Zheng, Y. An Intelligent IoT-Enabled Lighting System for Energy-Efficient Crop Production. Journal of Daylighting 2021, 8, 86–99. [Google Scholar] [CrossRef]
- Ams AS7341 – 11-Channel Spectral Color Sensor Ambient Light, Color, Spectral & Proximity Sensors | Ams OSRAM. Available online: https://ams-osram.com/products/sensor-solutions/ambient-light-color-spectral-proximity-sensors/ams-as7341-11-channel-spectral-color-sensor (accessed on 10 March 2025).
- Ams AS7265x Smart Spectral Sensor Ambient Light, Color, Spectral & Proximity Sensors - Ams-Osram - Ams. Available online: https://ams-osram.com/products/sensor-solutions/ambient-light-color-spectral-proximity-sensors/ams-as7265x-smart-spectral-sensor (accessed on 10 March 2025).
- Leon-Salas, W.D.; Rajendran, J.; Vizcardo, M.A.; Postigo-Malaga, M. Measuring Photosynthetically Active Radiation with a Multi-Channel Integrated Spectral Sensor. In Proceedings of the 2021 IEEE International Symposium on Circuits and Systems (ISCAS); May 2021; pp. 1–5.
- Mohagheghi, A.; Moallem, M. An Energy-Efficient PAR-Based Horticultural Lighting System for Greenhouse Cultivation of Lettuce. IEEE Access 2023, 11, 8834–8844. [Google Scholar] [CrossRef]
- Mohagheghi, A.; Moallem, M. Measuring Photosynthetic Photon Flux Density in the Blue and Red Spectrum for Horticultural Lighting Using Machine Learning Methods. IEEE Transactions on Instrumentation and Measurement 2024, 73, 1–10. [Google Scholar] [CrossRef]
- D Stevens, J.; Murray, D.; Diepeveen, D.; Toohey, D. Adaptalight: An Inexpensive PAR Sensor System for Daylight Harvesting in a Micro Indoor Smart Hydroponic System. Horticulturae 2022, 8, 105. [Google Scholar] [CrossRef]
- Bäumker, E.; Zimmermann, D.; Schierle, S.; Woias, P. A Novel Approach to Obtain PAR with a Multi-Channel Spectral Microsensor, Suitable for Sensor Node Integration. Sensors 2021, 21, 3390. [Google Scholar] [CrossRef]
- Kurasaki, R.; Byrd, M.; Kobayashi, K. Low-Cost Light Sensors for Indoor Agriculture. College of Tropical Agriculture and Human Resources (CTHAR) 2023.
- Gibb, A. Building Open Source Hardware: DIY Manufacturing for Hackers and Makers; Addison-Wesley Professional, 2014; ISBN 978-0-13-337390-5.
- Pearce, J.M. Cut Costs with Open-Source Hardware. Nature 2014, 505, 618–618. [Google Scholar] [CrossRef]
- Mars Hydro TS 1000 Full Spectrum Dimmable 150W LED Grow Light. Available online: https://www.mars-hydro.com/ts-1000-led-grow-light (accessed on 19 April 2025).
- ESP32 Wi-Fi & Bluetooth SoC | Espressif Systems. Available online: https://www.espressif.com/en/products/socs/esp32 (accessed on 19 April 2025).
- KiCad EDA. Available online: https://www.kicad.org/ (accessed on 19 April 2025).
- OSF | Open-Source Photosynthetically Active Radiation. Available online: https://osf.io/vxarp/ (accessed on 19 April 2025).
- The GNU General Public License v3.0 - GNU Project - Free Software Foundation. Available online: https://www.gnu.org/licenses/gpl-3.0.en.html (accessed on 26 August 2024).
- Home | CERN Open Hardware Licence. Available online: https://cern-ohl.web.cern.ch/ (accessed on 26 August 2024).
- Sells, E.; Bailard, S.; Smith, Z.; Bowyer, A.; Olliver, V. RepRap: The Replicating Rapid Prototyper: Maximizing Customizability by Breeding the Means of Production. In Handbook of Research in Mass Customization and Personalization; World Scientific Publishing Company, 2009; pp. 568–580 ISBN 978-981-4280-25-9.
- Jones, R.; Haufe, P.; Sells, E.; Iravani, P.; Olliver, V.; Palmer, C.; Bowyer, A. RepRap – the Replicating Rapid Prototyper. Robotica 2011, 29, 177–191. [Google Scholar] [CrossRef]
- Anzalone, G.C.; Wijnen, B.; Pearce, J.M. Multi-Material Additive and Subtractive Prosumer Digital Fabrication with a Free and Open-Source Convertible Delta RepRap 3-D Printer. Rapid Prototyping Journal 2015, 21, 506–519. [Google Scholar] [CrossRef]
- Dertinger, S.C.; Gallup, N.; Tanikella, N.G.; Grasso, M.; Vahid, S.; Foot, P.J.S.; Pearce, J.M. Technical Pathways for Distributed Recycling of Polymer Composites for Distributed Manufacturing: Windshield Wiper Blades. Resources, Conservation and Recycling 2020, 157, 104810. [Google Scholar] [CrossRef]
- SQ-500-SS: Full-Spectrum Quantum Sensor. Available online: https://www.apogeeinstruments.com/sq-500-ss-full-spectrum-quantum-sensor/ (accessed on 19 April 2025).
- Weisberg, S. Applied Linear Regression; John Wiley & Sons, 2013; ISBN 978-1-118-62595-8.
- Montgomery, D.C.; Peck, E.A.; Vining, G.G. Introduction to Linear Regression Analysis; John Wiley & Sons, 2015; ISBN 978-1-119-18017-3.
- Home | LibreOffice - Free and Private Office Suite - Based on OpenOffice - Compatible with Microsoft. Available online: https://www.libreoffice.org/ (accessed on 19 April 2025).
- NumPy. Available online: https://numpy.org/ (accessed on 19 April 2025).
- SciPy. Available online: https://scipy.org/ (accessed on 19 April 2025).
- MATLAB. Available online: https://www.mathworks.com/products/matlab.html (accessed on 19 April 2025).
- Use the Analysis ToolPak to Perform Complex Data Analysis-Microsoft Support. Available online: https://support.microsoft.com/en-us/office/use-the-analysis-toolpak-to-perform-complex-data-analysis-6c67ccf0-f4a9-487c-8dec-bdb5a2cefab6 (accessed on 16 March 2025).
- Food Security Structures Canada - Better Grow Lights. Available online: https://www.foodsecuritystructures.ca/growing-systems/better-grow-lights (accessed on 19 April 2025).
- Asgari, N.; Jamil, U.; Pearce, J.M. Net Zero Agrivoltaic Arrays for Agrotunnel Vertical Growing Systems: Energy Analysis and System Sizing. Sustainability 2024, 16, 6120. [Google Scholar] [CrossRef]
- Schallenberg-Rodriguez, J.; Rodrigo-Bello, J.-J.; Río-Gamero, B.D. Agrivoltaic: How Much Electricity Could Photovoltaic Greenhouses Supply? Energy Reports 2023, 9, 5420–5431. [Google Scholar] [CrossRef]
- Jamil, U.; Bonnington, A.; Pearce, J.M. The Agrivoltaic Potential of Canada. Sustainability 2023, 15, 3228. [Google Scholar] [CrossRef]
- Bitella, G.; Rossi, R.; Bochicchio, R.; Perniola, M.; Amato, M. A Novel Low-Cost Open-Hardware Platform for Monitoring Soil Water Content and Multiple Soil-Air-Vegetation Parameters. Sensors 2014, 14, 19639–19659. [Google Scholar] [CrossRef]
- Chagas, A.M. Haves and Have Nots Must Find a Better Way: The Case for Open Scientific Hardware. PLOS Biology 16, p.e300001.
- Pearce, J.M. Applications of Open Source 3-D Printing on Small Farms. Organic Farming 2015, 1, 19–35. [Google Scholar] [CrossRef]
- Robert, M.; Jérémy, B.; Christian, V.; Elies, D.; Roland, J. Open Source Hardware Development – A Handbook for Collaborative Product Creation; Berlin Universities Publishing, 2024; ISBN 978-3-9878101-3-8.
- Trilles, S.; González-Pérez, A.; Huerta, J. A Comprehensive IoT Node Proposal Using Open Hardware. A Smart Farming Use Case to Monitor Vineyards. Electronics 2018, 7, 419. [Google Scholar] [CrossRef]
- Rogers, H.; School of Computer Science, University of Lincoln; Fox, C.; School of Computer Science, University of Lincoln An Open Source Seeding Agri-Robot.; May 6 2020; pp. 48–50.
Figure 1.
Application of PAR sensor.
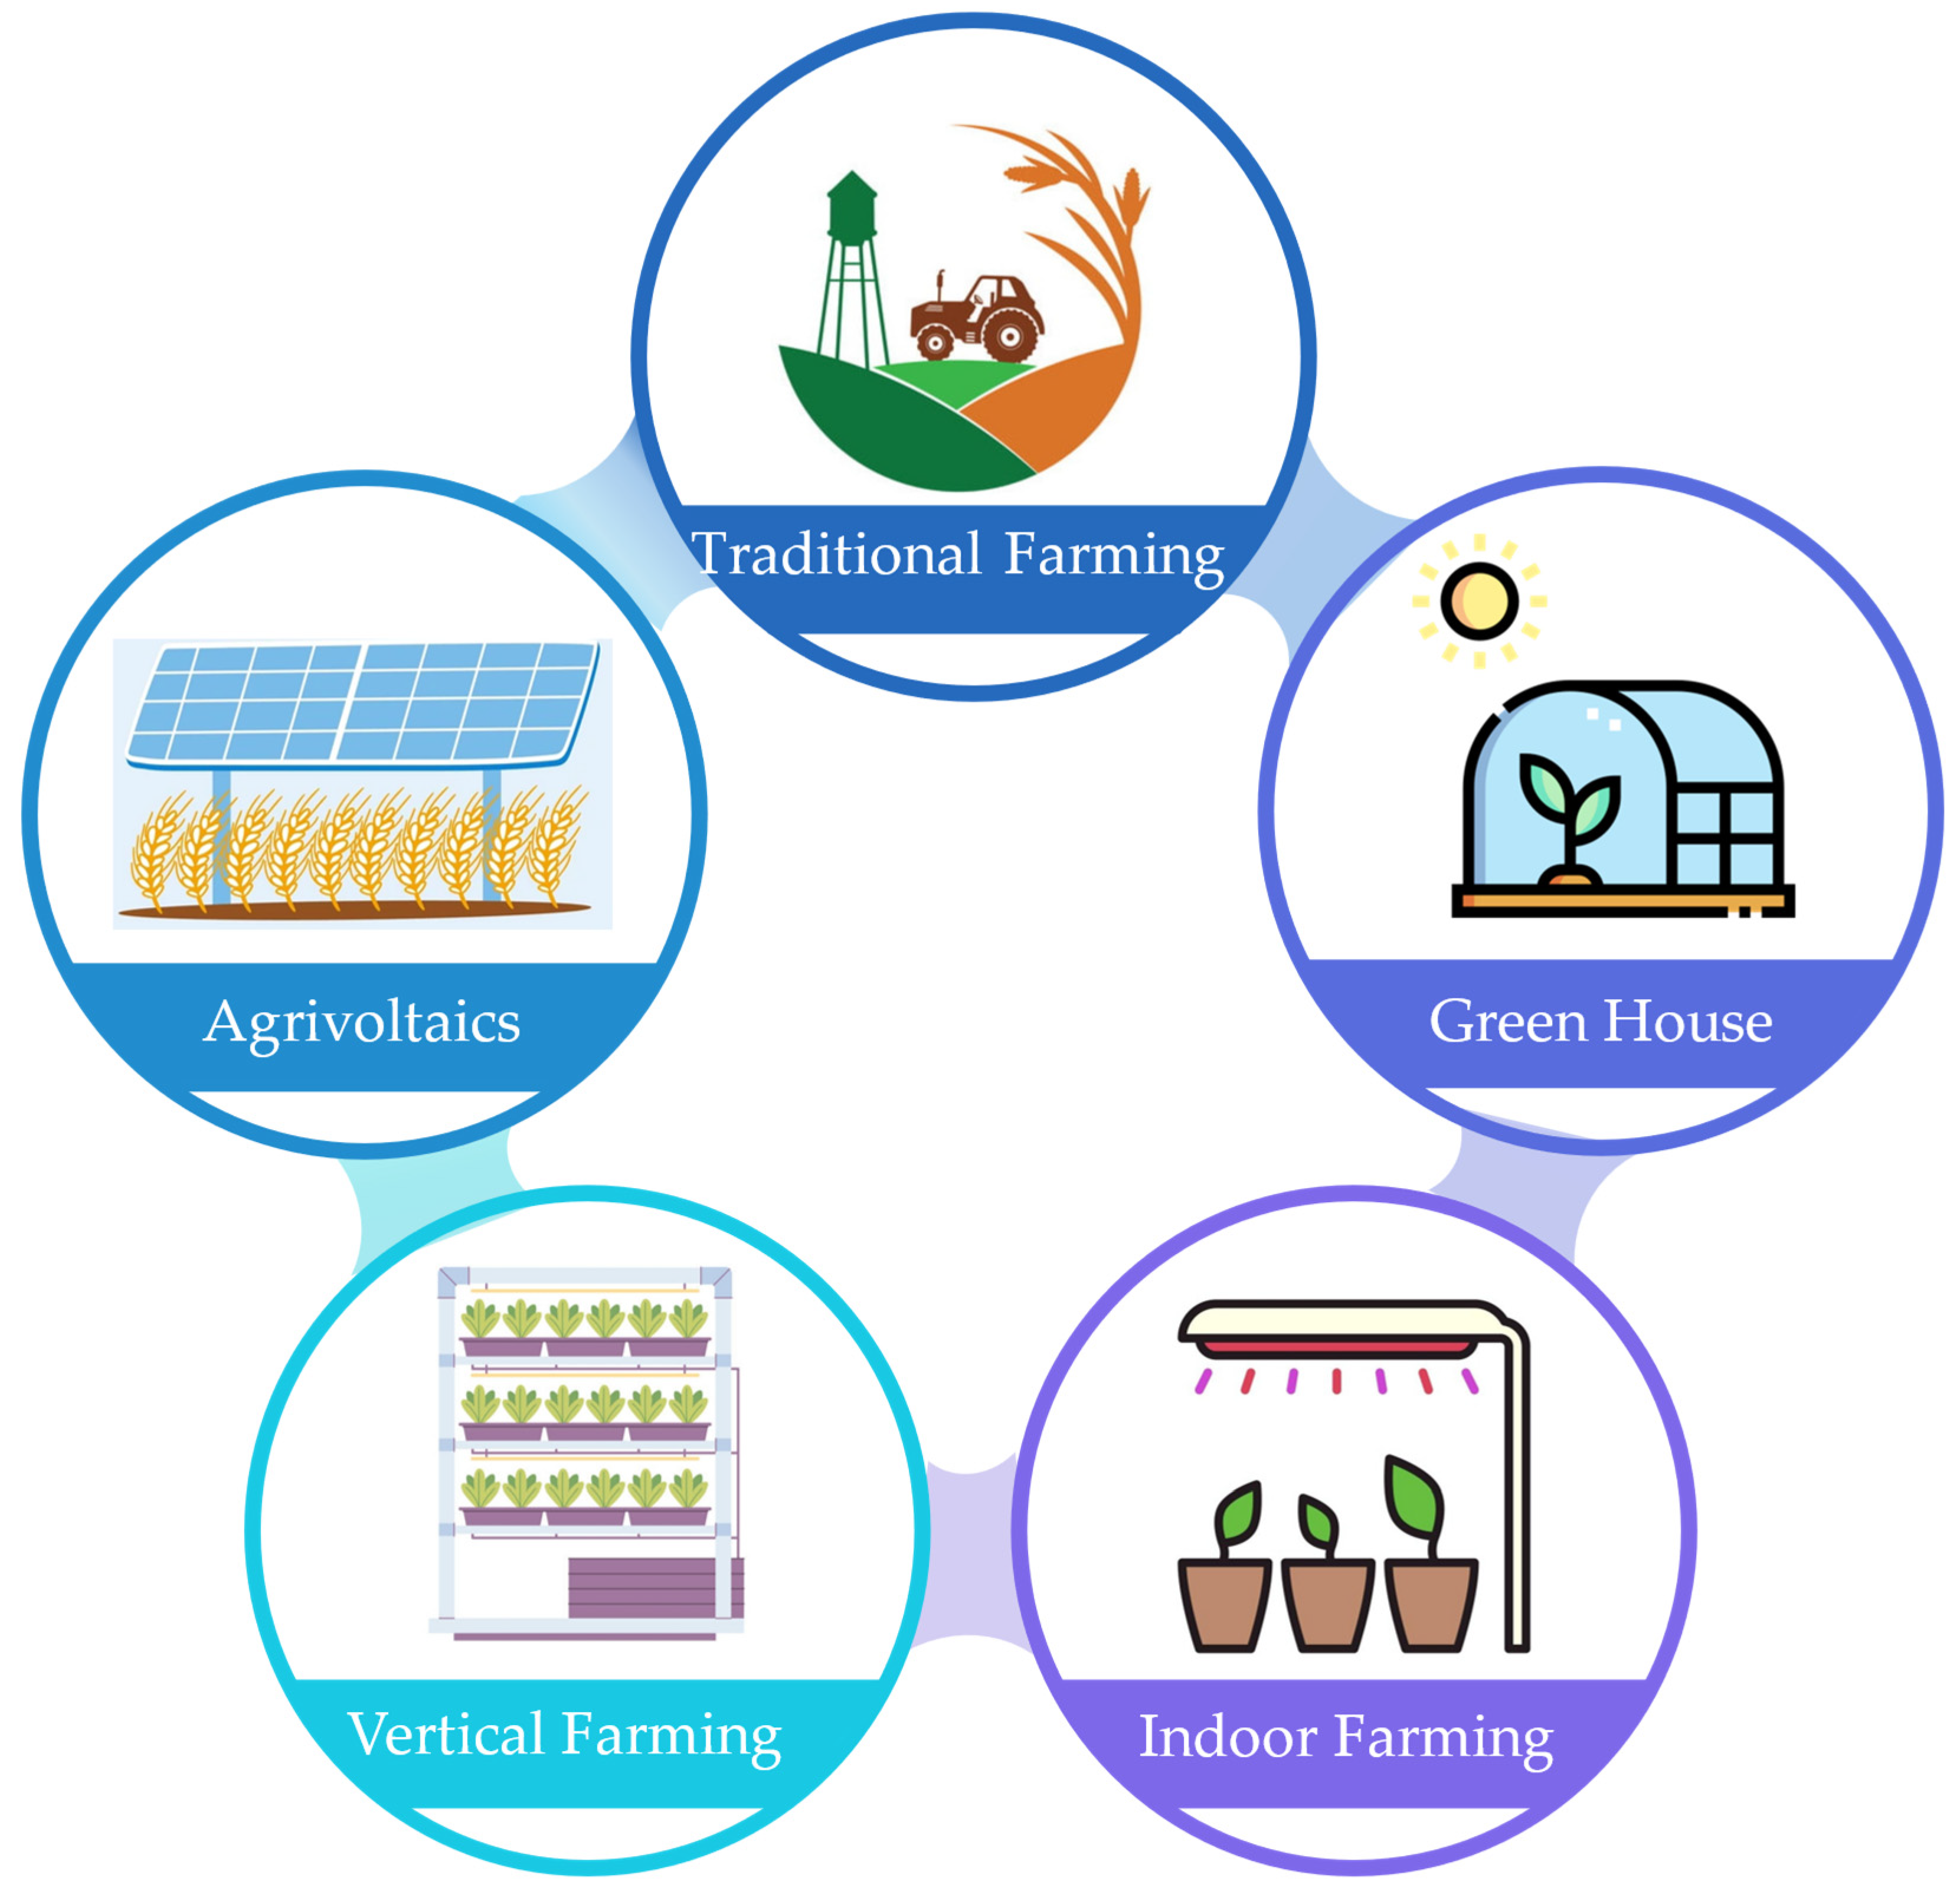
Figure 2.
Typical PPFD range and photoperiod requirements for specific types of crops [13,14,15,16].
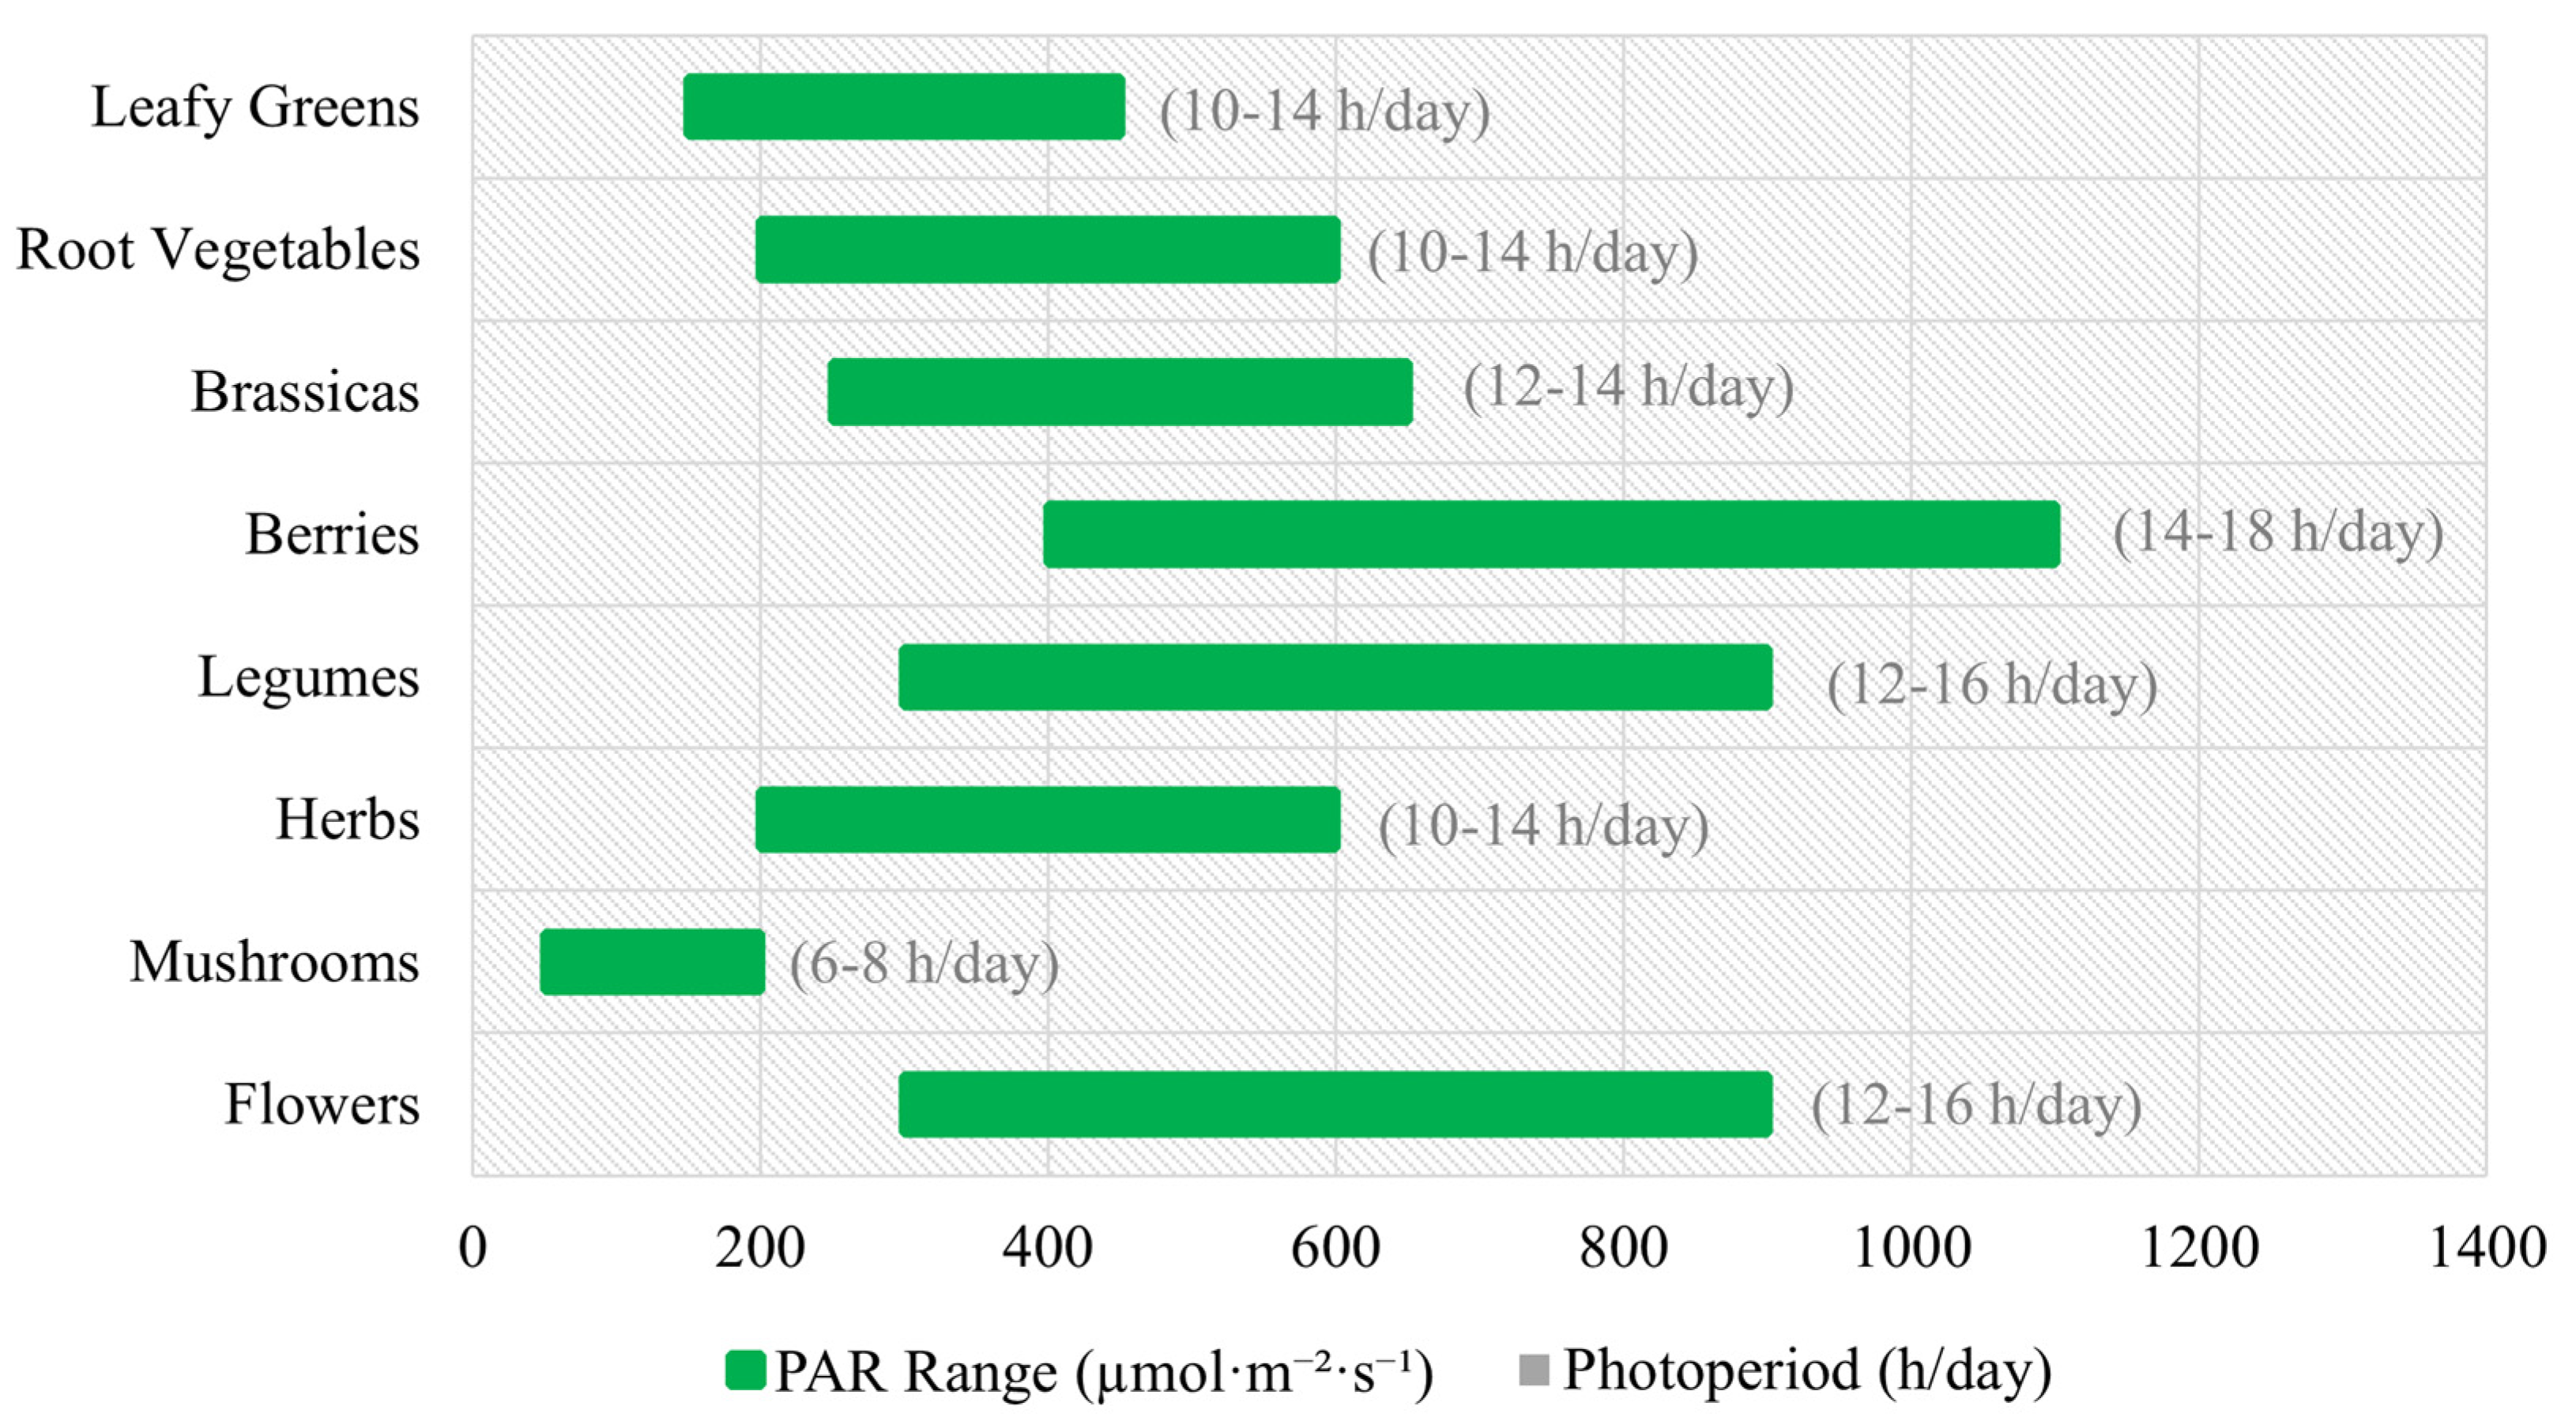
Figure 3.
(a) The nominal spectral intensity plot of grow light Mars Hydro TS-1000 (Recreated from TS-1000 data sheet) and (b) Measured spectral light distribution of LED grow light using AS7341 sensor.
Figure 3.
(a) The nominal spectral intensity plot of grow light Mars Hydro TS-1000 (Recreated from TS-1000 data sheet) and (b) Measured spectral light distribution of LED grow light using AS7341 sensor.
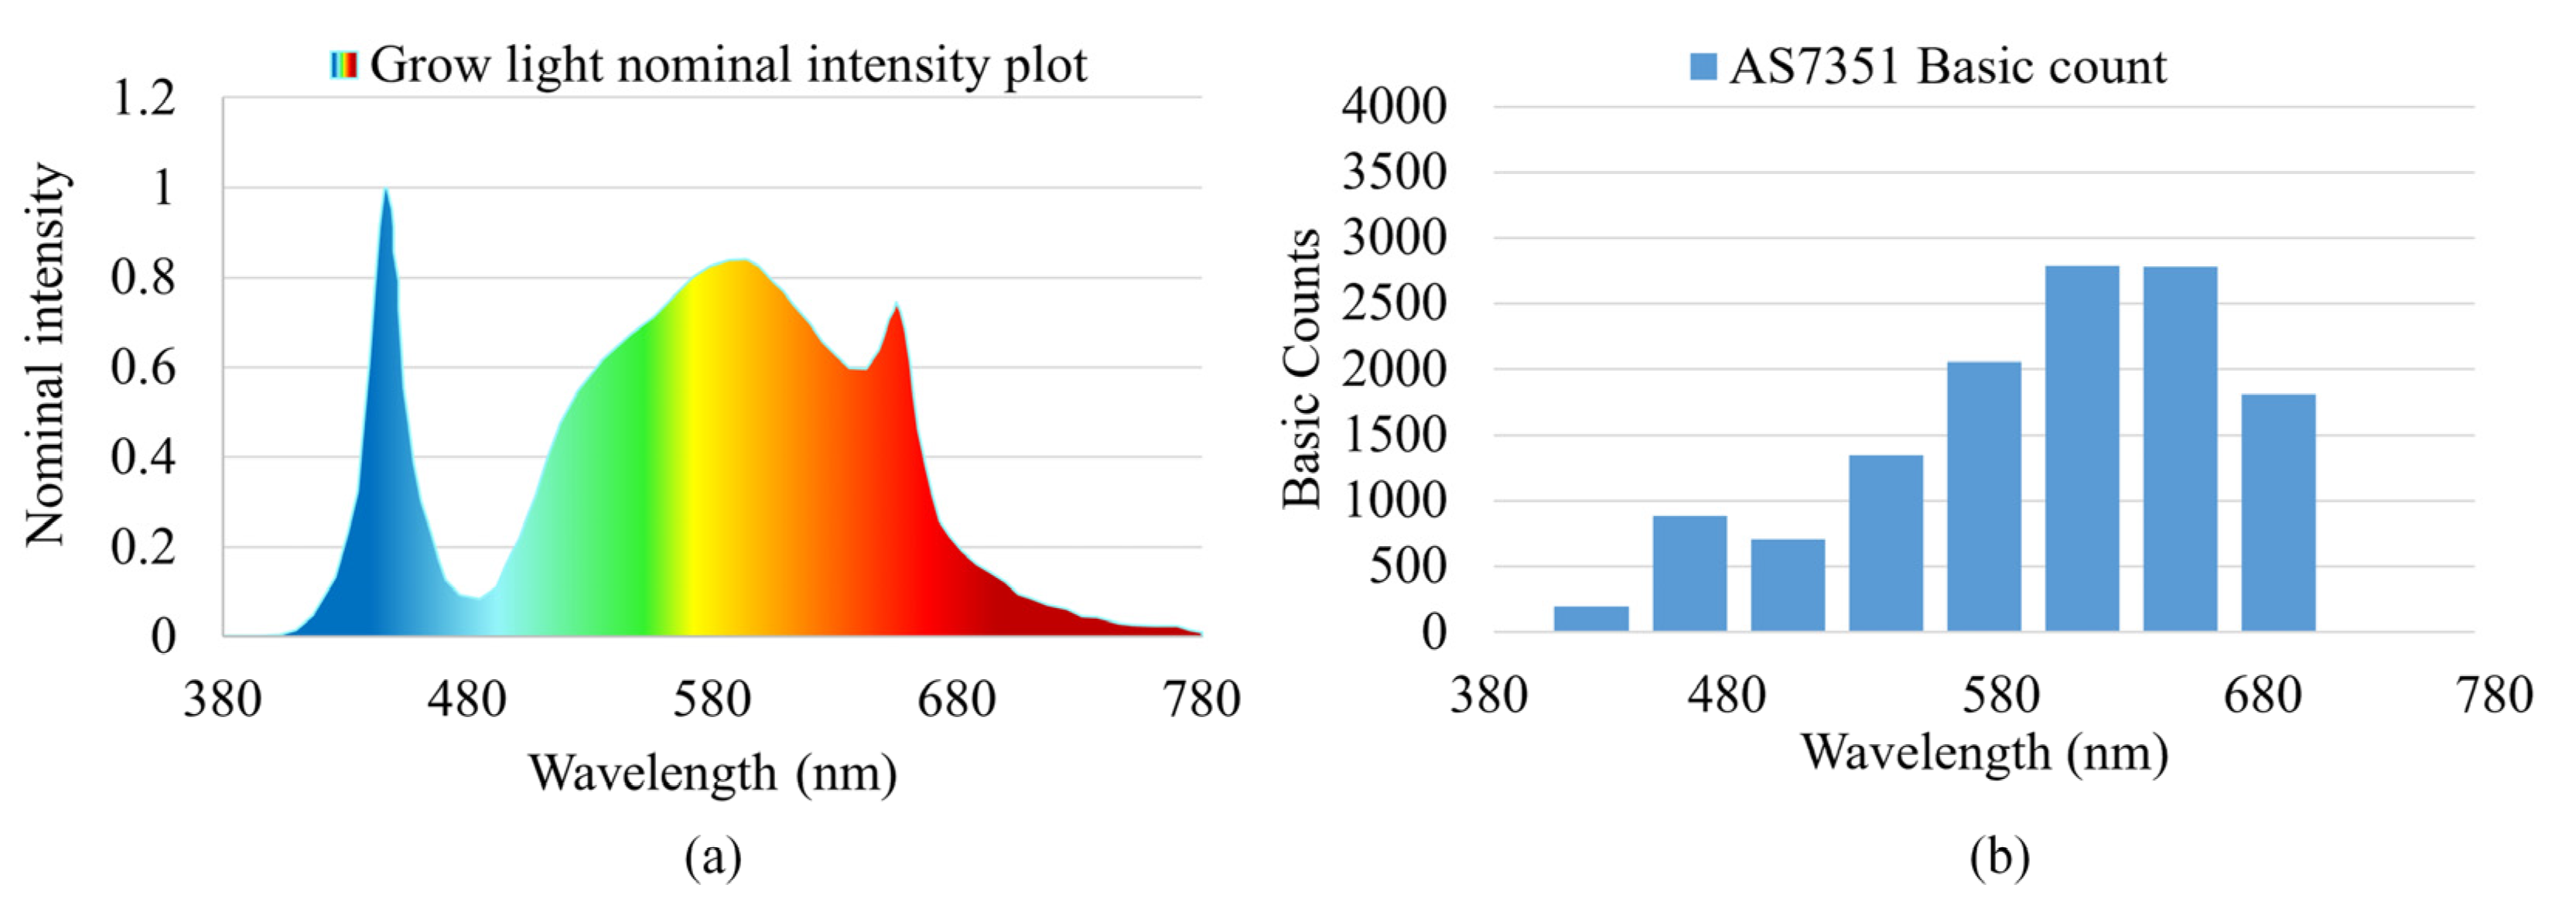
Figure 4.
Electrical design of the PAR sensor (a) ESP32 data logger, (b) AS7341 diagram.
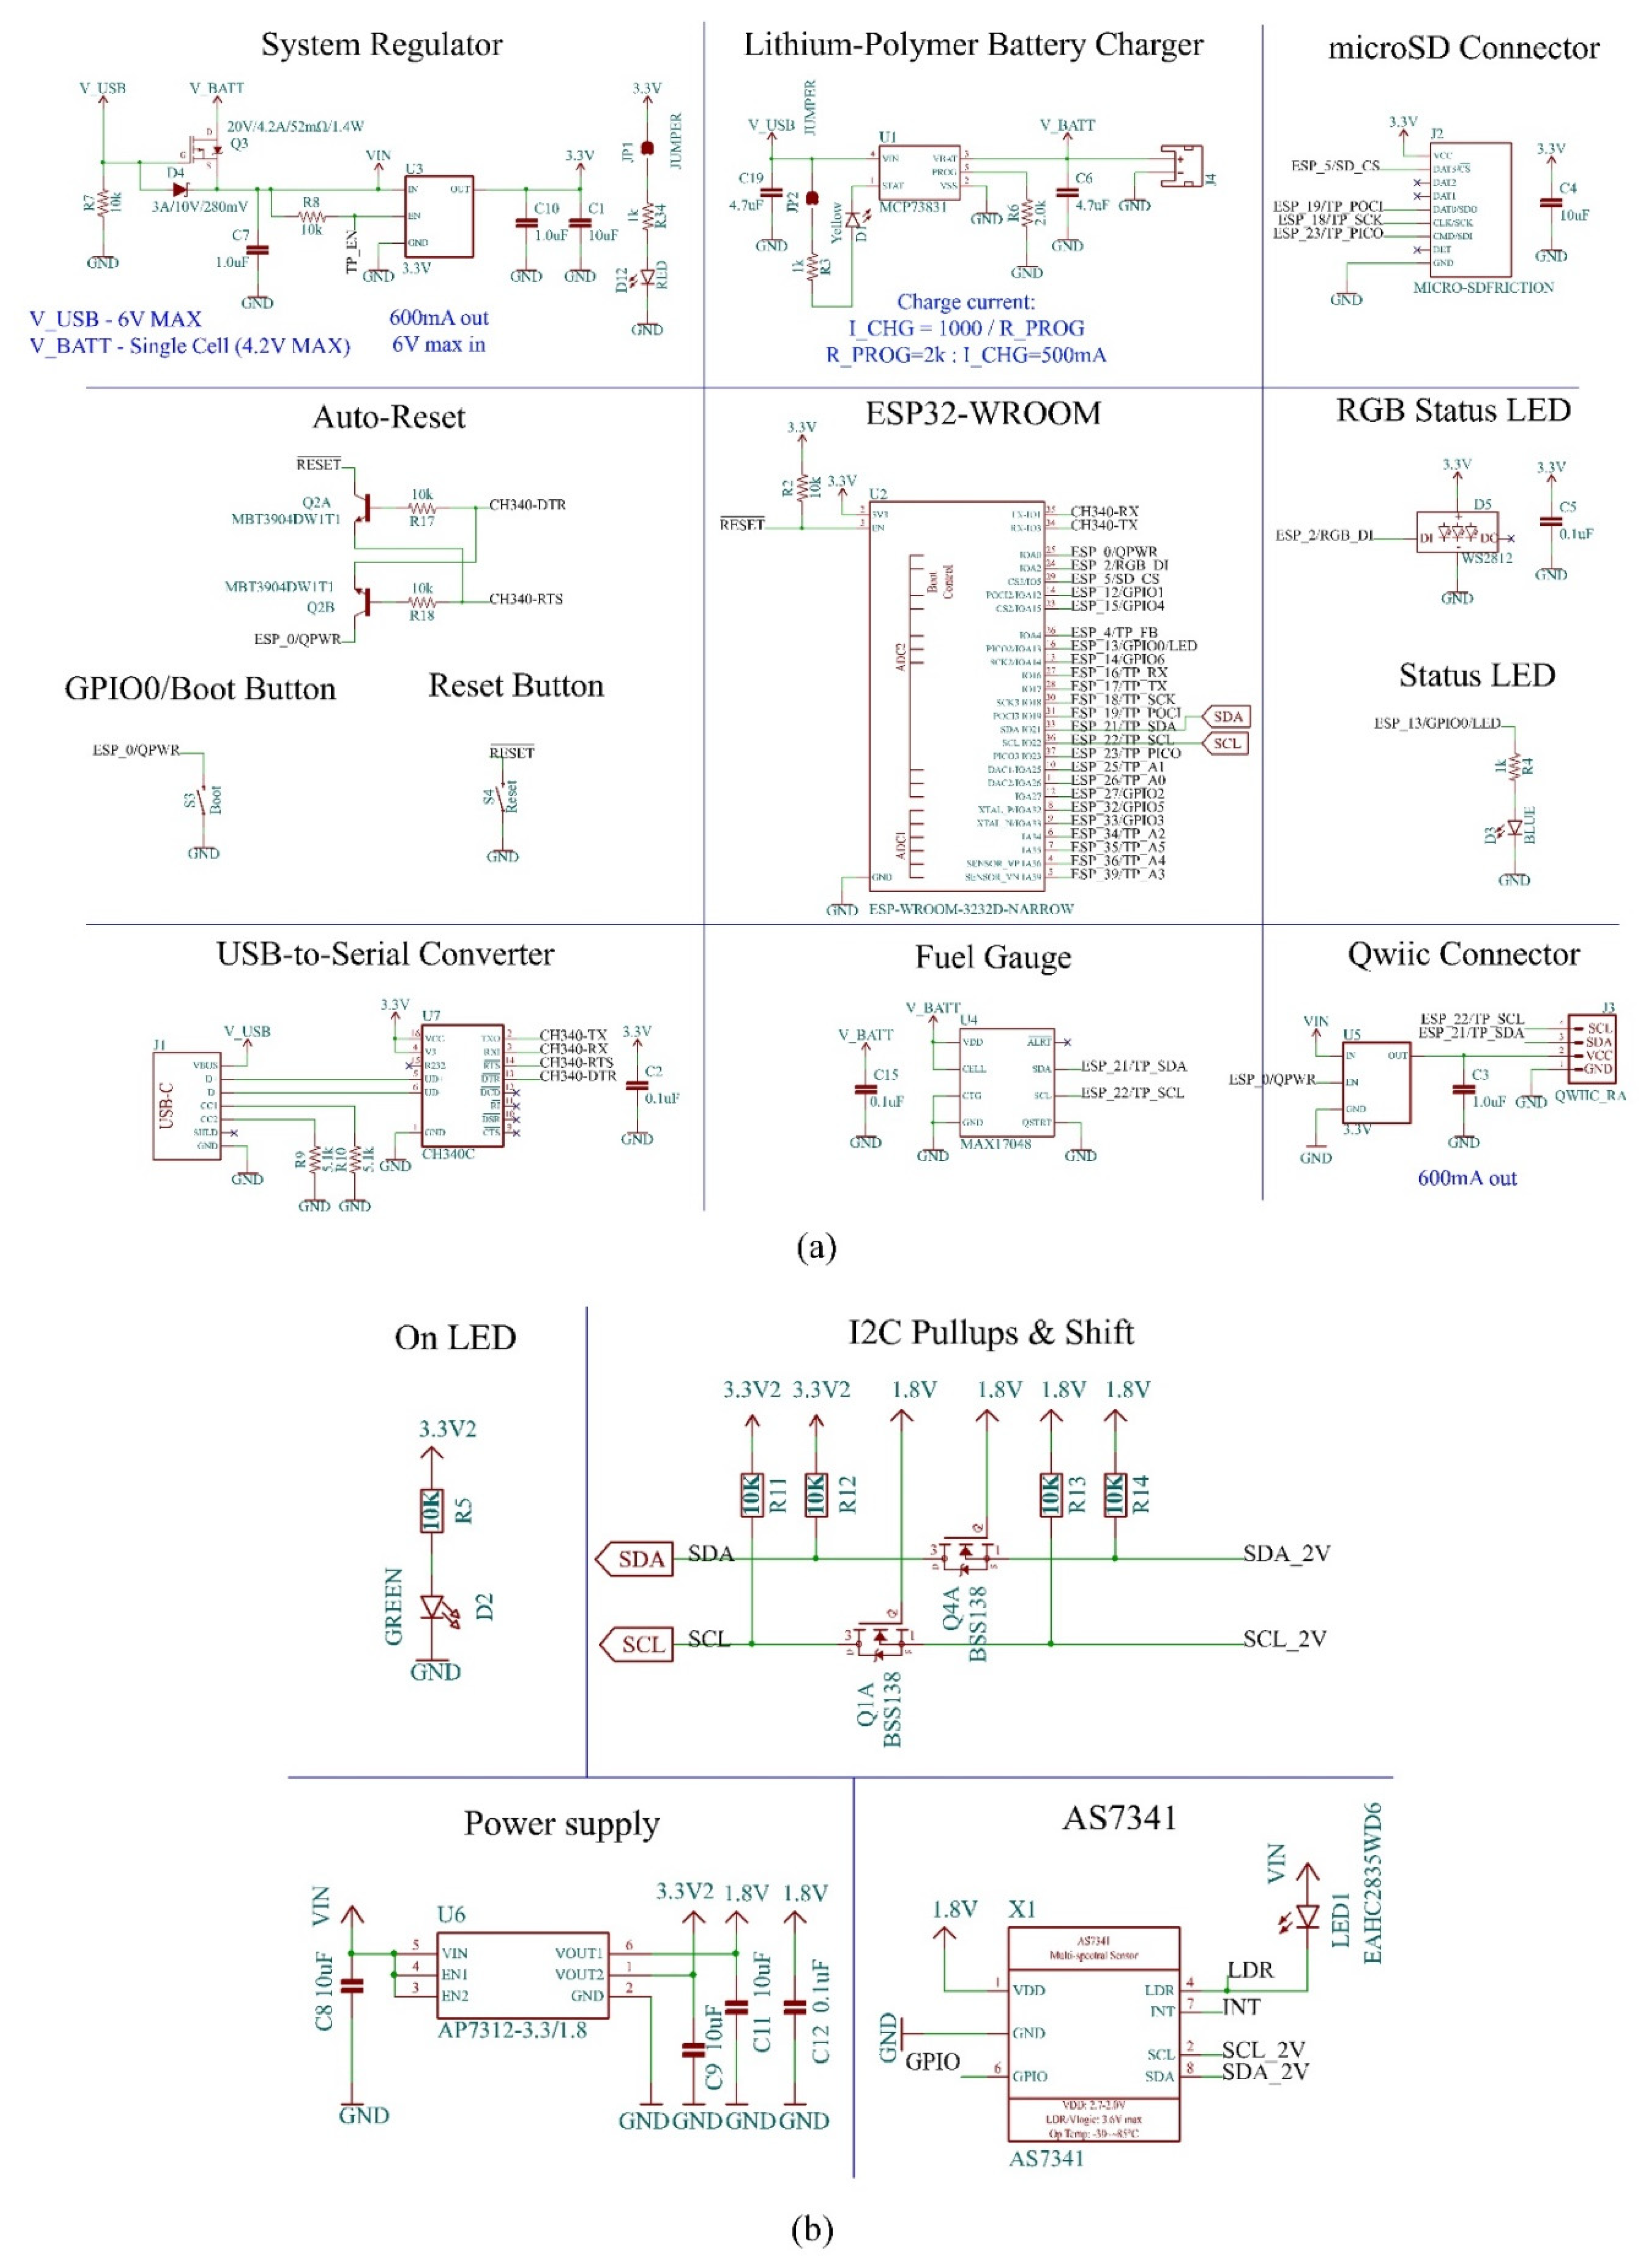
Figure 5.
(a-d) PCB layout and 3D visualization of the PCB, (e) Encloser design and assembly and (f) Assembled 3D model of the sensor.
Figure 5.
(a-d) PCB layout and 3D visualization of the PCB, (e) Encloser design and assembly and (f) Assembled 3D model of the sensor.
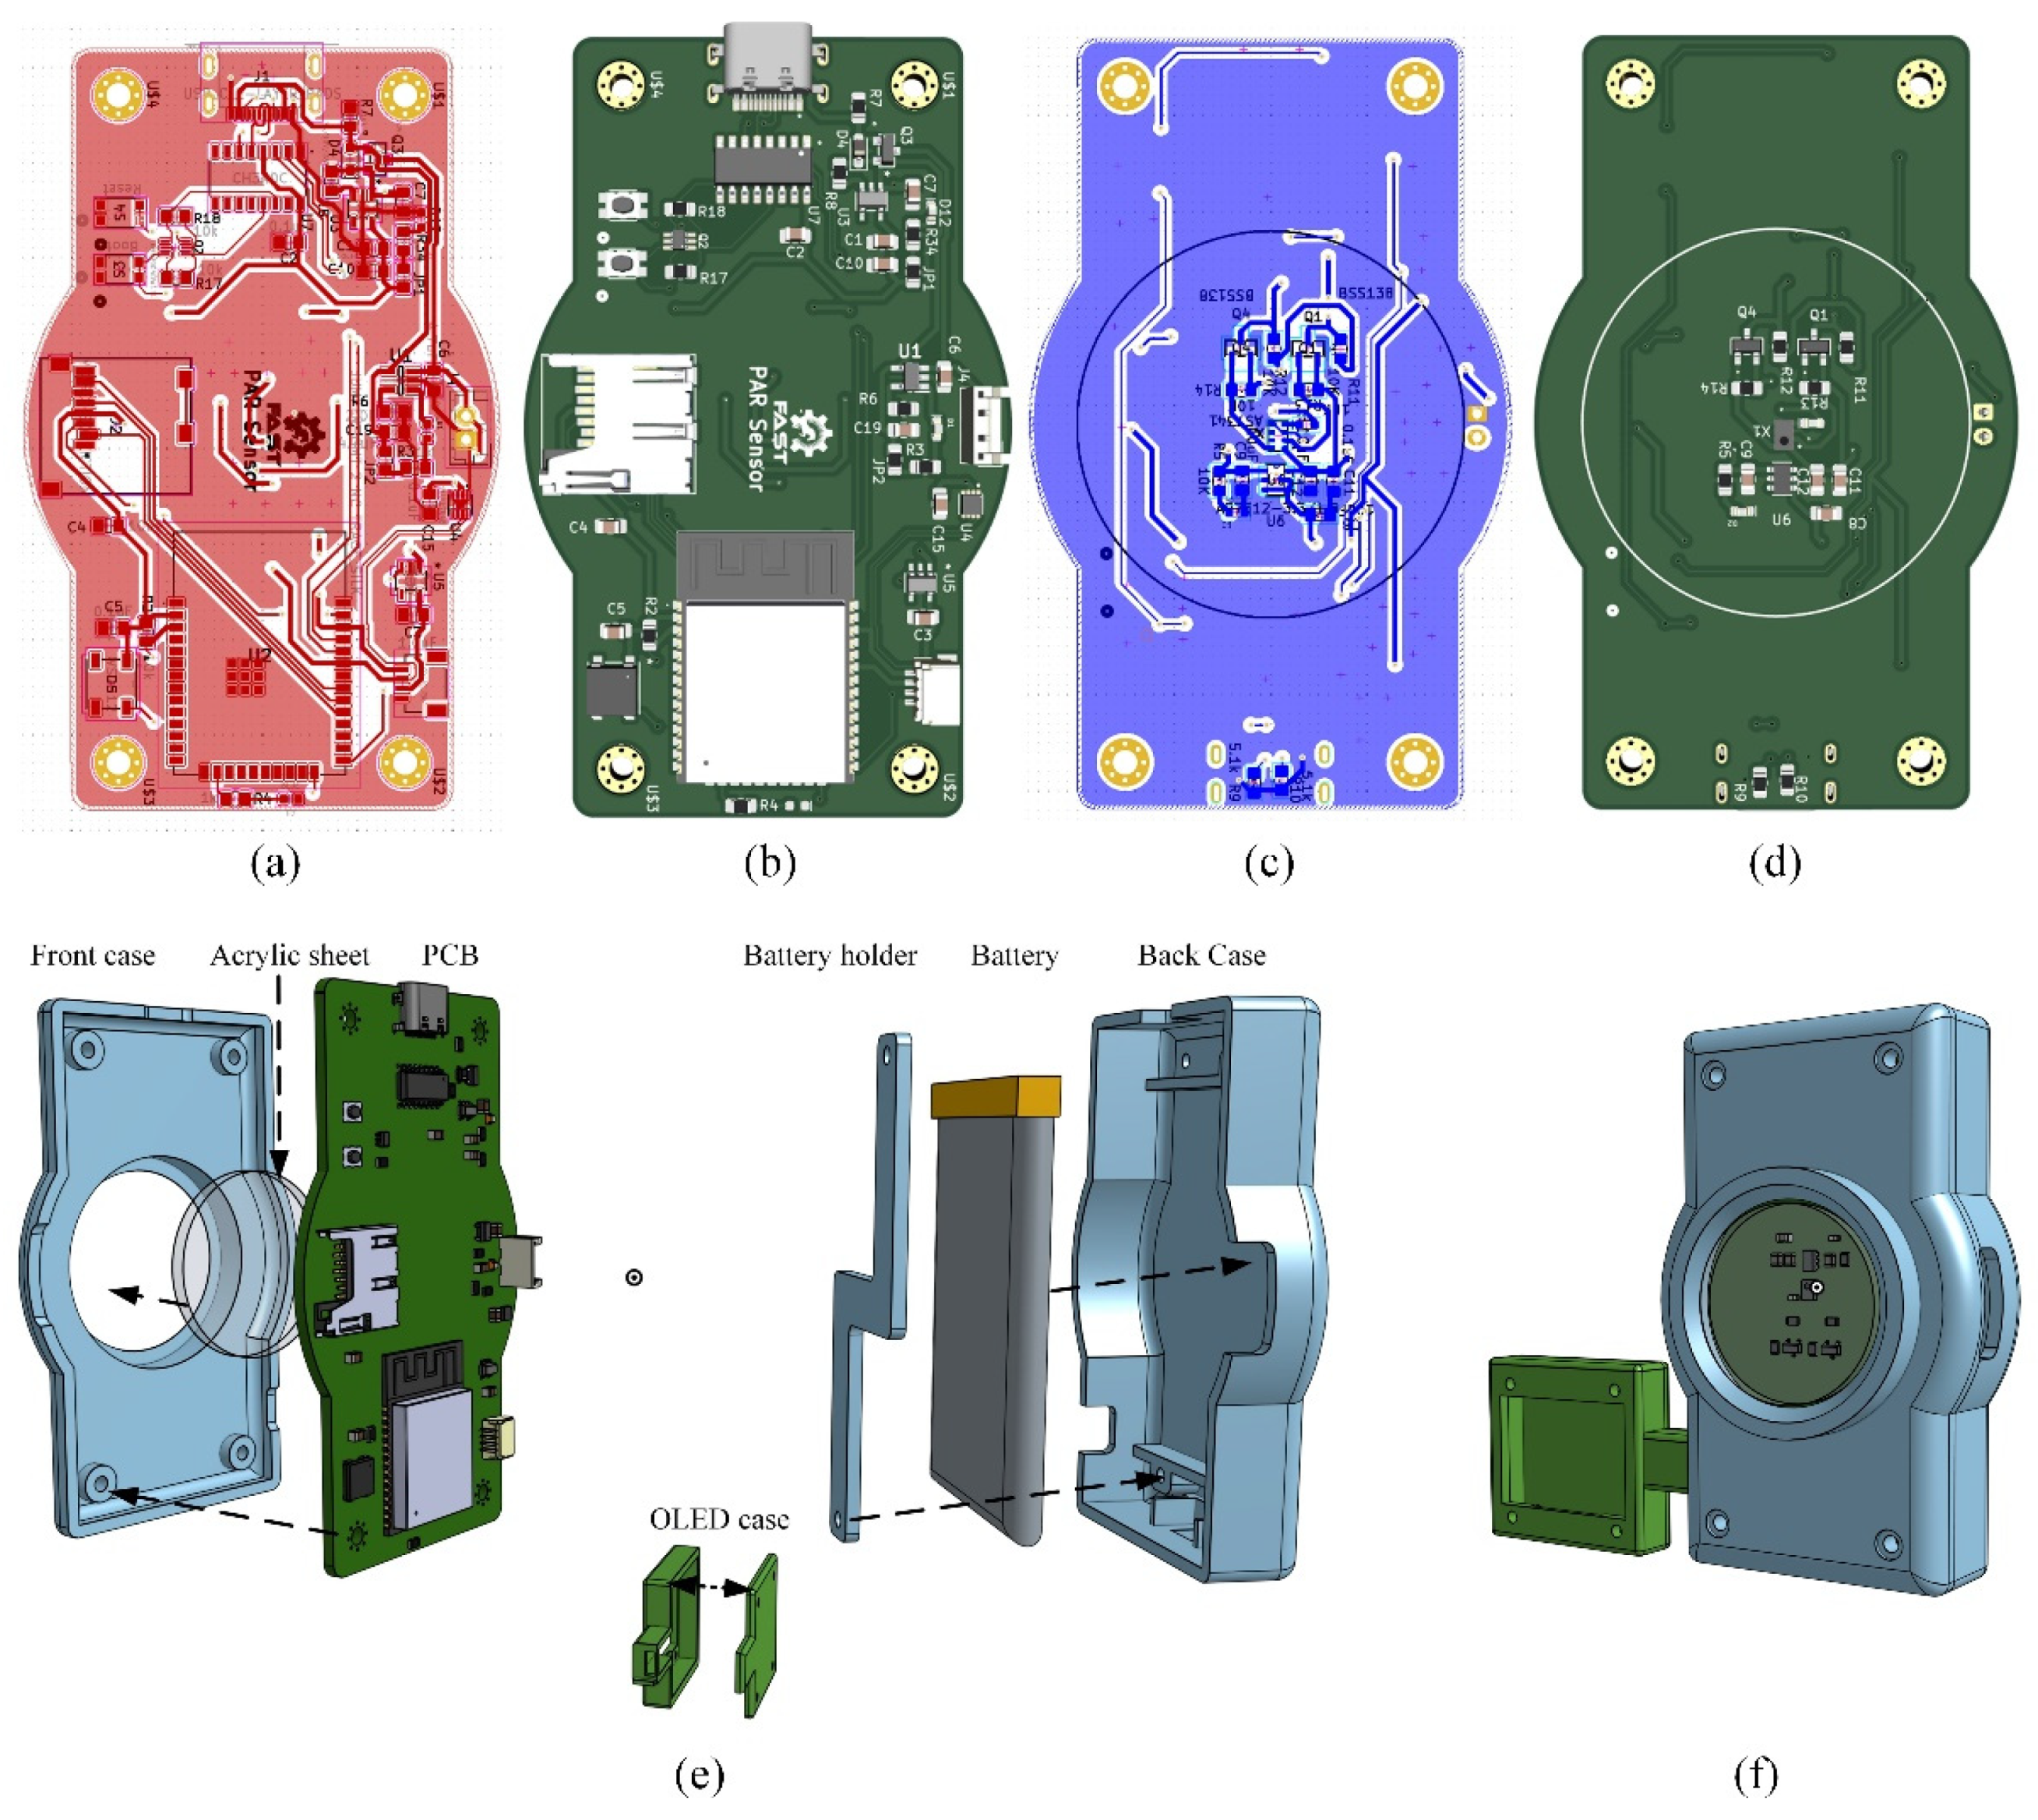
Figure 6.
Hardware assembly and calibration, (a) Interior hardware, (b) Assembled sensor with display and (c) Sensor overview.
Figure 6.
Hardware assembly and calibration, (a) Interior hardware, (b) Assembled sensor with display and (c) Sensor overview.

Figure 7.
Calibration process and data collection (a) Calibration setup, (b) Calibration under grow light, (c) Deployment in agrotunnel, (d) Deployment in agrivoltaics, (e) Deployment in greenhouse and (f) Web dashboard.
Figure 7.
Calibration process and data collection (a) Calibration setup, (b) Calibration under grow light, (c) Deployment in agrotunnel, (d) Deployment in agrivoltaics, (e) Deployment in greenhouse and (f) Web dashboard.
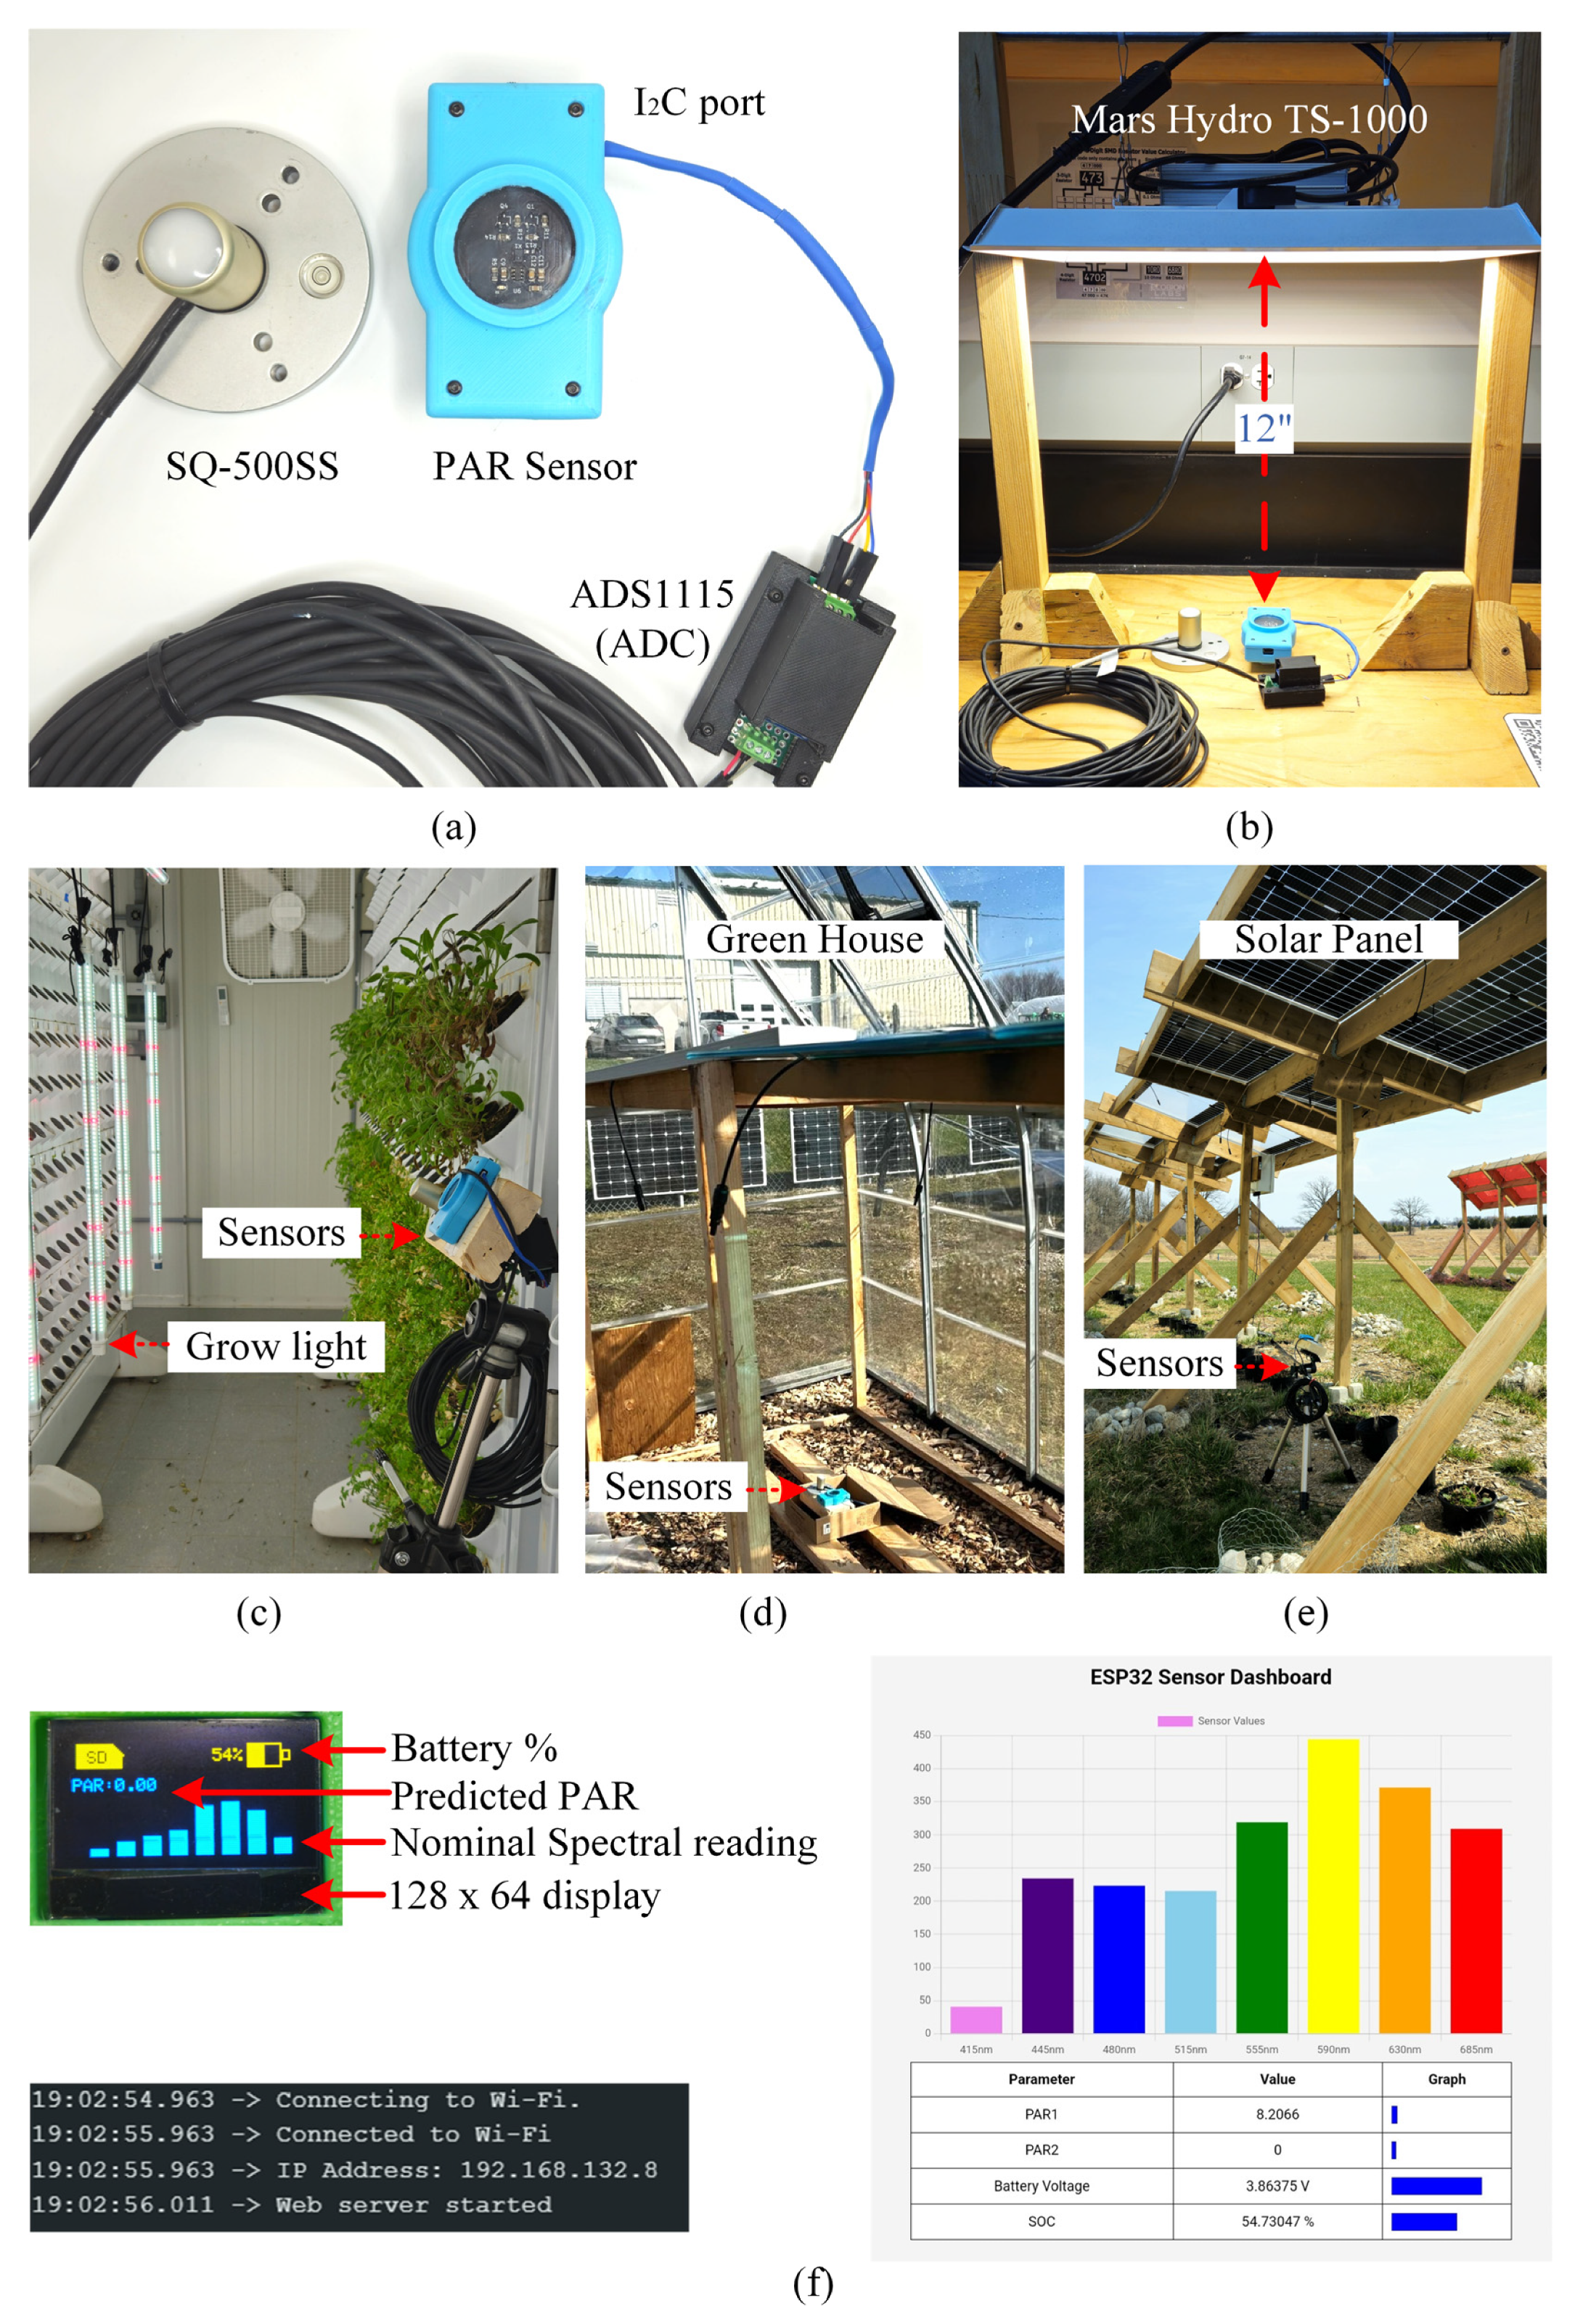
Figure 8.
Validation results of the calibrated sensor under grow light and agrotunnel conditions: (a) Spectral reading range measured by the AS7341 under grow light, (b) Comparison of predicted PAR values and actual PAR readings under grow light, (c) Correlation and mean error analysis between predicted and actual PAR values under grow light, (d) Recreated figure of spectral distribution of the Better grow light (360A) used in the agrotunnel, (e) Comparison of predicted and actual PAR values in the agrotunnel, (f) Spectral reading range measured by the AS7341 in the agrotunnel, and (g) Correlation and mean error analysis between predicted and actual PAR values in the agrotunnel.
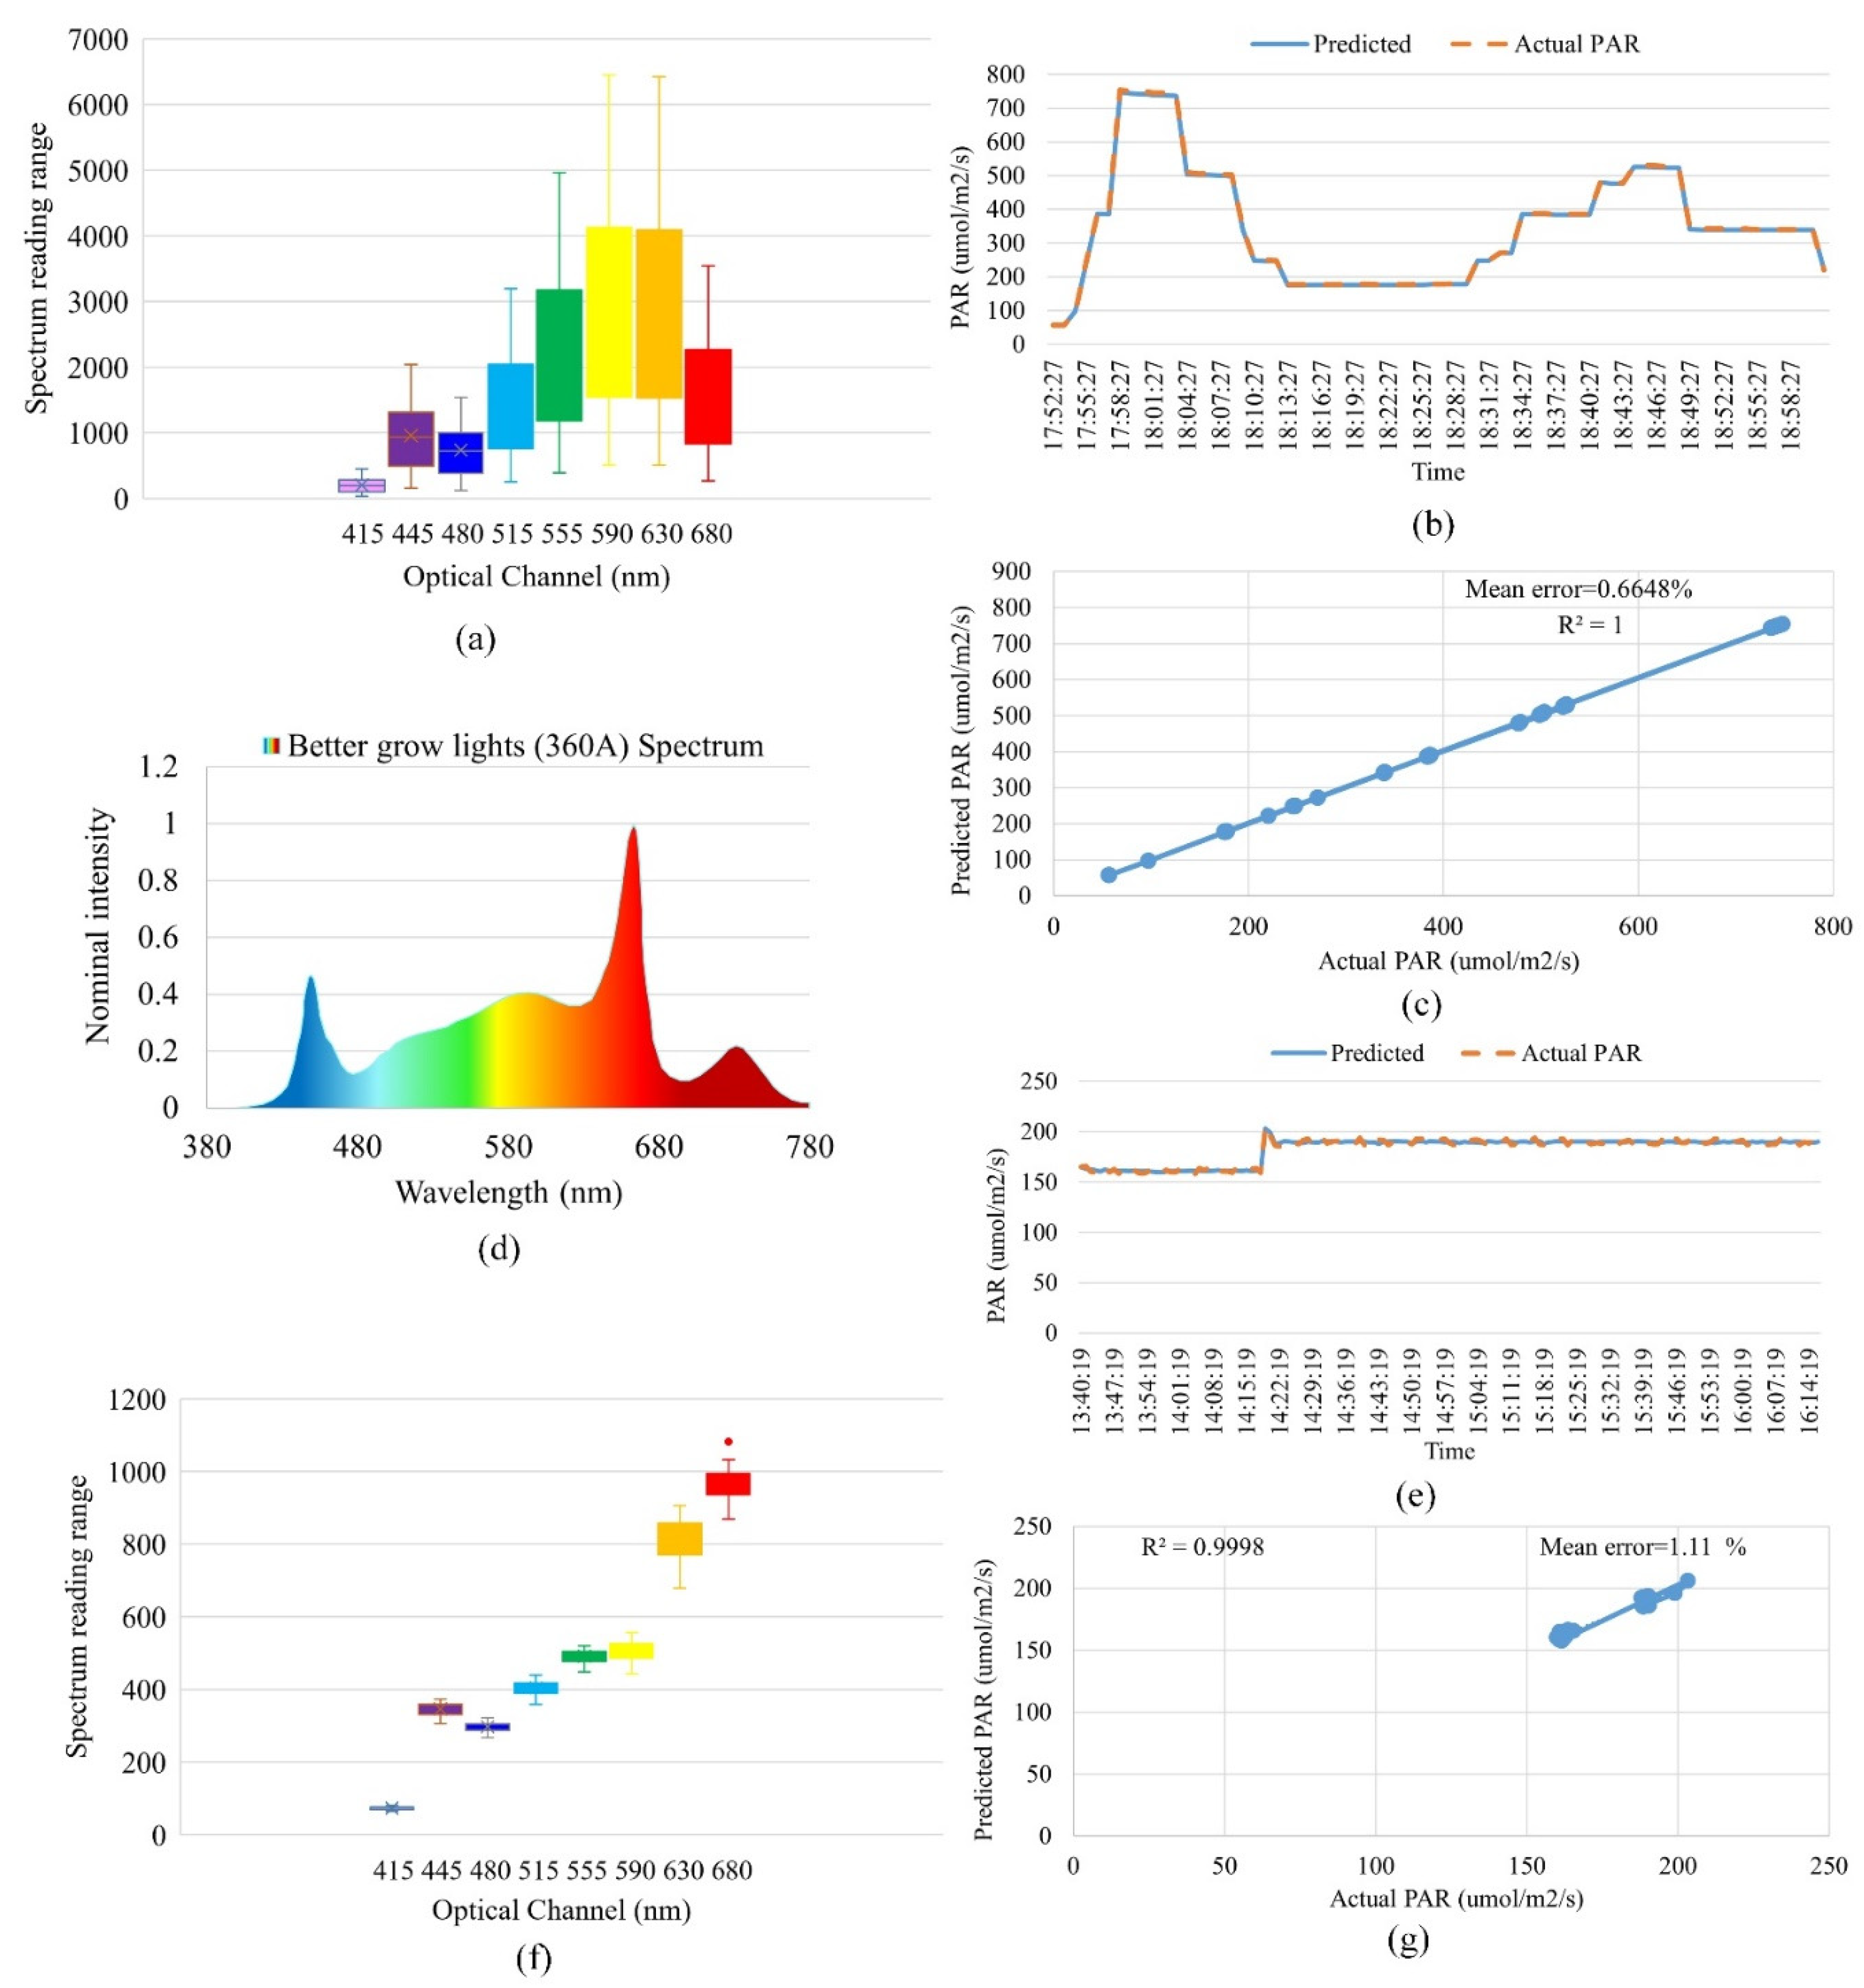
Figure 9.
Validation results of the calibrated sensor in green house and agrivoltaics site: (a) Spectral reading range measured by the AS7341 in green house, (b) Comparison of predicted PAR values and actual PAR readings in green house, (c) Correlation and mean error analysis between predicted and actual PAR values in green house, (d) Spectral reading range measured by the AS7341 in agrivoltaics site, (e) Comparison of predicted and actual PAR values in agrivoltaics site, and (f) Correlation and mean error analysis between predicted and actual PAR values in agrivoltaics site.
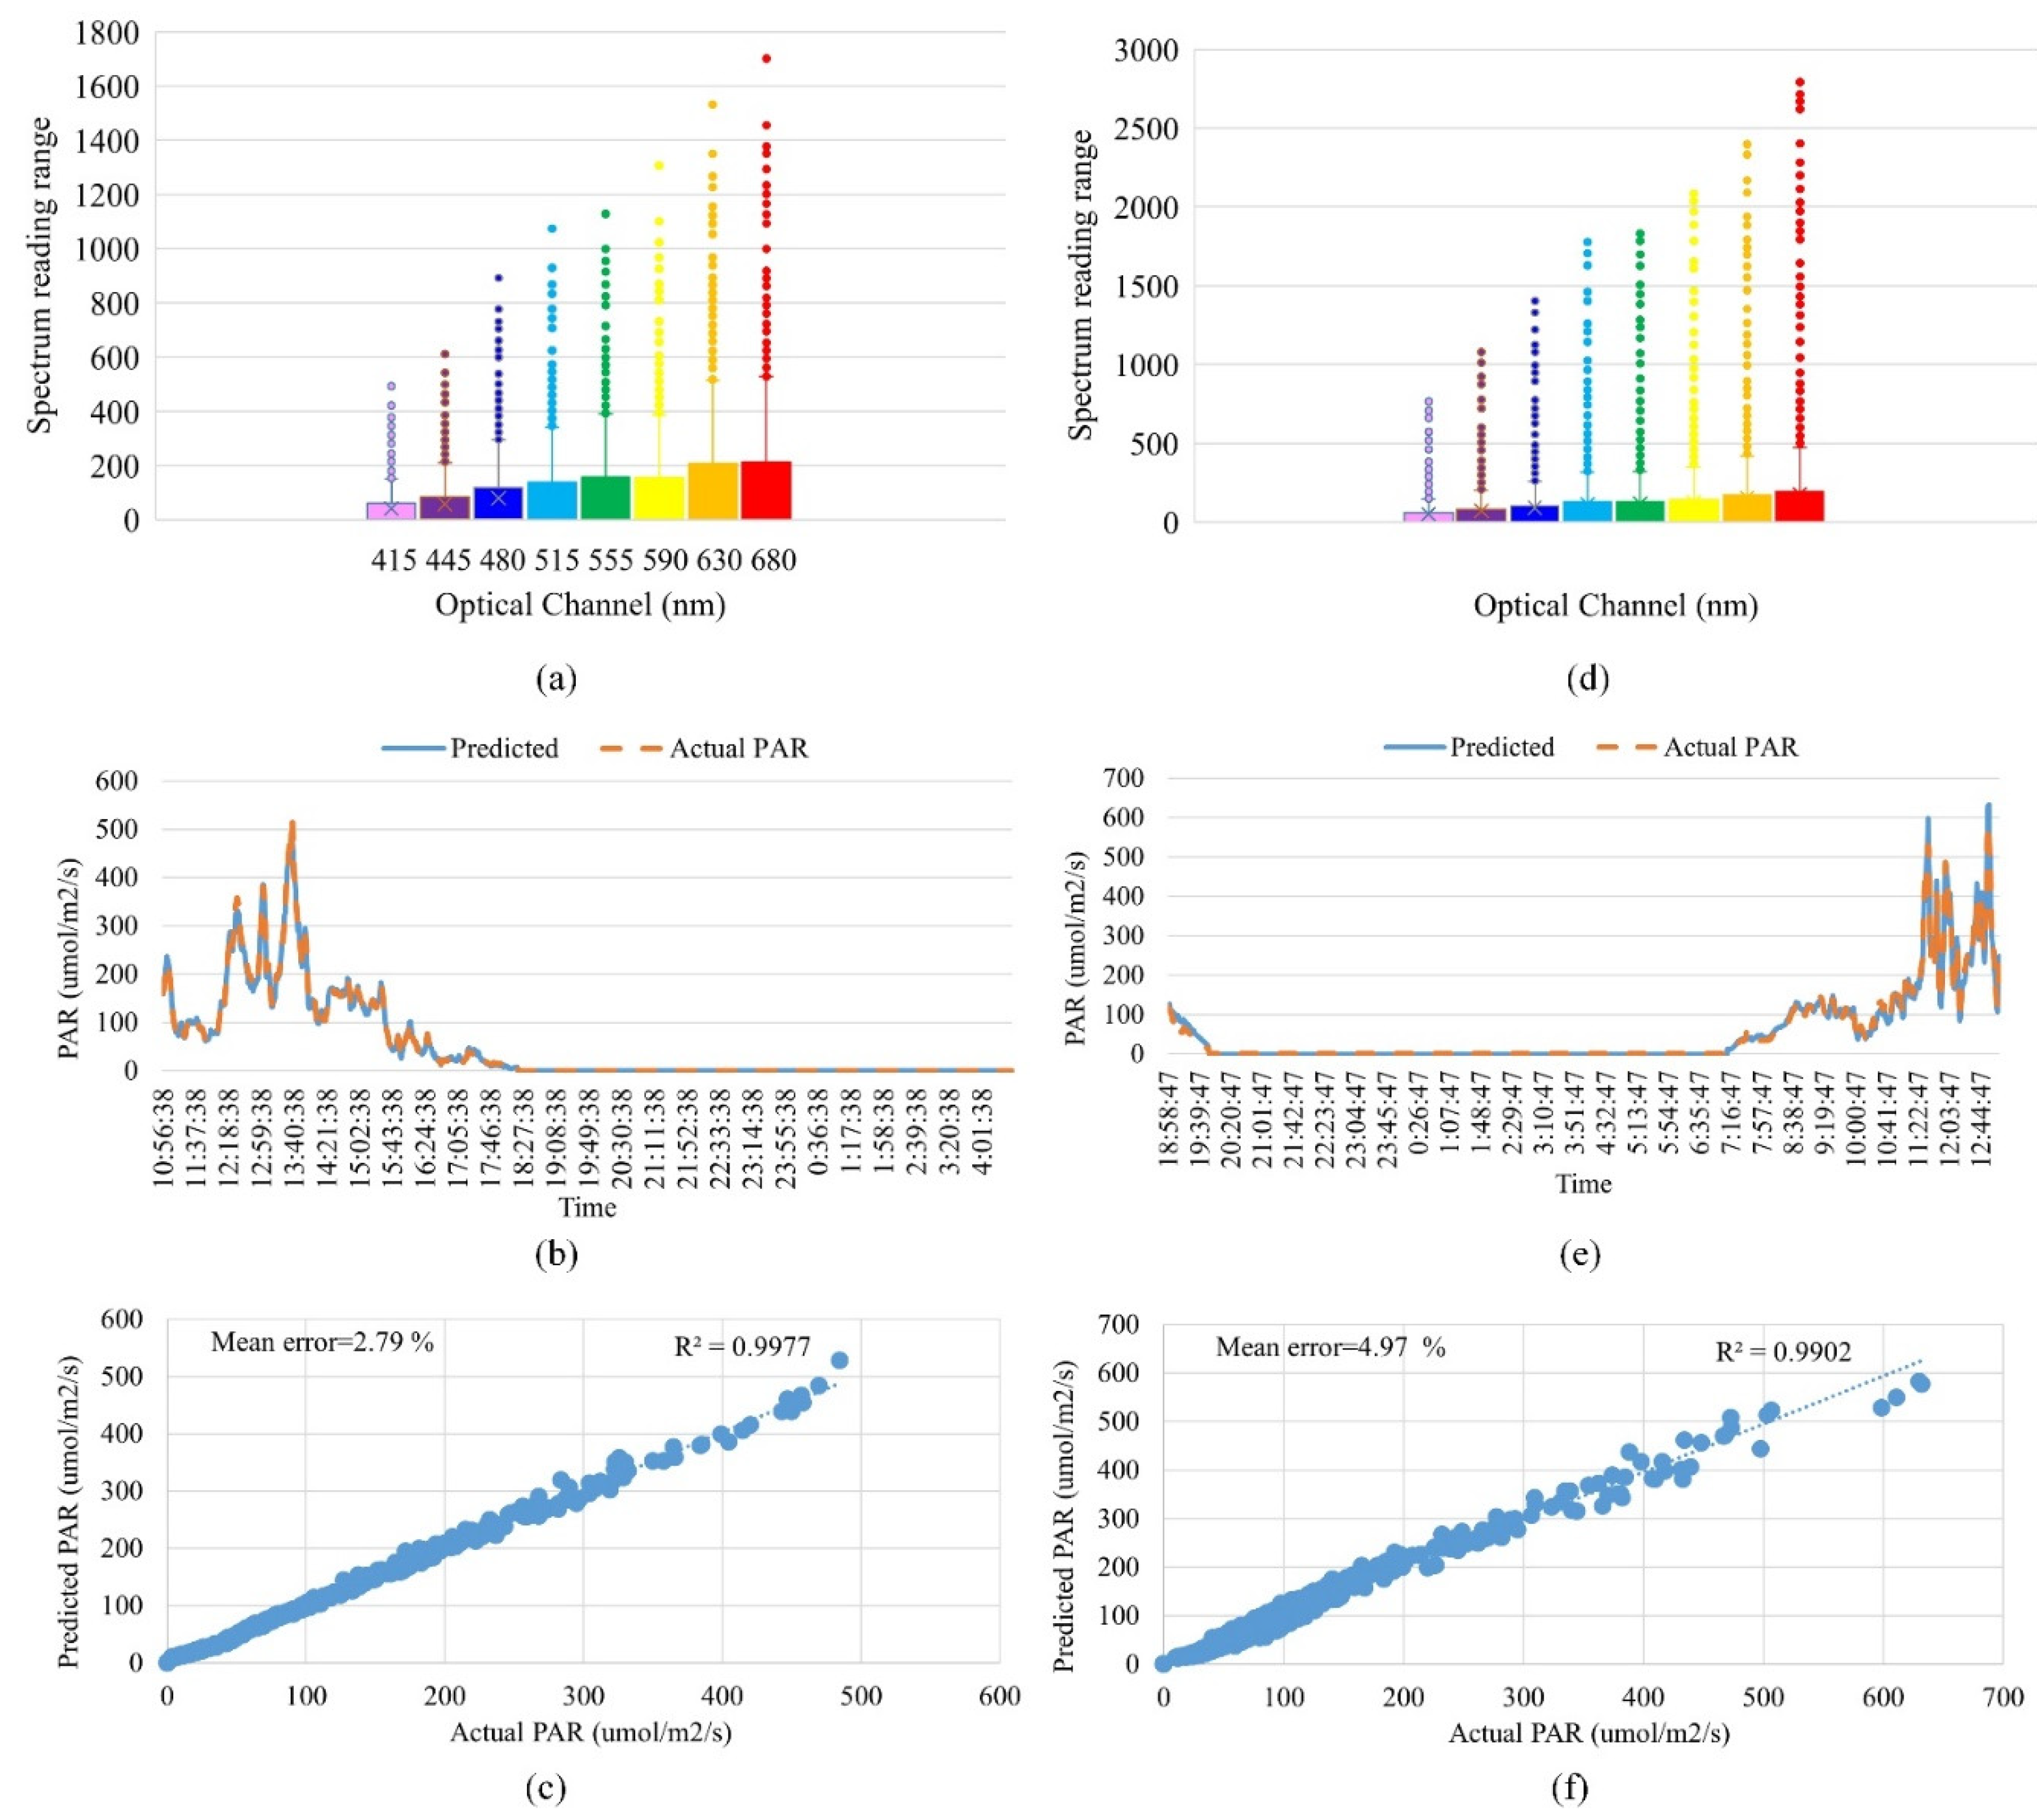
Figure 10.
Battery backup (a) Complete charge cycle (1300Ah, 4.2V Li-ion battery), (b) Complete discharge cycle of battery with Wi-Fi dashboard on and (c) Complete discharge cycle without Wi-Fi dashboard.
Figure 10.
Battery backup (a) Complete charge cycle (1300Ah, 4.2V Li-ion battery), (b) Complete discharge cycle of battery with Wi-Fi dashboard on and (c) Complete discharge cycle without Wi-Fi dashboard.
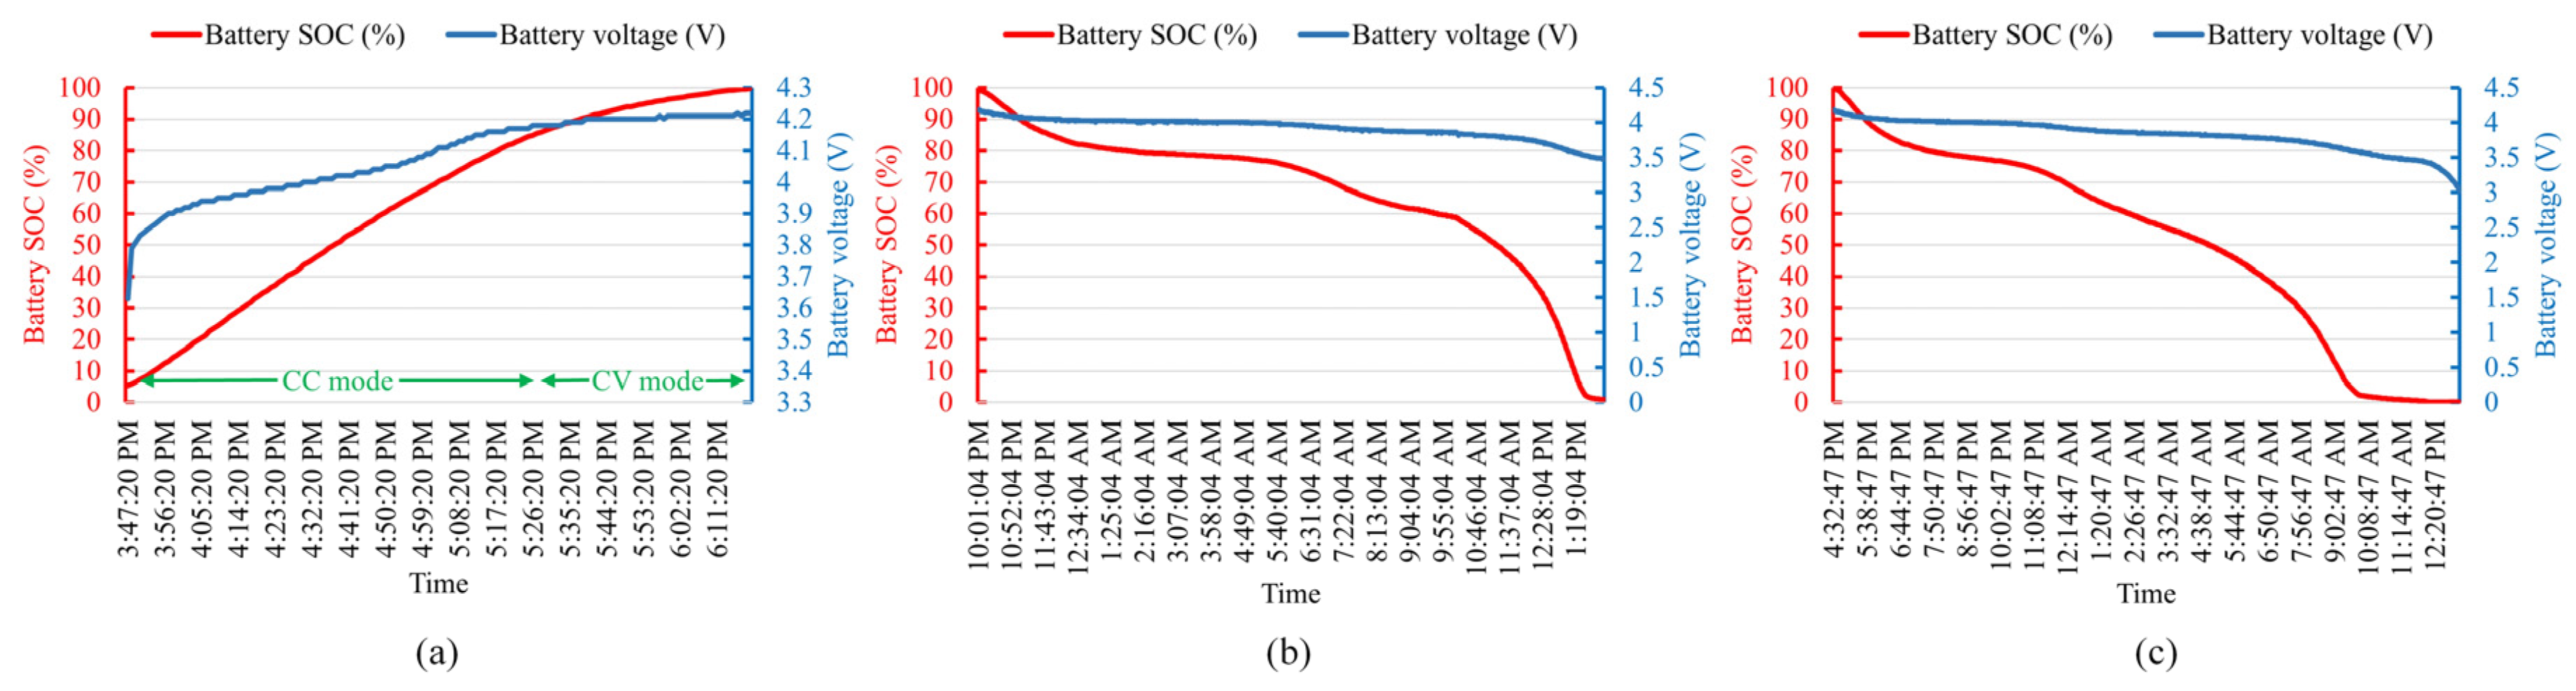
Table 1.
A cost comparison between some commercial PAR sensors and their features and level of accuracy.
Table 1.
A cost comparison between some commercial PAR sensors and their features and level of accuracy.
| Manufacturer | Model | Cost (in CAD) | Spectral range | PAR rangeµmol mˉ² sˉ¹ | Sensitivity | Calibration uncertainty | Reference | |
|---|---|---|---|---|---|---|---|---|
| Only sensor | Including monitoring device | |||||||
| Apogee | MQ-500 | 663 | 900 | 389 to 692 nm | 0 to 4000 | 0.01 mV per μmol s-1 m-2 | ±5% | [17] |
| MQ-510 | - | 917 | 389 to 692 nm | 0 to 4000 | ±5% | [18] | ||
| SQ-520 | 769 | - | 389 to 692 nm | 0 to 4000 | ±5% | [19] | ||
| LI-COR | LI-190R | 673 | - | 400–700 | 0 to 10000 | 5μA to 10 μAper 1,000 μmol/s/m2 | ±5% | [20] |
| Seeed studio | S-PAR-02 | 336 | - | 400–700 | 0-2500 | 1mV per μmol/s/m2 | N/A | [21] |
Table 2.
A comparison between recently developed multi-channel spectral sensor based PAR sensors in different literature, methods, complexity of their implementation and accuracy and cost.
Table 2.
A comparison between recently developed multi-channel spectral sensor based PAR sensors in different literature, methods, complexity of their implementation and accuracy and cost.
| Calculation Method | Measurement Environment | Sensor/ Device Used | Calibrated with | Microcontroller Used | Spectral Range |
Cost (if mentioned) |
Data Acquisition |
Performance | Ref | |
| Multilinear regression | Indoor smart hydroponic system | AS7265x | Apogee SQ-520 Quantum Sensor | Arduino UNO, Raspberry Pi | 410–940 nm | Not mentioned | Data logging InfluxDB server and Raspberry Pi | Correlation factor R2=88.7% for ambient light and 99.8% under LED. | [32] | |
| Multiple linear regression | Outdoor PAR measurement | AS-7341 | LI-190 with Li-250A light | LoRa-WAN | 360 nm to 760 nm | Not mentioned | Wireless | R2 of 0.991 obtained. | [33] | |
| Multi-linearregression | Greenhouse & field monitoring | AS-7341 | SS-110 spectroradiometer | Raspberry Pi 3 B+ | 400–700 nm | Not mentioned | Google cloud storage | PPFD is tracked with 0.3% error. | [30] | |
| Machine learning method (Decision tree and Random Forest models) |
Greenhouse & field monitoring | AS-7341 | SS-110 spectroradiometer | Raspberry Pi 3 B+ | 400–700 nm | Not mentioned | Google cloud storage | Mean absolute percentage errors (MAPEs) of 0.01%–0.88% |
[31] | |
| Vector quantization | Indoor controlled lighting system and outdoor | AS7265x, | Black comet spectroradiometer | Windows 10 laptop with an i7 processor | 410–940 nm | Not mentioned | Serial data transmission to laptop | A 12.51% average error was obtained. |
[29] | |
| Linear regression | Indoor greenhouse setup | AS7341 | Solar Electric Quantum Meter #3415FSE, | ESP32 S2 TFT Feather | 400–700 nm | $51 USD | N/A (LCD display) | [34] |
Table 6.
Multiple linear regression analysis results and calibrated co-efficient.
| Regression statistics | Multiple linear regression calibration co-efficient | |||||
|---|---|---|---|---|---|---|
| Coefficients | Standard Error | t Stat | P-value | |||
| Multiple R | 0.999891 | Intercept (bo) | -1.83008 | 0.898409 | -2.03702 | 0.042778 |
| R Square (R2) | 0.999782 | 415nm (b1) | -0.10893 | 0.185726 | -0.58649 | 0.558117 |
| Adjusted R Square | 0.999774 | 445nm (b2) | -0.19323 | 0.152327 | -1.26855 | 0.205867 |
| Standard Error | 1.97794 | 480nm (b3) | 0.149401 | 0.099145 | 1.506898 | 0.133191 |
| Observations | 242 | 515nm (b4) | 0.234282 | 0.11797 | 1.985939 | 0.048212 |
| 555nm (b5) | 0.019283 | 0.084076 | 0.229355 | 0.818794 | ||
| 590nm (b6) | -0.1623 | 0.058166 | -2.79027 | 0.005702 | ||
| 630nm (b7) | 0.133297 | 0.033919 | 3.92987 | 0.000112 | ||
| 690nm (b8) | 0.087622 | 0.029122 | 3.00877 | 0.002911 | ||
Table 7.
Table of correction factors and regression factors and Linear regression analysis for outdoor lighting.
Table 7.
Table of correction factors and regression factors and Linear regression analysis for outdoor lighting.
| Regression statistics | Multiple linear regression calibration co-efficient | |||||
|---|---|---|---|---|---|---|
| Coefficients | Standard Error | t Stat | P-value | |||
| Multiple R | 0.99659 | Intercept (bo) | -1.9196374 | 0.36951 | -5.19507 | 0.00000 |
| R Square (R2) | 0.99319 | 415nm (b1) | 4.7280568 | 0.08699 | 54.35164 | 0.00000 |
| Adjusted R Square | 0.99315 | 445nm (b2) | -0.6033910 | 0.13967 | -4.32009 | 0.00002 |
| Standard Error | 8.88614 | 480nm (b3) | -1.5187001 | 0.10148 | -14.96531 | 0.00000 |
| Observations | 1390 | 515nm (b4) | 0.4630669 | 0.13534 | 3.42156 | 0.00064 |
| 555nm (b5) | 0.6610031 | 0.09463 | 6.98546 | 0.00000 | ||
| 590nm (b6) | -1.6748574 | 0.07769 | -21.55799 | 0.00000 | ||
| 630nm (b7) | 0.7903176 | 0.05275 | 14.98284 | 0.00000 | ||
| 690nm (b8) | -0.2266746 | 0.04864 | -4.65997 | 0.00000 | ||
Table 8.
A comparison can be drawn between existing literature and this research.
Disclaimer/Publisher’s Note: The statements, opinions and data contained in all publications are solely those of the individual author(s) and contributor(s) and not of MDPI and/or the editor(s). MDPI and/or the editor(s) disclaim responsibility for any injury to people or property resulting from any ideas, methods, instructions or products referred to in the content. |
© 2025 by the authors. Licensee MDPI, Basel, Switzerland. This article is an open access article distributed under the terms and conditions of the Creative Commons Attribution (CC BY) license (http://creativecommons.org/licenses/by/4.0/).
Copyright: This open access article is published under a Creative Commons CC BY 4.0 license, which permit the free download, distribution, and reuse, provided that the author and preprint are cited in any reuse.


