
Submitted:
20 April 2025
Posted:
21 April 2025
You are already at the latest version
Abstract
The environmental challenges of urbanization led to a growing interest in the analysis of biodiversity in cities. So far, the focus was on public green spaces, which are becoming increasingly scarce as governments lose control of urban growth. Therefore, there is growing interest in the as yet little known and documented contribution of private players to the urban biodiversity conservation. This study assesses the biodiversity of Concessions held by catholic Religious’ Groups (CRGs) in three cities (Bukavu, Kisangani and Lubumbashi) in the Democratic Republic of Congo (DRC). CRGs are targeted due to the predominance of catholicism in the DRC and its key role in the socio-economic development of the country. This plant structure of CRGs analysis was based on a systematic inventory of the flora present in a total random sample of 70 CRGs. The results show that the average CRG area in Lubumbashi (1.1 ha) is smaller than those in Bukavu (3.7 ha) and Kisangani (5.2 ha). However, there is no link between CRG area and species richness. There is quasi-heterogeneity within and between cities in the CRGs plant composition, with a total of 220 species identified corresponding to 76 families and 185 genera. Plant diversity is dominated by phanerophytes and exotic species. This study highlights the importance of taking private players into account in the urban biodiversity conservation.
Keywords:
urban biodiversity
; biodiversity conservation
; gardening
; catholic religious groups
; private green space
; Democratic Republic of Congo
1. Introduction
Over the centuries, human societies have significantly influenced the dynamics of land occupation/use through the exploitation of natural resources and the occupation of space, a phenomenon commonly referred to as the anthropization of the landscape[1]. This phenomenon typically leads to two major processes: on one hand, the conversion of natural areas into agricultural land, and on the other hand, a direct conversion into urban areas, resulting in an additional phenomenon known as "urbanization."[1,2]
On a global scale, the process of urbanization is considered a major issue[3]. According to the United Nations, by 2050, more than two-thirds of the world’s population will be living in cities[4]. The continuous growth of human populations has fostered urban expansion that is even more significant than population growth in certain regions of the world [5]. The degree of urbanization worldwide today is high, with the number and size of large cities being unprecedented[6]. It is estimated that one in two people now live in a cities, compared to just one in ten at the beginning of the 20th century [7]. The situation is such that while cities play a likely dominant role (as centres of production and consumption) in the global economy, urban growth in developing countries far exceeds the capacity of most cities to provide adequate services to their citizens [8]. Additionally, rural exodus and population explosions exacerbate urban and peri-urban sprawl, with consequences for socio-ecosystem functioning [9]. These consequences include deforestation, the scarcity of green and open spaces in cities, loss of species, air and water pollution, the development of heat islands, erosion, and flooding [10,11,12]. The impacts of urbanization pressure on ecosystems and biodiversity have profound and multidimensional effects on the well-being of urban and peri-urban residents, who still heavily depend on these services, especially in sub-Saharan Africa [13]. Beyond its contribution to the conservation of biogenetic resources, urban biodiversity is indeed recognized for providing multiple essential services for human well-being. These include regulating microclimates, providing shade and recreational spaces, food, firewood, medicinal products, and contributions to water management, flooding, and erosion control [14,15,16].
For these reasons, increased attention is being given to the conservation of urban biodiversity, with the development of various initiatives to promote urban forestry and/or horticulture. These initiatives involve diverse public and private stakeholders at various levels and scales (individual, collective, local, national, regional, and/or international). For example, at the international and regional levels, the New Urban Agenda (NUA) was developed and adopted during the United Nations Conference on Housing and Sustainable Urban Development (Habitat III) in 2016, along with the African Strategy for Urban Forestry adopted in 2018 [17].
In this context, several studies are being conducted to better understand the biodiversity of urban green spaces [18,19,20,21,22]. However, while many studies focus on public green spaces [23,24,25,26,27], few address those managed by private stakeholders (individual private gardens, businesses, etc.) [28,29]. Yet, like public green spaces, private green spaces play an important role in urban areas and can host significant biodiversity that is still largely unknown[30]. Moreover, in the context of African cities where public authority or the state often loses control over urban growth, leading to the scarcity/spoliation of public green spaces, the contribution of private stakeholders to the development of green spaces in cities deserves attention. Private initiatives in this area indeed represent a promising avenue for the conservation of urban biodiversity and the promotion of eco-citizen awareness [31,32,33].
As is the case in several African countries, the situation of limited knowledge about urban biodiversity in public and especially private spaces is observed in the Democratic Republic of the Congo (DRC). Studies on urban ecology there are indeed recent[34,35]. Among private stakeholders are Catholic religious’ groups that have played and continue to play a crucial role in the socio-economic and even political development of the country [36,37,38]. These groups have acquired large concessions throughout the country, which they develop for various activities (schools, cultural centers, churches, etc.). For a better understanding of urban biodiversity in DRC cities, the biodiversity associated with the concessions managed by Catholic religious’ groups deserves particular attention due to their significance. Additionally, whether it concerns sacred forests in traditional religions [39] or the garden where Jesus prayed for the last time in Christianity, a close link between religious practices and vegetation is noted [40]. Furthermore, some authors highlight the greening of Christianity due to the commitment of churches to biodiversity conservation and the development of gardens or green spaces.
Moreover, according to the Central Office of Ecclesiastical Statistics of the Vatican, 49.6% of the Congolese population are Catholics [41]. This shows the majority presence of Catholic religious’ confessions compared to other confessions in the country, motivating the particular interest that this study has in these Catholic confessions. Additionally, beyond recognizing the disciplined application and maintenance of these confessions in managing their concessions, including green management, the floristic importance of the vegetation they host remains very little known and documented.
To contribute to a better understanding of the flora hosted by Catholic religious’ groups (CRGs) in DRC cities, this study focused on evaluating the biodiversity structure of CRGs in three major cities (Bukavu, Kisangani and Lubumbashi). These three cities were targeted due to the significant influence of Catholic groups in their history as well as in their socio-economic development and the opportunities for data mobilization in these cities [36]. The study in the three targeted cities revolves around the following hypotheses: plant diversity, in quantitative terms (number of species, families and genera) and qualitative terms (types of species, families, genera and life forms), is expected to be more similar among CRGs within the same city than between cities and would depend on the area of the CRGs. Indeed, green management is often greatly dictated by the availability of locally cultivated or planted vegetation, which in turn is dictated by the prevailing climate type and the dominant vegetation formation [42,43]. Furthermore, based on the potential effect of external species contributions, it is specifically expected that floristic diversity would be higher in Bukavu (a border city) compared to Lubumbashi (located 30 km from the border) and compared to Kisangani (an inland city), which would present the lowest diversity. Additionally, it is expected that the CRGs in each city would be characterized by the dominance of a few species, genera and families that would be found in the majority of CRGs within the same city. Indeed, in garden management, the influence of nearby examples on the choice of species is demonstrated [44,45]. The CRGs in the cities mainly consist of exotic species, but the city of Kisangani would have the most native species due to its relative isolation. It is indeed recognized that the flora of cities is often predominantly exotic [46]. Regardless of the city, the CRGs contain species classified as endangered on the International Union for Conservation of Nature (IUCN) Red List, but a majority of species remain unassessed.
2. Materials and Methods
2.1. Study Area
The study is conducted in three cities of the Democratic Republic of the Congo, namely Bukavu in the South Kivu province, Kisangani in the Tshopo province, and Lubumbashi in the Haut-Katanga province (Figure 1).
2.2. Data Collection
Not having a complete list of religious group concessions in the studied cities, a reasoned sample based on accessibility, abundance and the presence of vegetation was surveyed during the periods of full vegetation from 2023 to 2024, with prior authorization from site managers and with the assistance of a group of master’s level researchers. This involved 20 Concessions held by catholic Religious’ Groups (CRGs) in the city of Bukavu, 40 in Kisangani and 10 in Lubumbashi (Table 2).
The collected data consisted first of determining the extent of the concession, either in the field or via Google Earth, and second, systematically recording all plant species present by conducting a full-turn of each CRG. This process is justified by the fact that the vegetation of CRGs does not often occupy large continuous areas that would allow for the establishment of inventory plots [51,52].
The names of the inventoried species were subsequently verified while determining their family and origin status (exotic or native) in the available databases, notably the “African Plants Database,” “International Plant Names Index (IPNI),” and “The Plant List” websites. Similarly, the life forms of the identified species were established according to Raunkiaer’s definition [53], which takes into account the positioning of survival organs. Only the main categories were used, which provide some information on the stratification of vegetation and its persistence during unfavourable periods (such as the dry season): therophytes (Th), hemicryptophytes (Hem), geophytes (Ge), chamaephytes (Ch), epiphytes (Epi), and phanerophytes (Ph). Furthermore, the species conservation status was determined using the International Union for Conservation of Nature (IUCN) Red List database [54]. The observed statuses are extinct (EX), extinct in the wild (EW), critically endangered (CR), endangered (EN), vulnerable (VU), near threatened (NT), least concern (LC), data deficient (DD), and not applicable (NA).
2.3. Data Analysis
The collected data allowed for a quantitative analysis of the extent and plant composition, as well as the biological spectrum or distribution of life forms of the species, through the determination of average and total values of species richness, diversity, or the number of families and genera at the scale of the CRGs and the studied cities. Due to the non-normality of the data, the CRGs of the cities were compared through non-parametric analyses based on Dunn’s test for mean comparison, preceded by the Kruskal-Wallis test in Rstudio [55]. The same analysis was also applied to the area of the CRGs. The relationship between the latter and the aforementioned plant composition parameters was explored through Pearson correlation tests, also in Rstudio. Furthermore, the variations in the distribution of life forms of plant species in the CRGs between the studied cities were examined using Fisher’s exact test, which is advantageous for small samples [56]. The dominant families and genera in the different cities were determined by relative dominance, which consists of the ratio between the number of identified species of the corresponding taxon and the total species richness of the city.
The analysis of similarity between the CRGs of the same city (intra-city similarity) based on presence-absence data of the identified species, families and genera was conducted in Rstudio through Ascending Hierarchical Classification on Multiple Correspondence Analysis using the Factoshiny package [57]. This same package also allowed for Multiple Correspondence Analysis on the presence-absence data of species, families and genera to analyse the similarity between the three cities (inter-city similarity). Additionally, the relative occurrence frequencies of each taxonomic level in the CRGs were determined for each city to better highlight similarities and differences.
Based on data on the conservation status and origins of plant species from all the CRGs of each studied city, the absolute numbers of each category were determined. Subsequently, Fisher’s exact tests were performed to verify the existence of a link between the distribution of species status and the city.
3. Results
3.1. Quantification of the Plant Composition and Biological Spectrum of Concessions Held by Catholic Religious’ Groups in the Studied Cities and the Effect of Their Areas
A total of 220 plant species corresponding to 76 families and 185 genera (Appendix 1) was identified across the CRGs of the three studied cities. The results of the mean comparison analysis (Table 3) show that the CRGs of Bukavu and Kisangani are not statistically different in terms of average species richness, average family diversity, and average genus diversity. In contrast, the CRGs of the city of Lubumbashi stand out with statistically higher values, 2 to 3 times more, for the same parameters compared to the other two cities.
Consequently, the city of Lubumbashi presents the highest total species richness (152 species compared to 67 in Kisangani and 24 in Bukavu), as well as the highest family diversity (60 families compared to 36 in Kisangani and 15 in Bukavu) and the highest genus diversity (137 genera compared to 56 in Kisangani and 22 in Bukavu). Furthermore, within the same city, the high standard deviation values, regardless of the city, suggest a low intra-city homogeneity among the CRGs for the concerned parameters.
Moreover, the mean comparison analysis on the area of the CRGs shows that the area of the CRGs in Lubumbashi (1.1 ha) is on average smaller than those in Bukavu (3.7 ha) and Kisangani (5.2 ha). However, the latter two are not statistically different. Beyond this, the results of the correlation analyses reveal that there is no significant relationship between CRG area and their diversity in species (t = -0.63189, df = 68, p-value = 0.5296), families (t = -0.72088, df = 68, p-value = 0.4735) and genera (t = -0.65989, df = 68, p-value = 0.5116).
Regarding the biological spectrum of the CRGs, it was revealed by Fisher’s exact test that it depends on the city considered. Although in each of the three cities, the biological spectrum is dominated by phanerophytes, that of Lubumbashi is the widest with 5 life forms present compared to 2 in Bukavu and 1 in Kisangani (Figure 2).
Considering the top three values of the dominance index of the families and genera comprising the species of the CRGs in each of the cities (Table 4), it appears that the dominant families and genera are relatively different from one city to another. In Bukavu, the Bigoniaceae, Fabaceae, and Rutaceae are the families with the highest relative dominance (RD) (12.5% each), and the genus Citrus has the highest RD (12.5%). In Kisangani, the taxa with the highest RDs are the Fabaceae family (15.3%) and the genera Acacia and Citrus (5.6%). In contrast, in Lubumbashi, the taxa with the highest RDs are the Araceae family (8.6%) and the genera Cyperus and Euphorbia (2%).
3.2. Comparative Plant Composition Between Concessions Held by Catholic Religious’ Groups and Studied Cities
The results of intra-city similarity analyses in terms of plant composition through hierarchical classifications (Figure 3, Figure 4, and Figure 5) reveal that, regardless of the taxonomic level considered (species, family or genus), only the CRGs of Kisangani are predominantly similar (40 CRGs classified into three groups, one of which contains 38 CRGs regardless of the taxon). Those of Lubumbashi are less similar (10 CRGs classified into 5 groups regardless of the taxon), and those of Bukavu are even less so (20 CRGs classified into 10 groups for species composition, and into 7 groups for family and genus composition).
Furthermore, the results of multiple correspondence analysis (Figure 6) indicate that, regardless of the taxonomic level considered, the inter-city similarity regarding the plant composition of the CRGs is low. More specifically, the cities of Bukavu and Kisangani, although relatively dissimilar, share more taxa in common with each other compared to Lubumbashi, which is still very dissimilar to them.
The examination of the species, families and genera with the three highest relative frequencies per city (Table 5) clearly shows that, regardless of the taxon, the situation varies from one city to another
3.3. Distribution of the Vegetation of the CRGs in the Studied Cities According to Their Origin and Conservation Status
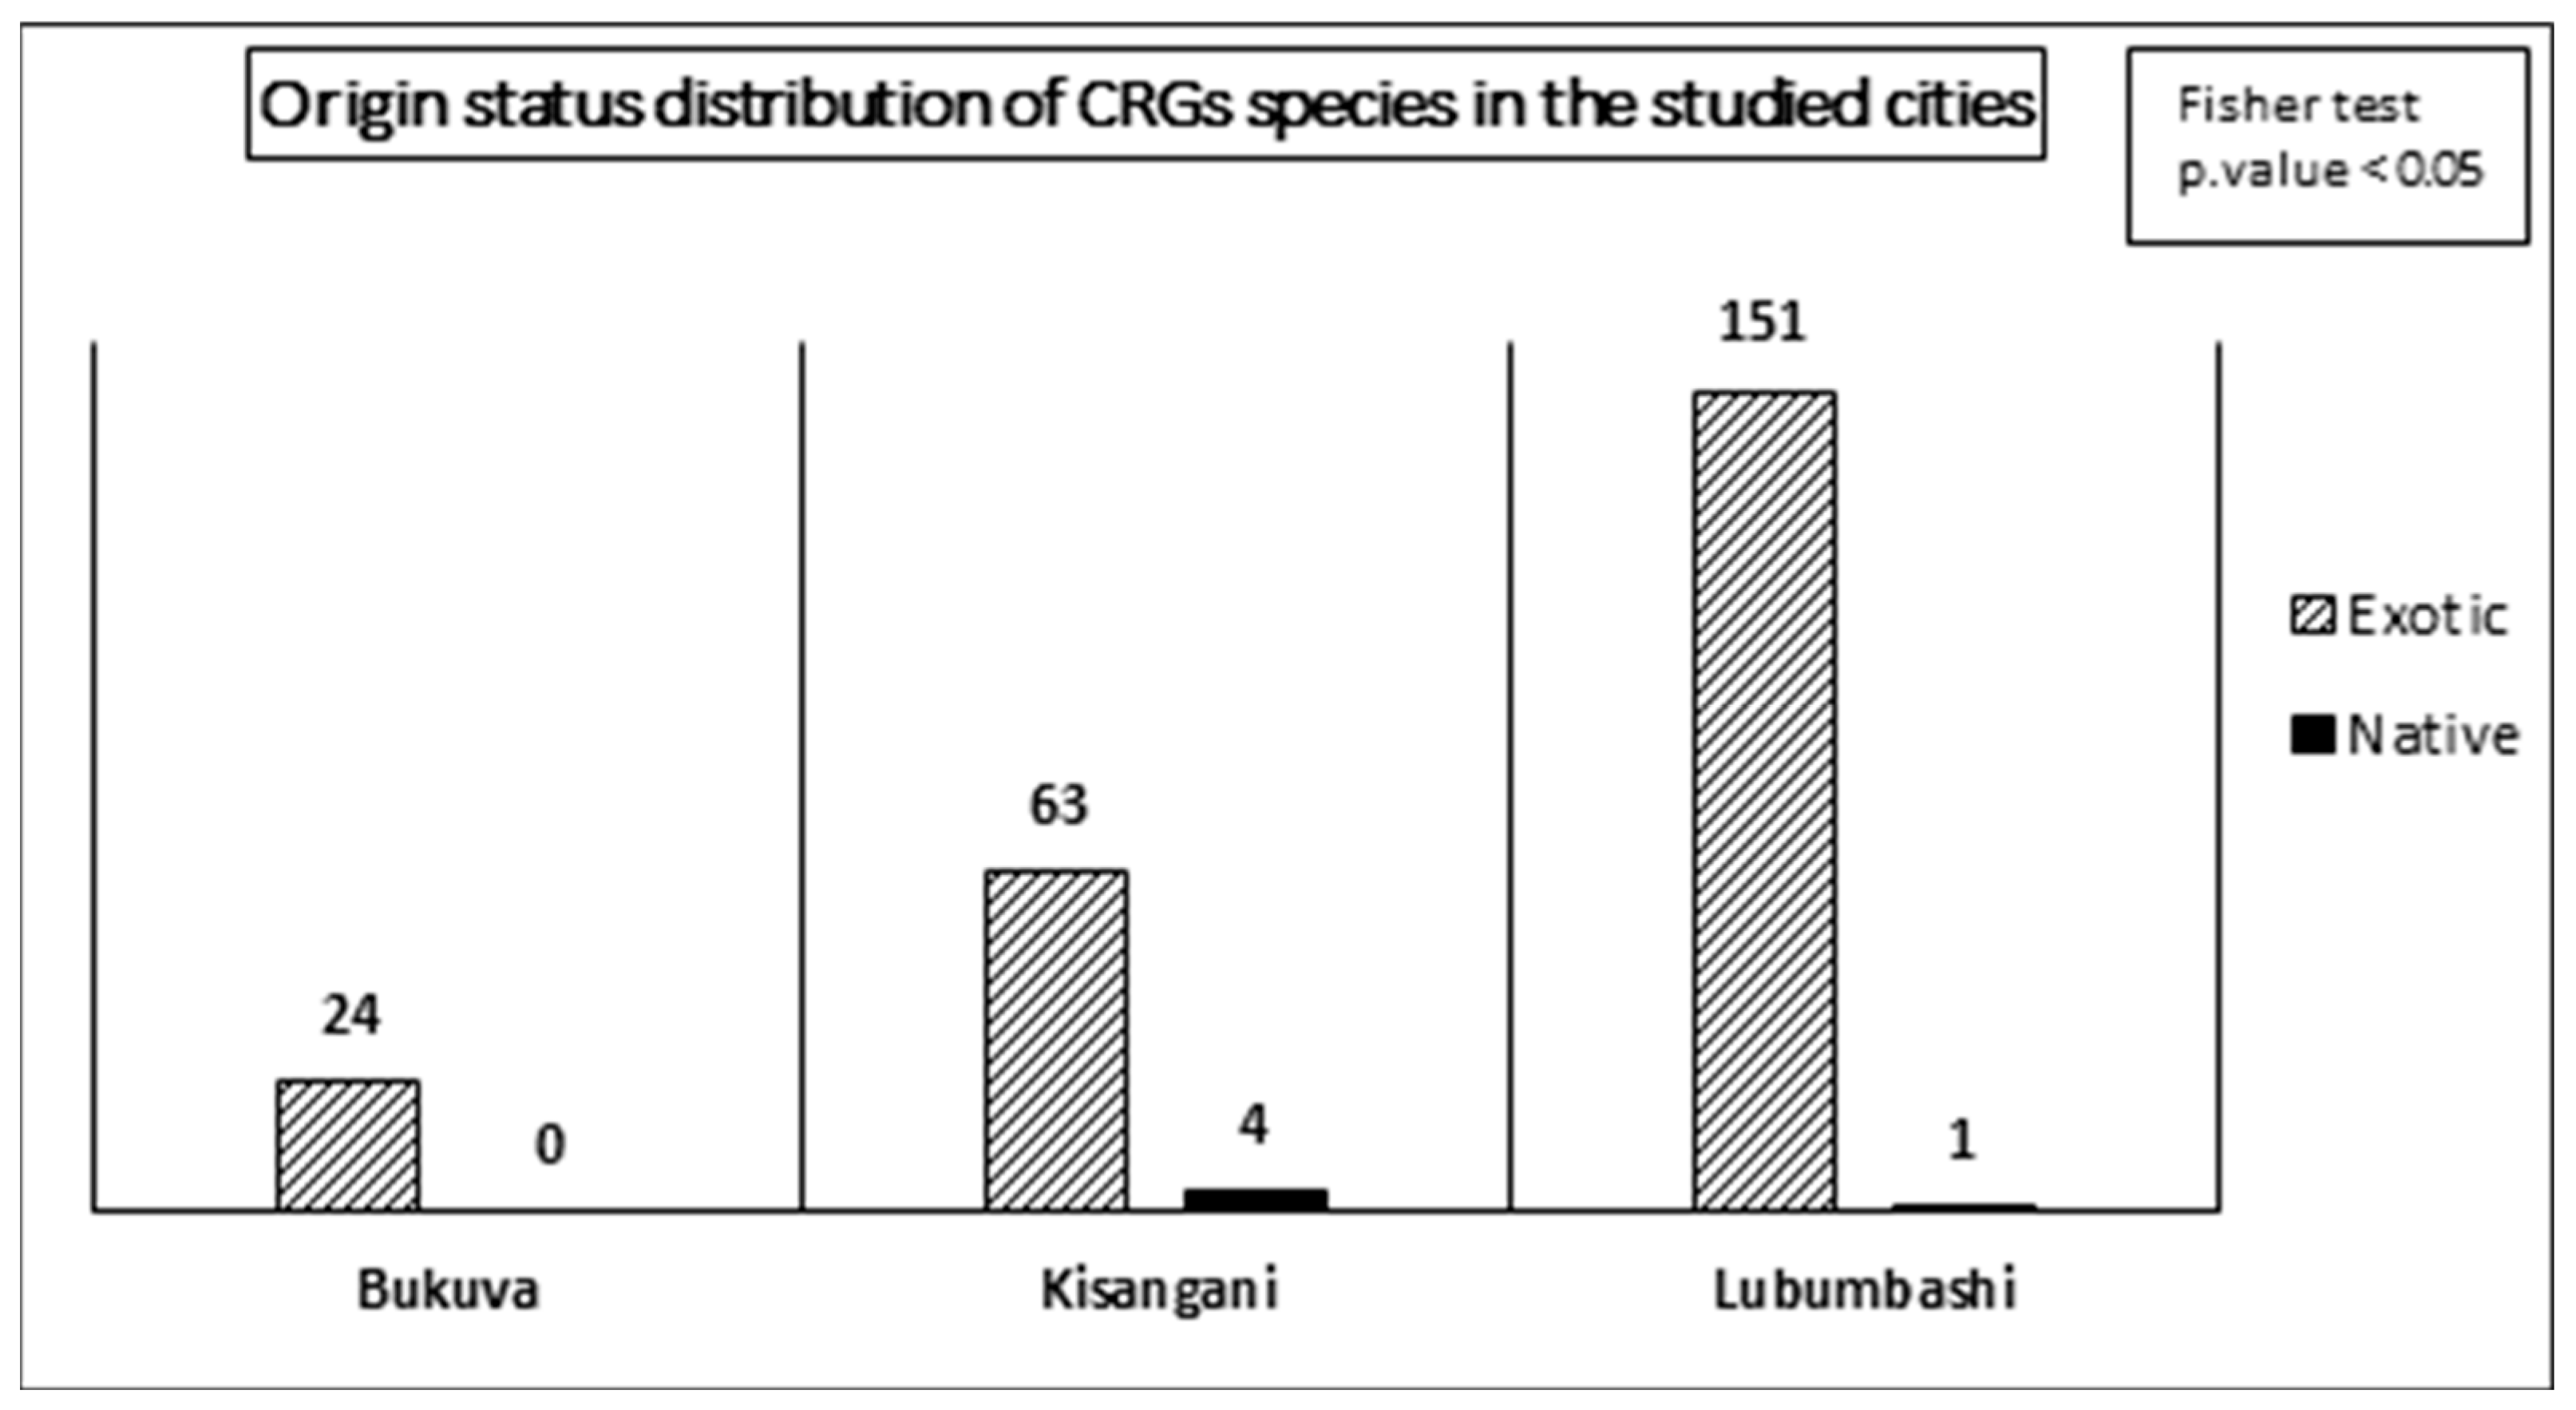
The results of the independence tests applied to the distribution of origin and conservation status of species across the cities reveal that the distribution of status depends on the cities (Figure 7 and Figure 8). Indeed, regarding the origin status of the species, although all cities are characterized by a majority of exotic species, Bukavu stands out due to the absence of native species, while Kisangani and Lubumbashi present 4 and 1 native species, respectively.
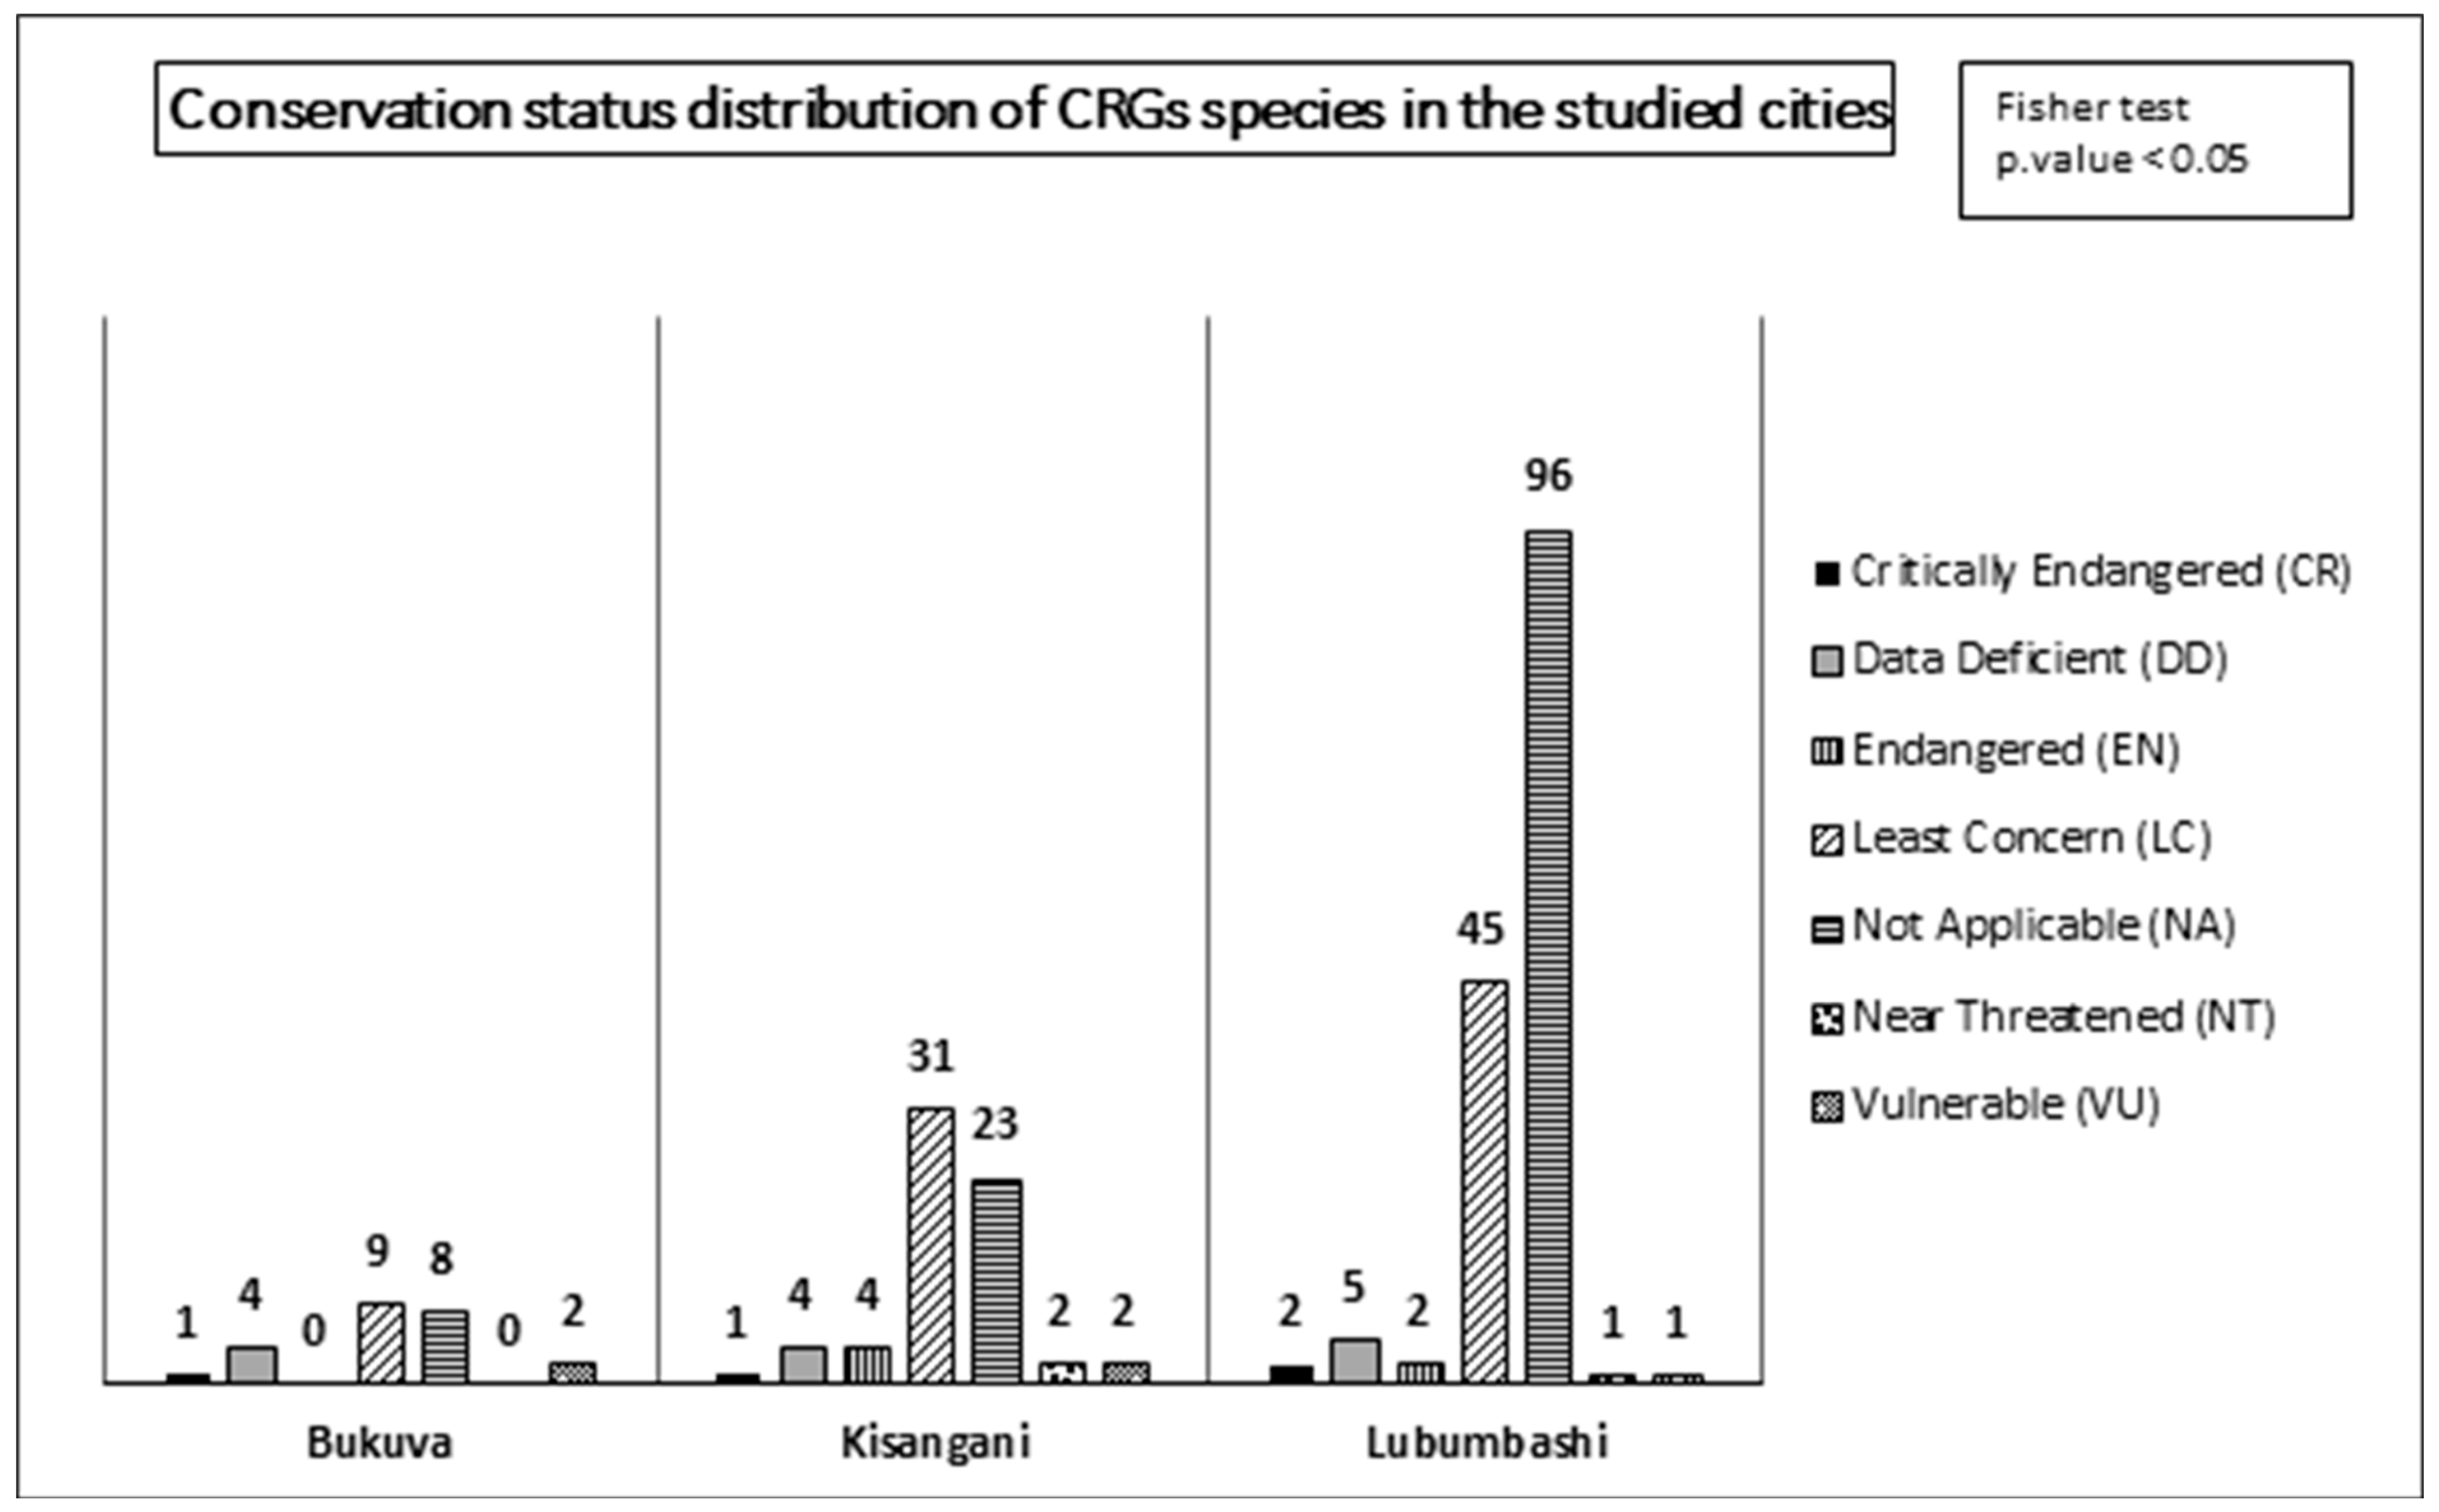
In relation to conservation status, the status LC, NA, and DD are in the majority regardless of the city. Bukavu is notable for having only one species classified as CR (Leucaena leucocephala (Lam.) De Wit, 1961). On the other hand, Kisangani has the highest number of species in the high-threat categories, including 1 species classified as CR (Leucaena leucocephala (Lam.) De Wit, 1961); 4 species classified as EN (Autranella congolensis (De Wild.) A. Chev.; Coffea arabica L., 1753; Millettia laurentii De Wild; and Tectona grandis L.f., 1782) and 2 species classified as NT (Artocarpus camansi Blanco, 1837 and Milicia excelsa (Welw.) C.C.Berg, 1982). The city of Lubumbashi, for its part, presents 2 species classified as CR (Hyophorbe lagenicaulis (L.H.Bailey) H.E.Moore, 1976 and Leucaena leucocephala (Lam.) De Wit, 1961), 2 species classified as EN (Coffea arabica L., 1753 and Kalanchoe daigremontiana Raym.-Hamet & H.Perrier, 1914), and 1 species classified as NT (Dypsis lutescens (H.Wendl.) Beentje & J.Dransf., 1995).
Figure 8.
Distribution of plant species conservation status for the CRGs of each of the three cities studied, according to the IUCN Red List. The values represent the absolute number of species identified in all CRGs per city. The result of the Fisher test reveals that the distribution of conservation status depends on the city.
4. Discussion
4.1. Discussion of the Methodological Approach
The study was based on a systematic floristic inventory of the vegetation present in the concessions held by catholic Religious’ Groups (CRGs). This approach was necessitated by the nature of the areas to be inventoried, which are of the garden type, i.e. they consist of discontinuous areas within the CRGs containing both low and high vegetation. This full-turn inventory approach is not new; it is most often used to study gardens. [58,59,60].
Moreover, the samples of CRGs surveyed by city are not equal, which may call into question the comparisons made. The size of the samples in each city was dictated by the accessibility and abundance of CRGs. However, due to the lack of a complete list of CRGs in the cities, it remains difficult to assert the full representativeness of the sample. The reliability of the comparisons was ensured by preferring non-parametric analyses suitable for all sample sizes. Additionally, it was found that plant diversity does not depend on the surveyed area. Furthermore, contrary to expectations, the city of Lubumbashi, which has the smallest sample, is where the highest number of species was recorded (Table 3).
4.2. The Near Heterogeneity Intra and Inter City in the Plant Composition of CRGs
The various results obtained allow us to refute the hypothesis of similarity among CRGs within the same city. Indeed, apart from the city of Kisangani, which showed a relatively strong similarity in the composition of CRGs in terms of species types, families, and genera, there was a low similarity for all other characteristics of the plant composition of CRGs within the same city and across all three studied cities. The openness of the cities of Bukavu and Lubumbashi to the country and the world, due to their easy accessibility and proximity to borders, allows for the introduction of a diversity of species and variation in green spaces influenced by contact with a variety of gardens. Several studies on the determinants of gardening practices indeed highlight the significant role of contact with nature and lived experiences [44,61,62].
Regarding the hypothesis of inter-city dissimilarity, our results confirm it. Indeed, even though in quantitative terms (average number of species, families and genera and average area of CRGs), the cities of Bukavu and Kisangani are similar, they are less so in all other aspects of plant composition considered, and even less so with the city of Lubumbashi. While some studies report similarities between private gardens in different regions of the same country, as is the case in Bangladesh [63], this is not necessarily true in the Democratic Republic of Congo (DRC). The marked climatic and environmental differences between regions in the DRC may be an important explanatory factor [64]. In this specific case, the particularity of the city of Lubumbashi compared to the other two cities reinforces the idea of the significant effect of climatic differences. The choice of species in CRGs would therefore be more influenced by climatic conditions favourable to the development of a given flora than by religious preferences.
The confirmation of intra and inter-city dissimilarity also allows us to deduce that the common Catholic belief among the compared entities does not evidently have a homogenizing effect on the green arrangements of CRGs, at least in terms of plant composition. These results underline facts noted by other authors, notably the complexity of interactions between human and nature, which vary according to individuals, regions, traditions and cultures. [65,66,67,68].
The observed independence between plant diversity and the area of CRGs, regardless of the city, is not the systematic outcome expected. It is often anticipated that species richness increases with area [69,70]. As is often the case in garden design, it’s possible to grow several species in a very small space, especially when it comes to herbaceous plants. This also explains how cities that cover only a small proportion of the Earth’s surface can host rich biodiversity [61]. Consequently, even the smallest identifiable green space is important and must be taken into consideration in the context of biodiversity conservation, particularly in urban environments.
Furthermore, the marked dominance of phanerophytes in the plant composition of CRGs across all cities corroborates its expected dominance under tropical climates [71]. This dominance is also linked to the general conditions favourable to forest vegetation in the landscapes where the studied cities are located [72]. The same applies to the dominant taxa (species, families, and genera) in each city. This dominance of phanerophytes also indicates a preference in CRGs for tall and perennial vegetation, which is less demanding in terms of maintenance effort. This contrasts with the results of a recent study on the floristic composition of private gardens in Lubumbashi, which noted the dominance of herbaceous, thus low vegetation [31].
4.3. The Importance of Phyto-Biodiversity Hosted by CRGs
The total CRGs in the studied cities host a total of 220 species. This species richness is close to that reported for private gardens in Lubumbashi (232 species)[31] and the city of Amman (223 species), the capital of Jordan in the Middle East [33]. However, it is high, compared to the species richness reported (103 species) for private gardens in the cities of Ouidah and Cotonou in Benin [52] and low, compared to that reported for the city of Tlokwe in South Africa (835 species) [32]. The species richness of biodiversity in cities is therefore variable and strongly depends on local gardening dynamics.
The analysis of the origin status of the species reveals that the majority of species are exotic, regardless of the city. This is a phenomenon observed in several other cities [32,33,52]. The city of Kisangani has the most native species, with 4 species. This confirms our hypothesis in this regard and aligns with the conclusions of studies on urban biodiversity in tropical countries [46]. Although exotic species include several acclimatized species, it clearly highlights the challenge of promoting native species. Indeed, the introduction or promotion of exotic species carries potential risks of invasion and thus threatens local phytogenetic diversity [32].
Moreover, it has been confirmed that CRGs contain species classified as threatened on the IUCN Red List. Indeed, this is one of the contributions to biodiversity conservation in private gardens highlighted by several authors [65,73,74]. The presence of a large majority of non-assessed species in GCRs further underlines their importance as biodiversity reservoirs.
4.4. Implications for Urban Biodiversity Management and Research Perspectives
This study focused on a specific private actor, namely Catholic groups, and the rich biodiversity revealed, confirms the importance of considering the role of private actors in urban biodiversity conservation. The study reinforces the idea of the city as a reservoir of biodiversity [16,69]. Unlike rural landscapes, urban biodiversity is scattered over disparate areas and is maintained by a variety of actors. It is therefore essential to keep in mind this diversity of actors and spaces when inventorying urban biodiversity.
The dominance of exotic species calls for raising awareness among stakeholders about the preference for native species. The positive effects of promoting native species in cities are indeed well documented [16]. Developing catalogs of native species and documenting their potential for green spaces would be a beneficial incentive approach to reverse current trends.
Furthermore, the comparisons made in this study focused solely on the affiliation of sites to a Catholic religious group due to the limitation of data collected from this single perspective. It could be considered, following a more extensive and resource-intensive data collection, to explore comparative perspectives related to the nature of activities held in Concessions held by catholic Religious’ Groups (CRGs) and other types of religious groups present in the country, such as Methodists, Protestants, and Kimbanguists. A better appreciation of the contribution of CRGs to biodiversity conservation could be envisaged through subsequent comparative analyses with public green spaces or other private actors.
5. Conclusions
This study aimed to assess the plant biodiversity maintained in the CRGs of three cities (Bukavu, Kisangani and Lubumbashi) through systematic inventories. The study confirms the hypothesis of low inter-city similarity in terms of CRGs flora and, to a lesser extent, intra-city similarity, with only the CRGs of Kisangani being the most similar to each other. It also appears that there is no relationship between the CGRs area and their specific richness and that exotic species are predominant.
A total of 220 plant species corresponding to 76 families and 185 genera were identified across all cities. Each city is characterized by the plant composition of its CRGs, and outside of Kisangani, where intra-city similarity of CRGs is stronger, the other two cities show greater intra-city dissimilarity among CRGs. The plant diversity and the presence of endangered species in CRGs highlight their importance in biodiversity conservation. However, the predominance of exotic species calls for the promotion of native species.
This study reinforces and illustrates the importance of private actors in urban biodiversity conservation and opens a pathway for investigation for various identifiable private actors.
Author Contributions
Conceptualization, L.M.P. and K.R.S.; methodology, L.M.P. and K.R.S.; software, L.M.P.; validation, K.R.S., Y.U.S. and J.B.; formal analysis, L.M.P. and K.R.S.; investigation, L.M.P., ABN, JMT, Y.U.S; J.P.P.M.T.H. resources, SMM, DP, JMT, Y.U.S. and J.P.P.M.T.H.; data curation, L.M.P.; D.P.; writing—original draft preparation, L.M.P., S.M.M. JBB, and K.R.S.; writing—review and editing, L.M.P., K.R.S., Y.U.S., J.B. and K.R.S.; visualization, L.M.P. and K.R.S.; supervision, K.R.S., JM, JFB, Y.U.S. and J.B.; project administration, J.B.; funding acquisition, L.M.P. and J.B. All authors have read and agreed to the published version of the manuscript.
Funding
This research was funded by Académie de Recherche pour l’Enseignement Supérieur (ARES–CCD, Belgium), B-MOB scholarship program of Liège University.
Institutional Review Board Statement
Ethical review and approval were waived for this study due to this reason: the study does not affect human health or well-being of human.
Informed Consent Statement
Not applicable.
Data Availability Statement
The data presented in this study are available upon request from the corresponding author.
Acknowledgments
The authors would like to thank all the field interviewers who contributed to the data collection.
Conflicts of Interest
The authors declare no conflicts of interest.
Appendix A
Appendix A.1

Table A1.
List of species inventoried in the concessions of Catholic religious groups in three cities (Bukavu, Kisangani, Lubumbashi) of the Democratic Republic of Congo (DRC). - = absent from town; + = present in town, Ex = Exotic, Na = Native.
Table A1.
List of species inventoried in the concessions of Catholic religious groups in three cities (Bukavu, Kisangani, Lubumbashi) of the Democratic Republic of Congo (DRC). - = absent from town; + = present in town, Ex = Exotic, Na = Native.
| N° | Scientific name | Family | Conservation status | Life form | Origin status | Bukavu | Kisangani | Lubumbashi |
|---|---|---|---|---|---|---|---|---|
| 1 | Acacia auriculiformis A.Cunn. ex Benth., 1842 | Fabaceae | LC | Ph | Ex | - | + | - |
| 2 | Acacia nilotica (L.) Willd. ex Delile | Fabaceae | LC | Ph | Ex | - | - | - |
| 3 | Acalypha wilkesiana Müll.Arg., 1866 | Euphorbiaceae | NA | Ph | Ex | - | - | + |
| 4 | Agave americana L. | Asparagaceae | LC | Ch | Ex | - | - | + |
| 5 | Agave attenuata Salm-Dyck, (1834 | Asparagaceae | NA | Ch | Ex | - | - | + |
| 6 | Aglaonema commutatum Schott, 1856 | Araceae | NA | Hem | Ex | - | - | + |
| 7 | Albizia chinensis (Osbeck) Merr., 1916 | Fabaceae | NA | Ph | Ex | - | + | - |
| 8 | Albizia gummifera (J.F.Gmel.) C.A.Sm., 1930 | Mimosaceae | LC | Ph | Ex | - | + | - |
| 9 | Albizia julibrissin Durazz., 1772 | Fabaceae | NA | Ph | Ex | - | + | - |
| 10 | Alocasia macrorrhizos (L.) G.Don, 1839 | Araceae | NA | Ge | Ex | - | - | + |
| 11 | Aloe arborescens Mill., 1768 | Asphodelaceae | LC | Ge | Ex | - | - | + |
| 12 | Aloe vera (L.) Burm.f., 1768 | Asphodelaceae | NA | Ge | Ex | - | - | + |
| 13 | Alternanthera brasiliana (L.) Kuntze, 1891 | Amaranthaceae | NA | Ph | Ex | - | - | + |
| 14 | Amaranthus hybridus L., 1753 | Amaranthaceae | NA | Ch | Ex | - | - | + |
| 15 | Annona muricata L., 1753 | Annonaceae | LC | Ph | Ex | - | - | + |
| 16 | Annona senegalensis Pers., 1806 | Annonaceae | LC | Ph | Ex | - | + | - |
| 17 | Anonidium mannii (Oliv.) Engler & Diels , 1901 | Annonaceae | LC | Ph | Ex | - | + | - |
| 18 | Anthocleista schweinfurthii Gilg, 1893 | Loganiaceae | LC | Ph | Ex | - | + | - |
| 19 | Antigonon leptopus Hook. & Arn., 1838 | Polygonaceae | NA | Ch | Ex | - | - | + |
| 20 | Araucaria cunninghamii Aiton ex D. Don,1837 | Araucariaceae | LC | Ph | Ex | - | - | + |
| 21 | Archontophoenix alexandrae H.Wendl. & Drude, 1875 | Arecaceae | LC | Ph | Ex | - | - | + |
| 22 | Aristaloe aristata Adrian Hardy Haworth, 1825 | Xanthorrhoeaceae | NA | Ge | Ex | - | - | + |
| 23 | Artocarpus altilis (Parkinson) Fosberg, 1941 | Moraceae | NA | Ph | Ex | - | + | - |
| 24 | Artocarpus camansi Blanco, 1837 | Moraceae | NT | Ph | Ex | - | + | - |
| 25 | Artocarpus heterophyllus Lam., 1789 | Moraceae | NA | Ph | Ex | - | - | + |
| 26 | Aspidistra elatior Blume, 1834 | Asparagaceae | NA | Ph | Ex | - | - | + |
| 27 | Asplenium nidus L., 1753 | Aspleniaceae | NA | Hem | Ex | - | - | + |
| 28 | Autranella congolensis (De Wild.) A. Chev. | Sapotaceae | EN | Ph | Na | - | + | - |
| 29 | Averrhoa carambola L., 1753 | Oxalidaceae | DD | Ph | Ex | - | + | - |
| 30 | Bambusa vulgaris Schrad. ex J.C.Wendl., 1810 | Poaceae | NA | Ph | Ex | + | - | + |
| 31 | Bauhinia variegata Carl von Linné, également connu sous le nom de Carl Linnaeus, 1753 | Fabaceae | LC | Ph | Ex | - | - | + |
| 32 | Begonia rex Jules Antoine Adolph Henri Putzeys, 1856 | Begoniaceae | NA | Epi | Ex | - | - | + |
| 33 | Bellucia pentamera Naudin | Melastomataceae | LC | Ph | Ex | - | + | - |
| 34 | Borassus flabellifer L., 1977 | Arecaceae | NA | Ph | Ex | - | - | + |
| 35 | Bougainvillea glabra Philibert Commerson, 1760 | Nyctaginaceae | LC | Ph | Ex | - | - | + |
| 36 | Breynia disticha J.R.Forst. & G.Forst., 1775 | Euphorbiaceae | NA | Ph | Ex | - | - | + |
| 37 | Caladium bicolor (Aiton) Vent., 1801 | Araceae | NA | Ch | Ex | - | - | + |
| 38 | Callistemon citrinus (Curtis) Skeels, 1913 | Myrtaceae | NA | Ph | Ex | - | - | + |
| 39 | Callistemon viminalis (Sol. ex Gaertn.) G.Don, 1830 | Myrtaceae | NA | Ph | Ex | - | - | + |
| 40 | Cananga odorata Albert Schwenger, 1860 | Annonaceae | LC | Ph | Ex | - | + | - |
| 41 | Canna indica L., 1753 | Cannaceae | NA | Ph | Ex | - | - | + |
| 42 | Carica papaya L., 1753 | Caricaceae | DD | Ph | Ex | + | + | + |
| 43 | Cascabela thevetia (Pers.) K. Schum,1895 | Apocynaceae | LC | Ph | Ex | - | - | + |
| 44 | Casimiroa edulis La Llave & Lex, 1825 | Rutaceae | LC | Ph | Ex | - | - | + |
| 45 | Cassia siamea ( Lam.) H.S.Irwin & Barneby, 1982 | Fabaceae | LC | Ph | Ex | - | + | - |
| 46 | Catharanthus roseus (L.) G.Don, 1837 | Apocynaceae | NA | Ph | Ex | - | - | + |
| 47 | Celosia cristata L., 1753 | Amaranthaceae | LC | Ph | Ex | - | - | + |
| 48 | Cestrum nocturnum L., 1753 | Solanaceae | LC | Ph | Ex | - | - | + |
| 49 | Chamaedorea cataractarum Mart., 1849 | Arecaceae | NA | Ph | Ex | - | - | + |
| 50 | Chamaerops humilis L., 1753 | Arecaceae | LC | Ph | Ex | - | - | + |
| 51 | Chelidonium majus L., 1753 | Papaveraceae | NA | Ph | Ex | - | - | + |
| 52 | Chlorophytum comosum Jacques, 1862 | Asparagaceae | NA | Hem | Ex | - | - | + |
| 53 | Citrus aurantium L., 1753 | Rutaceae | NA | Ph | Ex | - | - | + |
| 54 | Citrus limon (L.) Osbeck, 1765 | Rutaceae | NA | Ph | Ex | + | + | + |
| 55 | Citrus maxima (Burm.) Merrill, 1917 | Rutaceae | NA | Ph | Ex | + | + | - |
| 56 | Citrus reticulata Blanco, 1837 | Rutaceae | NA | Ph | Ex | - | + | - |
| 57 | Citrus sinensis (L.) Osbeck, 1765 | Rutaceae | NA | Ph | Ex | + | + | - |
| 58 | Clerodendrum thomsoniae Balf., 1862 | Lamiaceae | NA | Ph | Ex | - | - | + |
| 59 | Clivia miniata William J. Burchell en 1815 | Amaryllidaceae | NA | Ph | Ex | - | - | + |
| 60 | Cocos nucifera L., 1753 | Arecaceae | NA | Ph | Ex | - | + | - |
| 61 | Codiaeum variegatum (L.) Rumph. ex A.Juss., 1824 | Euphorbiaceae | LC | Ph | Ex | - | - | + |
| 62 | Coffea arabica L., 1753 | Rubiaceae | EN | Ph | Ex | - | + | + |
| 63 | Cola acuminata (P.Beauv.) Schott & Endl., 1832 | Malvaceae | LC | Ph | Ex | - | + | - |
| 64 | Coleus amboinicus Lour., 1790 | Lamiaceae | NA | Ph | Ex | - | - | + |
| 65 | Coleus scutellarioides (L.) Benth., 1830 | Lamiaceae | NA | Ph | Ex | - | - | + |
| 66 | Colocasia esculenta (L.) Schott, 1832 | Araceae | LC | Ph | Ex | - | - | + |
| 67 | Cordyline fruticosa (L.) A.Chev., 1919 | Asparagaceae | LC | Ph | Ex | - | - | + |
| 68 | Cornus drummondii C.A.Mey., 1845 | Cornaceae | LC | Ph | Ex | - | - | + |
| 69 | Cupaniopsis anacardioides (A.Rich.) Radlk., 1879 | Sapindaceae | LC | Ph | Ex | - | - | + |
| 70 | Cuphea hyssopifolia Kunth, 1823 | Lythraceae | NA | Ph | Ex | - | - | + |
| 71 | Cupressus macrocarpa Hartw., 1847 | Cyperaceae | NA | Ph | Ex | - | - | + |
| 72 | Cycas revoluta Carl Peter Thunberg, 1782 | Cycadaceae | NA | Ph | Ex | - | - | + |
| 73 | Cyperus alternifolius Carl von Linné, 1767 | Cyperaceae | NA | Ph | Ex | - | - | + |
| 74 | Cyperus esculentus L., 1753 | Cyperaceae | NA | Ph | Ex | - | - | + |
| 75 | Cyperus papyrus Linné, 1753 | Cyperaceae | NA | Ge | Ex | - | - | + |
| 76 | Dacryodes edulis [G.Don] H.J.Lam, 1832 | Burseraceae | NA | Ph | Ex | - | + | - |
| 77 | Dianella ensifolia (L.) Redouté, 1802 | Asphodelaceae | NA | Ph | Ex | - | - | + |
| 78 | Dieffenbachia seguine (Jacq.) Schott, 1829 | Araceae | NA | Ph | Ex | - | - | + |
| 79 | Dillenia indica (L.), 1753 | Dilleniaceae | LC | Ph | Ex | - | - | + |
| 80 | Dodonaea viscosa Jacq., 1760 | Sapindaceae | LC | Ph | Ex | - | - | + |
| 81 | Dracaena fragrans (L.) Ker Gawl., 1808 | Asparagaceae | LC | Ph | Ex | - | - | + |
| 82 | Dracaena reflexa Lam., 1786 | Asparagaceae | NA | Ph | Ex | - | - | + |
| 83 | Duranta erecta L., 1753 | Verbenaceae | LC | Ph | Ex | - | - | + |
| 84 | Dypsis lutescens (H.Wendl.) Beentje & J.Dransf., 1995 | Arecaceae | NT | Ph | Ex | - | - | + |
| 85 | Elaeis guineensis Jacq., 1763 | Arecaceae | LC | Ph | Ex | + | + | + |
| 86 | Entandrophragma candollei Harms, 1896 | Meliaceae | VU | Ph | Ex | - | + | - |
| 87 | Epipremnum aureum (Linden & André) Bunting, 1964 | Araceae | NA | Ch | Ex | - | - | + |
| 88 | Erythrina abyssinica Lam. ex DC., 1825 | Fabaceae | NA | Ph | Ex | + | - | - |
| 89 | Eucalyptus globulus Labill., 1800 | Myrtaceae | LC | Ph | Ex | + | - | - |
| 90 | Eucharis amazonica Linden ex Planch., 1857 | Liliaceae | NA | Ge | Ex | - | - | + |
| 91 | Euphorbia cotinifolia L., 1753 | Euphorbiaceae | NA | Ph | Ex | - | - | + |
| 92 | Euphorbia resinifera O.Berg, 1863 | Euphorbiaceae | NA | Ph | Ex | - | - | + |
| 93 | Euphorbia royleana E. Ursch et J. D. Léandri, 1954 | Euphorbiaceae | NA | Ph | Ex | - | - | + |
| 94 | Ficus benjamina L., 1767 | Moraceae | LC | Ph | Ex | - | - | + |
| 95 | Ficus mucuso Welw. ex Ficalho, 1884 | Moraceae | LC | Ph | Ex | - | + | - |
| 96 | Ficus vallis-choudae Delile, 1843 | Marantaceae | NA | Ph | Ex | - | + | - |
| 97 | Fragaria vesca L., 1753 | Rosaceae | LC | Ch | Ex | - | - | + |
| 98 | Goeppertia makoyana (É.Morren) Borchs. & S.Suárez, 2012 | Marantaceae | NA | Ch | Ex | - | - | + |
| 99 | Goeppertia zebrina (Sims) Nees, 1831 | Marantaceae | NA | Ph | Ex | - | - | + |
| 100 | Graptophyllum balansae Heine, 1976 | Acanthaceae | NA | Ph | Ex | - | - | + |
| 101 | Grevillea robusta A.Cunn. ex R.Br., 1830 | Proteaceae | LC | Ph | Ex | + | + | - |
| 102 | Harungana madagascariensis Lam. ex Poir., 1804 | Hypericaceae | LC | Ph | Ex | - | + | - |
| 103 | Hemerocallis fulva (L.) L., 1762 | Asphodelaceae | NA | Ph | Ex | - | - | + |
| 104 | Hevea brasiliensis (Willd. ex A.Juss.) Mull.Arg., 1865 | Euphorbiaceae | LC | Ph | Ex | - | + | - |
| 105 | Hibiscus rosa-sinensis L., 1753 | Malvaceae | NA | Ph | Ex | - | - | + |
| 106 | Hibiscus tiliaceus L., 1753 | Malvaceae | NA | Ph | Ex | - | + | - |
| 107 | Hydrocotyle verticillata Thunb., 1798 | Araliaceae | LC | Ge | Ex | - | - | + |
| 108 | Hymenocallis littoralis (Jacq.) Salisb., 1812 | Amaryllidaceae | NA | Ph | Ex | - | - | + |
| 109 | Hyophorbe lagenicaulis (L.H.Bailey) H.E.Moore, 1976 | Arecaceae | CR | Ph | Ex | - | - | + |
| 110 | Ipomoea indica (Burm.) Merr., 1917 | Convolvulaceae | DD | Ph | Ex | - | - | + |
| 111 | Iresine diffusa Humb. & Bonpl. ex Willd., 1806 | Amaranthaceae | NA | Ph | Ex | - | - | + |
| 112 | Iris pseudacorus L., 1753 | Iridaceae | LC | Ph | Ex | - | - | + |
| 113 | Jacaranda mimosifolia D.Don, 1822 | Bignoniaceae | VU | Ph | Ex | + | - | - |
| 114 | Kalanchoe daigremontiana Raym.-Hamet & H.Perrier, 1914 | Crassulaceae | EN | Ph | Ex | - | - | + |
| 115 | Lagerstroemia indica L., 1759 | Lythraceae | LC | Ph | Ex | - | - | + |
| 116 | Lannea discolor (Sond.) Engl., | Anacardiaceae | LC | Ph | Ex | + | - | - |
| 117 | Lantana camara L., 1753 s.s. | Verbenaceae | NA | Ph | Ex | - | - | + |
| 118 | Lavandula angustifolia Mill., 1768 | Lamiaceae | LC | Ph | Ex | - | - | + |
| 119 | Leucaena leucocephala (Lam.) De Wit, 1961 | Fabaceae | CR | Ph | Ex | + | + | + |
| 120 | Leucanthemum maximum (Ramond) DC., 1837 | Asteraceae | NA | Ph | Ex | - | - | + |
| 121 | Ligustrum sinense Lour., 1790 | Oleaceae | NA | Ph | Ex | - | - | + |
| 122 | Liriope muscari (Decne.) L.H.Bailey, 1929 | Asparagaceae | NA | Ge | Ex | - | - | + |
| 123 | Livistona chinensis (Jacq.) R.Br. ex Mart., 1838 | Arecaceae | NA | Ph | Ex | - | - | + |
| 124 | Malus domestica (Suckow) Borkh., 1803 | Rosaceae | NA | Ph | Ex | + | - | - |
| 125 | Malvaviscus arboreus Cav., 1787 | Malvaceae | LC | Ph | Ex | - | - | + |
| 126 | Mangifera indica L., 1753 | Anacardiaceae | DD | Ph | Ex | + | + | + |
| 127 | Manihot esculenta Crantz, 1766 | Euphorbiaceae | DD | Ph | Ex | - | - | + |
| 128 | Markhamia lutea (Benth.) K. Schum. | Bignoniaceae | LC | Ph | Ex | + | - | - |
| 129 | Melissa officinalis L., 1753 | Lamiaceae | LC | Ph | Ex | - | - | + |
| 130 | Milicia excelsa (Welw.) C.C.Berg, 1982 | Moraceae | NT | Ph | Ex | - | + | - |
| 131 | Millettia laurentii De Wild | Fabaceae | EN | Ph | Ex | - | + | - |
| 132 | Millettia novo-guineensis Kaneh. & Hatus. | Fabaceae | NA | Ph | Ex | - | + | - |
| 133 | Monstera deliciosa, Liebn., 1849 | Araceae | NA | Ph | Ex | - | - | + |
| 134 | Moringa oleifera Lam. | Moringaceae | LC | Ph | Ex | + | + | - |
| 135 | Morus alba L., 1753 | Moraceae | NA | Ph | Ex | - | - | + |
| 136 | Musa acuminata Colla, 1820 | Musaceae | LC | Ph | Ex | - | + | + |
| 137 | Musa basjoo Siebold ex Iinuma, 1830 | Musaceae | LC | Ph | Ex | - | - | + |
| 138 | Musanga cecropioides R. Br. ex Tedlie, 1819 | Urticaceae | LC | Ph | Ex | - | + | - |
| 139 | Myrianthus arboreus P. Beauv., 1804-1805 | Cecropiaceae | LC | Ph | Na | - | + | - |
| 140 | Nephrolepis cordifolia (L.) C.Presl, 1836 | Nephrolepidaceae | NA | Ph | Ex | - | - | + |
| 141 | Nephrolepis exaltata (L.) Schott, 1834 | Nephrolepidaceae | LC | Ph | Ex | - | - | + |
| 142 | Nerium oleander L., 1753 | Apocynaceae | LC | Ph | Ex | - | - | + |
| 143 | Newbouldia laevis (P. Beauv.) Seem. | Bignoniaceae | LC | Ph | Ex | - | + | - |
| 144 | Olea europaea L., 1753 | Oleaceae | DD | Ph | Ex | + | - | - |
| 145 | Oxalis griffithii Edgew. & Hook.f. | Oxalidaceae | NA | Ch | Ex | - | - | + |
| 146 | Passiflora edulis Sims, 1818 | Passifloraceae | NA | Ph | Ex | - | - | + |
| 147 | Peltandra virginica (Linnaeus) Schott & Endlicher | Araceae | NA | Ph | Ex | - | - | + |
| 148 | Peperomia obtusifolia (L.) A.Dietr., 1831 | Piperaceae | NA | Ch | Ex | - | - | + |
| 149 | Persea americana Mill., 1768 | Lauraceae | NA | Ph | Ex | + | + | + |
| 150 | Persicaria microcephala Seikei Zusetsu, 1804 | Polygonaceae | NA | Ph | Ex | - | - | + |
| 151 | Petersianthus macrocarpus (P. Beauv.) Liben | Lecythidaceae | LC | Ph | Ex | - | + | - |
| 152 | Petunia sp Wijsman, 1990 | Solanaceae | NA | Ph | Ex | - | - | + |
| 153 | Phoenix canariensis Chabaud, 1882 | Arecaceae | LC | Ph | Ex | - | - | + |
| 154 | Phyllostachys viridiglaucescens (Carrière) Rivière & C.Rivière, 1878 | Poaceae | NA | Ph | Ex | - | + | - |
| 155 | Pinellia pedatisecta Schott | Araceae | NA | Ph | Ex | - | - | + |
| 156 | Pinus patula Schltdl. & Cham., 1831 | Pinaceae | VU | Ph | Ex | + | - | - |
| 157 | Pittosporum tobira (Murray) W. T. Aiton | Pittosporaceae | NA | Ph | Ex | - | - | + |
| 158 | Plumeria rubra L., 1753 | Apocynaceae | LC | Ph | Ex | - | + | + |
| 159 | Polyscias scutellaria (Burm.f.) Fosberg, 1948 | Araliaceae | NA | Ph | Ex | - | - | + |
| 160 | Prunus caroliniana (Mill.) Aiton | Rosaceae | LC | Ph | Ex | - | - | + |
| 161 | Prunus domestica L., 1753 | Rosaceae | DD | Ph | Ex | + | + | - |
| 162 | Pseudospondias microcarpa (A. Rich.) Engl., 1883 | Anacardiaceae | LC | Ph | Ex | - | + | - |
| 163 | Psidium guajava L., 1753 | Myrtaceae | LC | Ph | Ex | + | + | + |
| 164 | Pteris vittata L., 1753 | Pteridaceae | LC | Ph | Ex | - | - | + |
| 165 | Pycnanthus angolensis (Welw.) Warb. Notizbl. Königl. Bot. Gart, 1895 | Myristicaceae | LC | Ph | Na | - | + | - |
| 166 | Ravenala madagascariensis Sonn., 1782 | Strelitziaceae | LC | Ph | Ex | - | - | - |
| 167 | Ribes aureum Pursh, 1813 | Grossulariaceae | NA | Ph | Ex | - | + | - |
| 168 | Ricinodendron heudelotii (Baill.) Pierre ex Heckel, 1898 | Euphorbiaceae | LC | Ph | Na | - | - | + |
| 169 | Rosa multiflora Thunb., 1784 | Rosaceae | NA | Ph | Ex | - | - | + |
| 170 | Rosa chinensis Jacq., 1768 | Rosaceae | NA | Ph | Ex | - | - | + |
| 171 | Roystonea regia (Kunth) O.F.Cook, 1900 | Arecaceae | LC | Ph | Ex | - | + | - |
| 172 | Rudbeckia laciniata L., 1753 | Asteraceae | NA | Ph | Ex | - | - | + |
| 173 | Ruellia simplex C.Wright, 1870 | Acanthaceae | NA | Ph | Ex | - | - | + |
| 174 | Sabal palmetto (Walter) Lodd. ex Schult. & Schult.f., 1830 | Arecaceae | NA | Ph | Ex | - | - | + |
| 175 | Saccharum officinarum L., 1753 | Poaceae | NA | Ph | Ex | - | - | + |
| 176 | Saintpaulia ionantha Rubra, 1896 | Gesneriaceae | VU | Ge | Ex | - | - | + |
| 177 | Salix alba L., 1753 | Salicaceae | LC | Ph | Ex | - | - | + |
| 178 | Sambucus canadensis L., 1753 | Adoxaceae | NA | Ph | Ex | - | - | + |
| 179 | Sanchezia speciosa Leonard, 1926 | Acanthaceae | NA | Ph | Ex | - | - | + |
| 180 | Sansevieria trifasciata Prain 1903 | Asparagaceae | NA | Ge | Ex | - | - | + |
| 181 | Schefflera arboricola (Hayata) Merr. | Araliaceae | NA | Ph | Ex | - | - | + |
| 182 | Senna occidentalis (L.) Link, 1829 | Fabaceae | LC | Ph | Ex | - | + | - |
| 183 | Senna siamea (Lam.) H.S.Irwin & Barneby, 1982 | Fabaceae | LC | Ph | Ex | + | - | - |
| 184 | Spathiphyllum wallisii Regel, 1877 | Araceae | NA | Ph | Ex | - | + | - |
| 185 | Spathodea campanulata P.Beauv., 1805 | Bignoniaceae | LC | Ph | Ex | - | - | + |
| 186 | Sphagneticola trilobata (L.) Pruski, 1996 | Asteraceae | NA | Ch | Ex | + | - | - |
| 187 | Spondias dulcis Parkinson, 1773 | Anacardiaceae | NA | Ph | Ex | - | - | + |
| 188 | Spondias mombin L., 1753 | Anacardiaceae | LC | Ph | Ex | - | + | - |
| 189 | Strelitzia reginae Banks, 1788 | Strelitziaceae | NA | Ph | Ex | - | + | - |
| 190 | Syagrus romanzoffiana (Cham.) Glassman, 1968 | Arecaceae | NA | Ph | Ex | - | - | + |
| 191 | Symphyotrichum novi-belgii (L.) G.L.Nesom, 1995 | Asteraceae | NA | Ph | Ex | - | - | + |
| 192 | Symphyotrichum salignum (Willd.) G.L.Nesom, 1995 | Asteraceae | NA | Ph | Ex | - | - | + |
| 193 | Syngonium podophyllum Schott, 1851 | Araceae | NA | Ph | Ex | - | - | + |
| 194 | Syzygium cumini (L.) Skeels, 1912 | Lamiaceae | NA | Ph | Ex | - | - | + |
| 195 | Syzygium jambos (L.) Alston, 1931 | Lamiaceae | NA | Ph | Ex | - | + | - |
| 196 | Syzygium manii (King) N. P. Balakrishnan | Lamiaceae | NA | Ph | Ex | - | + | - |
| 197 | Tabernaemontana divaricata (L.) R.Br. ex Roem. & Schult., 1819 | Apocynaceae | NA | Hem | Ex | - | - | + |
| 198 | Tagetes erecta L., 1753 | Asteraceae | NA | Ch | Ex | - | - | + |
| 199 | Tectona grandis L.f., 1782 | Lamiaceae | EN | Ph | Ex | - | + | - |
| 200 | Terminalia catappa L., 1767 | Combretaceae | LC | Ph | Ex | + | + | + |
| 201 | Terminalia ivorensis A.Chev., 1909 | Combretaceae | VU | Ph | Ex | - | + | - |
| 202 | Terminalia superba Engl. & Diels, 1899 | Combretaceae | NA | Ph | Ex | - | + | - |
| 203 | Theobroma cacao L., 1753 | Malvaceae | NA | Ph | Ex | - | + | - |
| 204 | Thyrsacanthus tubaeformis (Bertol.) Nees, 1847 | Acanthaceae | NA | Ph | Ex | - | - | + |
| 205 | Tithonia diversifolia (Hemsl.) A.Gray, 1883 | Asteraceae | NA | Ph | Ex | - | - | + |
| 206 | Tradescantia fluminensis Vell., 1829 | Commelinaceae | NA | Ch | Ex | - | - | + |
| 207 | Tradescantia pallida (Rose) D.R.Hunt, 1976 | Commelinaceae | NA | Ch | Ex | - | - | + |
| 208 | Tradescantia zebrina hort. ex Bosse, 1849 | Commelinaceae | NA | Ph | Ex | - | - | + |
| 209 | Treculia africana Decne. ex Trécul | Moraceae | LC | Ph | Ex | - | + | - |
| 210 | Uapaca esculenta A. Chev. ex Aubrév. & Leandri | Phyllanthaceae | LC | Ph | Ex | - | + | - |
| 211 | Umbellularia californica (Hook. & Arn.) Nutt., 1842 | Lauraceae | LC | Ph | Ex | - | - | + |
| 212 | Vachellia karroo (Hayne) Banfi & Galasso | Fabaceae | LC | Ph | Ex | - | + | - |
| 213 | Vernonia amygdalina Delile | Asteraceae | NA | Ph | Na | - | + | - |
| 214 | Vitex trifolia L., 1753 | Lamiaceae | NA | Ph | Ex | - | + | - |
| 215 | Volkameria inermis L., 1753 | Lamiaceae | NA | Ph | Ex | - | - | + |
| 216 | Yucca gigantea Lem., 1859 | Asparagaceae | DD | Ph | Ex | - | - | + |
| 217 | Zamioculcas zamiifolia (Lodd.) Engl., 1905 | Araceae | NA | Ph | Ex | - | - | + |
| 218 | Zantedeschia aethiopica (L.) Spreng., 1826 | Araceae | LC | Ph | Ex | - | - | + |
| 219 | Zephyranthes longifolia Hemsl. | Amaryllidaceae | NA | Ph | Ex | - | - | + |
| 220 | Zinnia elegans Jacq., 1792 | Asteraceae | NA | Ph | Ex | - | - | + |
References
- Bogaert, J.; Vranken, I.; André, M. Anthropogenic Effects in Landscapes: Historical Context and Spatial Pattern. In Biocultural Landscapes; Hong, S.-K., Bogaert, J., Min, Q., Eds.; Springer Netherlands: Dordrecht, 2014; pp. 89–112 ISBN 978-94-017-8940-0.
- Muteya, H.K.; Nghonda, D.-D.N.; Malaisse, F.; Waselin, S.; Sambiéni, K.R.; Kaleba, S.C.; Kankumbi, F.M.; Bastin, J.-F.; Bogaert, J.; Sikuzani, Y.U. Quantification and Simulation of Landscape Anthropization around the Mining Agglomerations of Southeastern Katanga (DR Congo) between 1979 and 2090. Land 2022, 11, 850. [CrossRef]
- Andre, M.; Mahy, G.; Lejeune, P.; Bogaert, J. Vers Une Synthèse de La Conception et Une Définition Des Zones Dans Le Gradient Urbain-Rural. Biotechnologie Agronomie Société Environnement 2014, 18.
- Gutu Sakketa, T. Urbanisation and Rural Development in Sub-Saharan Africa: A Review of Pathways and Impacts. Research in Globalization 2023, 6, 100133. [CrossRef]
- Suarez-Rubio, M.; Bates, P.J.J.; Aung, T.; Hlaing, N.M.; Oo, S.S.L.; Htun, Y.K.Z.; Mar, S.M.O.; Myint, A.; Wai, T.L.L.; Mo, P.M.; et al. Bird Diversity along an Urban to Rural Gradient in Large Tropical Cities Peaks in Mid-Level Urbanization. PeerJ 2023, 11, e16098. [CrossRef]
- World Urbanization Prospects The 2018 Revision.
- Damon, J. Peuplement, migrations, urbanisation:Où va la population mondiale ? Population & Avenir 2016, 728, 4–7. [CrossRef]
- Guo, H.; Qiao, W.; Liu, J. Dynamic Feedback Analysis of Influencing Factors of Existing Building Energy-Saving Renovation Market Based on System Dynamics in China. Sustainability 2019, 11, 273. [CrossRef]
- Bogaert, J.; Biloso, A.; I., V.; Andre, M. Peri-Urban Dynamics: Landscape Ecology Perspectives. In; 2015; pp. 63–73 ISBN 978-2-87016-136-4.
- Huang, H.; Zhuo, L.; Li, Z.; Ji, X.; Wu, P. Effects of Multidimensional Urbanisation on Water Footprint Self-Sufficiency of Staple Crops in China. Journal of Hydrology 2023, 618, 129275. [CrossRef]
- Power, A.L.; Tennant, R.K.; Jones, R.T.; Tang, Y.; Du, J.; Worsley, A.T.; Love, J. Monitoring Impacts of Urbanisation and Industrialisation on Air Quality in the Anthropocene Using Urban Pond Sediments. Front. Earth Sci. 2018, 6. [CrossRef]
- Useni Sikuzani, Y.; Malaisse, F.; Cabala Kaleba, S.; Kalumba Mwanke, A.; Yamba, A.M.; Nkuku Khonde, C.; Bogaert, J.; Munyemba Kankumbi, F. Tree Diversity and Structure on Green Space of Urban and Peri-Urban Zones: The Case of Lubumbashi City in the Democratic Republic of Congo. Urban Forestry & Urban Greening 2019, 41, 67–74. [CrossRef]
- Abdulai, I.; Osumanu, I. How Urbanisation Shapes Availability of Provisioning Ecosystem Services in Peri-Urban Ghana. International Journal of Urban Sustainable Development 2023, 15, 282–298. [CrossRef]
- Kraemer, R.; Kabisch, N. Parks Under Stress: Air Temperature Regulation of Urban Green Spaces Under Conditions of Drought and Summer Heat. Front. Environ. Sci. 2022, 10, 849965. [CrossRef]
- Li, G.; Fang, C.; Li, Y.; Wang, Z.; Sun, S.; He, S.; Qi, W.; Bao, C.; Ma, H.; Fan, Y.; et al. Global Impacts of Future Urban Expansion on Terrestrial Vertebrate Diversity. Nat Commun 2022, 13, 1628. [CrossRef]
- Threlfall, C.; Mata, L.; Mackie, J.; Hahs, A.; Stork, N.; Williams, N.; Livesley, S. Increasing Biodiversity in Urban Green Spaces through Simple Vegetation Interventions. Journal of Applied Ecology 2017, 54. [CrossRef]
- Carter, E.J. L’avenir de La Foresterie Urbaine Dans Les Pays En Développement : Un Document de Réflexion. Available online: https://www.fao.org/4/t1680f/t1680f00.htm (accessed on 4 October 2024).
- Aram, F.; Higueras Garcia, E.; Solgi, E.; Mansournia, S. Urban Green Space Cooling Effect in Cities. Heliyon 2019, 5, 1339. [CrossRef]
- Wolch, J.R.; Byrne, J.; Newell, J.P. Urban Green Space, Public Health, and Environmental Justice: The Challenge of Making Cities ‘Just Green Enough.’ Landscape and Urban Planning 2014, 125, 234–244. [CrossRef]
- Kothencz, G.; Kolcsár, R.; Cabrera-Barona, P.; Szilassi, P. Urban Green Space Perception and Its Contribution to Well-Being. Int J Environ Res Public Health 2017, 14, 766. [CrossRef]
- Kondo, M.C.; Fluehr, J.M.; McKeon, T.; Branas, C.C. Urban Green Space and Its Impact on Human Health. Int J Environ Res Public Health 2018, 15, 445. [CrossRef]
- Yilma, G.; Derero, A. Carbon Stock and Woody Species Diversity Patterns in Church Forests along Church Age Gradient in Addis Ababa, Ethiopia. Urban Ecosystems 2020, 23. [CrossRef]
- Neal, S.; Bennett, K.; Jones, H.; Cochrane, A.; Mohan, G. Multiculture and Public Parks: Researching Super-Diversity and Attachment in Public Green Space. Population, Space and Place 2015, 21, 463–475. [CrossRef]
- Shen, Y.; Sun, F.; Che, Y. Public Green Spaces and Human Wellbeing: Mapping the Spatial Inequity and Mismatching Status of Public Green Space in the Central City of Shanghai. Urban forestry & urban greening 2017, 27, 59–68. [CrossRef]
- You, H. Characterizing the Inequalities in Urban Public Green Space Provision in Shenzhen, China. Habitat International 2016, 56, 176–180. [CrossRef]
- Li, X.; Huang, Y.; Ma, X. Evaluation of the Accessible Urban Public Green Space at the Community-Scale with the Consideration of Temporal Accessibility and Quality. Ecological Indicators 2021, 131, 108231. [CrossRef]
- Xiao, Y.; li, Z.; Webster, C. Estimating the Mediate Effect of Privately Green Space on the Relationship between Urban Public Green Space and Property Value: Evidence from Shanghai, China. Land Use Policy 2016, 54, 439–447. [CrossRef]
- Poortinga, W.; Bird, N.; Hallingberg, B.; Phillips, R.; Williams, D. The Role of Perceived Public and Private Green Space in Subjective Health and Wellbeing during and after the First Peak of the COVID-19 Outbreak. Landscape and Urban Planning 2021, 211, 104092. [CrossRef]
- Hanson, H.I.; Eckberg, E.; Widenberg, M.; Alkan Olsson, J. Gardens’ Contribution to People and Urban Green Space. Urban Forestry & Urban Greening 2021, 63, 127198. [CrossRef]
- Hutt-Taylor, K. Assessing Urban Tree Taxonomic Diversity, Composition and Structure across Public and Private Green Space Types: A Community-Based Tree Inventory. masters, Concordia University, 2021.
- Useni Sikuzani, Y.U.; Kalonda, B.K.; Mukenza, M.M.; Mleci, J.Y.; Kalenga, A.M.; Malaisse, F.; Bogaert, J. Exploring Floristic Diversity, Propagation Patterns and Plant Functions in Domestic Gardens Across Urban Planning Gradient in Lubumbashi, DR Congo. 2024.
- Lubbe, C.S.; Siebert, S.J.; Cilliers, S.S. Floristic Analysis of Domestic Gardens in the Tlokwe City Municipality, South Africa. Bothalia 2011, 41, 351–361. [CrossRef]
- Al-Kofahi, S.D.; Al-Kafawin, A.M.; Al-Gharaibeh, M.M. Investigating Domestic Gardens Landscape Plant Diversity, Implications for Valuable Plant Species Conservation. Environ Dev Sustain 2023, 26, 21259–21279. [CrossRef]
- Useni Sikuzani, Y.; Malaisse, F.; Cabala Kaleba, S.; Kalumba Mwanke, A.; Yamba, A.M.; Nkuku Khonde, C.; Bogaert, J.; Munyemba Kankumbi, F. Tree Diversity and Structure on Green Space of Urban and Peri-Urban Zones: The Case of Lubumbashi City in the Democratic Republic of Congo. Urban Forestry & Urban Greening 2019, 41, 67–74. [CrossRef]
- Useni Sikuzani, Y.; Mpibwe Kalenga, A.; Yona Mleci, J.; N’Tambwe Nghonda, D.; Malaisse, F.; Bogaert, J. Assessment of Street Tree Diversity, Structure and Protection in Planned and Unplanned Neighborhoods of Lubumbashi City (DR Congo). Sustainability 2022, 14, 3830. [CrossRef]
- Musanganya, D. La matrice intellectuelle du catholicisme social face à l’Etat faible au Congo ( RDC) entre 1990 et 2018. phdthesis, Université Paris-Est, 2023.
- André, G.; Poncelet, M. Héritage Colonial et Appropriation Du Pouvoir d’éduquer. Approche Socio-Historique Du Champ de l’éducation Primaire En RDC. Cahiers de la recherche sur léducation et les savoirs 2013, 2, 271.
- Kasangana, A.C. L’église catholique et le Congo « belge » : approche historico-juridique des relations institutionnelles (1885-1960). phdthesis, Université Paris-Saclay, 2022.
- G, H.; B, T.; F, Y.; I, Y. Diversité et Connaissance Ethnobotanique Des Espèces Végétales de La Forêt Sacrée de Badjamè et Zones Connexes Au Sud-Ouest Du Benin. Revue Scientifique et Technique Forêt et Environnement du Bassin du Congo 2016, 7, 28–36. [CrossRef]
- Kaczyńska, M. The Church Garden as an Element Improving the Quality of City Life – A Case Study in Warsaw. Urban Forestry & Urban Greening 2020, 54, 126765. [CrossRef]
- Statistics of the Catholic Church in the Democratic Republic of the Congo and in South Sudan as of 31 December 2021 (from the Central Office for Church Statistics) Available online: https://press.vatican.va/content/salastampa/en/bollettino/pubblico/2023/01/24/230124d.html (accessed on 4 October 2024).
- Savard, J.-P.L.; Clergeau, P.; Mennechez, G. Biodiversity Concepts and Urban Ecosystems. Landscape and Urban Planning 2000, 48, 131–142. [CrossRef]
- Les Jardins Comme Moyens d’existence Available online: https://www.fao.org/4/y5112f/y5112f00.htm (accessed on 4 October 2024).
- Tremblay, M.-H.; Simard, M. Les effets de proximité dans l’appropriation collective d’un grand parc paysager à saguenay. vertigo 2011, 11.
- Gueymard, S. Facteurs environnementaux de proximité et choix résidentiels. Développement durable et territoires. Économie, géographie, politique, droit, sociologie 2006. [CrossRef]
- Sakhraoui, N.; Metallaoui, S.; Chefrour, A.; Hadef, A. La flore exotique potentiellement envahissante d’Algérie : première description des espèces cultivées en pépinières et dans les jardins. Biotechnol. Agron. Soc. Environ. 2019. [CrossRef]
- PopulationData.net Available online: https://www.populationdata.net/pays/republique-democratique-du-congo/aires-urbaines (accessed on 4 October 2024).
- L’insalubrité Publique et La Santé Environnementale Dans Le District Sanitaire de Bukavu - ISDR BUKAVUISDR BUKAVU Available online: https://isdrbukavu.ac.cd/produit/linsalubrite-publique-et-la-sante-environnementale-dans-le-district-sanitaire-de-bukavu/ (accessed on 4 October 2024).
- United Nations Conférence des Nations Unies sur le logement et le développement urbain durable : Habitat III | Nations Unies Available online: https://www.un.org/fr/conferences/habitat/quito2016 (accessed on 4 October 2024).
- Vwima Ngezirabona, S.; Mastaki, J.-L.; Lebailly, P. Le rôle du commerce frontalier des produits alimentaires avec le Rwanda dans l’approvisionnement des ménages de la ville de Bukavu (province du Sud-Kivu). In Brot, Jean (Ed.) Les Cahiers de l’Association Tiers-Monde n° 28-2013 : XXVIIIes Journées sur le Développement “Mobilités internationales, déséquilibres et développement : vers un développement durable et une mondialisation décarbonée ?” 2013.
- Balasha, A.M.; Murhula, B.B.; Munahua, D.M. Yard Farming in the City of Lubumbashi: Resident Perceptions of Home Gardens in Their Community. Journal of City and Development 2019, 1, 46–53.
- Sêdami, A.B.; Naéssé, A.V.; Julien, D.; Firmin, A.D. Practice of Home Gardens (HG) in the Suburban Area between Cotonou and Ouidah in Southern Benin. 2016.
- Raunkiaer, C. The Life Forms Of Plants And Statistical Plant Geography; The Clarendon Press: Oxford, 1934;
- IUCN Guidelines for Species Conservation Planning : Version 1.0; 2017; ISBN 978-2-8317-1877-4.
- RStudio Team RStudio: Integrated Development for R. RStudio Available online: http://www.rstudio.com/. (accessed on 4 October 2024).
- Logan, M. Biostatistical Design and Analysis Using R: A Practical Guide; 1st ed.; Wiley, 2010; ISBN 978-1-4051-9008-4.
- Pauline Vaissie, Astrid Monge, Francois Husson Factoshiny: Perform Factorial Analysis from “FactoMineR” with a Shiny Application 2015, 2.6.
- Subba, L.; Pala, N.; Shukla, G.; Chakravarty, S. Inventory of Flora in Home Gardens of Sub-Humid Tropical Landscapes, West Bengal, India. 2016, 17, 47–54.
- Regassa, R. Useful Plant Species Diversity in Homegardens and Its Contribution to Household Food Security in Hawassa City, Ethiopia. African Journal of Plant Science 2016, 10, 211–233. [CrossRef]
- Albuquerque, U.P.; Andrade, L.H.C.; Caballero, J. Structure and Floristics of Homegardens in Northeastern Brazil. Journal of Arid Environments 2005, 62, 491–506. [CrossRef]
- Samus, A.; Freeman, C.; Dickinson, K.; van Heezik, Y. An Examination of the Factors Influencing Engagement in Gardening Practices That Support Biodiversity Using the Theory of Planned Behavior. Biological Conservation 2023, 286, 110252. [CrossRef]
- Lemessa, D.; Legesse, A. Non-Crop and Crop Plant Diversity and Determinants in Homegardens of Abay Chomen District, Western Ethiopia. Biodiversity International Journal 2018, 2. [CrossRef]
- Kabir, E.; Webb, E.L. Can Homegardens Conserve Biodiversity in Bangladesh? Biotropica 2008, 40, 95–103. [CrossRef]
- Stein, A.; Gerstner, K.; Kreft, H. Environmental Heterogeneity as a Universal Driver of Species Richness across Taxa, Biomes and Spatial Scales. Ecol Lett 2014, 17, 866–880. [CrossRef]
- Idohou, R.; Fandohan, A.; Salako, V.; Kassa, B.; Gbedomon, R.; Yédomonhan, H.; Glele Kakaï, R.L.; Assogbadjo, A. Biodiversity Conservation in Home Gardens: Traditional Knowledge, Use Patterns and Implications for Management. International Journal of Biodiversity Science and Management 2014, 10. [CrossRef]
- Lepczyk, C.; Aronson, M.; Evans, K.; Goddard, M.; Lerman, S.; MacIvor, J.S. Biodiversity in the City: Fundamental Questions for Understanding the Ecology of Urban Green Spaces for Biodiversity Conservation. BioScience 2017, 67. [CrossRef]
- Souto, T.; Ticktin, T. Understanding Interrelationships Among Predictors (Age, Gender, and Origin) of Local Ecological Knowledge1. Economic Botany 2012, 66. [CrossRef]
- Kumar, B.M.; Nair, P.K.R. The Enigma of Tropical Homegardens. Agroforestry Systems 2004, 61, 135–152. [CrossRef]
- Joscha, B.; Veith, M.; Hochkirch, A. Biodiversity in Cities Needs Space: A Meta-Analysis of Factors Determining Intra-Urban Biodiversity Variation. Ecology Letters 2015, 18. [CrossRef]
- Scheiner, S.M.; Chiarucci, A.; Fox, G.A.; Helmus, M.R.; McGlinn, D.J.; Willig, M.R. The Underpinnings of the Relationship of Species Richness with Space and Time. Ecological Monographs 2011, 81, 195–213. [CrossRef]
- Niklas, K.J. Life Forms, Plants. In Encyclopedia of Ecology; Jørgensen, S.E., Fath, B.D., Eds.; Academic Press: Oxford, 2008; pp. 2160–2167 ISBN 978-0-08-045405-4.
- Nguinambaye, M.; Nana, R.; Mbayngone, E.; Djinet, A.; Badiel, B.; Tamini, Z. Distribution et Usages Des Ampelocissus Dans La Zone de Donia Au Sud Du Tchad. International Journal of Biological and Chemical Sciences 2015, 9, 186. [CrossRef]
- Useni Sikuzani, Y.; Malaisse, F.; Yona, J.M.; Mwamba, T.M.; Bogaert, J. Diversity, Use and Management of Household-Located Fruit Trees in Two Rapidly Developing Towns in Southeastern D.R. Congo. Urban Forestry & Urban Greening 2021, 63, 127220. [CrossRef]
- Vijayakumari, J.; Prabha vasu, S.; Rubi, J.; Raj, T.L.; Rayan, S. Floristic Diversity Assessment of Home Garden in Palayamkottai Region of Tirunelveli District, Tamil Nadu a Means of Sustainable Biodiversity Conservation. International Journal of Trend in Scientific Research and Development 2019, 3, 1484–1491. [CrossRef]
Figure 1.
Location of the three cities studied in the Democratic Republic of Congo with the main types of vegetation: Bukavu in the province of Sout-Kivu, Kisangani in the province of Tshopo and Lubumbashi in the province of Haut-Katanga.
Figure 1.
Location of the three cities studied in the Democratic Republic of Congo with the main types of vegetation: Bukavu in the province of Sout-Kivu, Kisangani in the province of Tshopo and Lubumbashi in the province of Haut-Katanga.
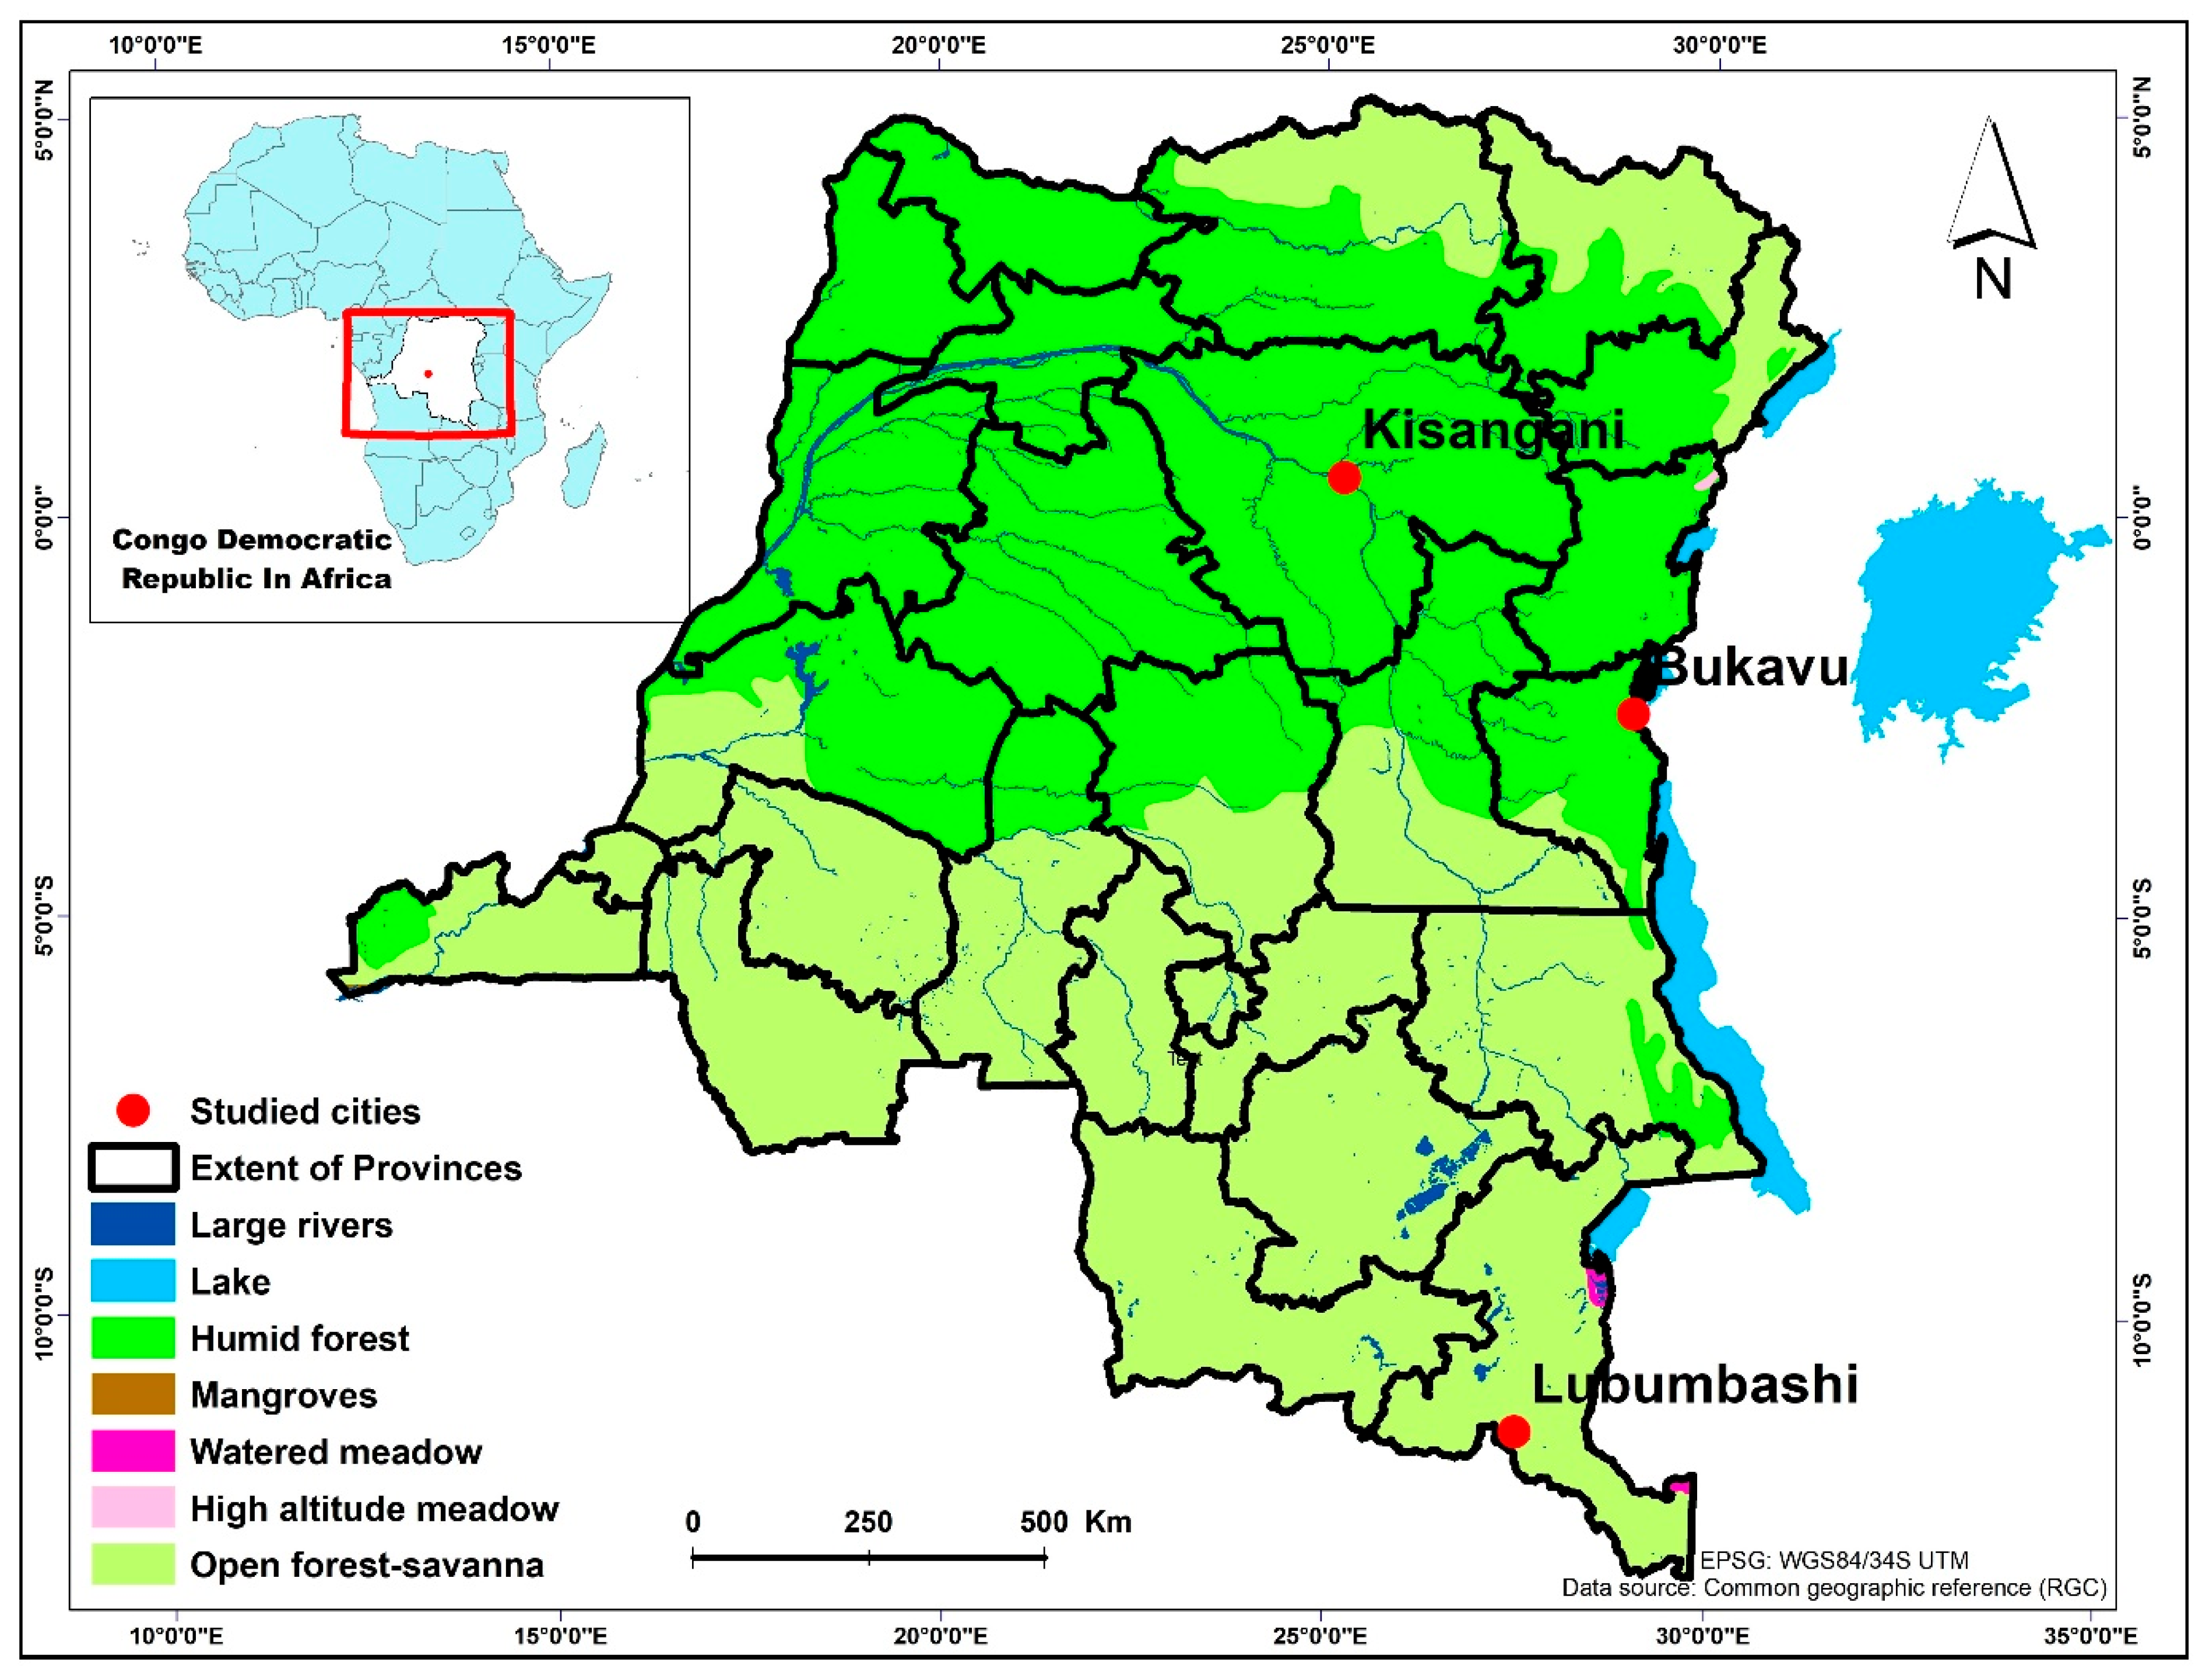
Figure 2.
Biological spectrum or distribution of life form numbers of plant species in all CRGs in each of the three cities studied. Values represent absolute numbers of species identified in all CRGs per city. The result of the Fisher test shows that there is a relationship between the biological spectrum and the city.
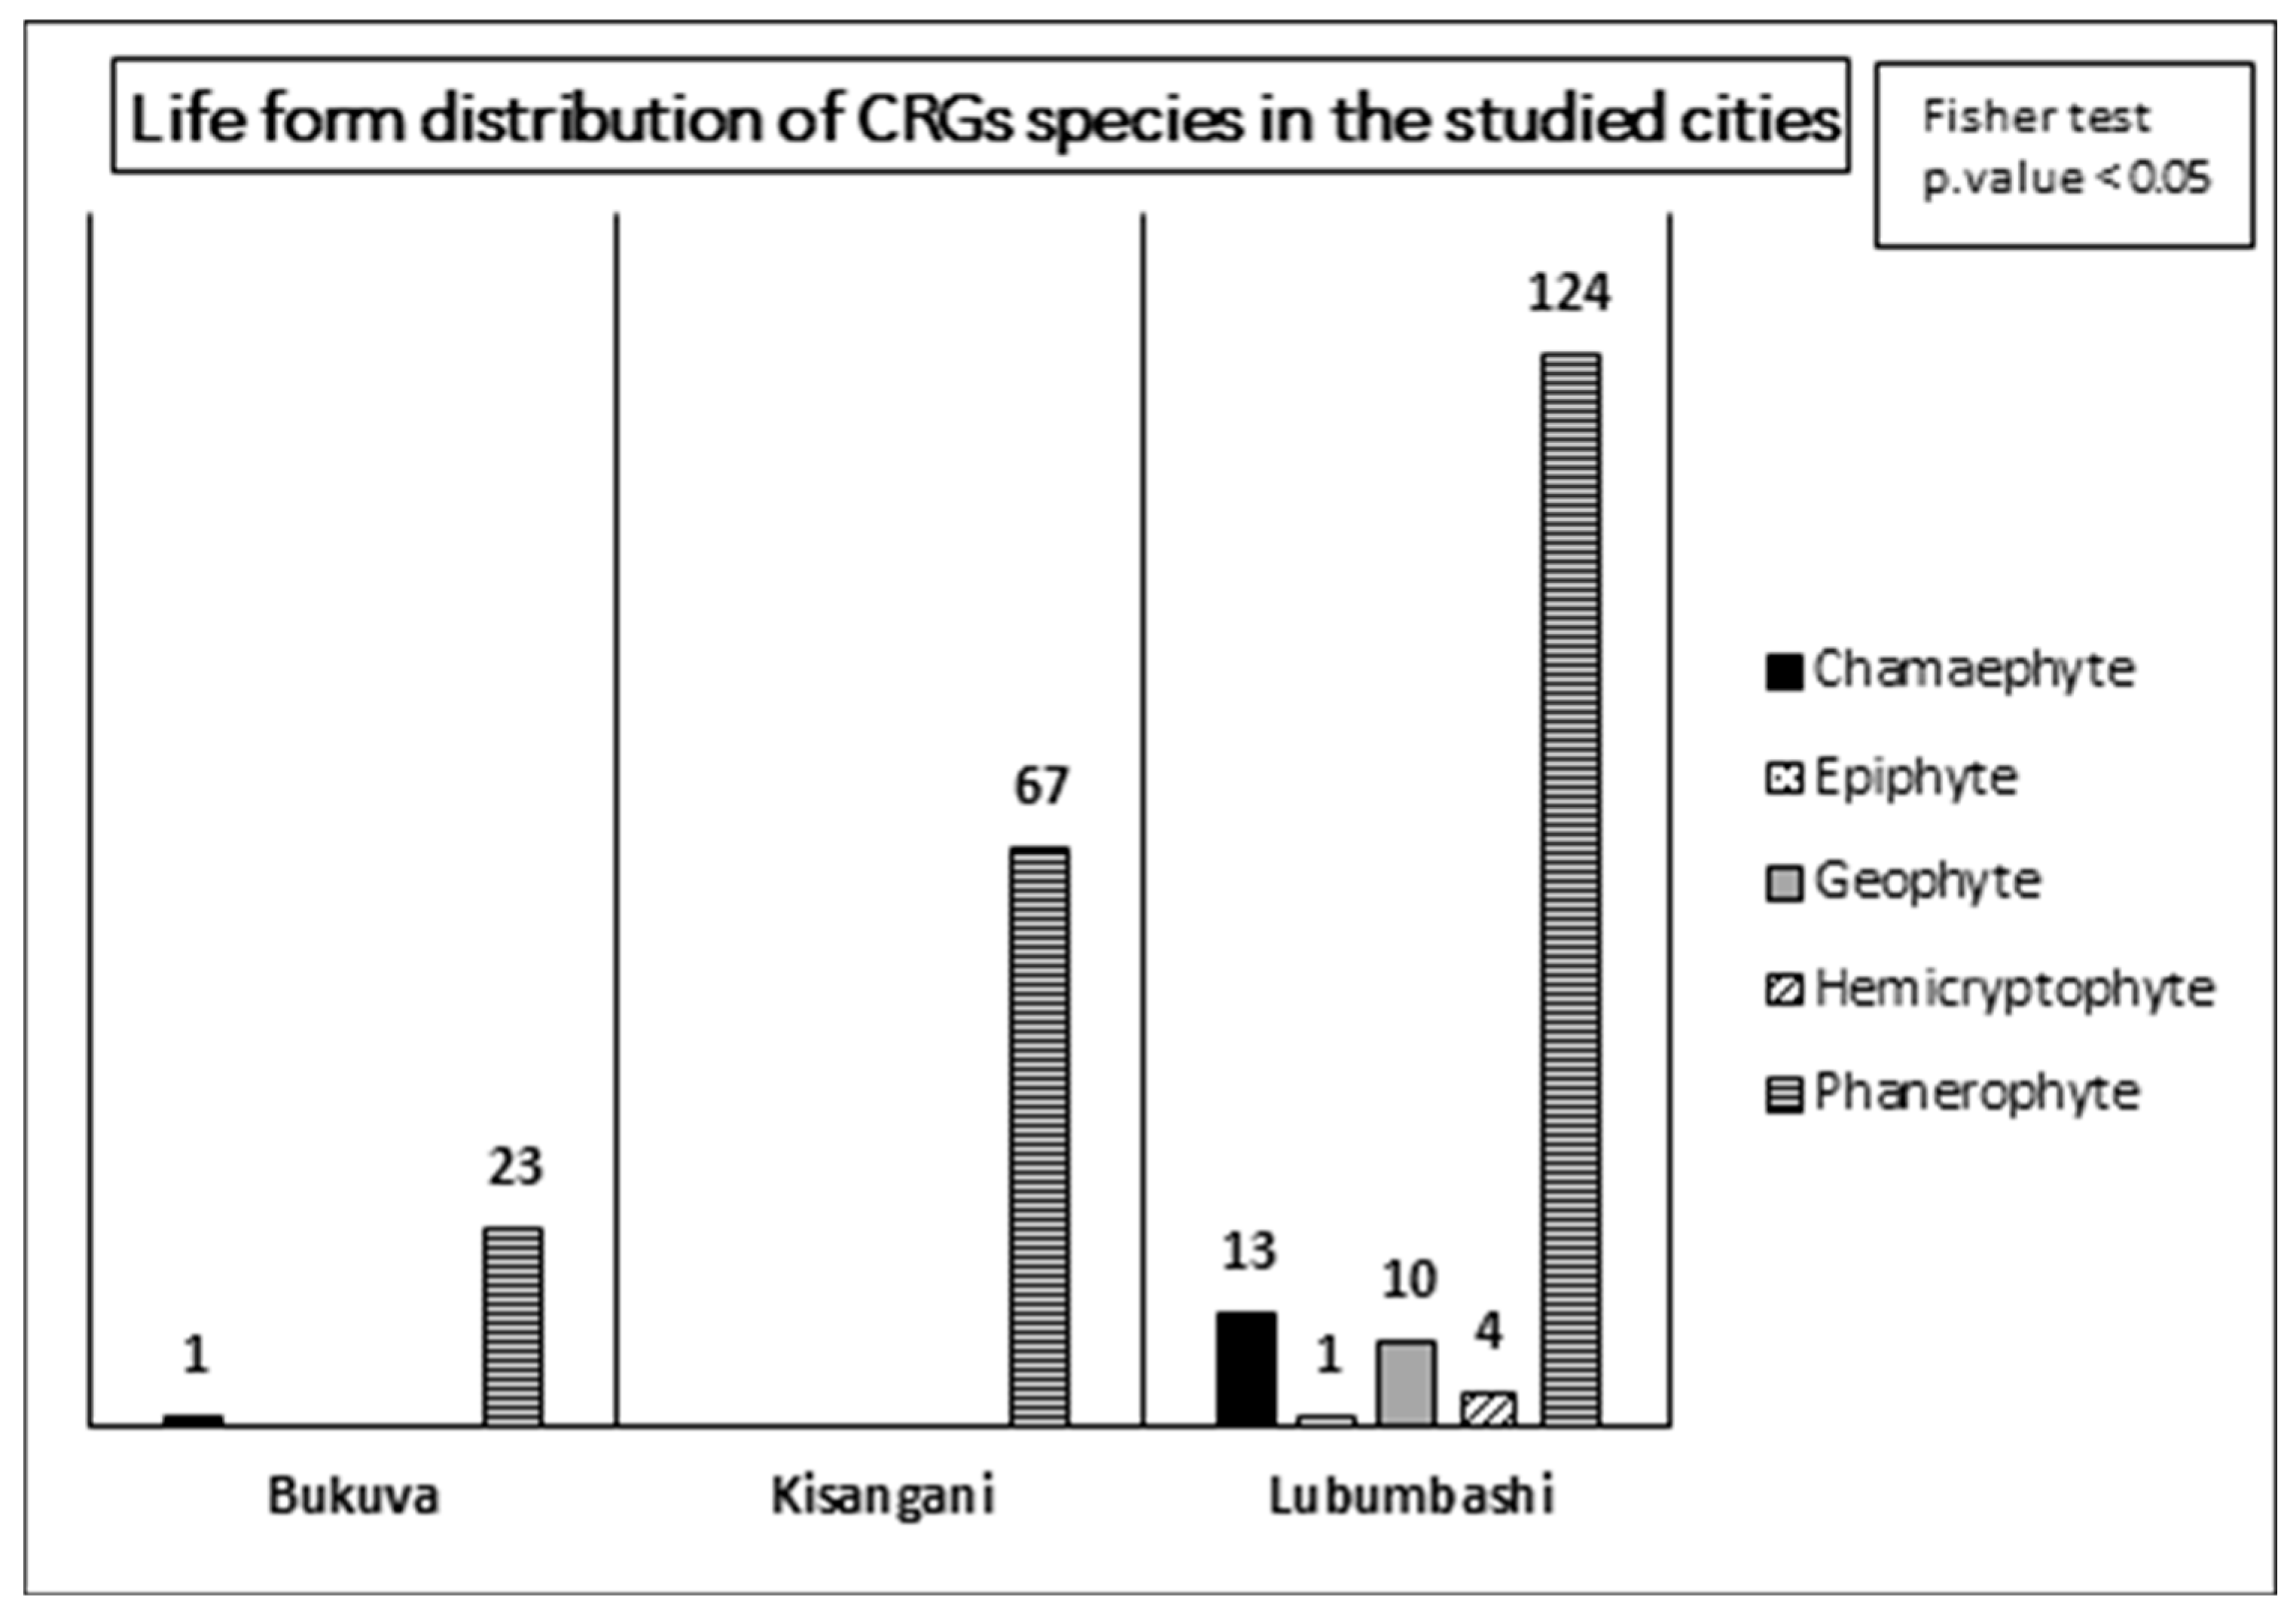
Figure 3.
Results of a hierarchical ascending classification based on multiple correspondence analysis of the CRGs of each of the three cities studied on the basis of presence-absence data for the species identified.
Figure 3.
Results of a hierarchical ascending classification based on multiple correspondence analysis of the CRGs of each of the three cities studied on the basis of presence-absence data for the species identified.
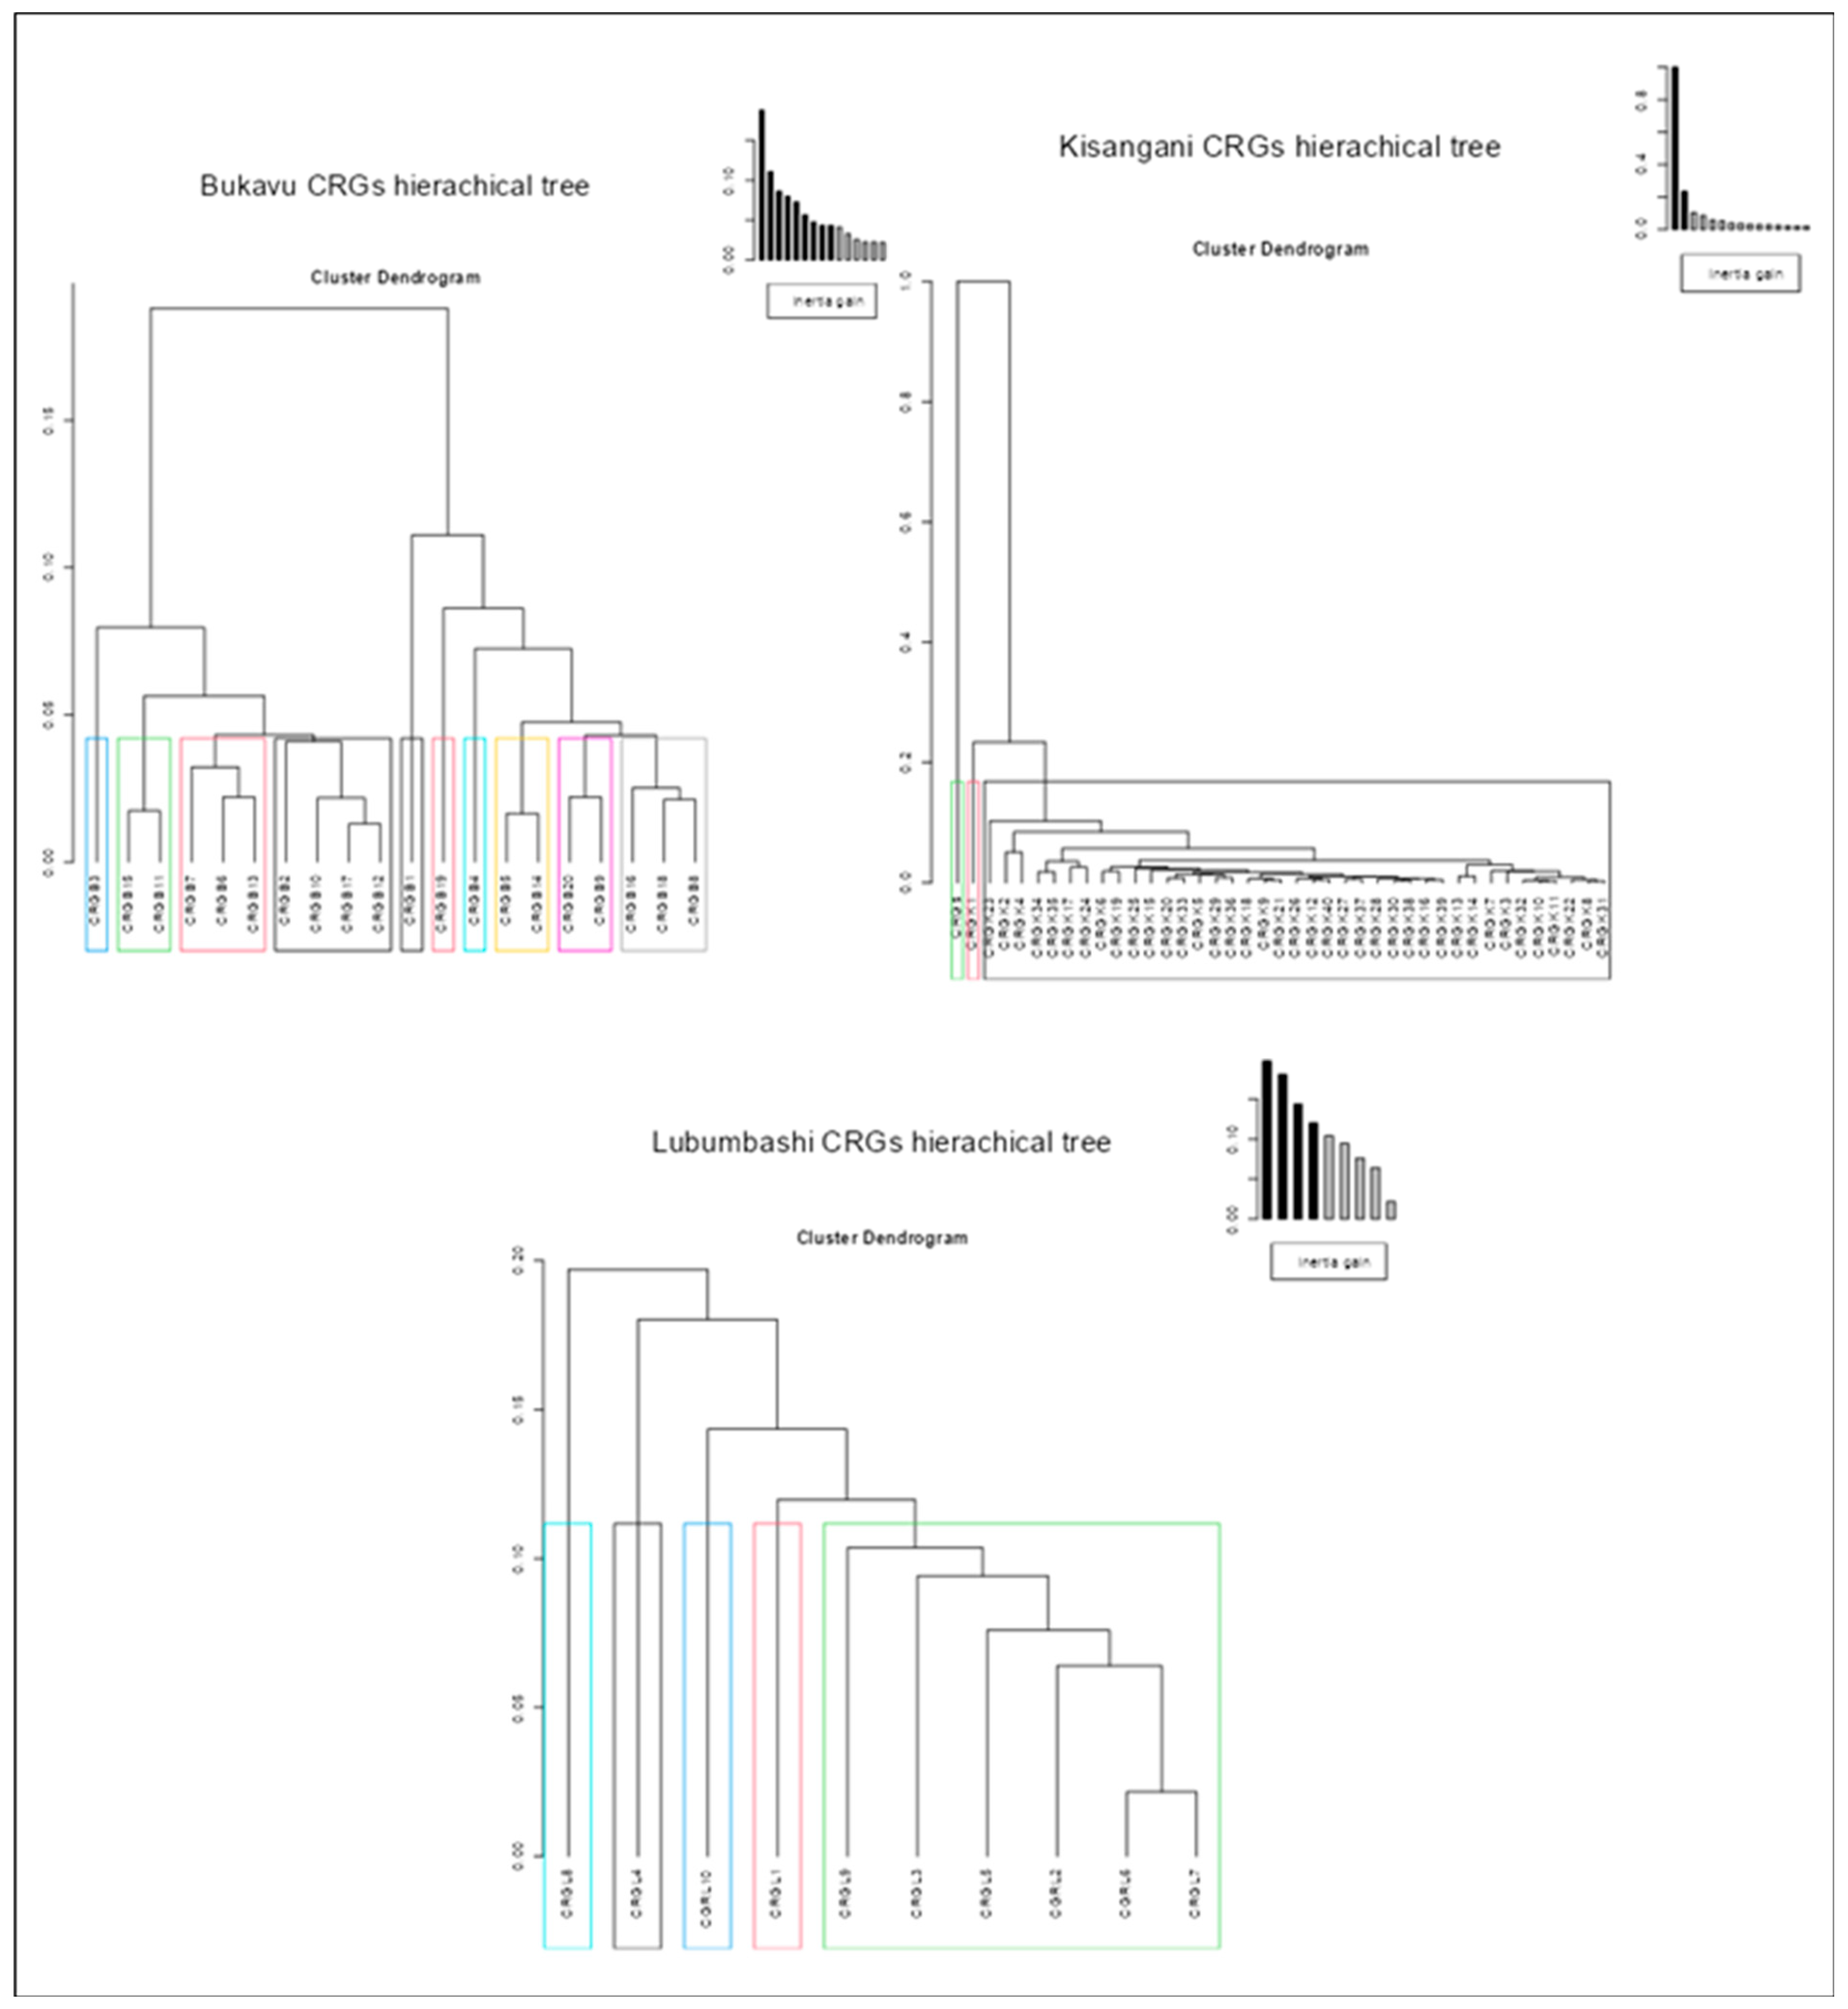
Figure 4.
Results of a hierarchical ascending classification based on multiple correspondence analysis of the CRGs of each of the three cities studied, based on the presence-absence data of the families identified.
Figure 4.
Results of a hierarchical ascending classification based on multiple correspondence analysis of the CRGs of each of the three cities studied, based on the presence-absence data of the families identified.
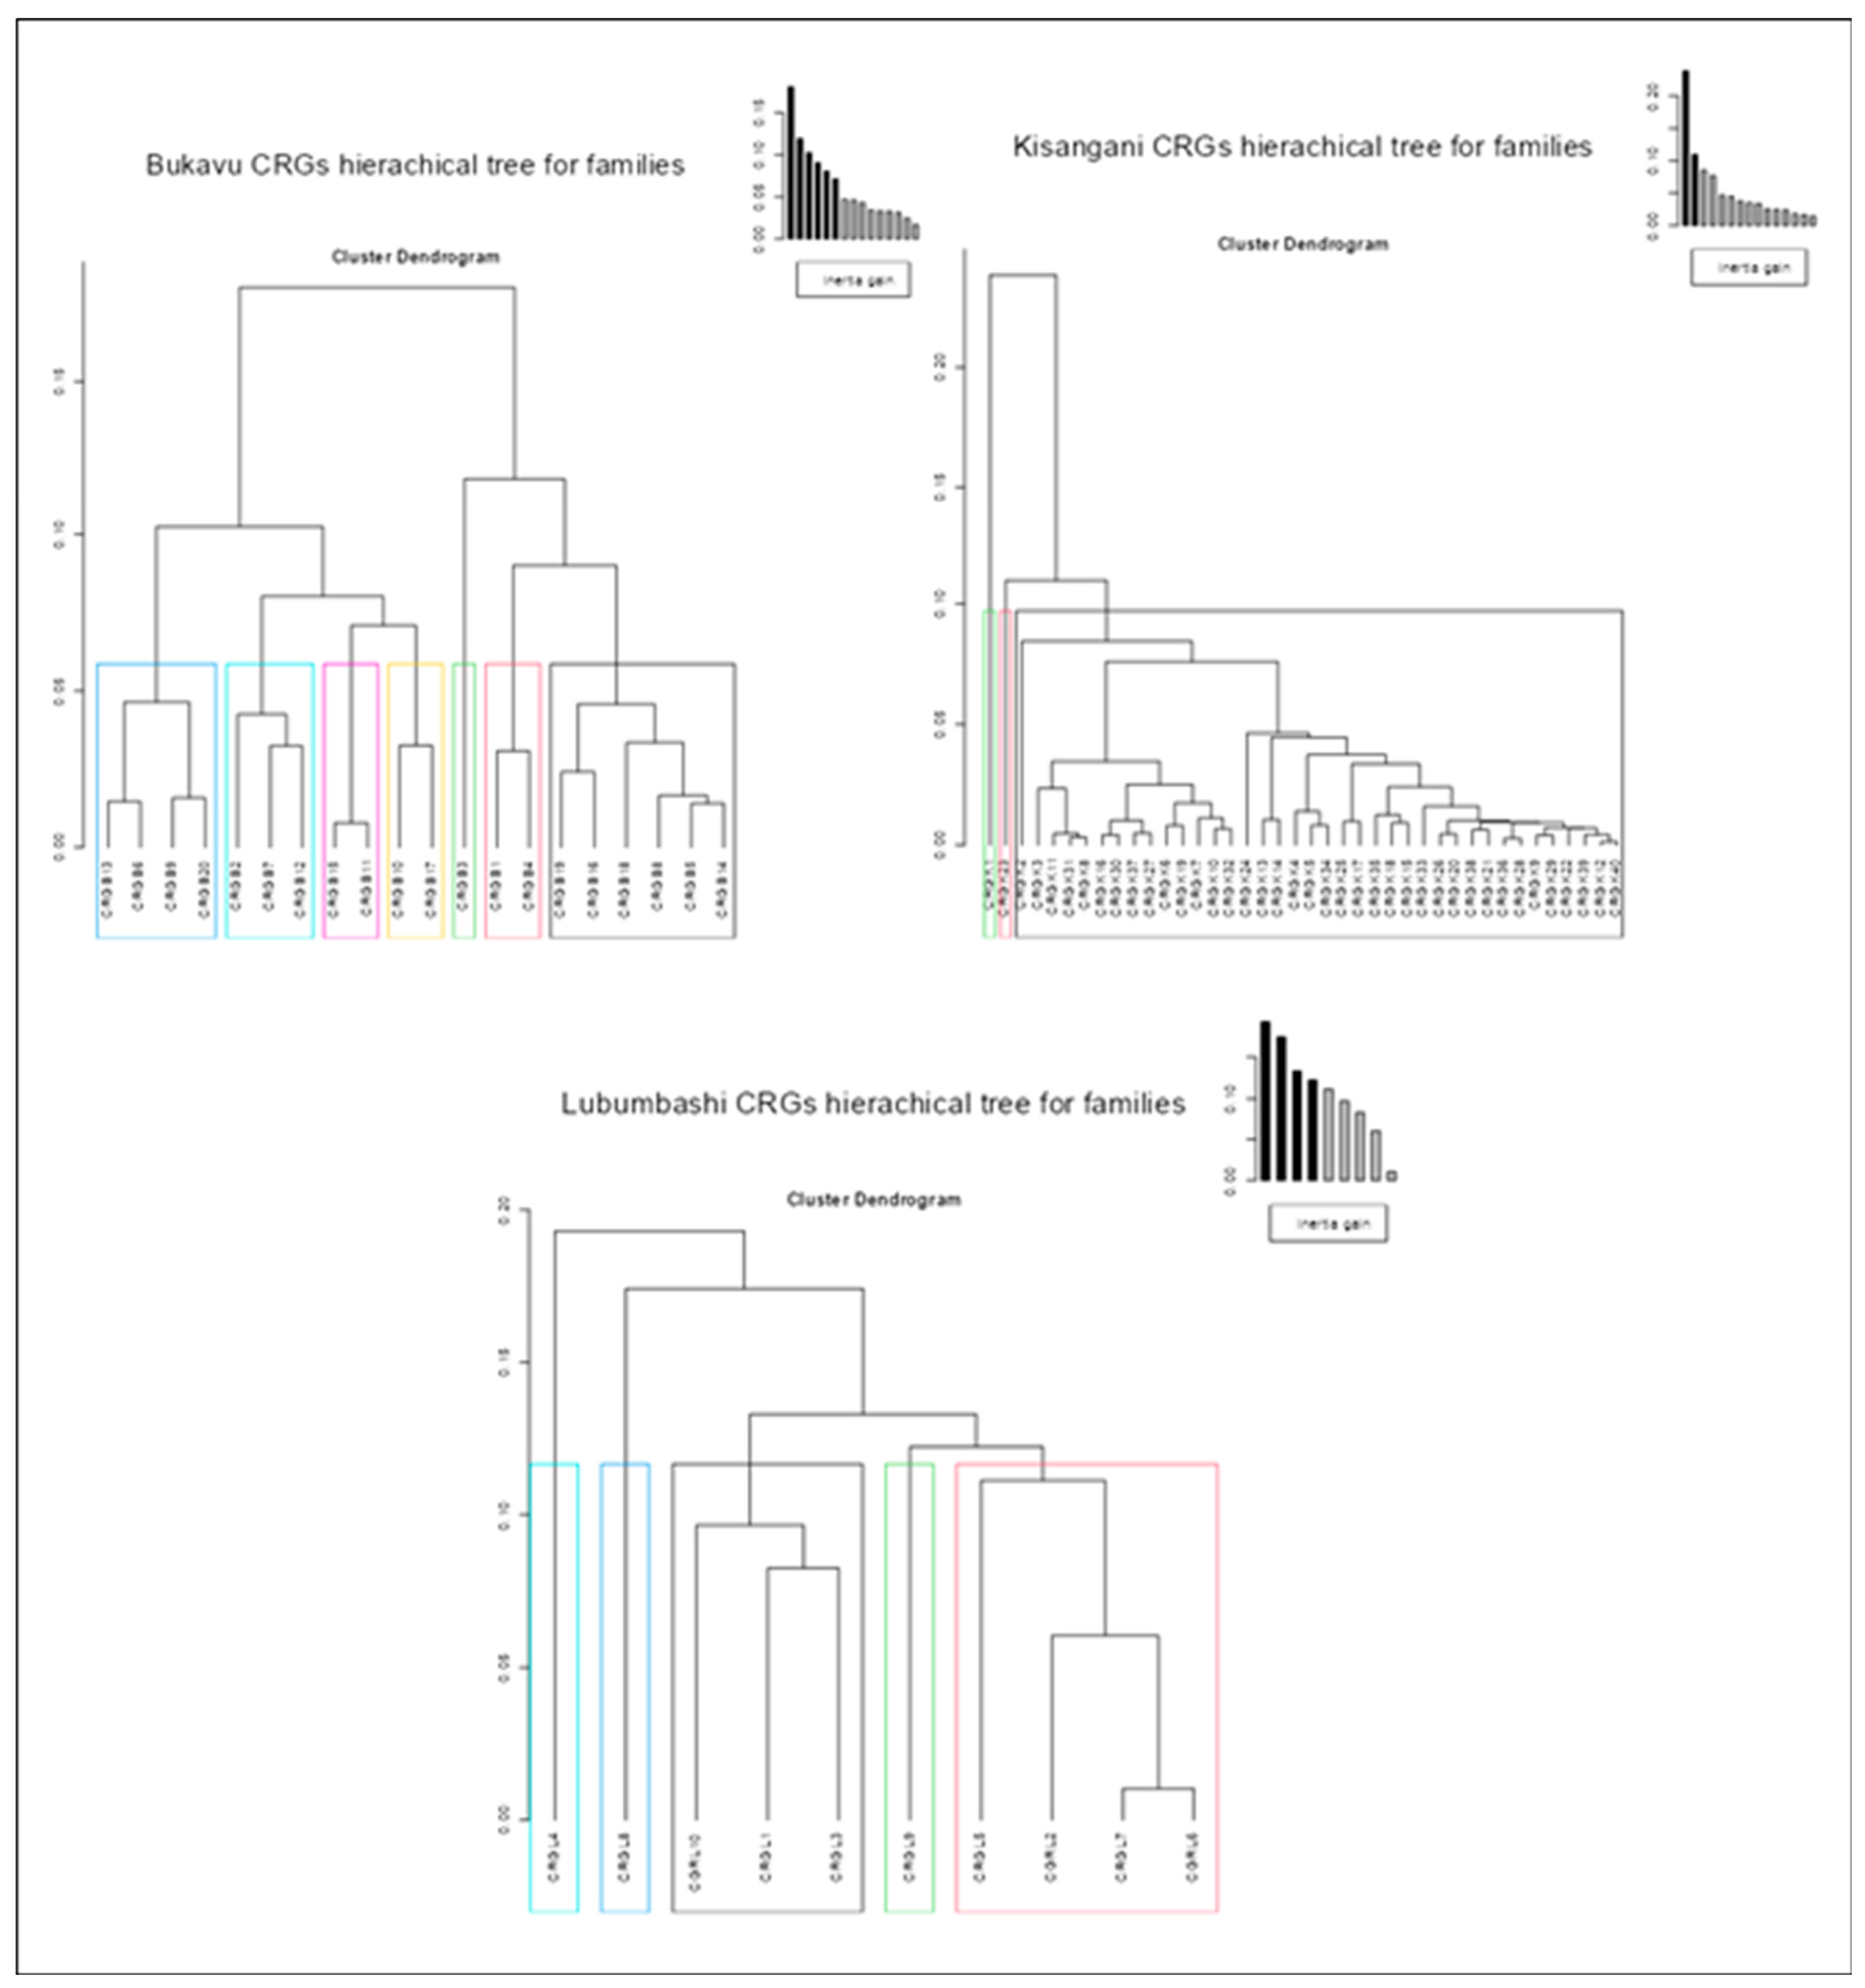
Figure 5.
Results of ascending hierarchical classification on multiple correspondence analysis of CRGs in each of the three cities studied, based on presence-absence data for the genera identified.
Figure 5.
Results of ascending hierarchical classification on multiple correspondence analysis of CRGs in each of the three cities studied, based on presence-absence data for the genera identified.
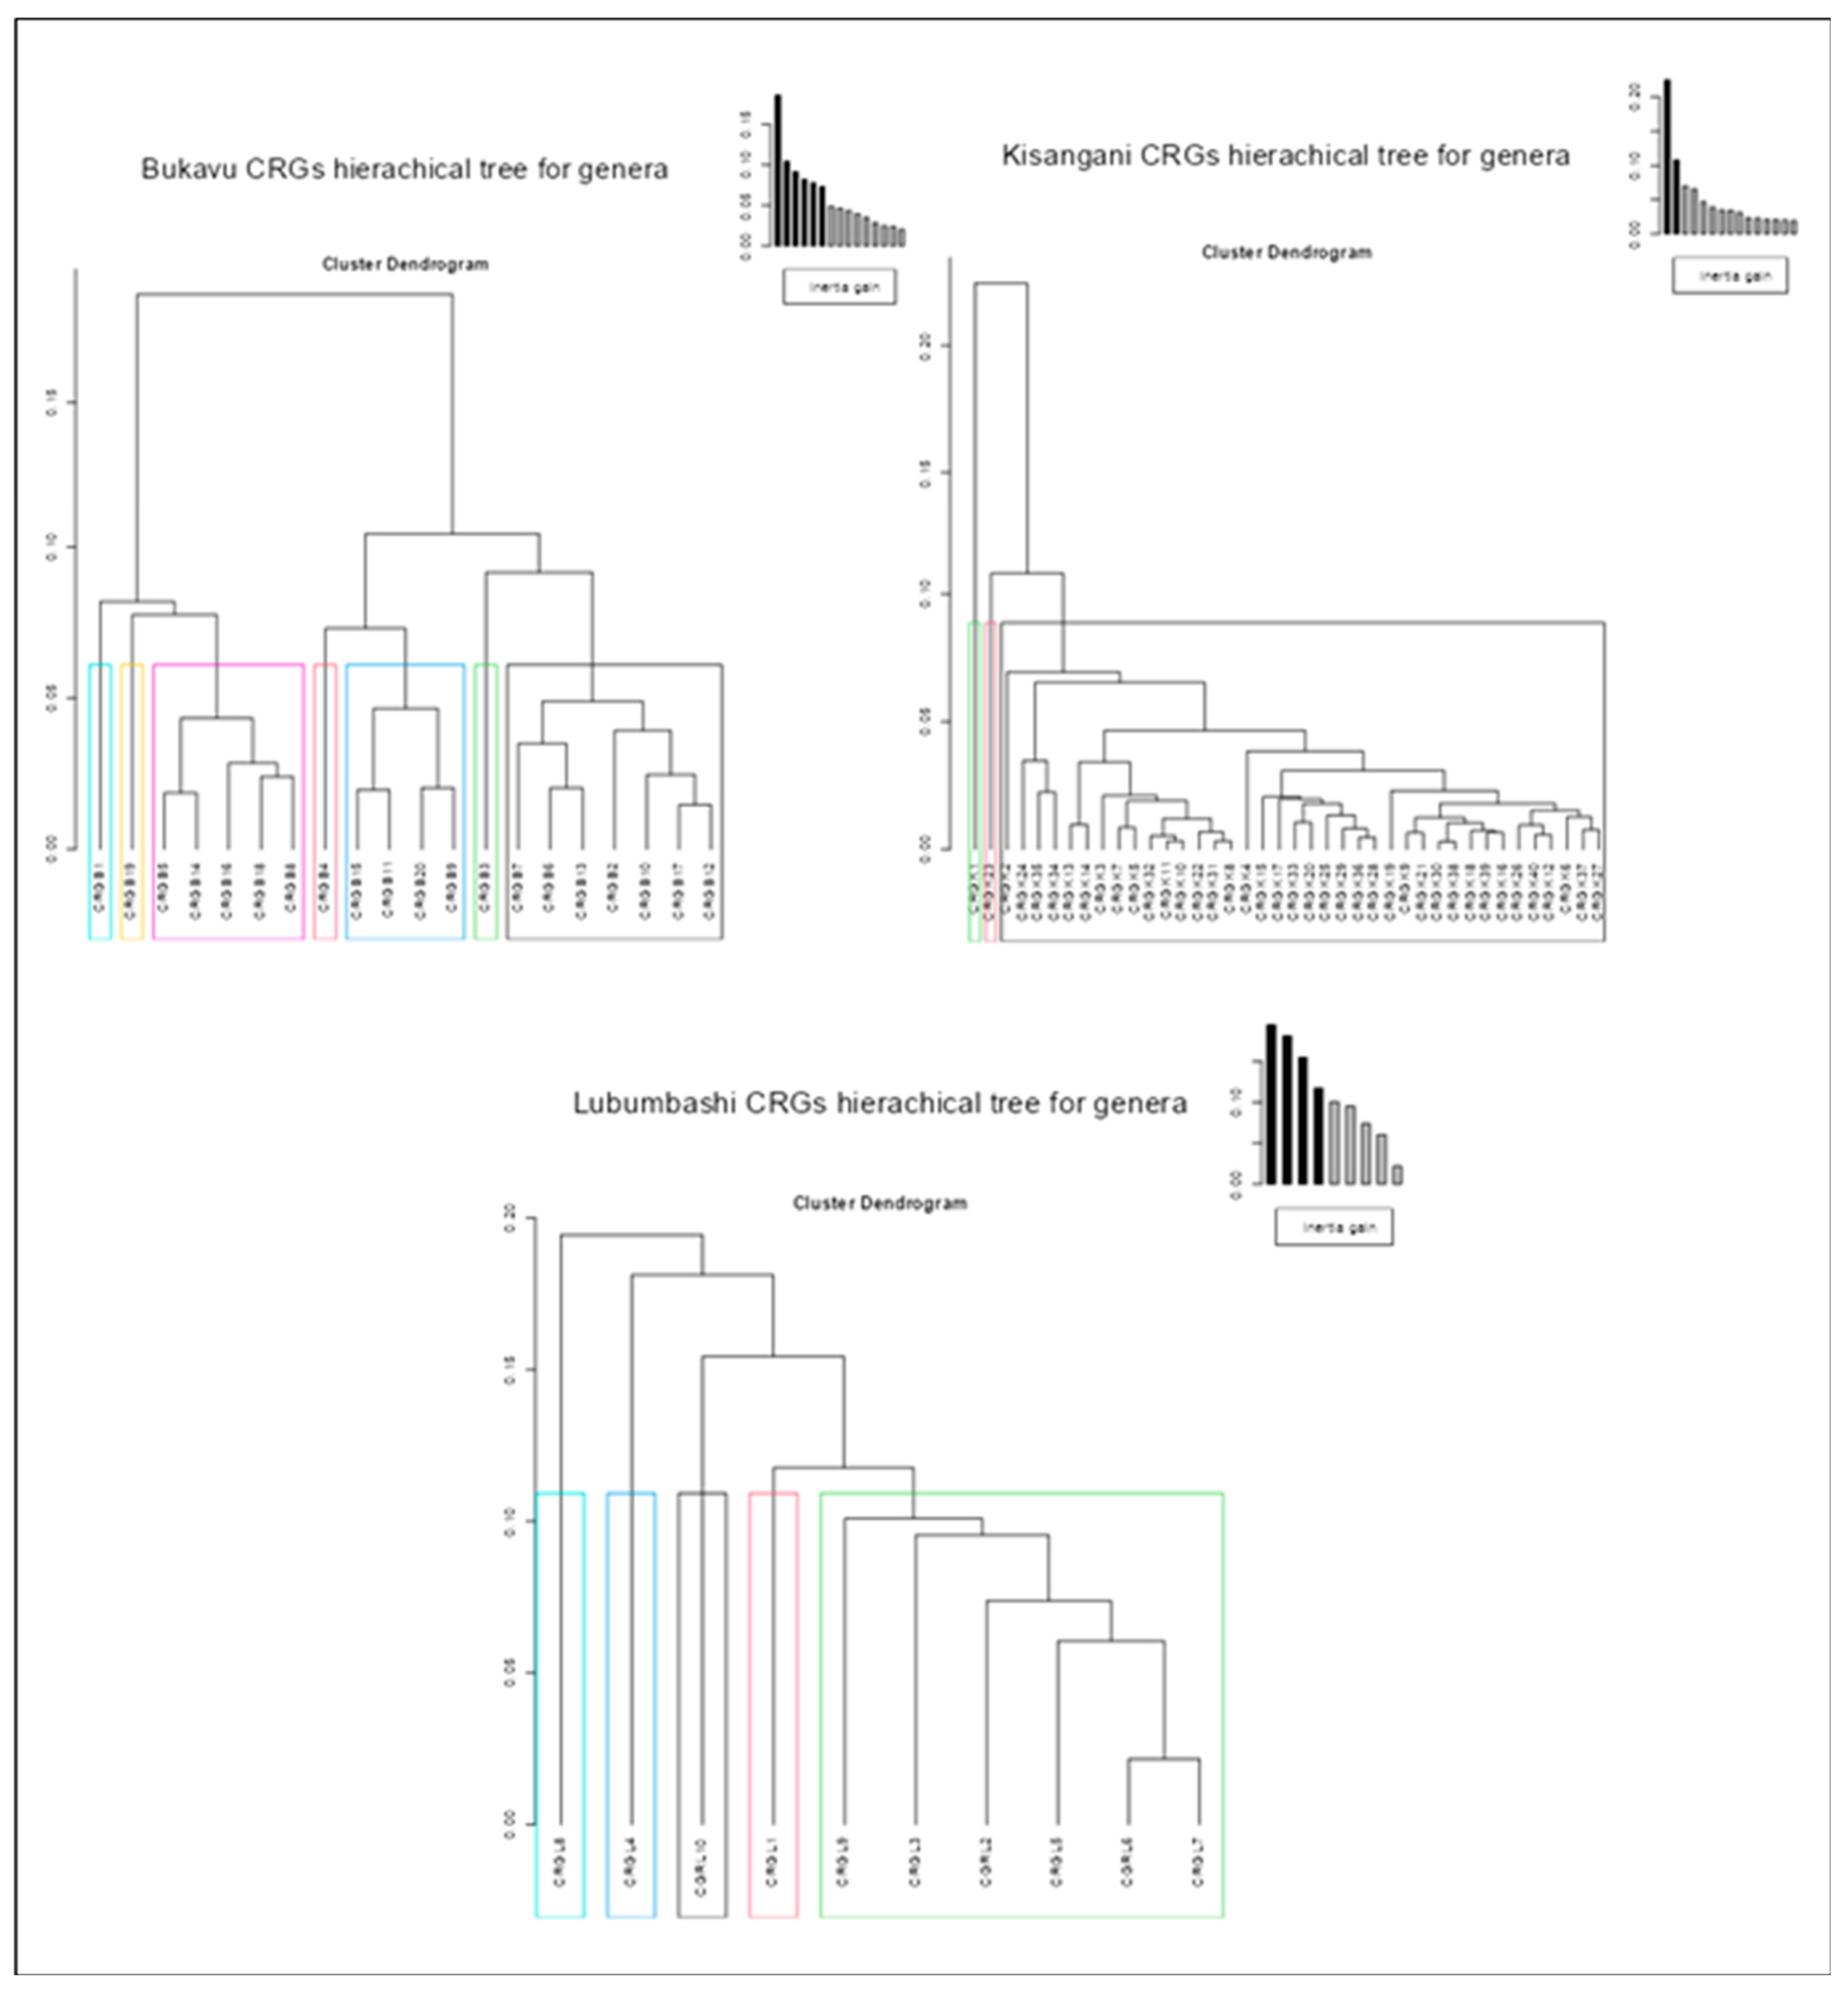
Figure 6.
Results of multiple correspondence analysis between the three cities studied on the basis of the composition of their CRGs in identified species, families and genera.
Figure 6.
Results of multiple correspondence analysis between the three cities studied on the basis of the composition of their CRGs in identified species, families and genera.
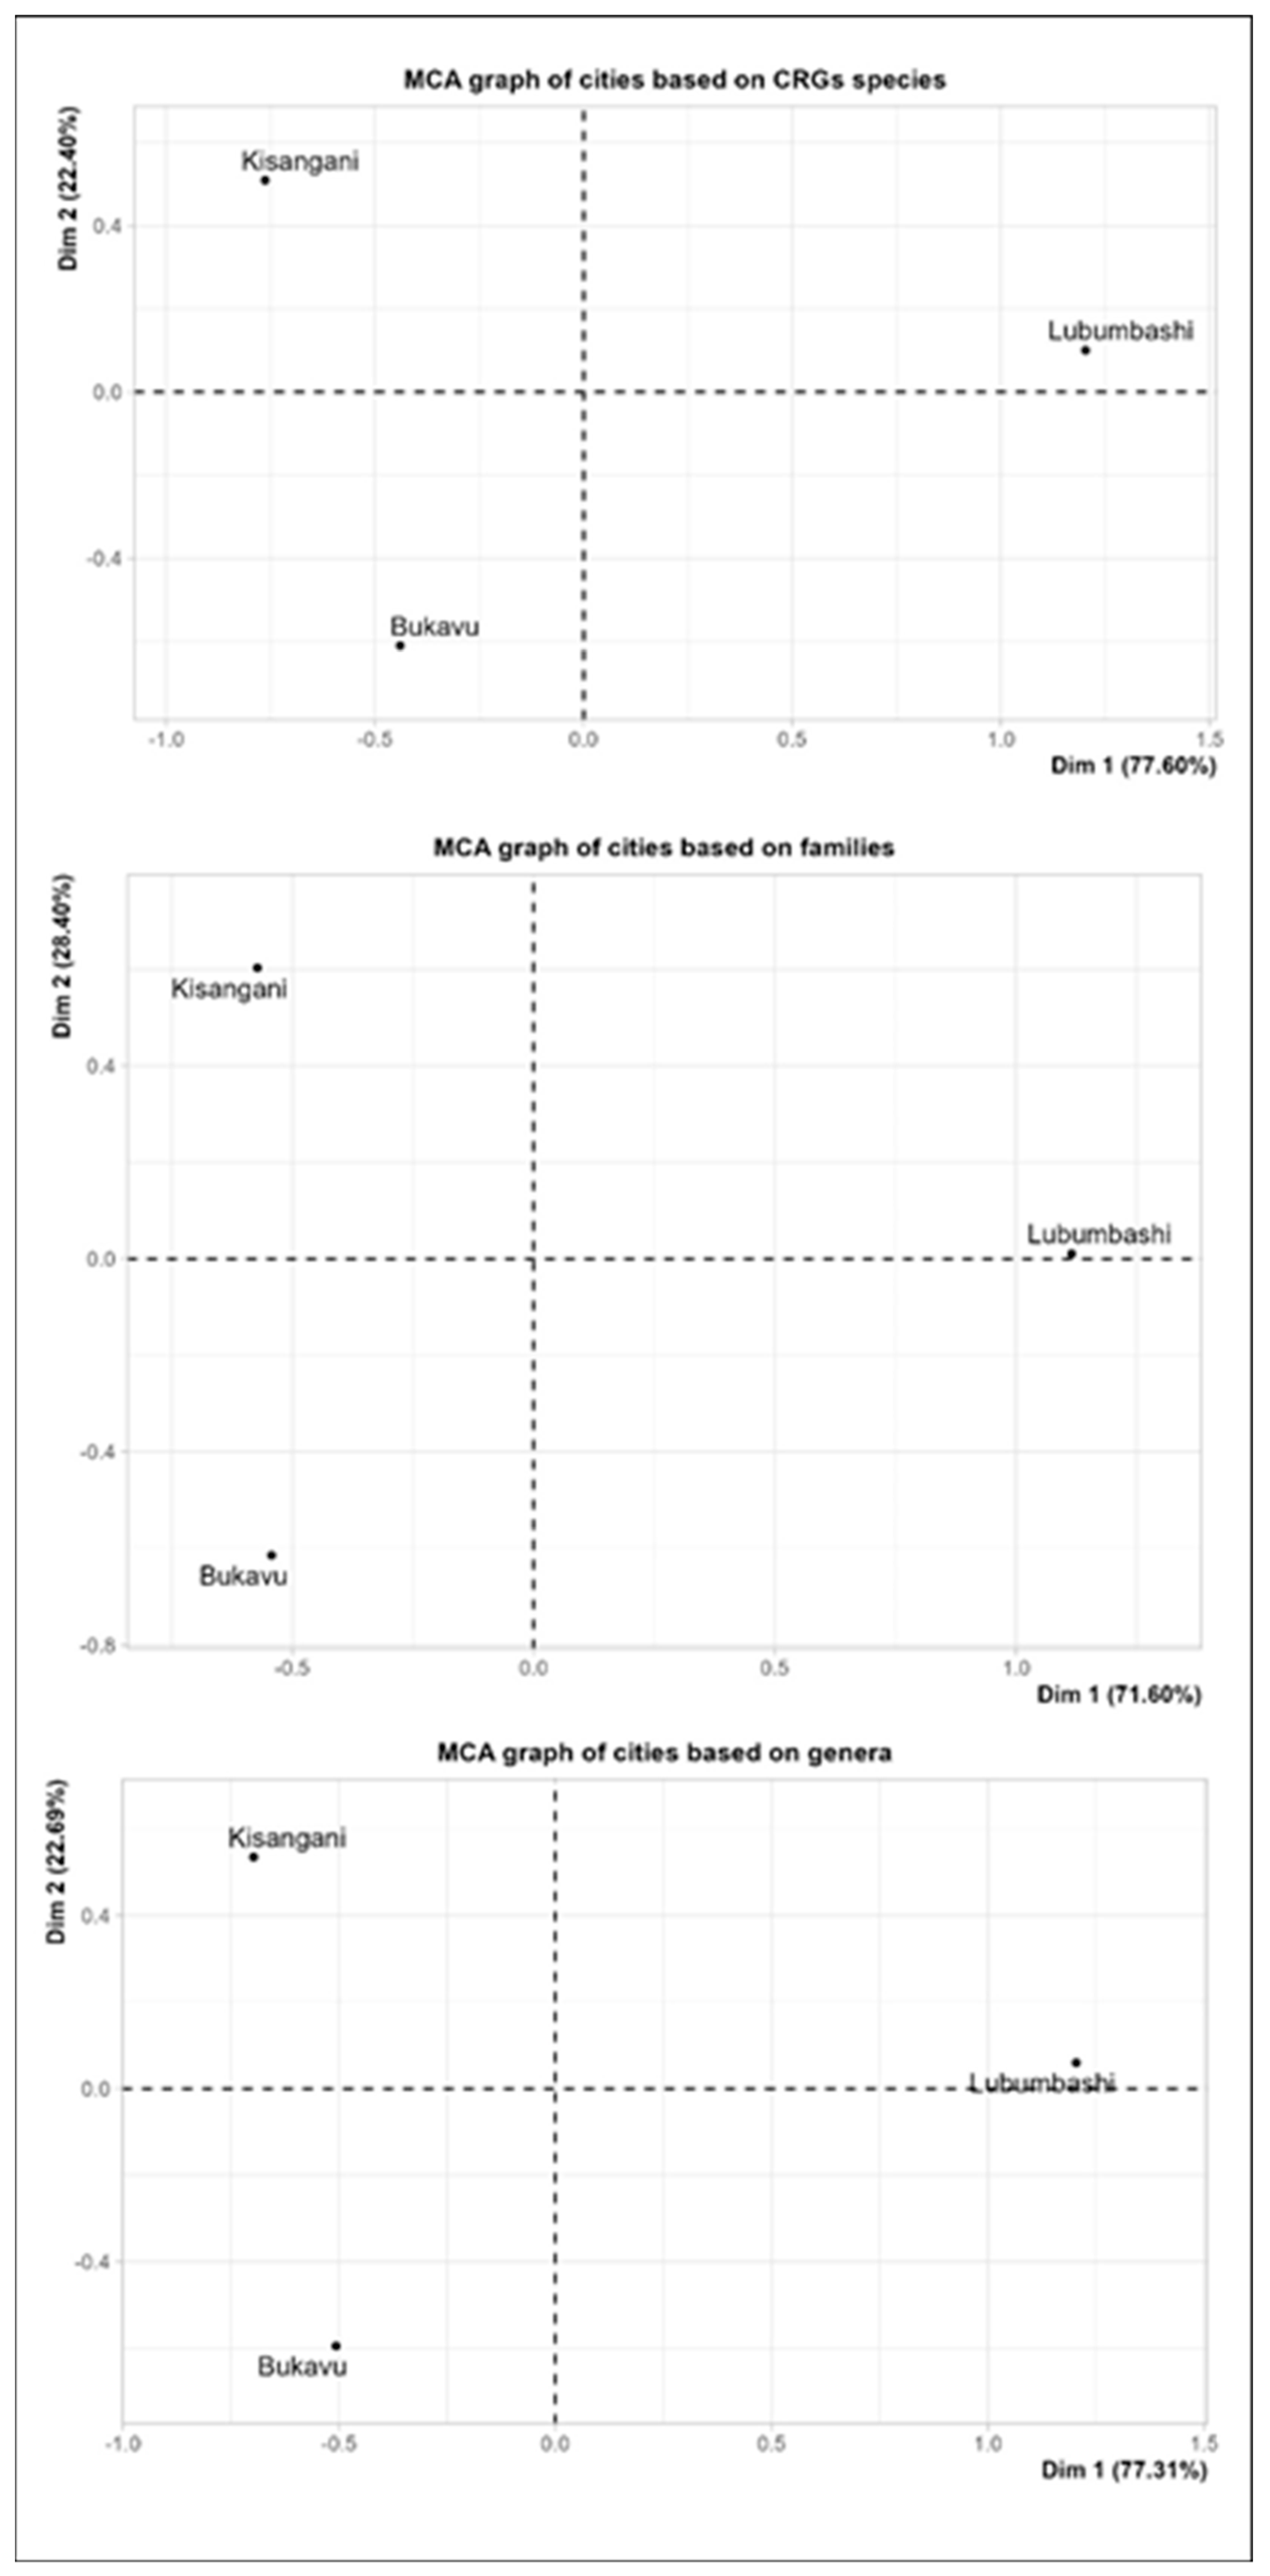
Figure 7.
Distribution of the number of plant species in the CRGs of each of the three cities studied. The values represent the absolute number of species identified in the CRGs by city. The result of the Fisher test reveals that the distribution of origin status depends on the city.
Figure 7.
Distribution of the number of plant species in the CRGs of each of the three cities studied. The values represent the absolute number of species identified in the CRGs by city. The result of the Fisher test reveals that the distribution of origin status depends on the city.
| City | Old Name | Location | Number of Municipalities | Area (km2) | Population Size in 2024 (Inhabitants) | Altitude | Climate Type | Annual Rainfall (mm/year) | Mean Annual Temperature (°C) | Dominant Soil | Characteristic Plant Formation |
|---|---|---|---|---|---|---|---|---|---|---|---|
| Bukavu | Costermansville | 2°30’55’’ south latitude and 28°50’42’’ east longitude | 3 municipalities: Kadutu, Ibanda and Bagira | 60 | 1 012 053 | Mean: 1.654 m Min: 1.422 m Maxi: 2.190 m |
Tropical mountain climate (BWh) Dry season: mid-May to mid-September Rainy season: mid-September to mid-May |
1500-2200 | 20,5 | Andosols (Volcanic, clayey, permeable soil belonging to the red clay soil group) |
Mountain forest |
| Kisangani | Stanleyville | 0°31’ north latitude, 25°11’ east longitude | 6 municipalities: Makiso, Tshopo, Mangobo, Kabondo Kisangani and Lubunga | 1910 | 1 602 144 | Mean: 415 m Min: 378 m Maxi: 503 m |
Hot, humid equatorial climate (Af) Two rainy seasons: September to November and March to May Long dry season: January Short dry season: July to August |
1500 - 2000 | 25 | Ferrasols (Mostly sandy-clay soils) |
Dense rainforest |
| Lubumbashi | Elisabethville | 27°48’61’’1 East longitude, 11° 61’55 3’’ South latitude | 7 municipalities: Lubumbashi, Kenya, Kampemba, Katuba, Kamalondo, Ruashi and Annexe |
747 | 2 096 961 | Mean: 1259 m Mini: 1167 m Maxi: 1411 m |
CW6 climate Rainy season: November Dry season: May to September to March Transition months: April and October |
1200 | 20 | Ferrasols (Ferralitic soils mostly represented by young and red soils) |
miombo forest |
Table 2.
List of CRGs surveyed by city and coding used.
| CRG’s code | CRG’s name | Area (ha) |
|---|---|---|
| Lubumbashi | ||
| CRGL1 | Convent of Saint Paul Parish | 0.11 |
| CRGL2 | Theological Institute - Chaplains of Work | 0.32 |
| CRGL3 | Tabora University Cultural Center | 0.17 |
| CRGL4 | Theologicum | 1.25 |
| CRGL5 | Provincial House of the Franciscans | 0.2 |
| CRGL6 | Tertiary Capuchin Sisters - Nazareth Homes | 0.15 |
| CRGL7 | Scholasticate - Chaplains of Work | 0.15 |
| CRGL8 | Laura House | 8.32 |
| CRGL9 | Carmelite Sisters | 0.58 |
| CRGL10 | Mercedarian Missionaries | 0.19 |
| Bukavu | ||
| CRGB1 | Bukavu Amani Center | 0.51 |
| CRGB2 | Kasongo Procuracy | 6.59 |
| CRGB3 | The Corniche | 0.24 |
| CRGB4 | Xaverian Sisters | 5.07 |
| CRGB5 | Missionaries of Africa | 0.41 |
| CRGB6 | Cirezi High School | 0.52 |
| CRGB7 | Cathedral of Our Lady of Bukavu | 1.05 |
| CRGB8 | Solidarity | 2.89 |
| CRGB9 | Saint Joseph Sisters | 1.09 |
| CRGB10 | Father Vavassori Health Center | 3.85 |
| CRGB11 | Saint John the Baptist Parish – Cahi | 2.37 |
| CRGB12 | Antonella School | 0.97 |
| CRGB13 | Holy Family Parish of Bagira | 0.06 |
| CRGB14 | Nyakavogo High School | 5.13 |
| CRGB15 | Nyakavogo Primary School | 2.15 |
| CRGB16 | Catholic University of Bukavu Bugaboo | 1.29 |
| CRGB17 | Saint Francis Xavier Parish - Kadutu | 0.65 |
| CRGB18 | Fundi Maendeleo Technical Institute | 14.38 |
| CRGB19 | Wima High School | 19.71 |
| CRGB20 | General Economat | 5.64 |
| Kisangani | ||
| CRGK1 | Kisangani Little Seminary of Mandombe | 3 |
| CRGK2 | Saint Peter Parish | 3 |
| CRGK3 | Saint Albert Chapel | 2 |
| CRGK4 | Saint Martha Parish | 8 |
| CRGK5 | Cathedral of Our Lady of the Most Holy Rosary | 8 |
| CRGK6 | Father Dehonus Scholasticate | 8 |
| CRGK7 | Simama Center | 3 |
| CRGK8 | Servant Sisters of Jesus | 10 |
| CRGK9 | Sisters of the Holy Family Mediatrix | 1 |
| CRGK10 | Augustinian Sisters | 1 |
| CRGK11 | Pastoral House of the Sacred Heart | 10 |
| CRGK12 | Convent of the Priests of Mont Fortaint | 3 |
| CRGK13 | Bel Vedere | 25 |
| CRGK14 | Saint Gabriel Parish | 4 |
| CRGK15 | Convent of the Priests of the Sacred Heart | 2 |
| CRGK16 | Sisters of Jesus Educator Station Kis-Bondo | 2 |
| CRGK17 | Canonical Sisters | 3 |
| CRGK18 | Sisters Novitiate Holy Family | 3 |
| CRGK19 | Saint Camille Parish | 0.4 |
| CRGK20 | Josephites of Kinzambi | 0.49 |
| CRGK21 | Sisters Holy Family Artisan | 0.15 |
| CRGK22 | Marist Brothers | 2 |
| CRGK23 | Formation House Scholasticate | 2 |
| CRGK24 | Saint Augustine Major Seminary | 1 |
| CRGK25 | Saint Lawrence Parish | 4 |
| CRGK26 | Deo Soli/Scholasticate | 0.25 |
| CRGK27 | Daughters of Wisdom | 0.08 |
| CRGK28 | Sisters Immaculate Conception | 7 |
| CRGK29 | Sisters Saint Joseph House | 0.32 |
| CRGK30 | Saint John Parish | 2.5 |
| CRGK31 | Blessed Isidore Bakanja Parish | 0.49 |
| CRGK32 | Blessed Anuarité Parish | 2 |
| CRGK33 | Deo Soli/Scholasticate 7th Plateau | 0.25 |
| CRGK34 | Comboni House | 0.49 |
| CRGK35 | Technical High School Mapendano | 7 |
| CRGK36 | The Moinnaux | 4 |
| CRGK37 | Mary Queen of Peace | 49 |
| CRGK38 | Christ the King Parish | 4 |
| CRGK39 | Saint Ignatius Parish | 3 |
| CRGK40 | Saint Joseph Artisan Parish | 20 |
Table 3.
Results of Dunn’s tests for mean comparison following the Kruskal-Wallis test among the three studied cities (Bukavu, Kisangani, and Lubumbashi) for four characteristic parameters of the CRGs. n represents the total sample of CRGs surveyed by city. For the same parameter, values followed by the same letter (a or b) are considered not statistically different (p-value < 0.05). SD = standard deviation.
| Cities | Specific Richness | Number of Families | Number of Genera | Area (ha) | ||||||||
|---|---|---|---|---|---|---|---|---|---|---|---|---|
| Mean | SD | Total | Mean | SD | Total | Mean | SD | Total | Mean | SD | Total | |
| Bukavu (n = 20) | 9.2a | 4.7 | 24 | 6.9a | 3.0 | 15 | 8.7a | 4.5 | 22 | 3.7a | 5.0 | 74.6 |
| Kisangani (n = 40) | 12.1a | 8.3 | 72 | 9.2a | 5.1 | 36 | 11.5a | 7.3 | 56 | 5.2a | 8.7 | 209.4 |
| Lubumbashi (n =10) | 24.1b | 10.8 | 152 | 17.9b | 7.5 | 60 | 23.7b | 10.6 | 137 | 1.1b | 2.5 | 11.4 |
Table 4.
Families and genera of the species making up the CRGs of the cities studied with the three highest relative dominance values (RD). RD here is the ratio of the number of species of the same family or genus to the total species richness (Rs). *The mention “all others” means that the rest of the complete list of the corresponding taxon has the same RD value in the corresponding city.
| Cities | Taxa | Parameters |
|---|---|---|
| Family | Relative Dominance | |
| Bukavu (Rs = 24) | Bignoniaceae | 12.5% |
| Fabaceae | 12.5% | |
| Rutaceae | 12.5% | |
| Anacardiaceae | 8.3% | |
| Myrtaceae | 8.3% | |
| Rosaceae | 8.3% | |
| All others* | 4.2% | |
| Kisangani (Rs = 67) | Fabaceae | 15.3% |
| Moraceae | 9.7% | |
| Anacardiaceae | 5.6% | |
| Myrtaceae | 5.6% | |
| Rutaceae | 5.6% | |
| Lubumbashi (Rs = 152) | Araceae | 8.6% |
| Arecaceae | 7.2% | |
| Asparagaceae | 6.6% | |
| Genus | Dominance relative | |
| Bukavu (Rs = 24) | Citrus | 12.5% |
| All others* | 4.2% | |
| Kisangani (Rs = 67) | Acacia | 5.6% |
| Citrus | 5.6% | |
| Albizia | 4.2% | |
| Ficus | 4.2% | |
| Terminalia | 4.2% | |
| Lubumbashi (Rs = 152) | Cyperus | 2.0% |
| Euphorbia | 2.0% | |
| Tradescantia | 2.0% | |
| All others* | 1.3% |
Table 5.
Taxa making up the CRGs of the cities surveyed with the three highest relative frequency values (Fr). Fr is the ratio of the number of CGRs in which the taxon is identified to the total number (n) of CRGs surveyed in the city.
Table 5.
Taxa making up the CRGs of the cities surveyed with the three highest relative frequency values (Fr). Fr is the ratio of the number of CGRs in which the taxon is identified to the total number (n) of CRGs surveyed in the city.
| Cities | Taxa | Parameters |
|---|---|---|
| Species | Relative Frequence | |
| Bukavu (n =20) | Pinus patula Schltdl. & Cham., 1831 | 75.0% |
| Eucalyptus globulus Labill., 1800 | 70.0% | |
| Citrus limon (L.) Osbeck, 1765 | 65.0% | |
| Psidium guajava L., 1753 | 65.0% | |
| Mangifera indica L., 1753 | 60.0% | |
| Markhamia lutea (Benth.) K. Schum. | 60.0% | |
| Persea americana Mill., 1768 | 60.0% | |
| Kisangani (n =40) | Persea americana Mill., 1768 | 82.5% |
| Elaeis guineensis Jacq., 1763 | 75.0% | |
| Mangifera indica L., 1753 | 67.5% | |
| Lubumbashi (n=10) | Cordyline fruticosa (L.) A.Chev., 1919 | 80.0% |
| Musa acuminata Colla, 1820 | 60.0% | |
| Acalypha wilkesiana Müll.Arg., 1866 | 50.0% | |
| Carica papaya L., 1753 | 50.0% | |
| Citrus limon (L.) Osbeck, 1765 | 50.0% | |
| Codiaeum variegatum (L.) Rumph. ex A.Juss., 1824 | 50.0% | |
| Families | Relative Frequence | |
| Bukavu (n=20) | Myrtaceae | 90.0% |
| Anacardiaceae | 75.0% | |
| Bignoniaceae | 75.0% | |
| Pinaceae | 75.0% | |
| Rutaceae | 65.0% | |
| Kisangani (n =40) | Arecaceae | 85.0% |
| Lauraceae | 82.5% | |
| Fabaceae | 77.5% | |
| Lubumbashi | Asparagaceae | 100.0% |
| Arecaceae | 90.0% | |
| Euphorbiaceae | 90.0% | |
| Lamiaceae | 80.0% | |
| Genera | Relative Frequence | |
| Bukavu (n=20) | Pinus | 68.2% |
| Eucalyptus | 63.6% | |
| Citrus | 59.1% | |
| Psidium | 59.1% | |
| Kisangani (n =40) | Persea | 82.5% |
| Elaeis | 75.0% | |
| Mangirefa | 67.5% | |
| Lubumbashi (n=10) | Cordyline | 80.0% |
| Citrus | 60.0% | |
| Musa | 60.0% | |
| Acalypha | 50.0% | |
| Carica | 50,0% | |
| Codiaeum | 50,0% | |
| Dracaena | 50,0% | |
| Tradescantia | 50,0% |
Disclaimer/Publisher’s Note: The statements, opinions and data contained in all publications are solely those of the individual author(s) and contributor(s) and not of MDPI and/or the editor(s). MDPI and/or the editor(s) disclaim responsibility for any injury to people or property resulting from any ideas, methods, instructions or products referred to in the content. |
© 2025 by the authors. Licensee MDPI, Basel, Switzerland. This article is an open access article distributed under the terms and conditions of the Creative Commons Attribution (CC BY) license (http://creativecommons.org/licenses/by/4.0/).
Copyright: This open access article is published under a Creative Commons CC BY 4.0 license, which permit the free download, distribution, and reuse, provided that the author and preprint are cited in any reuse.


