
Submitted:
20 April 2025
Posted:
21 April 2025
You are already at the latest version
Abstract
Solar energy reaching the Earth's surface varies due to absorption, reflection, and attenuation by atmospheric components, among other factors. This affects photovoltaic (PV) power production. Given this, a long–term inference of solar energy accessibility through short-term measurements, was performed to maximize PV power production. The clear–sky index (K_t^* ) method was used, completely removing traces of solar energy inhibition and reporting measured radiation to theoretical clear–sky radiation. The solar energy sample was collected in Mozambique along the southern region at Maputo–1, Massangena, Ndindiza, Pembe, the Mid region at Chipera, Nhamadzi, Barue–1, and Barue–2, Lugela-1, Lugela-2, and North-region at Nipepe-1, Nipepe-2, Nanhupo-1, Nanhupo-2, and Chomba, between 2005 and 2024, with a measurement interval of 1 to 10 minutes and 1 hour, during the measurement campaigns of FUNAE, INAM, other was token in the PVGIS, Meteonorm, NOAA and NASA solar database. The analysis reveals a K_t^* with a density close to 1 for clear days, and intermediate-sky days have characteristics between clear and cloudy days. It can be concluded that there is a strong correlation between sky types in the order of 0.95 to 0.89 per station, the correlated energies, and experiences a regression with coefficients in the order of 0.79 to 0.95. According to the sample analysis, the area has the potential to use solar energy, and other locations can apply the same sampling approach to maximize PV output and other solar exploitation projects.
Keywords:
Regressive
; spatio–temporal
; solar energy
; accessibility
; variability
; clear–sky index
1. Summary
The evolution of human society necessitates an ever-increasing energy supply to fulfill its daily requirements. Historically, humans have relied on their physical strength as a fundamental and adequate energy source, primarily for survival. Numerous natural processes are enhanced by the solar radiation that reaches the Earth’s surface, including photosynthesis, hydrological cycles, surface erosion, and climate change, among others. As the population expands and technology and industry advance, there is a growing demand for energy to support daily activities such as lighting, cooling, heating, and irrigation, as well as to meet industrial needs, including the operation of machinery and large-scale electrification [1,2,3].
A portion of the world’s energy comes from fossil fuels, which release harmful gases and particles into the atmosphere and seriously pollute it. Despite this, efforts are being made to drastically reduce their use and increase the amount of clean, green, and renewable energy sources by 2050. Although most of the population still does not have access to grid-connected electricity, major companies have adopted local sources, which are very useful in most countries, with 85% having access to hydroelectric power for electrification. In the case of Mozambique, however, 72% of the electricity supplied comes from hydroelectric sources. Hydroelectric sources, among others, have the small disadvantage of destroying the ecosystem, which will affect future generations as well as future species. There is a strong need to use other sources, such as solar energy, which has the advantage of being used anywhere where solar energy is available. However, the output of a solar plant is impacted by the variability of solar energy [1,2,3,4,5,6].
Recent studies that infer the performance of solar systems in various locations around the world have found that there are differences in the energy generated during periods of low solar radiation and during phases of high solar radiation [5,6]. They found that there is a strong correlation between the variability of solar energy and duration over a variety of periods, including 24 hours, 1 hour, 1 minute, 1 second, 0.01 seconds, 0.001 seconds, 0.0001 seconds, and 0.00001 seconds [7,8,9]. They also identified a significant variation in intermediate days, as well as a decrease in amplitude and the observation of real variables impacted by the dynamics of gases, particles, and other factors [5,12,13,14]. Based on cloud velocity and global horizontal irradiance (GHI), they estimated GHI data on a horizontal surface of the optimal tilt angle based on a 5-minute model and concluded that there was variability in the tilted surfaces [12,13,14]. They evaluated the short–term variable and concluded that short–term ramp rates were attenuated as plant size increased [7,15]. They predicted PV power production from the GHI process for renewable resource generation, and variable solar resources, and found fluctuations in solar power variability [5,16]. They also analyzed PV systems, revealing limited access due to environmental factors and renewable energy tariffs.
To enhance access to electricity for diverse needs and promote social development, the present study sought to analyze the long-term regressive and spatio-temporal accessibility of variability of solar energy on a short-scale measurement. The GHI sample was collected across the Southern, Mid and North regions of Mozambique at 15 stations, with 24-hour amplitudes and short time scales with 1- and 10-minutes, and 1-hour intervals over one year between 1994 to 2024. Solar energy falls under the purview of the Mozambique solar energy study project under the FUNAE [20], INAM [21], PVGIS [22], NASA [23], NOAA [24] and Meteonorm [25]. Part of data was directly extracted in the database and other from FUNAE and INAM were, measured by high–resolution pyranometers that were stored in the data logger. During this time, the instruments underwent regular maintenance procedures to remove potential obstacles and shadows, as well as records of rainy days that significantly impacted the behavior of solar energy.
The solar radiation model was adopted instead of the cloud model to determine the , which eliminates the variability of solar energy due to many factors, such as spatial geometry, among others. To determine regressive and spatio-temporal accessibility of variability of solar energy throughout the Southern, Mid and North regions of Mozambique at a short–measurement scale and over a long period of data collection, it was necessary to analyze the temporal variability of different types of days, perform correlations between increases in two sensor points and create an advisory instrument for solar radiation in the Mozambique regions.
The area can be examined through the experimental sampling descriptor of data collected in the South, Mid and North regions of Mozambique, utilizing the regions model, which operates at a resolution ranging from 1 to 10 minutes and achieves a confidence level of 0.91 for overall data quality. The data exhibits Gaussian statistical characteristics concerning the frequency of daily recording and observation, which has been adjusted for inaccuracies arising from various factors such as convection current failures, shading, and obstruction by birds. This analysis employs both the Random Forest model and the Ordinary Kriging model, taking into account atmospheric conditions of clear skies and eliminating all variability linked to spatial geometry. The statistical evaluation of all variability measures reveals an accessibility metric indicating energy availability exceeding 70% during the period of lowest solar incidence, characterized by predominantly clear and intermediate days. However, a decorrelation is observed extending from the Mozambique region on an interprovincial scale, demonstrating a regression with a coefficient of approximately 0.89, inferred from atmospheric parameters.
These findings establish a series of model steps that can be applied to all regions of the world, customizing only local inputs such as location, climate, and acidity, among others. However, it can be shown that in the study area, the energy is distributed along the Nhamadzi, Barue–1, Barue–2, and Chipera study paths. Consequently, based on annual observations with the highest uniformity of measurements from 2005 to 2024, the states of Nhamadzi and Chipera have the highest density potential for acceptable day total solar, followed by the states of Barue–2 and Barue–1, in all cases at least 50% basing in the evaluation of its radiation equivalent to its .
2. Data Description
2.1. Data Collection and Processing
The GHI data were gathered during the solar radiation measurement campaign conducted by the FUNAE [20] and INAM [21], and also solar energy data platform of PVGIS [22], NASA [23] and Meteonorm [25], in the years 2005 to 2024. This initiative established a monitoring network across the Southern, Mid, and North regions of Mozambique, encompassing Maputo City, Gaza, Inhambane, Sofala, Manica, Tete, Zambezia, Niassa, Nampula, and Cabo-Delgado. The network included the stations, equipped with 16 high-resolution pyranometers. The Campbell CR23X data logger used, operates at a frequency of 1 Hz, storing the instantaneous averages of 1 and 10 minutes. The data met quality control (elimination of spurious values) and were subsequently processed by programs developed specifically for calculating radiation with a time interval of 1, 10 minutes and 1 hour.
The cumulative monitoring network forecasted energy output and verified the effectiveness of solar PV power installations. Improved operating efficiency, anomaly detection, real-time sample collection, climatic evaluations, and long-term performance are only a few advantages of the network. Continuous GHI and DNI (Direct Normal Irradiance) collection and analysis enables better performance, quicker problem-solving, and more accurate energy use planning.
2.2. Study Area
Mozambique is situated between the meridians 30°12 and 40°51’ E longitude and the parallels 10°27’ and 26°52’ South latitude. The network included the stations This is where the stations were installed, with latitude and longitude at Chomba (39°23.3’36.16”E and 11°32’57.57”S), Nanhupo 1 and 2 (39°30’46.77”E and 15°57’57.38”S), Nipepe (32°26’12.82”E and 13°54’25.935”S), Chipera (31°40’3.4”E and 14°58’28.1”S), Nhamadzi (35°2’18.7”E and 19°43’46.6”S), Massangena (32°56’26.7”E and 21°34’59.5”S), Lugela 1 and 2 (36°42’47.51”E and 16°28’4.45”S), Ndindiza (33°25’22.8”E and 23°27’37.1”S), Pembe (35°35’35.5”E and 22°56’44.3”S), Barue 1 and 2 (33°13’0.8”E and 17°47’32.5”S), Maputto-1 (32°9’39.8”E and 23°55’7.8”S). The sample, gathered through comprises 19 years of measurement from 2005, to 2024, covering January through December, with daily radiation data.
2.3. Specifications of Each Sample File
The “CSV” files, under the title: “daily_GHI_Chomba(2005-2024)”, “daily_GHI_Nanhupo-1(2005-2024)”, “daily_GHI_Nanhupo-2(2005-2024)”, “daily_GHI_Nipepe-1(2005-2024)”, “daily_GHI_Nipepe-2(2005-2024)”, “daily_GHI_Lugela-1(2005-2024)”, “daily_GHI_Lugela-2(2005-2024)”, “daily_GHI_Chipera(2005-2024)”, “daily_GHI_Nhamadzi(2005-2024)”, “daily_GHI_Barue-1(2005-2024)”, “daily_GHI_Barue-2(2005-2024)”, “daily_GHI_Pembe(2005-2024)”, “daily_GHI_Ndindiza(2005-2024)”, “daily_GHI_Massangena(2005-2024)” and “daily_GHI_Maputo–1(2005-2024)” refer to the GHI measurements at the stations of Chomba, Nanhupo-1, Nanhupo-2, Nipepe-1, Nipepe-2, Lugela-1, Lugela-2, Chipera, Barue–1 and Barue–2, Nhamadzi, Pembe, Ndindiza, Massangena, and Maputo–1, between the years 2005 to 2024. In each file, column A under reference “Time” refers to the local measurement time interval, columns B to column AF, under reference GHI_1 to GHI_31 refer to the GHI measurements on each day of each month (1 to 30 or 31). For example, under the terminology: under the terminology “_Jun_Cho” refers to June at Chomba station, under the terminology “_Jun_Na_1” refers to June at Nanhupo–1 station, under the terminology “_Jun_Na_2” refers to June at Nanhupo–2 station, under the terminology “_Jun_Ni_2” refers to June at Nipepe–1 station, under the terminology “_Jun_Ni_2” refers to June at Nipepe–2 station, “_Apr_Cha” refers to April at Chipera station, “_Jun_Be_1” refers to June at Barue–1 station, under the terminology “_Jun_Be_2” refers to June at Barue–2 station, under the terminology “_Oct_Nzi” refers to October at Nhamadzi station, under terminology “_Jun_Pe” refers to June at Pembe station, under terminology “_Jun_Ndza” refers to June at Ndindiza station, under terminology “_Jun_Mna” refers to June at Massangena station, the above with a measurement interval of 1 to 10 minutes, and under terminology “_MPT–1” refers to June at from Maputo–1 (with a 1–minute measurement interval).
The “CSV” files, under the writing “Chomba_A(2005-2024)”, “Nanupo-1_A(2005-2024)”, “Nanhupo-2_A(2005-2024)”, “Nipepe-1_A(2005-2024)”, “Nipepe-2_A(2005-2024)”, “Chipera_A(2005-2024)”, “Nhamadzi_A(2005-2024)”1, “Barue–1_A(2005-2024)” and “Barue–2_A(2005-2024)”, “Lugela-1_A(2005-2024)” “Lugela-2_A(2005-2024)”, the sample of clear–sky index data referring to the days analyzed as acceptable days measured during the twelve months of each year among the years 2005 to 2024, with a regular amplitude of 24–hours and a measurement interval of 1 to 10 minutes and 1 hours, with the symbols “kt*_C_A” and “Δkt*_C_A” in column A and column B of each file, referring to the clear–sky index and clear–sky index increments on clear sky days; “kt*_Cy_A” and “Δkt*_Cy_A” in column C and column D of each file, and referring to the clear–sky index and clear sky index increments on cloudy sky days, “kt*_I_A” and “Δkt*_I_A” in column E and column F of each file, and referring to the clear–sky index and clear sky–index increments on intermediate sky days (if accompanied by the terminology: “_Cho” and referring to the Chomba station, “_Na-1” and “_Na-2” referring to the Nanhupo-1 and nanupo-2 station, “_Ni-1” and “_Ni-1” referring to the Nipepe-1 and Nipepe-2 stations, “_Cha” and referring to the Chipera station, “_Nzi” and referring to the Nhamadzi station, “_Be–1” and “_Be–2” and referring to the “Barue–1” and “Barue–2” stations, “_Lu-1” and “_Lu-2” referring to the Lugela-1 and Lugela-2 stations), applied in the regressive and spatio–temporal study methodology of the variability of solar energy on unacceptable days.
The “CSV” files, under the writing “Chipera_NA(2005-2024)”, “Nhamadzi_NA(2005-2024)”, “Barue–1_NA(2005-2024)” and “Barue–2_NA(2005-2024)”, the sample of clear–sky index data referring to the days analyzed as unacceptable days measured during the twelve months of the 19 years 2005 to 2024, with a regular amplitude of 24 hours and a measurement interval of 1 to 10 minutes and 1 hour, with the symbols “kt*_C_NA” and “Δkt*_C_NA” in column A and column B of each file, referring to the clear–sky index and clear sky–index increments on clear sky days; “kt*_Cy_NA” and “Δkt*_Cy_NA” in column C and column D of each file, and referring to the clear sky index and clear–sky index increments on cloudy sky days, “kt*_I_NA” and “Δkt*_I_NA” in column E and column F of each file, and referring to the clear–sky index and clear–sky index increments on intermediate sky days (if accompanied by the terminology: “_Cha” refers to the Chipera station, “_Nzi” refers to the Nhamadzi station, “_Be–1” and “_Be–2” refers to the “Barue–1” and “Barue–2” stations), applied in the regressive and spatio–temporal study methodology of the variability of solar energy on unacceptable days.
The file “CSV”, under the heading done_behavior_sigle_day_density, column A under the symbolic specification kt* and the clear–sky index under the description of a clear day to study the behavior of the daily course of a clear day in terms of its relationship with the density of the clear–sky index. In the “CSV” file, concerning “location_of_study_stations”, column A under reference to “ID” refers to the identity assigned to each station by the researcher, column B under reference to “Name” refers to the name assigned to each station according to its location by the researcher, column C under reference to “Num_stations” refers to the number of measuring devices (pyranometers) installed in each measuring station, column D, under reference to “Province” refers to the province in which the measuring station is installed, column E and column F, under reference to “Longitude” and “Latitude” refer to the geographic coordinates longitude and latitude where the measuring stations are located.
Furthermore, the “CSV” files, written with the terminology “_accepted_unaccepted_unapplicable”, refer to the classification of days as acceptable, unacceptable, and not applicable. If they start with: “Barue_1_2005_2011”, “Barue_1_2012_2018” and “Barue_1_2019_2024” they refer to the classification at the Barue_1 station in the years 2005 to 2024; by “Barue_2_2005_2011”, “Barue_2_2012_2018” and “Barue_2_2019_2024” they refer to the classification at the Barue_2 station in the years 2005 to 2024; Nhamadzi_2005_2011”, “Nhamadzi_2012_2018” and “Nhamadzi_2019_2024” refers to the classification at Nhamadzi station in the years 2005 to 2024; “Chipera_2005_2011” and “Chipera_2012_2018” refers to the classification at Chipera station in the years 2005 to 2024; “Massangena_2005_2011”, “Massangena_2012_2018” and “Massangena_2019_2024” refers to the classification at Massangena station in the years 2005 to 2024; by “Ndindiza_2005_2011”, “Ndindiza_2012_2018” and “Ndindiza_2019_2024” refers to the classification at Ndindiza station in the years 2005 to 2024; by “Pembe_2005_2011” and “Pembe_2012_2018” refers to the classification at Pembe station in the years 2005 to 2024; and by “Maputo_1” refers to the classification at Maputo_1 station in the year 2005 to 2024. Each of the previously described files includes a full explanation of the technical specifications and significance of its constituent parameters. The vectors and instructions for managing the solar energy sample for long-term measurement and casual interactive accessibility are also explained in Table 1.
2.4. Sample Size
Through the use of FUNAE, INAM campaign data, PVGIS, NASA, and Meteonorm, entitled, MZF01-Maputo–Maputo-1, MZ17–Gaza–Ndindiza, MZ15-Gaza-Massangena. The samples for MZ20–Inhambane–Pembe, MZ11–Sofala–Nhamadzi, MZ21–Manica–Barue–1 and –2, MZ06–Tete–Chipera, MZF01-Niassa-1 and Nipepe-2, MZF24-Nanpula-Nanhupo-1 an Nanhupo-2, MZF03-Chomba, which covered 19 years of full measurements in 2005 to 2024, were prepared to calculate the solar radiation from 6 to 18 hours, the interval is calculated as the incidence of solar energy on the earth’s surface spanning the study region. This produced daily data for each radiation area of about 147.745,00 for 1 to 10 minutes measurements and 297.402 for 1 hour’s intervals measurements.
2.5. Data Values Fluctuations
The selection process for each station is explained below, demonstrating how the data values varied on every day of every month under analysis. This necessitated a prior classification into classes of acceptable days, when the measured GHI spectrum was close (or closeness) to the spectrum, unacceptable days, when the experimental GHI spectrum was far (or farness) from the spectrum, and unapplicable days when the GHI spectrum presented roughly 60% of the measured data and that satisfied a spectrum with values outside the solar constant, which dictated a very distorted spectrum compared to that of, in the Student’s T-test, given that the daily sample comprises a binomial distribution with gaussian characteristics.
At the Barue–1 station, in 2005-2011, approximately 65.0% of acceptable days, 34.0% of unacceptable days, and 1.0% of unapplicable days were observed, with the description of each type of day being shown in Table 2.
Guided by the same analysis as in Table 2, was found in 2012-2018, at the Barue–1 station 63.0% of acceptable days, 36.0% of unacceptable days, and 1.0% of unapplicable days. In 2019-2024, it had 55.0% of acceptable days, 31.0% of unacceptable days, and 14.0% of unapplicable days. At the Barue–2 station, in 2005-2011, around 57.0% of acceptable days, 29.0% of unacceptable days, and 14.0% of unapplicable days were observed. In 2012-2018, approximately 63.0% of acceptable days, 36.0% of unacceptable days, and 1.0% of unapplicable days were observed. At the Barue–2 station, in 2012-2018, approximately 70.0% of acceptable days, 29.0% of unacceptable days, and 1.0% of unapplicable days were observed. At the Chipera station in 2005-2011, approximately 67.0% of acceptable days, 24.0% of unacceptable days, and 9.0% of unapplicable days were observed. At the Chipera station in 2012-2018, approximately 40.0% of acceptable days, 48.0% of unacceptable days, and 12.0% of unapplicable days were observed. In 2019-2024, approximately 52.0% of acceptable days, 39.0% of unacceptable days, and 9.0% of unapplicable days were observed. At the Nhamadzi station, in 2005_2011, approximately 68.0% of acceptable days, 26.0% of unacceptable days, and 6.0% of unapplicable days were observed. At the Nhamadzi station, in 2012-2018, approximately 0.0% of acceptable days, 99.0% of unacceptable days, and 1.0% of unapplicable days were observed. At the Nhamadzi station, in 2019-2024, approximately 0.0% of acceptable days, 38.0% of unacceptable days, and 62.0% of unapplicable days were observed.
Throughout the Southern region: at the Maputo–1 station in 2005-2011, approximately 42.0% of acceptable days, 30% of unacceptable days, and 28% of unapplicable days were observed, without any observations in 2012-2018 and 2019-2024. At the Massangena station in 2005-2011, approximately 72.0% of acceptable days, 23.0% of unacceptable days, and 5.0% of unapplicable days were observed, shown in Figure 1.
At the Massangena station in 2005-2011, approximately 71.0% of acceptable days, 29.0 of unacceptable days, and 0.1% of unapplicable days were observed, without any observations in 2012-2018. At the Ndindiza station in 2019-2024, approximately 73.0% of acceptable days, 23.0% of unacceptable days, and 4.0% of unapplicable days were observed. At the Ndindiza station in 2005-2011, approximately 68.0% of acceptable days, 31.0% of unacceptable days, and 1.0% of unapplicable days were observed. At the Ndindiza station in 2012-2018, approximately 70.0% of acceptable days, 29.0% of unacceptable days, and 1.0% of unapplicable days were observed. At the Pembe station in 2005-2011, approximately 18.0% of acceptable days, 9.0% of unacceptable days, and 73.0% of unapplicable days were observed. At the Pembe station in 2012-2018, approximately 81.0% of acceptable days, 18.0% of unacceptable days, and 1.0% of unapplicable days were observed. Finally, at Pembe station in 2019-2024, approximately 81.0% of acceptable days, 19.0% of unacceptable days, and 0% of unapplicable days were observed. At the Lugela–1 station in 2005-2011, approximately 64.0% of acceptable days, 18.0% of unacceptable days, and 18.0% of unapplicable days were observed. At the Lugela-1 station in 2012-2018, approximately 78.0% of acceptable days, 12.0% of unacceptable days, and 10.0% of unapplicable days were observed. Finally, at Lugela-1 station in 2019-2024, approximately 77.0% of acceptable days, 7.0% of unacceptable days, and 0% of unapplicable days were observed. At the Lugela-2 station in 2005-2011, approximately 67.0% of acceptable days, 27.0% of unacceptable days, and 6.0% of unapplicable days were observed. At the Lugela-2 station in 2012-2018, approximately 71.0% of acceptable days, 8.0% of unacceptable days, and 21.0% of unapplicable days were observed. Finally, at Lugela-2 station in 2019-2024, approximately 56.0% of acceptable days, 22.0% of unacceptable days, and 22.0% of unapplicable days were observed.
3. Methods
3.1. Clear–Sky Index
The characteristics of the ideal development of a random were examined, and the horizontal direct normal radiance at clear sky was found. It describes the spectrum of a day and finds that there is a lower incidence of GHI in the sky and the Sun, but there are high values of solar incidence during the peak period. The days under analysis include the theoretical distribution of radiation for the clear sky (the atmosphere with a clear sky), and the curve is Gaussian [8,9,15]. The was defined by relating the GHI and the clear sky radiation (), as shown in eq. 1 [7,17].
By using the e (ramp rate) pattern, the values obtained present the best fit in defining the values of the normalized model. The GHI and Total Theoretical Radiation spectra were used in combination with time to select a maximum of 10 days with the GHI behavior closest to the Total Theoretical Radiation, or acceptable, and similarly for days that were not acceptable [3,18].
3.2. Process for Clustering
With the days modeled to correspond to each quartile, including the designation of the first (), second (), third (), interquartile (IQR), and lower whisker ; the upper whisker and the outliers , the probability density function was calculated using the kernel density estimator function [19,20,21]. The days chosen for each month were arranged in a table that included the reference day, the mean value, and, finally. The spectrum was then plotted using the function of and, as a result, the median values were determined. In graphical terms, the sample was categorized into classes. As is customary for cloudy sky days, the days of the year in which their horizontal and vertical coordinates are located in intervals before and after the median of the values of and below were designated as clear sky days; and, finally, the days in which their coordinates are located above the values of, regardless of what the values of, were defined as intermediate sky days [21,22].
3.3. Regression and Correlation
Utilizing values for the various day classes (clear, intermediate, and cloudy), a correlation function based on the distance from the correlation coefficient or systematic correlation of the and was performed, as shown in eq. 2 [3,21,23].
Random values, increments are and metric standard deviation , individually over a period of time between two locations , are used to discover the relationship between two points, and , with distance , both statistically and geographically. The correlation of the between two equally spaced measuring stations was established, highlighting the initial equidistant location at Nhamadzi, followed by Barue–1 and Barue–2, then evaluating Chipera. The systematic correlation model, initially proposed by Marcos et al. (2011) [33], gives as was used to compare the systematic relationship of increases in the . Finally, using a set of relative velocity values for the Southern and Mid region, Hoff and Perez (2012) [10] proposed a spatial correlation coefficient model given as . To analyze the accessibility of solar energy, the distribution of daily energy transfers, as well as the number of acceptable, unacceptable and non-applicable days were examined. According to the density estimation kernel, the best days were shown in the quantitative diagram as the most distinct and nubs.
The computerization for analysis in terms of logarithmic regression, provided by eq. 3,
Considering the regression matrix and other factors and matrix residuals. Guided to observation of the existence of a trend of a greater deviation of pairs of stations for other types of regression models [3,21,23], influenced by multiplicative atmospherical transmittance along the study region as shown in Figure 2, mostly by water vapor and uniform mixed gases ranges 0.9986 and 0.9865, followed by ozone ranges 0.9758, aerosols 0.9656, and 0.8992 contributed by the Rayleigh/ Mie dispersion.
3.4. Validation and Data Curation
The solar energy sample collected daily during the years 2005 to 2024 was treated to extract the period of incidence of solar radiation. Missing periods were filled by interpolation of missing data. The theoretical clear sky radiation was determined and compared with the measured GHI, then separated into acceptable and unacceptable days. The days were statistically analyzed separately to eliminate outliers and obtain results with a greater margin of error, however, the final percentage contributed to the summative evaluation and final determination of the values.
The GHI and data sample was registered on the ePPI Reviewer 6 platform, version 6.15, on October 23, 2023, under ID: 44675, having generated around 756 of the keywords collected that interconnect from the interconnection diagram built in VOS explorer, and then validated, the system presented a set of meta-analysis guiding to: the determination of clearness sky index, determination of as the selected method, and with the randomized values of this the course evaluation diary of a day, its temporal deviation during a year, temporal analysis using histograms, analysis of the index of variability as a function of time of day, the rate of variability using various methods, adjustment of normalized , study of effects of , the temporal variability of a singular measurement point and the spatial-temporal variability between two points, and their correlation and regression of . Additionally, the data was dragged to observe possible analyses in the STATA Software. It was possible to observe the similarity in some meta-analyses (ID: 36458), highlighting proposals for energy accessibility in different stations throughout the chosen section.
3.5. Noise in the Solar Energy and Quality Dataset
On all days analyzed in the diapason, most of the sample data had values included in the extraterrestrial solar energy spectrum, that is, the solar constant. The values that were outside this spectrum due to sometimes multiple solar reflections, human intervention, obstacles, shading, and external lighting, were considered in the class of unacceptable days that were corrected by interpolation using Random Forest machine learning models to eliminate excessive fluctuations. In cases of days with more than 50% of missing measurements due to measurement failures, shading and/or power outages and/or failures of mini solar power supplies of grounded power supplies, they were classified as non-applicable days. The final results of the classification revealed the majority of days with intermediate sky types and clear sky days, with fewer cloudy sky days observed throughout the study region than in areas with strong solar incidence.
4. Usefulness and Applicability of the Solar Energy Dataset
For short–scale measurements, the sample was measured using standardized pyranometers between one and ten minutes. The data logger received the sample, and the computer application “NRD” extracted the results. Eq. 1 was then used to calculate the , clear, cloudy, and intermediate sky days were the classifications given to the randomized data. In addition, in all seasons, clear sky days have a high energy flow with an index close to 1. Cloudy sky days with strong obstruction to the passage of solar energy are observed with a clear sky index close to 0.2. Intermediate sky days present intermediate characteristics between the two previously described. An analysis of all types of day shows a marked variation in the clear sky index for values between 0.2 and 1.
To determine the proportion of acceptable, unacceptable, and unapplicable days, the spectral comparison of the clear sky radiation (ignoring all atmospheric constituents) and the GHI (radiation lowered by the various atmospheric constituents: clouds, gases, water vapor, etc.) uses. Using clear, cloudy, and intermediate sky days as well as acceptable, unacceptable, and unapplicable days, this qualitative analysis shows the variability of solar energy. The development of each type of day as well as of all types of days has a central maximum close to zero, always varying in the range of -1 to 1. Intermediate sky days with intermediate characteristics between clear and intermediate sky days are potentially the ones that most affect photovoltaic production, registering an abrupt decrease at a frequency of around 0.8 and then with wide arms in which solar radiation gradually decreases, impacting the output power in a solar PV power plant.
This data provides energy levels, as well as periods of lower and higher incidence (June and December for the study region) that constitute a tool for dimensioning PV system projects based on the energy available at each location. Knowledge and optimal handling of these energy parameters eliminate the effect of variability on the output of a solar plant, by a priori preventing the PV cells from being impacted by the high variability of solar energy, which can occasionally result in hot spots and overloads that impact the PV modules, the optimal operation of the systems and the final PV production at the output of a solar plant, extending the useful life of the system.
The association between clear, cloudy, and intermediate sky days, as well as of all days during the full research area, was examined using eq. 2 and 3 for each class of acceptable and unacceptable days. It shows that increasing distances, the spatial correlation structures of the three sky types, along the analysis section, also differ in their decay rates: for acceptable days, the approximate values of under cloudy sky conditions are 0.79565, clear 0.8783, intermediate 0.8579, and all-sky types 0.8024; on unacceptable days under cloudy sky conditions 0.8524, clear 0.8828, intermediate 0.6854 and all-sky types 0.6325.
The region shows a non-linear regression with a tendency towards logarithmic behavior, with a regression coefficient of approximately 0.8254 and 0.9684 for all types of days. For the and their increase for acceptable days regression coefficients are, 0.8256 and 0.8483 for clear days, 0.7564 and 0.8489 for cloudy days, 0.7225 and 0.8447 for intermediate sky days, and 0.7178 and 0.7459 for all sky types. For unacceptable days, the regression coefficients for, for clear days 0.7458 and 0.7248, for cloudy days 0.6487 and 0.8789, intermediate sky days are 0.7489 and 0.8789, and for all sky types 0.7885 and 0.8487.
The trajectory back to the norm is more noticeable on days with intermediate sky conditions, in comparison to other types of sky conditions. The geospatial-temporal distribution of solar energy indicates frequency of increasing trends in clear sky days being higher in 2024 than it was in 2005. On cloudy sky days, there is a greater tendency for the clear sky index to rise. Prior to the trending higher in 2024, the frequency of occurrence density was higher in 2005 but declined thereafter. The was 0.6218 in Maputo, 0.8778 in Inhambane, Tete average of 0.9979, 0.8211 in Sofala, 0.7258 in Manica, 0.6997 in Zambezia, 0.7320 in Niassa, 0.9287 in Niassa, 0.8616 in Nampula, and 0.7628 in Cabo-Delgado, as shown in Figure 3a.
In all measurement years, as shown in Figure 3b, the average is -0.0416 in Maputo, -0.0686 in Gaza, 0.0878 in Inhambane, 0.0941 in Tete, -0.0654 in Sofala, -0.01985 in Zambezia, -0.2333 at Niassa, -0.20427 in Nampula, and 0.01537 in Cabo-Delgado province.
4.2. Limitations
Several restrictions were faced during the data collection process, including the inability to install radiometers on towers that were shade-free, frequent interruptions in the conventional electric current that was connected to the solar PV-hybrid data storage base in the data logger, and bird obstructions that hindered measurements, particularly around the central region stations. Techniques were employed, nevertheless, to rule out any sample influence flaws. Not having access to GHI data samples that are measured at short intervals (less than one minute and ten minutes) to compare the raw sample. A binomial distribution can be used to classify the different types of days in a similar way to the study using sun brightness hours, cloud speed, and dynamics.
Supplementary Materials
The following supporting information can be downloaded at: https://github.com/Muco-1990/Accessibility.git.
Author Contributions
In this research article, the conceptualization, methodology, and validation, formal analysis, were in charge of Fernando Mucomole, the investigation, resources, data curation, writing, preparation of the original draft, writing, review, and editing, acquisition of funding, visualization and software was in charge of the main author Fernando V. Mucomole and Lourenco L. Magaia, the supervision, project administration was in charge of Fernando V. Mucomole and Carlos A. S. Silva, the advanced curation of data, writing and supervision was in charge of Fernando V. Mucomole, Carlos A. S. Silva, Lourenco L. Magaia. All authors read and agreed with the published version of the manuscript.
Funding
This research is funded by CS–OGET, Faculty of Engineering, Eduardo Mondlane University, for doctoral research.
Institutional Review Board Statement
Not applicable.
Informed Consent Statement
Not applicable.
Data Availability Statement
The data that backs up the reported outcomes is accessible on the NOAA [24] website at https://www.noaa.gov/weather, PVGIS [22] website at https://re.jrc.ec.europa.eu/pvg_tools/en/#MR, Meteonorm [25] at website at https://www.noaa.gov/weather, and the NASA POWER [23] website at https://power.larc.nasa.gov/data-access-viewer/. Additional data that supports the conclusions of this research have not been released and can be obtained from INAM [21], FUNAE [20], UEM [34], or by contacting the corresponding author upon request.
Acknowledgments
We express our gratitude to the FUNAE, entities for their assistance in providing us with sample data from the campaign. We would also like to thank INAM for supplying us with the sample of solar radiation data spanning from 2005 to 2024, and for granting us access to their facilities for training and experimental tests. Additionally, we extend our appreciation to the Department of Physics at Eduardo Mondlane University for generously making their facilities available for real-time testing and measurements of the latest solar energy behavior. Their provision of a laboratory for data processing greatly contributed to the compilation of this research. Lastly, we would like to acknowledge CS-OGET for their support, as it played an integral role in the culmination stage of this research.
Conflicts of Interest
No conflicts of interest.
Abbreviations
| − Clear-sky index; |
| – Clear–sky radiation; |
| – First quartile; |
| – Second quartile; |
| – Third quartile; |
| – Lower whisker; |
| – Upper whisker; |
| Apr – April; |
| Aug – August |
| Be_1 – Barue–1; |
| Be_2 – Barue–2; |
| Cha – Chipera; |
| CR23X – Campbell data logger; |
| CS–OGET – Center of Excellence of Studies in Oil, Gas Engineering and Technology; |
| CSV – Comma-Separated Values; |
| Dec – December; |
| DNI – Direct Normal Irradiance; |
| ePPI – Electronic Patient-Reported Performance Indicators; |
| Eq – Equation; |
| Feb – February; |
| FUNAE – National Energy Fund; |
| GHI – Global horizontal irradiance; |
| Id. or ID – Identification; |
| INAM – Mozambique National Institute of Meteorology; |
| IQR – interquartile; |
| kt*_C_A – Clear-sky index on clear sky acceptable days; |
| kt*_C_NA – Clear-sky index on clear sky unacceptable days; |
| kt*_Cy_A – Clear-sky index on cloudy sky acceptable days; |
| kt*_Cy_NA – Clear-sky index on cloudy sky acceptable days; |
| kt*_I_A – Clear-sky index on intermediate sky acceptable days; |
| kt*_I_NA – Clear-sky index on intermediate sky acceptable days; |
| VOS – Visualization of Similarities; |
| Δkt*_C_A – Clear-sky index increments on clear sky acceptable days; |
| Δkt*_C_NA – Clear-sky index increments on clear sky unacceptable days; |
| Δkt*_Cy_A – Clear-sky index increments on cloudy sky acceptable days; |
| Δkt*_Cy_NA – Clear-sky index increments on cloudy sky acceptable days; |
| Δkt*_I_A – Clear-sky–index increments on intermediate sky acceptable days; |
| Δkt*_I_NA – Clear-sky index increments on intermediate sky acceptable days. |
References
- Duffie, J.A.; Beckman, W.A. Solar Engineering of Thermal Processes; Wiley: New York, NY, USA, 1980.
- M. Iqbal, An introduction to solar radiation. Toronto ; New York: Academic Press, 1983.
- F. V. Mucomole, C. A. S. Silva, and L. L. Magaia, “Regressive and Spatio-Temporal Accessibility of Variability in Solar Energy on a Short Scale Measurement in the Southern and Mid Region of Mozambique,” Energies, vol. 17, no. 11, p. 2613, Jan. 2024. [CrossRef]
- S. R. Wenham, M. A. Green, M. E. Watt, R. Corkish, and A. Sproul, Eds., Applied Photovoltaics, 3rd ed. London: Routledge, 2011. [CrossRef]
- F. V. Mucomole, C. A. S. Silva, and L. L. Magaia, “Modeling Parametric Forecasts of Solar Energy over Time in the Mid-North Area of Mozambique,” Energies, vol. 18, no. 6, Art. no. 6, Jan. 2025. [CrossRef]
- F. V. Mucomole, C. A. S. Silva, and L. L. Magaia, “Experimental Parametric Forecast of Solar Energy over Time: Sample Data Descriptor,” Data, vol. 10, no. 3, Art. no. 3, Mar. 2025. [CrossRef]
- M. A. Hassan et al., “Evaluation of energy extraction of PV systems affected by environmental factors under real outdoor conditions,” Theor. Appl. Climatol., vol. 150, no. 1–2, pp. 715–729, Oct. 2022. [CrossRef]
- R. A. J. Neggers, H. J. J. Jonker, and A. P. Siebesma, “Size Statistics of Cumulus Cloud Populations in Large-Eddy Simulations,” J. Atmospheric Sci., vol. 60, no. 8, pp. 1060–1074, Apr. 2003. [CrossRef]
- M. J. R. Perez and V. M. Fthenakis, “On the spatial decorrelation of stochastic solar resource variability at long timescales,” Sol. Energy, vol. 117, pp. 46–58, Jul. 2015. [CrossRef]
- T. E. Hoff and R. Perez, “Quantifying PV power Output Variability,” Sol. Energy, vol. 84, no. 10, pp. 1782–1793, Oct. 2010. [CrossRef]
- G. M. Lohmann, “Irradiance Variability Quantification and Small-Scale Averaging in Space and Time: A Short Review,” 2018.
- A. W. Aryaputera, D. Yang, L. Zhao, and W. M. Walsh, “Very short-term irradiance forecasting at unobserved locations using spatio-temporal kriging,” Sol. Energy, vol. 122, pp. 1266–1278, Dec. 2015. [CrossRef]
- B. Yu, H. Liu, J. Wu, and W.-M. Lin, “Investigating impacts of urban morphology on spatio-temporal variations of solar radiation with airborne LIDAR data and a solar flux model: a case study of downtown Houston,” Int. J. Remote Sens., vol. 30, no. 17, pp. 4359–4385, Aug. 2009. [CrossRef]
- F. V. Mucomole, C. A. S. Silva, and L. L. Magaia, “Parametric Forecast of Solar Energy over Time by Applying Machine Learning Techniques: Systematic Review,” Energies, vol. 18, no. 6, Art. no. 6, Jan. 2025. [CrossRef]
- A. Trindade and L. C. Cordeiro, “Synthesis of Solar Photovoltaic Systems: Optimal Sizing Comparison,” in Software Verification, vol. 12549, M. Christakis, N. Polikarpova, P. S. Duggirala, and P. Schrammel, Eds., in Lecture Notes in Computer Science, vol. 12549. Cham: Springer International Publishing, 2020, pp. 87–105. [CrossRef]
- A. Takilalte, S. Harrouni, M. R. Yaiche, and L. Mora-López, “New approach to estimate 5-min global solar irradiation data on tilted planes from horizontal measurement,” Renew. Energy, vol. 145, pp. 2477–2488, Jan. 2020. [CrossRef]
- A. U. Obiwulu, N. Erusiafe, M. A. Olopade, and S. C. Nwokolo, “Modeling and estimation of the optimal tilt angle, maximum incident solar radiation, and global radiation index of the photovoltaic system,” Heliyon, vol. 8, no. 6, p. e09598, Jun. 2022. [CrossRef]
- R. Van Haaren, M. Morjaria, and V. Fthenakis, “Empirical assessment of short-term variability from utility-scale solar PV plants: Assessment of variability from utility-scale solar PV plants,” Prog. Photovolt. Res. Appl., vol. 22, no. 5, pp. 548–559, May 2014. [CrossRef]
- G. Koudouris, P. Dimitriadis, T. Iliopoulou, N. Mamassis, and D. Koutsoyiannis, “A stochastic model for the hourly solar radiation process for application in renewable resources management,” Adv. Geosci., vol. 45, pp. 139–145, Aug. 2018. [CrossRef]
- FUNAE—National Energy Fund of Mozambique, Data on the solar radiation component extracted from the energy atlas. Available online: https://funae.co.mz/ (accessed on 30 April 2023).
- INAM—Mozambique’s National Institute of Meteorology, Weather and Solar Data. Available online: https://www.inam.gov.mz/index.php/pt/ (accessed on 9 December 2024).
- “JRC Photovoltaic Geographical Information System (PVGIS) - European Commission.” Accessed: Apr. 04, 2025. [Online]. Available: https://re.jrc.ec.europa.eu/pvg_tools/en/#MR.
- AERONET—Aerosol Robotic Network, Site Information Page, 2019. Available online: https://aeronet.gsfc.nasa.gov/new_web/webtool_aod_v3.html (accessed on 29 August 2024).
- “NOAA AVHRR derived aerosol optical depth over land - Hauser - 2005 - Journal of Geophysical Research: Atmospheres - Wiley Online Library.” Accessed: Sep. 04, 2024. [Online]. [CrossRef]
- “Meteonorm Version 8 - Meteonorm (de).” Accessed: Apr. 04, 2025. [Online]. Available: https://meteonorm.com/meteonorm-version-8.
- D. Kumar, “Hyper-temporal variability analysis of solar insolation with respect to local seasons,” Remote Sens. Appl. Soc. Environ., vol. 15, p. 100241, Aug. 2019. [CrossRef]
- R. Perez et al., “Spatial and Temporal Variability of Solar Energy,” Found. Trends® Renew. Energy, vol. 1, no. 1, pp. 1–44, 2016. [CrossRef]
- H. Verbois et al., “Improvement of satellite-derived surface solar irradiance estimations using spatio-temporal extrapolation with statistical learning,” Sol. Energy, vol. 258, pp. 175–193, Jul. 2023. [CrossRef]
- D. Amjad, S. Mirza, D. Raza, F. Sarwar, and S. Kausar, “A Statistical Modeling for spatial-temporal variability analysis of solar energy with respect to the climate in the Punjab Region,” vol. 7, p. 10, Mar. 2023.
- Wilson P. and Tanaka O. K., Statistics, Basic Concepts —Wilson Pereira/Oswaldo K. Tanaka, 2018. Available online: https://www.estantevirtual.com.br/livros/wilson-pereira-oswaldo-k-tanaka/estatistica-conceitos-basicos/189548989 (accessed on 6 February 2024).
- F. V. Mucomole, C. A. S. Silva, and L. L. Magaia, “Temporal Variability of Solar Energy Availability in the Conditions of the Southern Region of Mozambique,” Am. J. Energy Nat. Resour., vol. 2, no. 1, Art. no. 1, Mar. 2023. [CrossRef]
- F. V. Mucomole, C. S. A. Silva, and L. L. Magaia, “Quantifying the Variability of Solar Energy Fluctuations at High–Frequencies through Short-Scale Measurements in the East–Channel of Mozambique Conditions,” Am. J. Energy Nat. Resour., vol. 3, no. 1, Art. no. 1, Apr. 2024. [CrossRef]
- J. Marcos, L. Marroyo, E. Lorenzo, D. Alvira, and E. Izco, “Power output fluctuations in large scale pv plants: One year observations with one second resolution and a derived analytic model: Power Output Fluctuations in Large Scale PV plants,” Prog. Photovolt. Res. Appl., vol. 19, no. 2, pp. 218–227, Mar. 2011. [CrossRef]
- Eduardo Mondlane University—Undergraduate, Postgraduate, Extension and Innovation (Department of Physics). Available online: https://uem.mz/index.php/en/home-english/ (accessed on 9 December 2024).
Figure 1.
Acceptable, Unacceptable, and unapplicable days in Massangena during the 2005-2011.
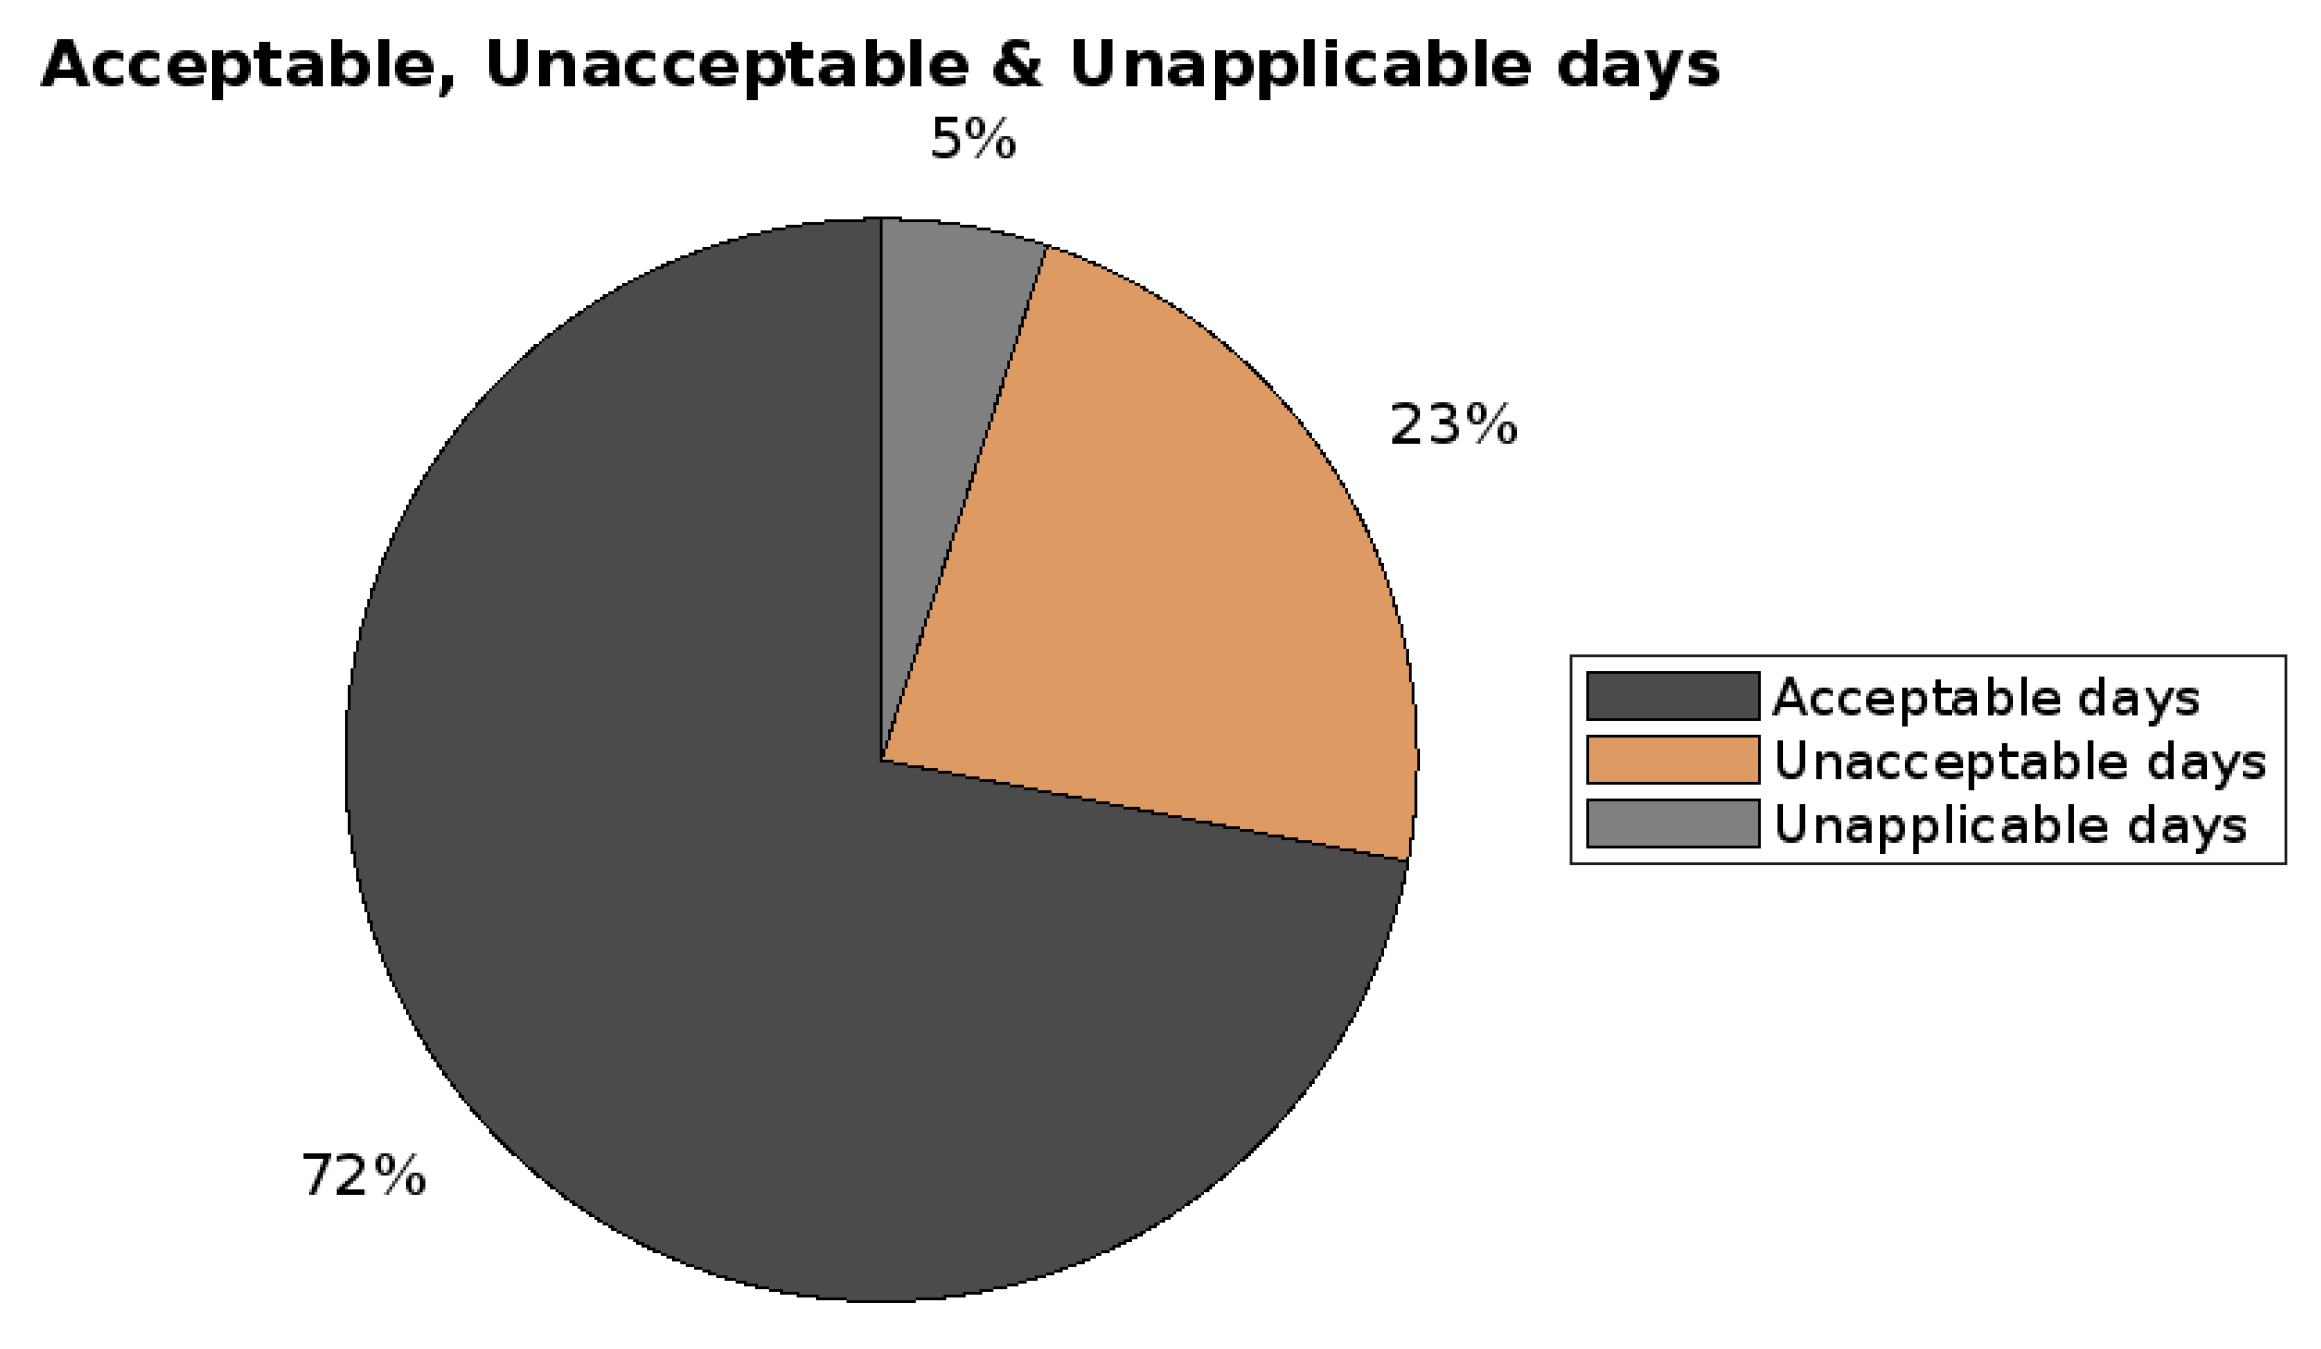
Figure 2.
Effect of regressive transmittances along the study region.
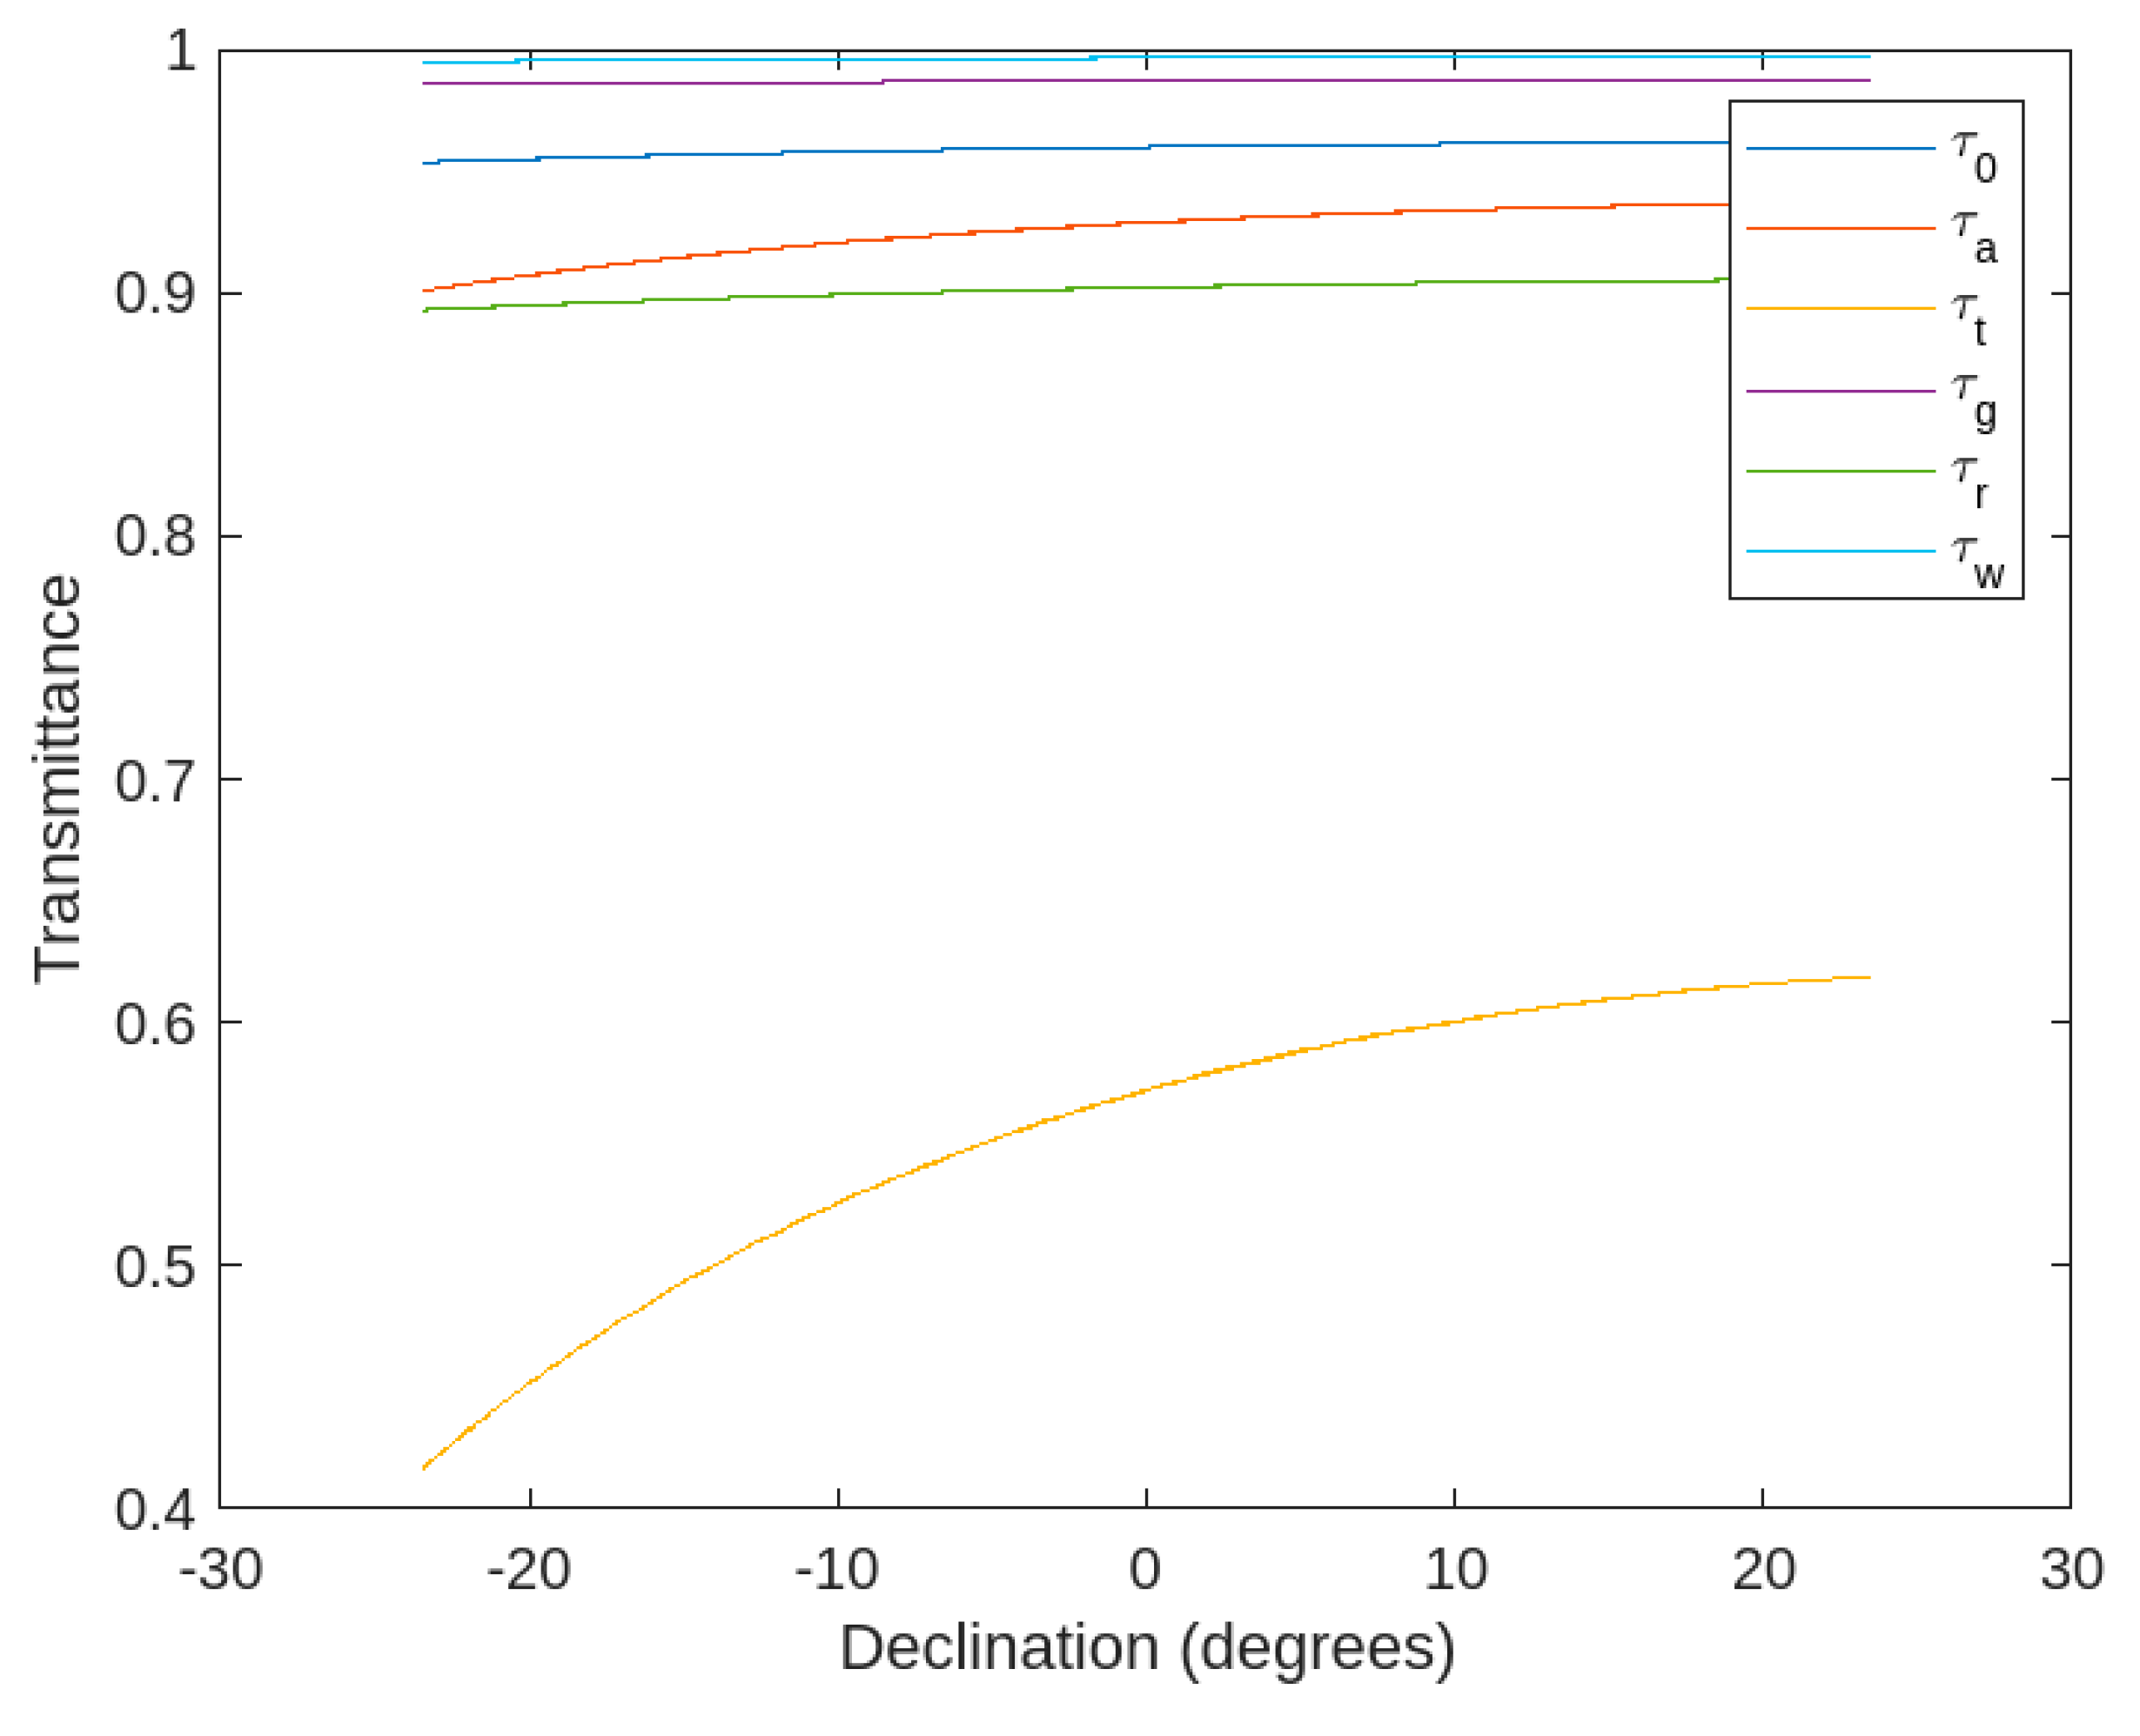
Figure 3.
Casual inference of solar energy in Mozambique consisting in Regressive and spatio-temporal accessibility of variability (a) , and (b) .
Figure 3.
Casual inference of solar energy in Mozambique consisting in Regressive and spatio-temporal accessibility of variability (a) , and (b) .
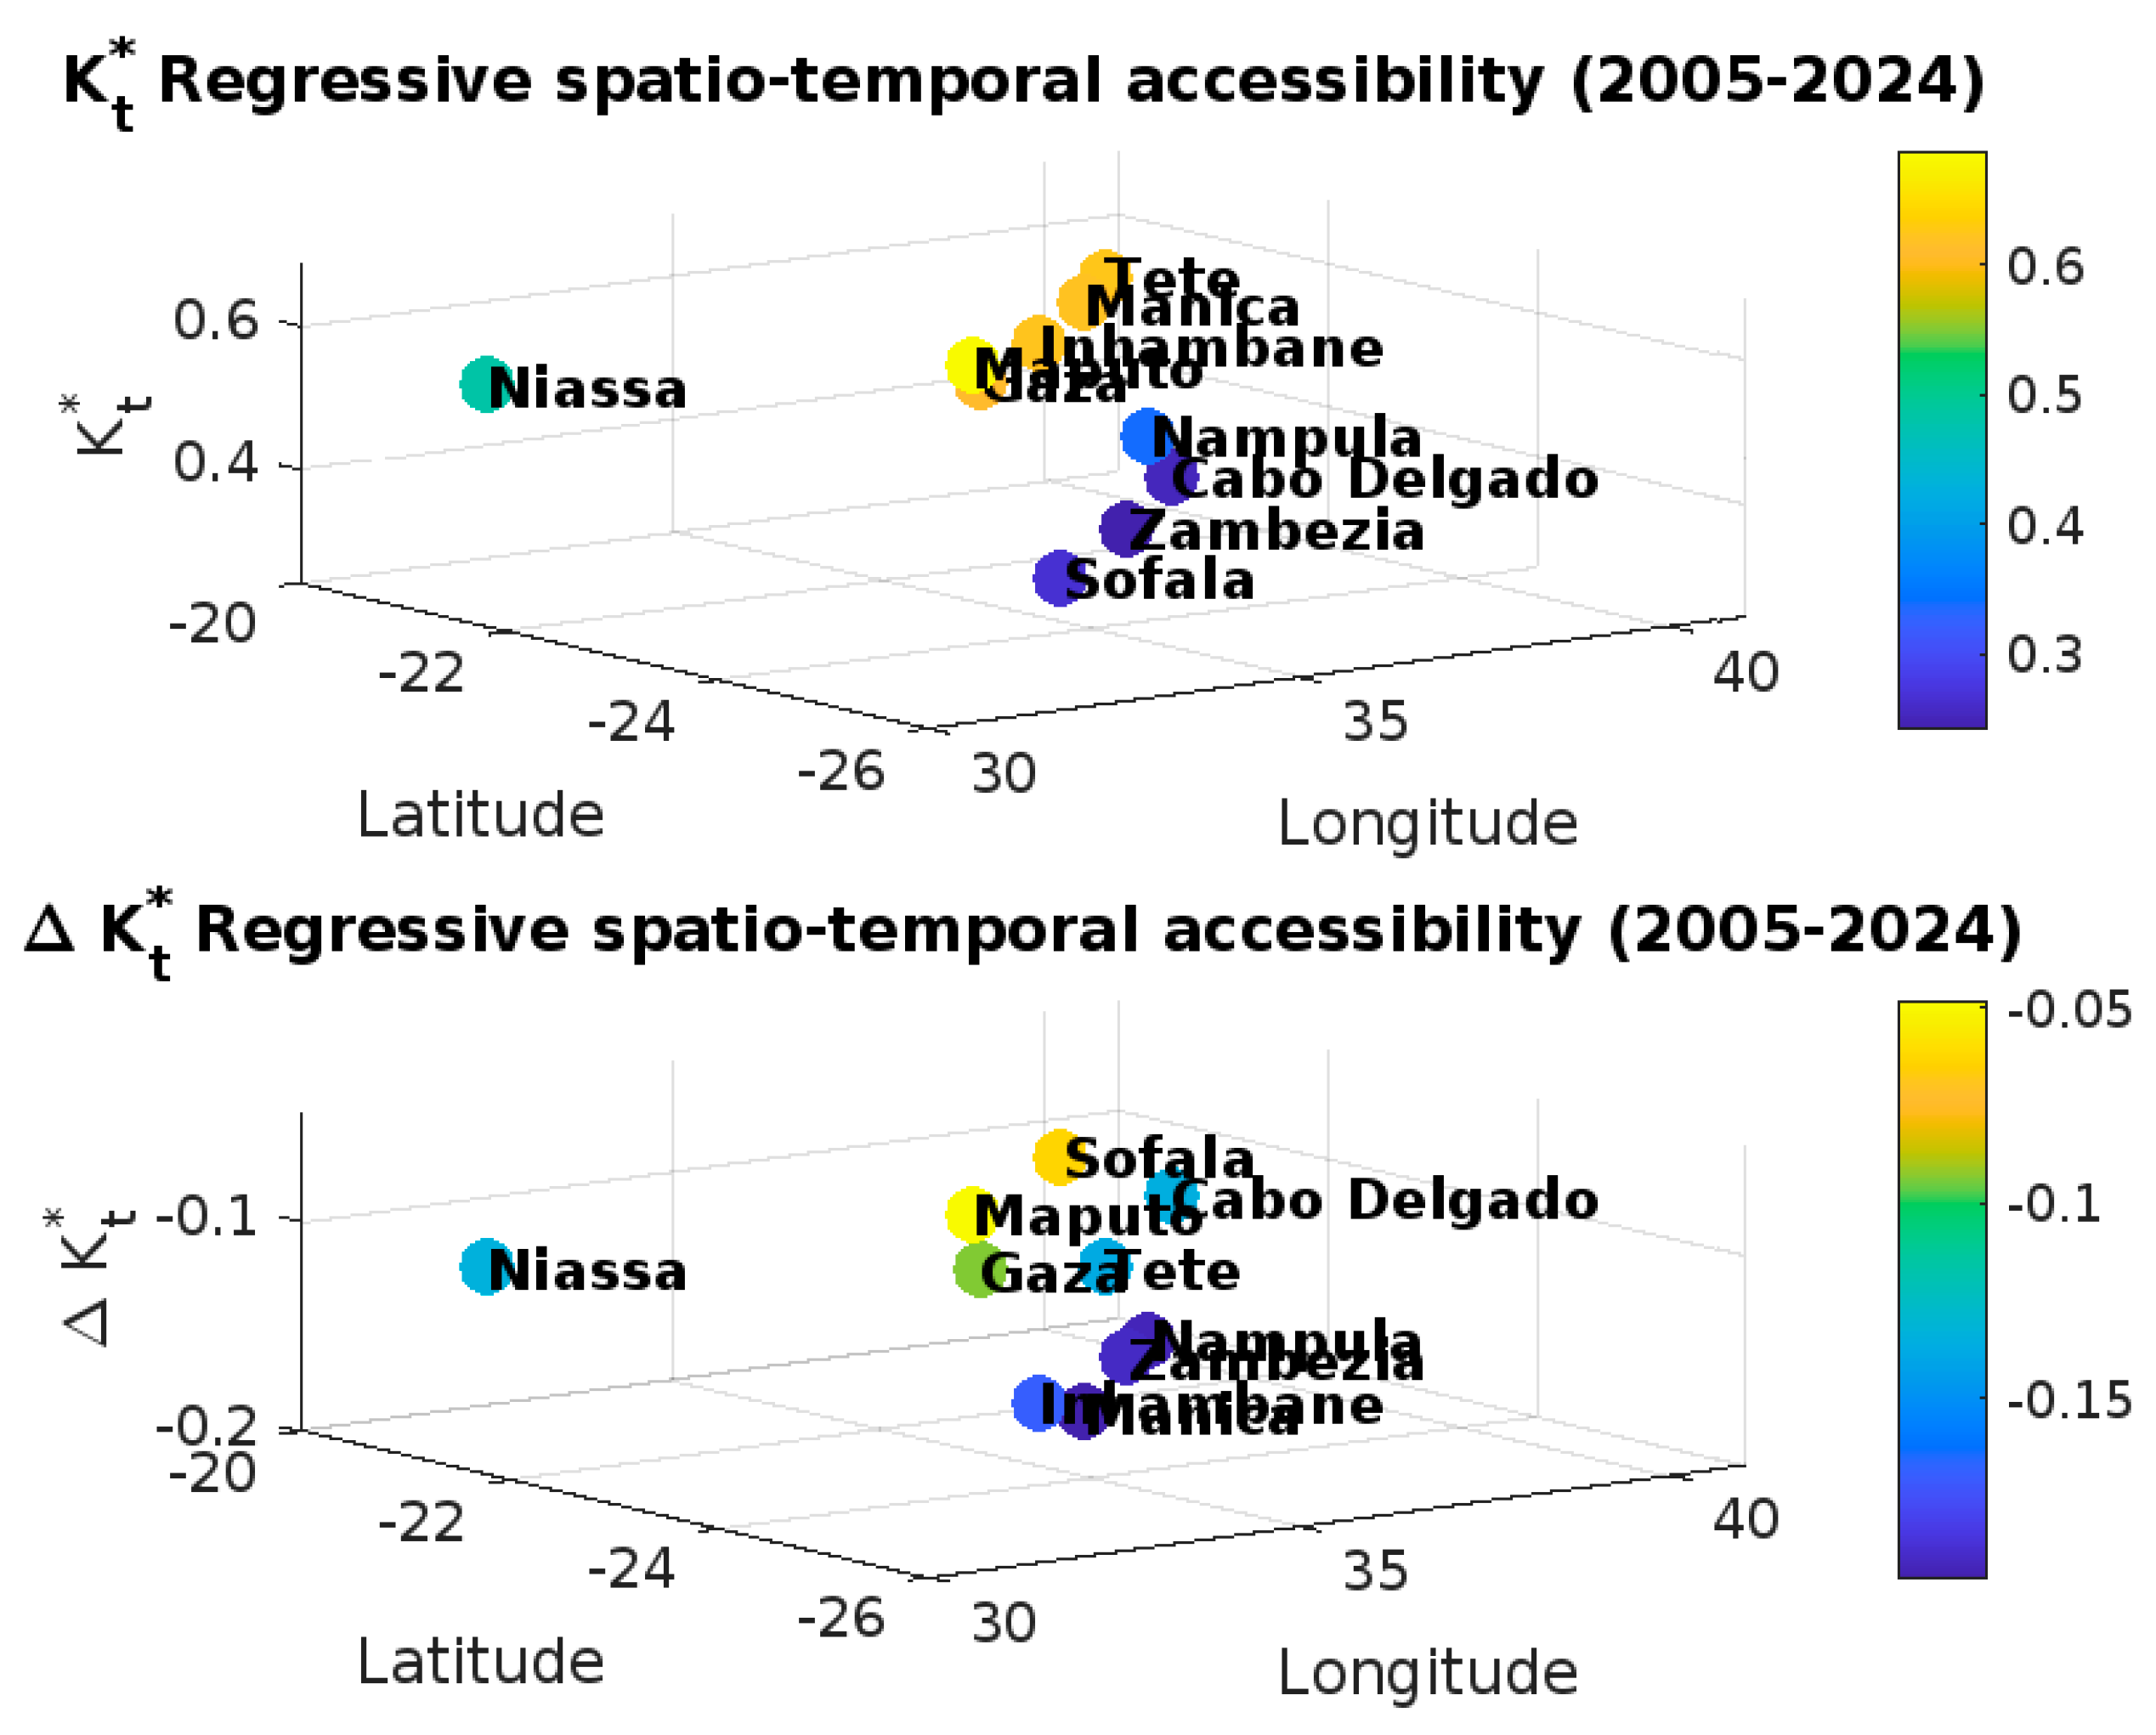

Table 1.
Selection of days at the Barue–1.
| Files | Content | Interval | Sample |
|---|---|---|---|
| “daily_GHI_Chomba(2005-2024)”, “daily_GHI_Nanhupo-1(2005-2024)”, “daily_GHI_Nanhupo-2(2005-2024)”, “daily_GHI_Nipepe-1(2005-2024)”, “daily_GHI_Nipepe-2(2005-2024)”, “daily_GHI_Chipera(2005-2024)”, “daily_GHI_Nhamadzi(2005-2024)”, “daily_GHI_Barue-1(2005-2024)”, “daily_GHI_Barue-2(2005-2024)”, “daily_GHI_Lugela-1(2005-2024)”, “daily_GHI_Lugela-2(2005-2024)”, “daily_GHI_Pembe(2005-2024)”, “daily_GHI_Ndindiza(2005-2024)”, “daily_GHI_Massangena(2005-2024)” and “daily_GHI_Maputo–1(2005-2024)” | GHI measurements at the stations | 1, 10 minutes, and 1 hour | Input |
| “Chipera_A(2005-2024)”, “Nhamadzi_A(2005-2024)”, “Barue–1_A(2005-2024)” and “Barue–2_A(2005-2024)” |
data for acceptable days measured | 1, 10 minutes, and 1-hour | Output and input |
| “_accepted_unaccepted_unapplicable start with: “Barue_1_2005_2011”, “Barue_1_2012_2018” and “Barue_1_2014” they refer to the classification at the Barue_1 station in the years 2005 to 2024; by “Barue_2_2005_2011, “Barue_2_2012_2018” and “Barue_2_2019_2024” | acceptable, unacceptable and not applicable | 1 hour, and 1-hours | Output |
Table 2.
Selection of days at the Barue–1 station in 2005-2011.
| Month | Acceptable Days | Unacceptable Days | Unapplicable Days | |||
|---|---|---|---|---|---|---|
| Nr. | Id. | Nr. | Id. | Nr. | Id. | |
| January | 11 | 1, 17, 18, 19, 23, 24, 25, 26, 28, 30, 31 | 20 | 2, 3, 4, 5, 6, 7, 8, 9, 10, 11, 12, 13, 14, 15, 16, 20, 21, 22, 27, 29 | 0 | None |
| February | 17 | 1, 3, 4, 10, 15, 16, 17, 18, 19, 20, 21, 23, 24, 25, 26, 27, 28, | 11 | 2, 5, 6, 7, 8, 9, 11, 12, 13, 14, 22 | 0 | None |
| March | 24 | 1, 2, 3, 4, 5, 6, 7, 8, 9, 12, 13, 14, 15, 17, 18, 19, 20, 21, 22, 23, 24, 25, 29, 30 | 7 | 10, 11, 16, 26, 27, 28, 31 | 0 | None |
| April | 25 | 1, 2, 3, 4, 6, 7, 8, 9, 10, 13, 14, 15, 16, 17, 18, 19, 20, 21, 22, 23, 26, 27, 28, 29, 30 | 4 | 11, 12, 5, 24, 25 | 0 | None |
| May | 28 | 1, 2, 3, 4, 5, 6, 7, 8, 9, 10, 11, 12, 13, 14, 15, 16, 17, 21, 22, 23, 24, 25, 26, 27, 28, 29, 30, 31 | 3 | 18, 19, 20 | 0 | None |
| June | 22 | 2, 3, 4, 5, 6, 7, 8, 9, 13, 14, 15, 17, 19, 20, 22, 25, 26, 27, 28, 29, 30 | 8 | 10, 11, 12, 16, 18, 21, 23, 24 | 0 | None |
| July | 25 | 1, 2, 3, 4, 5, 7, 8, 9, 10, 12, 13, 14, 15, 16, 17, 20, 21, 23, 24, 25, 26, 27, 28, 29, 31 | 5 | 6, 11, 18, 19, 30 | 0 | None |
| August | 15 | 3, 4, 5, 6, 7, 8, 9, 10, 11, 12, 13, 14, 15, 16, 17 | 16 | 1, 2, 18, 19, 20, 21, 22, 23, 24, 25, 26, 27, 28, m29, 30, 31 | 0 | None |
| September | 14 | 4, 5,6, 7, 8, 9, 11, 17, 23, 24, 25, 26, 27, 28 | 15 | 1, 2, 3, 12, 13, 14, 15, 16, 18, 19, 20, 21, 22, 29, 30 | 0 | None |
| October | 21 | 2, 3, 4, 5, 6, 8, 9, 10, 11, 12, 13, 16, 20, 21, 22, 25, 26, 27, 29, 30, 31 | 8 | 1, 7, 14, 15, 17, 19, 23, 24 | 2 | 18, 28 |
| November | 19 | 1, 2, 5, 6, 7, 13, 14, 15, 16, 17, 18, 20, 21, 25, 26, 27, 28, 29, 30 | 11 | 3, 4, 8, 9, 10, 11, 12, 19, 22, 23, 24 | 0 | None |
| December | 15 | 1, 2, 3, 4, 5, 9, 10, 11, 13, 23, 24, 25, 26, 27, 28 | 16 | 6, 7, 8, 12, 14, 15, 16, 17, 18, 19, 20, 21, 22, 29, 30, 31 | 0 | None |
Disclaimer/Publisher’s Note: The statements, opinions and data contained in all publications are solely those of the individual author(s) and contributor(s) and not of MDPI and/or the editor(s). MDPI and/or the editor(s) disclaim responsibility for any injury to people or property resulting from any ideas, methods, instructions or products referred to in the content. |
© 2025 by the authors. Licensee MDPI, Basel, Switzerland. This article is an open access article distributed under the terms and conditions of the Creative Commons Attribution (CC BY) license (http://creativecommons.org/licenses/by/4.0/).
Copyright: This open access article is published under a Creative Commons CC BY 4.0 license, which permit the free download, distribution, and reuse, provided that the author and preprint are cited in any reuse.


