
Submitted:
19 April 2025
Posted:
21 April 2025
You are already at the latest version
Abstract
Nearly one million people in Amazon still don't have reliable access to electricity. Moreover, the rural electricity grid is mostly single-phase, ground-return type, with poor energy quality and high expenses. This study examines very low head micro hydro power (MHP) installations in Amazon, emphasizing the integration of multiple axial-flow turbines. It includes an analysis of flow duration curves and key curves, both upstream and downstream, to design an MHP with two or more units aimed at maximizing annual energy generation. The presence of multiple turbines is crucial due to the substantial annual flow variation in the Amazon rivers. This research supports the design of small, cost-effective axial-flow hydraulic turbines. The design applies the minimum pressure coefficient criterion to increase turbine efficiency. Computational Fluid Dynamics (CFD) simulations forecast turbine efficiency and flow behavior. The CFD model is validated against an existing experimental study from the literature on a propeller turbine with a curved plate blade, which is similarly used in this study due to cost reasons. The study also explores the implications of including inlet guide vanes (IGV). A case study is showcased for a location at a small bridge in Vila do Janari, situated in the southeastern part of Pará state, where heads range from 1.4 to 2.4 m and turbine flow rates span from 0.23 to 0.92 m³/s. The optimal configuration shows the potential to generate 63 MWh/year.
Keywords:
Micro-hydropower
; axial-flow turbines
; Amazon energy access
; CFD
; minimum pressure coefficient
1. Introduction
Brazil has a vast and diverse electrical grid; however, remote areas of the Amazon remain underserved, with about one million people lacking reliable electricity access [1]. Nearly one-third of this population resides in isolated communities that rely on polluting diesel generators, which increases public health risks and contributes to environmental degradation [2]. Government programs such as Mais Luz para a Amazônia (MLA), analyzed by [3], aim to achieve universal energy access. However, progress is hindered by geographic isolation, weak governance, and deteriorating infrastructure, particularly the collapse of wooden bridges essential for transportation and maintenance [4,5]. Paradoxically, Amazon’s extensive hydrographic network holds untapped potential for decentralized hydropower, presenting a promising pathway for economic development and social equity [6,7].
While conventional hydropower systems are central to Brazil’s energy matrix, they are often impractical in the Amazon due to low topographic heads (<3 m) and significant seasonal variations in river discharge [8,9]. Advances in Very Low Head Turbines (VLHTs) provide a promising solution in these contexts [10,11]. However, current designs frequently fail to align with broader infrastructure modernization efforts, such as replacing wooden bridges with concrete structures, and often neglect to address hydrological variability. Modular micro-hydropower systems, like those proposed by [12], have achieved up to 73% efficiencies in low-head environments. Nevertheless, standardized design criteria for very low head applications remain underdeveloped [13]. Additionally, existing hydrological optimization frameworks often overlook turbine design parameters [14], failing to link flow duration curves to blade geometry—a critical oversight in regions with pronounced seasonal flow fluctuations.
The rural community of Vila do Janari exemplifies these challenges. Located along the Água Preta river in southeastern Pará (Figure 1), the community depends on a deteriorating wooden bridge for transportation and agricultural logistics, underscoring broader infrastructure vulnerabilities. This study proposes a hybrid dam-bridge-turbine system that leverages the Ecopontes initiative, designed to replace wooden bridges with concrete structures, thus reducing mobilization costs and incorporating fish ladders to protect aquatic biodiversity [15].
The turbine design integrates classical turbomachinery principles—such as velocity triangles [16] and an updated Cordier diagram customized for axial-flow turbines [17] with the minimum pressure coefficient criterion (Cpmin) to enhance hydraulic efficiency [18,19]. The Cp coefficient is defined by Eq. 1.
where p is the static pressure on the blade surface, p₀ is the reference pressure, and w is the relative flow velocity. This criterion defines a minimum Cp value on the suction side of the blade at the hub section to ensure optimal aerodynamic loading, as established by [18,19,20]. Muis et al. [19] achieved 91% efficiency in a 2-kW axial turbine operating at 1.2 m head.
Adapting such designs to Amazonian contexts requires simplification to suit local machining capabilities [21]. This study addresses the dual challenge of manufacturability and efficiency by employing circular arc cascades, validated by empirical studies [22,23], to balance performance with feasibility.
Given the critical role of cost in small hydropower development [24], a systematic comparison was conducted between IGV-equipped and non-IGV turbine configurations. IGVs improve flow guidance, reduce swirl losses, and enhance efficiency in low-head applications [25,26]. However, they increase manufacturing complexity and costs. In contrast, non-IGV turbines offer simpler fabrication but experience lower efficiency [27].
Computational Fluid Dynamics (CFD), a standard tool in VLHT design [28], was used to model a dual-turbine system tailored to the Água Preta River’s hydrology (head: 1.4–2.4 m; flow: 0.23–0.92 m³/s) [29]. Simulations employed the k-ω Shear Stress Transport (SST) turbulence model in Ansys CFX to solve the Reynolds-Averaged Navier-Stokes (RANS) equations, validating results against benchmark experimental data from [30].
The implementation costs for micro-hydro plants were derived from Balarim’s dissertation [31], which proposes expedited methodologies for cost estimation based on parameters such as power capacity (5–100 kW) and hydraulic head (5–60 m), covering civil and electromechanical components. The payback period was compared with the SCABCleuch Micro-Hydro Scheme case study, a Scottish project integrating initial investment data, annual energy generation, and tariff-based revenue [32]. The use of the Ecopontes program presents a strategic advantage by reducing mobilization costs when compared to standalone infrastructure projects [11]. The system is expected to operate seasonally, with an estimated annual generation of approximately 63 MWh, highlighting its operational resilience across both wet and dry seasons.
This analysis highlights the system’s affordability and environmental compatibility. The design mitigates ecological impacts by incorporating fish ladders and aligns with the “energy-ecology nexus” framework [15]. This research proposes a replicable, sustainable energy solution for the Amazon that integrates technical, economic, and environmental challenges.
2. Methods
This methodology outlines a systematic approach for designing and evaluating hydraulic turbines, integrating technical and economic analyses. It begins with a case study to define project scope and collect local hydrological data, followed by key curve analysis to identify critical flow and head scenarios. Turbine configurations are preliminarily selected and designed using the Cordier diagram and Cpmin criteria for high efficiency.
CFD simulations validate efficiency and pressure distribution performance metrics. A comparative analysis evaluates trade-offs between IGV-equipped and non-IGV turbines. Subsequently, micro hydro power plant costs are estimated through literature estimations to assess overall economic viability. Figure 2 illustrates the methodology.
2.1. The Use of Multiple Axial-Flow Turbines in Small Rivers
The turbine flow rates were determined based on the site’s flow (Qriver) duration curve, which indicates the frequency at which specific flow rates occur throughout the year. The smaller turbine (Q2) was designed to operate at Q95% (the flow rate exceeded 95% of the time), ensuring continuous operation throughout the year.
For the larger turbine (Q1), iterative configurations were tested in increments of 0.5 times the smaller turbine’s flow rate. The total design flow rate (Qp) corresponded to the combined flow rate in each case (Q1+Q2). The annual energy generated was calculated by integrating the power produced over time, considering:
- Exclusive operation of the smaller turbine when Q1 > Qriver>Q95%;
- Exclusive operation of the bigger turbine when Qp> Qriver> Q1;
- Combined operation of both turbines when Qriver>Qp;
- Spillage of excess flow when it occurs.
The optimal configuration was selected based on the combination yielding the highest annual energy output. Figure 3 illustrates this concept
While centrifugal pumps repurposed as turbines (PATs) typically offer cost advantages, axial flow pumps exhibit lower efficiency and higher costs when operated in reverse as turbines. In low-head, high-flow scenarios, axial pumps deviate significantly from their best efficiency point (BEP) as turbines, necessitating oversized or custom designs that escalate expenses. This inefficiency, compounded by seasonal flow variability, renders axial flow pumps less economically viable than purpose-built ultra-low-head axial turbines.
2.2. Main Turbine Parameters
The methodology for designing very low-head axial turbines was developed to maximize energy efficiency. The proposed approach integrates semi-empirical diagrams with the minimum pressure coefficient. For the primary geometric parameters of the rotor, the Cordier diagram was utilized to optimize the specific speed Nq (Equation 2) and rotor diameter, ensuring compatibility with ultra-low-head conditions. This methodology was further refined using the empirical diagrams of Menny [33] and the correlations proposed by Quaranta [34] to determine the optimal rotational speed and define key parameters such as the number of blades and the hub-to-tip ratio.
where n is the rotational speed (rpm), Q is the flow rate (m³/s), and H is the head (m).
2.3. Low-Cost Blade Design with Linearized Angle Variation
The proposed turbine design employs curved blades fabricated from sheet metal, significantly reducing manufacturing costs compared to CNC-machined or cast blades. The blade angle variation from hub to tip is linearized to simplify production, avoiding complex curvatures while maintaining hydraulic performance. The blade angle (β) is defined as a linear function of the radial position (rr) (Equation 3):
where βhub and βtip are the angles at the hub and tip, respectively. This linearization reduces machining complexity and enables mass production using standard sheet metal forming techniques. While this approach introduces a minor efficiency penalty compared to optimized angles, the cost reduction in material and labor justifies its adoption for small-scale hydropower applications.
2.4. Euler’s Equation and Guide Vanes Design
The turbine’s hydraulic efficiency hinges on optimizing velocity triangles at the rotor inlet and outlet, governed by Euler’s turbomachinery (Equation 4):
U is the blade speed, and Cu is the difference in tangential components of the absolute velocity at the rotor inlet and outlet. Without an IGV, the incoming flow exhibits higher relative velocity (W) (Figure 4a) and unfavorable incidence angles, leading to excessive aerodynamic loading on the rotor blades. This overload increases separation risks and reduces efficiency. Including an IGV rectifies this issue by imparting pre-swirl (Cu1) to the flow, aligning it with the rotor blade angle and reducing W (Figure 4b). This adjustment ensures smoother energy transfer.
2.5. The Minimum Pressure Coefficient Criterion for Axial-Flow Turbine Design
Following the preliminary design phase, the Cpmin criterion is applied to evaluate blade cascade performance at the selected operating point. This analysis focuses on balancing two aerodynamic thresholds:
Cpsi (inferior limit): Below this value, boundary layer separation risks escalate due to excessive pressure loading.
Cpss (superior limit): Above this value, friction losses dominate due to larger wet surfaces.
Recommended Cpmin ranges are specific for each application. For example, Cruz et al. [20] propose a range of -0.8 to -0.4 for Nq=278, while Sutikno [18] advocates -2.25 to -1.25 for Nq=102. This work selects the applicable range based on the numerical validation to balance aerodynamic loading and loss mitigation. This ensures the blade cascade operates within thresholds that minimize boundary layer separation risks and excessive friction losses, as illustrated in Figure 5.
2.6. CFD Analysis
The computational fluid dynamics (CFD) approach used for turbine performance assessment was validated against experimental measurements from a tubular axial turbine (Figure 6), tested under various speed and discharge conditions. Numerical simulations were conducted in ANSYS CFX using a single-phase flow framework.
Based on the Navier-Stokes equations, three-dimensional viscous flow modeling enabled detailed investigation of intricate flow separation behaviors, origins of energy dissipation, and spatial loss allocation across turbine components during nominal and off-design operation. The simulations employed a pressure-based transient solver with second-order spatial discretization to enhance numerical accuracy. The boundary conditions were defined as follows:
-Inlet: Mass flow rate ranging from 0.004 to 0.010 m³/s, with a turbulence intensity of 5%.
-Outlet: Static pressure set to atmospheric, with backflow stabilization enabled.
-Rotating Domain: The turbine rotor was subjected to a moving reference frame (MRF) approach, with angular velocities varying between 750 and 1500 RPM to cover the operational range of the experiment.
-The interface between stationary and rotating domains utilized a frozen rotor approximation, which has been validated for steady-state performance prediction in turbomachinery.
The (SST) k-ω turbulence model was selected for its ability to synergize the k-ω model’s precision in near-wall regions with the k-ϵ model’s reliability in free-stream flows. This hybrid formulation solves adverse pressure gradients and boundary layer separation, critical factors influencing low-head turbine efficiency, where viscous effects dominate performance trends [33].
To enhance the accuracy of near-wall turbulence resolution, the computational mesh was refined in the boundary layer region, with the first-layer thickness calibrated to maintain a dimensionless wall distance (y+) ≤ 1 across all blade surfaces. A controlled expansion factor 1.05 was also applied to adjacent layers, ensuring a smooth growth of prismatic elements while preserving gradient accuracy for the SST k-ω equations. A mesh independence study was performed (Figure 7) to ensure the reliability of the numerical simulations.
Four mesh configurations, ranging from 3.4 to 5.6 million elements, were evaluated by monitoring key performance parameters: hydraulic efficiency (η) and head (H). The selected mesh, consisting of 4.1 million elements, exhibited less than 2% variations in η and H compared to the finest grid, meeting the Grid Convergence Index (GCI) criterion. Figure 8 shows the selected mesh on the hub section of the rotor.
2.7. Cost Analysis
The cost estimation methodology follows the linear regression model proposed by Balarim (1996), expressed as:
where: H represents the hydraulic head (in meters), A, B, and C are regression constants derived from the rated power capacity (P, in kW) of the hydroelectric plant. These constants encapsulate region-specific cost drivers, including economies of scale, material procurement, and labor intensity, calibrated to historical data from Brazilian hydroelectric projects.
The annual revenue from energy generation was calculated using the average regional energy price per kilowatt-hour (kWh) across all states in the Brazilian North region. This regional average was selected due to the area’s hydrological and infrastructural similarity to the case studied. The derived energy price (US$ 0.16/kWh) was then incorporated into revenue calculation.
3. Results
3.1. Key Curve Analysis of the Selected Site
Field inspections were conducted at Água Preta small river to evaluate its hydraulic dynamics. The findings highlighted substantial flow rate fluctuations and a low hydraulic head. The flow duration curves in Figure 9 and the gross head curve in Figure 10 visually summarizes these hydrological patterns.
The data acquired from these assessments directly guided the specification of turbine flow capacities and operational limits explored in this work, as discussed in subsequent sections. By incorporating this site-specific hydraulic information, more accurate boundary conditions were defined for turbine performance analysis, ensuring the design aligns with the site’s distinct hydrological profile.
3.2. Turbine Configuration and Flow Rate Specification
Eight potential turbine configurations were evaluated for operational viability under the site’s hydraulic conditions based on an analysis of the key stream curves. Configurations 1 and 7 (corresponding to 1x Q95% and 3.5x Q95%) emerged as the most suitable options (Figure 11). The annual utilization rates for the selected configuration are illustrated in Figure 12.
3.3. CFD Results of the Validation Case
A comparison between experimental data from the literature and simulation results was conducted to verify the accuracy of the CFD methodology. Post-processing evaluations showed that the numerically predicted values closely matched the experimentally measured head and efficiency (Figure 13). Flow visualization in the statorless turbine setup, used for experimental validation, indicates a consistent tangential velocity component at the rotor outlet.
This tangential flow component (Figure 14) generates aerodynamic losses due to non-axial exit flow conditions, directly degrading turbine efficiency.
3.4. Minimum Pressure Coefficient Criterion
Subsequently, an optimized turbine configuration was designed using the validated numerical framework. Three distinct pressure coefficient configurations were simulated to refine aerodynamic performance. Table 1 presents comparative analyses between the baseline turbine and the Cordier-optimized design, while Table 2 details the performance variations across the three pressure coefficient-based configurations.
As indicated in Table 2, decreasing the pressure coefficient correlates with reduced efficiency. This occurs because steeper pressure gradients generated at lower pressure coefficients amplify flow separation and turbulence-induced energy losses.
Figure 15 depicts the distinct flow patterns observed across the blade profiles of the three turbine configurations.
The flow behavior from Machines A to C shows a gradual rise in hydraulic loading, linked to their geometric differences. Machine A, designed for lower loading with a higher solidity ratio of 1.3, maintains stable flow attachment. Conversely, Machine C has a lower blade spacing-to-chord ratio (l/t = 0.66), leading to increased loading and sharper suction-side pressure gradients. This pattern is reflected in the minimum pressure coefficient, which decreases from −0.78 for Machine A to −2.65 for Machine C, highlighting stronger adverse pressure gradients and a higher likelihood of boundary layer separation.
3.5. Machine Design and Performance Comparison: IGV vs. Non-IGV
Two VLHTs were created for the Janari Bridge to implement the proposed methodology. These turbines were specifically engineered to meet the site’s distinct hydraulic and geometric limitations. Table 3 summarizes their essential design parameters and operational specifications. Figure 16 offers a detailed depiction of the machines, showcasing their primary dimensions in a design that lacks guide vanes. Figure 17 shows the configuration that incorporates guide vanes.
Table 4 shows the minimum pressure coefficient and the machine’s chosen configuration. Figure 18 illustrates the flow patterns on the cylindrical section of the blade hub for both machines without guide vanes, and Figure 19 depicts the flow patterns for both machines, including guide vanes.
The flow behavior is evident in both the non-IGV (Figure 18) and IGV-equipped (Figure 19) configurations. The main distinction between the two cases is the clear reduction in the machine’s relative flow velocity after IGV implementation. This decrease aligns with the flow-straightening and pre-swirl effects introduced by the guide vanes, which redistribute kinetic energy within the system. Additionally, the efficiency results are displayed in Figure 20 and Figure 21.
Figure 20 and Figure 21 illustrate specific operating points at which the efficiency of the stator-equipped setup is surprisingly lower than that of the stator-free setup. This occurrence is linked to unstable flow behavior during off-design operations, which disrupts the aerodynamic consistency of the system. At these points, flow separation and secondary vortex formation, triggered by mismatched incidence angles and adverse pressure gradients, impair energy transfer efficiency, negating the advantages of guide vanes integration. This is further evidenced by the comparison between non-IGV and IGV-equipped configurations under off-design flow conditions, as depicted in Figure 22 and Figure 23.
The data shows that stator-induced flow guidance becomes less effective outside the design envelope, increasing losses due to unsteady detachment and recirculation zones. These variations highlight the nonlinear relationship between stator implementation and system performance, especially when aerodynamic stability is affected.
3.6. Cost Analysis
The total project cost was estimated using Balarim’s (1996) [31] formula, originally developed for small-scale hydropower installations (<15 kW). The cost model, expressed as:
where H=2 m, yields base cost of:
To reflect 2025 monetary values, this cost was adjusted for inflation using Brazil’s cumulative inflation rate of 870% (1 BRL in 1996 = 9.7 BRL in 2025):
The final cost in U.S. dollars was derived using the projected 2025 exchange rate (1 USD=5.81 BRL):
The simple payback method is applied to estimate the period required for a micro hydropower plant to recover its initial investment through revenues from electricity generation. The total initial investment is estimated at USD 94,073.15. However, due to the simultaneous construction of a bridge at the project site, the overall cost is reduced by 19%, corresponding to the average expenditure related to the mobilization of equipment and personnel, a significant cost component in remote locations. This average was obtained through data available from the government for many bridges previously constructed in the region.
The plant is expected to generate approximately 63,000 kWh per year, at a unit sale price of USD 0.1362 per kWh, this price was calculated using an average of the energy cost in the region for the year of 2024:
The annual O&M costs are estimated at 1% of the total investment, according to [24] for small hydropower:
The annual net revenue and simple payback were then calculated.
The estimated costs for the analyzed project align with those reported by Balarim (1996 [31], while the calculated payback period (7–8 years) closely matches the SCABCleuch case [32] (6-7 years). Minor discrepancies arise from regional variations in labor costs, operational efficiency, and tariff policies. Both cases highlight the economic viability of micro-hydro systems in off-grid communities, demonstrating attractive financial returns within a medium-term horizon.
3.7. Environmental Impact and Dam-Bridge Integration
Figure 24 presents various views of the conceptual design for the bridge-dam structure. The bridge’s support system on land consists of concrete wing walls, as illustrated in Figures 24(a) and 24(b). The turbine water intake is equipped with inclined grates, shown in Figure 24(c), which are designed to prevent debris from entering that could compromise turbine performance. Their inclination decreases the likelihood of blockage and aids maintenance and cleaning operations.
The lower-capacity turbine is intended for continuous operation under various flow conditions, and the dual-turbine setup reduces the flooded area, leading to less environmental impact.
The spillway, illustrated in Figure 24(d), functions in three scenarios: when both turbines are inactive during low-flow periods, when only the smaller turbine is running. Still, the flow does not support the larger turbine, and when both turbines operate, they cannot keep the upstream water level below a critical limit. It features an inclined structure for efficient energy dissipation.
To protect the migratory paths of local fish species affected by the bridge, a fish ramp—also depicted in Figure 24(d)—is included in the design. This ramp has a gentler slope than the spillway, facilitating fish ascension during migration. Consequently, the design helps minimize ecological disruption, particularly regarding the reproductive cycles of aquatic life.
5. Conclusions
This study introduces a robust framework for creating and assessing very low- head axial- flow turbines designed explicitly for remote Amazonian communities’ hydrological and infrastructural contexts. The suggested hybrid dam-bridge-turbine system presents a practical, sustainable alternative to diesel-powered generation by combining hydrodynamic principles, cost-effective production methods, and advanced numerical simulations. Circular arc cascades and simplified blade profiles facilitate local manufacturing while ensuring acceptable performance. Additionally, incorporating fish ladders and seasonal operation strategies aligns with ecological preservation goals.
Numerical results indicate a significant correlation between the minimum pressure coefficient and the turbine’s specific speed, suggesting that varying machine designs may exhibit a defined range of minimum pressure values. However, further exploration is needed to validate this theory across various designs and operating conditions. The flow patterns also become highly unstable at the low and high ends of the turbine’s operational flow rate. These dynamic behaviors are not fully captured by steady-state simulations, emphasizing the necessity for unsteady numerical simulations to depict transient flow phenomena like separation and vortex shedding accurately. Furthermore, multiphase flow models are critical for precisely evaluating the risk and location of cavitation, particularly in the low-pressure zones identified in the simulations.
Economically, the project’s feasibility hinges on initial investment costs, mainly as constructing bridges to support or integrate the turbine infrastructure constitutes a substantial portion of the total expenditure. A cost model was implemented to project capital expenditures, covering electromechanical components and civil works. Additionally, a payback analysis evaluated the return on investment over the expected operational lifespan of the system. This analysis reveals cost-effective configurations and aids in prioritizing design options with quicker economic returns, factoring in energy production and infrastructure costs.
The Vila do Janari case study illustrates the system’s technical feasibility and economic viability, projecting an annual generation of 63 MWh. The cost analysis, bolstered by validated CFD models and localized cost data, highlights the solution’s affordability. Moreover, the design methodology, informed by site-specific flow duration curves and optimization based on Cpmin, creates a replicable approach for decentralized electrification in other low-head river environments.
This research connects hydropower innovation with regional development strategies by synchronizing energy access initiatives with ongoing infrastructure modernization efforts like Ecopontes. The findings advance the broader objective of universal electricity access in Brazil’s Amazon region, demonstrating how tailored technological adaptations can bolster national sustainability and equity goals.
Author Contributions
The authors confirm contribution to the paper as follows: conceptualization: Andre Mesquita; methodology: Andre Mesquita, Rodolfo Ramalho; software: Rodolfo Ramalho, Manoel Sena; validation: Rodolfo Ramalho; formal analysis: Rodolfo Ramalho, Manoel Filho; investigation: Andre Mesquita, Davi Souza; resources: Davi Souza; data curation: Siergberth Neto, Romulo Mendes; draft manuscript preparation: José Coelho; Rodolfo Ramalho; review and editing: Gilton Furtado, Manoel Sena; visualization: Rodolfo Ramalho; supervision: Andre Mesquita; project administration: Andre Mesquita; All authors reviewed the results and approved the final version of the manuscript
Funding
This research was funded by the Conselho Nacional de Desenvolvimento Científico e Tecnológico (CNPq), project number 408034/2022-0.
Data Availability Statement
The data that support the findings of this study are available from the Corresponding Author, A.M., upon reasonable request.
Acknowledgments
The authors express sincere gratitude for the technical support provided by the Federal University of Pará and the Laboratory of Fluid Dynamics and Particulates. Their assistance was invaluable in completing this study successfully.
Conflicts of Interest
The authors declare no conflicts of interest. The funders had no role in the study’s design, data collection, analysis, interpretation, manuscript writing, or decision to publish the results.
Abbreviations
The following abbreviations are used in this manuscript:
| MHP | Micro Hydro Power |
| CFD | Computational Fluid Dynamics |
| VLHT | Very Low Head Turbine |
| SST | Shear Stress Transport |
| Cpmin | Minimum Pressure Coefficient |
| Cpsi | Inferior pressure coefficient limit |
| Cpss | Superior pressure coefficient limit |
| Q | Flow Rate |
| Qp | Design Flow Rate |
| Qriver | River Flow Rate |
| BEP | Best efficiency point |
| f | Frequency |
| H | Head |
| nq | Specific Speed |
| EG | Generated Energy |
References
- Instituto de Energia e Meio Ambiente. Electrical Exclusion in the Legal Amazon: Who Is Still without Access to Electricity? 2020. Available online: https://energiaeambiente.org.br/wp-content/uploads/2021/02/relatorio-amazonia-2021-bx.pdf (accessed on 7 August 2024).
- Sánchez, A.S.; Torres, E.A.; Kalid, R.A. Renewable energy generation for the rural electrification of isolated communities in the Amazon Region. Renew. Sustain. Energy Rev. 2015, 49, 278–290. [Google Scholar] [CrossRef]
- Silva Pereira, J.; Santos, M.A.O.; de Lima Bandeira, F.; Soares, F.I.L.; Vieira, T.A. Electrification in remote regions: An analysis of the More Light for Amazon Program. Energies 2023, 16(12). [Google Scholar] [CrossRef]
- Ponte, G.P.; Calili, R.F.; Souza, R.C. Energy generation in Brazilian isolated systems: Challenges and proposals for increasing the share of renewables based on a multicriteria analysis. Energy Sustain. Dev. 2021, 61, 74–88. [Google Scholar] [CrossRef]
- Lembi, R.; Lopez, M.C.; Ramos, K.N.; Johansen, I.C.; da Silva, L.J.S.; Santos, M.R.P.; et al. Towards energy justice and energy sovereignty: Participatory co-design of off-grid systems in the Brazilian Amazon. Energy Res. Soc. Sci. 2025, 119. [Google Scholar] [CrossRef]
- Chaudhari, S.; Brown, E.; Quispe-Abad, R.; Moran, E.; Müller, N.; Pokhrel, Y. In-stream turbines for re-thinking hydropower development in the Amazon basin. Nat. Sustain. 2021, 4(8), 680–687. [Google Scholar] [CrossRef]
- Hampl, N. Energy systems for Brazil’s Amazon: Could renewable energy improve Indigenous livelihoods and save forest ecosystems? Energy Res. Soc. Sci. 2024, 112. [Google Scholar] [CrossRef]
- Martin, J.; Swiderski, J.; Chang, L.; Tung, T.T.; Barbosa, W.A.; Tiago Filho, G.L.; Botan, A.C.B. Recommend ultra low-head mini-hydro turbine generator system for coastal river application. In Proceedings of the 4th Asian Wave and Tidal Energy Conference (AWTEC 2018), Taipei, Taiwan, 9–13 September 2018. [Google Scholar]
- Pribadyo, A.; Suryono, S.; Wijaya, A. CFD analysis of shear stress and pressure distribution in low-head axial flow turbines. Energy Rep. 2021, 7, 1234–1245. [Google Scholar]
- Nascimento, E.O.; Freitas, E.A.; Lins, E.F.; Vaz, J.R.P. Performance assessment of an Indalma hydro-turbine. SN Appl. Sci. 2020, 2, 2156. [Google Scholar] [CrossRef]
- Chaulagain, D.; Mishra, S.; Singal, S.K. A review of ultra-low-head hydropower turbines for sustainable energy solutions. Renew. Sustain. Energy Rev. 2023, 184, 113543. [Google Scholar]
- Alexander, K.V.; Giddens, E.P. Microhydro: Cost-effective, modular systems for low heads. Renew. Energy 2008, 33(6), 1379–1391. [Google Scholar] [CrossRef]
- Zhou, D.; Deng, Z. Ultra-low-head hydroelectric technology: A review. Renew. Sustain. Energy Rev. 2024. [CrossRef]
- Anagnostopoulos, J.S.; Papantonis, D.E. Optimal sizing of a run-of-river small hydropower plant. Energy Convers. Manag. 2007, 48(10). [Google Scholar] [CrossRef]
- Quaranta, E.; Bonjean, M.; Cuvato, D.; Nicolet, C.; Dreyer, M.; Gaspoz, A.; et al. Hydropower Case Study Collection: Innovative Low Head and Ecologically Improved Turbines, Hydropower in Existing Infrastructures, Hydropeaking Reduction, Digitalization and Governing Systems. Sustainability 2020, 12(21), 8873. [Google Scholar] [CrossRef]
- Barsi, D.; Marini, M.; Covi, A. Design and performance analysis of a compact propeller turbine for low-head applications. Energy Convers. Manag. 2019, 198, 111804. [Google Scholar]
- Zhang, Z. Improvement and extension of Cordier diagram for hydraulic turbines. Proc. Inst. Mech. Eng. Part A: J. Power Energy 2022, 236(7), 1309–1319. [Google Scholar] [CrossRef]
- Sutikno, P.; Adam, W. Design and optimization of a 2 kW axial-flow turbine for very low-head applications. J. Fluids Eng. 2011, 133(12), 121101. [Google Scholar]
- Muis, Z.A.; Sutikno, P.; Adam, W. CFD-based optimization of very low-head axial-flow turbines using the minimum pressure coefficient criterion. Renew. Energy 2015, 80, 654–663. [Google Scholar]
- Guilherme da Cruz, A.B.; Luiz Mesquita, A.A.; José Blanco, C.C. Minimum pressure coefficient criterion applied in axial-flow hydraulic turbines. J. Braz. Soc. Mech. Sci. Eng. 2008, 30(1), 1–10. [Google Scholar]
- Ebhota, W.S.; Inambao, F.L. Simplified design of low-cost propeller turbines for rural electrification. Renew. Energy 2016, 99, 1203–1215. [Google Scholar]
- Ikui, T.; Inoue, M.; Kaneko, K. Two-dimensional cascade performance of circular-arc blades. In Proceedings of Tokyo Joint International Gas Turbine Conference and Products Show, Tokyo, Japan, 1971; pp. 57–64.
- Tezuka, A.; Sunada, Y.; Rinoie, K. Surface pressure distributions on 4% circular arc airfoil at low Reynolds number. J. Aircraft 2008, 45(6), 2164–2167. [Google Scholar] [CrossRef]
- Klein, S.J.W.; Fox, J.M. Cost-benefit analysis of decentralized hydropower systems in rural regions. Energy Policy 2022, 165, 112935. [Google Scholar]
- Zhou, J.; Zhang, Y.; Li, X. Hydraulic performance and ecological impacts of ultra-low-head turbines. Renew. Energy 2019, 113, 1256–1265. [Google Scholar]
- Krzemianowski, Z.; Kaniecki, M. Energy-ecology nexus in low-head hydropower: A case study of Kaplan turbine optimization. Energy Convers. Manag. 2023, 275, 116452. [Google Scholar]
- Shukla, S.; Parashar, A. CFD-driven design of a 58.48 kW propeller turbine for low-head hydropower. Appl. Energy 2017, 207, 346–359. [Google Scholar]
- Soesanto, Q.M.B.; Widiyanto, P.; Susatyo, A.; Yazid, E. Cascade optimization of an axial-flow hydraulic turbine type propeller by a genetic algorithm. Int. J. Technol. 2019, 10(1), 200–211. [Google Scholar] [CrossRef]
- Portilho, V.B.; José, C.; Blanco, C.; Correia, R.V.; Davi, R.; Sales, E.; et al. Integration of micro hydropower plants in a multi-purpose bridge-dam in the rural Amazon. In Proceedings of the 27th ABCM International Congress of Mechanical Engineering; 2023. [Google Scholar] [CrossRef]
- Samora, I.A.; Hasmatuchi, V.; Münch-Alligné, C.; Franca, M.J.; Schleiss, A.J.; Ramos, H.M. Experimental characterization of a five-blade tubular propeller turbine for pipe inline installation. Renew. Energy 2016, 95, 356–366. [Google Scholar] [CrossRef]
- Balarim, C.R. Expedited Assessment of Implementation Costs for Micro-Hydroelectric Plants. Master’s Thesis, São Paulo State University, Botucatu, Brazil, 1996. [Google Scholar]
- FAS Scotland. SCABCleuch Micro-Hydro Scheme: A Case Study. 2023. Available online: https://www.fas.scot/article/scabcleuch-micro-hydro-scheme-a-case-study/ (accessed on 15 April 2025).
- Menny, K., Strömungsmaschinen: hydraulische und thermische Kraft- und Arbeitsmaschinen, 5th ed. Leipzig, Germany: Teubner, 2006.
- Quaranta, E., “Optimal rotational speed of Kaplan and Francis turbines with focus on low-head hydropower applications and dataset collection,” J. Hydraul. Eng., vol. 145, no. 12, Dec. 2019. [CrossRef]
Figure 1.
Location of the Janari community and the small river Água Preta: (a) Overview map of Brazil showing the location of Janari, indicated with a marker (image from Google Maps); (b) Closer view of the Janari area, as indicated in (a), showing local geographical context (image from Google Maps); (c) Aerial photograph of a small portion of the area shown in (b), taken by the research team, featuring a bridge crossing the Água Preta stream.
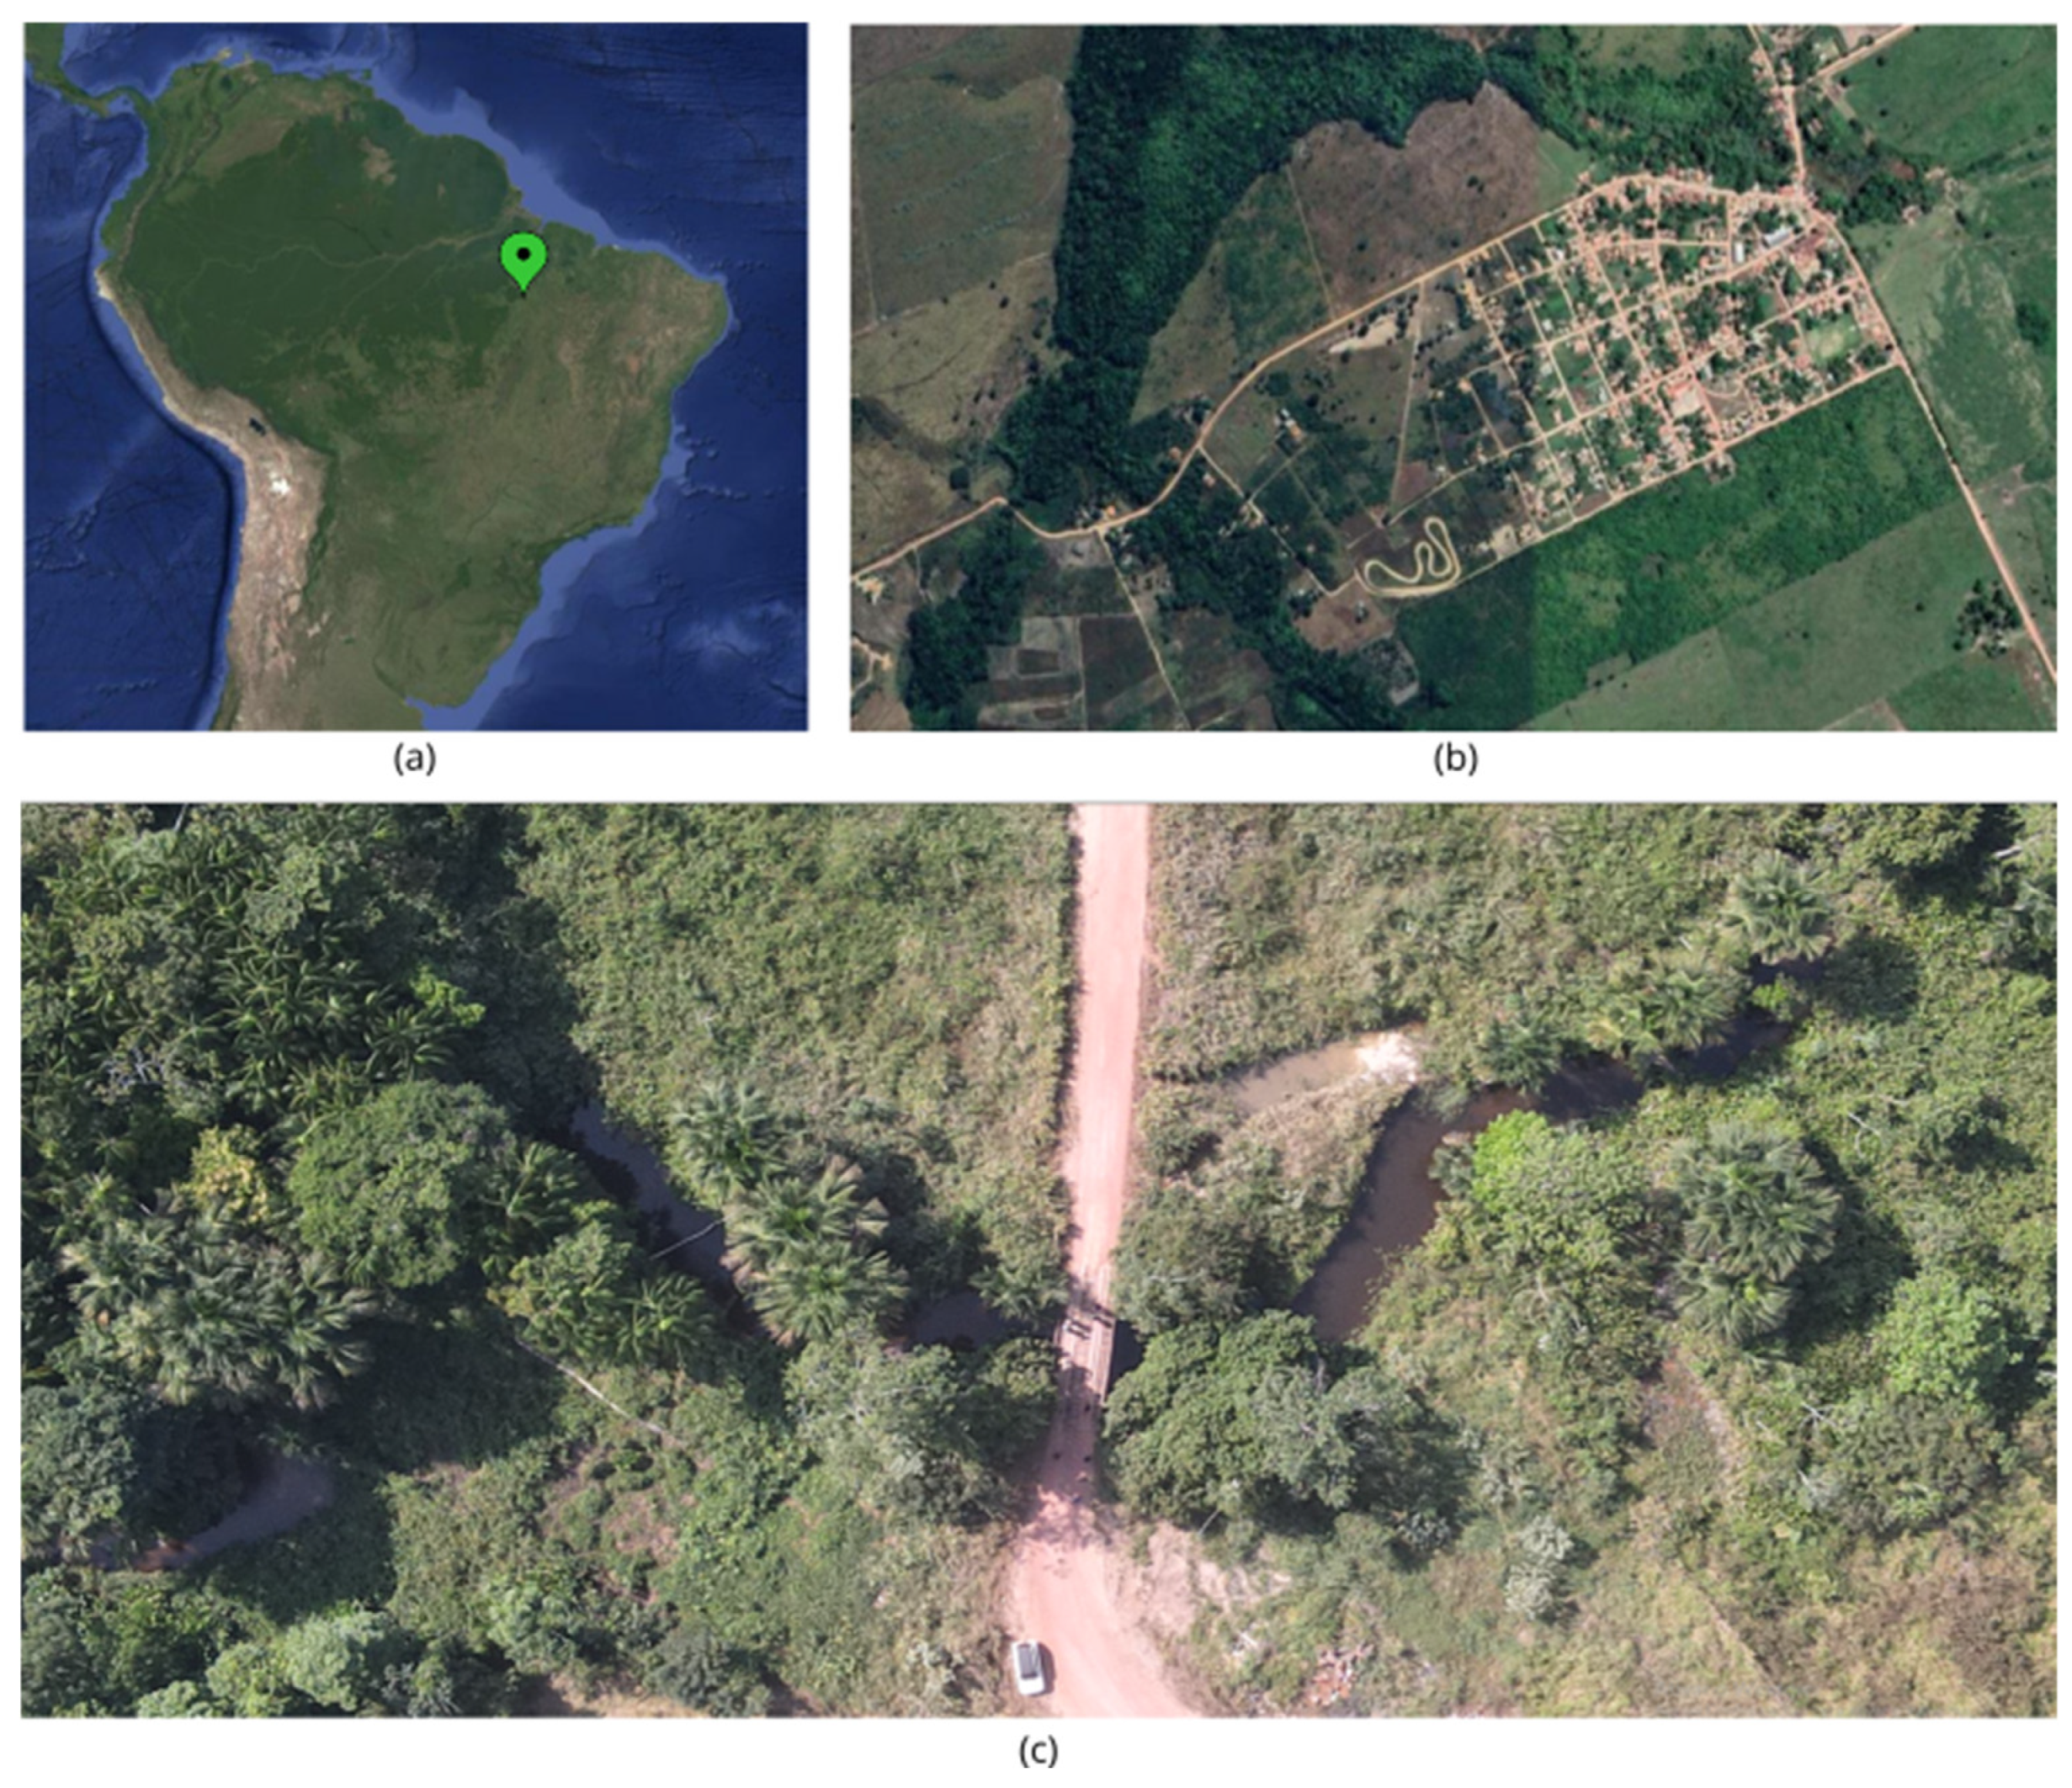
Figure 2.
Flowchart of the methodology used.
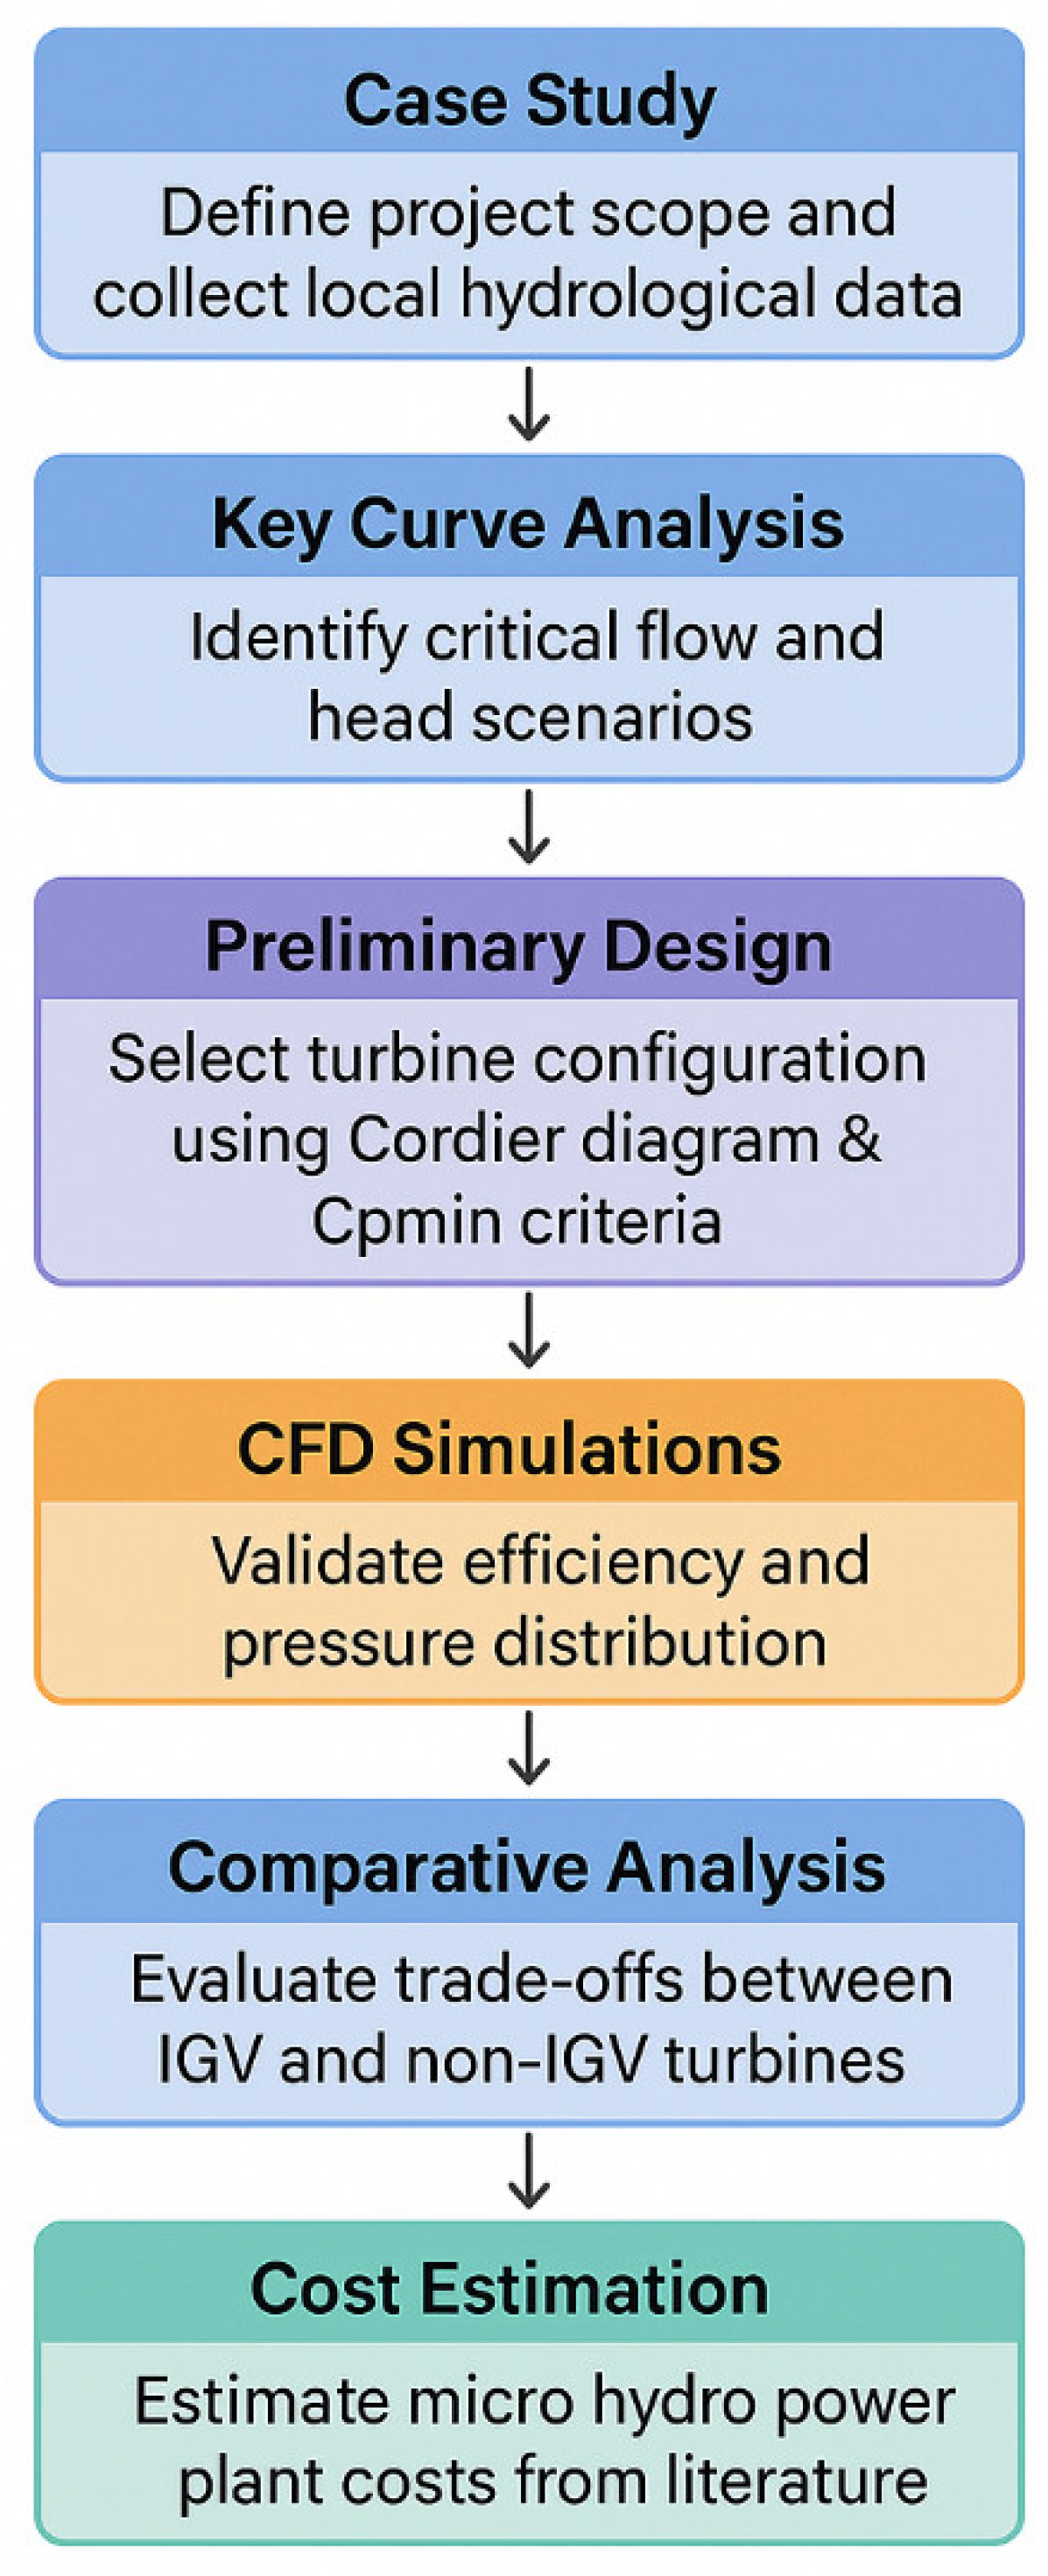
Figure 3.
Annual flow rate distribution.
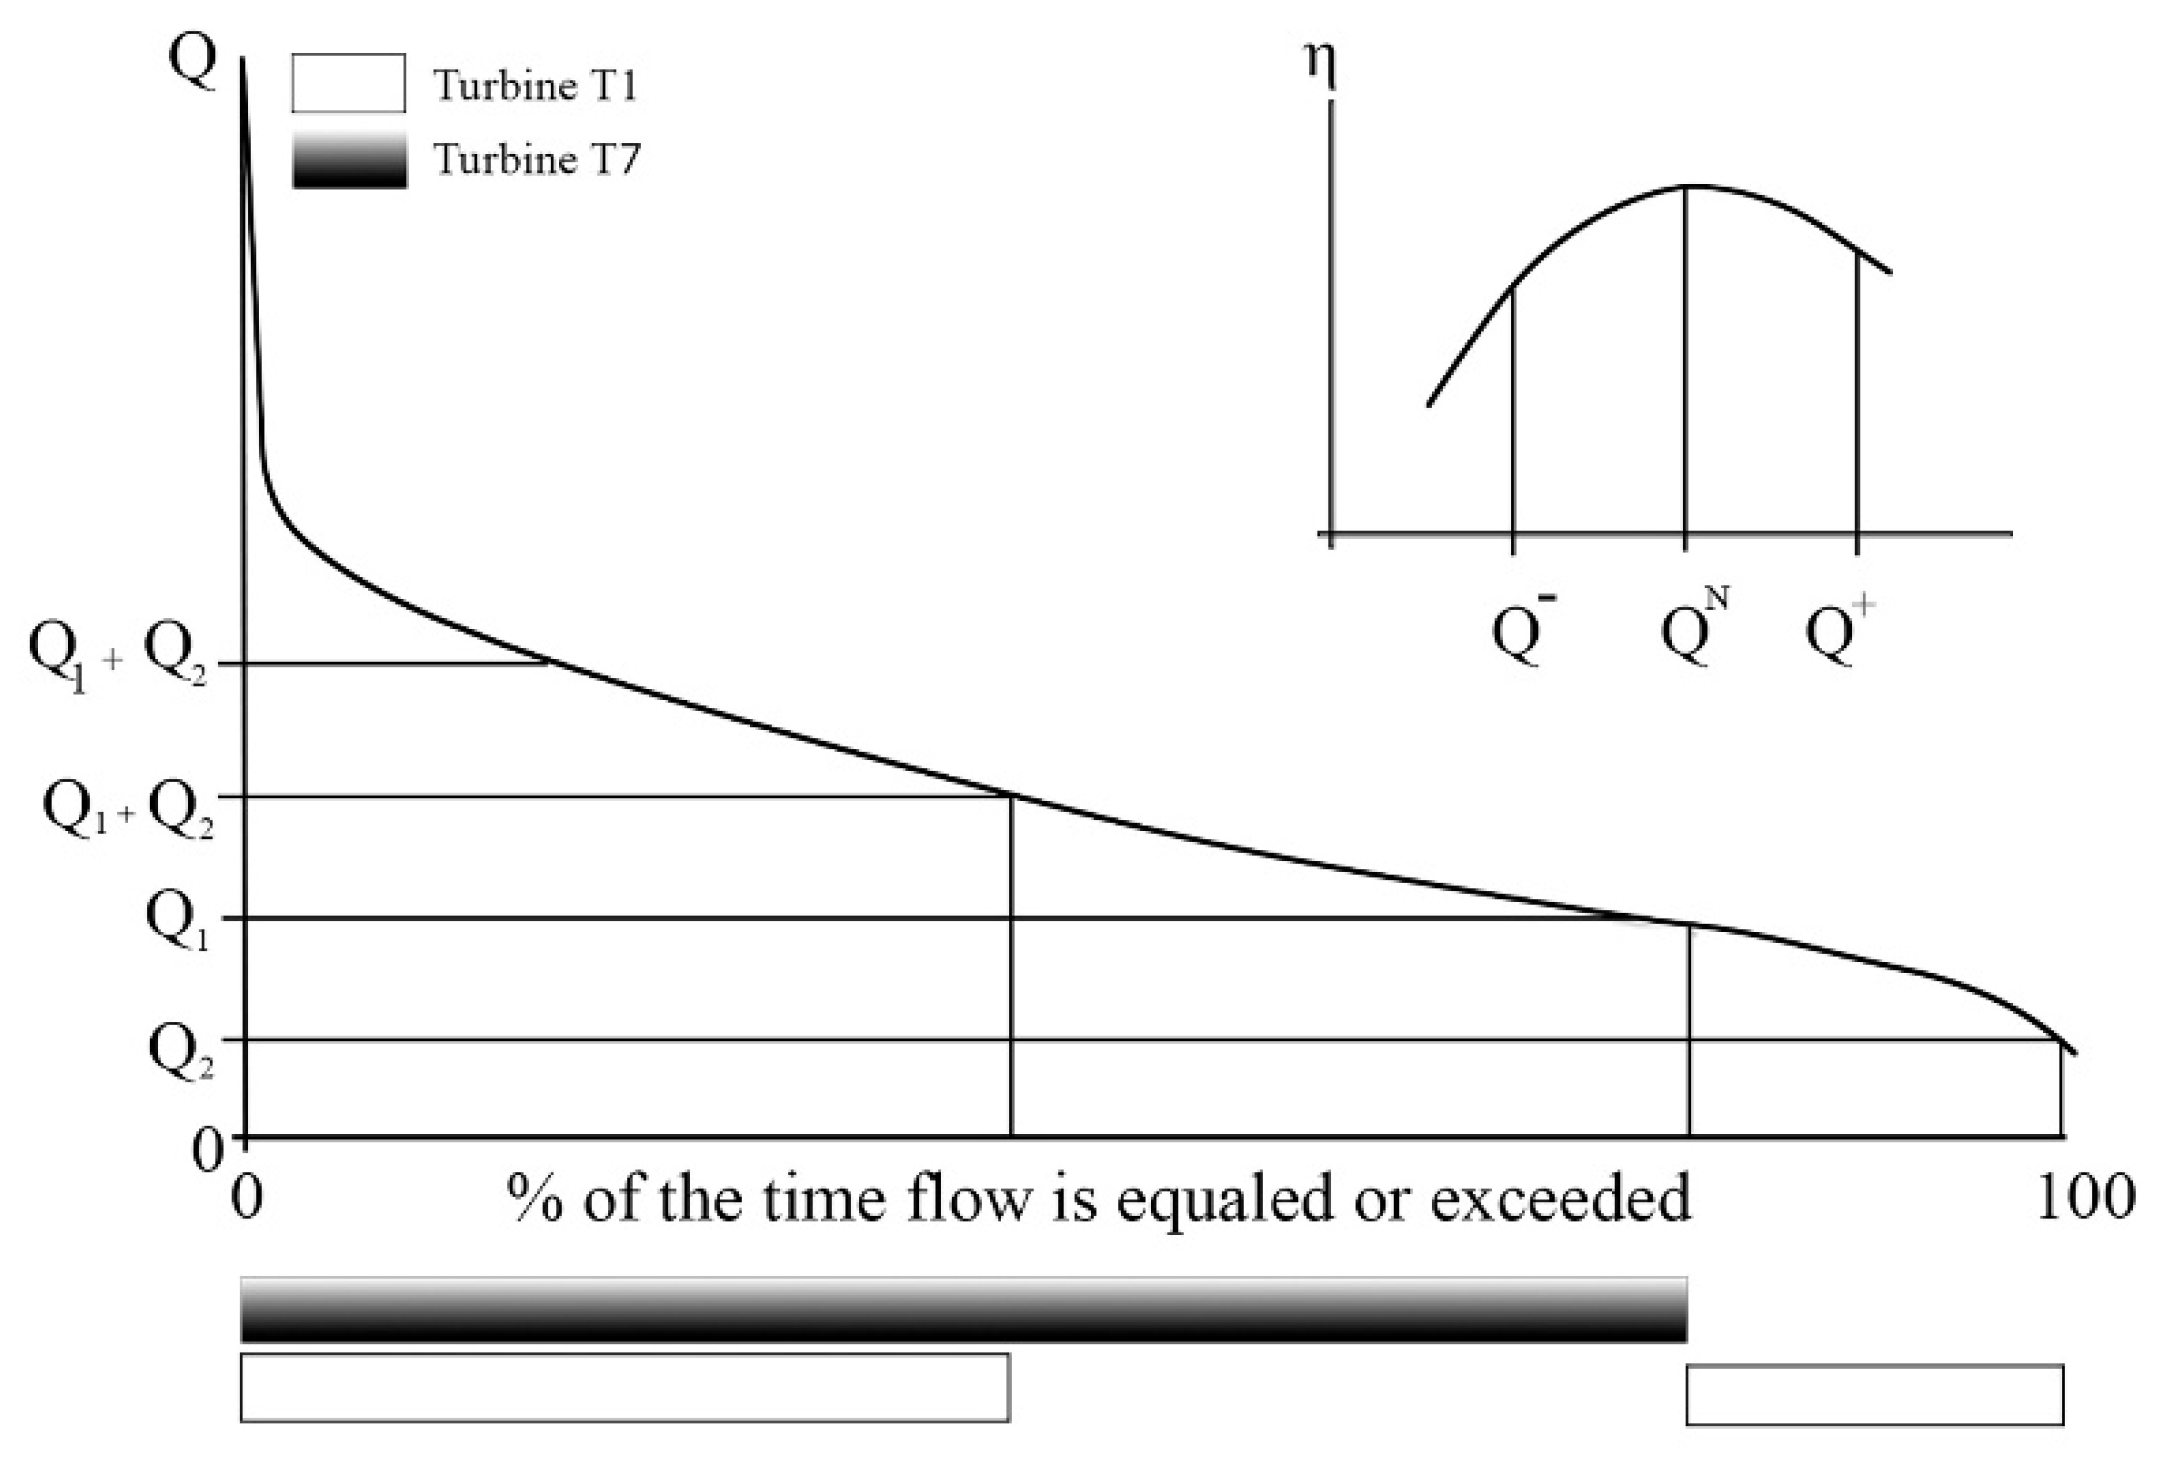
Figure 4.
Velocity triangles of axial flow turbine. a-Without IGV b-With IGV.
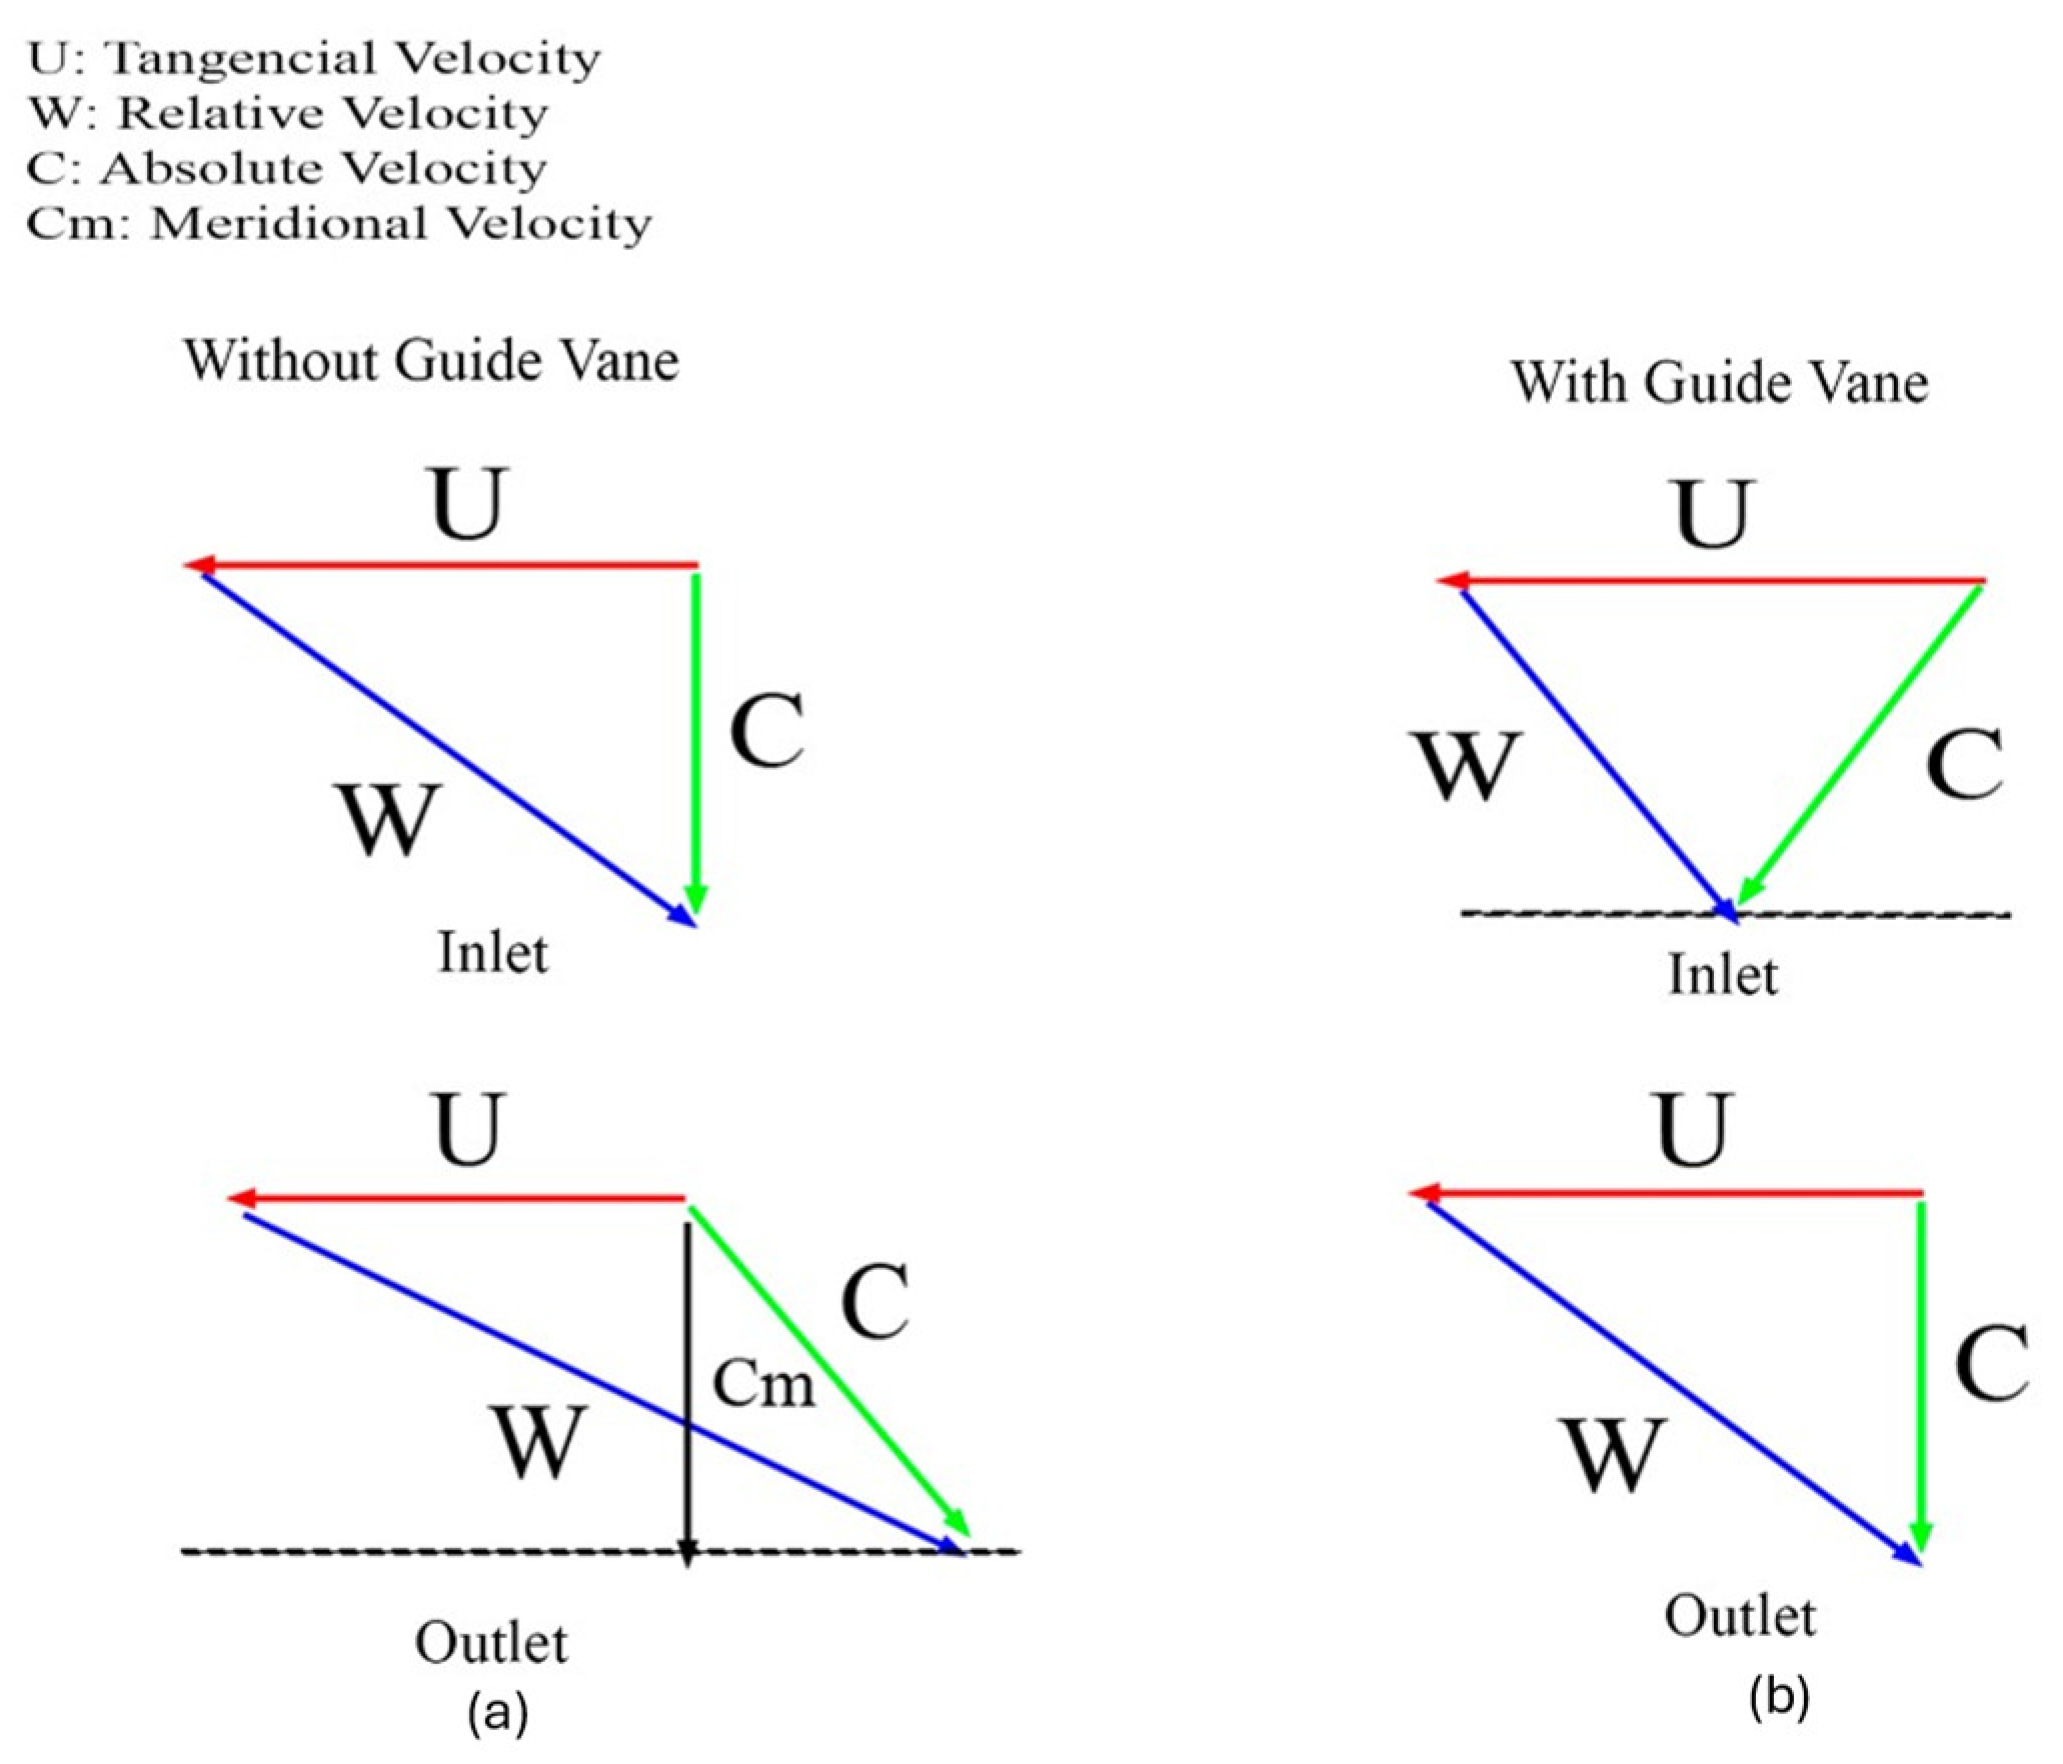
Figure 5.
The minimum pressure coefficient criterion.
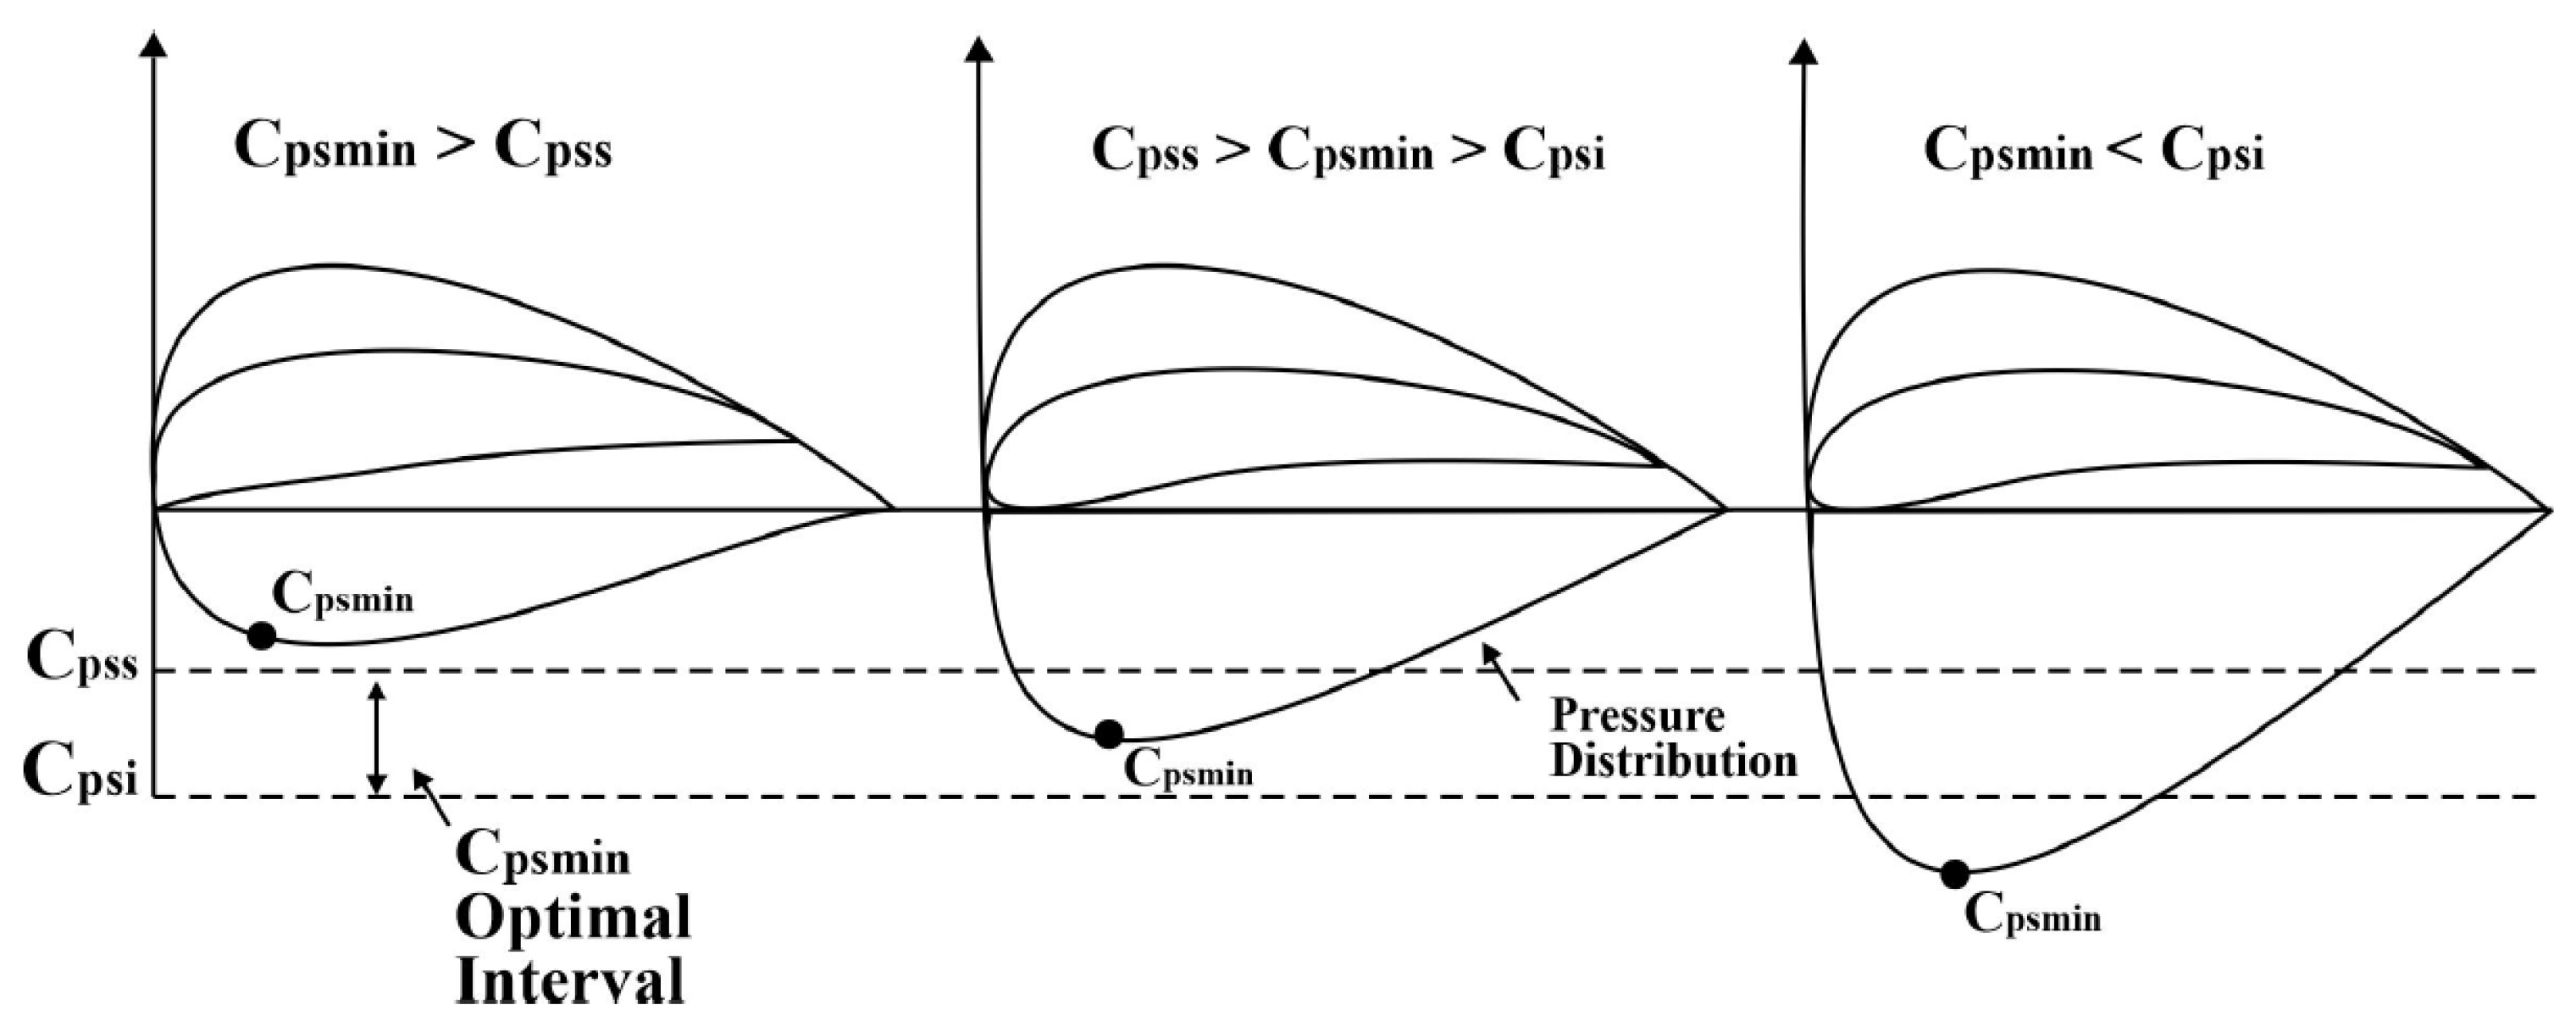
Figure 6.
Tubular turbine used for the validation of the CFD model.
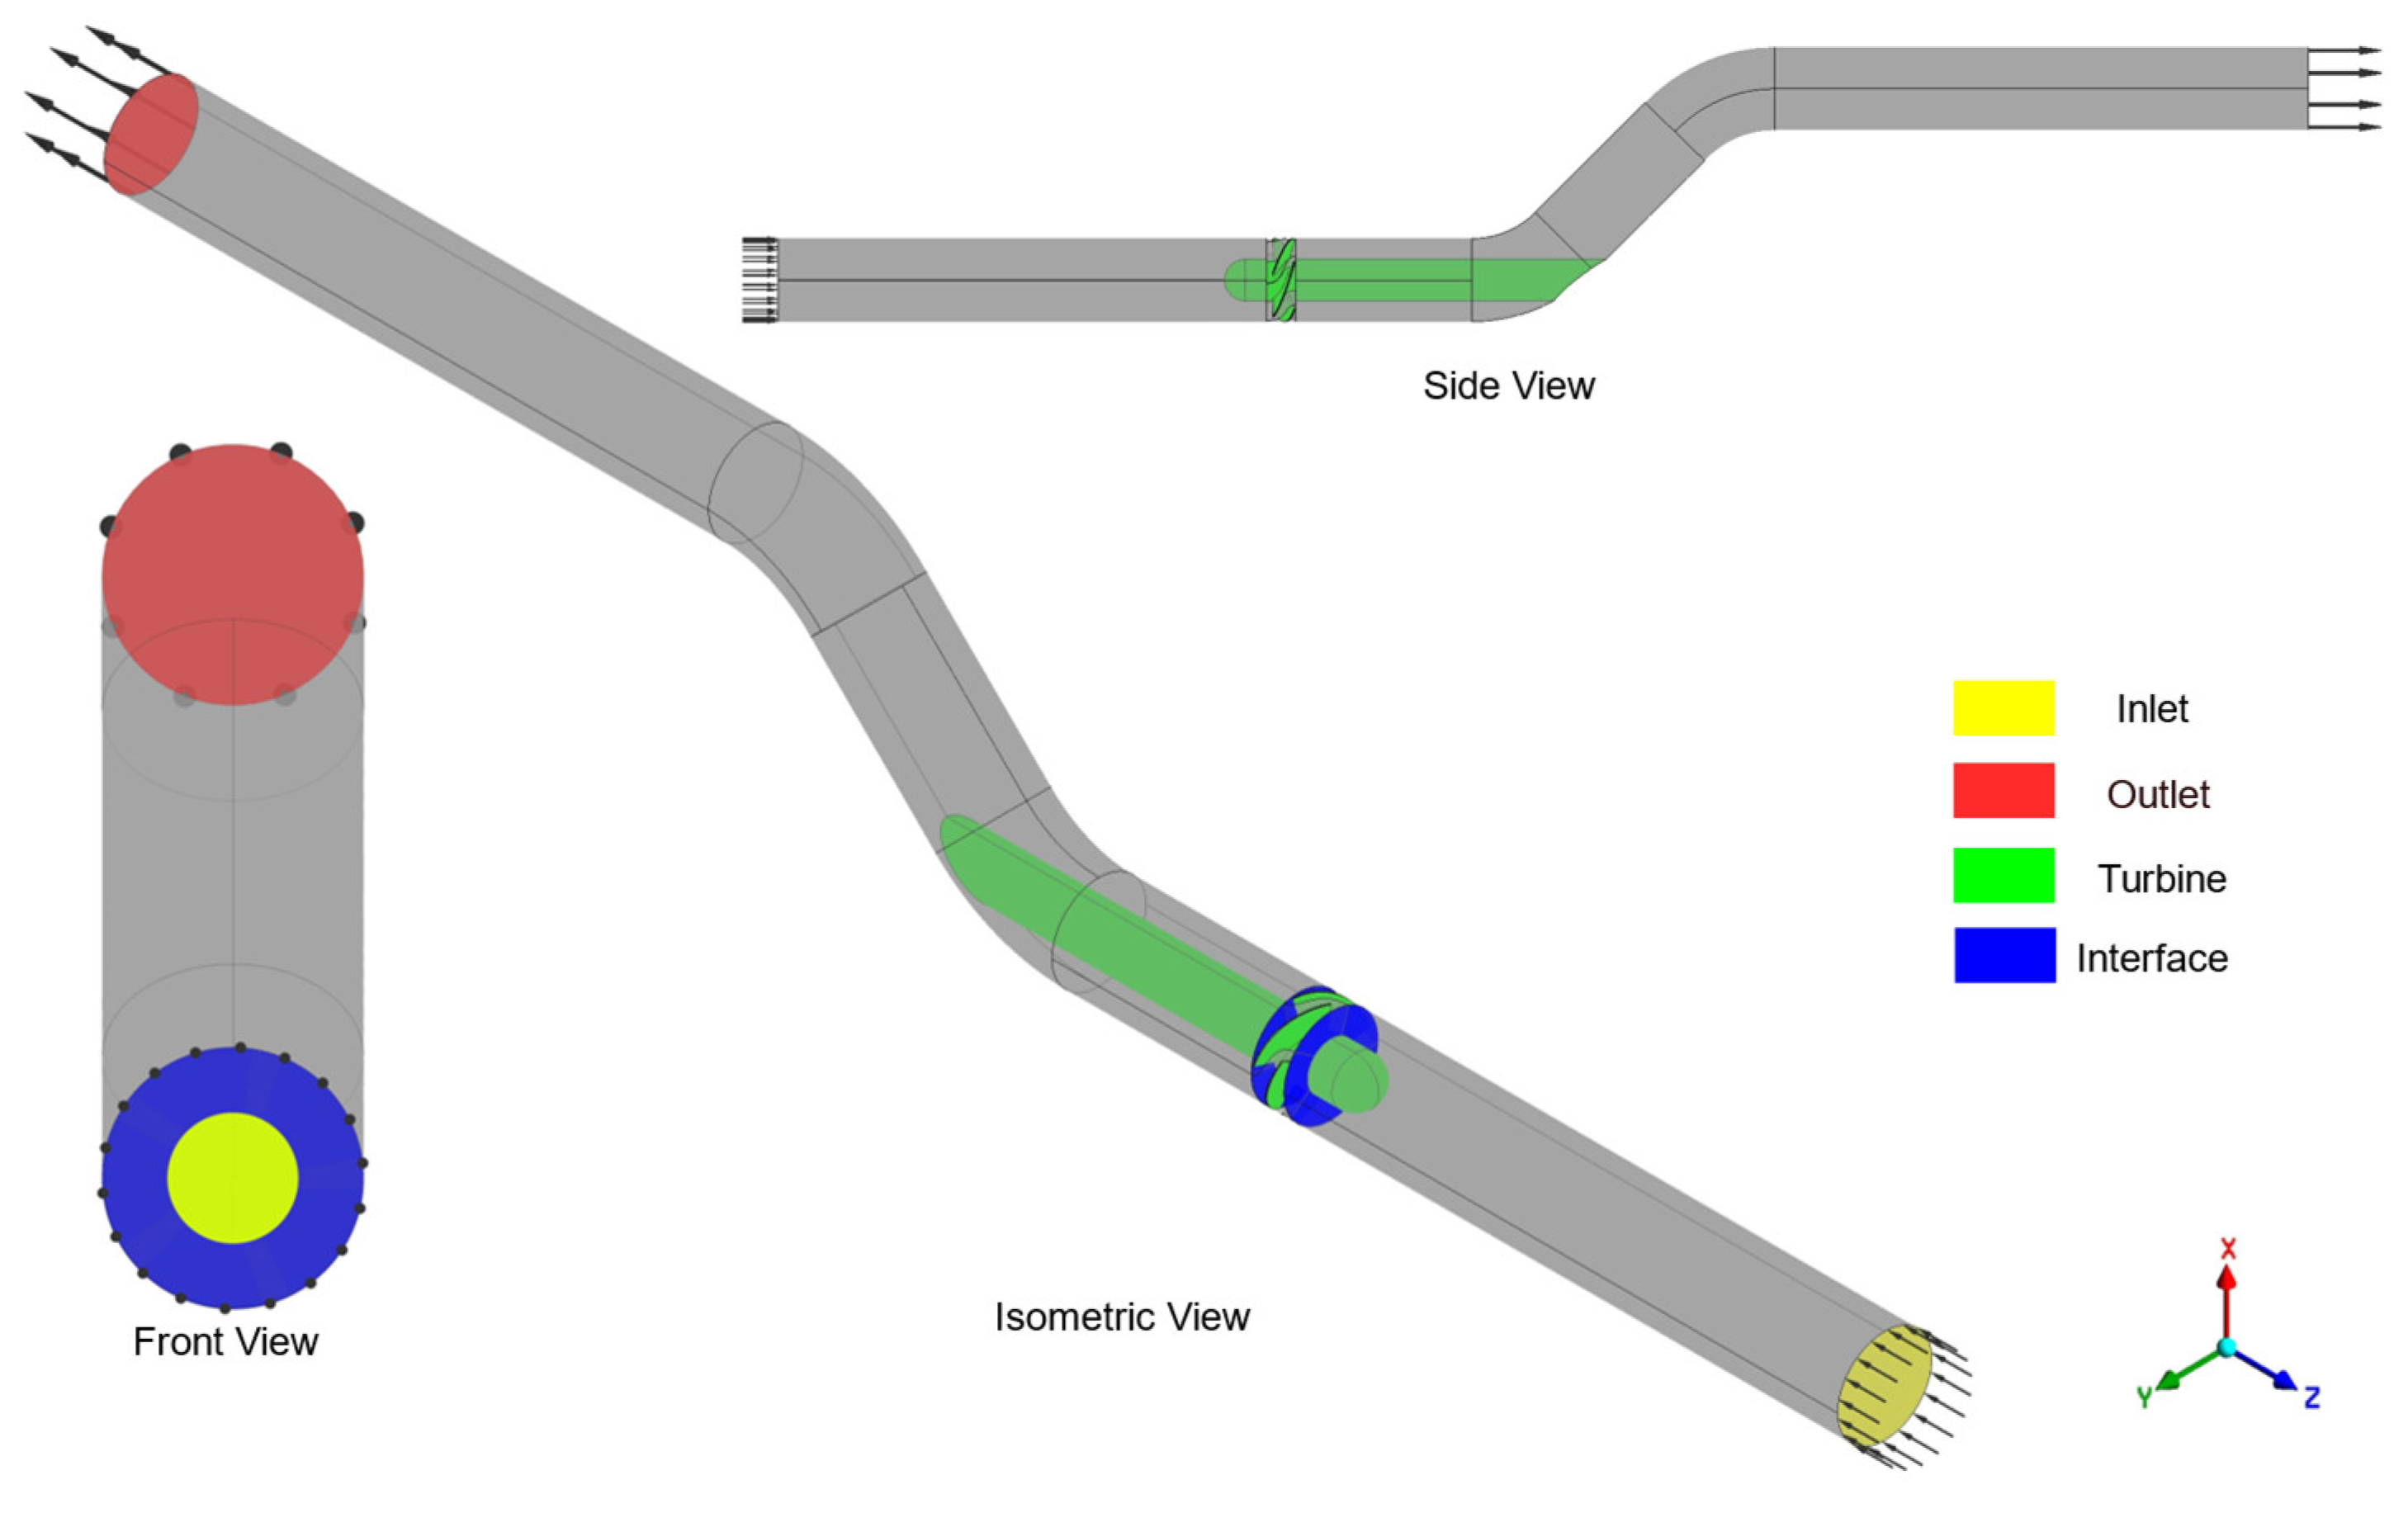
Figure 7.
Mesh independence study for the validation case.
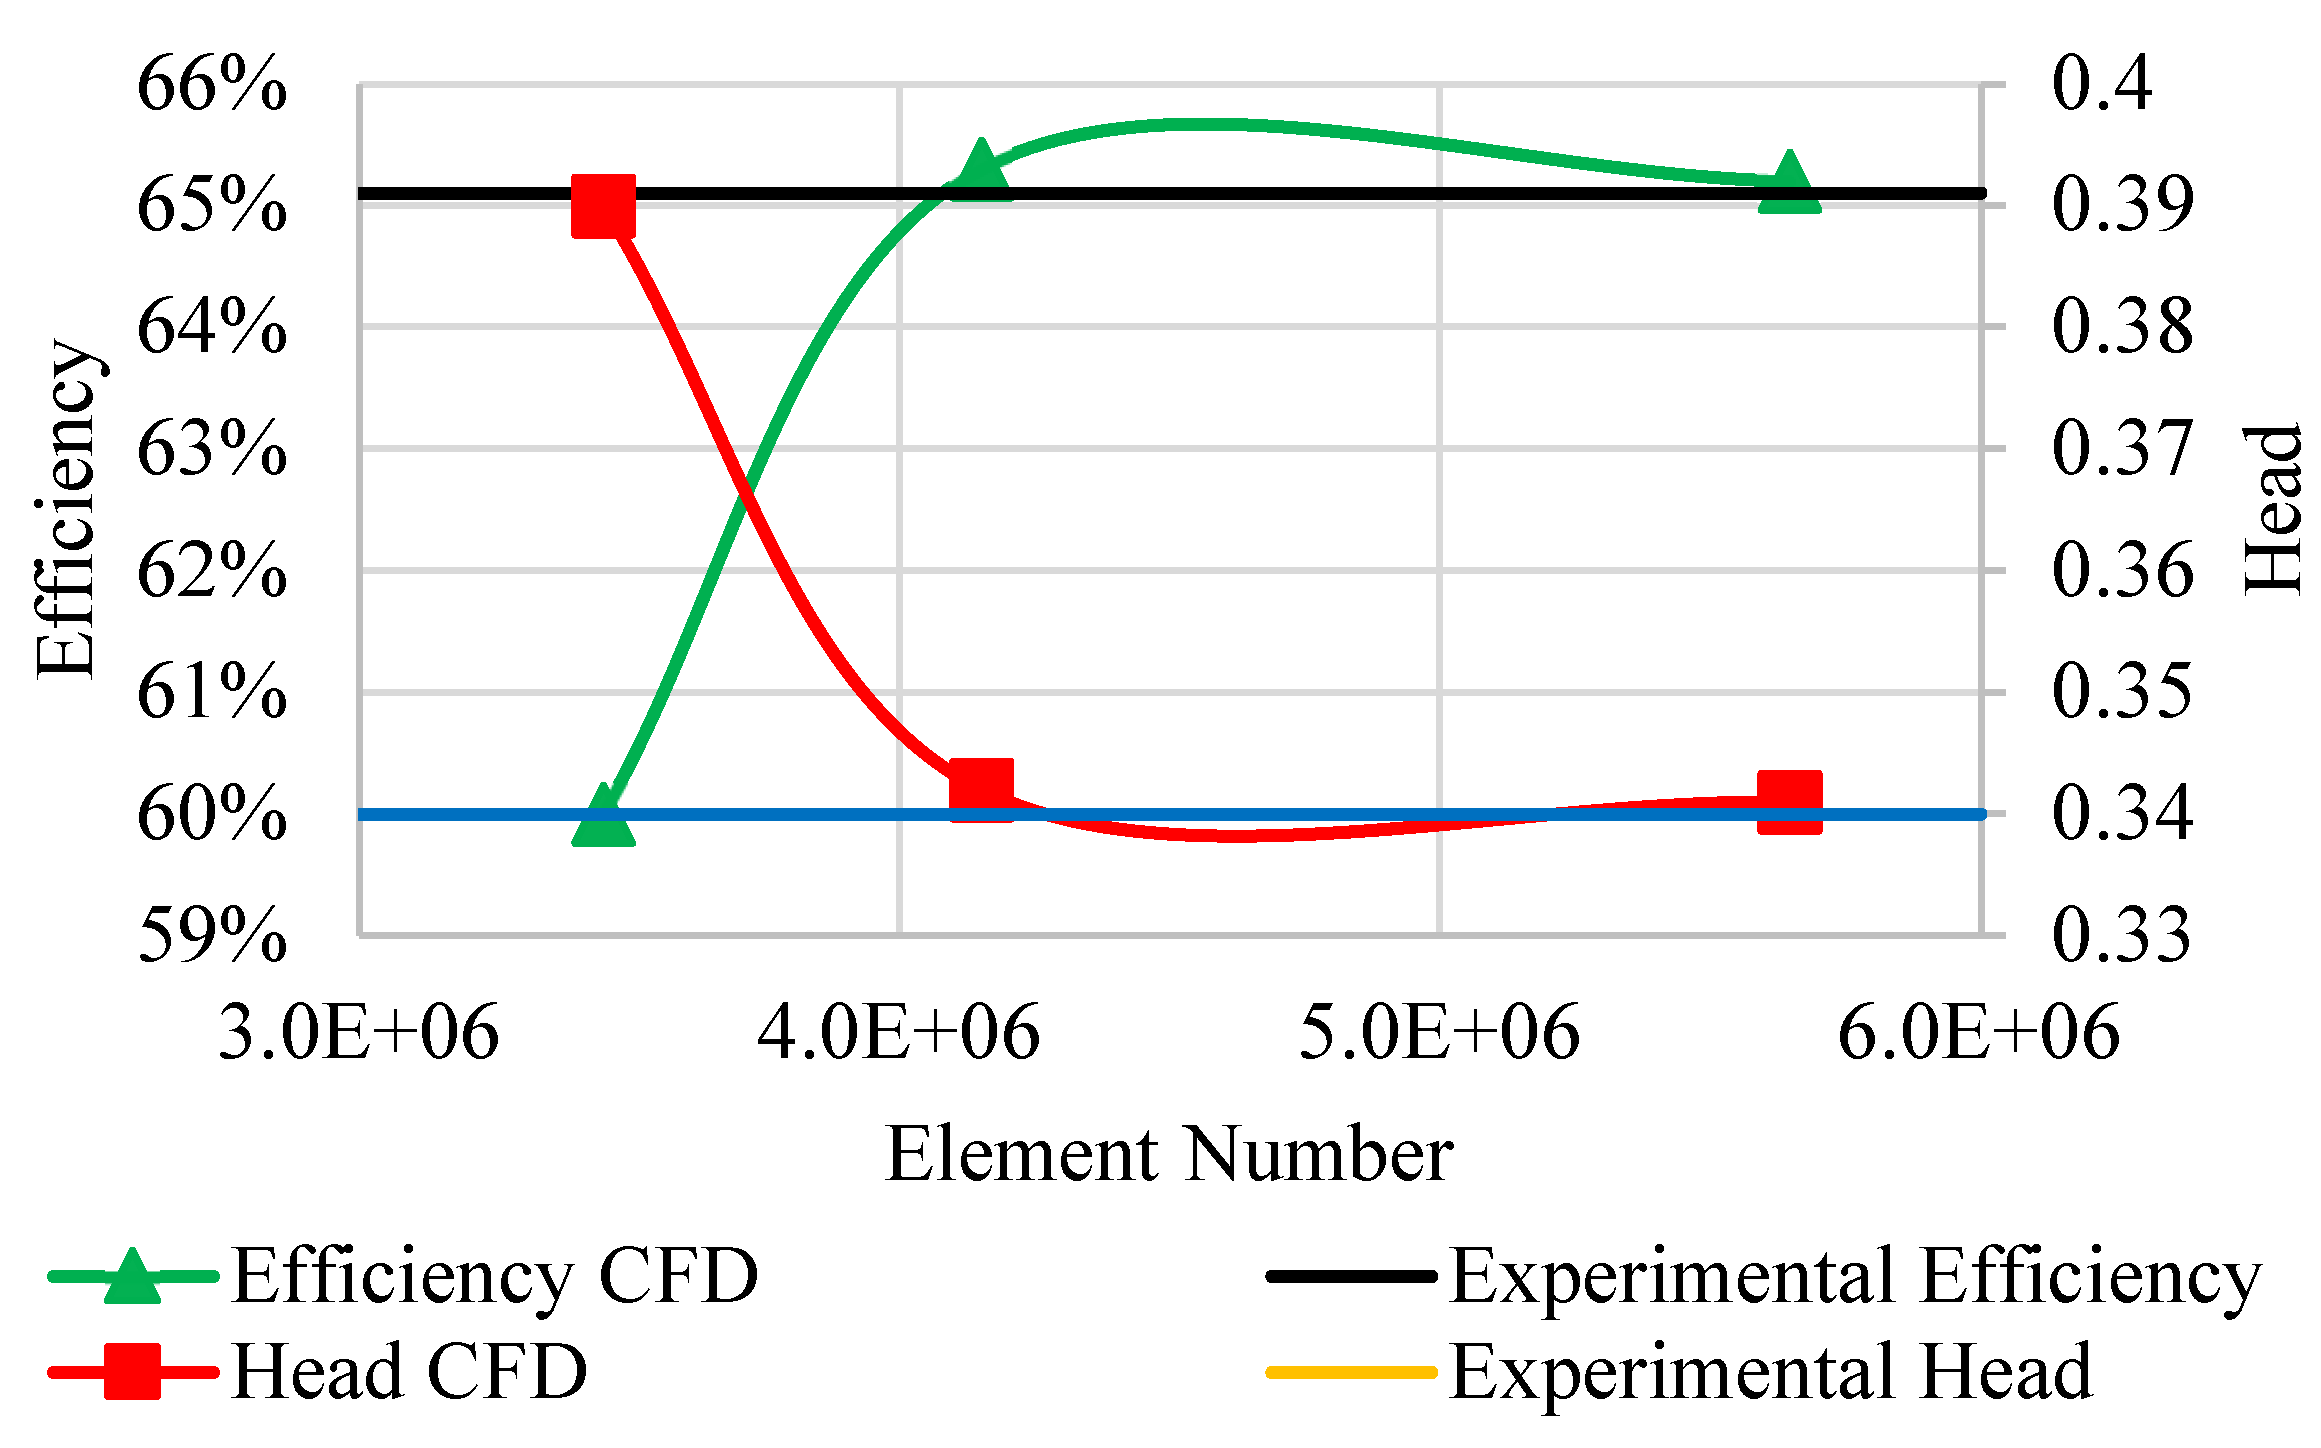
Figure 8.
Mesh on the hub section of the rotor.
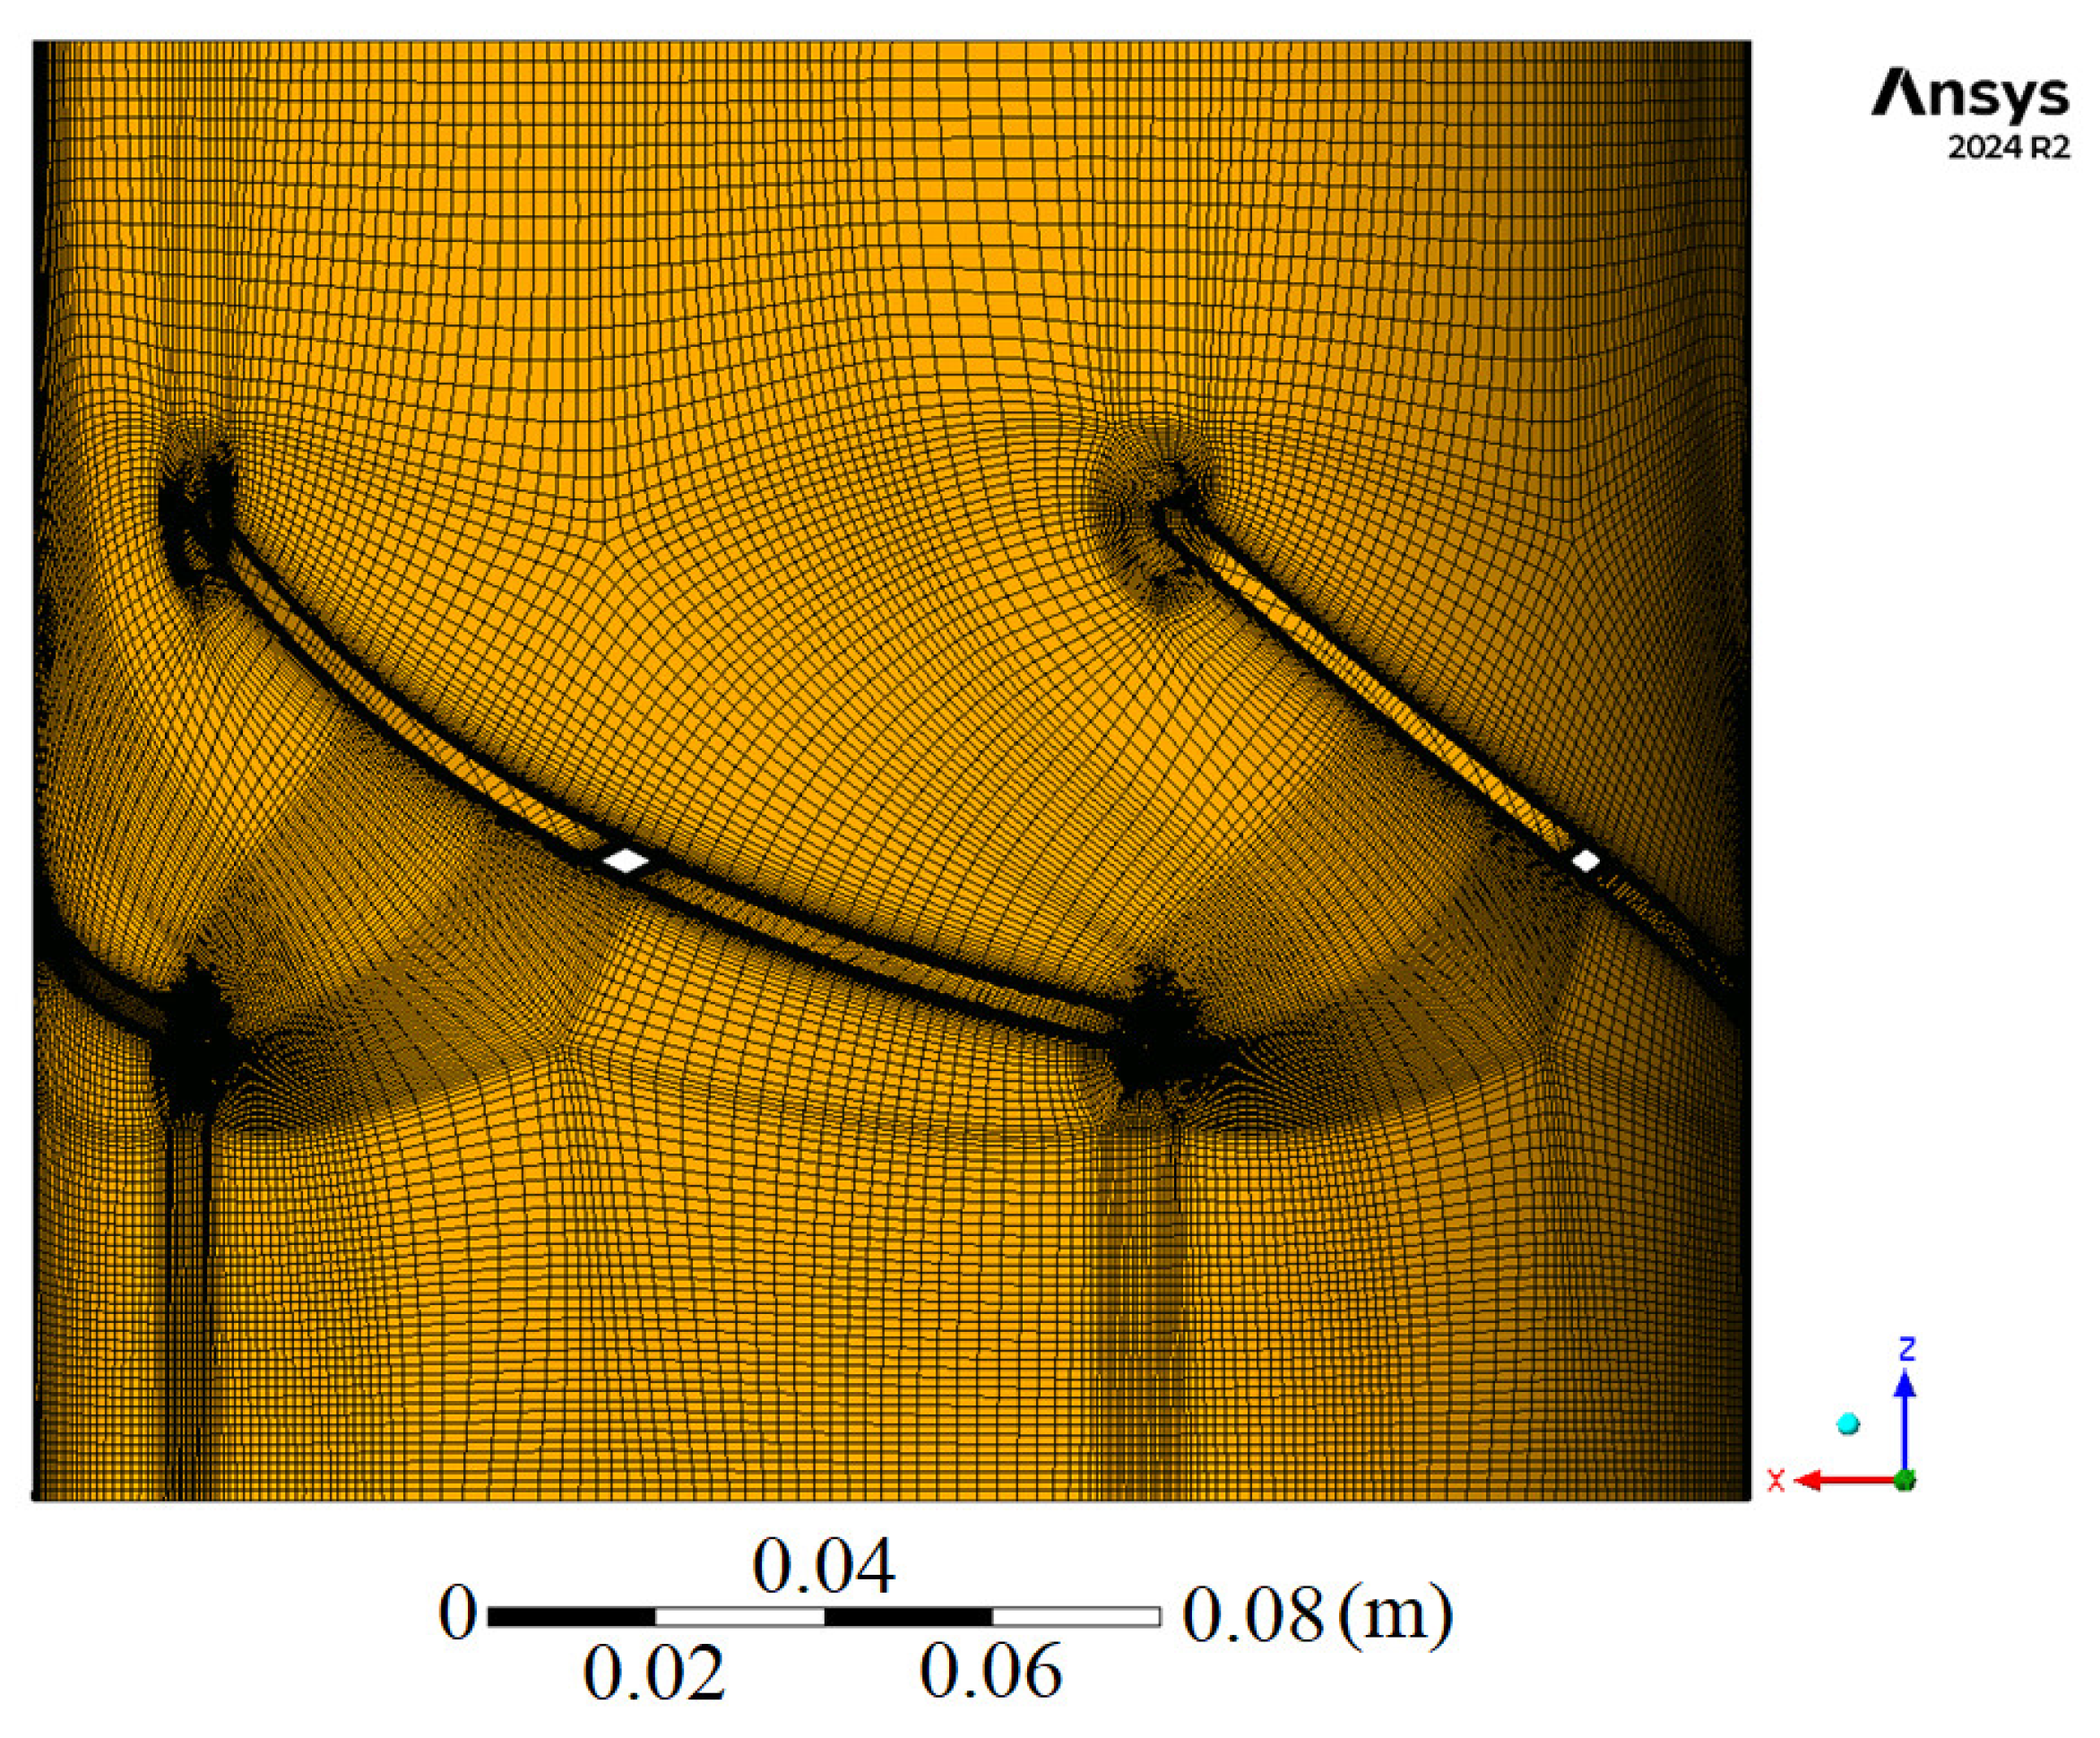
Figure 9.
Flow duration curve of the selected site.
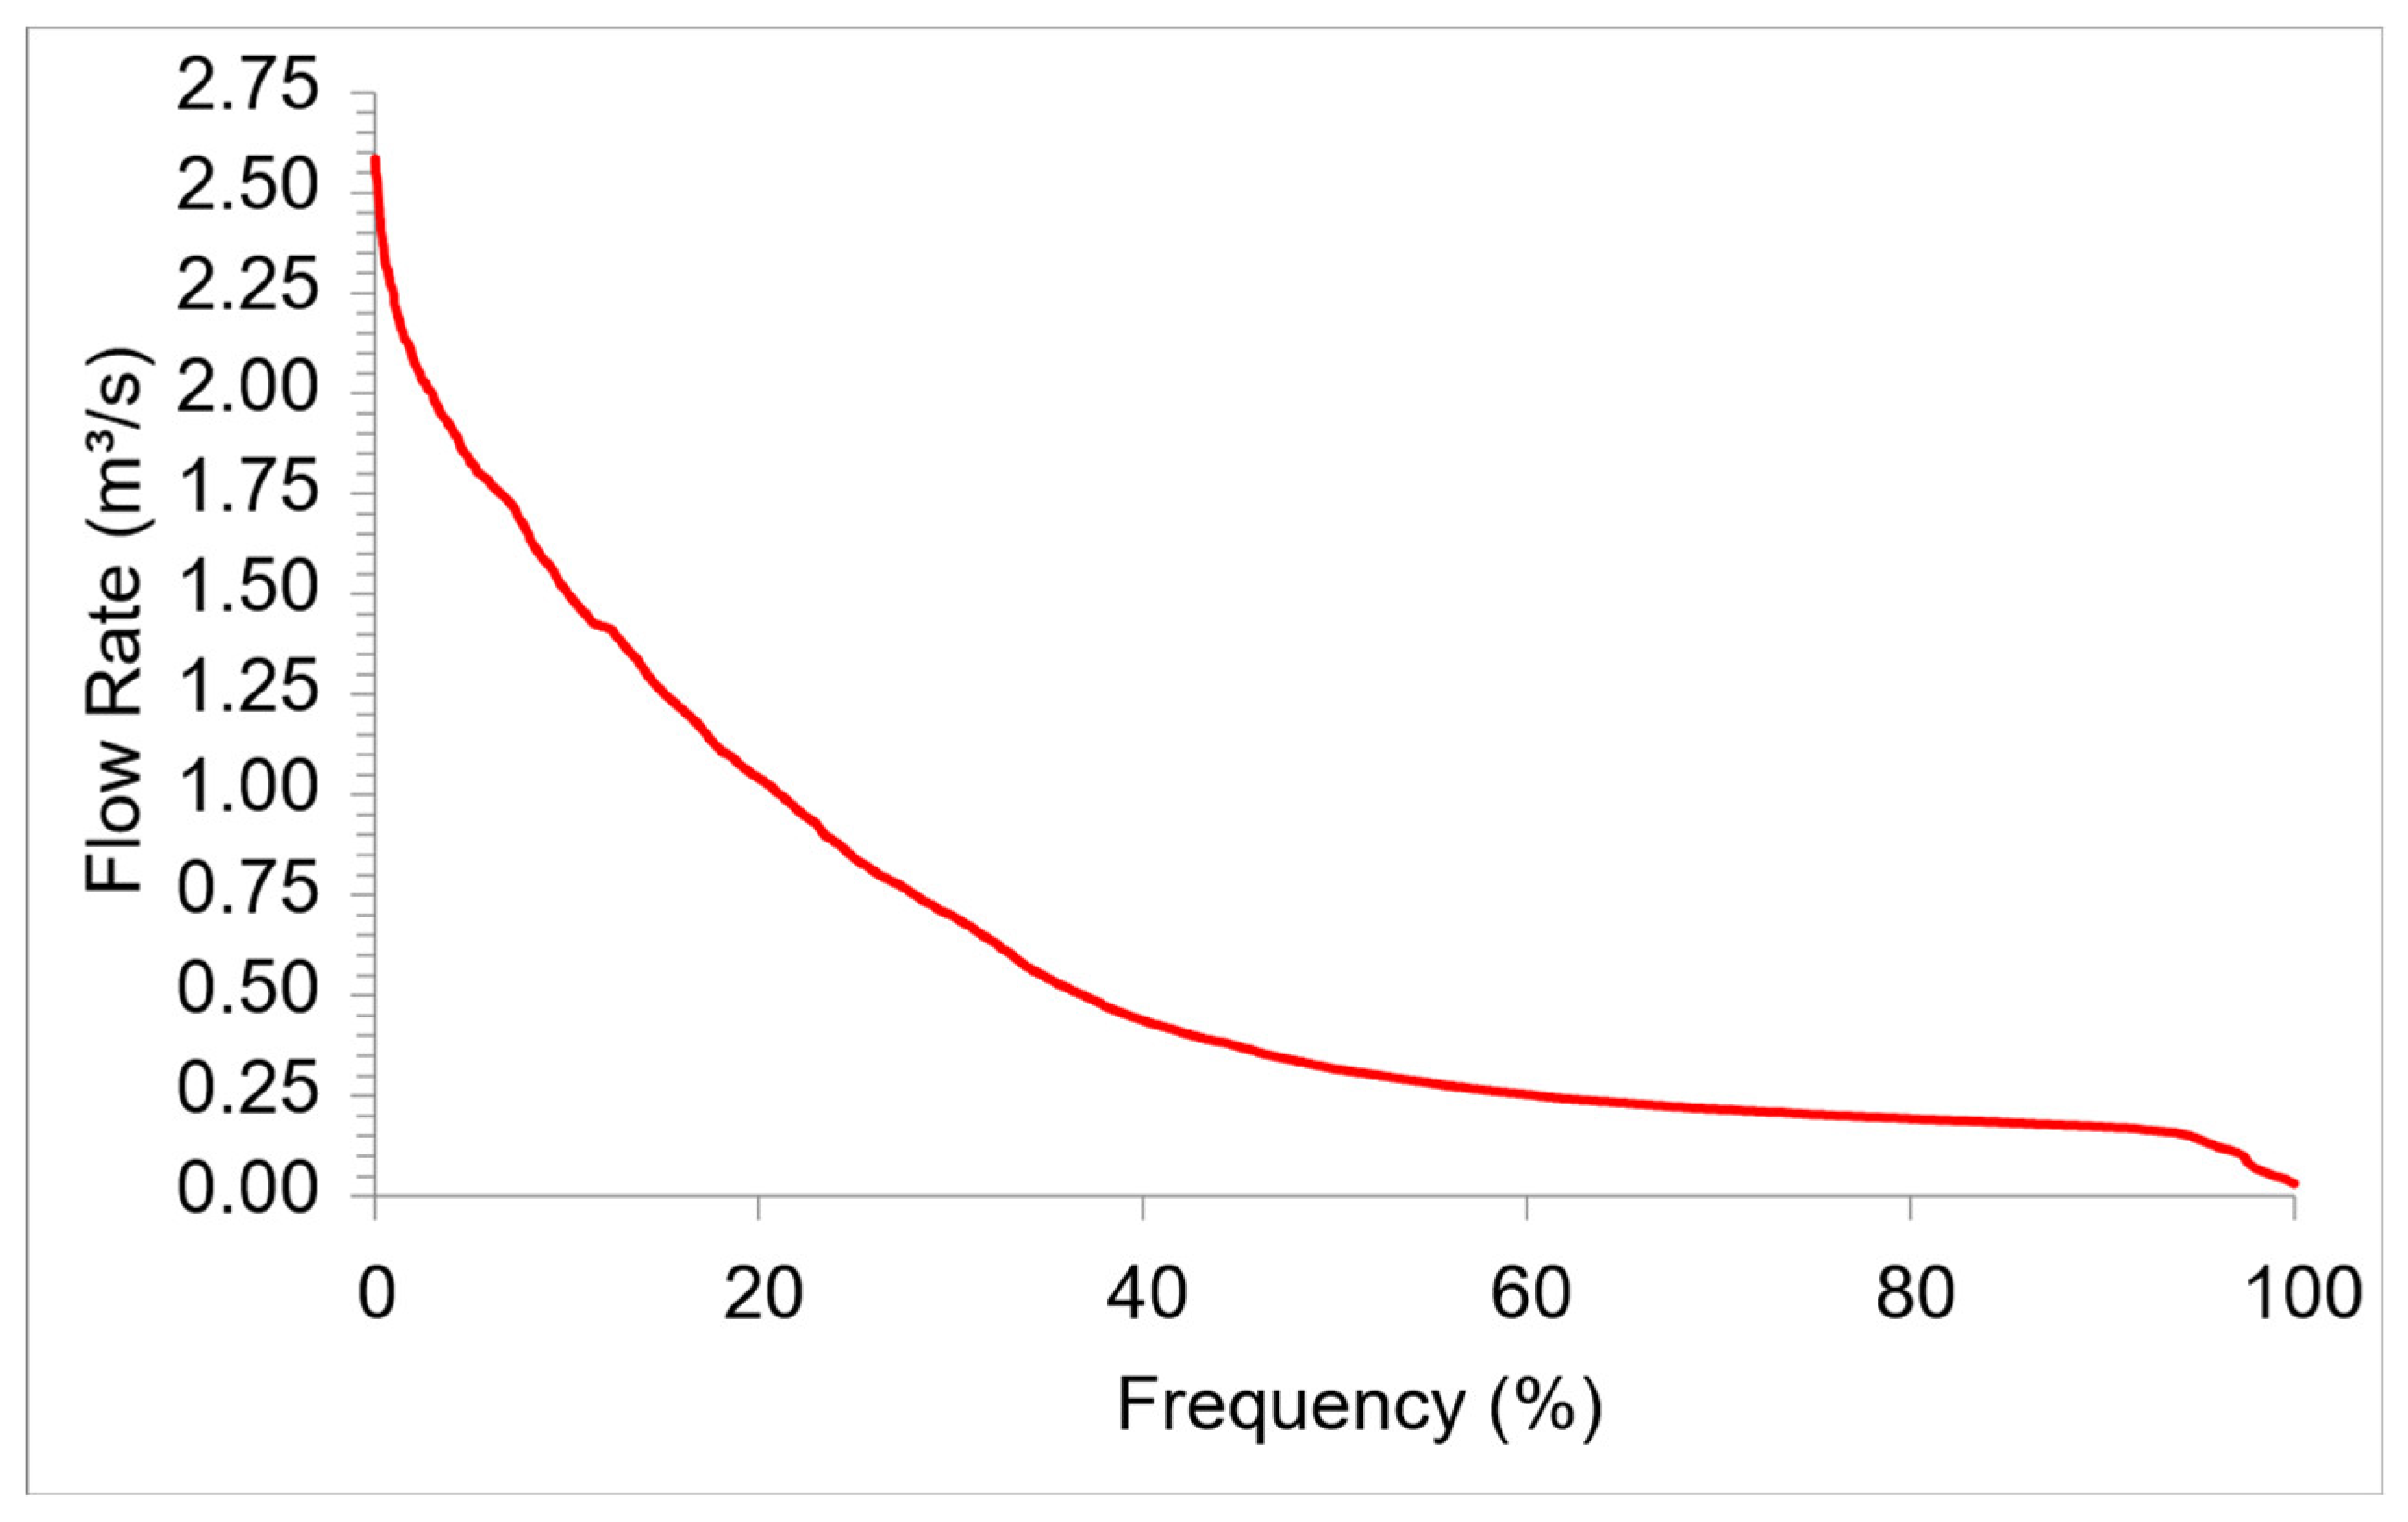
Figure 10.
Gross head curve of the selected site.
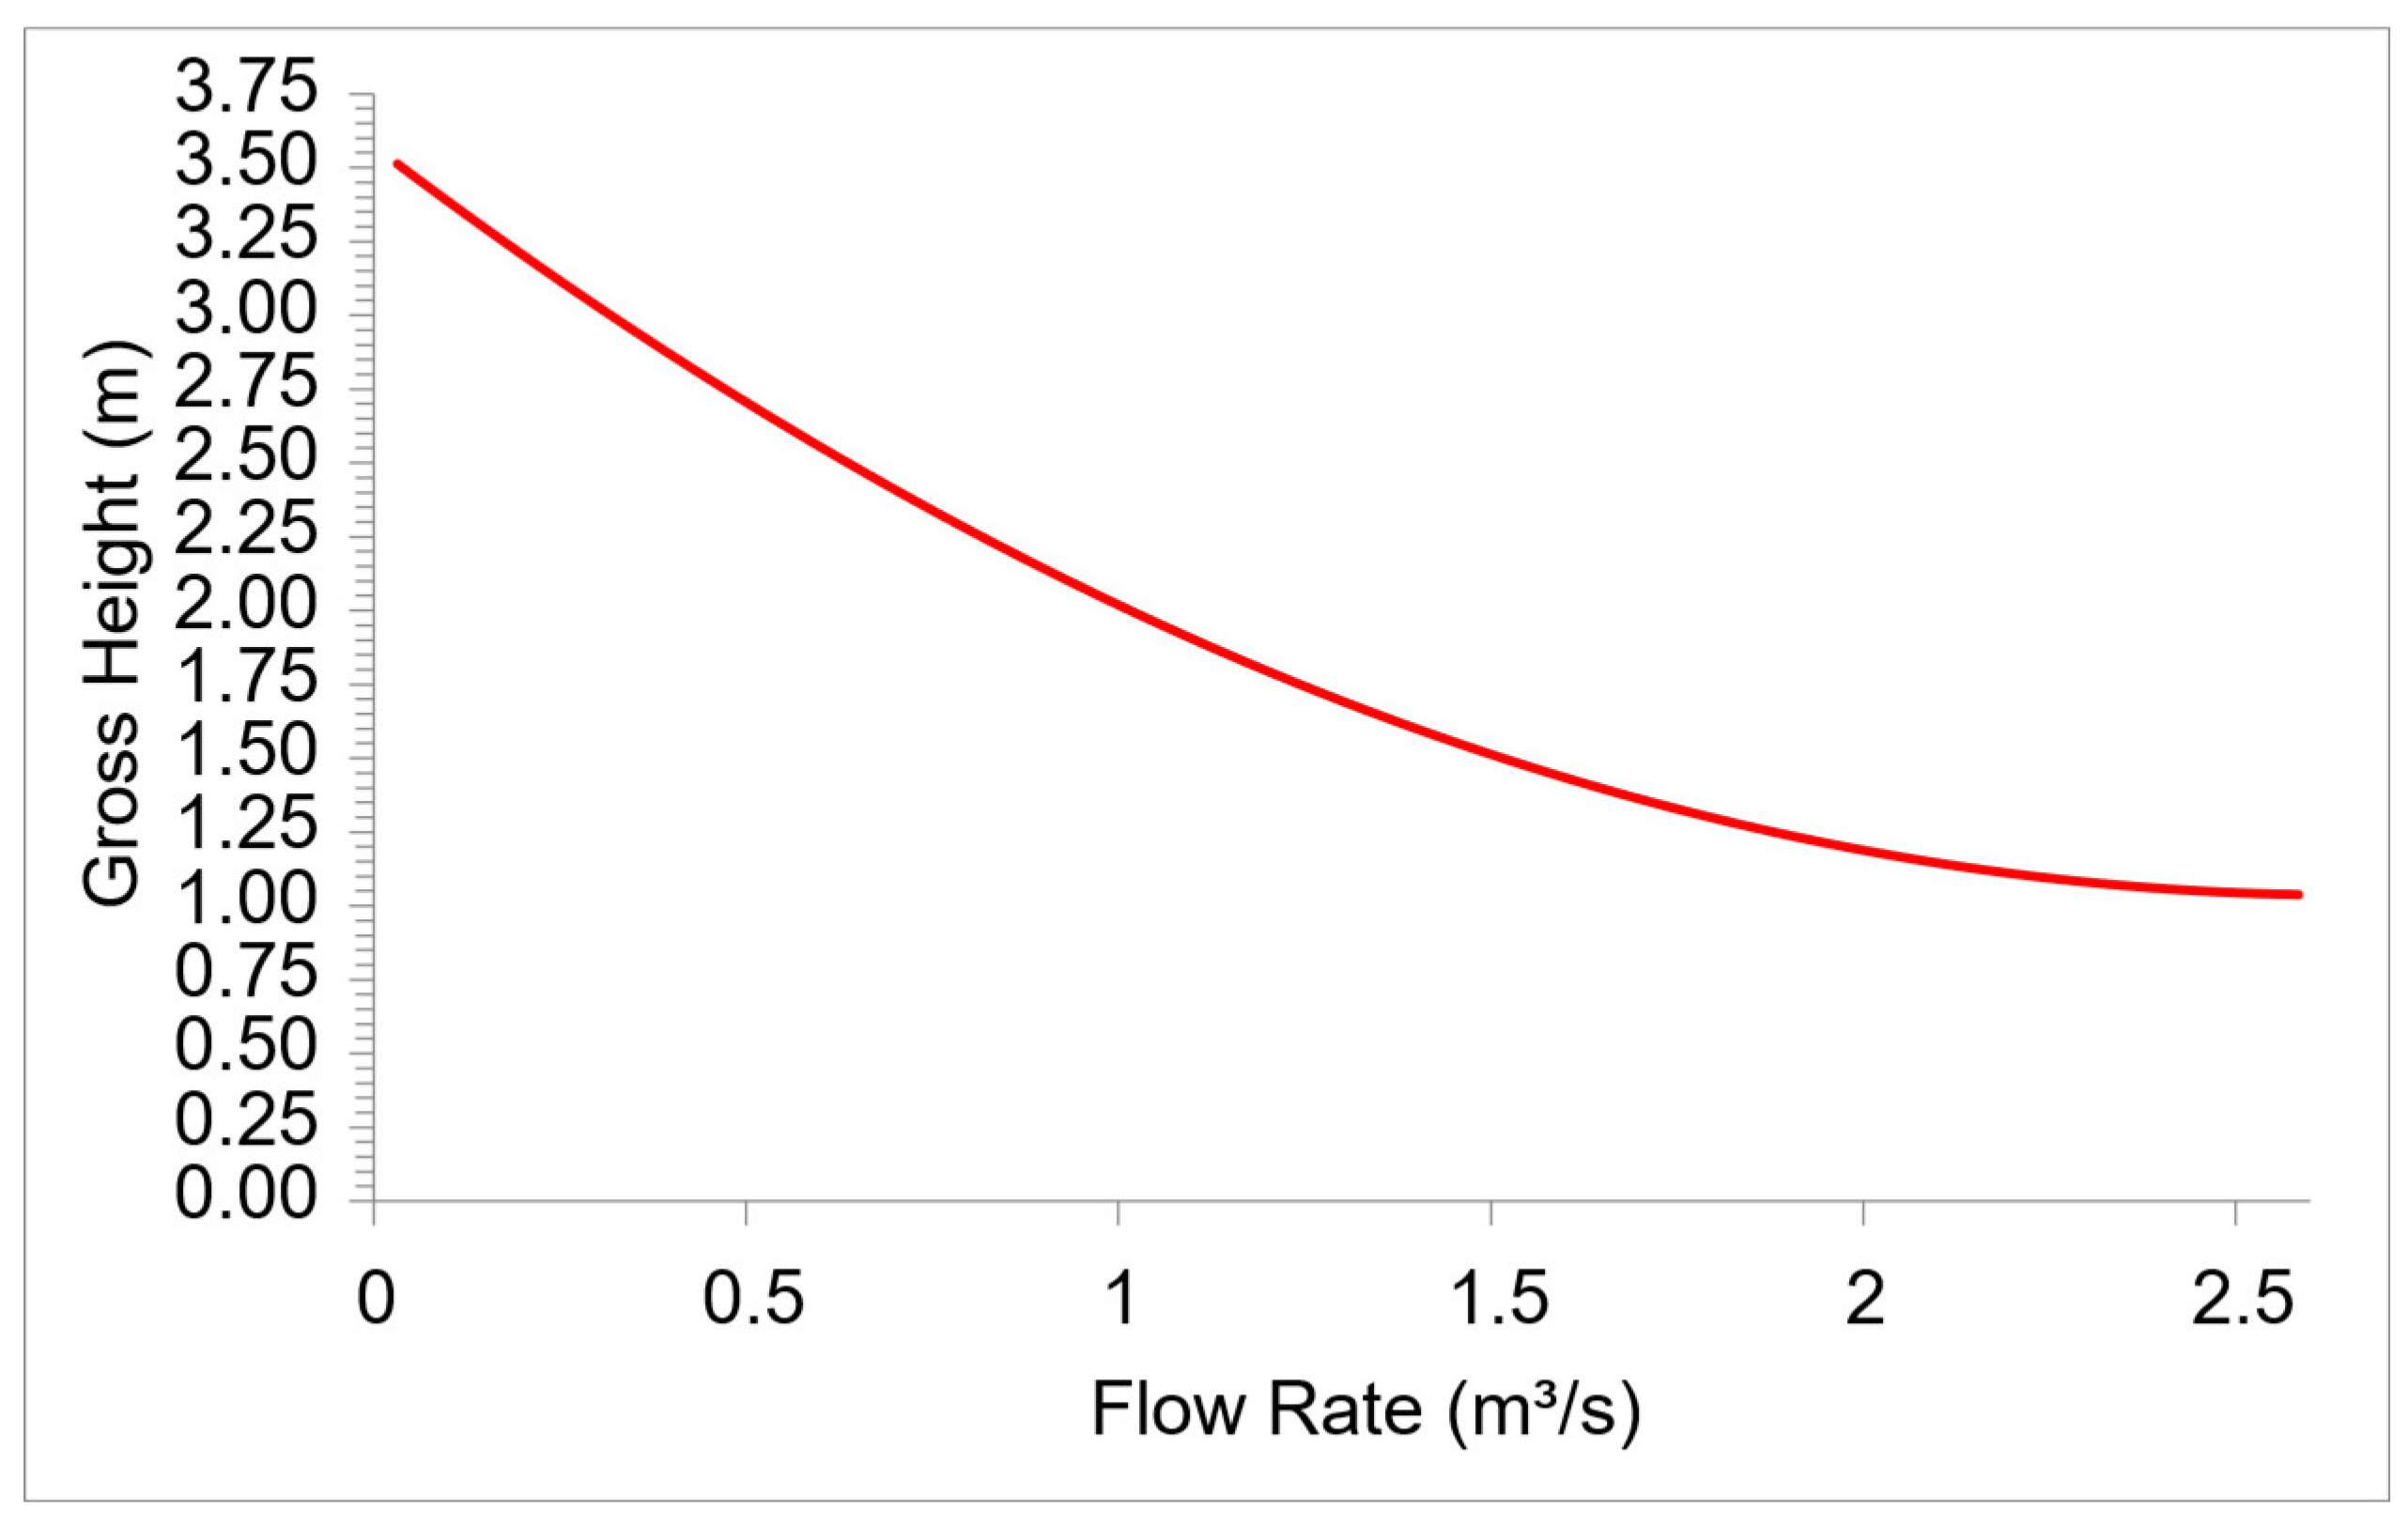
Figure 11.
Generated energy for each flow rate combination.
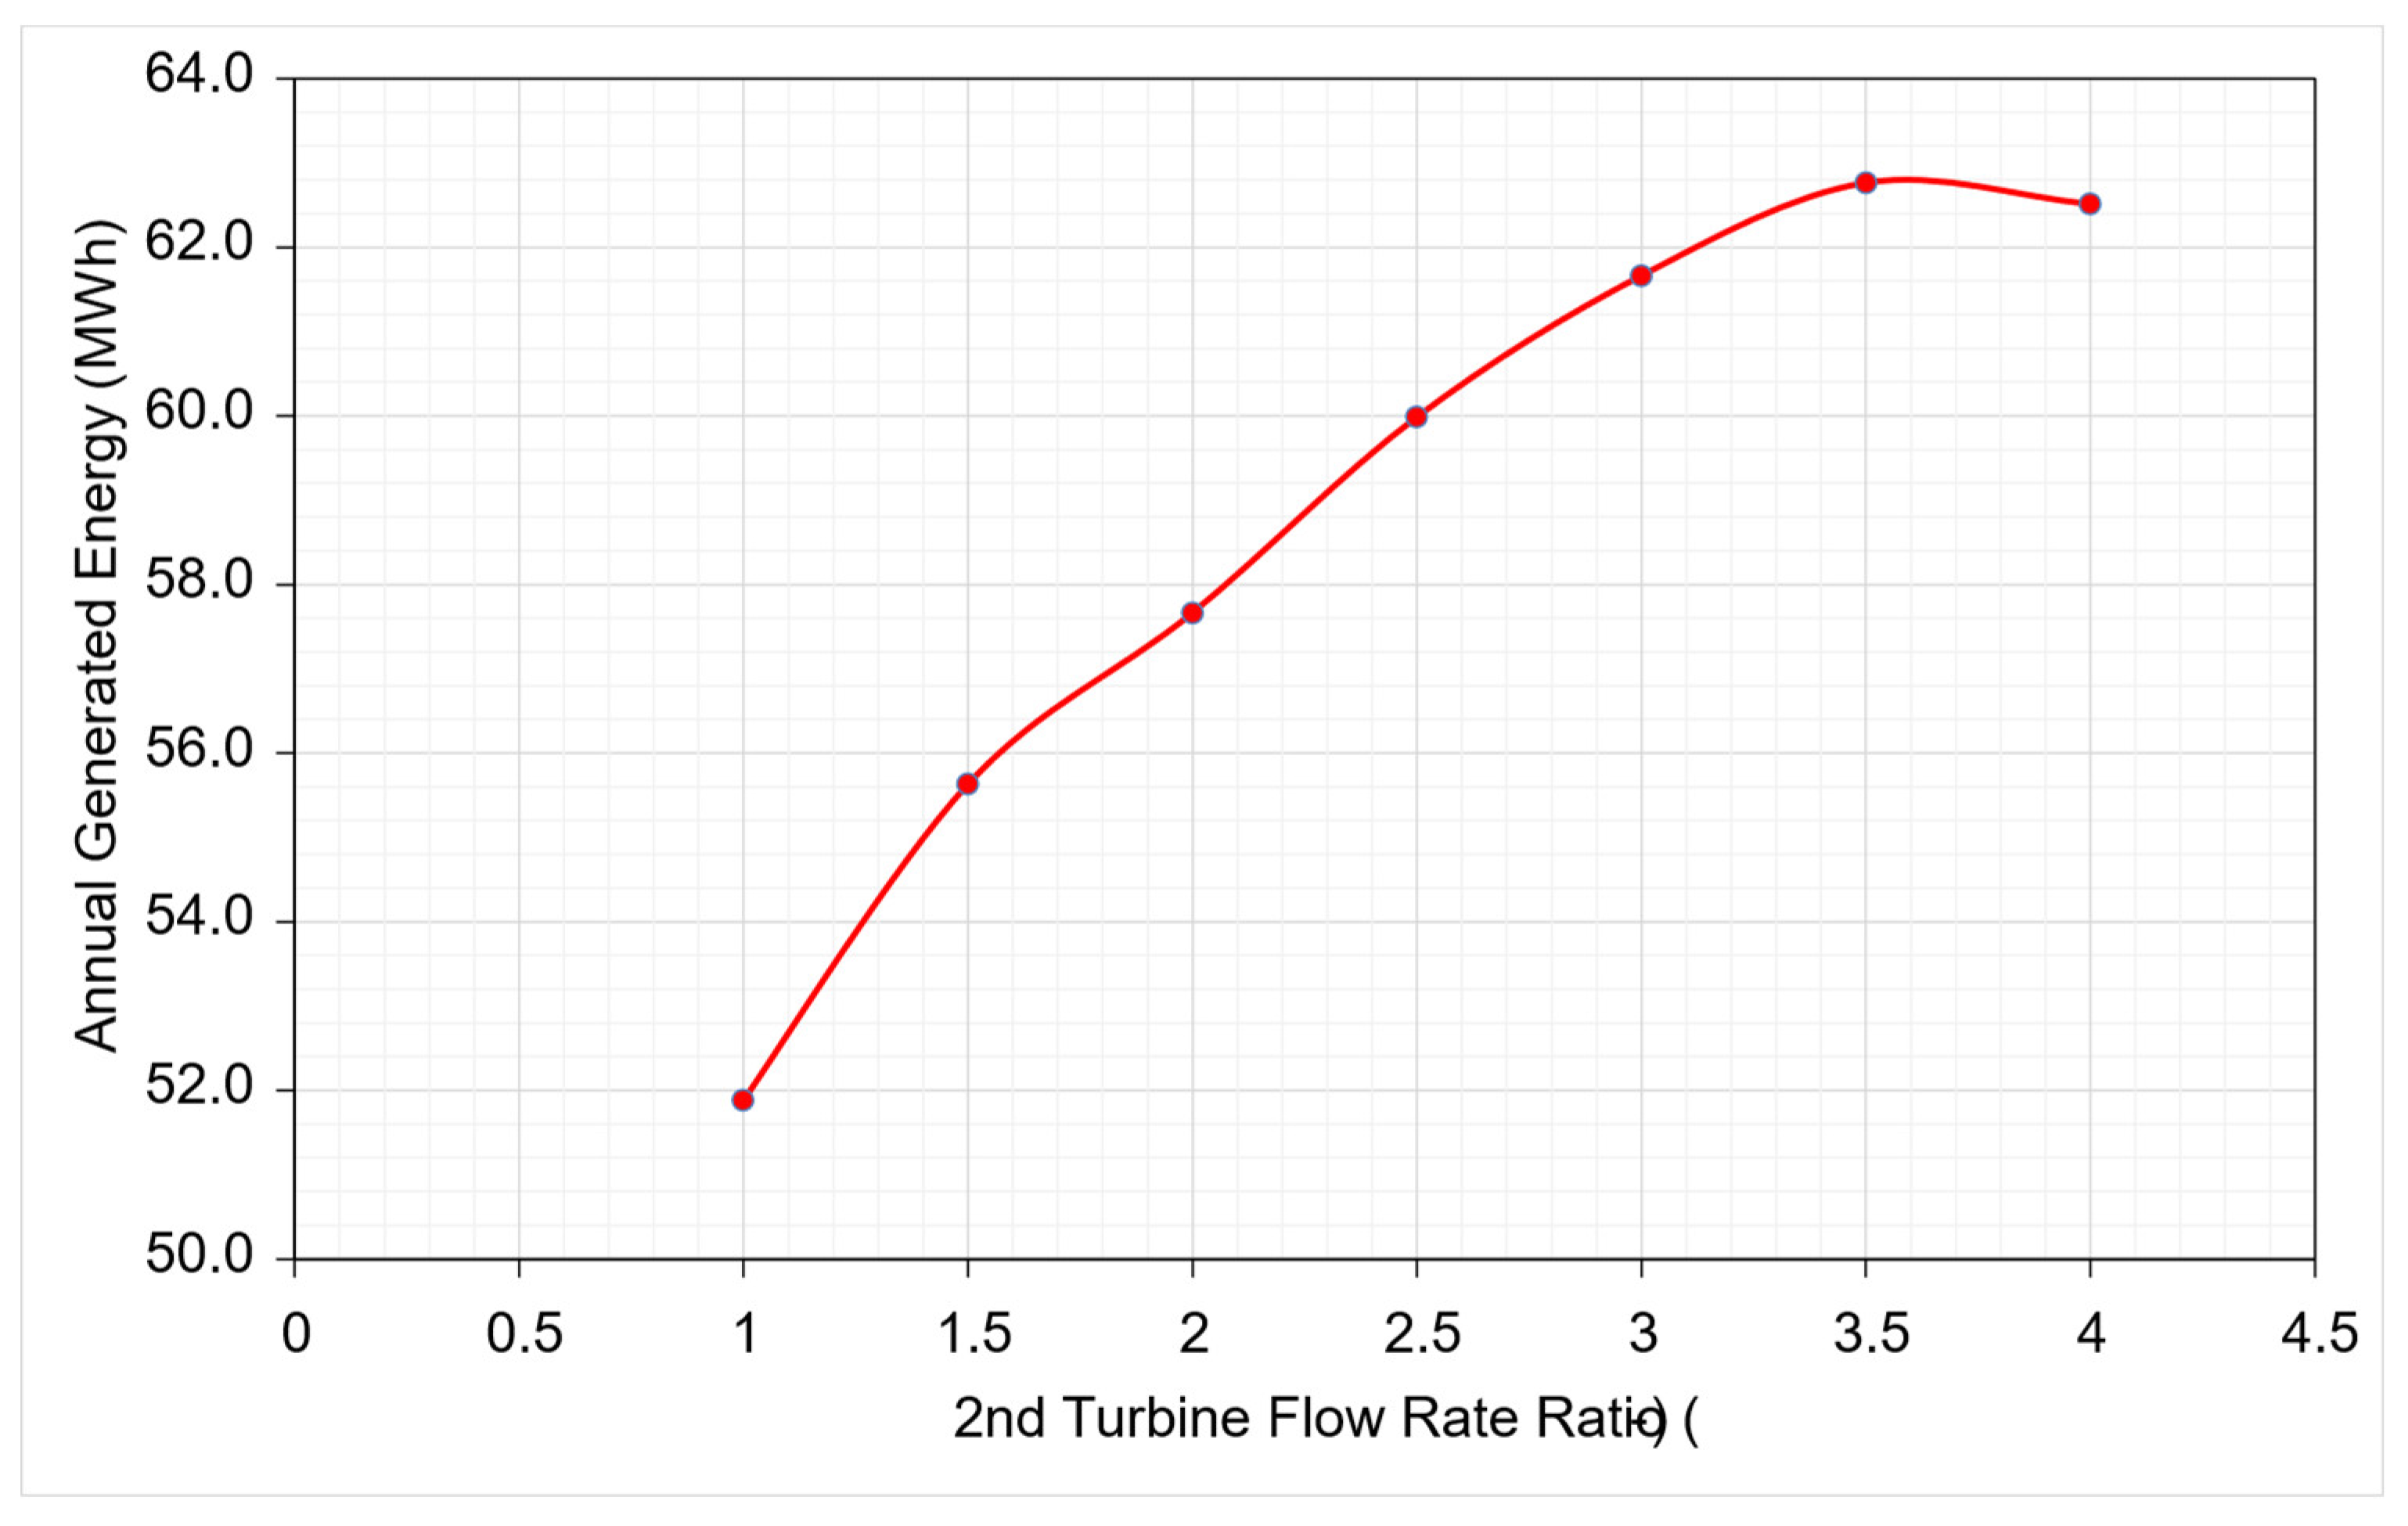
Figure 12.
Flow rate selected for each turbine for the best energy output.
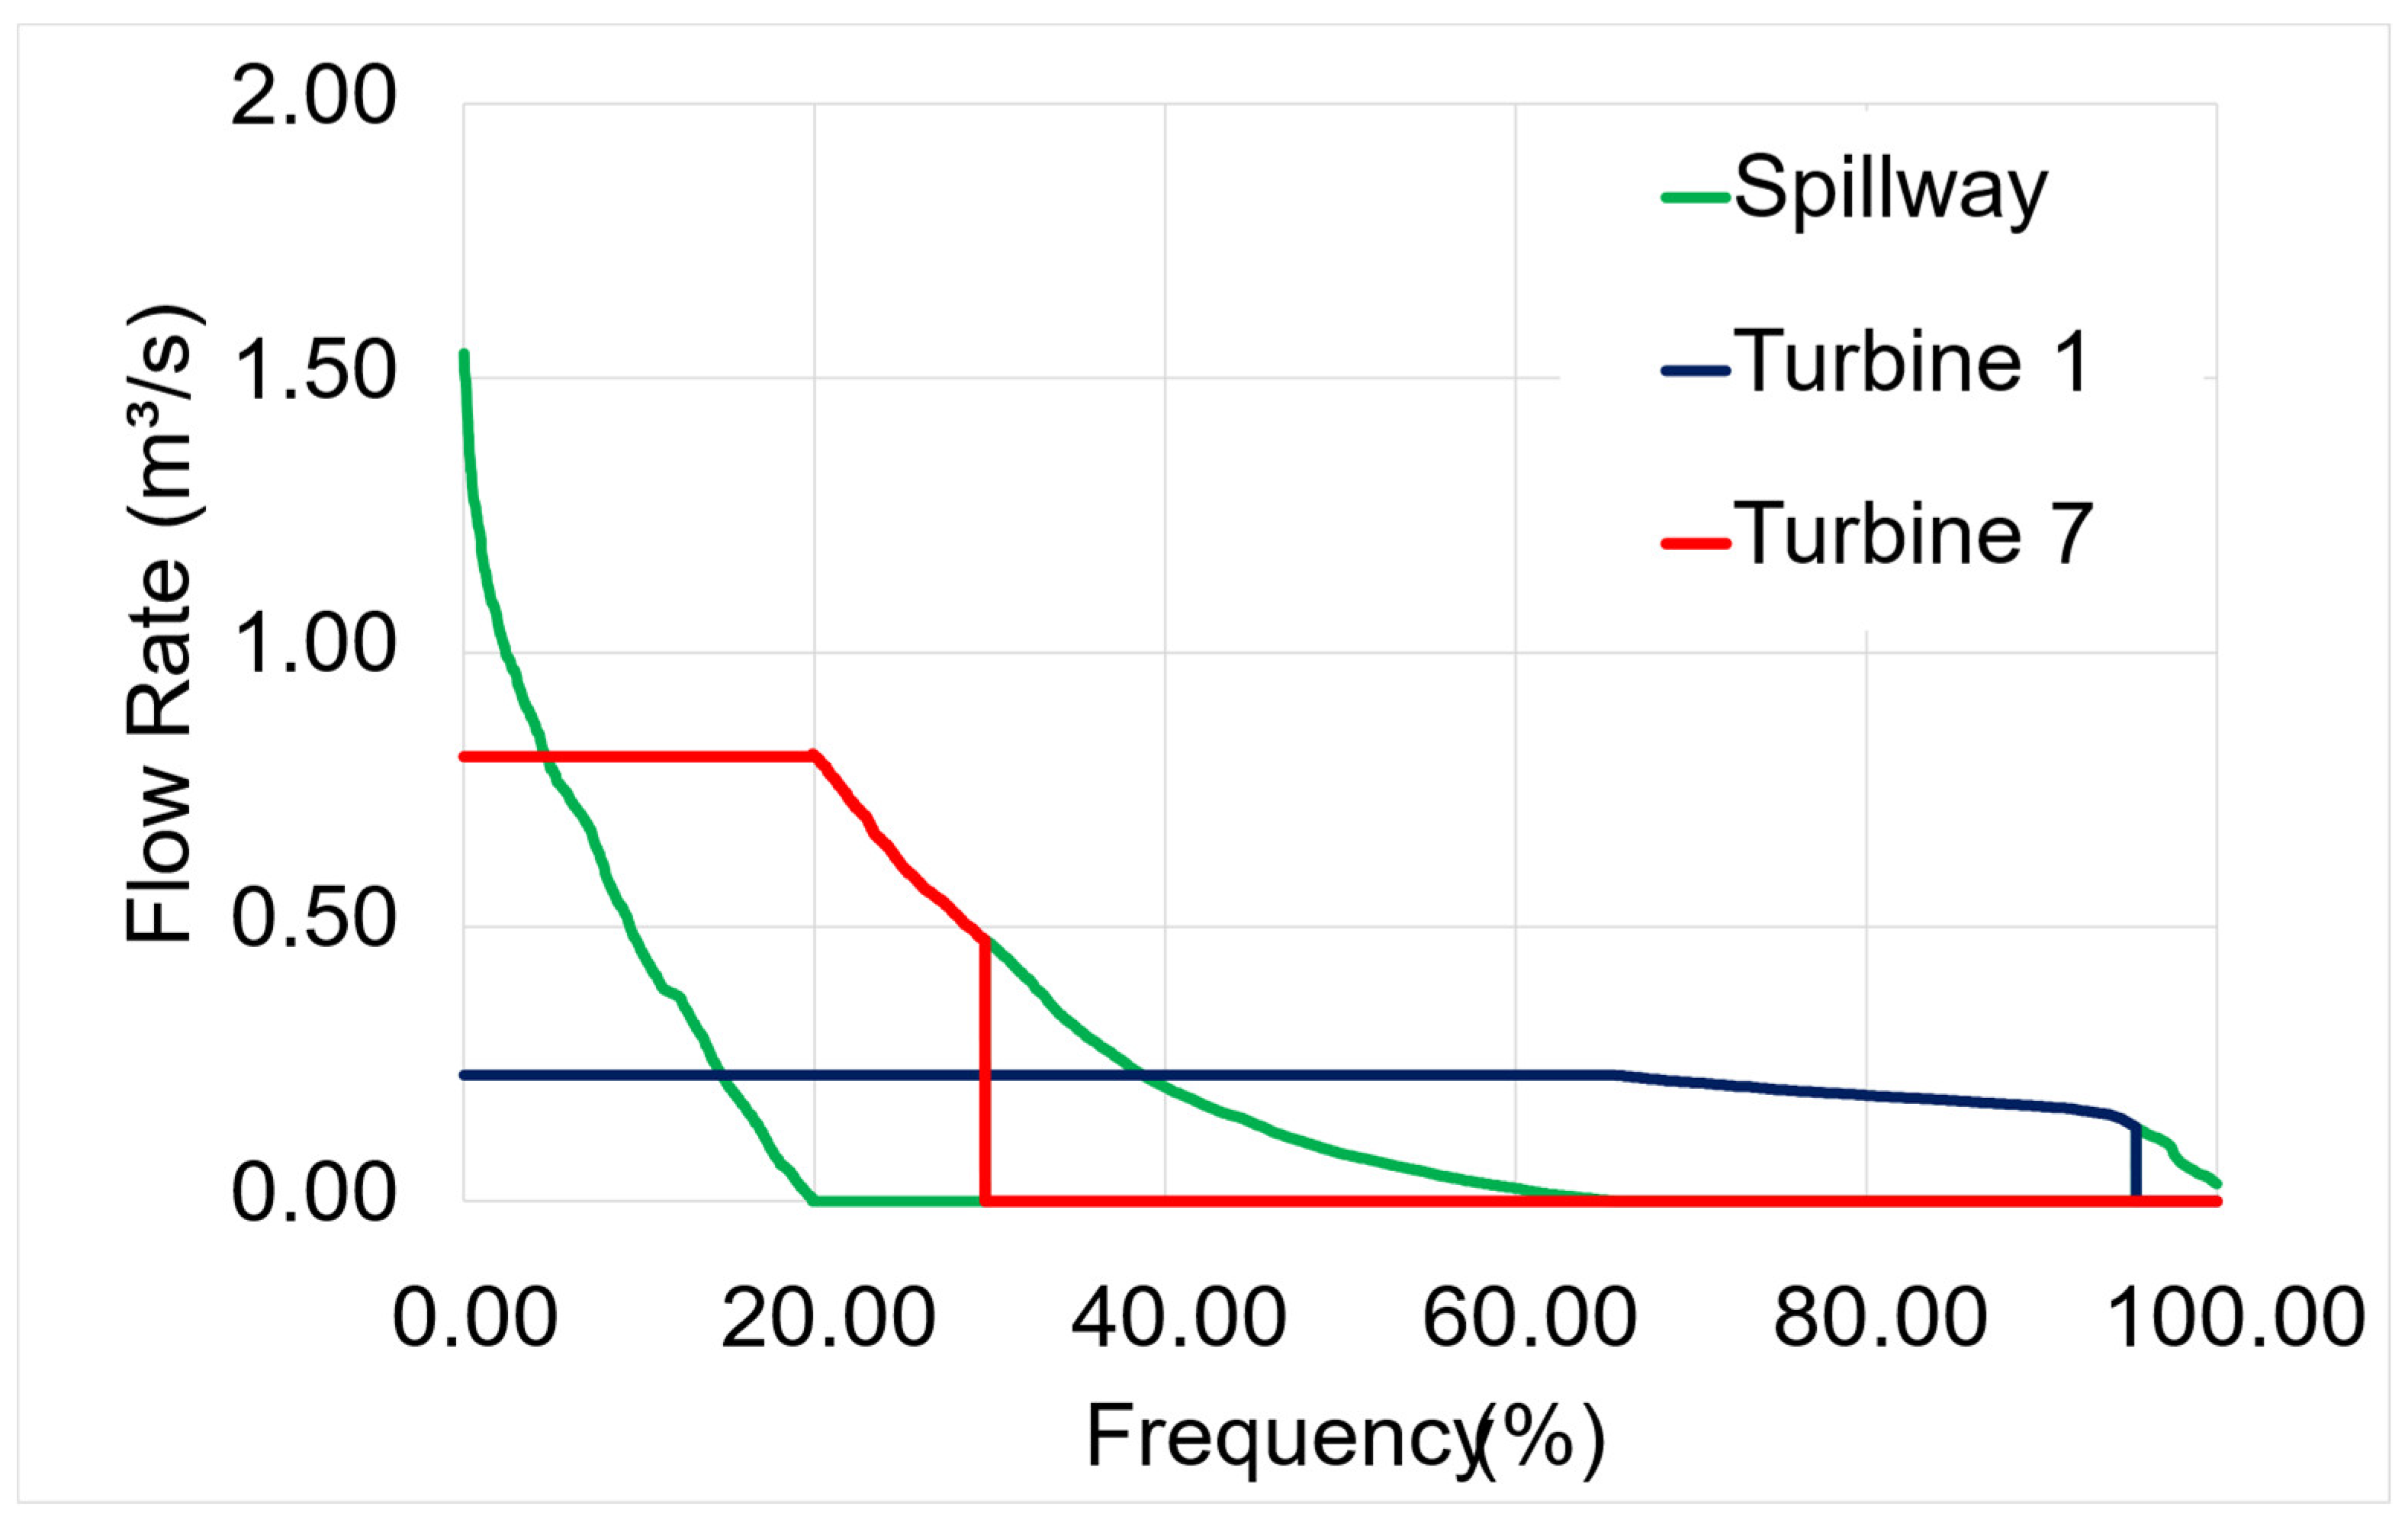
Figure 13.
Comparison of experimental and numerical values.
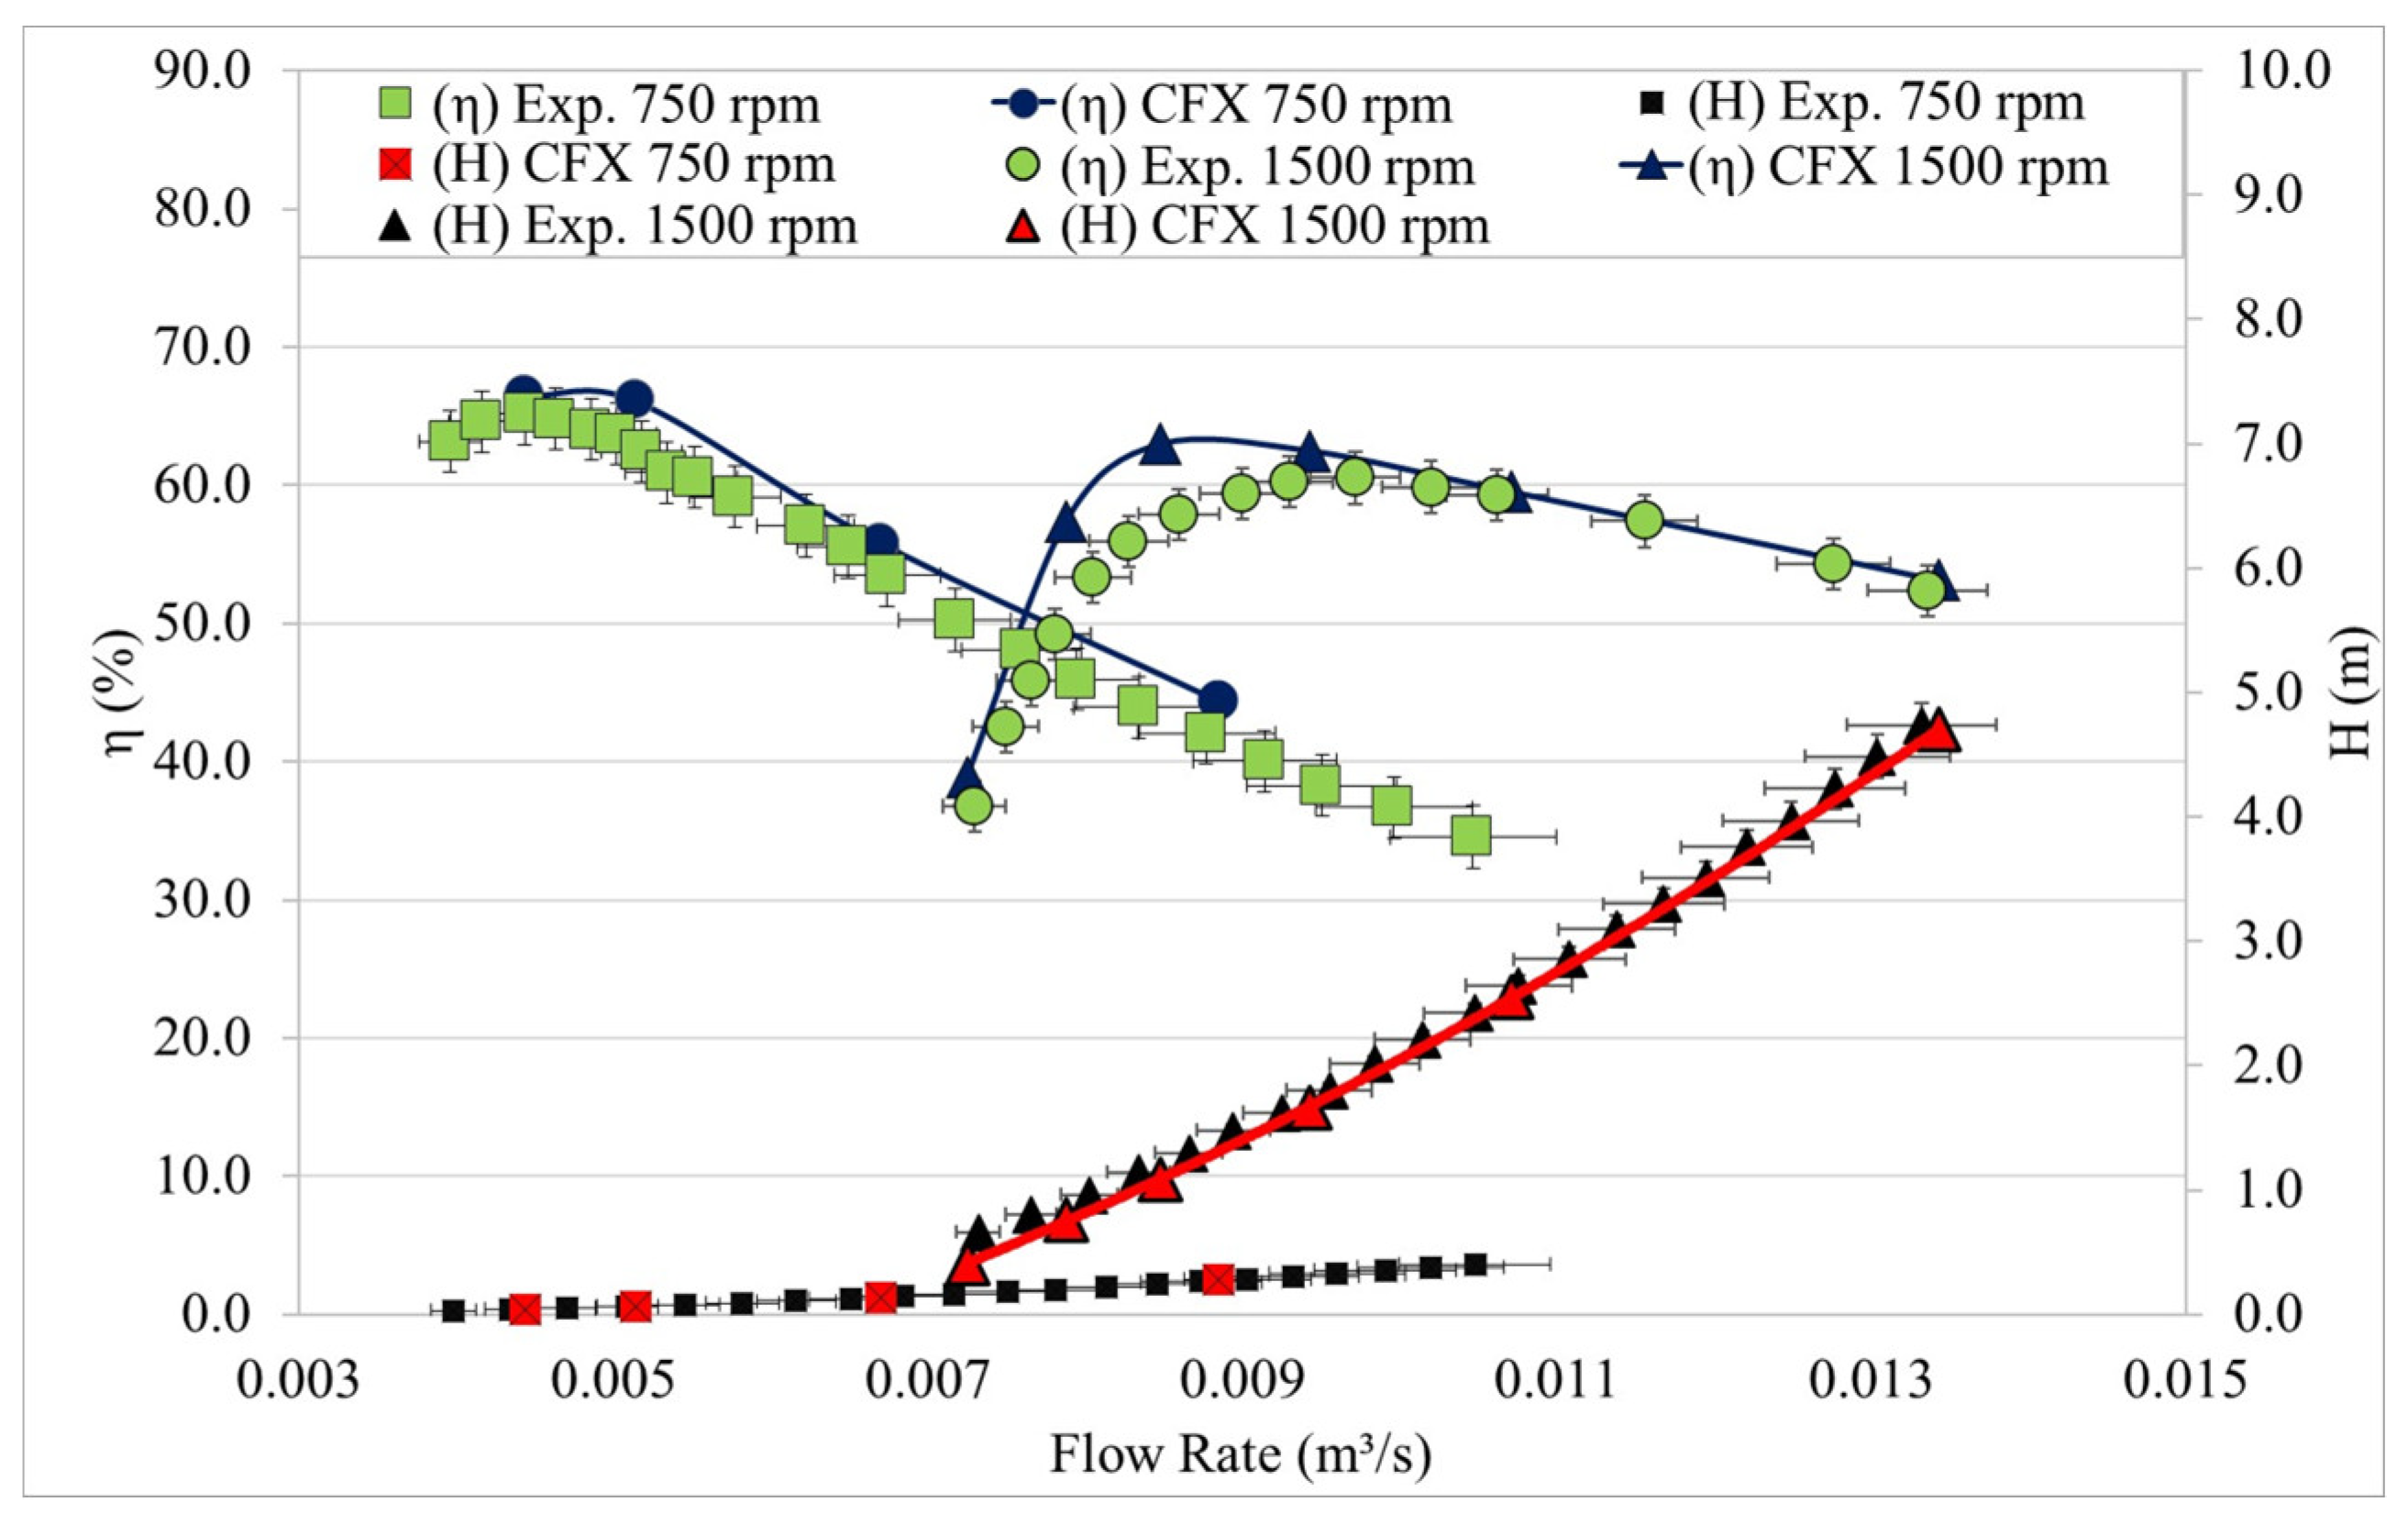
Figure 14.
Visualization of the flow in the tubular turbine used for validation.
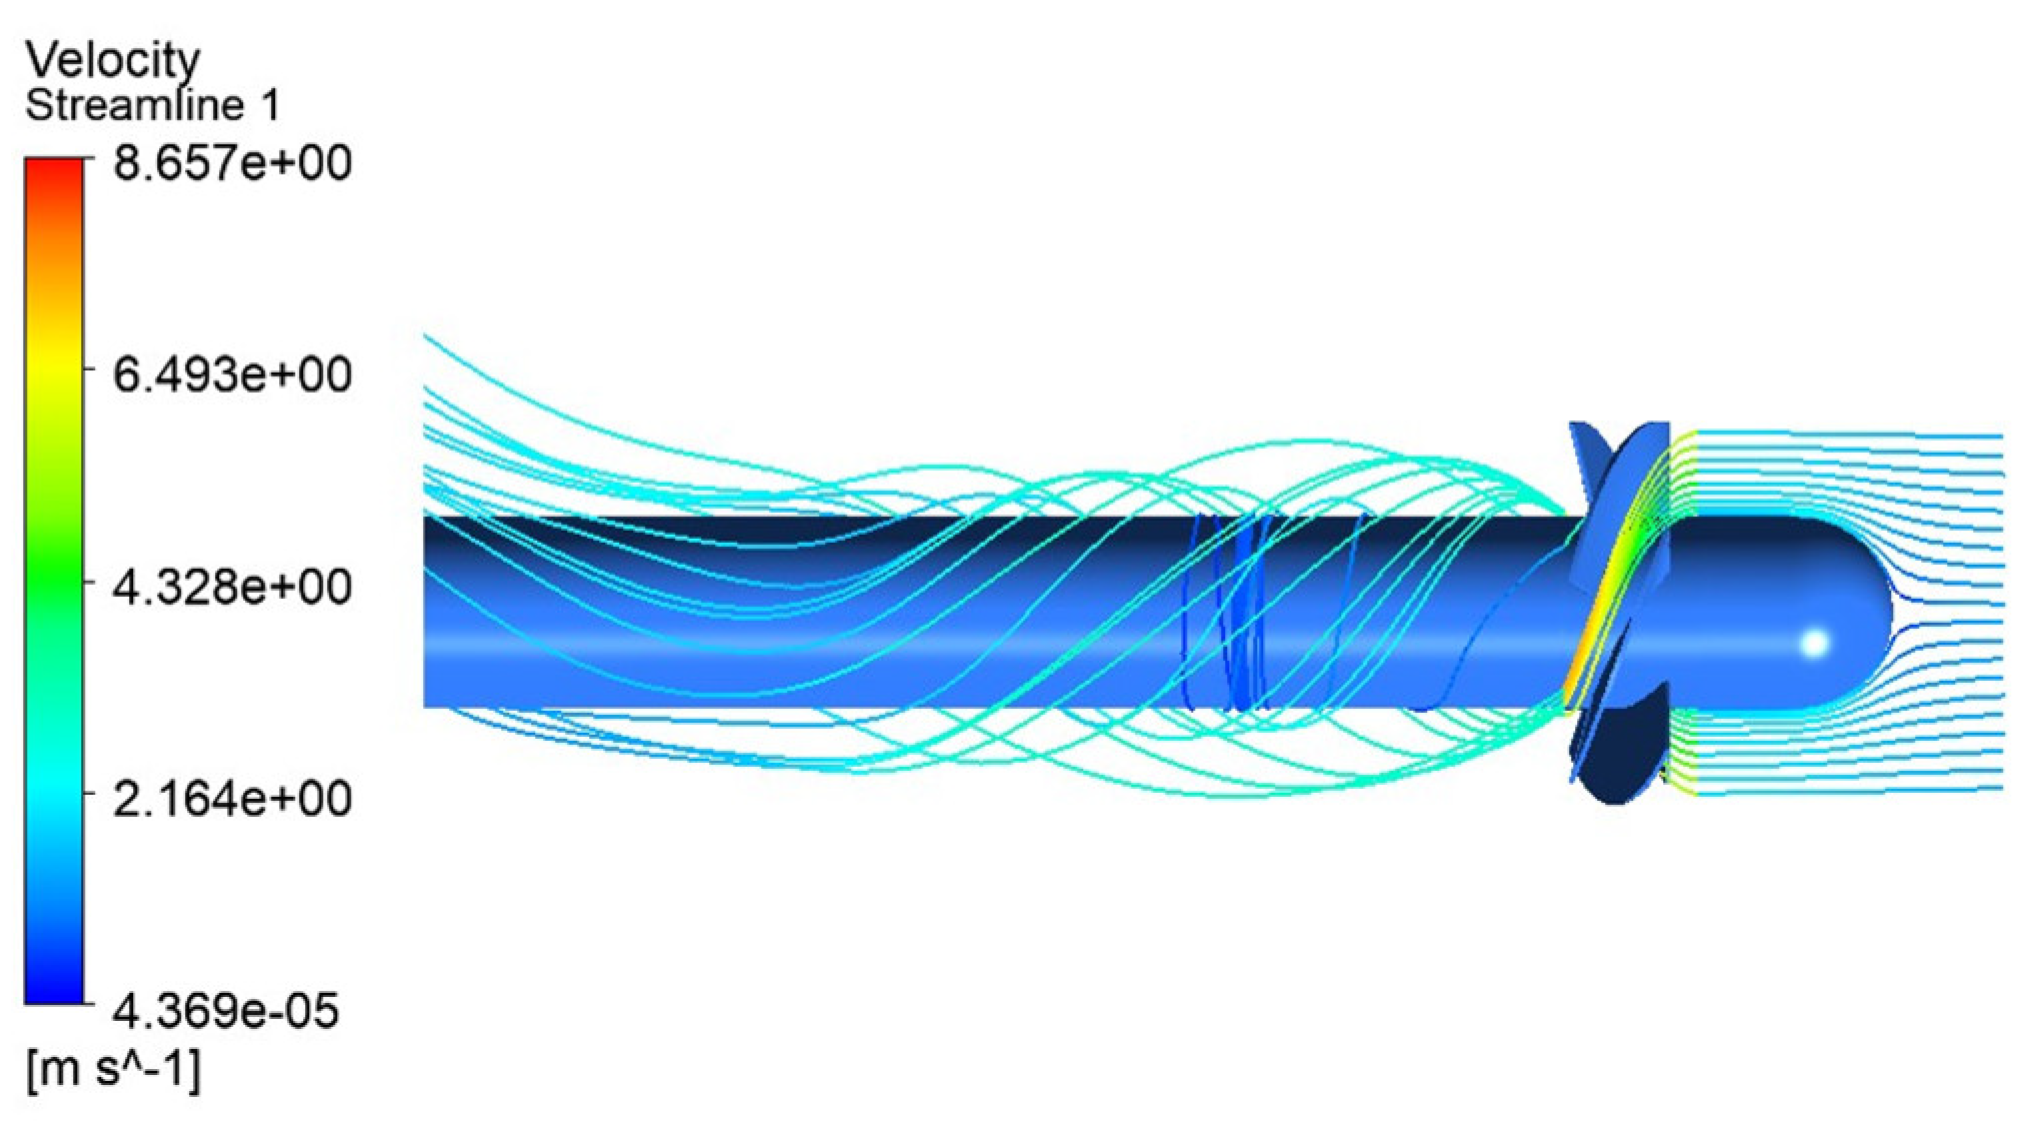
Figure 15.
Visualization of the flow on the three tested configurations: a) Machine a, b) Machine b. c) Machine c.
Figure 15.
Visualization of the flow on the three tested configurations: a) Machine a, b) Machine b. c) Machine c.
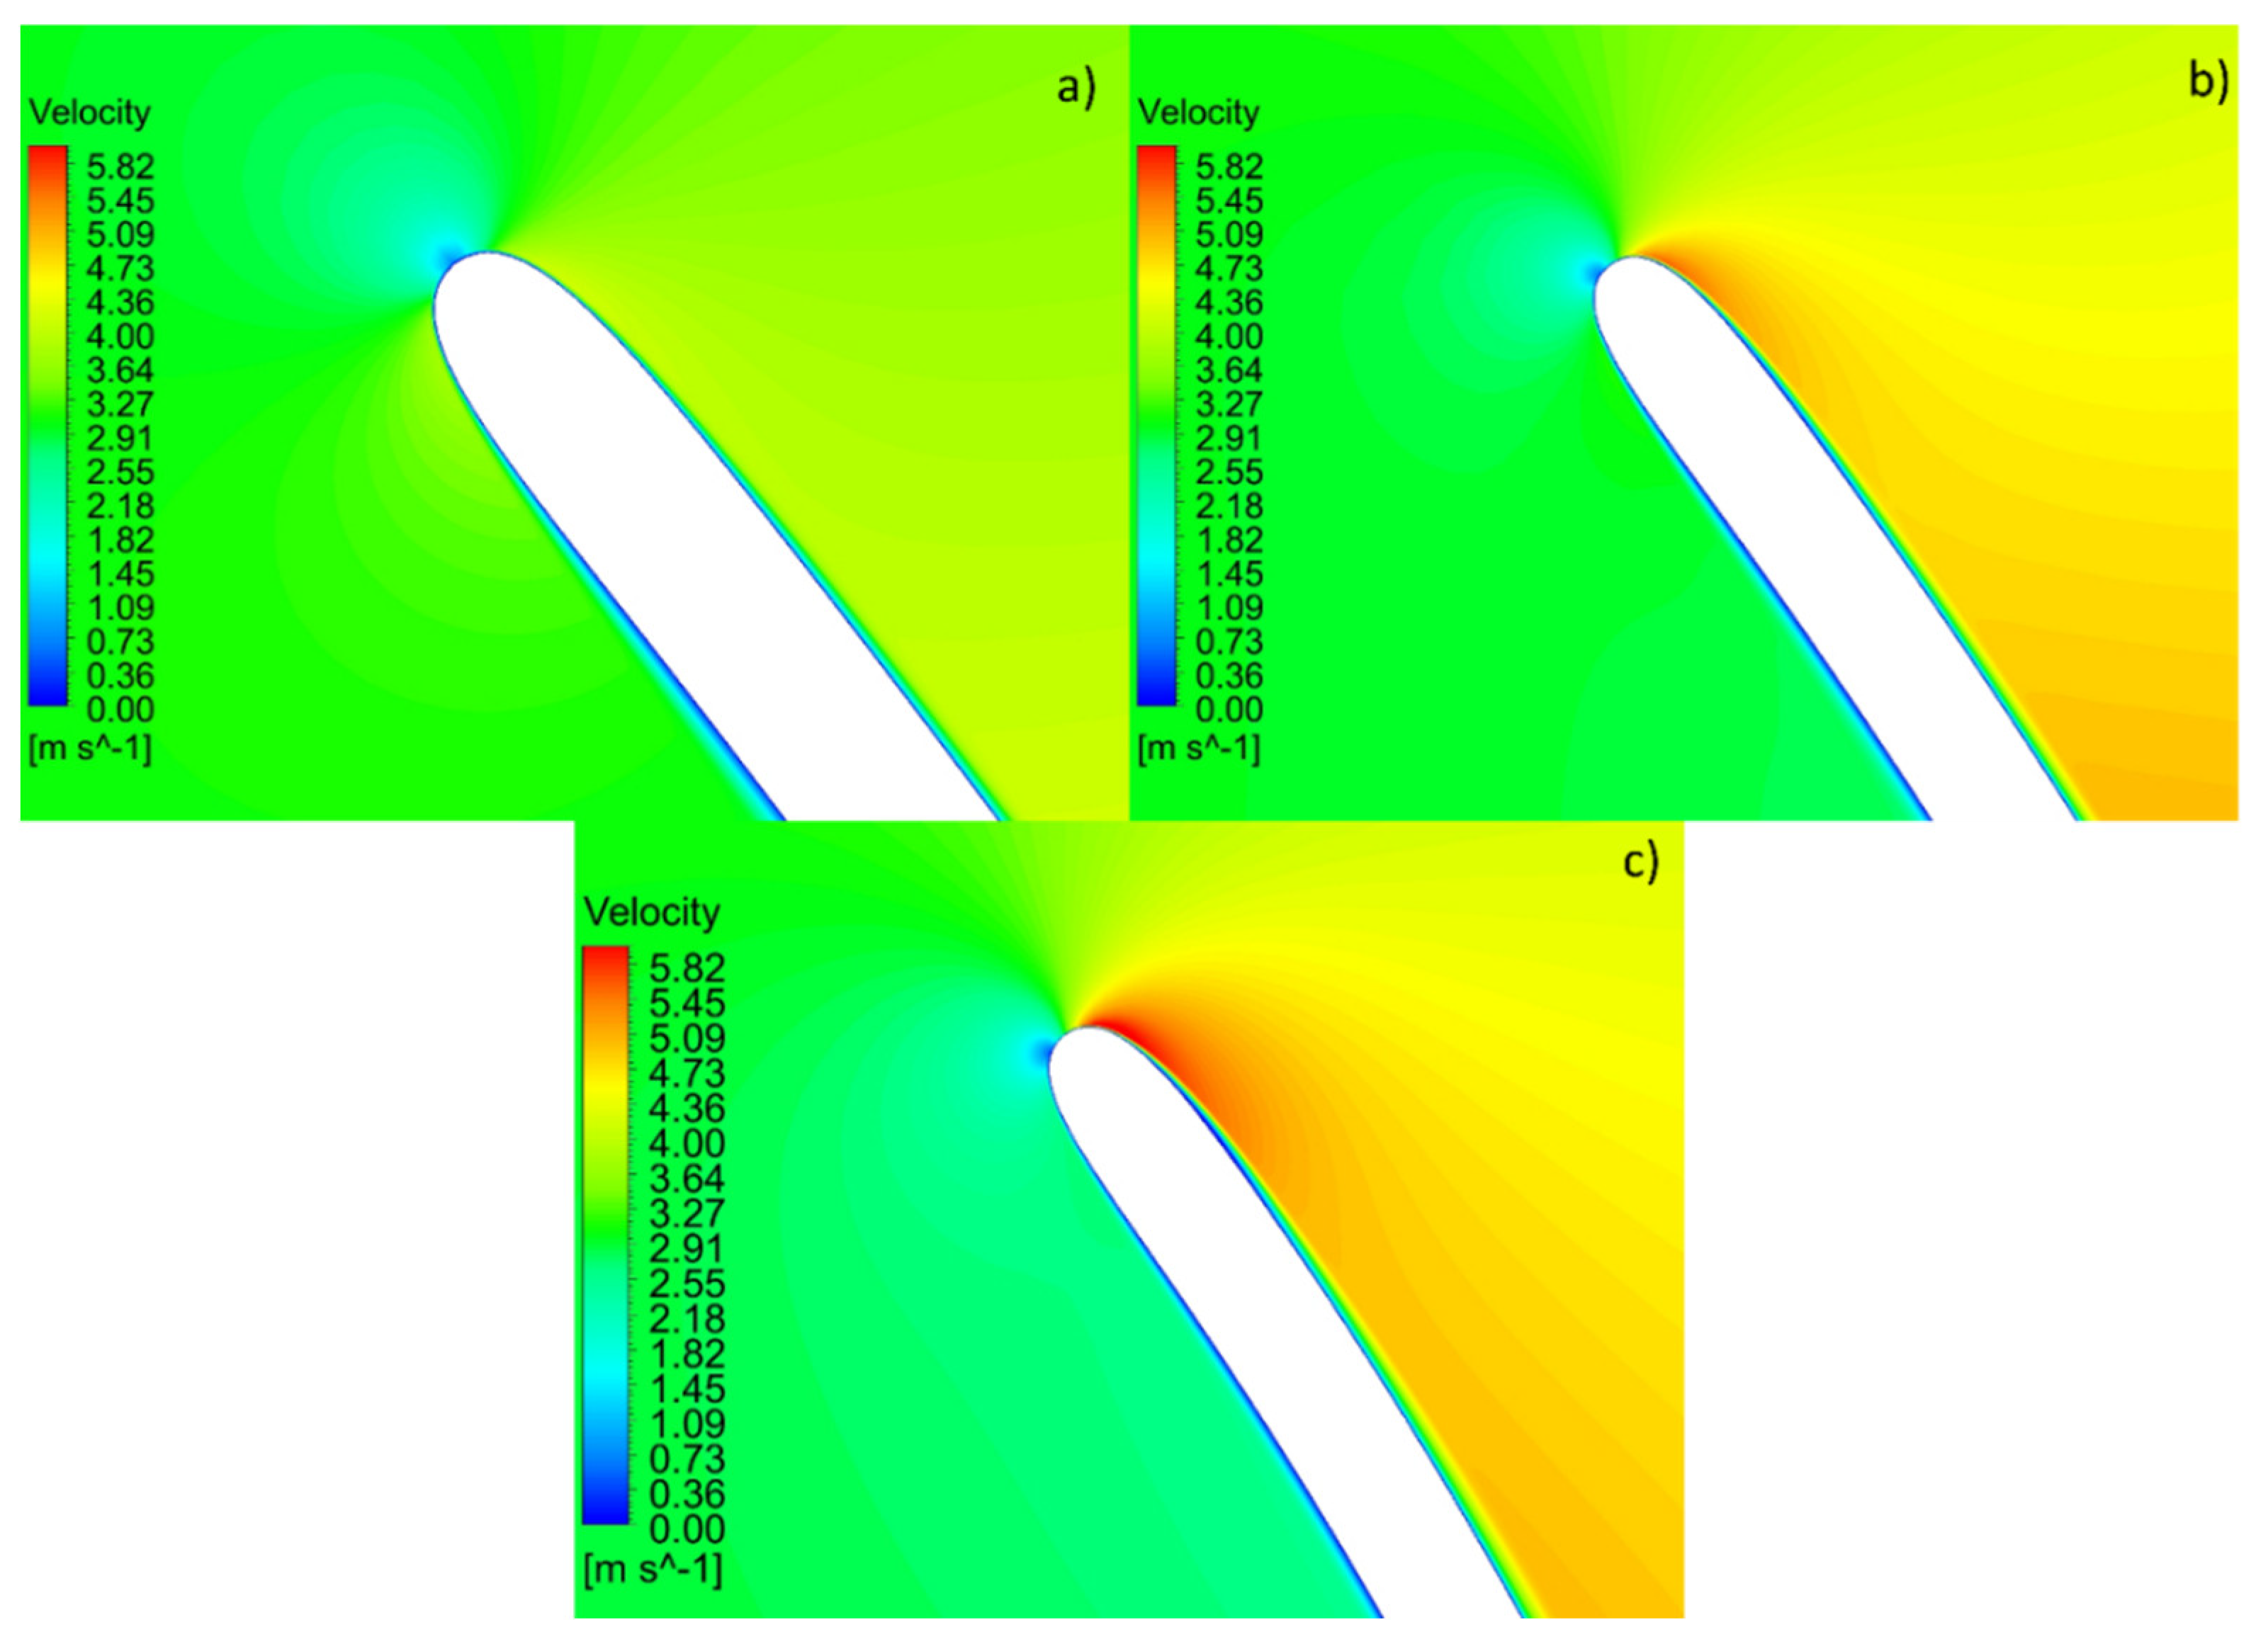
Figure 16.
Turbines designed without guide vanes. a)-T1 Lateral View. b) – T1 Front View. c) -T7 Lateral View. d) - T7 Front View.
Figure 16.
Turbines designed without guide vanes. a)-T1 Lateral View. b) – T1 Front View. c) -T7 Lateral View. d) - T7 Front View.
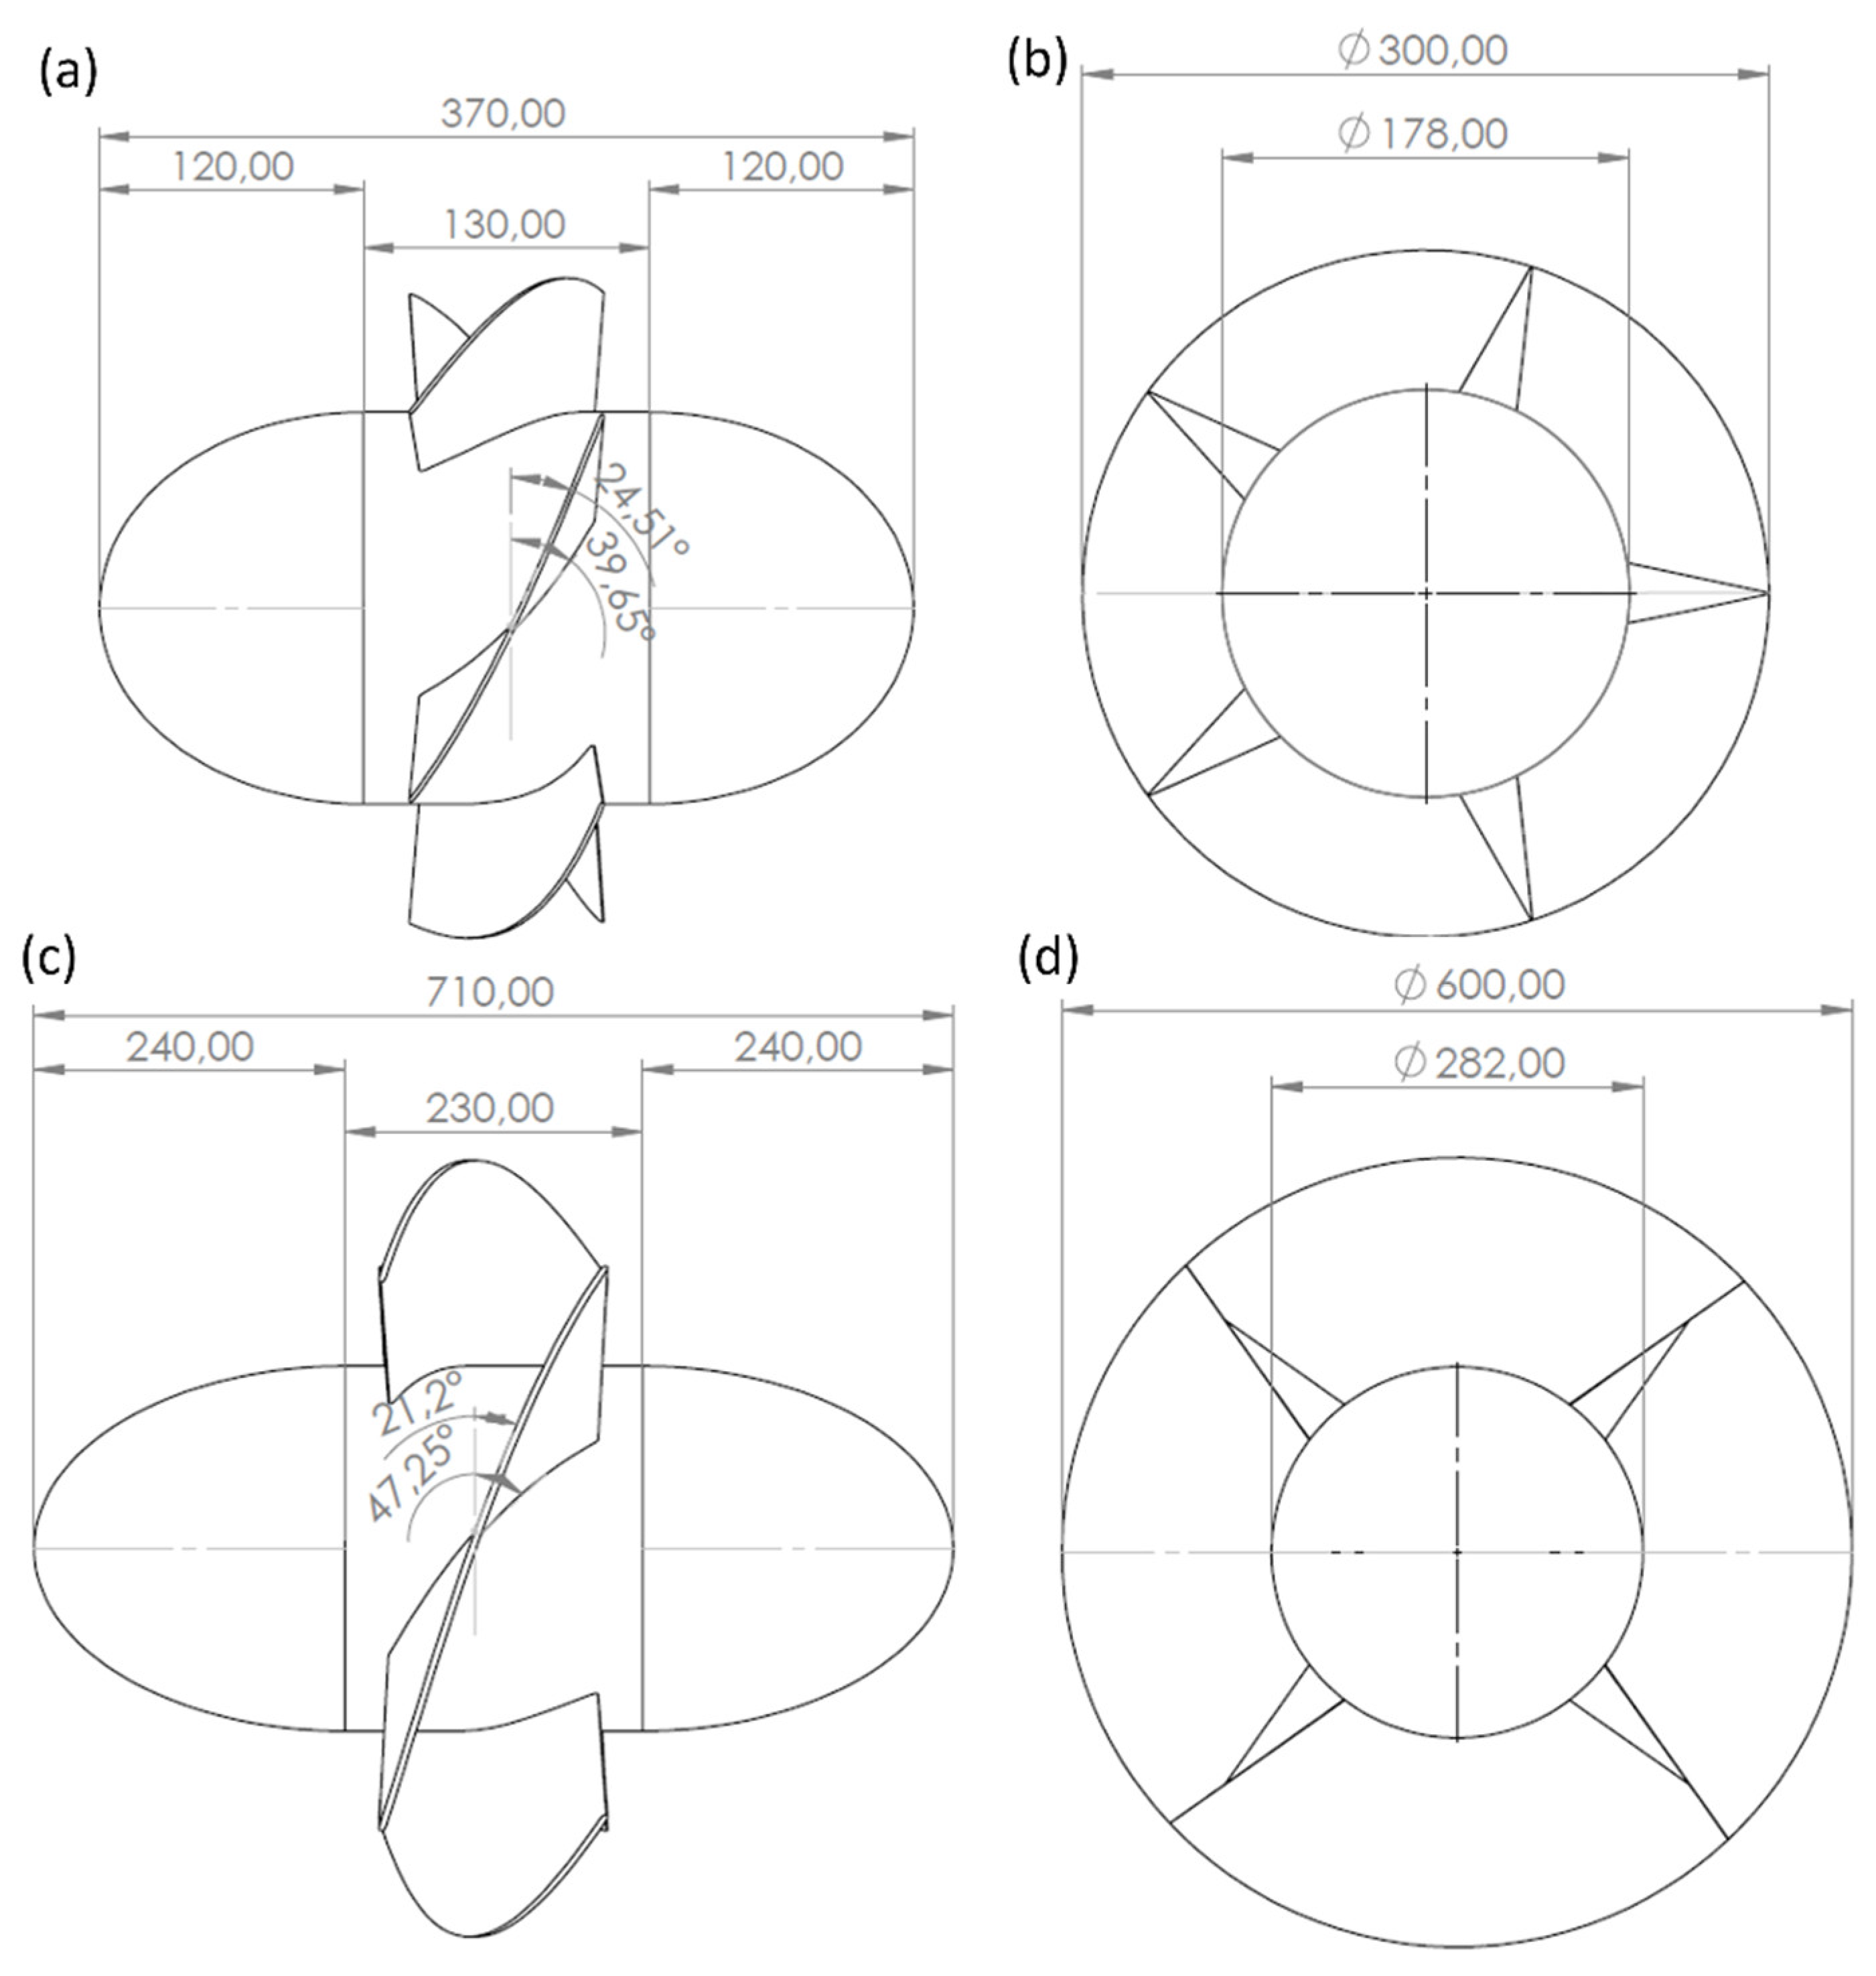
Figure 17.
Turbines designed with guide vanes. A)-T1 Lateral View. B) – T1 Front View. C) -T7 Lateral View. D) - T7 Front View.
Figure 17.
Turbines designed with guide vanes. A)-T1 Lateral View. B) – T1 Front View. C) -T7 Lateral View. D) - T7 Front View.
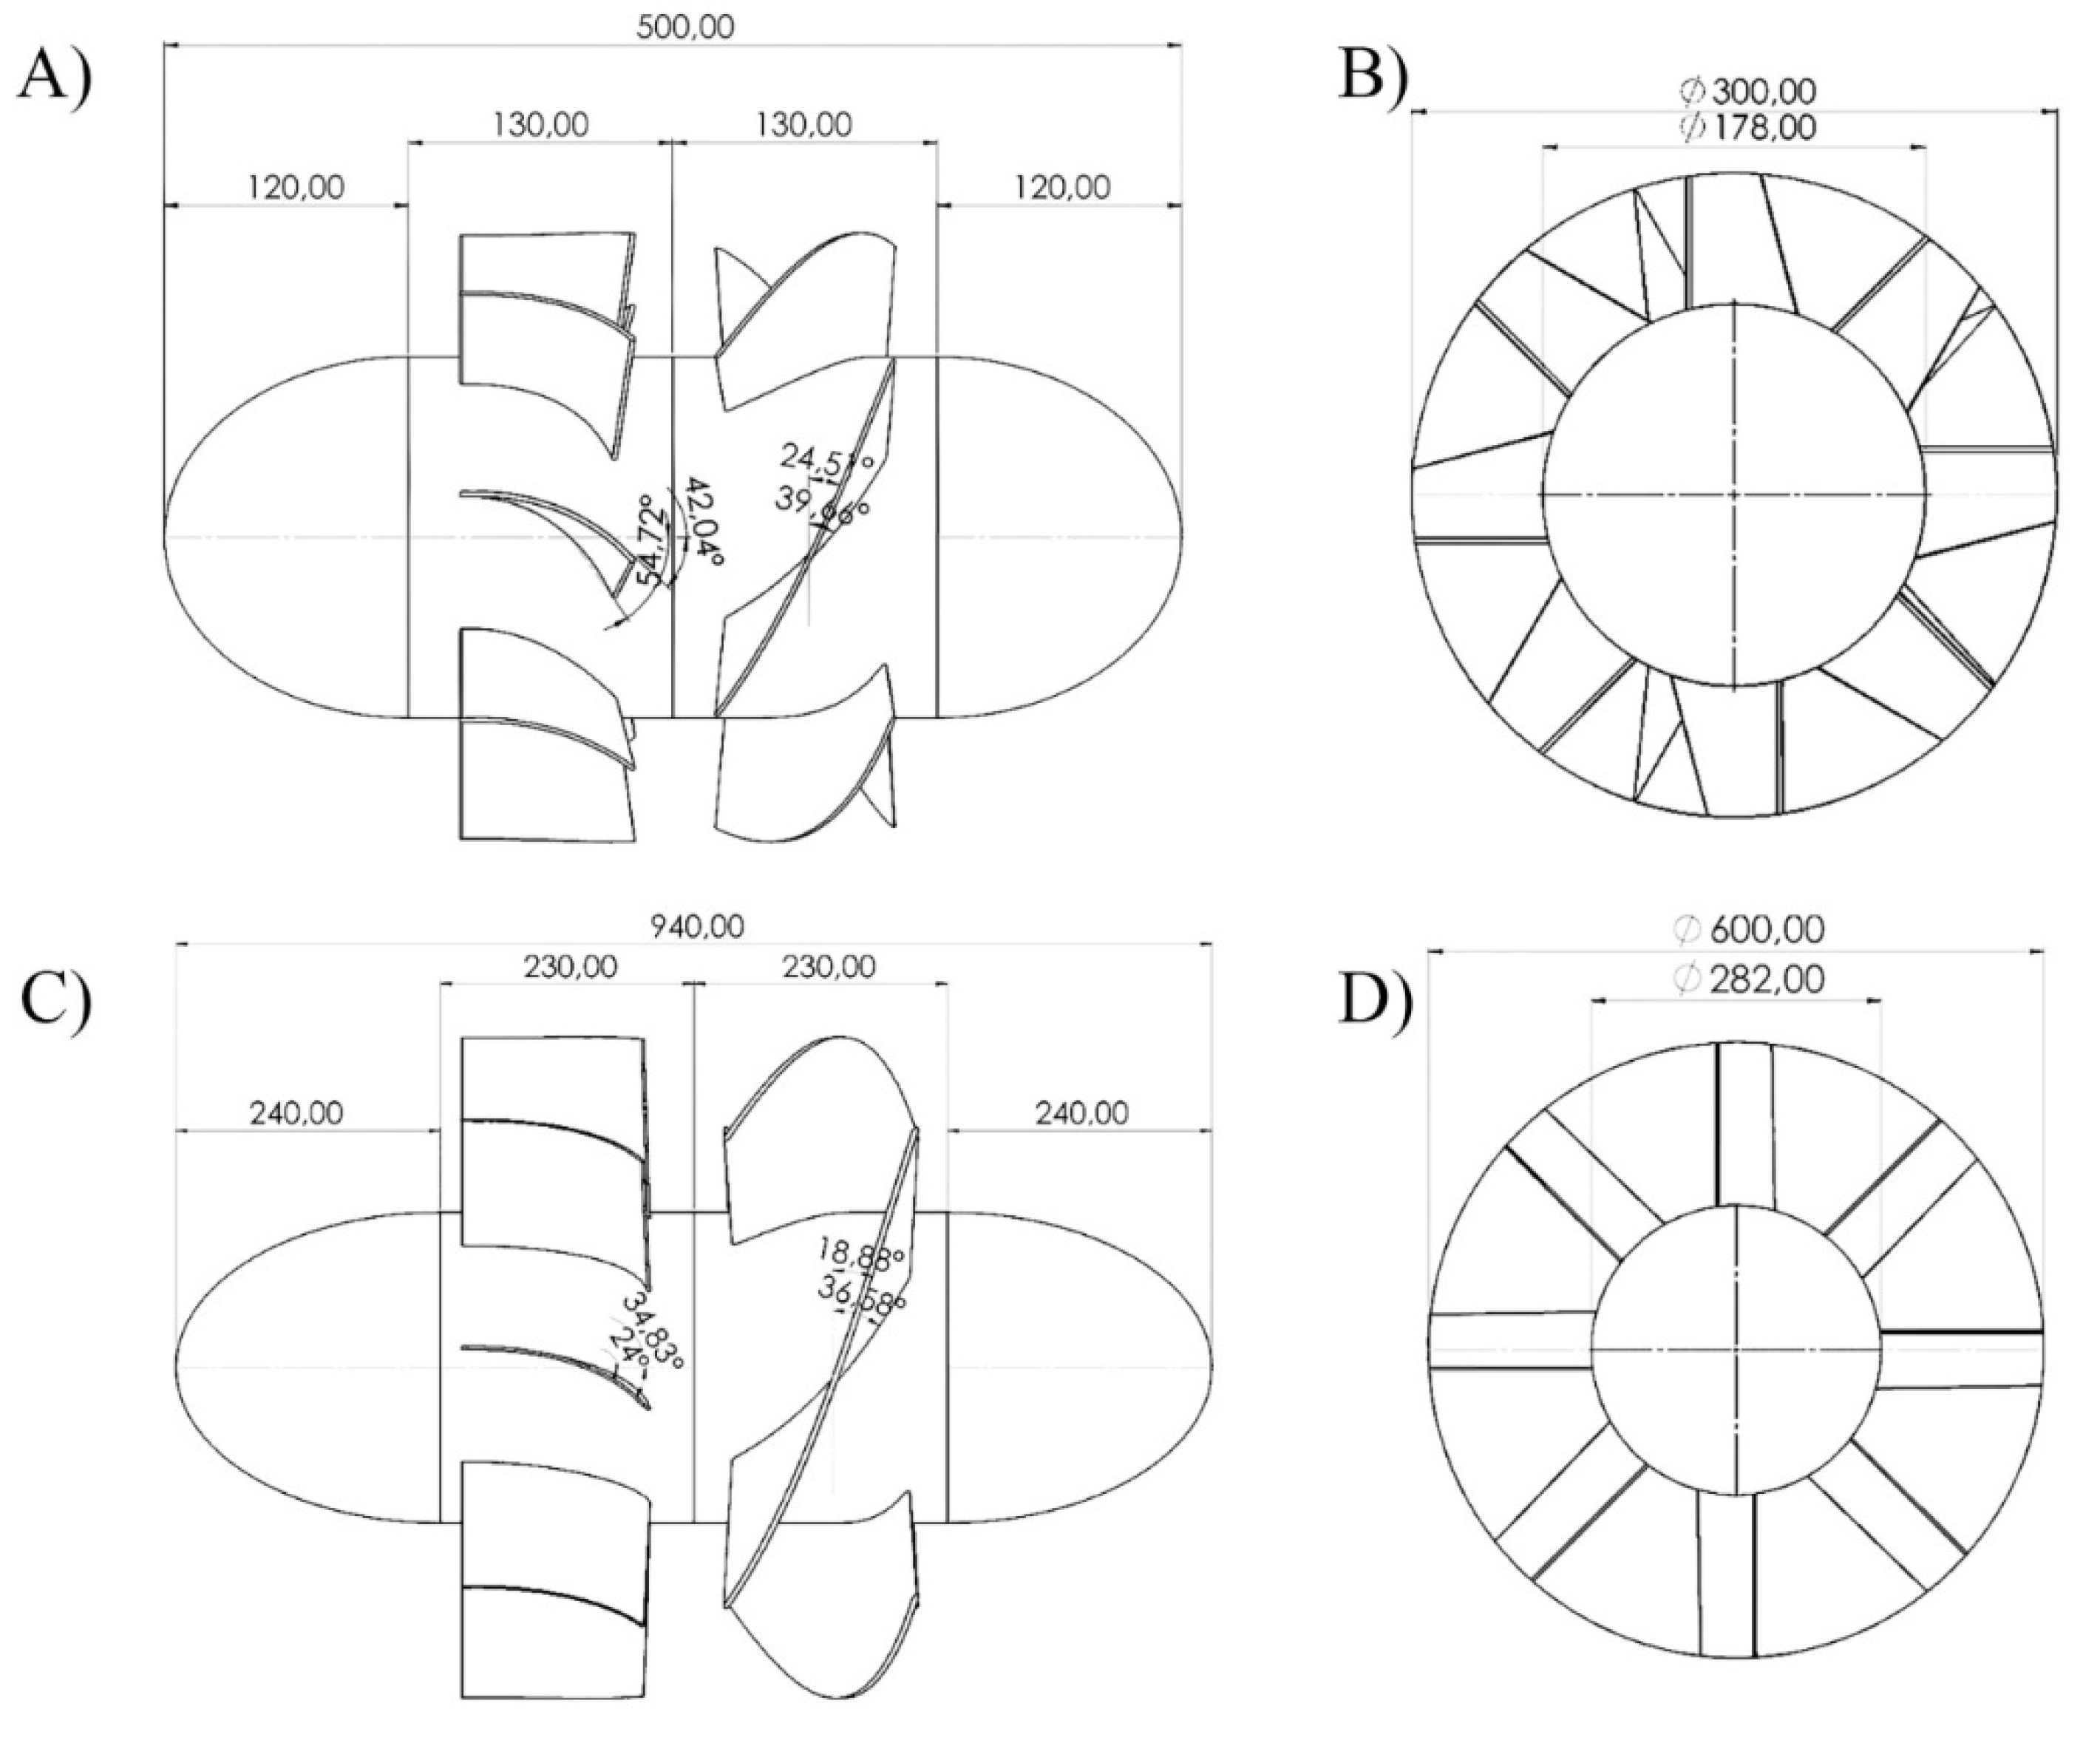
Figure 18.
Turbines designed without guide vanes at design flow rate. a)-T1 Flow visualization at the hub section. b) – T7 Flow visualization at the hub section.
Figure 18.
Turbines designed without guide vanes at design flow rate. a)-T1 Flow visualization at the hub section. b) – T7 Flow visualization at the hub section.
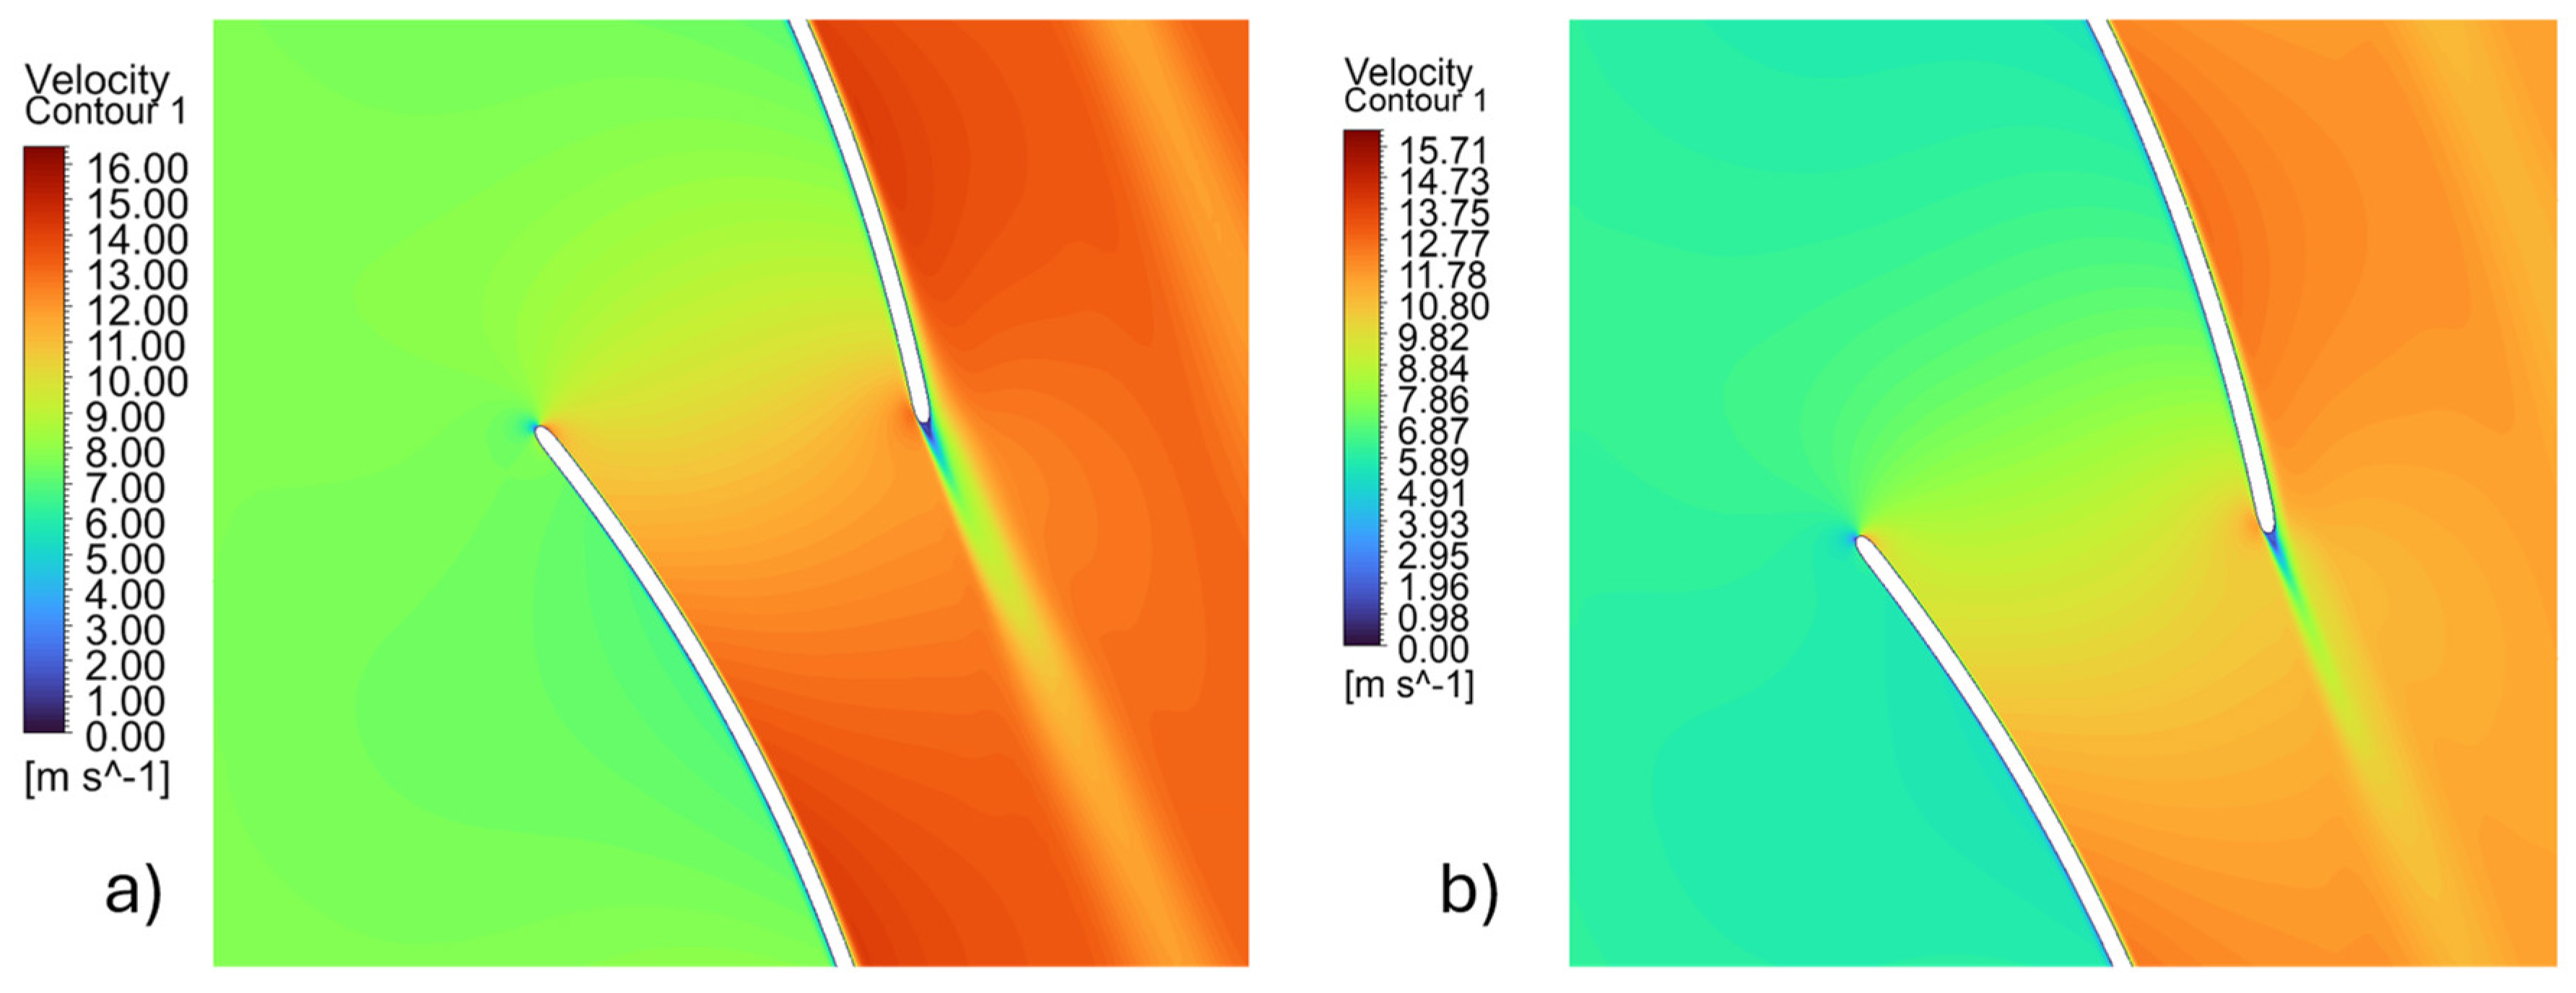
Figure 19.
Turbines designed with guide vanes at design flow rate. a)-T1 Flow visualization at the hub section. b) – T7 Flow visualization at the hub section.
Figure 19.
Turbines designed with guide vanes at design flow rate. a)-T1 Flow visualization at the hub section. b) – T7 Flow visualization at the hub section.
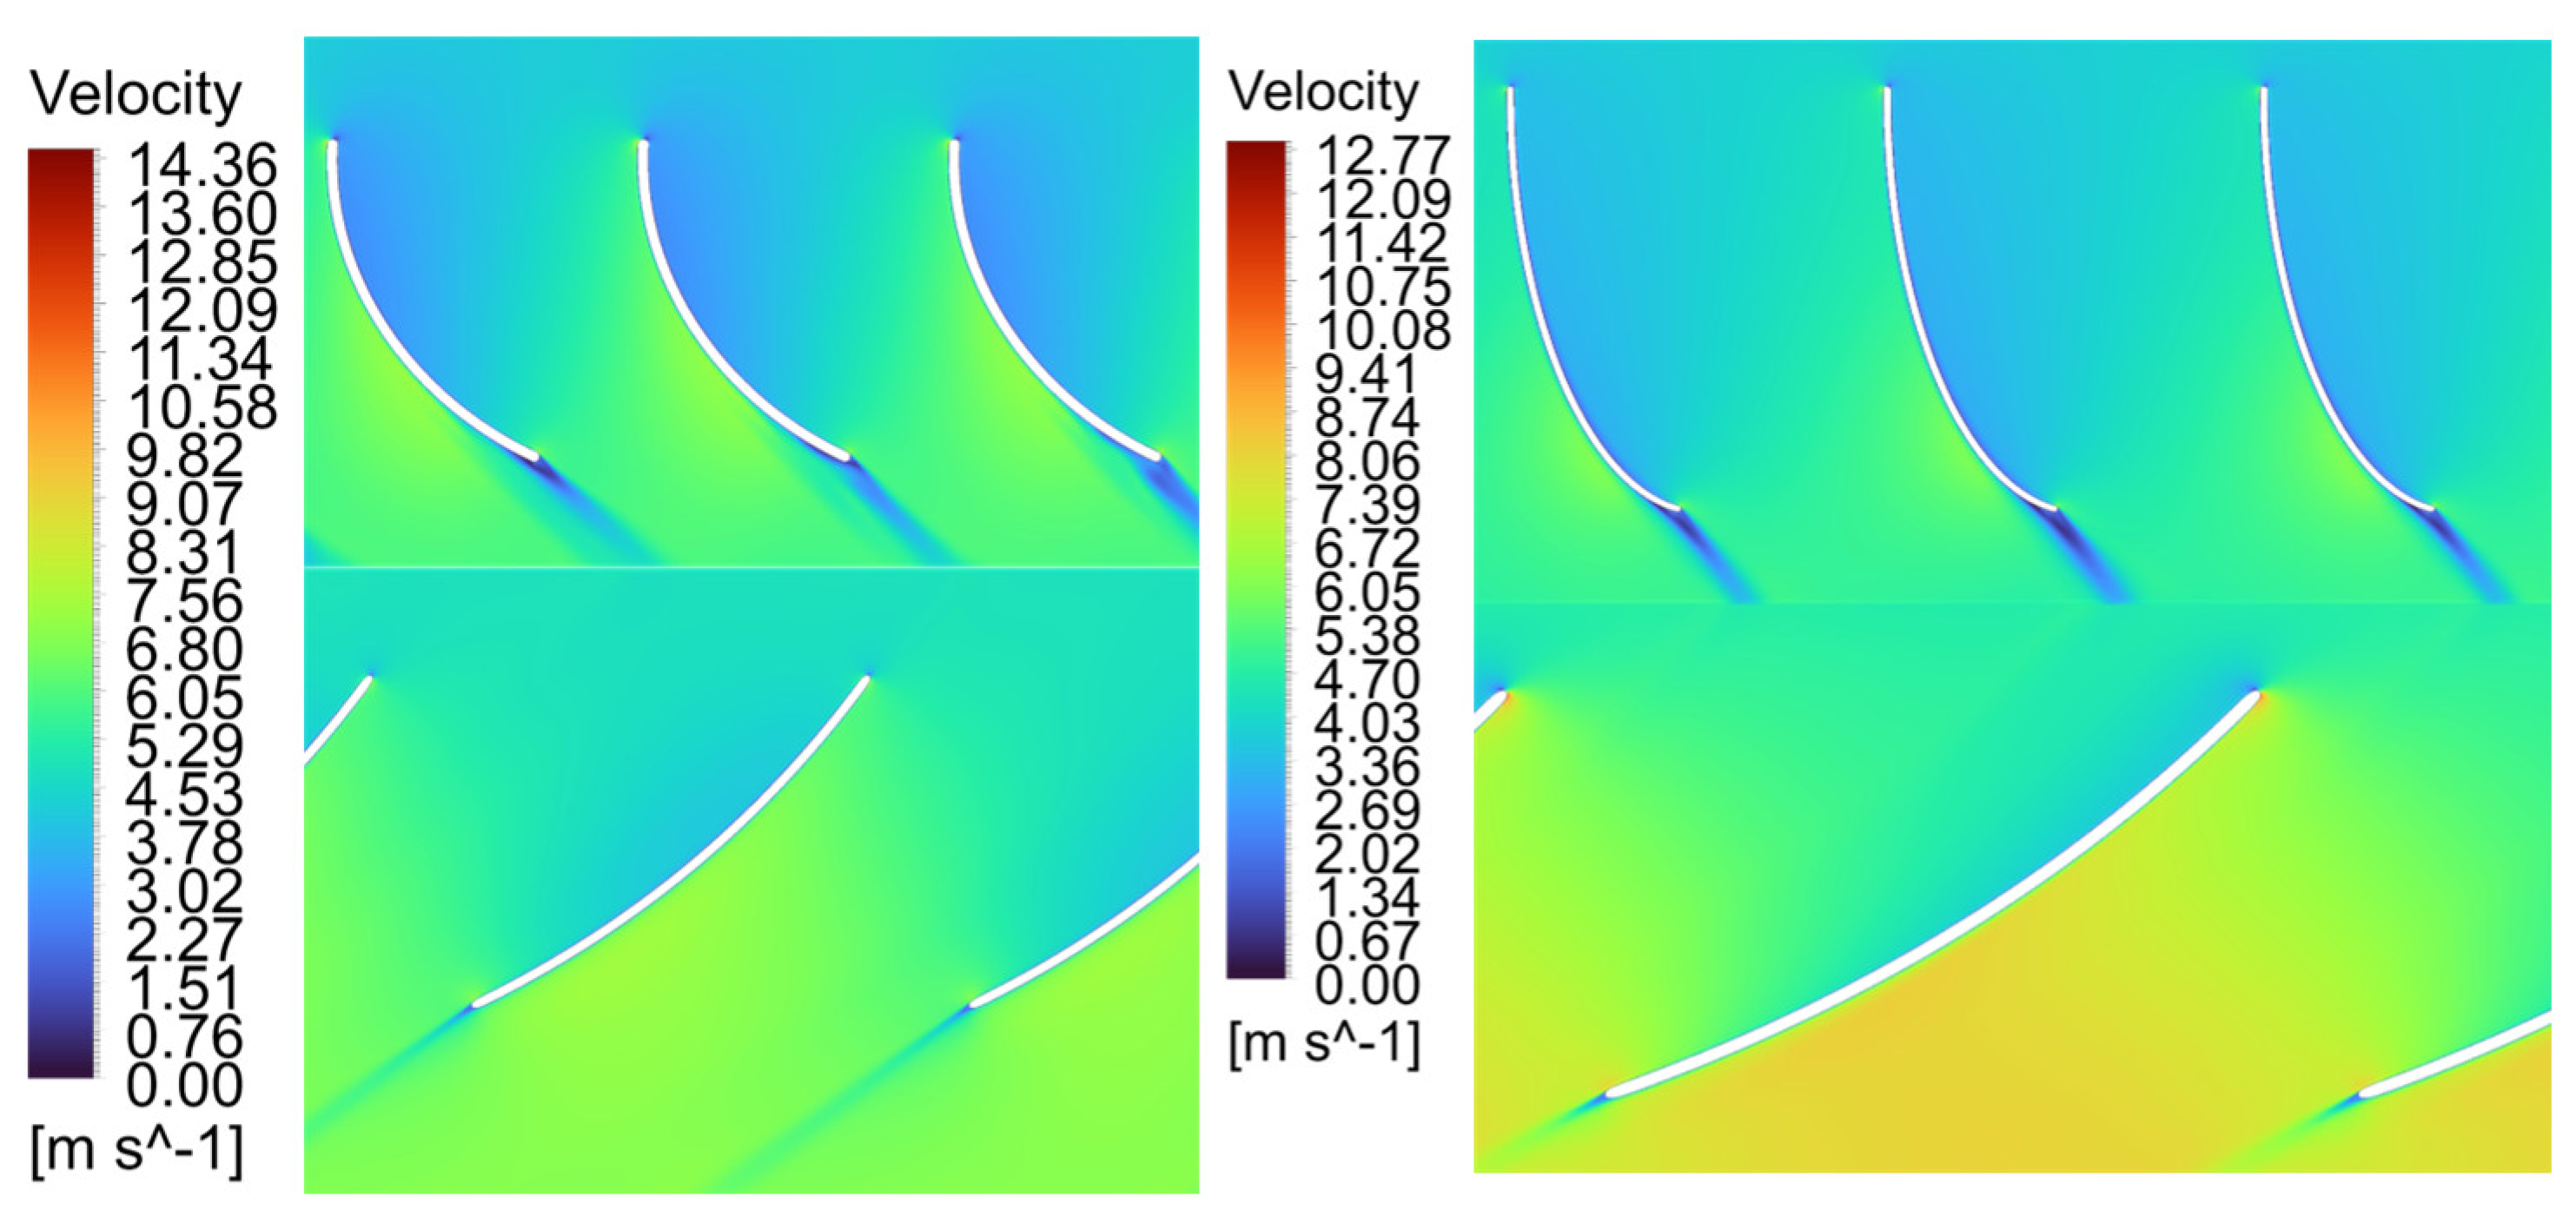
Figure 20.
Turbine Efficiency comparison with and without guide vanes for T1.
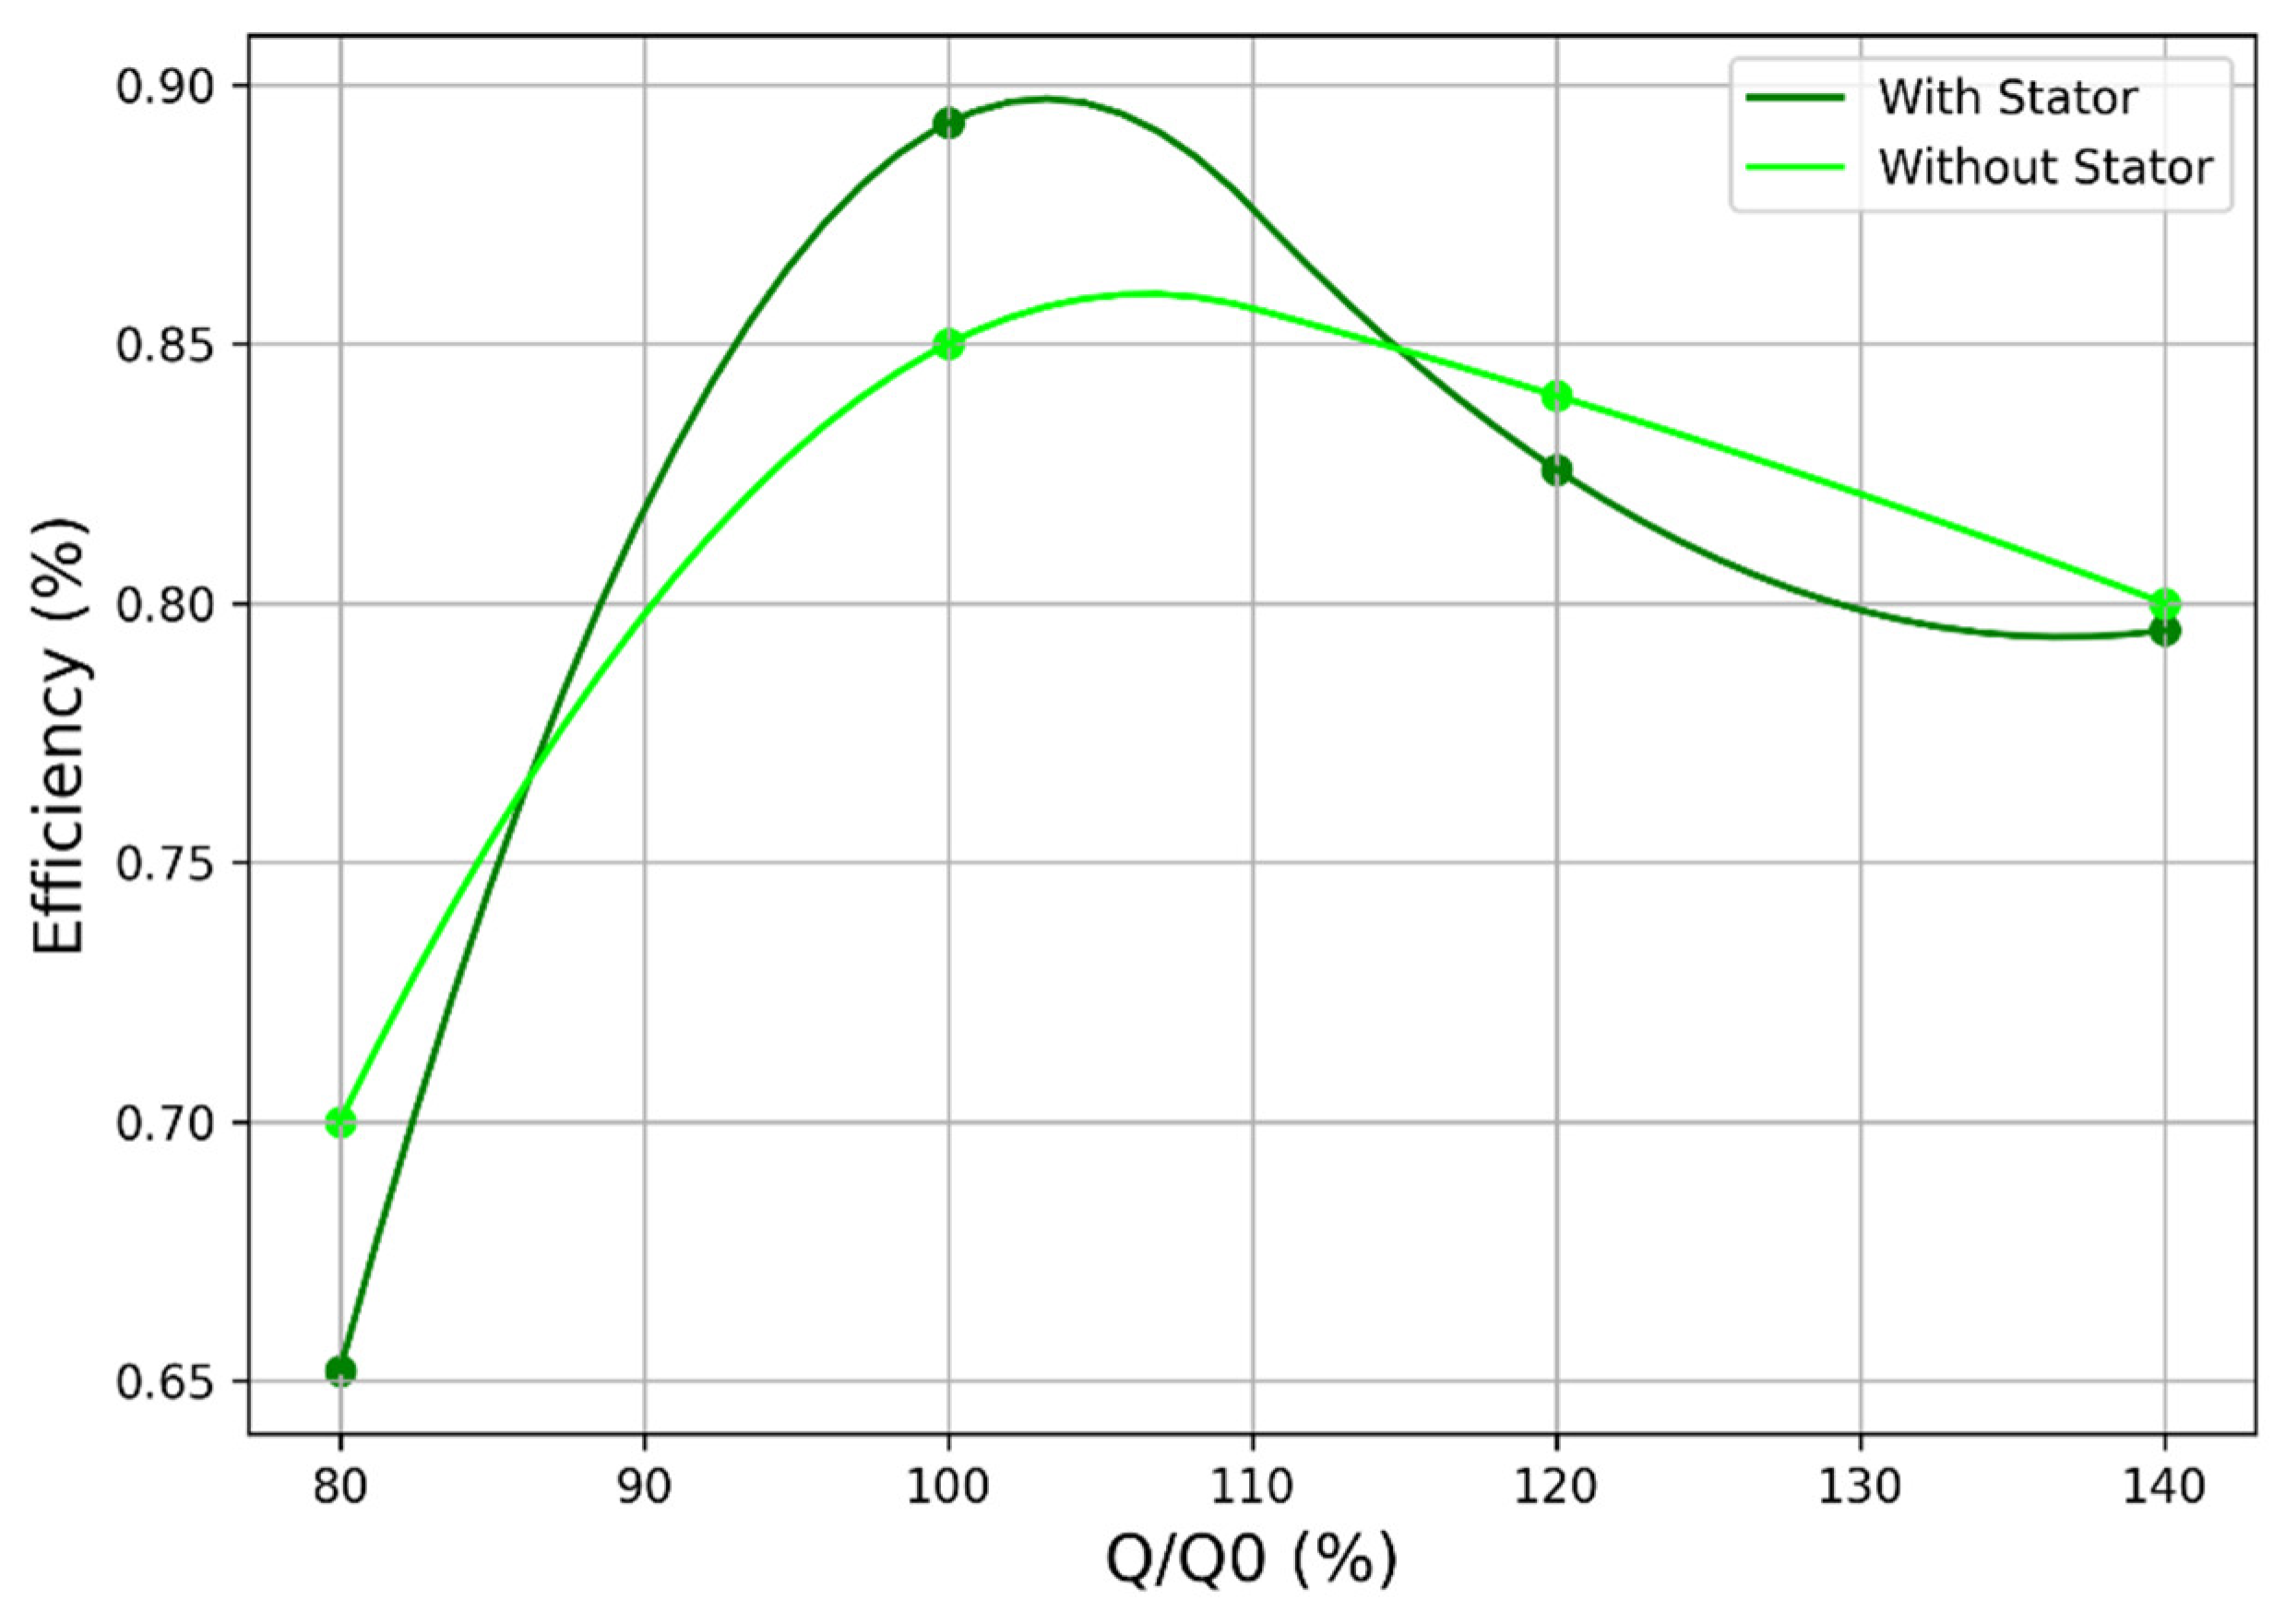
Figure 21.
Turbine Efficiency comparison with and without guide vanes for T7.
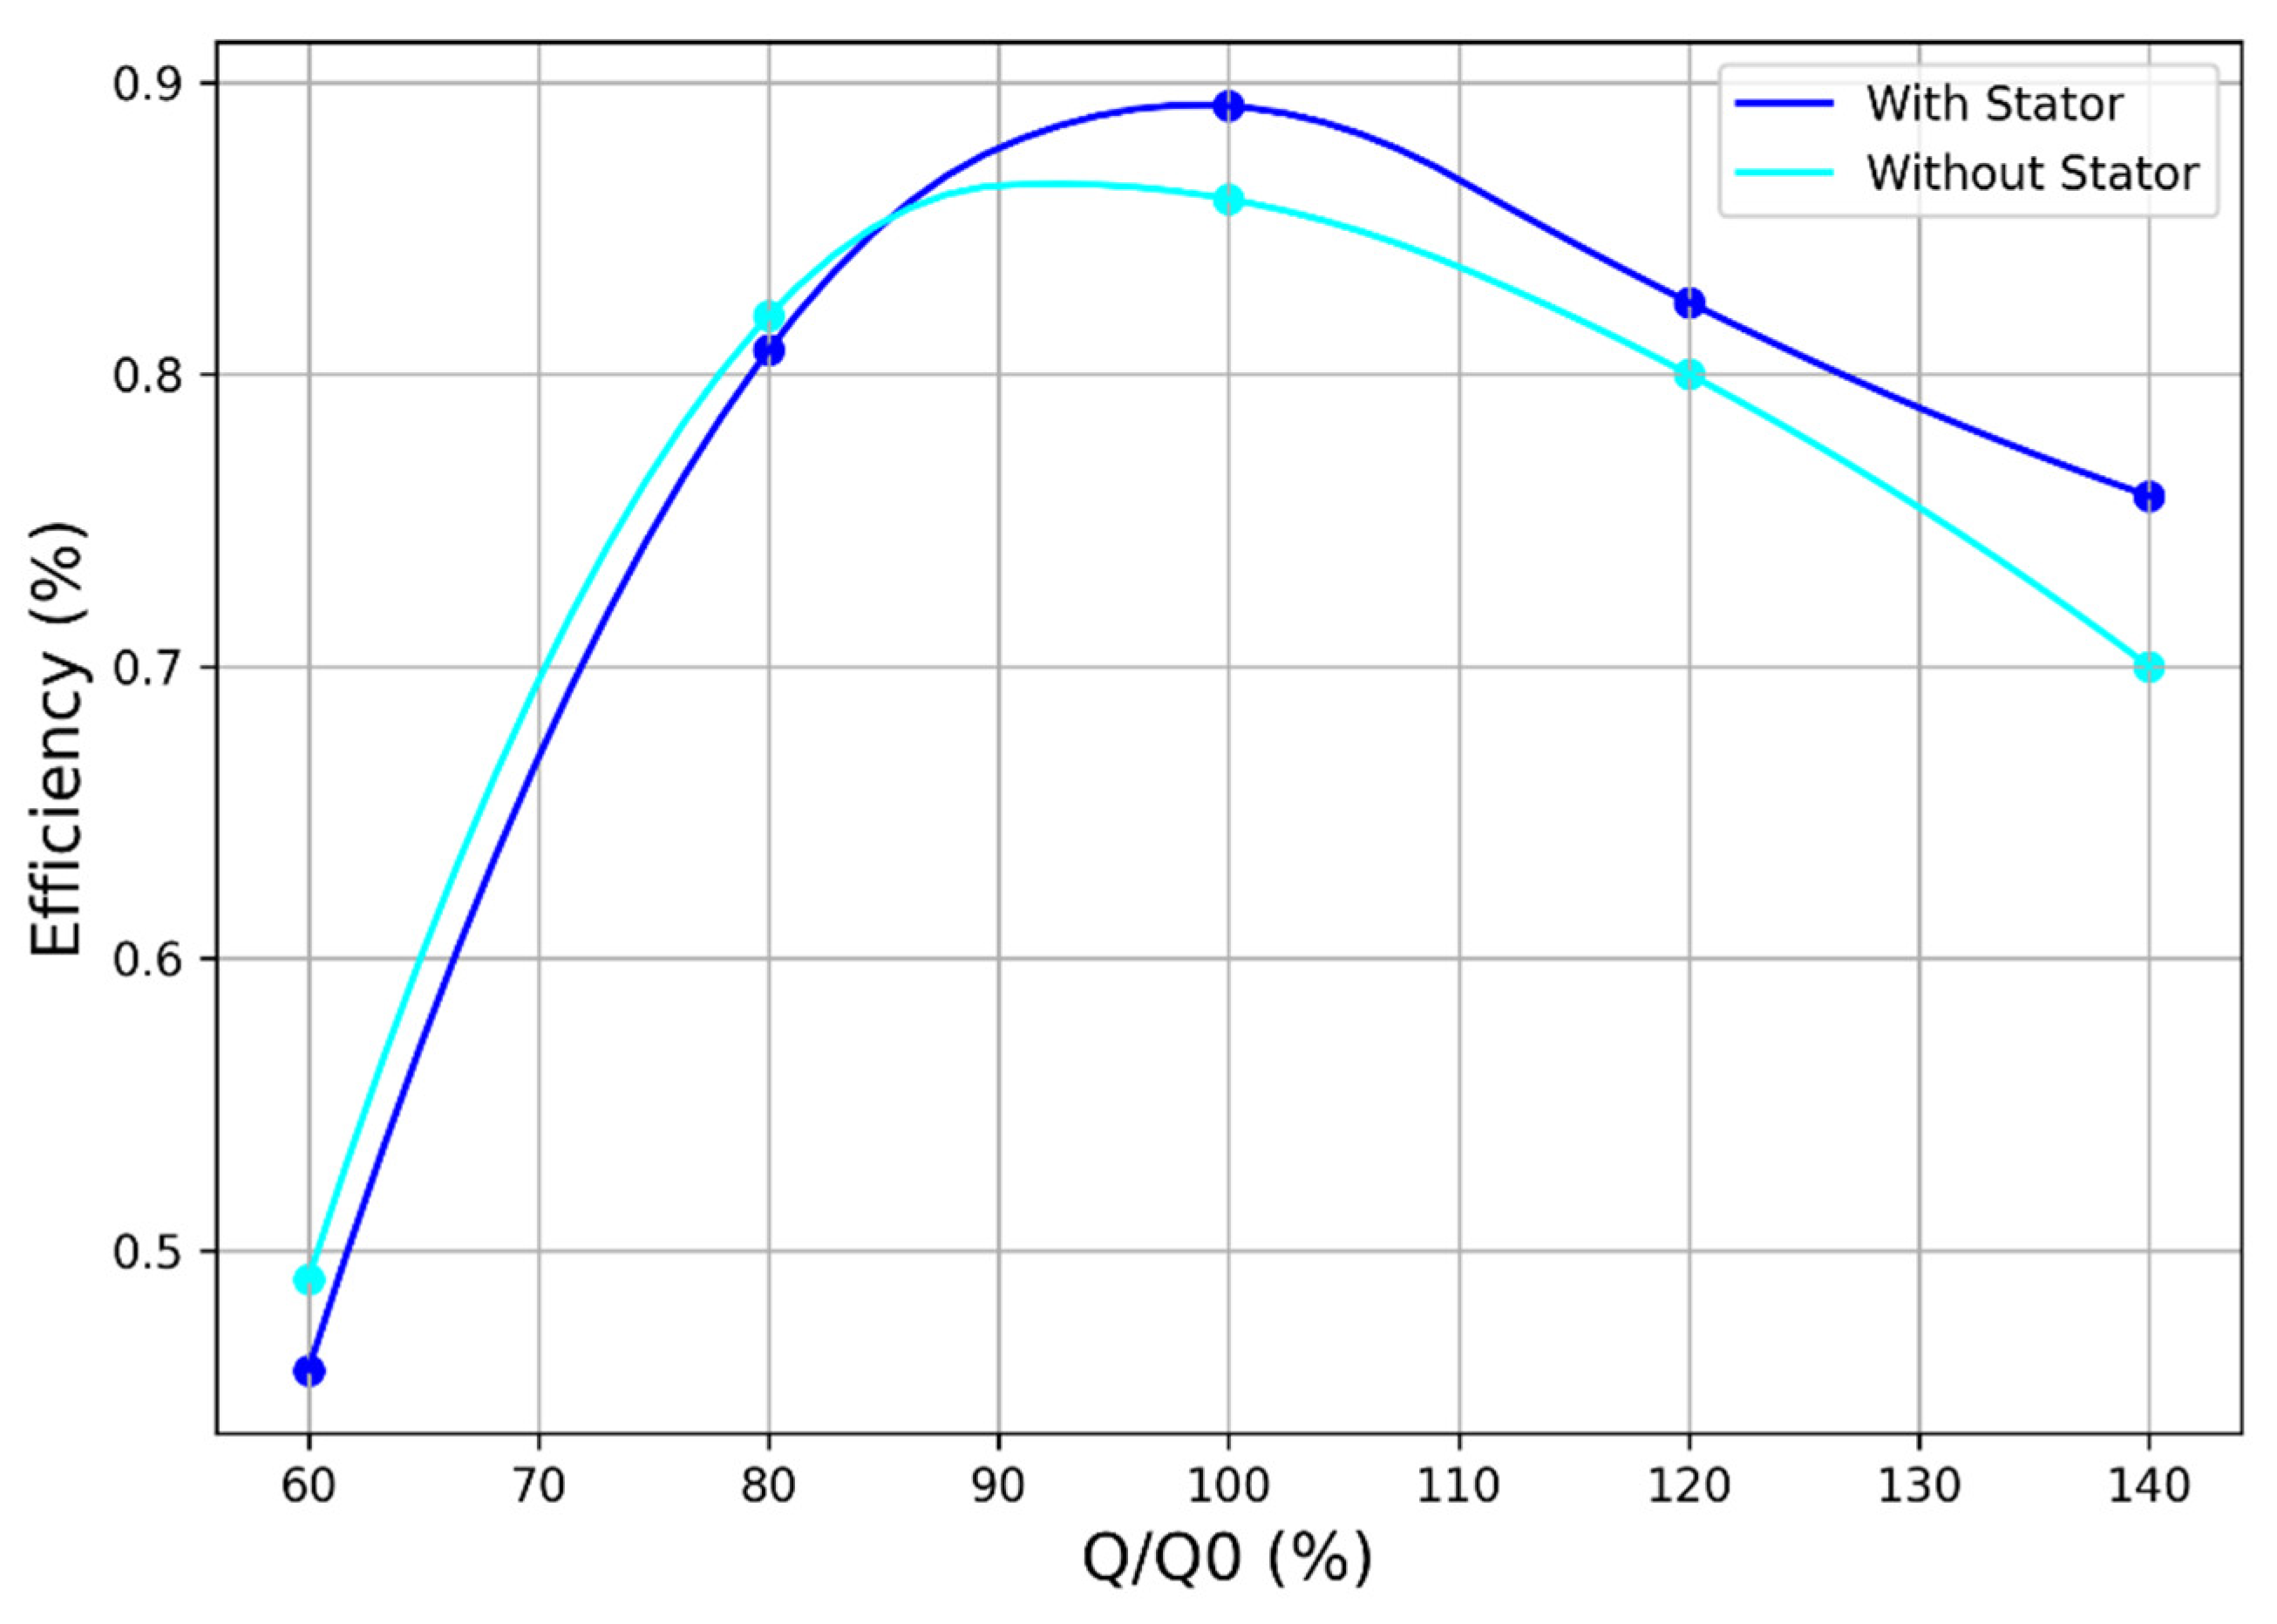
Figure 22.
Turbine relative velocity at the hub section of the blade at Q = 0.8Q0 for T1. Without IGV (a) and with IGV (b).
Figure 22.
Turbine relative velocity at the hub section of the blade at Q = 0.8Q0 for T1. Without IGV (a) and with IGV (b).
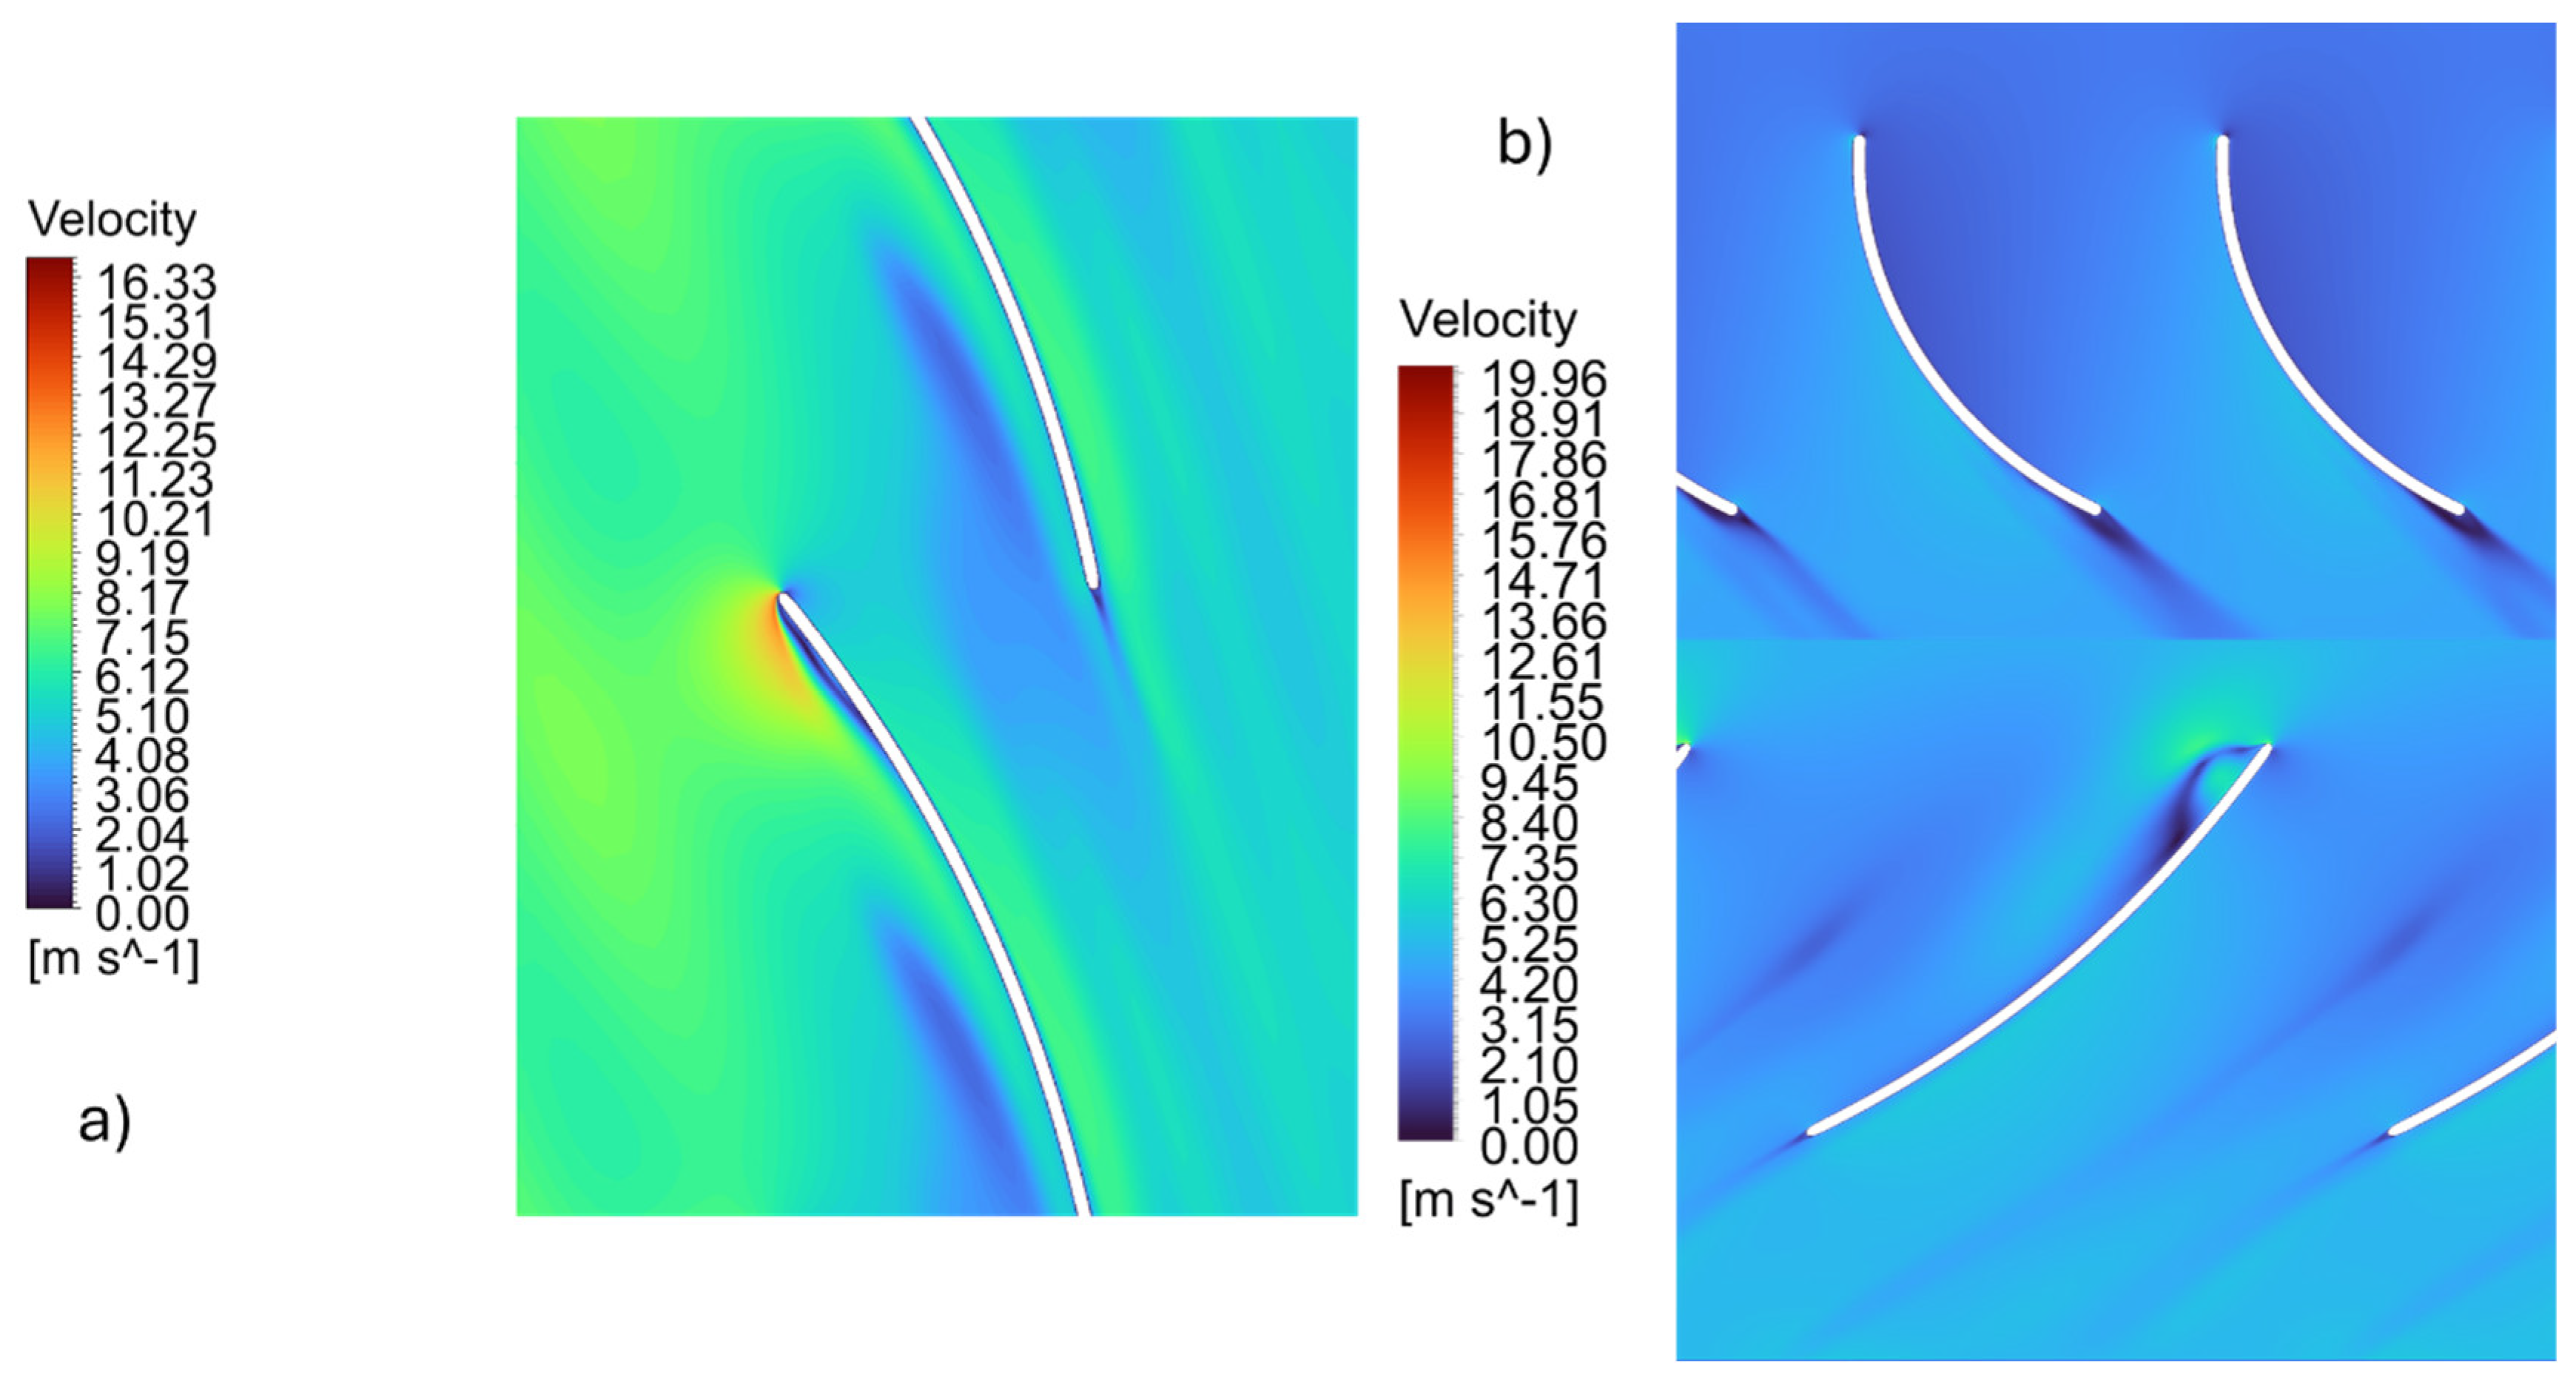
Figure 23.
Turbine relative velocity at the hub section of the blade at Q = 0.8Q0 for T7. Without IGV (a) and with IGV (b).
Figure 23.
Turbine relative velocity at the hub section of the blade at Q = 0.8Q0 for T7. Without IGV (a) and with IGV (b).
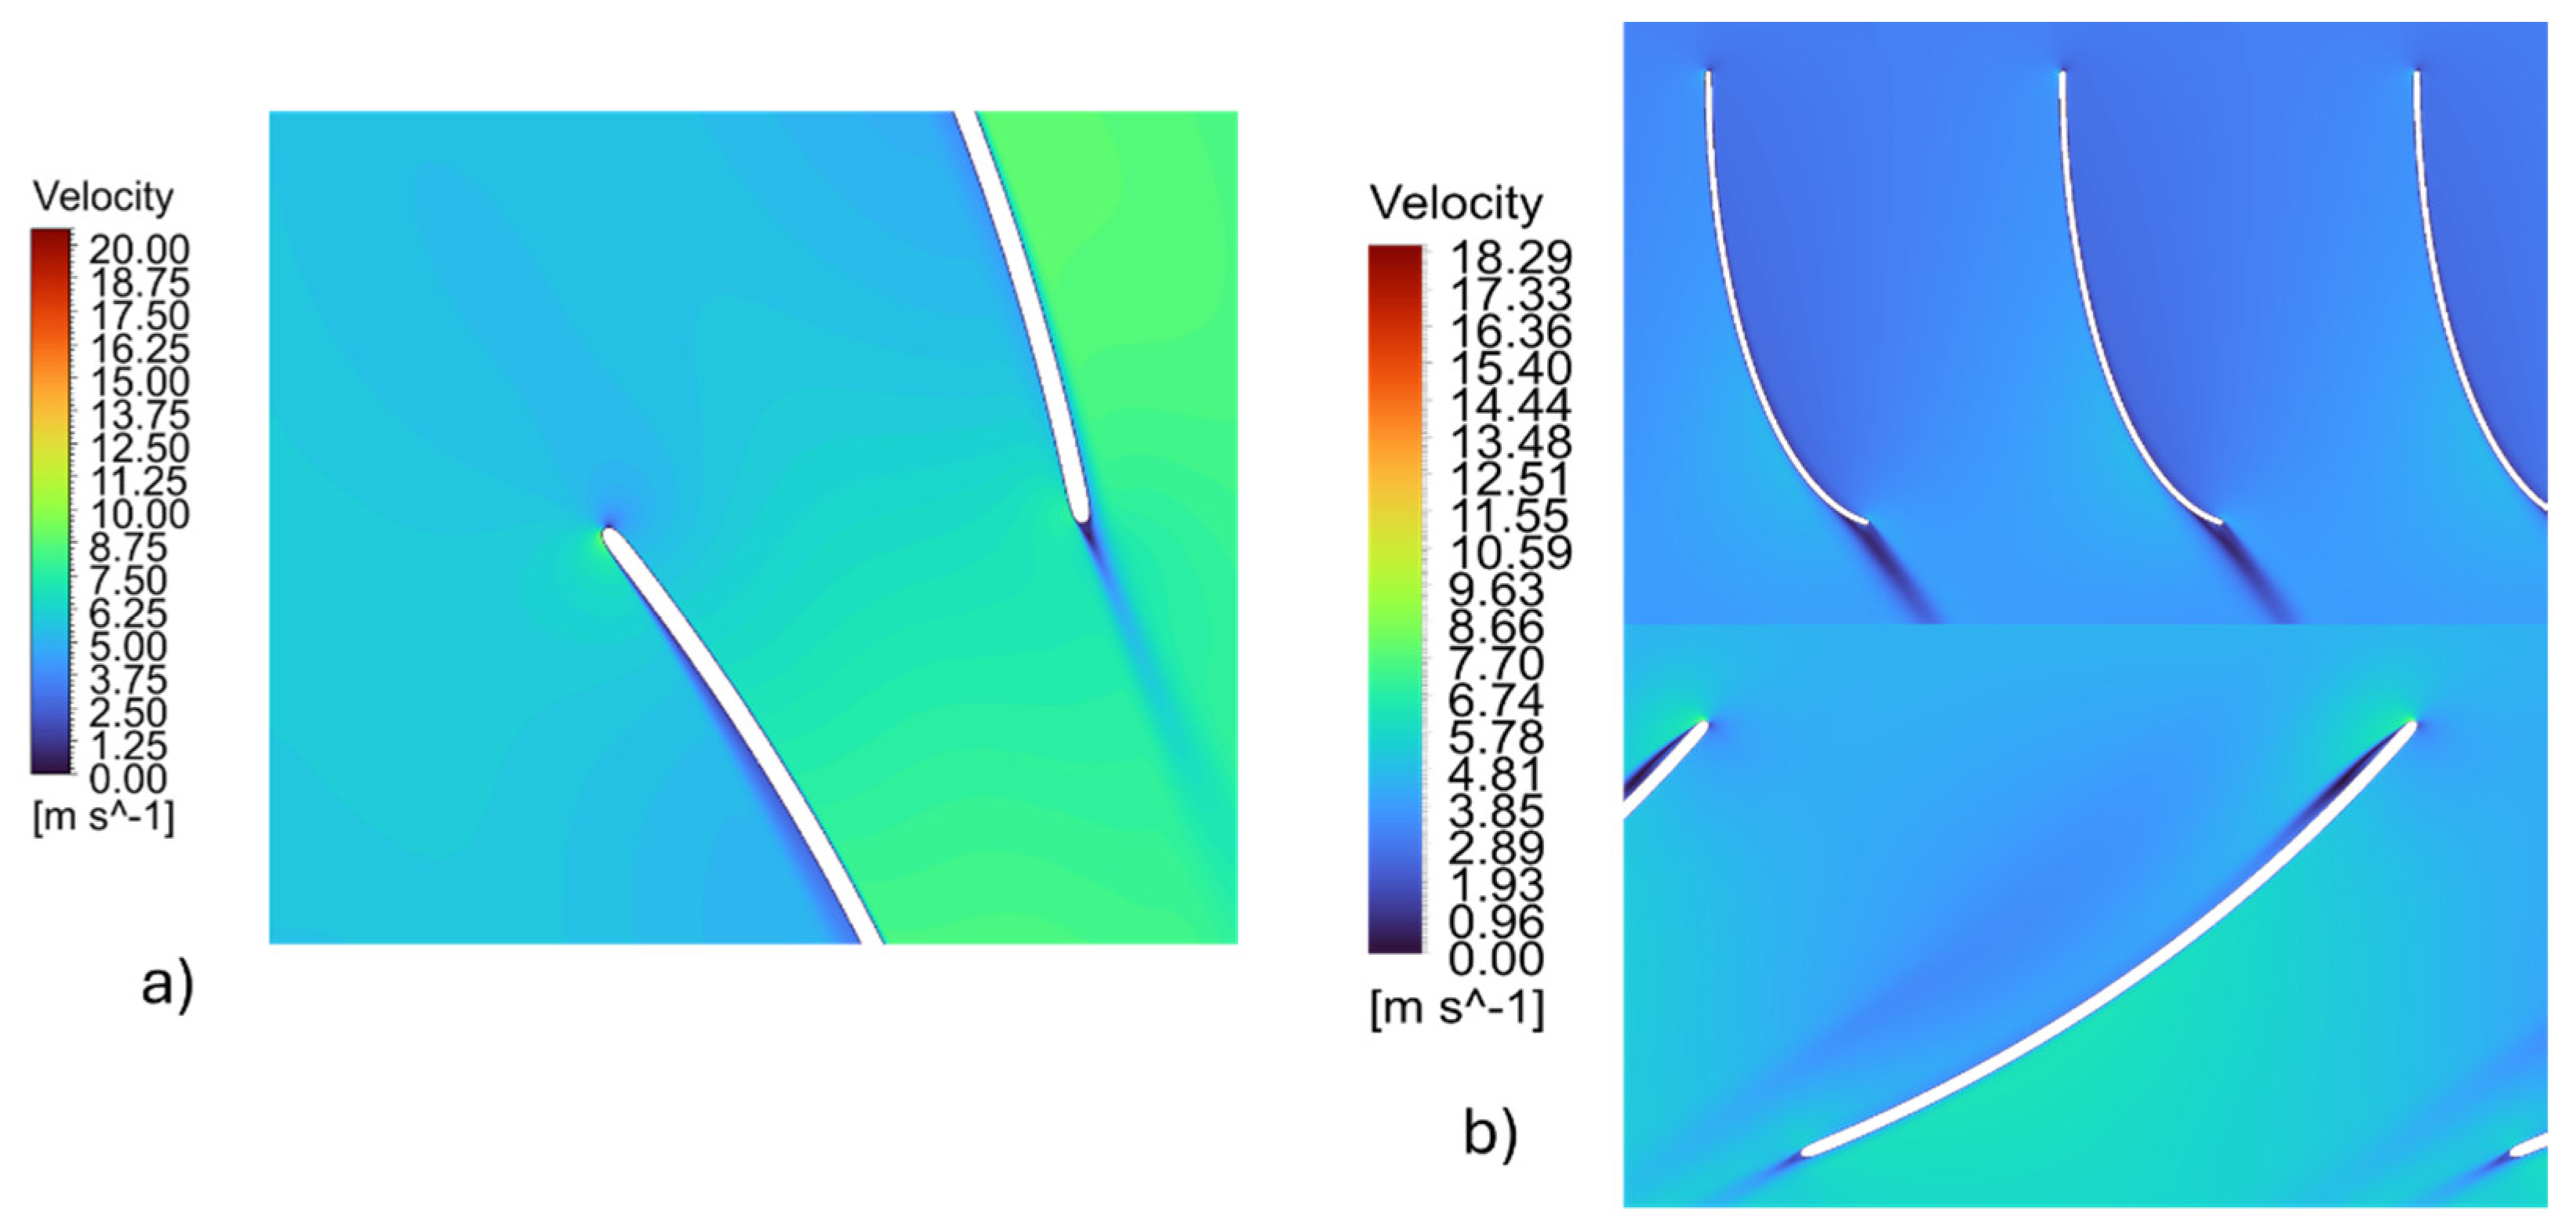
Figure 24.
3D model views of the bridge-dam structure: (a) upstream view highlighting the wing walls; (b) downstream view highlighting the wing walls; (c) general upstream perspective; (d) general downstream perspective.
Figure 24.
3D model views of the bridge-dam structure: (a) upstream view highlighting the wing walls; (b) downstream view highlighting the wing walls; (c) general upstream perspective; (d) general downstream perspective.
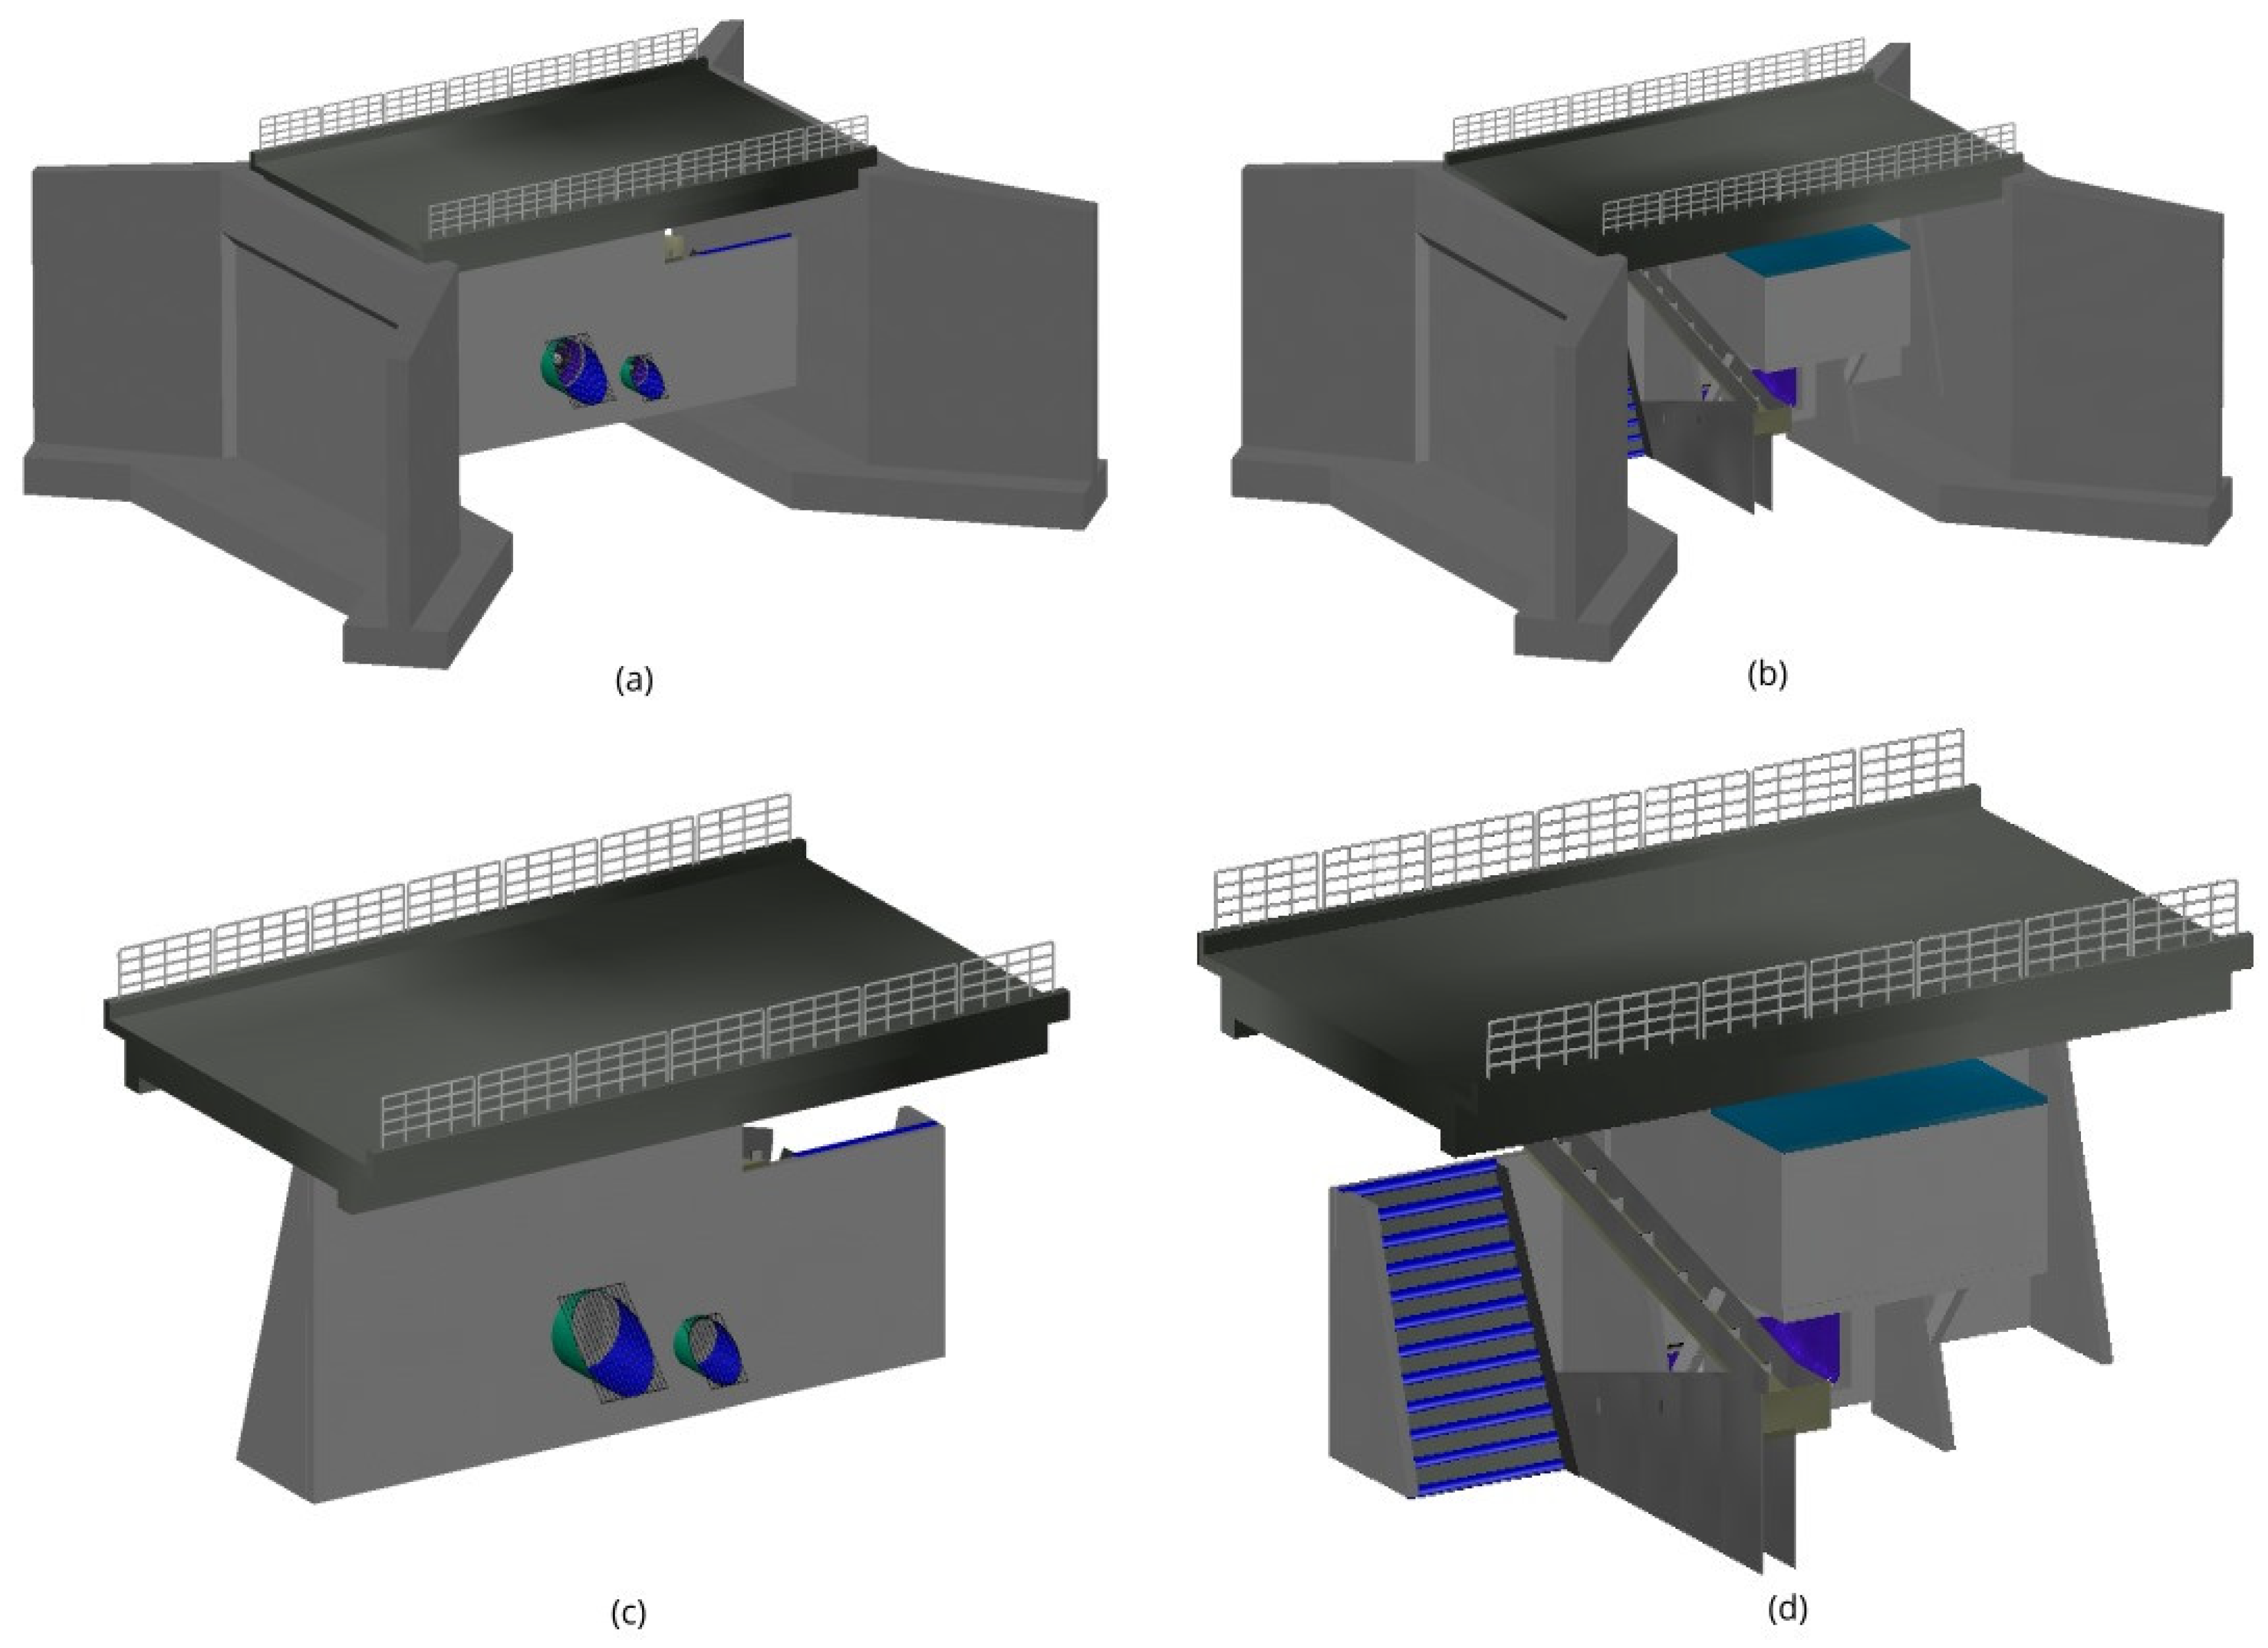

Table 1.
Comparison between reference and improved turbine.
| Value | Reference | Improved |
| Q | 0.0044 m³/s | 0.0044 m³/s |
| H | 0.34 m | 0.34 m |
| D | 0.085 m | 0.066 m |
| N | 750 RPM | 1311 RPM |
Table 2.
Pressure coefficient and cascade configuration for each proposed geometry.
| Machine | Cpmin | Solidity | Camber | Efficiency |
| a | -0.7881 | 1.33 | 7% | 85% |
| b | -0.9292 | 1.0 | 7% | 86% |
| c | -2.65 | 0.66 | 7% | 80% |
Table 3.
Flow rate, head, power, and energy generation for each turbine proposition.
| Specifications | Turbine 1 | Turbine 7 |
| Flow Rate | 0.23 m³/s | 0.81 m³/s |
| Head | 2.37 m | 1.47 m |
| Diameter | 0.3 m | 0.562 m |
| Rotational Speed | 724 RPM | 345 RPM |
| Blade Number | 5 | 4 |
Table 4.
Cpmin and cascade configuration at the hub section of the blade.
| Machine | Cpmin | Solidity | Camber | Relative Velocity (m/s) (IGV) |
Relative Velocity (m/s) (no IGV) |
| Turbine 1 | -0.9 | 1.1 | 7% at 50% of the blade | 7.94 | 9.95 |
| Turbine 7 | -1.1 | 1.1 | 7% at 50% of the blade | 6.29 | 7.78 |
Disclaimer/Publisher’s Note: The statements, opinions and data contained in all publications are solely those of the individual author(s) and contributor(s) and not of MDPI and/or the editor(s). MDPI and/or the editor(s) disclaim responsibility for any injury to people or property resulting from any ideas, methods, instructions or products referred to in the content. |
© 2025 by the authors. Licensee MDPI, Basel, Switzerland. This article is an open access article distributed under the terms and conditions of the Creative Commons Attribution (CC BY) license (http://creativecommons.org/licenses/by/4.0/).
Copyright: This open access article is published under a Creative Commons CC BY 4.0 license, which permit the free download, distribution, and reuse, provided that the author and preprint are cited in any reuse.


