
Submitted:
17 April 2025
Posted:
18 April 2025
You are already at the latest version
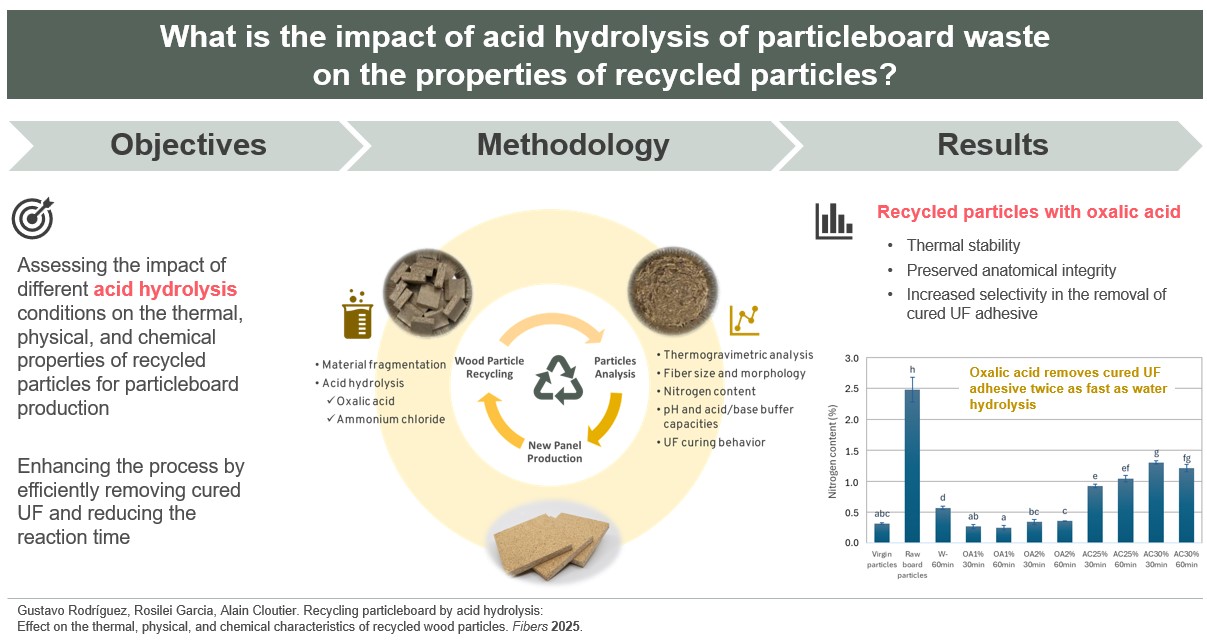
Abstract
Acid hydrolysis can be more efficient than water hydrolysis, particularly in breaking down cured adhesives found in waste panels within a shorter reaction time that could benefit large-scale industrial processes. This study evaluates the effects of various acid hydrolysis conditions on the thermal, physical, and chemical properties of recycled particles intended for particleboard production. Particleboards were recycled using oxalic acid and ammonium chloride at different concentrations and reaction times at 122 °C. The thermal stability of the particles was determined by thermogravimetric analysis. Particle size distribution, particle morphology, nitrogen content, pH and acid/base buffer capacity were analyzed. The effect of the recycled particles on the urea-formaldehyde (UF) curing was assessed using differential scanning calorimetry and the gel time method. The recycled particles exhibited a higher thermal degradation beyond 200 °C, indicating their thermal stability for manufacturing new panels. The acid treatments did not damage the anatomical structure of the particles. The nitrogen content of recycled particles decreased by up to 90% when oxalic acid was used, compared to raw board particles. Recycled particles had a lower pH, a lower acid buffer capacity, and a higher base buffer capacity than those of raw board particles. The recycled particles did not significantly affect the peak polymerization temperature of the UF adhesive. However, some treatments affected the gel time of the adhesive. The results indicate that particleboards can be effectively recycled through acid hydrolysis, mainly with oxalic acid, which gives better results than hydrolysis using water alone. Oxalic acid showed increased selectivity in eliminating the cured UF adhesive, resulting in recycled particles suitable for manufacturing new panels.
Keywords:
Wood-based panels
; post-consumer wood
; circular economy
; wood waste
; differential scanning calorimetry
; gel time
; particle morphology
; particle size
; thermogravimetric analysis
; urea-formaldehyde removal
1. Introduction
Particleboard production reached record levels in 2021-2022, with global production averaging more than 110 million m3 per year, an increase of more than 13 million m3 over the previous year. Asia led particleboard production with an average of 49.5 million m3 (44.8%) in 2021-2022, followed by Europe with 46.7 million m3 (42.3%), while the Americas accounted for 11.8 million m3 (10.7%) [1]. The global particleboard market is experiencing rapid expansion, driven by increasing demand from the construction and furniture industries. As an environmentally responsible product, particleboard uses wood residues, low-value wood, lignocellulosic materials derived from agricultural residues, and an increasing amount of wood waste from construction, renovation, and demolition [2]. Particleboard plays a significant role in carbon storage, with a lifespan of 25 to 30 years, which far outweighs the carbon emissions generated during its manufacturing [3]. At the end of its life cycle, particleboard is often disposed of through energy recovery (incineration) or sent to a landfill. This is due to the presence of chemical contaminants, such as adhesives based on formaldehyde and coatings based on melamine, which necessitate pre-treatment to enable effective recycling [4]. Most particleboards are bonded with adhesives containing nitrogen such as urea-formaldehyde (UF). The incineration and disposal of these materials in landfills create environmental and health issues. The combustion of particleboard releases toxic substances, including nitrogen oxide (NOx) at levels four times higher than those from wood, along with formaldehyde, ammonia, isocyanates, and other hazardous emissions resulting from formaldehyde-based adhesives [5]. When landfilled, particleboard can release formaldehyde and other volatile organic compounds into the environment, contributing to air pollution. This practice generates greenhouse gases, such as methane and leachate, that can contaminate soil and groundwater and adversely affect ecosystems [6]. Life Cycle Assessment (LCA) studies have demonstrated that recycling particleboard waste to manufacture new panels is the most sustainable option for minimizing its environmental impact in most LCA categories [4,7], thereby reducing demand for virgin wood and promoting a circular economy.
The volume of particleboard waste is substantial and is projected to rise in the coming years. This increase is due to high production rates, which lead to waste from non-compliant products during manufacturing, as well as waste generated when the panels reach the end of their lifespan. Europe and Asia are the two main contributors to global post-consumer wood recycling, accounting for 29.7 million m³ (77.7%) and 8.5 million m³ (22.2%), respectively, while recycling in the Americas is negligible [1]. Currently, the use of post-consumer wood in panel manufacturing is almost exclusively limited to untreated, unpainted, clean wood waste. Efforts to incorporate particleboard waste into new particleboard manufacturing processes are limited. This is why it is necessary to find effective recycling solutions.
One of the challenges in particleboard recycling is optimizing hydrolysis conditions while balancing the quality of recovered particles with the effective removal of cured UF adhesive. The goal is to produce recycled material that provides the panel with good physical and mechanical properties, meeting standard requirements while eliminating UF residue to keep formaldehyde emissions of the new panels within acceptable levels. Previous research has indicated that thermal hydrolysis of particleboard waste under specific conditions can produce new particleboards with properties meeting established standards. Studies by Fu et al. showed that hydrolysis at 100 °C for 100 min, 120 °C for 60 min, and 140 °C for 20 min using a reactor successfully removed 51.7 – 65.0% of the cured UF adhesive from recycled particles. The particleboard made from this recycled material exhibited good physical and mechanical properties, with formaldehyde emissions comparable to those of virgin particles. [8]. However, hydrolysis at 140 °C for 20 min increased the gel time of the UF adhesive, which can impact hot pressing time and production costs [9]. Moreover, the hydrolysis process involves heating and cooling the reactor, which significantly prolongs the recycling time. Acid hydrolysis can offer advantages over water hydrolysis, particularly in terms of efficiency and reaction time. Acid hydrolysis could be more effective than other methods in breaking down adhesives present in panel waste, requiring a shorter reaction time or lower temperature, which could be advantageous for large-scale industrial processes. While managing the acids and effluents requires additional precautions, the overall cost may be lower due to the process's speed and efficiency. While some investigations have focused on the acid hydrolysis of particleboard and medium-density fiberboard wastes [10,11,12], uncertainty remains regarding the optimal conditions, including the type of acid, its concentration, and reaction time, to achieve high-quality recycled particles while also ensuring satisfactory removal of cured UF adhesive.
In this context, this study aims to evaluate the effects of various acid hydrolysis treatments on the thermal, physical, and chemical properties of recycled particles intended for particleboard production. The research includes (1) thermogravimetric analyses (TGA) to assess the thermal stability of recycled particles subjected to different types of acids and conditions to minimize thermal degradation and improve the quality of the recycled particles for future studies; (2) analysis of particle size distribution and microscopic characteristics of recycled particles; and (3) examination of the chemical characteristics of the recycled particles, including nitrogen content, pH levels, and acid/base buffer capacities, as well as their influence on UF adhesive curing behavior, evaluated through differential scanning calorimetry (DSC) and the gel time method.
2. Materials and Methods
2.1. Materials
Raw particleboards without any overlay, such as paper laminates, with a thickness of 15 mm, bonded with UF adhesive were used. They were cut into specimens measuring 50 mm × 50 mm to be subjected to various hydrolysis conditions. Virgin particles without UF adhesive, were obtained from Tafisa Canada, Lac-Mégantic, Quebec, Canada. Additionally, the raw particleboards were cut and ground for further characterization and comparison with the recycled particles. The ground material from raw particleboards was referred to as raw board particles. Both virgin and raw board particles were used as a reference for thermal and chemical analysis of the recycled particles. The oxalic acid and ammonium chloride used for the hydrolysis treatments were purchased from Sigma-Aldrich (St. Louis, MO, USA) and Fisher Chemical (Ottawa, ON, Canada) respectively.
2.2. Acid Hydrolysis Treatments
The raw particleboards were recycled in a Scientific Prevacuum Sterilizer, model SV-120 from STERIS® Amsco® Century™ (Mentor, OH, USA), operating at a chamber pressure of 124.1 ± 1 kPa and a temperature of 122 °C. A total of 90 ± 1 g of raw particleboard in 50 mm x 50 mm pieces was placed in a 3 L beaker containing 1.5 L of each acid solution. The panels were hydrolyzed for 30 and 60 min using oxalic acid and ammonium chloride acid solutions at two concentration levels. Each combination of acid, concentration level, and reaction time constituted a treatment, with three replicates. Additionally, a treatment using only water for 60 min was used for comparison. Table 1 presents all the combinations considered in the hydrolysis treatments. For all treatments, the hydrolysis reaction was considered complete when the solution reached a temperature of 122 °C. Thermocouples were used to measure the temperature inside the beakers. At the end of the reaction time, the particles were filtered using Whatman® grade 1 filter paper and washed three times with distilled water, 150 mL each time. The particles were oven-dried and stored for further characterization. The acid hydrolysis treatment used is summarized in Figure 1.
2.3. Characterization of Recycled Particles
2.3.1. Thermal Stability
The thermal stability of the virgin particles, the raw board particles, and the recycled particles was assessed using a thermogravimetric analyzer model STARe System TGA/DSC 3+ from Mettler Toledo (Mississauga, ON, Canada). Approximately 8 mg of grounded samples were analyzed, for each treatment in triplicate. The analysis was performed using a heating rate of 10 °C/min. The measurement range was set between 35 and 500 °C under a controlled nitrogen atmosphere. Additionally, a set of samples consisting of raw board particles was analyzed in the presence of oxalic acid and ammonium chloride solutions at varying concentrations to determine the degradation stages of the panels under different acidic conditions, using a 1:1 ratio.
2.3.2. Granulometric and Morphological Characterization
For the particle size analysis of the recycled particles, approximately 60 g of oven-dried material from each hydrolysis condition was placed in an RO-TAP RX-29 sieve shaker (Mentor, OH, USA). The particle size distribution was classified using 12-, 20-, 35-, and 48-mesh screens. The samples were shaken for 15 min to obtain different size fractions, whose weights were expressed as percentages representing the particle size distribution of the sample. The particle size distribution of each treatment was evaluated in triplicate.
The microstructure and morphology of the recycled particles obtained from acid hydrolysis were examined using a scanning electron microscope (SEM) from JEOL JSM-6360LV (Saint-Hubert, QC, Canada), operating at 25 kV. Samples were placed on an aluminum disk with double-sided conductive carbon tape, and then gold sputtered in an EMS 950x sputter coater (Hatfield, PA, USA).
2.3.3. Nitrogen Content
The nitrogen content of the virgin particles, the raw board particles, and the recycled particles was determined using a Perkin Elmer 2410 Series II Nitrogen Analyzer (Shelton, CT, USA). Before testing, the samples were ground to an appropriate particle size using a Retsch ZM100 ultra-centrifugal grinder mill (Haan, Germany), resulting in particles of ≤ 1.05 mm. Approximately 30 mg of sample was used for each evaluation, with analyses conducted in triplicate for each treatment.
2.3.4. pH and Acid/Base Buffer Capacity
The pH and buffering capacity of the virgin particles, the raw board particles, and the recycled particles were measured using the extraction procedure proposed by Fu et al. [9]. Approximately 25 g of oven-dried particles were placed in a 500 mL flat-bottom flask with 200 mL of distilled water. The flask was connected to a condenser and heated until reflux was established in the sample for 20 min. The time measurement started when the water began to boil. The mixture was then filtered using Whatman® grade 4 filter paper. The sample was washed twice with 75 mL of distilled water each time. The extracted solution was diluted to a final volume of 500 mL. The extraction was performed in duplicate for each treatment. A titration procedure was performed to determine the acid and base buffer capacities of the extracted solutions. The initial pH before titration corresponded to the pH of the extracted solution. One hundred mL of the extracted solution was pipetted into a 200 mL beaker and continuously stirred. A 0.0125 mol/L sulfuric acid (H2SO4) solution was used to titrate the solution until a pH of 3 was reached to measure the acid buffer capacity. The same procedure was followed for the base buffer capacity, using a 0.025 mol/L sodium hydroxide (NaOH) solution to titrate the solution until a pH of 11 was achieved. For each treatment, two extractions were performed, and the acid and base titration procedures were repeated twice for each extracted solution. Thus, the acid and base buffer capacity of each treatment represents the average of four measurements.
The pH of each treatment corresponds to the average of eight measurements (2 extractions × 2 acid buffer capacities × 2 base buffer capacities). The acid and base buffer capacity, expressed in millimoles (mmol), were determined using the following equations:
2.3.5. Influence of the Recycled Particles on the UF Curing Behavior and Gel Time
The impact of recycled particles on the curing behavior of UF adhesive, the most commonly used in panel manufacturing, was investigated. The polymerization temperature of UF adhesive in the presence of recycled particles was determined using high-pressure capsules in a DSC2550 Discovery Series from TA Instruments (New Castle, DE, USA). Five mg of each type of recycled particle were used for the analysis, with measurements performed in triplicate for each condition. A heating rate of 10 °C/min was applied under a controlled nitrogen atmosphere, spanning a temperature range from 30 °C to 180 °C. The gel time of UF adhesive in the presence of recycled particles was determined using a Sunshine Gel Time Meter. In a beaker, 30 g of UF adhesive was mixed with 3.5 g of each oven-dried recycled particles (particle size retained on a 48-mesh sieve). Additionally, 1% of a 25% ammonium chloride catalyst was added to the UF adhesive. Approximately 5 g of the mixture was placed in a 150 mm test tube and tested to determine the gel time at 100 °C. Measurements were performed in triplicate for each type of recycled particle. The pure UF adhesive was used as a reference for DSC and gel time analysis.
2.4. Statistical Analysis
To evaluate the effects of the different types of acids, the acid concentrations, and reaction times on nitrogen content, pH, acid/base buffer capacity, and gel time, a 23 factorial experiment was designed. The data were analyzed using ANOVA. The model assumptions for each response variable were assessed and, when necessary, were satisfied through a transformation using the "boxCox" function from the "car" package in R [13]. Additionally, a second ANOVA test was conducted to compare the acid hydrolysis treatments with the W-60min treatment, virgin particles, and raw board particles. A Tukey test was also performed to analyze significant differences between all treatments. All statistical analyses were conducted using the R software version 4.3.2 [14].
3. Results and Discussion
3.1. Thermal Stability
Figure 2A shows the thermal stability of the virgin particles, the raw board particles, and the recycled particles under different hydrolysis conditions. Thermogravimetric curves provide information on the particle degradation stage as a function of temperatures. Virgin, raw board particles, and recycled particles treated with water and oxalic acid exhibit a single well-defined degradation stage. Degradation begins at approximately 120 °C in all cases, with a maximum degradation temperature of about 330 °C for W-60min, OA1%-60min, and OA1%-30min. For virgin particles, raw board particles, OA2%-60min, and OA2%-30min, the maximum degradation temperature was close to 365 °C. At these temperatures, the degradation of cellulose present in the sample structure is likely to have occurred [15]. In wood fibers, hemicelluloses typically begin to degrade at temperatures ranging from 180 to 350 °C [16]. Cellulose, on the other hand, degrades between 200 and 450 °C [17]. The pyrolysis process notably slowed between 400 and 500 °C, resulting in minimal mass loss. Within this temperature range, lignin degradation occurs [18].
During the panel manufacturing process, it is crucial to carefully select the pressing conditions to prevent excessive degradation of the wood’s chemical components, which could negatively impact the panel's mechanical properties. On the other hand, the recycled particles obtained using ammonium chloride exhibited two degradation stages. The first stage of degradation began below 200 °C, with a weight loss primarily attributed to the decomposition of ammonium chloride [19]. The most significant weight loss occurred between 300 and 380 °C, which is associated with the thermal decomposition of cellulose present in the particles. This degradation pattern can also be observed in Figure 2B, where raw board particle samples were tested in the presence of the different acid solutions. The samples containing ammonium chloride solution (yellow and purple lines) exhibited two degradation stages, which align with the TGA curves of the recycled particles (Figure 2A). This indicates that in AC25%-30min, AC25%-60min, AC30%-30min, and AC30%-60min, ammonium chloride residues remain within the particles, despite multiple washings after the acid hydrolysis treatment. Also, the TGA curves of the raw board particle samples in the presence of oxalic acid (Figure 2B) exhibit a similar degradation behavior to that of the particles recycled with this acid (Figure 2A). In general, all recycled particles exhibit good thermal stability, similar to that observed in the TGA curve of virgin particles used for particleboard manufacturing. The highest degradation rates occur at temperatures above 200 °C. As these temperatures are generally higher than those used in the panel manufacturing process, particles recycled from all hydrolysis conditions can be used in the manufacture of new panels.
3.2. Granulometric and Morphological Characterization
The size distribution of the recycled particles is shown in Figure 3. For all hydrolysis conditions, the highest percentage of particles was retained by the 12-mesh sieve, corresponding to particles ≥1.68 mm. The retention percentage ranged from 46% to 52%, with AC25%-60min and AC30%-60min exhibiting the highest proportion among the acid hydrolysis-treated recycled particles (49.8% and 49.4% respectively). The values observed for particles recycled using only water were higher, at 51.6%. For the 20-mesh sieve, the retention percentage ranged from 24% to 26% across all cases, corresponding to particle sizes between 0.84 mm and 1.68 mm. Between 12% and 15% of the particles were retained by the 35-mesh sieve, with all acid treatments exhibiting a slightly higher percentage of particles in this category than W-60min. A similar trend was observed for the 48-mesh sieve, where the retention percentage ranged from 6% to 9% in all acid treatments.
Particles smaller than or equal to 0.30 mm were collected at the bottom of the sieve, and their content never exceeded 5% in any case. All the treatments evaluated showed a low percentage of fine particles, which is ideal if the aim is to reuse these particles in the production of new panels. Fine particles have a high specific surface area. Therefore, an increased proportion of fines would necessitate the use of more adhesive during manufacturing to attain the desired properties of the panels. This is not optimal from a cost perspective. Additionally, the results showed that using acid solutions in the hydrolysis process does not significantly alter the dimensions of the recycled particles compared to those obtained using water alone. The SEM images of the recycled particles from acid hydrolysis treatments are shown in Figure 4.
The anatomical structure of the particles obtained through acid hydrolysis remains unaffected by the acidic solutions used; the fibers stay well-defined across all treatments. The images indicate that recycled particles are composed of a mixture of softwood and hardwood species. The acid hydrolysis treatment was highly selective toward the adhesive, effectively preserving the integrity of the prosenchymatous elements. This is evident in the perforation plates of hardwoods, which can be observed in Figure 4A; bordered pits in the softwood tracheides shown in Figure 4C–E; as well as in cell walls. Another noteworthy observation is the absence of delamination in the longitudinal tracheids in softwoods and fibers in hardwoods. This serves as a strong indicator that the acid was not sufficiently strong to dissolve the middle lamella. This conclusion is supported by the fact that no signs of separation were observed in the cell bundles. Likewise, a clearly defined vessel composed of various vessel elements can also be distinguished in Figure 4F, as well as the presence of bordered pits in Figure 4G. In Figure 4H, a tangential section of a softwood particle reveals well-defined uniseriate rays. The presence of these structures in the samples indicates a high-quality anatomical integrity of the recycled particles, suggesting their potential as a viable alternative for producing new particleboards. Furthermore, no adhesive residues or foreign elements were detected in the recycled particles. The TGA analysis revealed the presence of ammonium chloride in the recovered particles (AC25%-30min; AC25%-60min; AC30%-30min; and AC30%-60min). However, no visible crystals or precipitates were observed in the SEM images (Figure 4E-H). This suggests that the ammonium chloride may be retained within the cell lumens and void spaces of the particles.
3.3. Nitrogen Content
The nitrogen content found in the virgin particles, the raw board particles, and the recycled particles is shown in Figure 5. The nitrogen content of raw board particles was determined as a control sample, yielding a value of 2.48%. This amount contrasts with and exceeds that obtained in virgin particles, which was 0.31%. Hagel and Saake [20] reported similar nitrogen contents (0.3%) in neet wood particles from poplar and spruce species.
The high nitrogen content in the raw board particles compared to virgin particles is due to the presence of cured UF adhesive and the ammonium chloride catalyst, both used in particleboard manufacturing [9]. Consequently, a decrease in nitrogen content following hydrolysis is associated with the removal of the cured adhesive from the recycled particles. After the acidic hydrolysis, the nitrogen content values of recycled particles were significantly lower than those of the raw board particles. Hydrolysis treatments using oxalic acid proved to be more effective than those using ammonium chloride. For oxalic acid treatment, the nitrogen content of recycled particles was reduced by 85% to 90%, depending on concentration and reaction time. The OA1%-60min treatment exhibited the lowest nitrogen content in absolute terms (0.25%), representing a 90% reduction in nitrogen content compared to raw board particles. Among the ammonium chloride treatments, AC25%-30min yielded the best results in terms of removing cured UF, with a nitrogen content of 0.92%, representing a 63% reduction compared to raw board fibers. As previously described, ammonium chloride particles remained in the recycled particles, which may have contributed to slightly higher nitrogen content values compared to the oxalic acid treatments. The W-60min treatment exhibited a nitrogen content of 0.57%, representing a 77% reduction compared to the raw board particles. The W-60min remains a better treatment than ammonium chloride under the conditions tested in our study. Also, the W-60min performed better than the treatment reported by Fu et al. [9] under comparable conditions, specifically at a temperature of 120 °C and a reaction time of 60 min. In their study, the nitrogen content in the recycled particles was found to be 0.95% (a 58.7% reduction compared to the control samples). The factorial ANOVA reveals a strong interaction between reaction time, acid type, and its concentration, which significantly affects the nitrogen content (Table 2). The effect of time depends on the type of acid and its concentration. When using a lower concentration, the nitrogen content in the ammonium chloride treatments increased with longer reaction times, whereas at higher concentrations, it remained constant. In contrast, when using oxalic acid, neither time nor concentration has an impact on the nitrogen content. In addition, statistical analysis showed that particles recycled with oxalic acid had the same nitrogen content as virgin particles and a lower nitrogen content than those recycled at W-60min, indicating a higher efficiency of oxalic acid hydrolysis (Figure 5).
3.4. pH and Acid/Base Buffer Capacity
Table 3 presents the pH levels of virgin particles, raw board particles, and recycled particles. The pH of the virgin particles was measured at 5.25, while the raw board particles had a pH of 5.37. The pH levels of all particles obtained through acid hydrolysis were lower than these values. Using oxalic acid, the highest recorded pH was in OA1%-60min, with a value of 4.14, which represents a 23% reduction compared to the raw board particles. In contrast, OA2%-30min showed the most significant reduction in pH, approximately 39%. On the other hand, among the recycled particles treated with ammonium chloride, AC30%-60min showed the highest pH reduction, with a 44% decrease, resulting in a pH of 3.00. The pH levels of particles treated with ammonium chloride were lower than those obtained with oxalic acid. This could be attributed to the presence of small quantities of residual ammonium chloride in the recycled material.
The pH level of particles is a crucial property for the manufacture of new particleboard, as it can influence gel time, which in turn impacts pressing time and the final properties of the panels. Although the polymerization of UF adhesive used in particleboard production is most effective under acidic conditions, excessively low pH levels can adversely affect the fabrication of new panels due to the rapid polymerization of the adhesive. Unlike the acid treatments, the pH of the W-60min recycled particles was higher (5.89) than that of the virgin particles and the raw board particles. Using similar conditions, Fu et al. [9] obtained a pH of 6.57 in recycled particles using water alone. The statistical analysis revealed that reaction time has a differential effect on pH, depending on the type of acid solution and its concentration (Table 2). When using oxalic acid, the pH increases over time, whereas with ammonium chloride, it tends to decrease (Table 3). In this case, notable differences in the slope of the pH level obtained with oxalic acid and ammonium chloride under both concentration conditions suggest an interaction between treatment and time. On the other hand, there are significant differences in pH levels obtained for acid hydrolysis treatments compared with W-60min, the virgin particles, and the raw board particles.
The buffer capacity of a solution is a measure of its ability to neutralize strong acids (acid buffer capacity) or strong bases (base buffer capacity) while maintaining a stable pH [21]. It indicates the amount of a strong acid (such as H₂SO₄) or a strong base (such as NaOH) that can be added to the solution before a significant increase or decrease in pH occurs. Table 4 presents the acid/base buffer capacity of the different recycled particles. Particles obtained through acid hydrolysis show a lower acid buffer capacity than virgin and raw board particles. This indicates that these particles will be less effective in resisting pH changes in the presence of strong acids, leading to a faster pH decrease compared to virgin and raw board particles. This effect is more pronounced in treatments with ammonium chloride, reaching its maximum in the case of AC30%-60min. The W-60min treatment exhibits the same acid buffer capacity as virgin particles and is highly similar to that of raw board particles. Since all the acid buffer capacity values in the AC30%-60min treatment were 0, the model assumptions were not met, and an ANOVA could not be performed on the factorial design to evaluate the influence of the factors. When comparing the acid hydrolysis treatments, significant differences in acid buffer capacity were found among the virgin particles, the raw board particles, and the W-60min treatment. According to the Tukey test, the treatments with ammonium chloride are statistically similar. Differences are observed between the oxalic acid treatments at 1% and 2%, but no significant differences exist between treatments with the same concentration. Finally, virgin and raw board particles do not differ significantly from each other. The acid buffer capacity is an important factor to consider when reusing recycled particles to produce new panels. Wood particles with a high acid buffer capacity can significantly affect the curing process of the UF adhesive commonly used in particleboard manufacturing [22].
On the other hand, the base buffer capacity exhibits a different behavior. The base buffer capacities of virgin particles and raw board particles are similar. However, the base buffer capacity of the particles recycled by acid hydrolysis increased, with a more pronounced effect with ammonium chloride regardless of acid concentration or reaction time. In particular, the AC30%-60min treatment exhibited an almost eightfold increase compared to raw board particles. The base buffer capacity of the particles recycled with oxalic acid also increased, but to a lesser extent. This increased capacity makes these particles more stable against disturbances, such as the addition of strong bases. Conversely, in particles obtained through hydrolysis with water (W-60min), the base buffer capacity significantly decreased compared to virgin and raw board particles. The factorial ANOVA results indicate that the effect of reaction time on the base buffer capacity depends on the type of acid solution used (Table 2). When using ammonium chloride, the base buffer capacity decreases at lower acid concentration and increases at a higher concentration. In contrast, with oxalic acid, the base buffer capacity remains constant as both reaction time and acid concentration increase.
3.5. Influence of the Recycled Particles on the UF Curing Behavior and Gel Time
The polymerization reactions of UF adhesives are typically exothermic. The adhesive cures through a polycondensation process, during which water and methanol are released through an exothermic reaction, as characterized by DSC analysis. Figure 6 shows the peak temperature for pure UF adhesive and mixed with each type of recycled particles obtained by hydrolysis with water alone and in acid solutions. This peak temperature corresponds to the point at which the reaction reaches its maximum intensity [23] and, in our case, represents the temperature at which the UF adhesive polymerizes in the presence of recycled particles. The peak temperature of the pure UF adhesive obtained in our study was 89.7 °C. Particles treated with oxalic acid showed a slight decrease in peak temperature during the curing reaction, except for OA1%-60min. A more pronounced effect was observed in treatments using a 2% oxalic acid concentration compared to pure UF adhesive. However, in the OA1%-60min treatment, the peak temperature was slightly higher than that of the pure UF adhesive. Conversely, the presence of particles treated with 25% ammonium chloride resulted in a higher peak temperature compared to pure UF adhesive. In the cases of AC30%-30min and AC30%-60min, the peak temperatures were marginally lower than that of pure UF adhesive.
Therefore, no clear pattern emerges regarding the influence of recycled particles on the peak temperature. However, their presence subtly affects the peak temperature of the UF curing reaction. If the recycled particles from our study are used to produce new panels, the UF adhesive curing reaction would be suitable, as indicated by the DSC results.
The influence of recycled particles on the gel time of UF adhesive is shown in Figure 7. The gel time of UF adhesive in the presence of recycled particles treated with oxalic acid does not exhibit significant differences compared to pure UF adhesive. This is a positive indicator for reusing these particles in producing new panels, as it would not require additional pressing time or a higher amount of catalyst to accelerate the polymerization reaction of the adhesive. Additionally, the OA1% treatments differ from OA2% treatments regardless of reaction time. On the other hand, the influence of particles obtained with 30% ammonium chloride is primarily reflected in the reduction of the gel time of the UF adhesive. In treatments AC25%-30min and AC25%-60min, the gel time is equal to that of pure UF adhesive. These results may be attributed to the lower acidity of the recycled particles compared to the virgin particles. This result aligns with the findings of Xing et al. [24], who suggested that UF adhesive mixed with lower pH particles requires less curing time. Additionally, it has been reported that an increase in the acid buffer capacity of the wood particles is associated with a longer gel time [25]. In this case, the acid buffer capacity of the recycled particles is low. Therefore, it can be inferred that the gel time of the UF adhesive in the presence of these particles would be shorter than that of the UF adhesive alone.
The ANOVA revealed a significant interaction between the type of acid used and its concentration (Table 2). As oxalic acid concentration increases, the gel time also increases. In contrast, when the ammonium chloride concentration increases, the gel time decreases. Furthermore, there is a significant interaction between the concentration used and the hydrolysis reaction time. At lower concentrations, the gel time is longer, reaching 60 minutes. However, at higher concentrations, the gel time remains constant regardless of the hydrolysis reaction time. When comparing the acid hydrolysis treatments with W-60min and pure UF adhesive, significant differences were observed between some treatments.
4. Conclusions
This study demonstrates that recycling particleboards using an acid hydrolysis process is advantageous due to its efficiency in removing the cured UF adhesive while preserving the thermal stability and quality of the recycled particles. The TGA shows that the recycled particles exhibit a higher degradation percentage beyond 200 °C. All recycled particles exhibit good thermal stability and can be used to manufacture new panels. For hydrolysis treatments with ammonium chloride, the TGA curves reveal that a small fraction of acid remained on the particles even after multiple post-treatment washing steps. However, SEM images did not indicate the presence of crystals or encrustations that might be associated with ammonium chloride residues.
The anatomical structures of recycled particles remained in excellent condition, and no delamination occurred between the tracheids or fibers of the wood particles. The nitrogen content of recycled particles was significantly lower than that of raw board particles, particularly for hydrolysis with oxalic acid. For the latter, the nitrogen content was similar to that of virgin particles. Treatment with 1% oxalic acid for 60 min achieved a maximum reduction in nitrogen content of 90%. This demonstrates the efficiency of acid hydrolysis treatments in removing cured UF adhesive from recycled wood particles, particularly when oxalic acid is used.
In all hydrolysis treatments, the pH of the recycled particles was lower than that of raw board particles, with a more pronounced effect in the particles obtained from ammonium chloride hydrolysis. This should be considered when using recycled particles to produce new panels, as the acidity of the particles affects the curing of the UF adhesive. Additionally, the based buffer capacity of the recycled particles was higher while their acid buffer capacity was lower than that of the raw board particles. The latter is advantageous for producing new panels using recycled particles, as a high acid buffer capacity could significantly affect the curing process of the UF adhesive.
The recycled particles had no significant effect on the peak curing temperature of the UF adhesive. The range of peak temperatures obtained was approximately 86–91 °C, which is very similar to the curing temperature of pure UF adhesive. On the other hand, treatments with 30% ammonium chloride for both 30 and 60 min had a significant influence on the gel time of the UF adhesive, thereby reducing the polymerization reaction time. The remaining treatments exhibited a gel time similar to pure UF adhesive.
Finally, oxalic acid performed better than ammonium chloride and water alone, demonstrating higher selectivity in removing the cured UF adhesive found in particleboards. Additionally, oxalic acid can remove more cured UF in half the time of water hydrolysis. Based on the results regarding nitrogen content, pH, buffer capacity, and gel time of the UF adhesive, it is recommended to treat the material with 1% oxalic acid for 30 min. This approach will yield recycled particles that are suitable for producing new particleboards.
Author Contributions
Conceptualization, methodology, validation, writing–-review and editing, G.R., R.G., and A.C.; writing-original draft preparation, visualization, G.R., and R.G.; formal analysis, investigation, data curation, G.R.; resources, supervision, project administration, funding acquisition, A.C. All authors have read and agreed to the published version of the manuscript.
Funding
The study was conducted as part of the Wood-Based Composite Panel Research Consortium (Corepan-Bois) at Université Laval. We gratefully acknowledge funding from the Natural Sciences and Engineering Research Council of Canada (NSERC) [ALLRP 571660–21], the Ministère des Ressources naturelles et des Forêts (MRNF), the Quebec Forest Industry Council (CIFQ) [PIP-2019–12], Arbec Forest Products Inc., FPInnovations, Tafisa Canada, Uniboard Canada, and SACOPAN.
Data Availability Statement
The data presented in this article are available upon reasonable request from the corresponding authors.
Acknowledgments
The authors would like to thank Yves Bédard and Paul Desauniers for their technical support, particularly for training in the use of the equipment and for conducting chemical analyses.
Conflicts of Interest
The authors declare no conflicts of interest. The funders had no role in the design of the study; in the collection, analyses, or interpretation of data; or in the writing of the manuscript. The partners reviewed the manuscript and approved it for publication.
References
- FAO. FAOSTAT: Forestry Production and Trade. Available online: https://www.fao.org/faostat/en/#data (accessed on 27 November 2024).
- Baharuddin, M.N.M.; Zain, N.M.; Harun, W.S.W.; Roslin, E.N.; Ghazali, F.A.; Som, S.N.Md. Development and performance of particleboard from various types of organic waste and adhesives: A review. Int. J. Adhes. Adhes. 2023, 124, 103378. [Google Scholar] [CrossRef]
- Puettman, M.E. Carbon analysis of wood composite panels. Forest Prod. J. 2022, 72(2), 112–5. [Google Scholar] [CrossRef]
- Farjana, S.H.; Tokede, O.; Tao, Z.; Ashraf, M. Life cycle assessment of end-of-life engineered wood. Sci. Total Environ. 2023, 887, 164018. [Google Scholar] [CrossRef]
- Risholm-Sundman, M.; Vestin, E. Emissions during combustion of particleboard and glued veneer. Holz Roh Werkst. 2005, 63, 179–185. [Google Scholar] [CrossRef]
- Ministry of Environment. Wood waste landfills guideline for the code of practice for industrial non-hazardous waste landfills incidental to the wood processing industry. British Columbia, 2011. Available online: https://www2.gov.bc.ca/assets/gov/environment/waste-management/industrial-waste/industrial-waste/pulp-paper-wood/woodwastelandfillguideline.pdf (accessed on 02 December 2024).
- de Souza Pinho, G.C.; Calmon, J.L.; Medeiros, D.L.; Vieira, D.; Bravo, A. Wood waste management from the furniture industry: The environmental performances of recycling, energy recovery, and landfill treatments. Sustainability 2023, 15, 14944. [Google Scholar] [CrossRef]
- Fu, Q.; Zhuang, B.; Wang, X.-M.; Cloutier, A.; Roussière, F.; Bouffard, J.F. Thermo-hydrolytically recycling of urea-formaldehyde resin-bonded laminated particleboards. BioResources 2022, 17, 6847–59. [Google Scholar] [CrossRef]
- Fu, Q.; Wang, X.-M.; Cloutier, A.; Roussière, F. Chemical characteristics of thermo-hydrolytically recycled particles. BioResources 2020, 15, 3774–86. [Google Scholar] [CrossRef]
- Lubis, M. A. R.; Hong, M. K.; Park, B. D. Hydrolytic removal of cured urea-formaldehyde resins in medium-density fiberboard for recycling. J. Wood Chem. Technol. 2018, 38, 1–14. [Google Scholar] [CrossRef]
- Nuryawan, A.; Rahmawaty; Tambun, K.D.S.; Risnasari, I.; Masruchin, N. Hydrolysis of particleboard bonded with urea-formaldehyde resin for recycling. Heliyon 2020, 6, e03936. [Google Scholar] [CrossRef]
- Olgun, Ç.; Ateş, S.; Uzer, E. Effects of medium density fiberboards (MDF) recycling methods on fiber dimensions and some reconstructed board properties. Drv. Ind. 2023, 74, 61–9. [Google Scholar] [CrossRef]
- Fox, J.; Weisberg, S. An R Companion to Applied Regression, 3rd ed.; Sage: Thousand Oaks, CA, USA, 2019. [Google Scholar]
- R Core Team. R: A Language and Environment for Statistical Computing; R Foundation for Statistical Computing: Vienna, Austria, 2024; Available online: https://www.R-project.org/ (accessed on 17 March 2025).
- Chen, W.; Fong, C.; Lin, Y.; Bach, Q. Independent parallel pyrolysis kinetics of cellulose, hemicelluloses and lignin at various heating rates analyzed by evolutionary computation. Energ. Convers. Manage. 2020, 221, 113165. [Google Scholar] [CrossRef]
- Poletto, M.; Zattera, A. J.; Forte, M. M. C.; Santana, R. M. C. Bioresource Technology Thermal decomposition of wood: Influence of wood components and cellulose crystallite size. Bioresource Technol. 2012, 109, 148–153. [Google Scholar] [CrossRef]
- Morán, J. I.; Alvarez, V. A.; Cyras, V. P.; Vázquez, A. Extraction of cellulose and preparation of nanocellulose from sisal fibers. Cellulose 2008, 15(1), 149–159. [Google Scholar] [CrossRef]
- Alvarado Flores, J. J.; Rutiaga Quiñones, J. G. Estudio de cinética en procesos termogravimétricos de materiales lignocelulósicos. Maderas-Cienc. Tecnol. 2018, 20, 221–238. [Google Scholar] [CrossRef]
- Kuzmenko, V.; Naboka, O.; Gatenholm, P.; Enoksson, P. Ammonium chloride promoted synthesis of carbon nanofibers from electrospun cellulose acetate. Carbon 2014, 67, 694–703. [Google Scholar] [CrossRef]
- Hagel, S.; Saake, B. Fractionation of Waste MDF by Steam Refining. Molecules 2020, 25(2165), 1–20. [Google Scholar] [CrossRef]
- Król, P.; Toczyłowska-mamińska, R.; Mamiński, M. A Critical Role for the Presence of Lignocellulosic Material in the Determination of Wood Buffering Capacity. J. Wood Chem. Technol. 2017, 37, 478–484. [Google Scholar] [CrossRef]
- Policardi, F.; Thebault, M. The Buffer Effect of Different Wood Species and the Influence of Oak on Panel Composites Binders. Polymer 2020, 12(1540), 1–9. [Google Scholar] [CrossRef]
- Popović, M.; Miljković, J.; Budinski Simendić, J.; Pavličević, J.; Ristić, I. Curing characteristics of low emission urea-formaldehyde adhesive in the presence of wood. Wood Res-Slovakia. 2011, 56, 589–600. [Google Scholar]
- Xing, C.; Zhang, S. Y.; Deng, J. Effect of wood acidity and catalyst on UF resin gel time. Holzforschung 2004, 58, 408–412. [Google Scholar] [CrossRef]
- Gadhave, R. V; Mahanwar, P. A.; Gadekar, P. T. Factor Affecting Gel Time / Process-Ability of Urea Formaldehyde Resin Based Wood Adhesives. Open J. Polym. Chem. 2017, 7, 33–42. [Google Scholar] [CrossRef]
Figure 1.
Hydrolysis treatment process used for raw particleboard recycling.
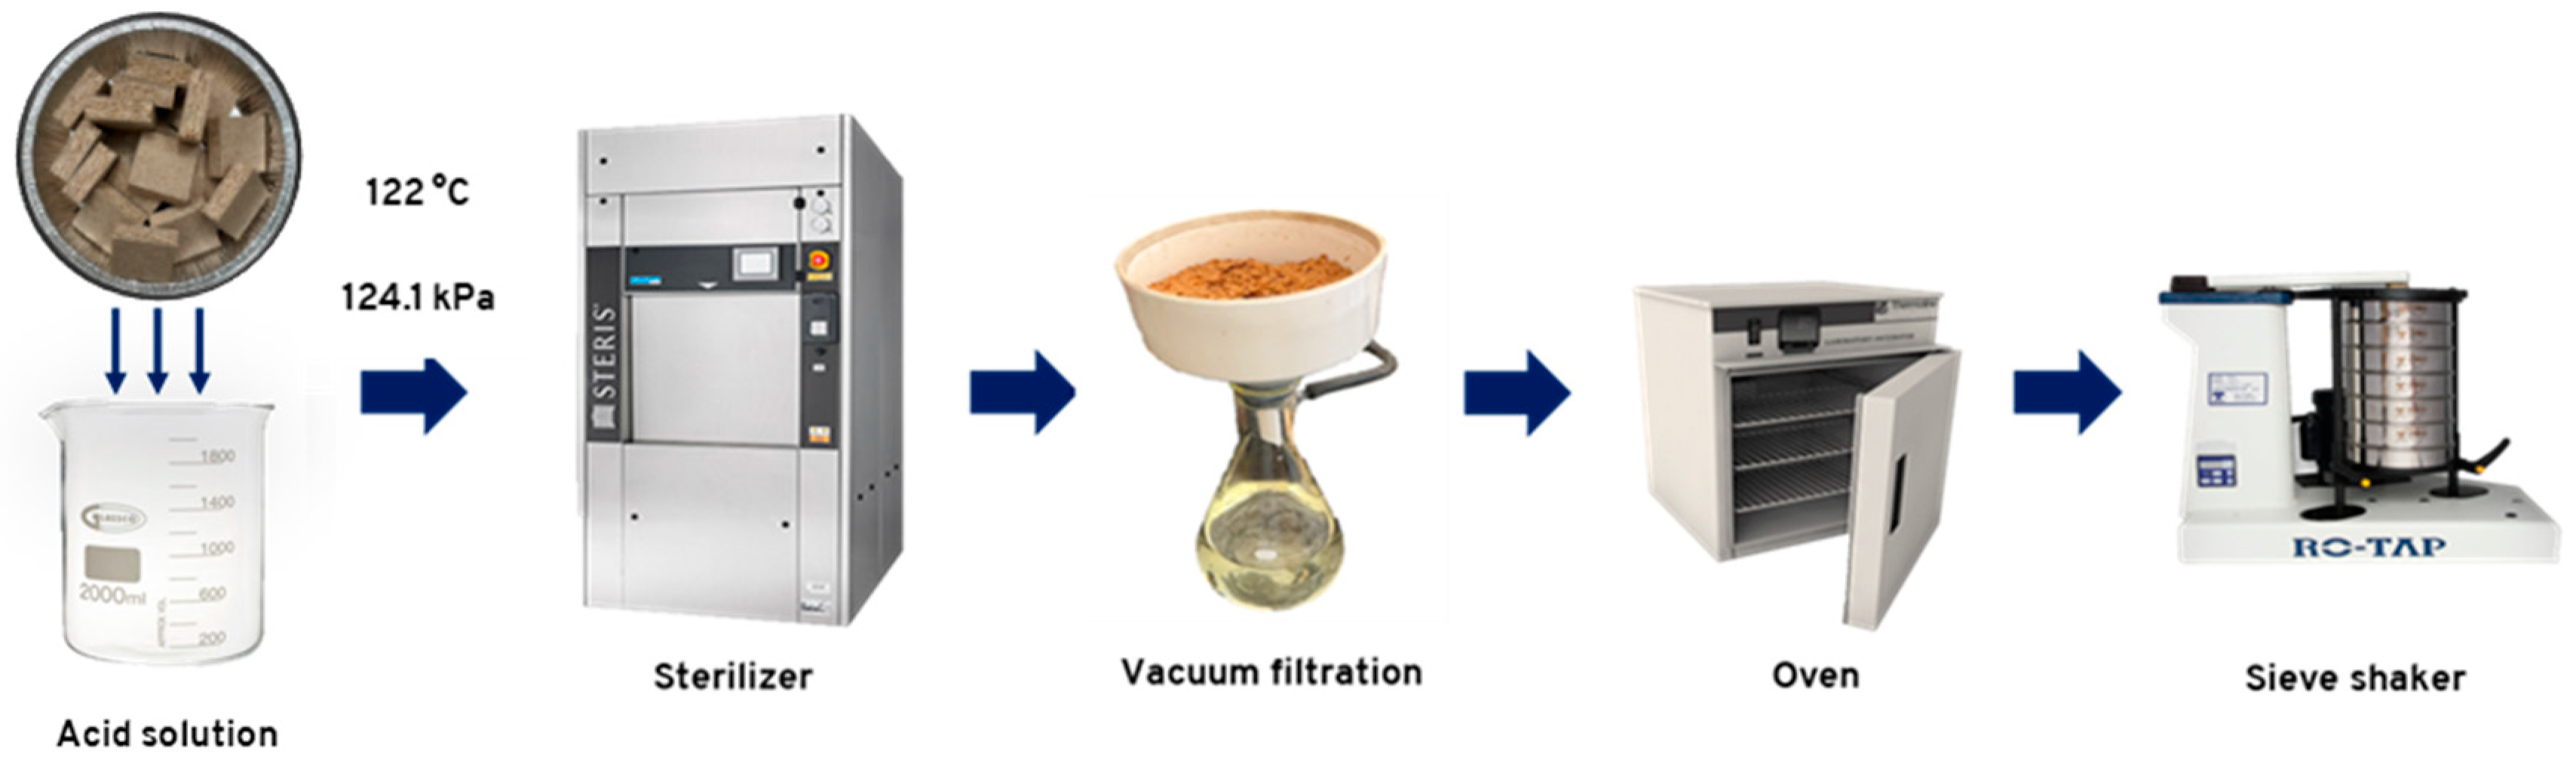
Figure 2.
(A) TGA curves of the virgin, the raw board particles, and the recycled particles (B) TGA curves of raw board particles in the presence of various acid solutions.
Figure 2.
(A) TGA curves of the virgin, the raw board particles, and the recycled particles (B) TGA curves of raw board particles in the presence of various acid solutions.
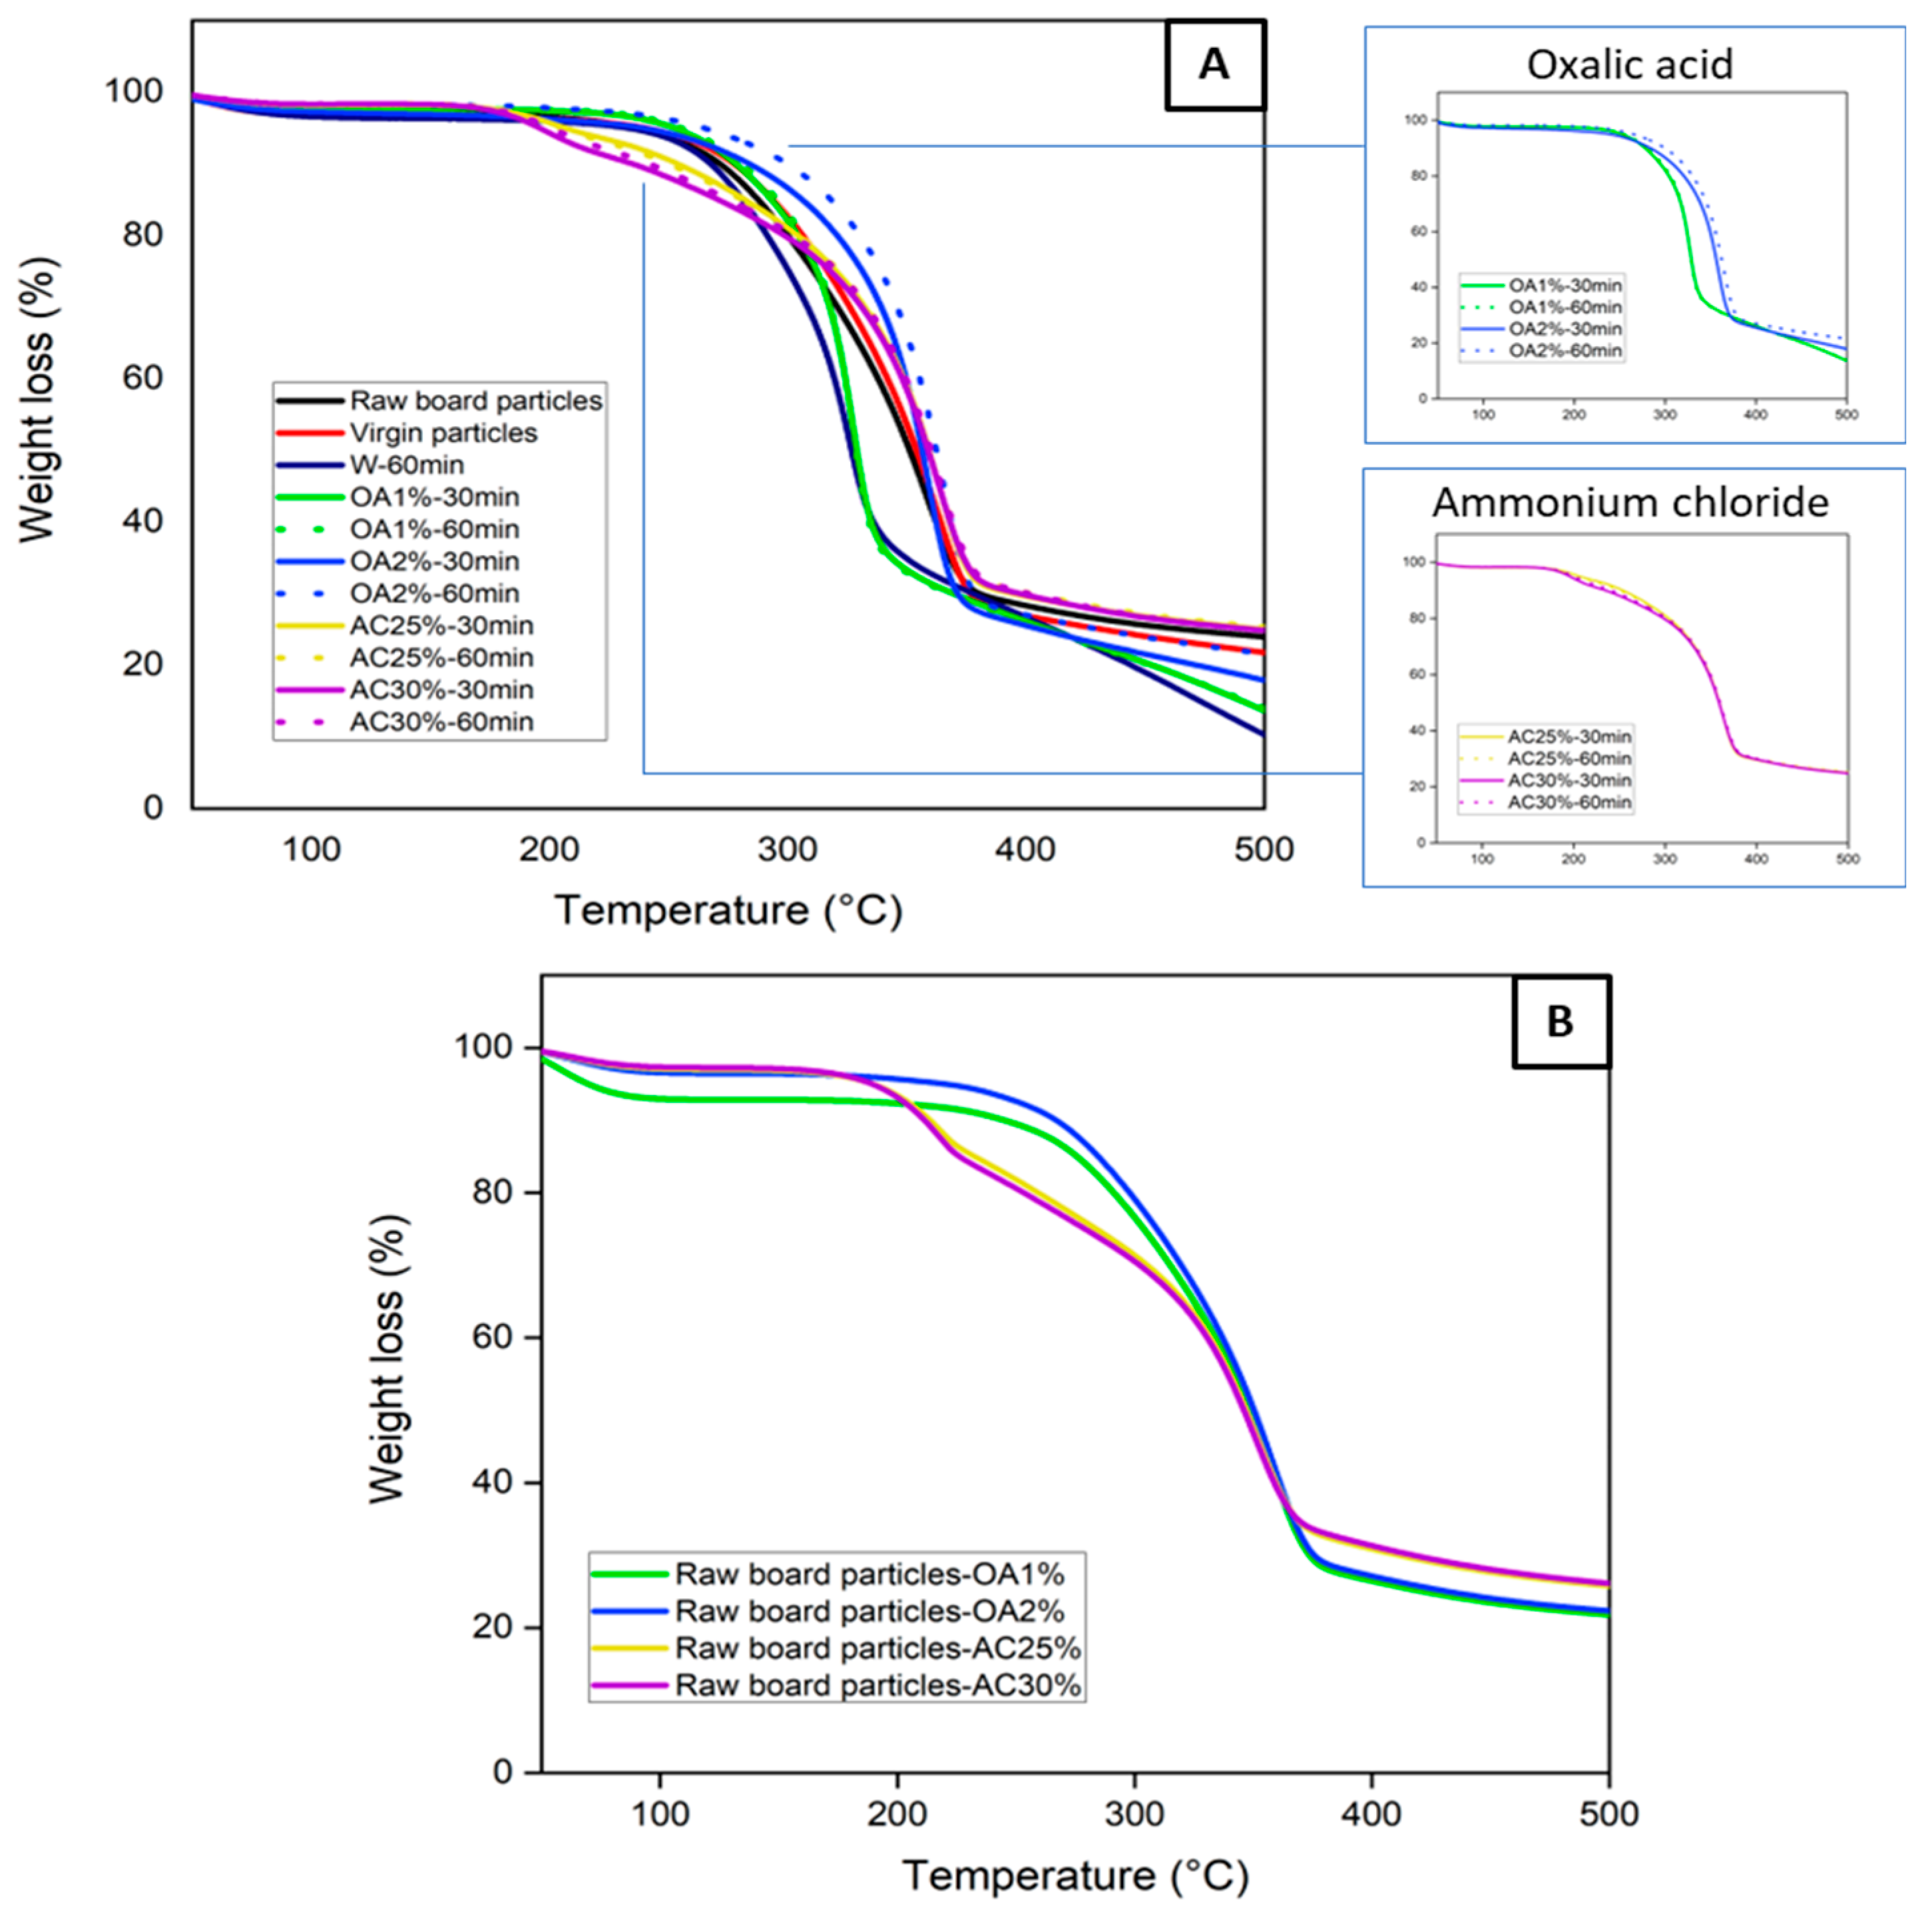
Figure 3.
Size distribution of recycled particles from various hydrolysis conditions.
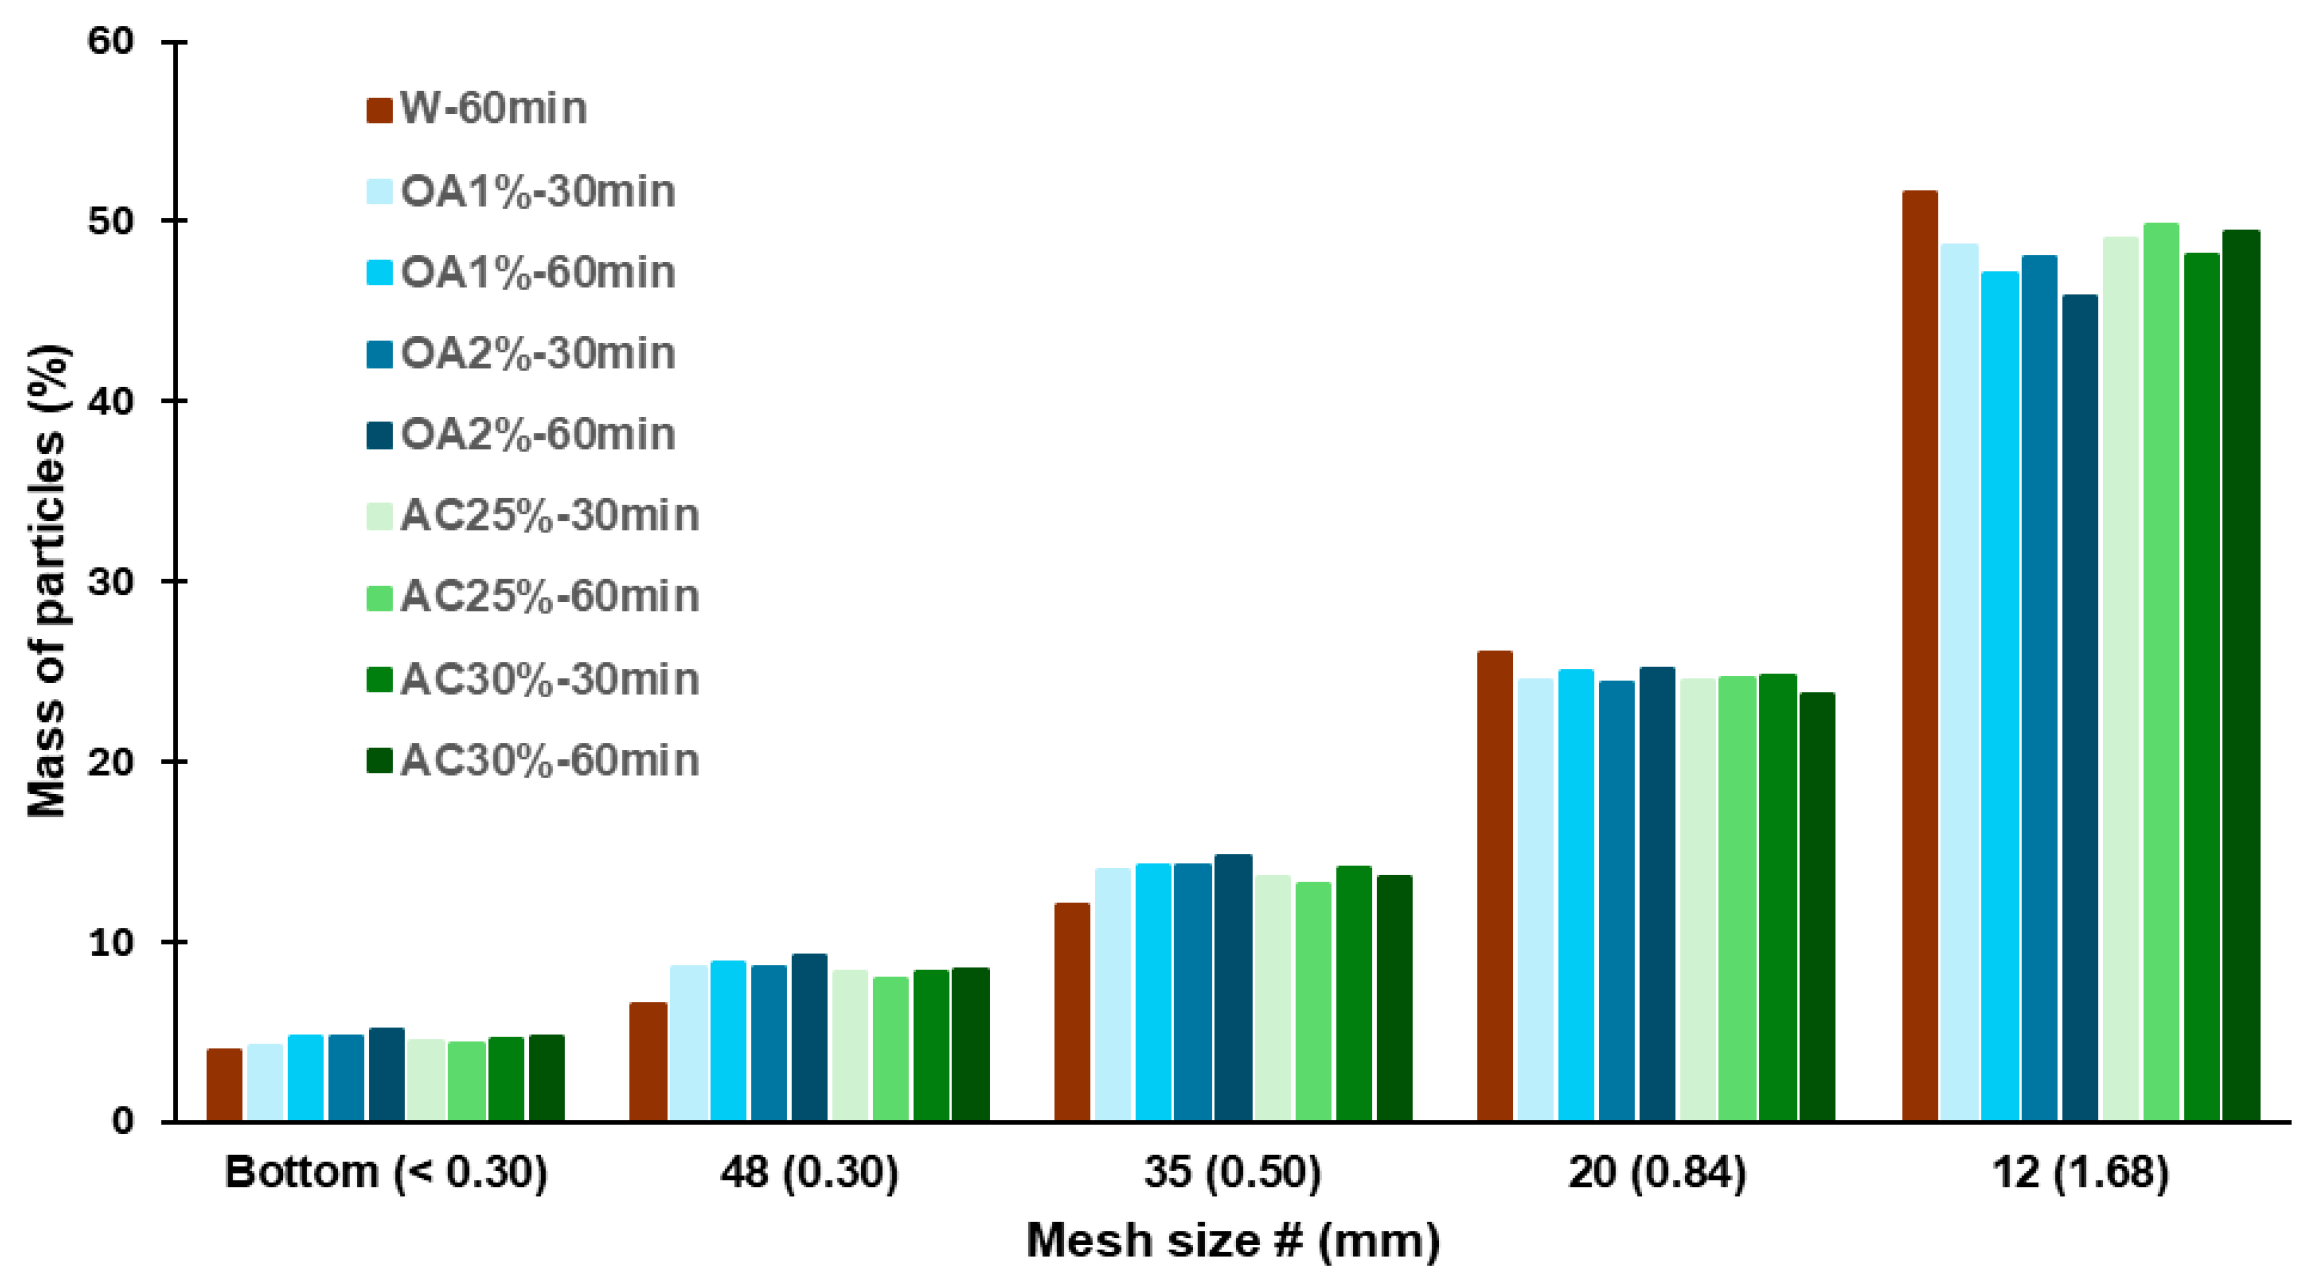
Figure 4.
SEM images of recycled particles obtained by acid hydrolysis. (A) OA1%-30min; (B) OA1%-60min; (C) OA2%-30min; (D) OA2%-60min; (E) AC25%-30min; (F) AC25%-60min; (G) AC30%-30min; (H) AC30%-60min.
Figure 4.
SEM images of recycled particles obtained by acid hydrolysis. (A) OA1%-30min; (B) OA1%-60min; (C) OA2%-30min; (D) OA2%-60min; (E) AC25%-30min; (F) AC25%-60min; (G) AC30%-30min; (H) AC30%-60min.
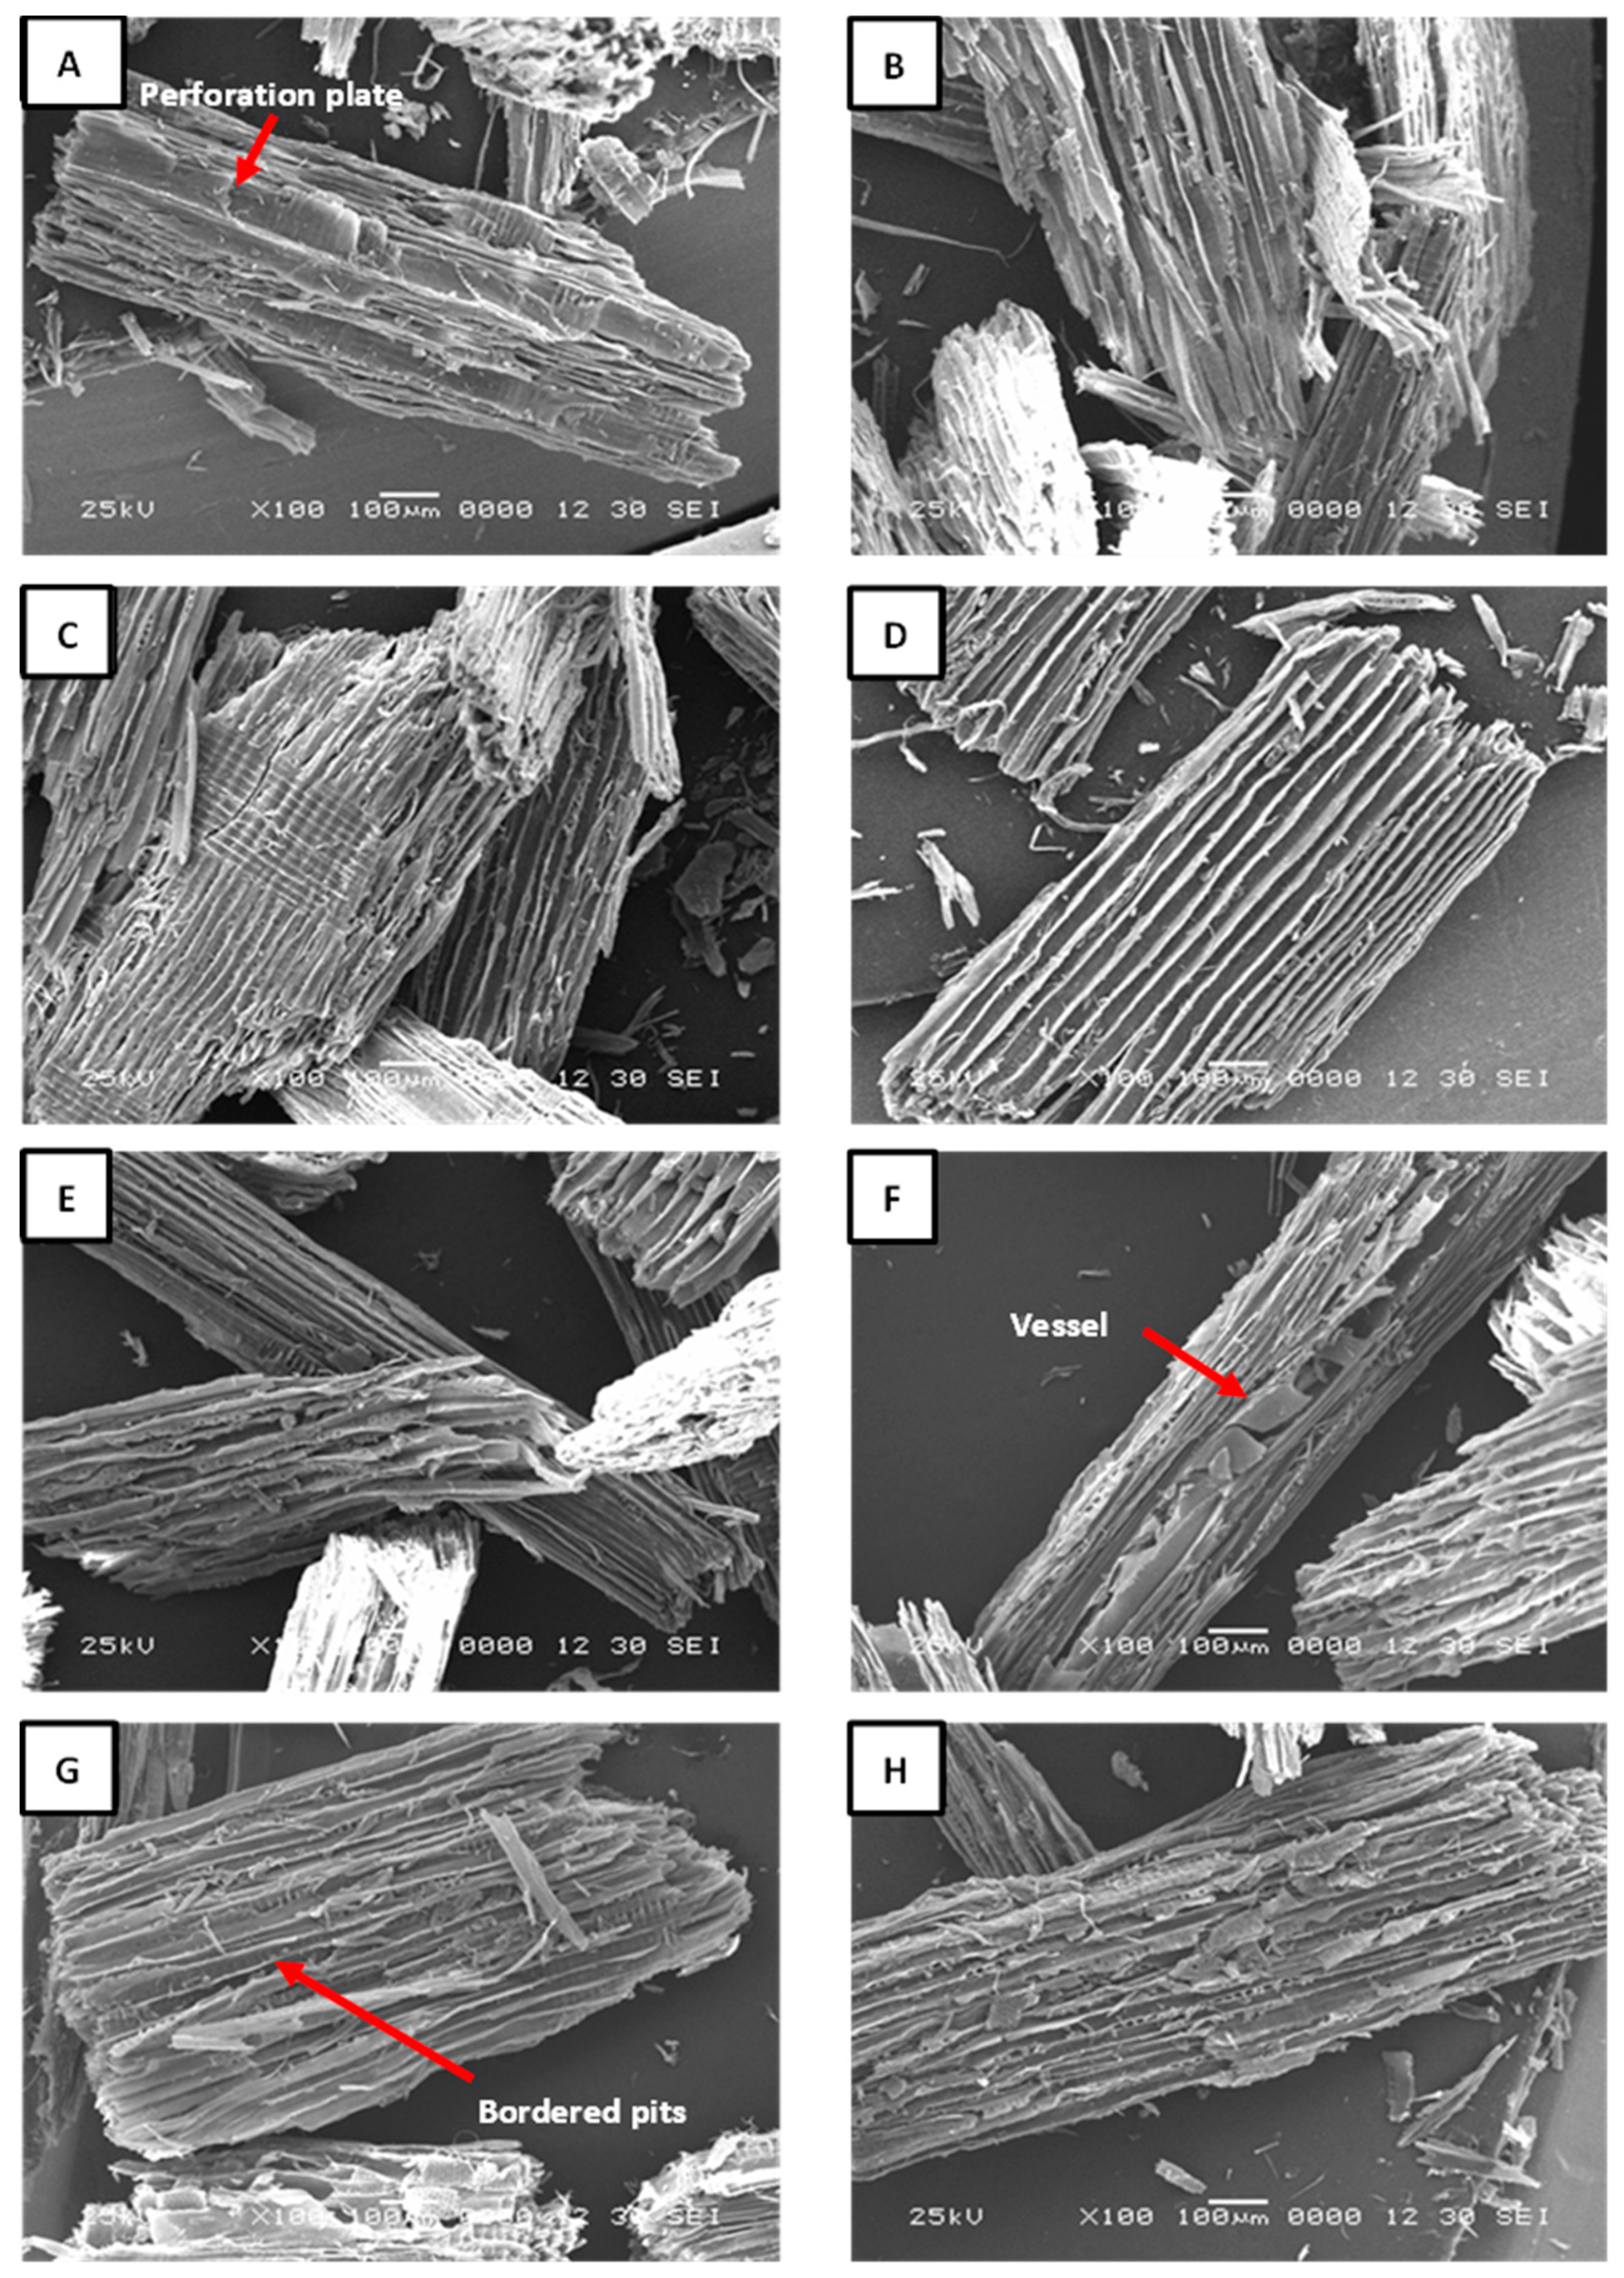
Figure 5.
Nitrogen content of the virgin particles, the raw board particles, and the recycled particles from various hydrolysis conditions. Means with the same letter are not statistically different by Tuckey’s test.
Figure 5.
Nitrogen content of the virgin particles, the raw board particles, and the recycled particles from various hydrolysis conditions. Means with the same letter are not statistically different by Tuckey’s test.
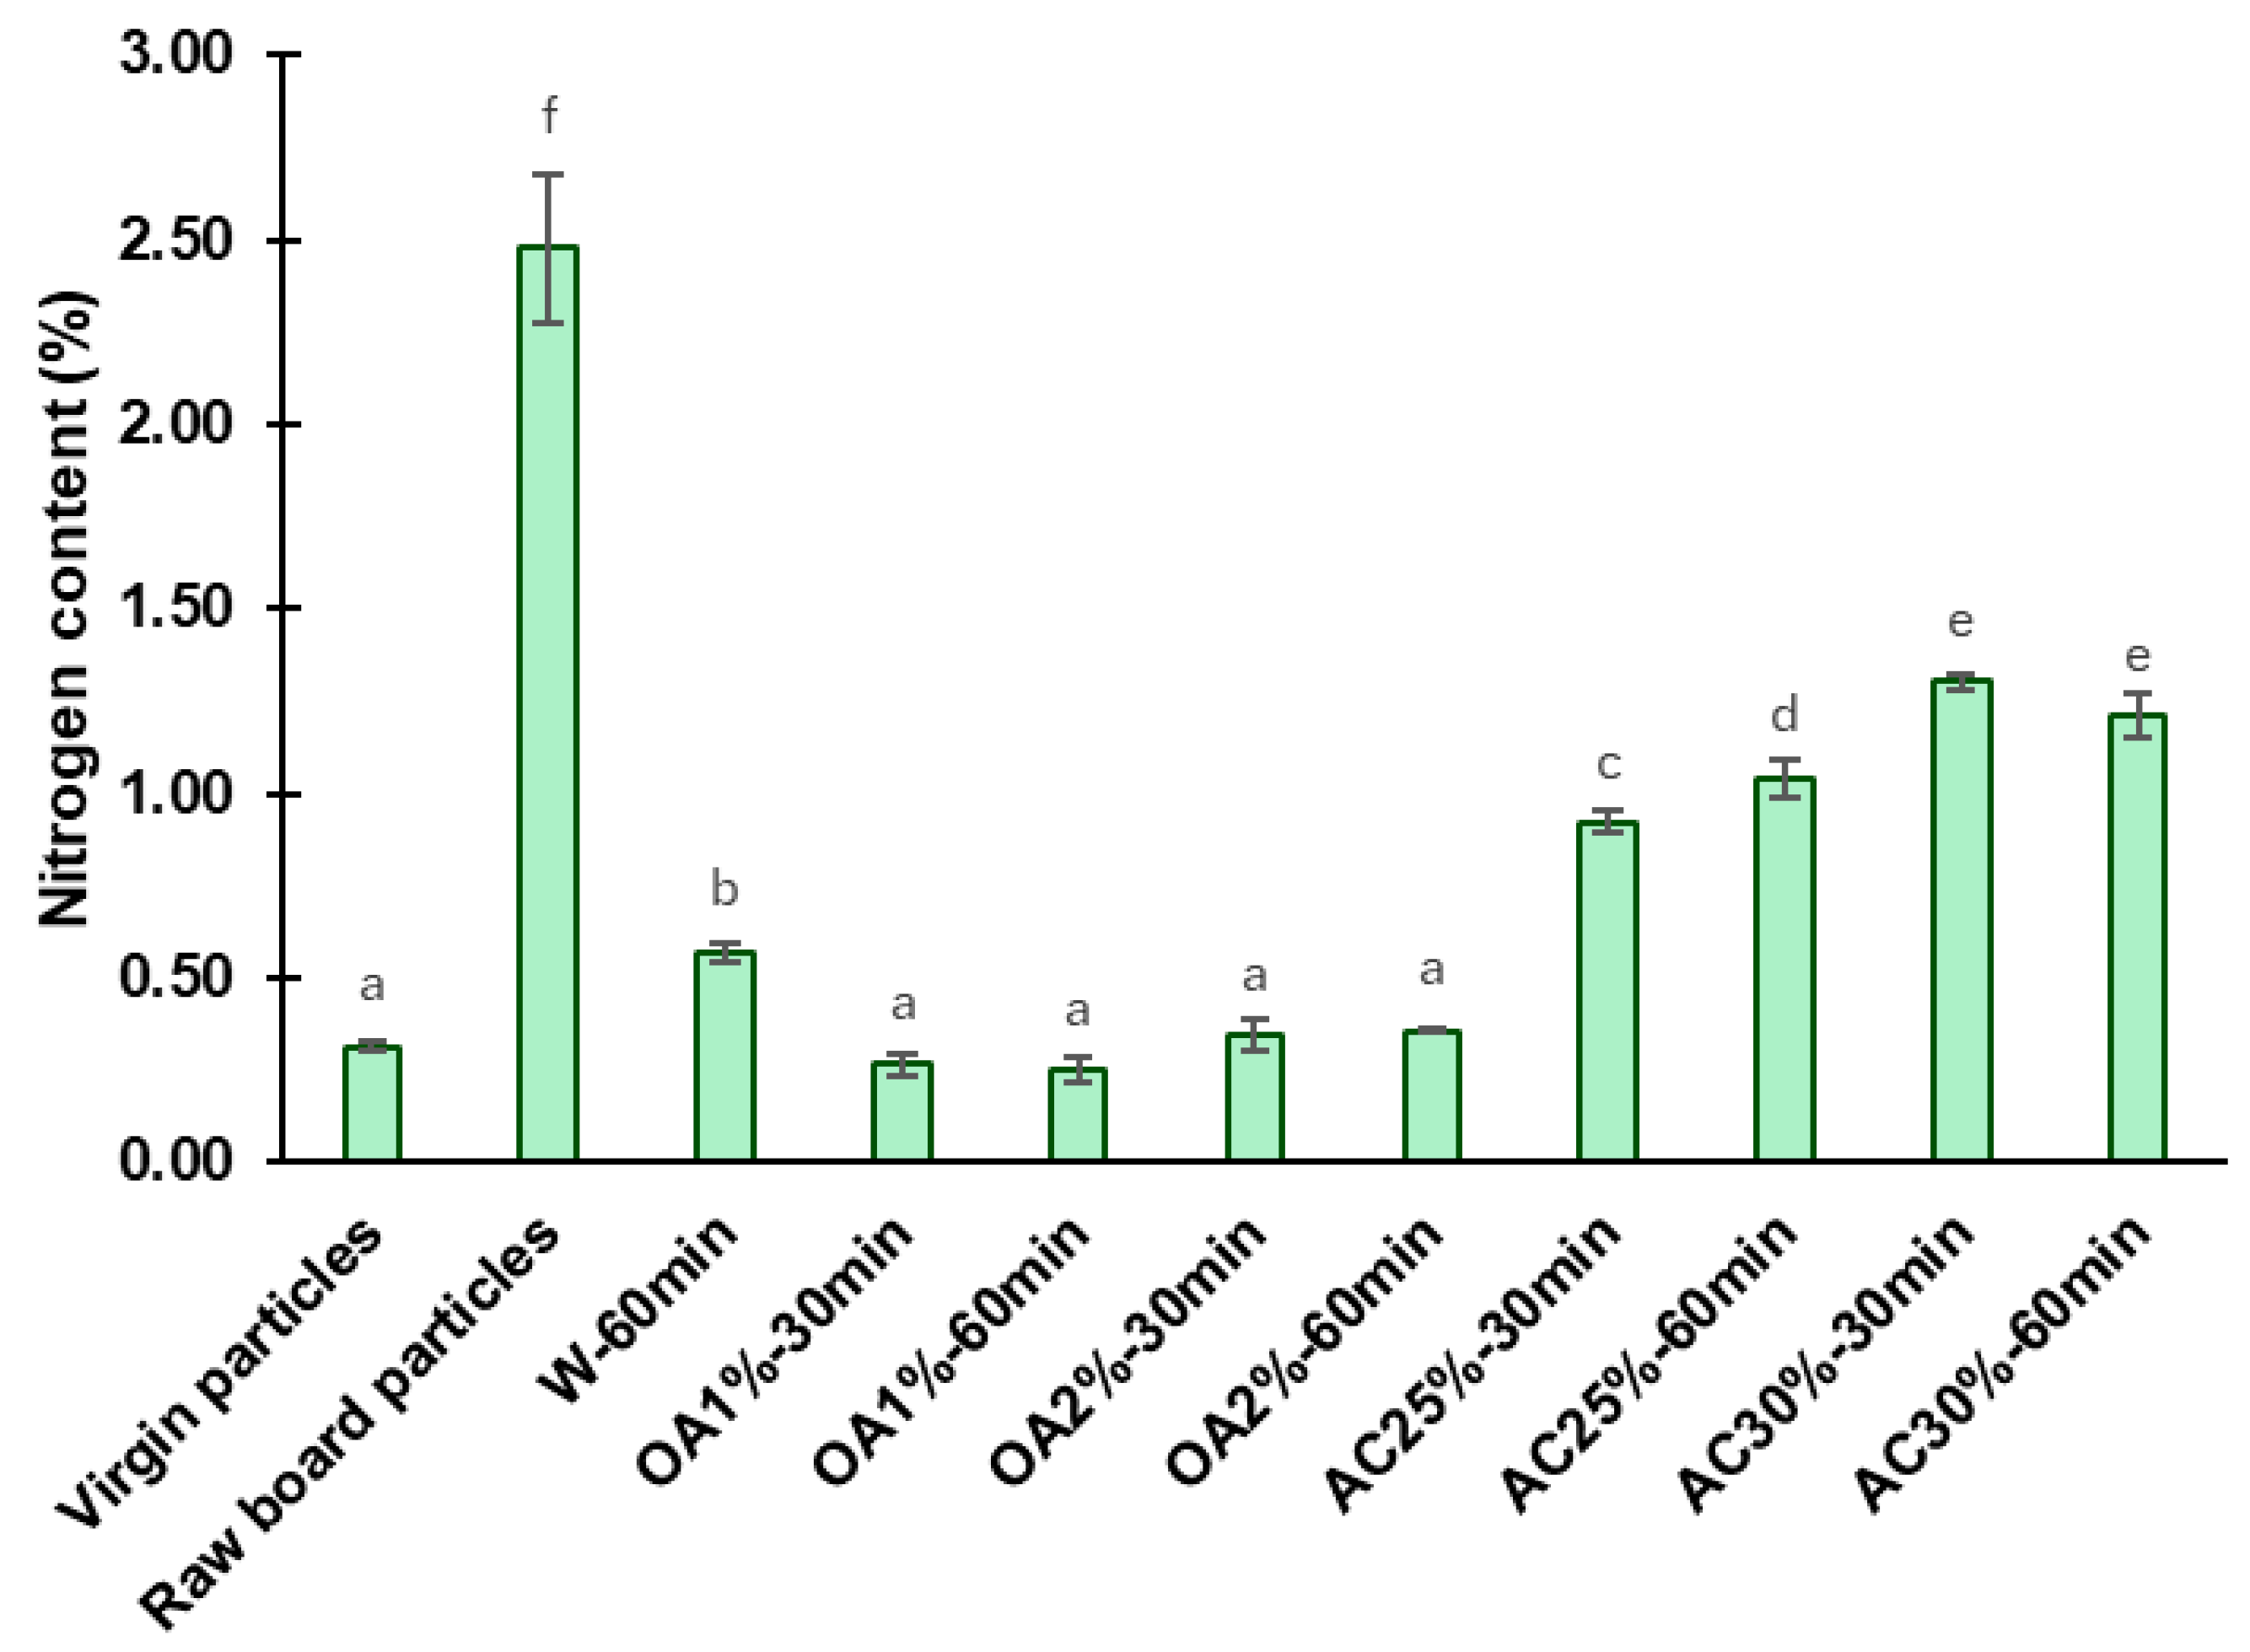
Figure 6.
Differential scanning calorimetry curves for the curing of pure UF adhesive and UF adhesive mixed with the recycled particles.
Figure 6.
Differential scanning calorimetry curves for the curing of pure UF adhesive and UF adhesive mixed with the recycled particles.
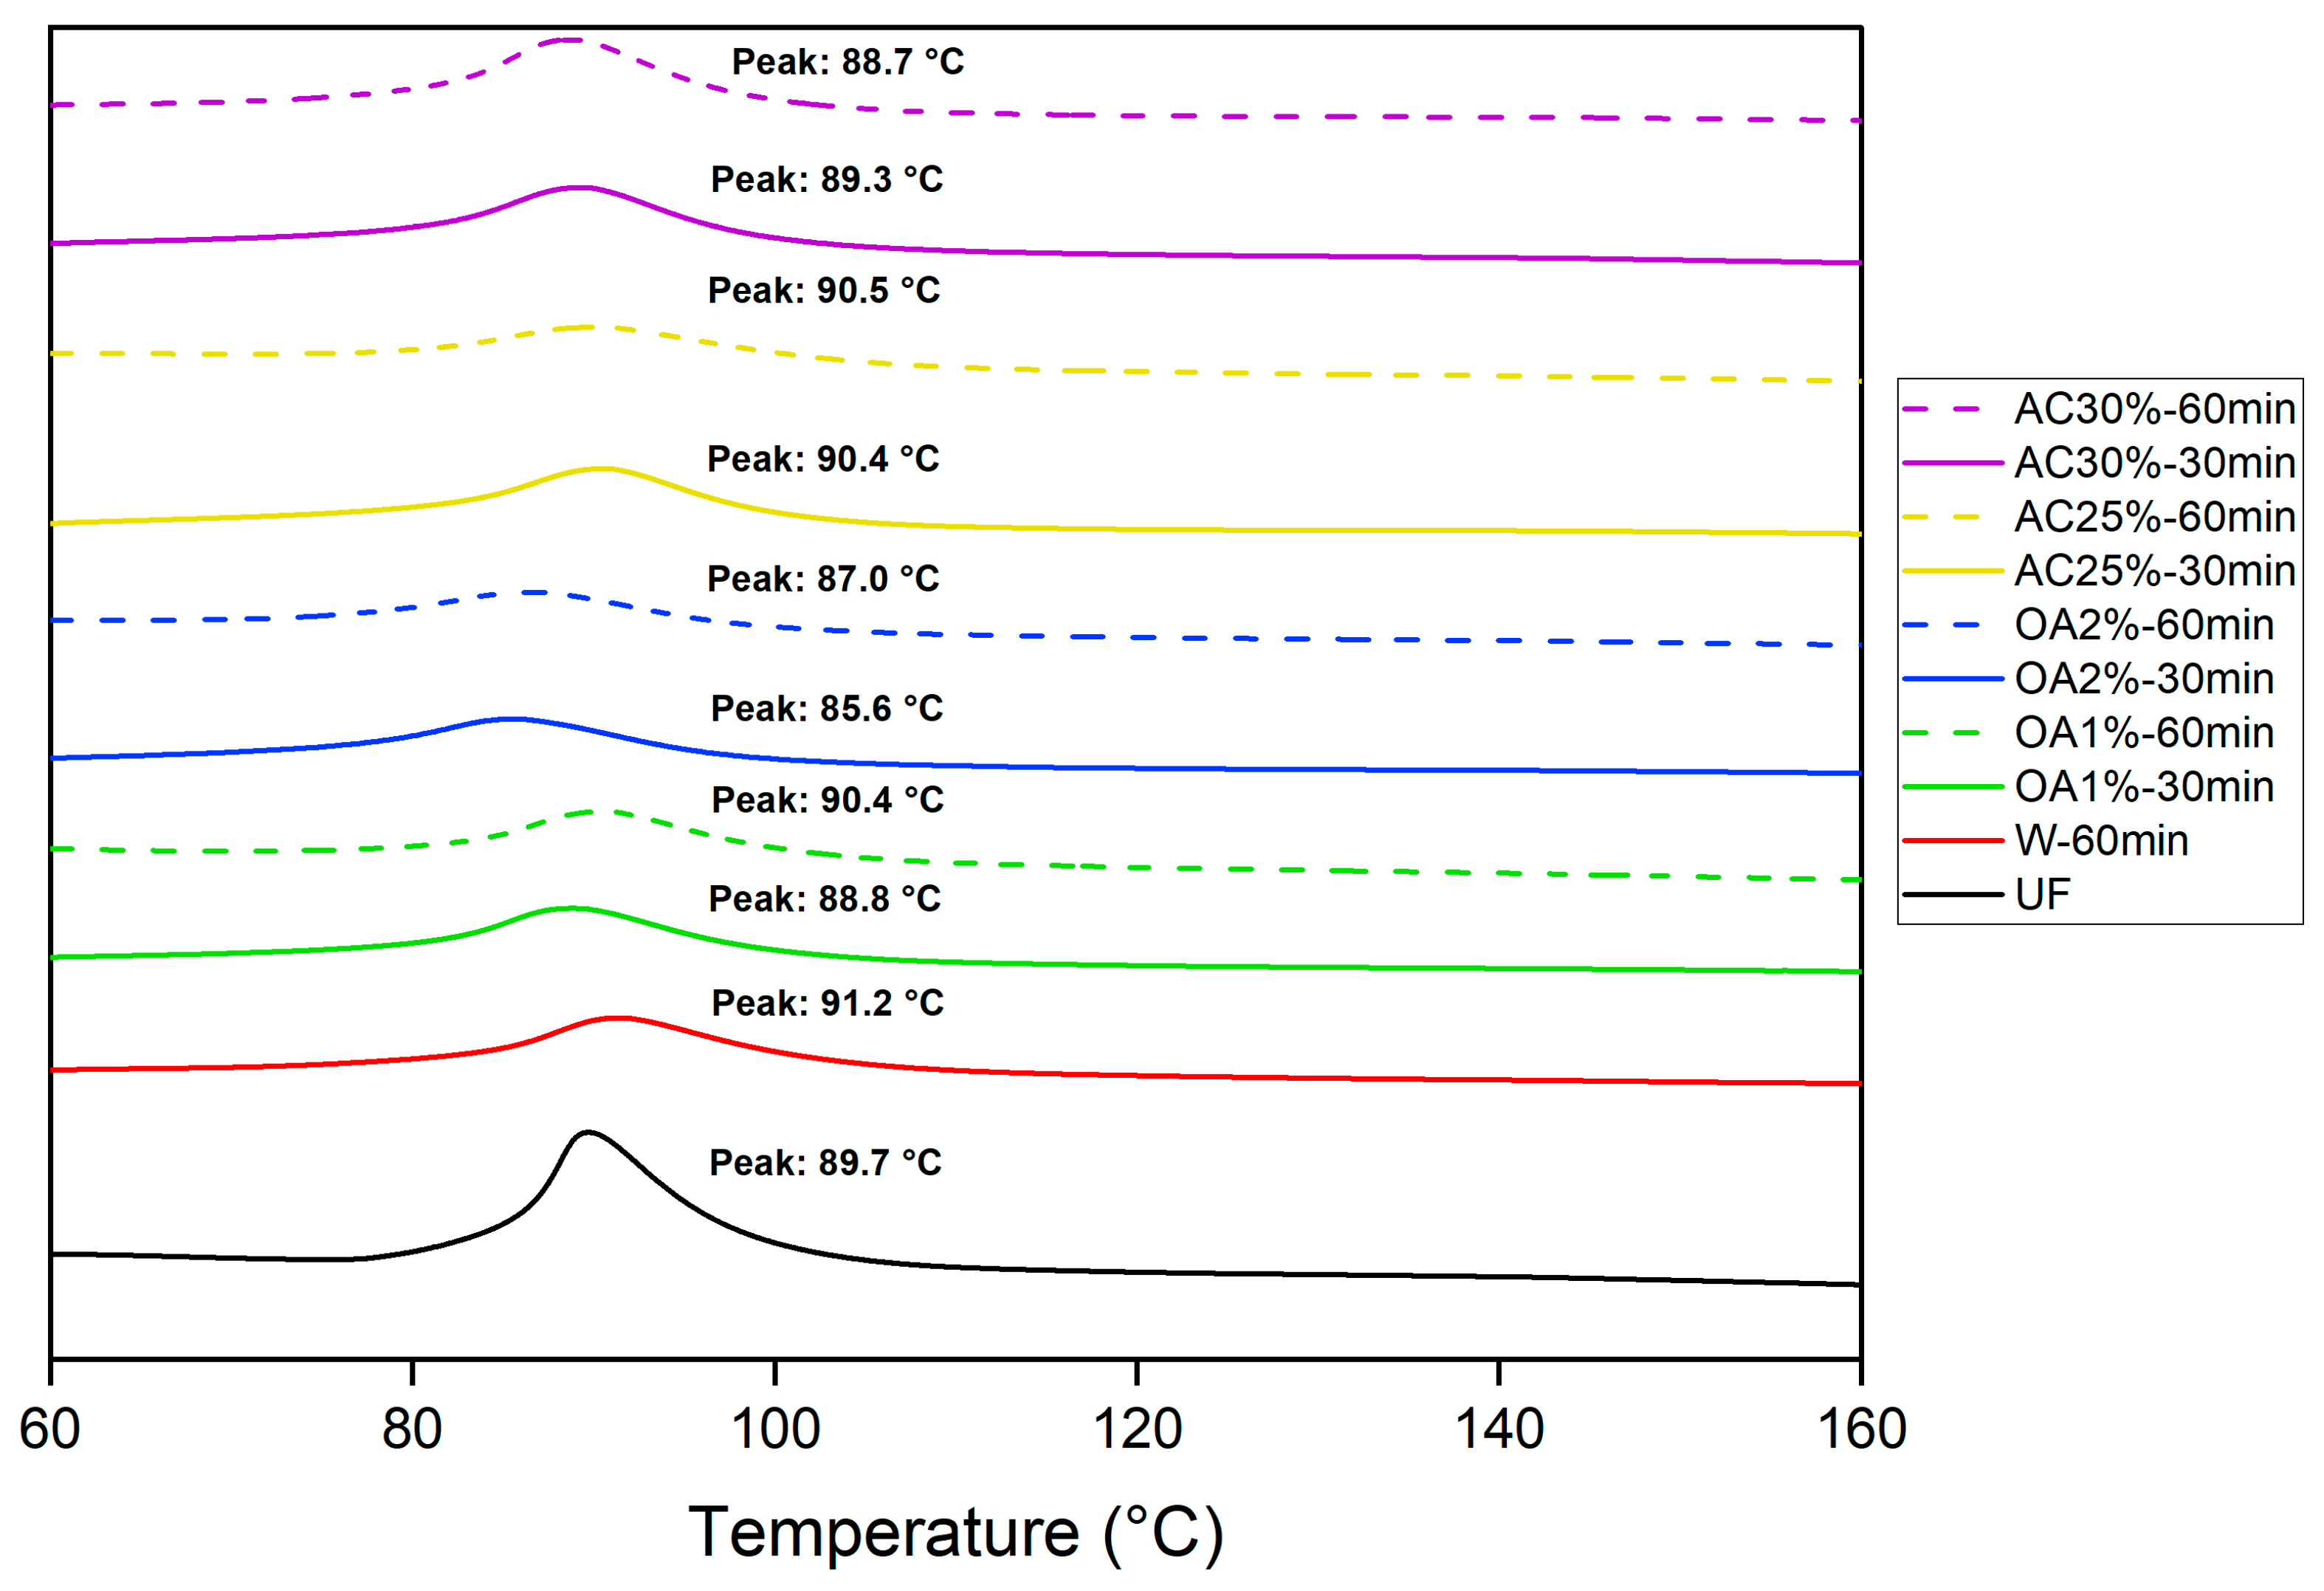
Figure 7.
Influence of the recycled particles on the gel time of UF adhesive. Means with the same letter are not statistically different by Tuckey’s test.
Figure 7.
Influence of the recycled particles on the gel time of UF adhesive. Means with the same letter are not statistically different by Tuckey’s test.
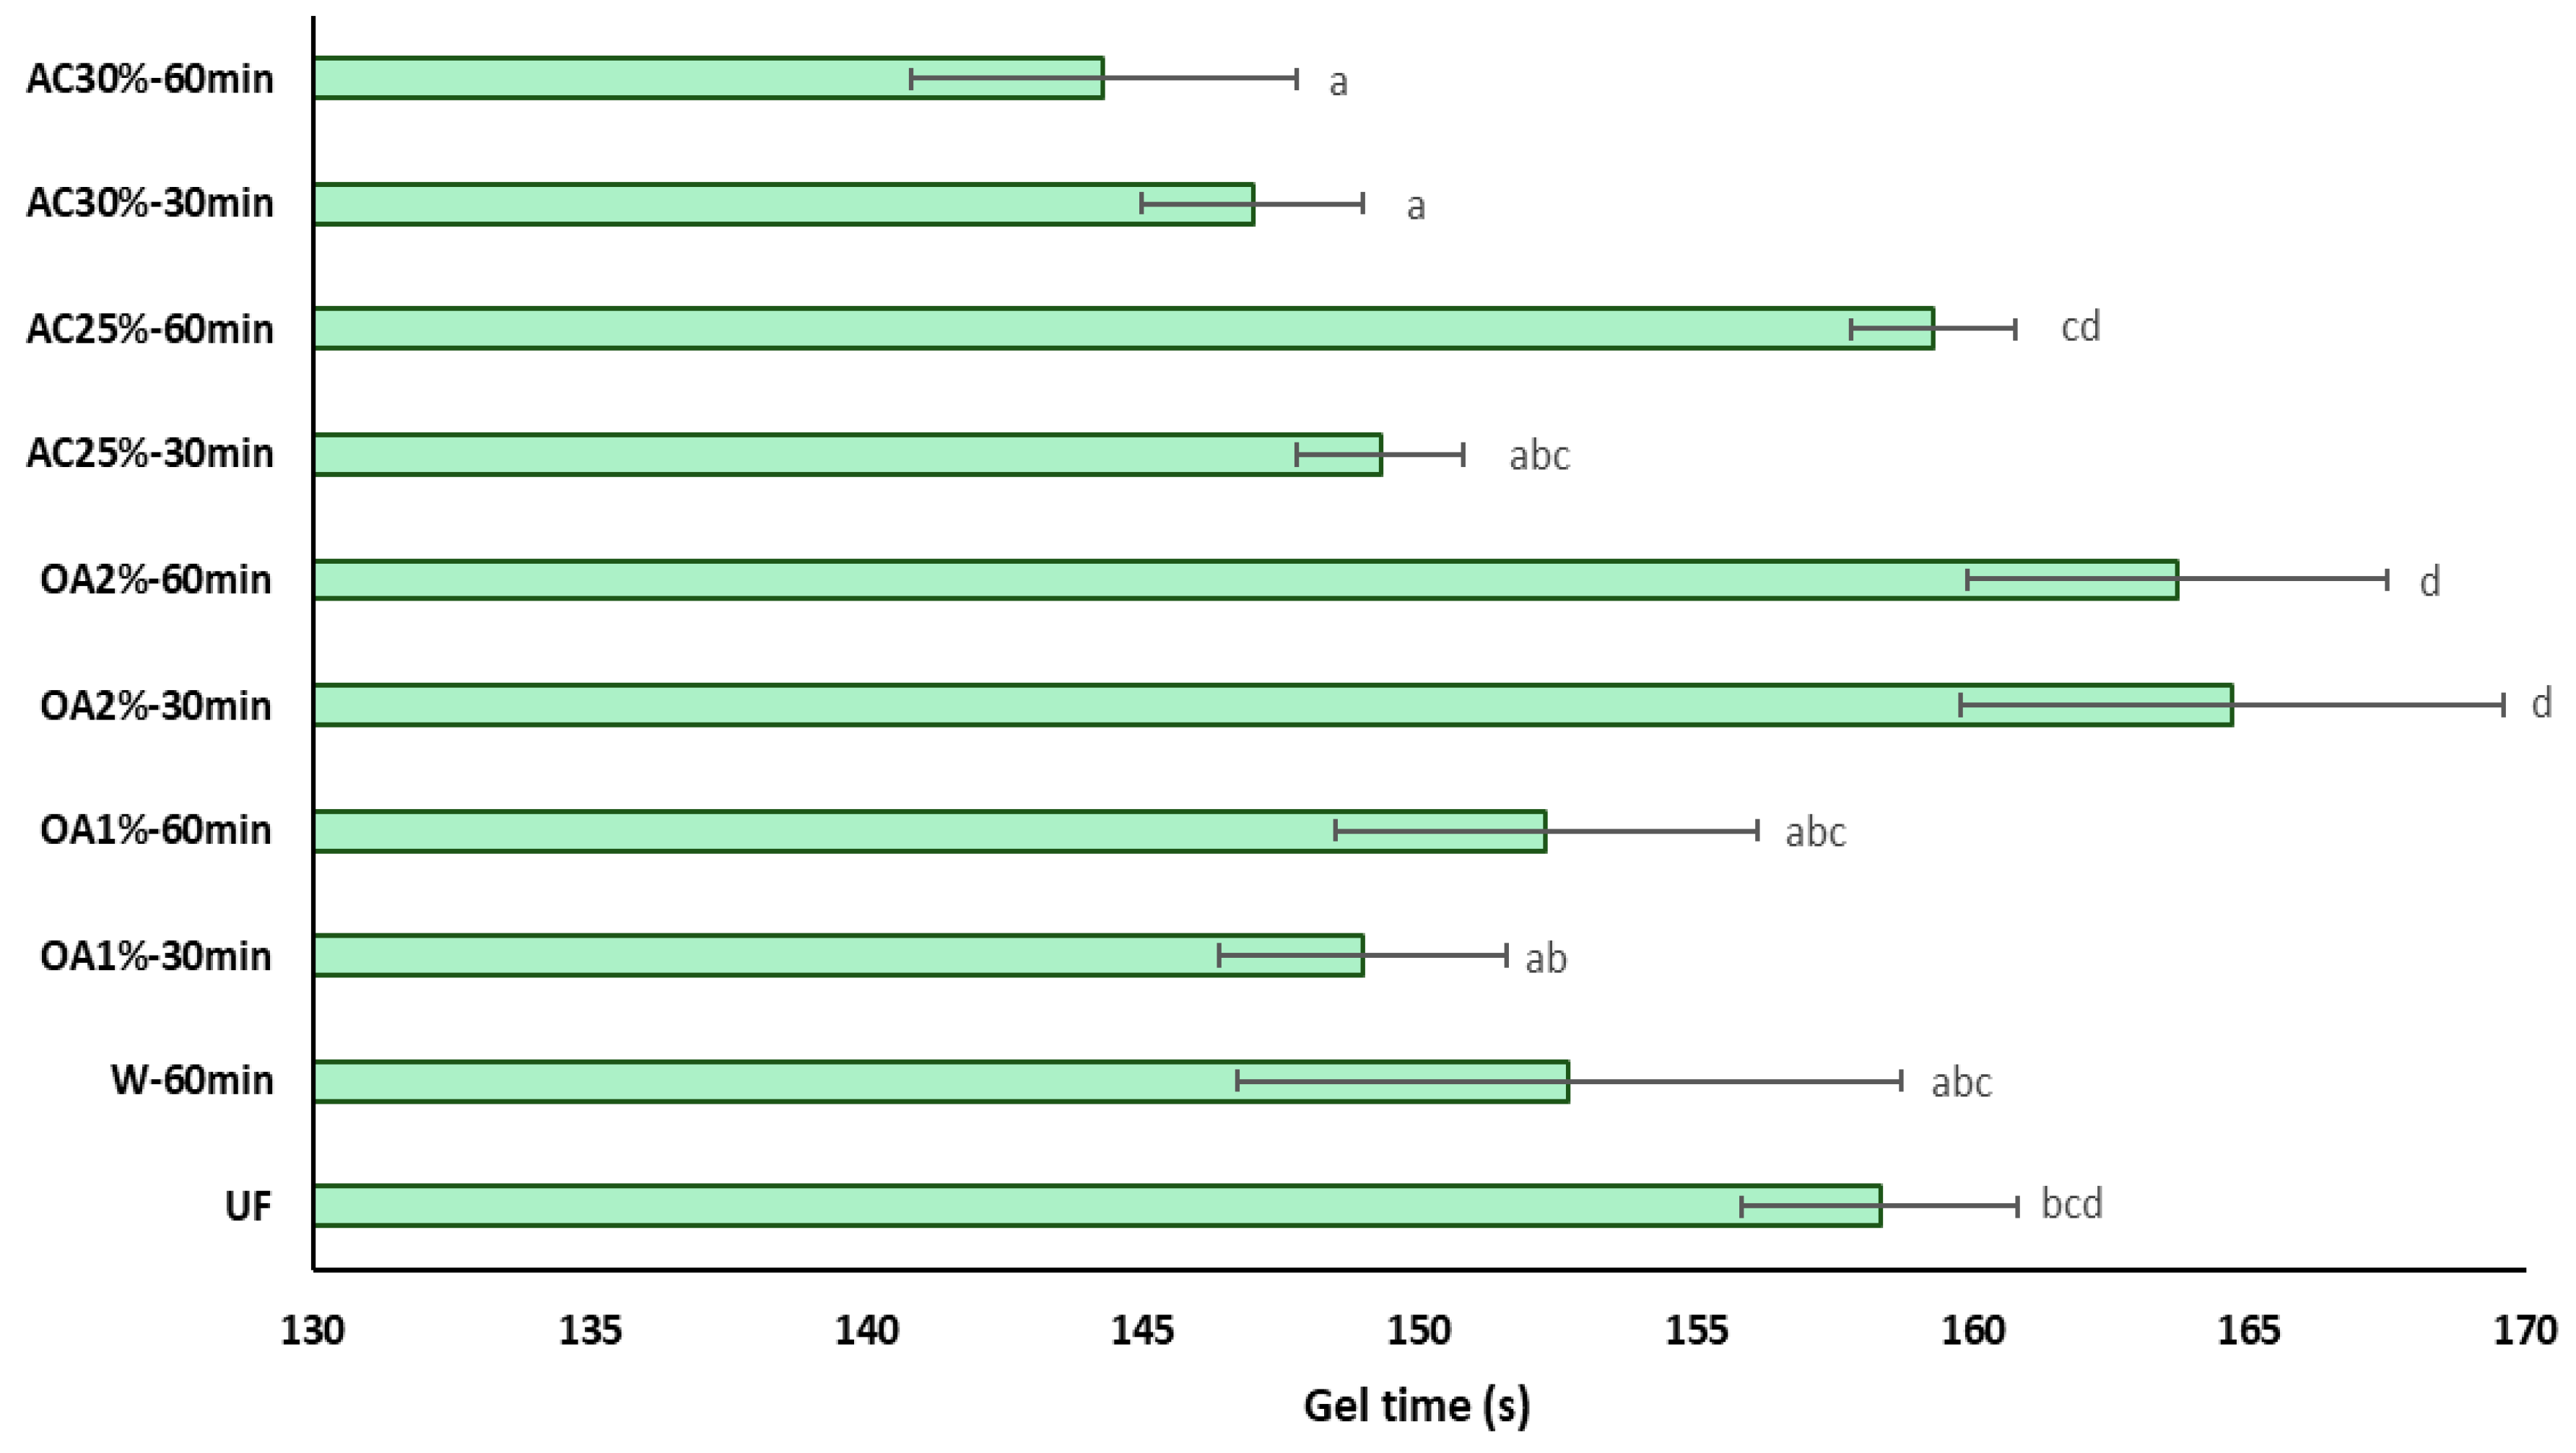

Table 1.
Water and acid hydrolysis treatments applied.
| Treatment code | Treatment | Acid solution concentration (%) | Reaction time (min) |
|---|---|---|---|
| W-60 | Water | - | 60 |
| OA1%-30min | Oxalic acid | 1 | 30 |
| OA1%-60min | Oxalic acid | 1 | 60 |
| OA2%-30min | Oxalic acid | 2 | 30 |
| OA2%-60min | Oxalic acid | 2 | 60 |
| AC25%-30min | Ammonium chloride | 25 | 30 |
| AC25%-60min | Ammonium chloride | 25 | 60 |
| AC30%-30min | Ammonium chloride | 30 | 30 |
| AC30%-60min | Ammonium chloride | 30 | 60 |
Table 2.
Summary of results of factorial ANOVA for chemical properties with F-values and p-values obtained for acid type, concentration, reaction time, and their interaction.
Table 2.
Summary of results of factorial ANOVA for chemical properties with F-values and p-values obtained for acid type, concentration, reaction time, and their interaction.
| Variation source | Nitrogen content | pH | Base buffer capacity | Gel time |
|---|---|---|---|---|
| Type of acid (A) | 2732.8 (<2.2x10⁻¹⁶ *) |
822.9 (< 2.2x10⁻¹⁶ *) | 9180.5(< 2.2x10⁻¹⁶ *) | 32.6 (3.2x10⁻⁵ *) |
| Concentration (C) | 138.3 (2.8x10⁻⁹ *) |
441.5 (< 2.2x10⁻¹⁶ *) | 1098.1(< 2.2x10⁻¹⁶ *) | 3.5 (8.1x10⁻²) |
| Reaction time (T) | 0.2 (6.7x10⁻¹) |
56.6 (4.8x10⁻¹⁰ *) | 35.6(3.7x10⁻⁶ *) | 3.5 (8.1x10⁻²) |
| (A x C) | 34.6 (2.3x10⁻⁵ *) |
101.7 (3.4x10⁻¹⁴ *) |
902.5 (< 2.2x10⁻¹⁶ *) |
72.8 (2.4x10⁻⁴ *) |
| (A x T) | 0.3 (6.0x10⁻¹) |
357.7 (< 2.2x10⁻¹⁶ *) |
35.0 (4.2x10⁻⁶ *) |
0.9 (3.5x10⁻¹) |
| (C x T) | 9.0 (8.5x10⁻³ *) |
7.5 (8.2x10⁻³ *) |
357.9 (6.3x10⁻¹⁶ *) |
10.7 (4.7x10⁻³ *) |
| (A x C x T) | 15.6 (1.1x10⁻³ *) |
27.6 (2.4x10⁻⁶ *) |
484.7 (<2.2x10⁻¹⁶ *) |
2.6 (1.2x10⁻¹) |
Values in parentheses are the p-values. The * represents the significant differences, where the p-value is less than 0.05.
Table 3.
pH levels of virgin particles, raw board particles, and recycled particles from various hydrolysis conditions.
Table 3.
pH levels of virgin particles, raw board particles, and recycled particles from various hydrolysis conditions.
| Virgin particles | Raw board particles | W-60min | OA1%-30min | OA1%-60min | OA2%-30min | OA2%-60min | AC25%-30min | AC25%-60min | AC30%-30min | AC30%-60min |
|---|---|---|---|---|---|---|---|---|---|---|
| 5.25h | 5.37i | 5.89j | 3.86f | 4.14g | 3.28c | 3.46e | 3.38d | 3.17b | 3.34cd | 3.00a |
| (1.09) | (1.01) | (1.24) | (3.19) | (3.54) | (1.50) | (1.42) | (1.15) | (1.59) | (1.25) | (0.29) |
Values in parentheses represent the coefficient of variation (%). Means that share the same letter are not statistically different according to Tukey’s test.
Table 4.
Acid/base buffer capacity of virgin particles, raw board particles, and recycled particles from various hydrolysis conditions.
Table 4.
Acid/base buffer capacity of virgin particles, raw board particles, and recycled particles from various hydrolysis conditions.
| Buffer Capacity |
Virgin particles | Raw board particles | W-60min | OA1%-30min | OA1%-60min | OA2%-30min | OA2%-60min | AC25%-30min | AC25%-60min | AC30%-30min | AC30%-60min |
|---|---|---|---|---|---|---|---|---|---|---|---|
| Acid (mmol) | 0.223e (3.2) | 0.238e (0.5) | 0.211de (9.5) | 0.158c (16.6) | 0.171cd (19.4) | 0.083ab (6.9) | 0.107b (18.4) | 0.068a (16.7) | 0.055a (17.9) | 0.057a (14.6) | 0* (0) |
| Base (mmol) | 0.341b (7.3) | 0.407b (2.0) | 0.159a (16.6) | 0.493c (11.7) | 0.550cd (7.1) | 0.610d (2.0) | 0.550cd (7.1) | 2.266f (4.4) | 1.266e (2.0) | 2.687g (1.0) | 3.236h (2.2) |
Values in parentheses are the coefficient of variation (%). Means with the same letter are not statistically different by Tuckey’s test. * Excluded from the analysis because all results were 0.
Disclaimer/Publisher’s Note: The statements, opinions and data contained in all publications are solely those of the individual author(s) and contributor(s) and not of MDPI and/or the editor(s). MDPI and/or the editor(s) disclaim responsibility for any injury to people or property resulting from any ideas, methods, instructions or products referred to in the content. |
© 2025 by the authors. Licensee MDPI, Basel, Switzerland. This article is an open access article distributed under the terms and conditions of the Creative Commons Attribution (CC BY) license (http://creativecommons.org/licenses/by/4.0/).
Copyright: This open access article is published under a Creative Commons CC BY 4.0 license, which permit the free download, distribution, and reuse, provided that the author and preprint are cited in any reuse.


