Submitted:
17 April 2025
Posted:
17 April 2025
You are already at the latest version
Abstract
This paper presents a novel approach to streamline, analyze, and visualize long-term planning simulation results using a large language model (LLM). We discuss the design, implementation, and performance of GridCoPilot - a first o f its kind tool developed using ChatGPT - to analyze and visualize data from PCM simulations of long term planning studies. Grid Copilot processes PCM data generating concise textual summaries and context-aware visualizations, providing users with comprehensive insights. By automating data processing and visualization tasks, Grid Copilot significantly r educes t he t echnical b arriers t o data analysis for long term planning studies. This enhancement can allow analysts, and policymakers to focus on interpreting results and making informed decisions, rather than grappling with data manipulation and visualization code.
Keywords:
Decarbonization
; Large language model
; Longterm planning
; Production cost modeling
I. Introduction
Analysis and projections of future infrastructure systems, particularly the electric grid, are crucial for utilities and planners to develop efficient i nfrastructure and make prudent investment decisions.. For policy makers, these projections are important to assess the impacts of policy decisions, technology developments to ensure a secure economic future. In the electric grid context, such projections are widely studied in the industry through creating postulated future scenarios and simulating it resource planning studies [1]. Tools such as capacity expansion, transmission expansion, and production cost modeling (PCM) are used for conducting resource planning studies to ascertain adequate generation for the projected demand.
In this paper, we restrict our focus to production cost modeling (PCM), though any of the other tools can be easily adapted. PCM [2,3] simulations are used for planning studies over longer horizons. Typically, such simulations have hourly resolution for an entire year. These simulations include unit commitment (UC) and economic dispatch (ED) models that minimizes power systems’ operating costs of meeting electricity demand and reserve requirements while simultaneously satisfying a wide variety of operating constraints from capacity limits to flow constraints (depending on the complexity, fidelity, and simulation time requirements). Each such an entire year simulation is a single scenario (for e.g. 50% renewable energy target) and many such scenarios are typically studied.
As such, PCM simulations produce voluminous data that need to be stored, organized, and analyzed to assist in addressing important stakeholder decision making questions, for example “Are decarbonization goals creating reliability issues” or “What is the reduction in power outages as a result of installing new technology.” These big PCM simulation result data sets typically need customized software/scripts for analysis needing intensive manual labor and are extremely time-consuming. As such, the scope of analysis is kept limited because of the inability to easily access and manipulate the data. This significant extra time spent on analysis could be rather used to generate more possible futures, but unfortunately it is not the case currently. The processing, analysis, and extraction of meaningful patterns from these extensive datasets necessitates substantial time and resources from data analysts and policymakers, often diverting attention from the core task of deriving actionable insights.
Conventionally, data analysts have relied on standard data science tools and methodologies [4], such as Python and SQL, for ETL (Extract, Transform, Load) pipelines and manipulation of power grid datasets. Visualization systems including Matplotlib, Seaborn, Plotly, and D3.js [5] are widely employed to present power grid data in an intuitive and comprehensible format. While these tools offer considerable power and flexibility, they present a steep learning curve for individuals whose primary expertise lies outside the realms of data science and programming. Moreover, the process of coding for data extraction and visualization creation can be time- consuming and complex, often requiring iterative refinement and debugging.
A. Research Novelty and Contributions
We present a novel large language powered (LLM) chat framework – Grid Copilot – designed to facilitate user-friendly efficient interactive analysis and visualization of PCM results. Grid Copilot provides a conversational interface that accepts natural language queries (in English) about PCM datasets and automatically generates visualizations, textual summaries, and tabular data. This approach significantly reduces the barrier to entry for complex data analysis tasks, allowing users to focus on result interpretation rather than grappling with data manipulation and visualization code.
Grid Copilot has been developed and tested on PCM results generated using GridView software [6]. The data analyzed with Grid Copilot consists of PCM simulations of future grid decarbonization scenarios each for an entire year with hourly resolution. Such simulations produce detailed temporal grid information including generation-load profiles, transmission line flows, and other operational aspects. Each simulation data set (scenario) is roughly between 2 – 4 GB. The novel Grid Copilot tool allows an analyst to query the massive data set through a question-answering (chat) interaction, enabling users to efficiently extract relevant information without necessitating extensive programming knowledge [7]. This is complemented by the incorporation of automated recommendations and generation of visualizations into the system’s responses, pro- viding intuitive visual representations of complex data patterns. Furthermore, we propose a system architecture and workflow that demonstrates significant potential for adaptability and application to a wide range of intelligent systems utilizing LLMs in the domain of sustainable societies [8].
II. Large Language Models
Large Language Models (LLMs) represent a transformative advancement in artificial intelligence technology that has emerged as a powerful tool for processing and generating human-like text. These models are built upon the transformer architecture [9], which revolutionized natural language process- ing through its innovative attention mechanism. In the context of power systems analysis, LLMs serve as an intermediary layer that bridges the gap between complex technical data and human operators/analysts, enabling more intuitive interaction with sophisticated analysis tools.
The fundamental architecture of LLMs is based on the transformer model [9], which employs an attention mechanism to process input text by understanding the relationships and dependencies between words in a sequence. This capability has been significantly enhanced through successive generations of models, culminating in advanced systems like GPT-4 [10] that demonstrate unprecedented natural language understanding and generation abilities. In power systems applications, where context is crucial for interpreting queries about complex grid operations, these advances enable more sophisticated analysis and interaction patterns.
LLMs have demonstrated remarkable capabilities in technical domains [11], with applications ranging from code generation to complex reasoning tasks. Their ability to understand and pro- cess domain-specific language has been particularly valuable in industrial applications, where they can bridge the gap between technical complexity and user accessibility. While these models have shown impressive capabilities in technical domains, they serve as assistive technologies requiring validation for critical grid operations. The application of LLMs through Grid Copilot enhances the efficiency of power systems analysis, particularly in long-term planning and production cost modeling where rapid exploration of large datasets is essential for decision- making.
III. Grid Copilot Architecture and Data Flow
The system architecture of Grid Copilot, as illustrated in Figure 1, is predicated on an ensemble of state-of-the- art technologies and frameworks, meticulously integrated to provide a seamless user experience. At its core, Grid Copilot utilizes GPT-4o [12] for natural language processing and generation, enabling accurate interpretation of user queries and generation of contextually relevant responses. LangChain [13] manages the interaction between components and the LLM. This design is an extension of our previous work on ChatGridTM – power grid visualization using LLMs for grid operations [14].
Grid Copilot’s functionality is primarily divided into two key components: NL2SQL for data retrieval and text summarization, and NL2VIS for automated visualization generation. These components work in tandem to address the challenges of working with large-scale power grid datasets.
A. Natural Language to SQL (NL2SQL)
The NL2SQL component addresses several critical chal- lenges inherent in working with large-scale power grid datasets. Primarily, it facilitates the efficient selection and retrieval of relevant data subsets from massive temporal power grid datasets, ensuring that only pertinent information is processed. This selective approach not only enhances computational efficiency but also contributes to maintaining data privacy and security [15] by keeping the dataset in a local database.
The NL2SQL process begins by establishing a connection to the database and retrieving the schema, tables, and attribute information. This database description then transmits to the LLM, which is prompted to generate syntactically correct SQL clauses to answer the user’s questions based on the provided table and attribute names and their semantic meanings. We utilize modified SQL prompt templates from LangChain [16] to ensure the generated queries are syntactically correct and optimized for performance.
The interaction between various components and the LLM is managed by LangChain [13], an auxiliary framework that streamlines the setup of actions and steps for LLM-based applications. Following the execution of the SQL query and data retrieval, only aggregated results are sent to the LLM for generating concise text summaries, which are then displayed in the conversation window. This approach enhances data privacy in sensitive scenarios.
B. Natural Language to Visualization (NL2VIS)
Building upon the data retrieved by the NL2SQL component, the NL2VIS component automates the generation of visualiza- tions to highlight data patterns effectively. The visualization capabilities of Grid Copilot are powered by Vega-Lite [17], a high-level grammar of interactive visualizations that enables concise, declarative specifications of a wide range of charts and graphs. Recent works [18,19,20,21,22] have demonstrated the capability of LLMs in generating Vega-Lite specifications for visualization recommendations and authoring. We follow this strategy to use LLM to generate valid visualization specifications in Vega-Lite based on input data entries and natural language queries.
To ensure adherence to best practices in data visualization and effective communication of data insights, we incorporate NL4DV [23], a toolkit for visualization recommendation that suggests appropriate chart types based on data characteristics and analytical tasks. This includes the use of line charts for temporal data, histograms for distributions, scatter plots for correlations, and bar charts for sorted results. For geospatial visualization and complex, highly customized visualizations that require specific libraries and features beyond Vega-Lite’s capabilities, we employ Deck.gl [24], an open-source package that facilitates efficient rendering of large-scale geospatial datasets. This allows for the creation of animated maps that dynamically update in response to user queries, visually representing time series changes in an intuitive and engaging manner. Through this combination of NL2SQL and NL2VIS components, Grid Copilot enables users to perform sophisti- cated analyses and generate insightful visualizations without requiring extensive knowledge of database query languages or complex programming skills.
IV. Grid Copilot Demonstration
We demonstrate Grid Copilot’s capabilities using datasets from the Pacific Northwest National Laboratory’s (PNNL) Grid Operations, Decarbonization, Environmental and Energy Equity Platform (GODEEEP) initiative. These datasets, comprising 2-3 gigabytes of data, provide high-resolution, multi-year projections of decarbonization scenarios for the western U.S. power system. Encompassing information on 5,383 generation plants across 13 western states, the data details various energy production technologies [25] and their respective generation capacities. The inclusion of hourly generation, load, and transmission flows enables comprehensive analysis of complex,large-scale power system scenarios, showcasing Grid Copilot’s ability to process and interpret intricate temporal and spatial power grid data. We present a couple of user interaction querries next and their results presented by Grid Copilot.
A. Power Generation Analysis Query
In this use case, a user queries, "Show me the amount of power generation by energy type across states." Grid Copilot responds with a multi-step process that showcases its analytical and visualization capabilities. Initially, the system generates SQL query to aggregate power generation data by both energy type and state. Upon data retrieval, Grid Copilot uses an LLM to create a concise yet informative text summary of the numeric results, presenting key findings in natural language that is readily understandable to the user. The system then enhances this textual response with a visual representation, plotting the generation plants on an interactive map. Colors are used to indicate different energy types, while the height of bars represents the power generation capacity of each plant on the map. This geospatial representation allows users to quickly grasp spatial distribution of energy production with underlying geography as shown in Figure 2. To further aid in comparative analysis, Grid Copilot suggests and generates a stacked bar chart to compare the power generation breakdown by energy type across different states. This visualization approach effectively highlights energy distribution patterns, such as the predominance hydroelectric power in Washington.
B. Temporal Generation Pattern Analysis
The second use case demonstrates Grid Copilot’s ability to analyze temporal generation patterns. When prompted with "Show me the power generation changes in California during the first two days of January 2040," Grid Copilot first creates an animated map display of temporal changes, complete with a playback slider that allows users to observe power generation fluctuations over time. This dynamic visualization is complemented by a line chart that provides an overview of generation fluctuations throughout the specified period as shown in Figure 3. These visualizations reveal characteristic patterns of different generation types, including diurnal cycles of solar and hydro power, and the variable nature of wind generation. This comprehensive visual representation allows users to identify trends, anomalies, and patterns in power generation that might be difficult to discern from raw data.
C. User-Driven Visualization Generation in GridCoPilot
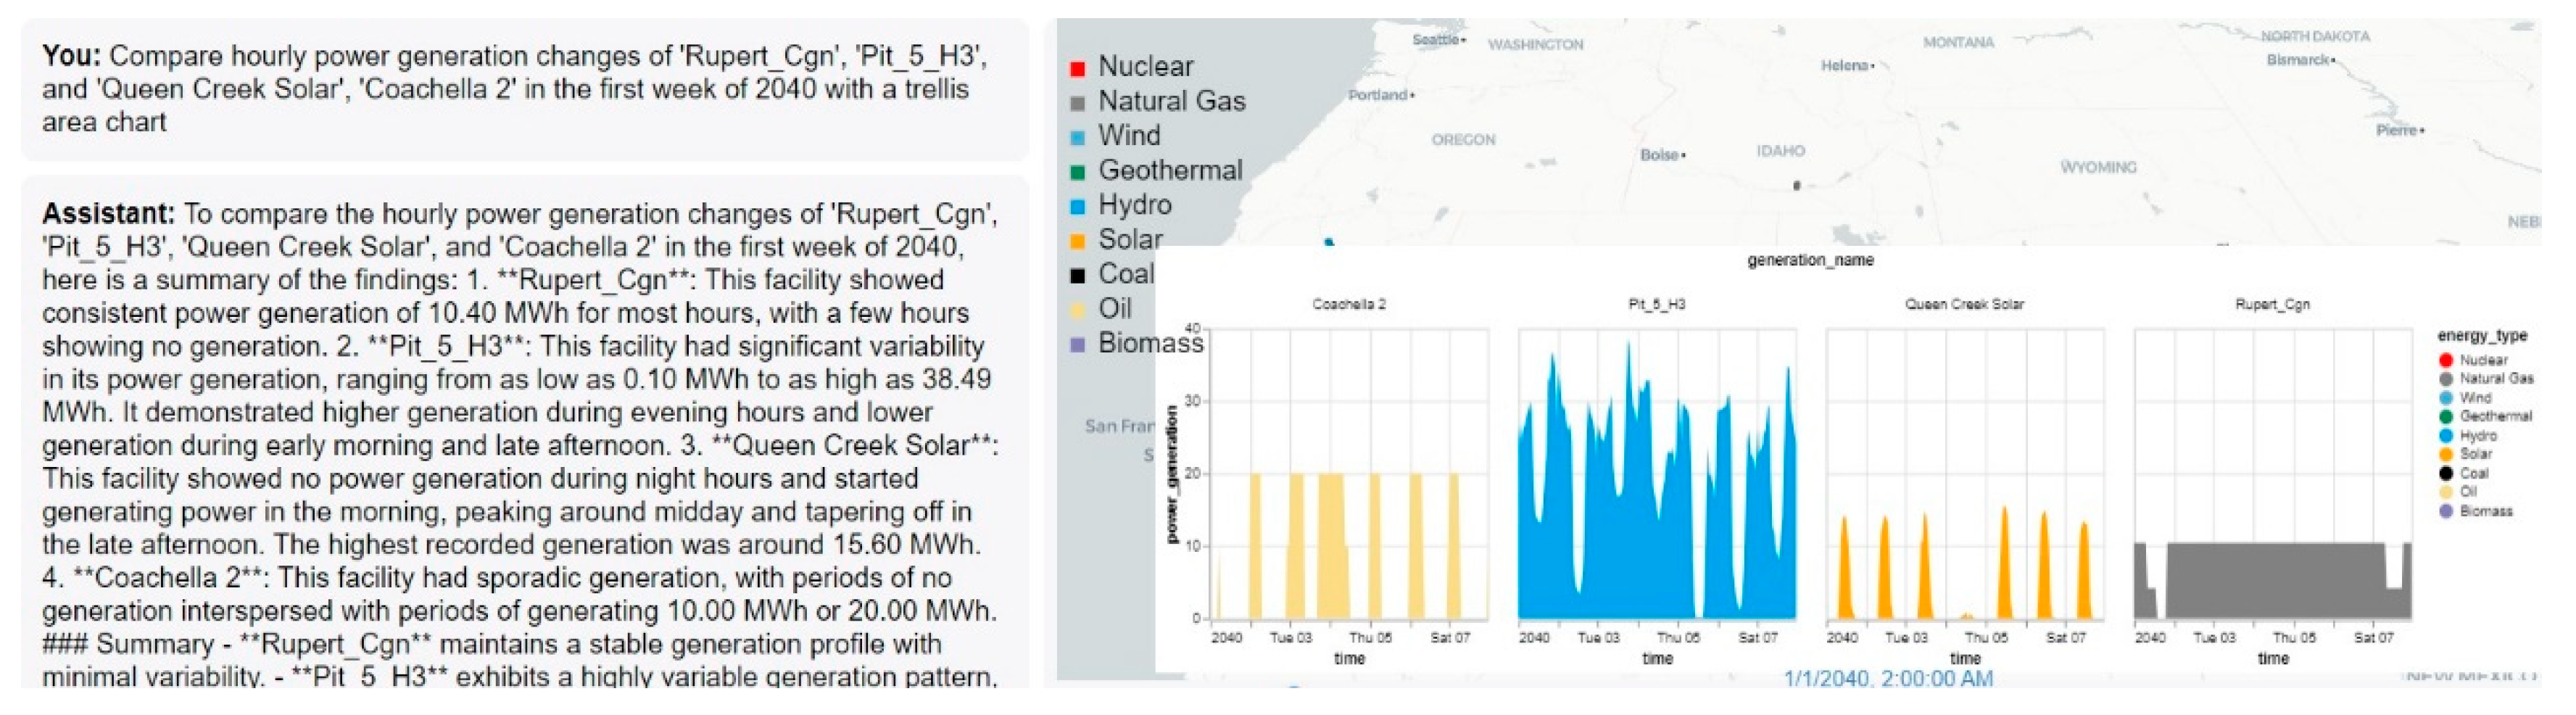
In addition, GridCoPilot not only recommends visualizations based on users’ questions but also supports user-defined specifications to generate tailored visualizations. For instance, users can specify using a box plot instead of a histogram to show internal individual data points along with the overall distribution patterns. As shown in Figure 4, GridCoPilot responds to a user’s request for a trellis area chart to ’compare hourly power generation changes of four specific substations in the first week of 2024.’ It displays each substation’s generation changes as small multiple area charts side by side to facilitate comparison. An example of a list of supported chart types and their combinations can be found in the Vega-Lite gallery [26]. Beyond the options for choosing chart types, users can also specify visual encodings with their queries, such as size, length, width, and color, to create customized visualizations tailored to their analytical needs.
V. Conclusions
Grid Copilot represents a significant advancement in power grid data analysis, combining large language models with advanced visualization techniques to streamline complex dataset exploration. The chat-based interface for textual and visual data exploration enhances accessibility, enabling stakeholders to derive insights without extensive programming expertise. By interpreting natural language queries, retrieving relevant data, and generating summaries and visualizations, Grid Copilot addresses traditional data analysis challenges. This study demonstrates its effectiveness for long-term planning scenarios, enabling comprehensive user-driven analyses beyond pre- defined graphical user interface (GUI) frameworks.
References
- B. F. Hobbs. Optimization methods for electric utility resource planning. European Journal of Operational Research 1995, 83, 1–20 [Online] Available: https://wwwsciencedirectcom/science/article/ pii/037722179400190N. [Google Scholar] [CrossRef]
- M. ISO. Midwest iso production cost model fundamentals. Iowa State University, Lecture Notes. [Online]. Available: https://www.engineering.iastate.edu/~jdm/ee590-Old/ ProductionCostModleFundamentals_EE590.
- J. Wood, B. F. J. Wood, B. F. Wollenberg, and G. B. Sheblé, Power generation, operation, and control, 3rd ed. John Wiley Sons, 2013.
- P. Bhattarai, S. Paudyal, Y. Luo, M. Mohanpurkar, K. Cheung, R. Tonkoski, R. Hovsapian, K. S. Myers, R. Zhang, P. Zhao et al.. Big data analytics in smart grids: state-of-the-art, challenges, opportunities, and future directions. IET Smart Grid 2019, 2, 141–154. [Google Scholar] [CrossRef]
- M. Bostock, V. Ogievetsky, and J. Heer. D3 data-driven documents. IEEE transactions on visualization and computer graphics 2011, 17, 2301–2309. [Google Scholar]
- Sheth, K. , & Patel, D. (2023). Evaluation of solar and wind power potential in Barranquilla, Colombia. International Journal of Engineering Research & Technology (IJERT), 12(12).
- Srinivasan and, J. Stasko. Orko: Facilitating mul- timodal interaction for visual exploration and analysis of networks. IEEE transactions on visualization and computer graphics 2017, 24, 511–521. [Google Scholar] [CrossRef] [PubMed]
- M. Q. Raza and A. Khosravi. A review on artificial intelligence based load demand forecasting techniques for smart grid and buildings. Renewable and Sustainable Energy Reviews 2015, 50, 1352–1372. [Google Scholar] [CrossRef]
- Vaswani. Attention is all you need. Advances in Neural Information Processing Systems.
- Swami, G. , Sheth, K., & Patel, D. From ground to grid: The environmental footprint of minerals in renewable energy supply chains. Computational Water, Energy, and Environmental Engineering 2025, 14, 2. [Google Scholar] [CrossRef]
- R. Bommasani, D. A. R. Bommasani, D. A. Hudson, E. Adeli, R. Altman, S. Arora, S. von Arx, M. S. Bernstein, J. Bohg, A.
- Sheth, K. , & Patel, D. Comprehensive examination of solar panel design: A focus on thermal dynamics. Smart Grid and Renewable Energy 2024, 15, 2 https:// doiorg/104236/sgre2024151002. [Google Scholar]
- Swami, G. , Sheth, K., & Patel, D. PV capacity evaluation using ASTM E2848: Techniques for accuracy and reliability in bifacial systems. Smart Grid and Renewable Energy 2024, 15, 12 https:// doiorg/104236/sgre2024159012. [Google Scholar]
- Sheth, K. , Patel, D., & Swami, G. (2024). Strategic insights into vehicles fuel consumption patterns: Innovative approaches for predictive modeling and efficiency forecasting. International Journal of Engineering Research & Technology (IJERT), 13(6).
- S. Tan, D. De, W.-Z. Song, J. Yang, and S. K. Das. Survey of security advances in smart grid: A data driven approach. IEEE Communications Surveys & Tutorials 2016, 19, 397–422. [Google Scholar]
- Langchain. Langchain sql agent. 2024. [Online]. Available: \url{https://python.langchain.com/v0.
- Satyanarayan, D. Moritz, K. Wongsuphasawat, and J. Heer. Vega-lite: A grammar of interactive graphics. IEEE transactions on visualization and computer graphics 2016, 23, 341–350. [Google Scholar] [CrossRef] [PubMed]
- H.-K. Ko, H. H.-K. Ko, H. Jeon, G. Park, D. H. Kim, N. W. Kim, J.
- H.-K. Ko, H. H.-K. Ko, H. Jeon, G. Park, D. H. Kim, and Kim. Natural language dataset generation framework for visualizations powered by large language models. in Proceedings of the CHI Conference on Human Factors in Computing Systems, 2024, pp. 1–22.
- H. Voigt, K. H. Voigt, K. Lawonn, and S. Zarrieß. Plots made quickly: An efficient approach for generating visualizations from natural language queries. in Proceedings of the 2024 Joint International Conference on Computational Linguistics, Language Resources and Evaluation (LREC-COLING 2024), 2024, pp. 12 787–12 793.
- Y. Tian, W. Y. Tian, W. Cui, D. Deng, X. Yi, Y. Yang, H. Zhang, and Y. Wu. Chartgpt: Leveraging llms to generate charts from abstract natural language. IEEE Transactions on Visualization and Computer Graphics.
- V. Dibia. Lida: A tool for automatic generation of grammar-agnostic visualizations and infographics using large language models. arXiv 2023, arXiv:2303.02927. [Google Scholar]
- Narechania, A. Srinivasan, and J. Stasko. Nl4dv: A toolkit for generating analytic specifications for data visualization from natural language queries. IEEE Trans-actions on Visualization and Computer Graphics 2020, 27, 369–379. [Google Scholar] [CrossRef] [PubMed]
- Sheth, K. , Patel, D., & Swami, G. Reducing electrical consumption in stationary long-haul trucks. Open Journal of Energy Efficiency 2024, 13, 6. [Google Scholar] [CrossRef]
- H. Lund. Renewable energy strategies for sustainable development. Energy 2007, 32, 912–919. [Google Scholar] [CrossRef]
- Sheth, K. , & Patel, D. Strategic placement of charging stations for enhanced electric vehicle adoption in San Diego, California. Journal of Transportation Technologies 2024, 14, 5. [Google Scholar] [CrossRef]
Figure 1.
Grid Copilot system architecture showing data flow and component interactions.
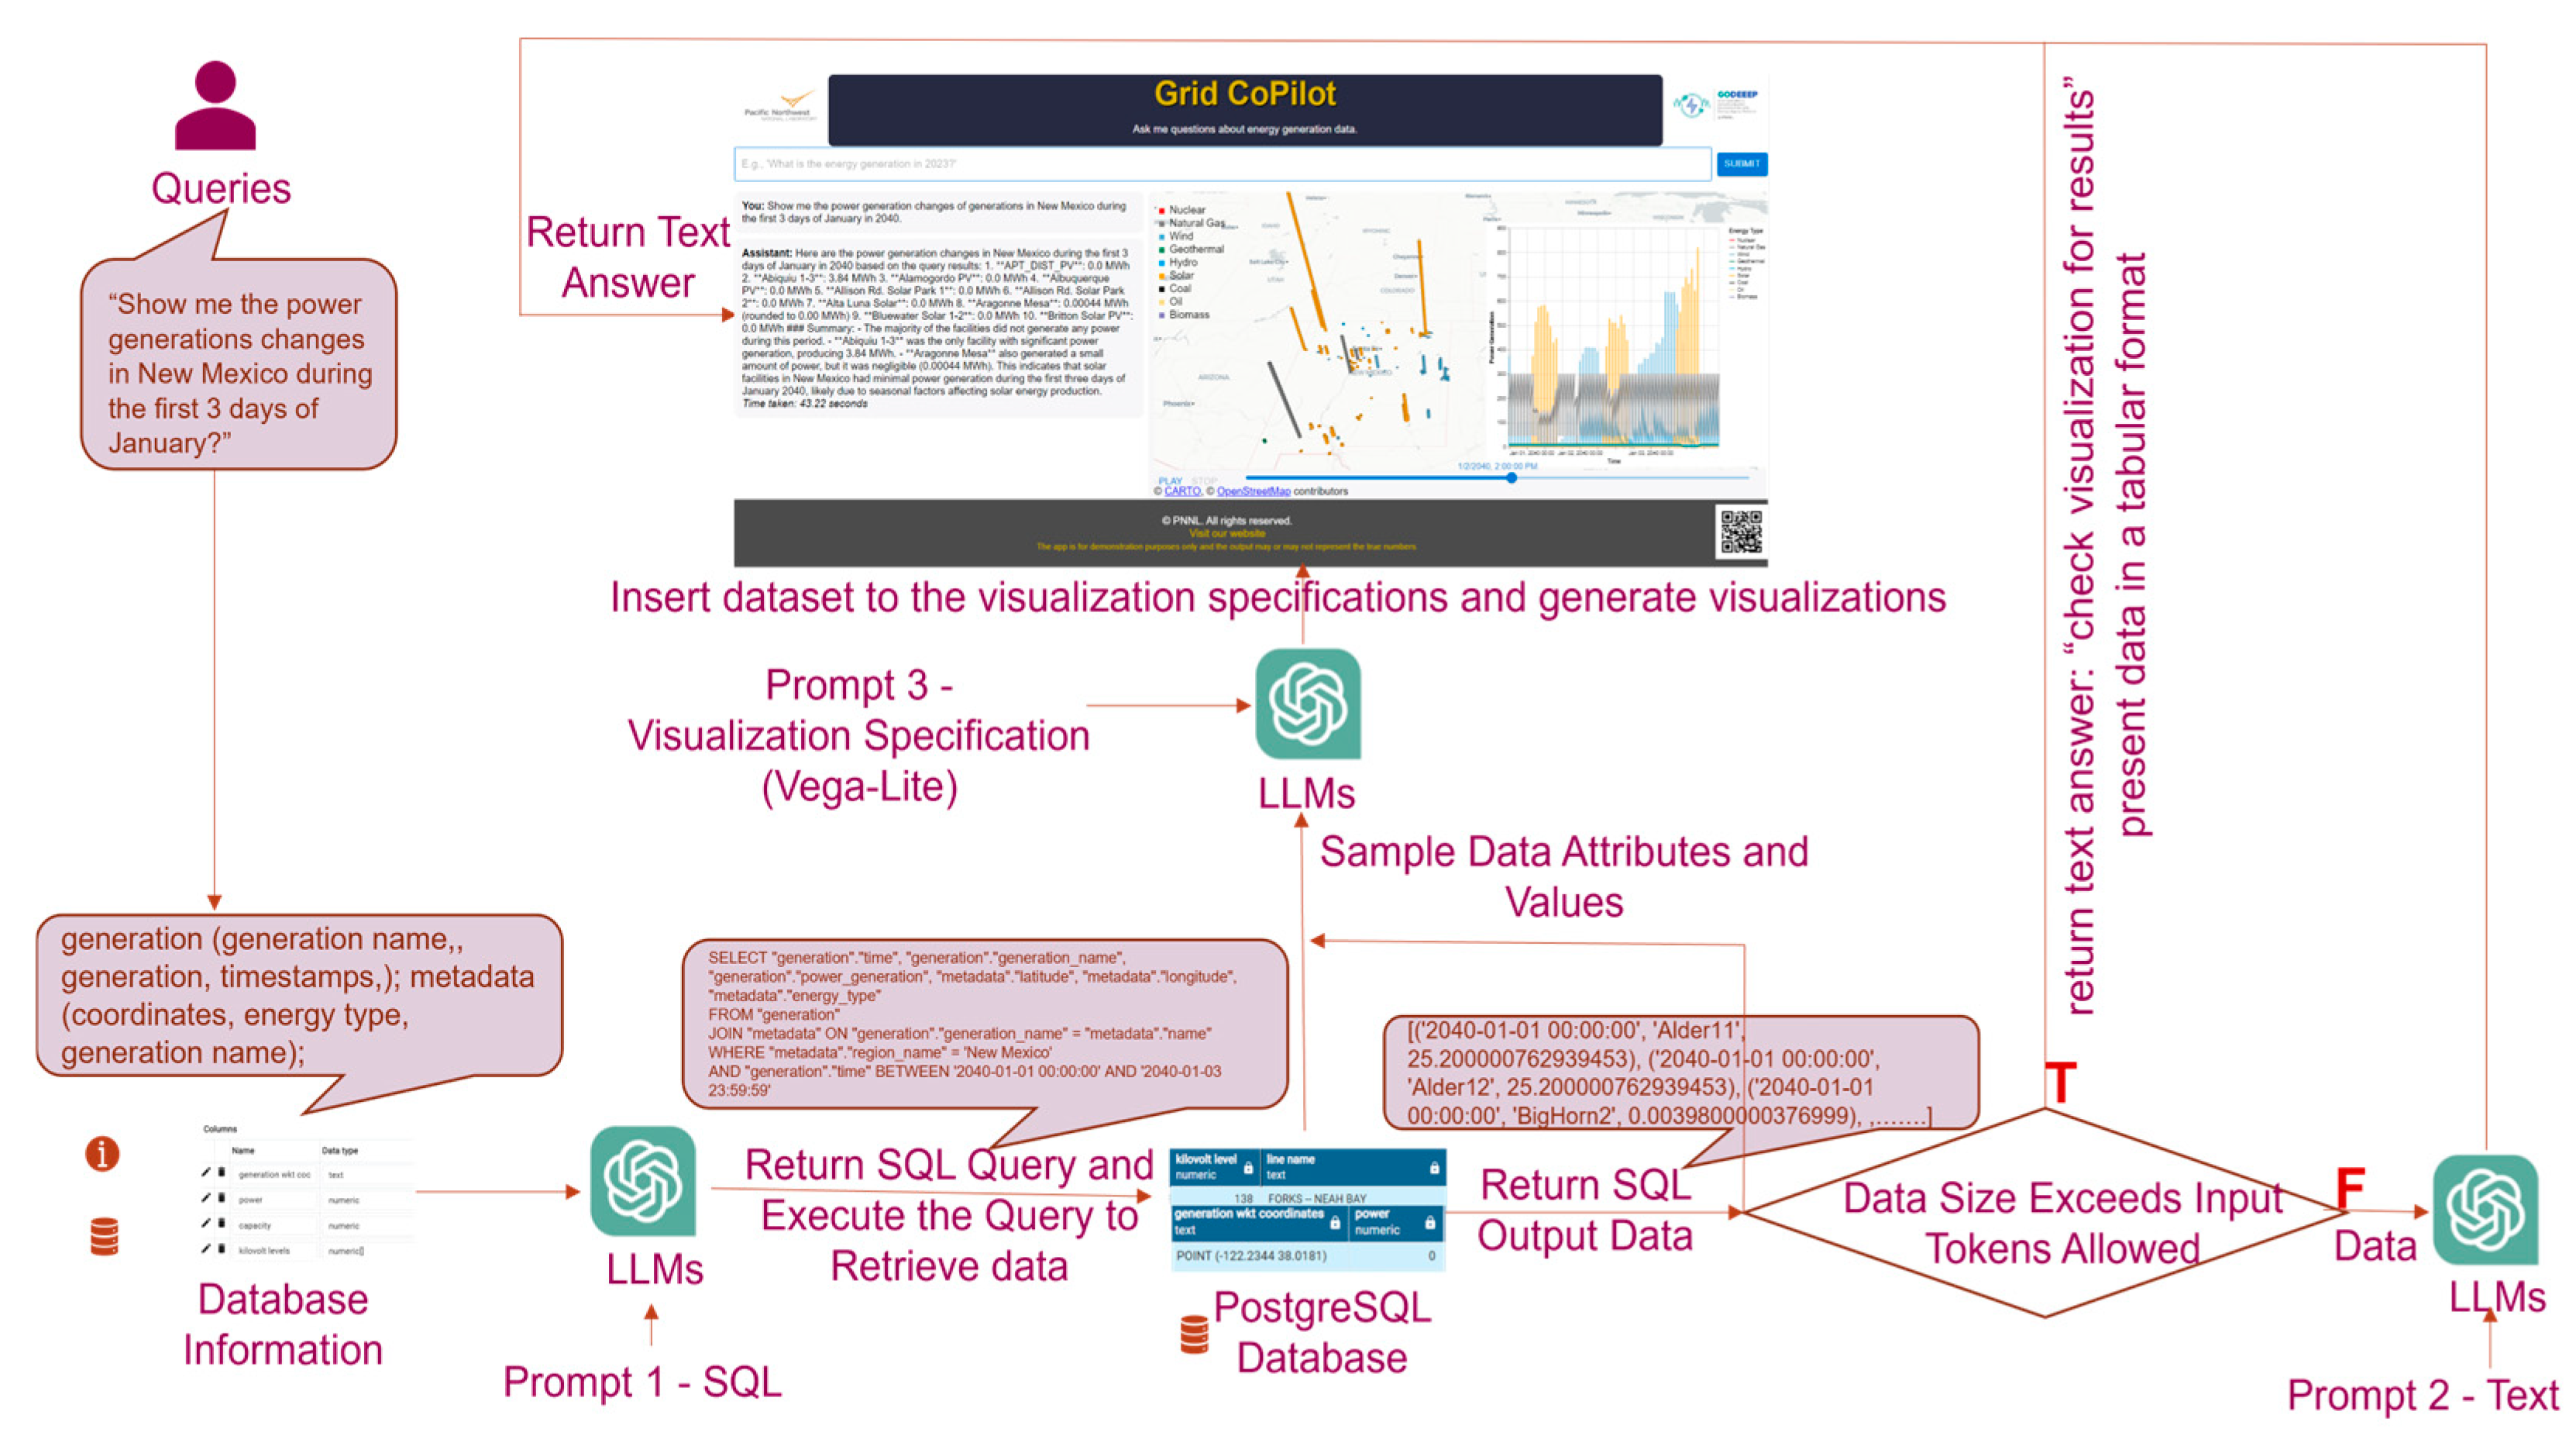
Figure 2.
Spatial visualization of Western U.S. generation distribution: (a) geographic view and (b) state-level energy type breakdown.
Figure 2.
Spatial visualization of Western U.S. generation distribution: (a) geographic view and (b) state-level energy type breakdown.
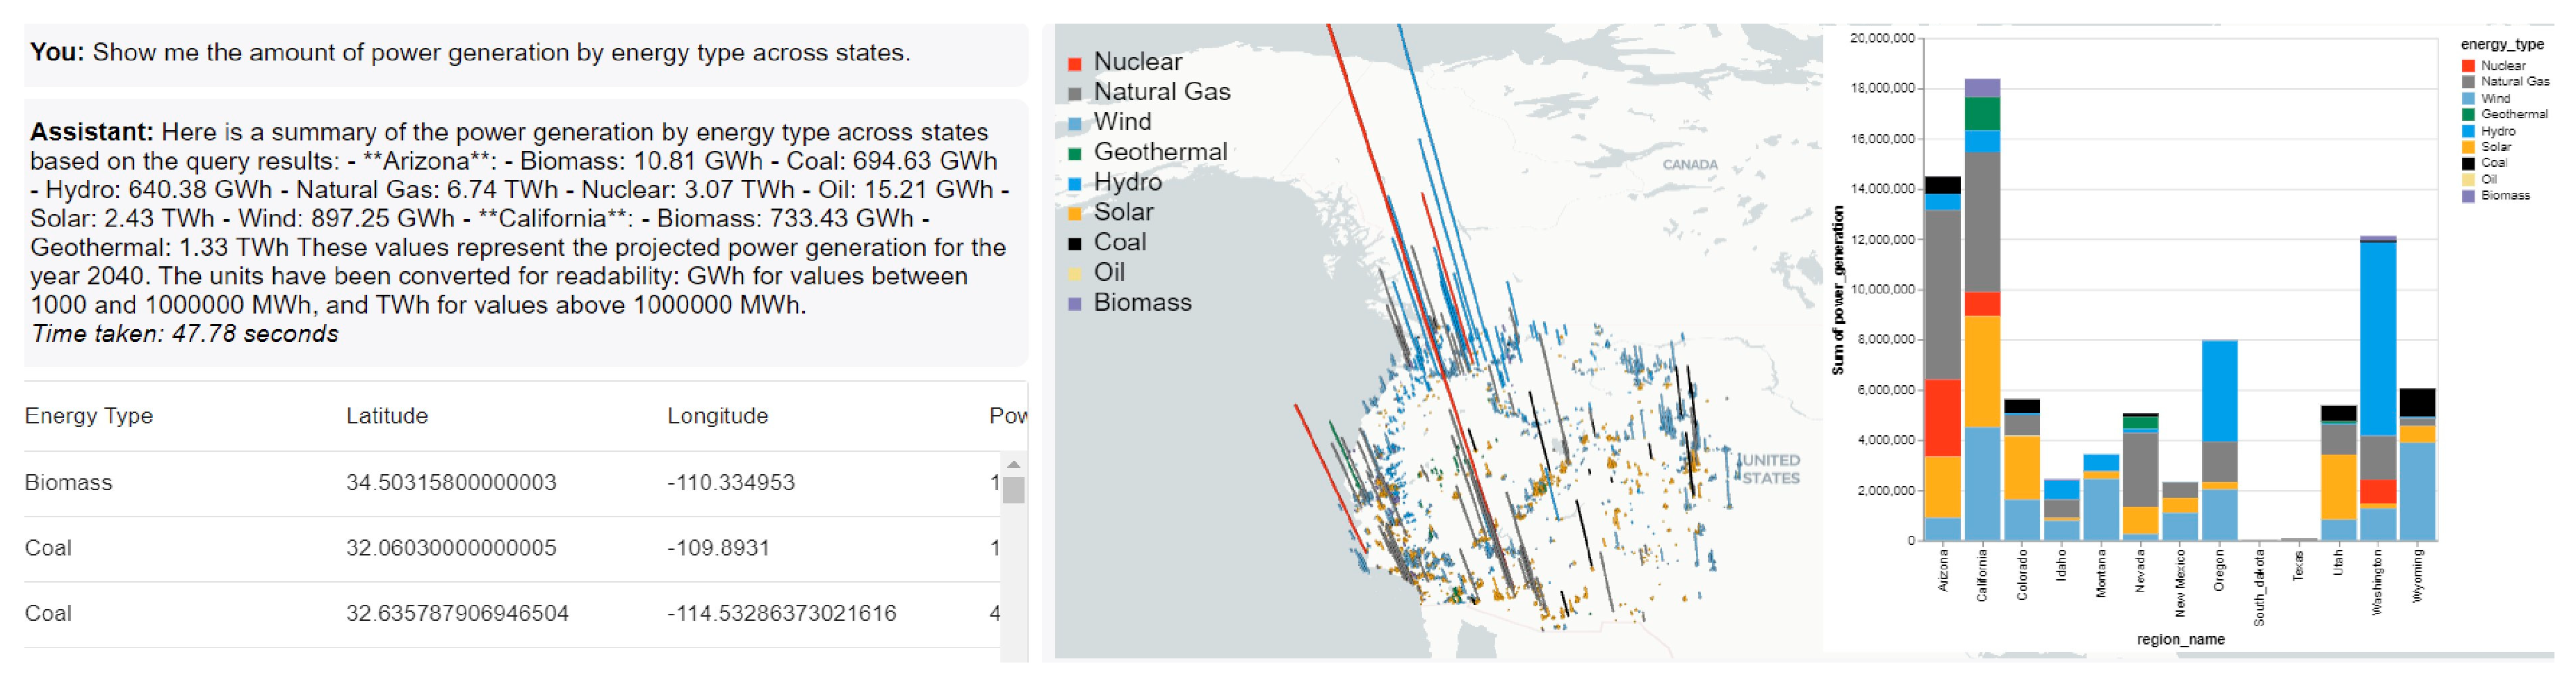
Figure 3.
Temporal analysis of generation patterns showing (a) animated geographic visualization and (b) time-series representation of generation by source.
Figure 3.
Temporal analysis of generation patterns showing (a) animated geographic visualization and (b) time-series representation of generation by source.
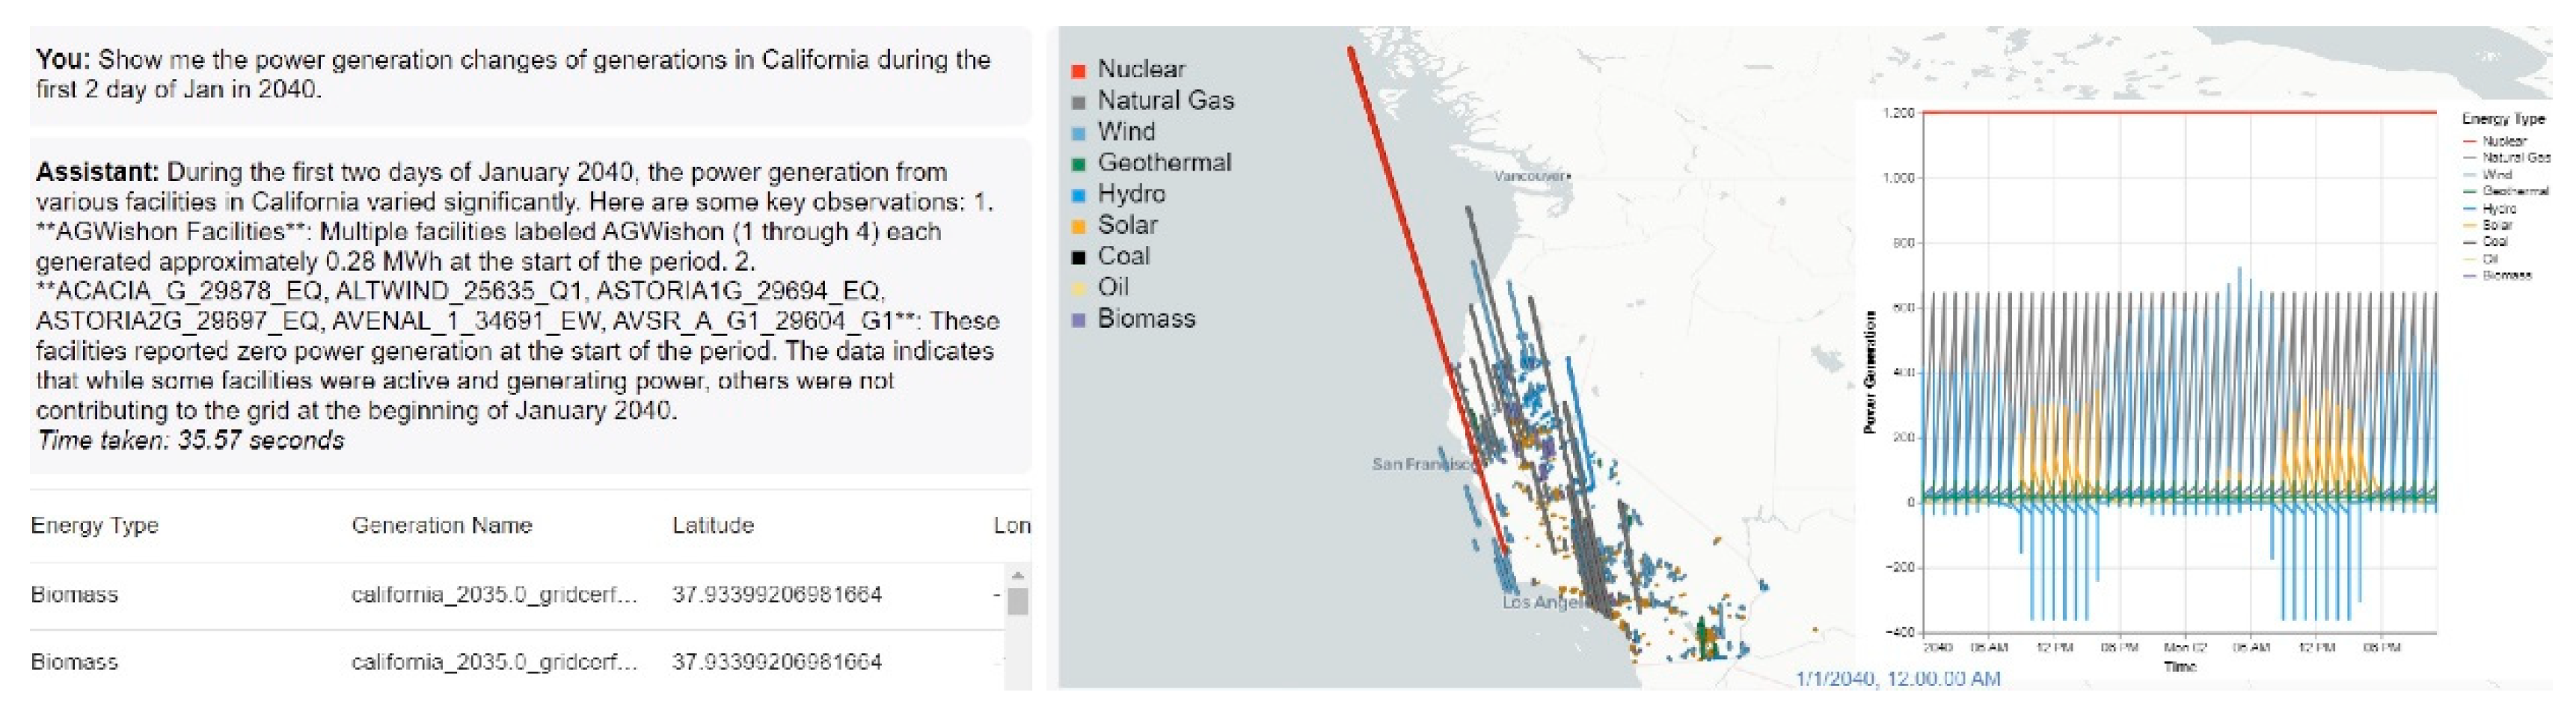
Figure 4.
GridCoPilot uses a trellis area chart to compare generation changes over time across four generations, based on the user-specified chart type.
Figure 4.
GridCoPilot uses a trellis area chart to compare generation changes over time across four generations, based on the user-specified chart type.
Disclaimer/Publisher’s Note: The statements, opinions and data contained in all publications are solely those of the individual author(s) and contributor(s) and not of MDPI and/or the editor(s). MDPI and/or the editor(s) disclaim responsibility for any injury to people or property resulting from any ideas, methods, instructions or products referred to in the content. |
© 2025 by the authors. Licensee MDPI, Basel, Switzerland. This article is an open access article distributed under the terms and conditions of the Creative Commons Attribution (CC BY) license (http://creativecommons.org/licenses/by/4.0/).
Copyright: This open access article is published under a Creative Commons CC BY 4.0 license, which permit the free download, distribution, and reuse, provided that the author and preprint are cited in any reuse.


