
Submitted:
16 April 2025
Posted:
17 April 2025
You are already at the latest version
Abstract
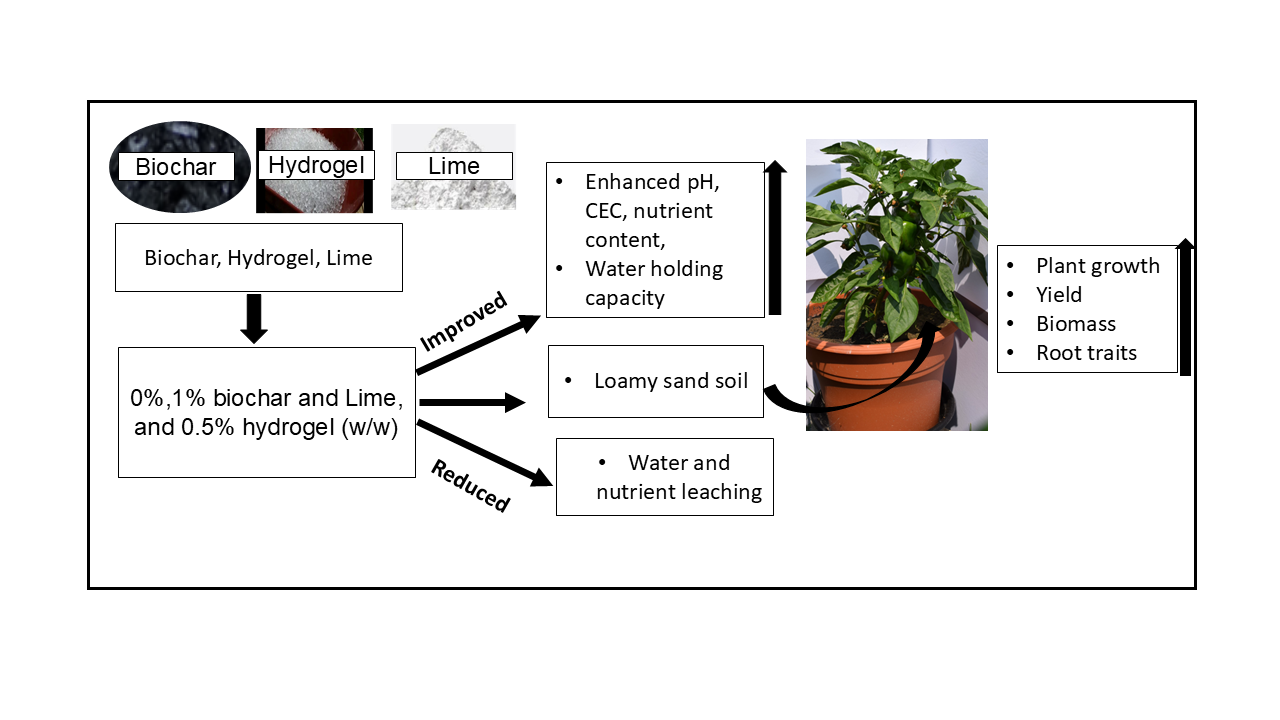
Nutrient leaching from agricultural fields can degrade soil fertility and groundwater quality, especially in coarse-textured soils. Amending soils with biochar, lime, hydrogel, or their combinations may reduce leaching, but the effects of single versus combined amendments remain unclear. A three-year pot experiment under field conditions was conducted on a loamy sand soil to enhance water and nutrient retention capacity of this soil. Soil samples were mixed with all possible combinations of 1% biochar (B), l% lime (L), and 0.5% hydrogel (H), i.e., BL, BH, HL, and BHL. The amendments were arranged in a randomized complete block design with four blocks. The results showed that compared to control, amendments B, H, BH, HL, and BHL significantly decreased (p ≤ 0.05) nitrate-N leaching per unit biomass by 58%-88%, and L, H, BH, HL, BHL significantly reduced (p ≤ 0.05) orthophosphate-P leaching per unit biomass by 34%-98%. Compared to control, the marketable yield significantly increased (p ≤ 0.05) by 24%-38% under BH, HL, and BHL in 2019, and by 17%-52% under amendments B, L, H, BL, BH, HL, and BHL in 2020. These results were not seen in the first year due to soil conditioning for biochar and lime. Amendments H, BH, HL, and BHL show potential to improve water use efficiency, reduce nutrient leaching, and support sustainable crop production.
Keywords:
water losses
; nutrient leaching
; biochar
; hydrogel
; liming
; soil amendments
1. Introduction
The rapidly growing global population is placing increasing pressure on the water and land resources needed to produce sufficient food [1,2,3]. Freshwater scarcity is an escalating global threat, especially in densely populated regions. Agriculture is responsible for 70% of the world’s freshwater usage, primarily due to inefficient irrigation methods and the cultivation of water-intensive crops [4], depleting rivers and lakes, which threatens food security. There are competing demands for freshwater, which is needed for sustainable agricultural practices and drinking purposes. Farmers increase fertilizer application frequency to achieve sustainable agricultural yields for better economic return in the face of declining soil fertility. However, rising fertilizer costs are placing additional economic stress on them. In addition, increased fertilizer use is also causing groundwater contamination and eutrophication of rivers and lakes [5]. The need to address these issues has led to an increasing demand for eco-friendly and economically viable soil amendments (e.g., biochar, hydrogels, and lime) that can restore soil fertility, reduce water contamination, and increase crop productivity.
Biochar is a carbon-rich material derived from the thermal decomposition of organic feedstocks in the absence of and or a limited supply of oxygen at temperatures exceeding 250°C [6]. This process results in a material with a highly porous structure, high pH, and low density [6,7]. As a soil amendment, biochar is known to enhance plant growth and productivity by improving soil fertility and water availability [8,9]. Studies have suggested that biochar amendment of soil reduces nutrient leaching and increases the soil’s water-holding capacity [10,11,12]. Therefore, using biochar as a soil amendment may solve current issues related to water scarcity and nutrient retention, especially in coarse-textured soils.
Another soil amendment, hydrogel, a synthetic crosslinked hydrophilic polymer with a three-dimensional structure, is showing excellent water absorbency, long shelf life, and high mechanical strength [13,14]. When used as a soil amendment, it can store water near the root zone to be utilized later by the crop, making it an ideal amendment to improve the water and nutrient retention capacity of soil [15]. In previous studies it was shown that by improving the soil’s water-holding capacity, hydrogel amendment extends irrigation intervals, increases water use efficiency (WUE), reduces nutrient leaching, and promotes better plant growth and higher crop yields [16,17,18]. Although hydrogel is known to improve water retention, plant growth, and yield, information concerning its effectiveness in improving soil physical and chemical properties and reducing nutrient leaching with growing plants is still limited, as very few studies have investigated its effects of hydrogel on nutrient leaching [19].
Liming is another soil amendment that has been used frequently to ameliorate soil acidity [20,21]. It can effectively raise soil pH by increasing Ca and Mg and decreasing Al availability, which helps to increase base saturation and nutrient availability in the soil [22]. Furthermore, liming can potentially reduce nutrient leaching and enhance nutrient uptake by plants [23]. Studies have found lime amendments to reduce soil phosphorus leaching and runoff from clay and sandy soils [24,25]. Liming promotes plant growth and yield by improving soil properties and nutrient availability in poor-quality soil [26,27]. Although lime-based products, such as quicklime, slake lime, limestone, and dolomite, have been used to enhance plant yield [24,28], field-level studies are required to determine the effect of other lime-based products (e.g., high calcium hydrated lime) on nutrient loss, plant growth, and yield.
Recent studies have shifted attention to an integrated rather than a single-amendment approach [29,30]; a range of combined treatments may lead to more effective, sustainable and eco-friendly soil amendments with the potential to address pressing issues related to nutrient leaching and water availability. Prior studies have shown that a combination of soil amendments, such as biochar compost, biochar-hydrogel, and biochar-lime, can improve crop yield by enhancing the soil’s nutrient and water retention [29,30,31,32]. The application of biochar-hydrogel and biochar-lime focus on increasing soil fertility and alleviating the hazards of drought for various crops [8,17]. However, few studies have quantified the combined effect of biochar, hydrogel, and lime as soil amendments to increase plant growth and yield by improving soil nutrient retention in topsoil. Studies have shown that combined biochar-hydrogel amendment improved the soil’s hydro-physical properties [33] and increased green pea (Pisum sativum L.) growth and yield by reducing drought stress in a sandy soil [34]. In another study, hydrogel-biochar soil amendment significantly increased wastewater-irrigated spinach yield [18]. However, studies have indicated that combining biochar-hydrogel research requires more field-level applications, as the previous studies do not explain the influential role of biochar-hydrogel on the improvement of soil properties as well as plant growth [33,34]. There is an information gap on the effect of mixed amendments (biochar-lime, biochar-hydrogel, hydrogel-lime, and biochar-hydrogel-lime) on soil nutrient leaching, plant growth, and plant productivity, especially for green peppers.
The use of biochar in soil has been shown to influence green pepper (Capsicum annuum L.) plant growth and yield [35,36], reduce pathogen loads [35,37], and affect heavy metal uptake [38]. However, there is currently no documentation on how soil amendments impact water and nutrient losses in green pepper plants, cultivated on loamy sand soil. While lime and hydrogel amendments are commonly used to improve soil fertility, studies on their effects have primarily focused on black peppers, sweet peppers, and chili peppers, examining plant growth, yield, and water use efficiency [39,40]. Specifically, research on the impact of lime and hydrogel as soil amendments on the growth and yield of green peppers grown on a loamy sand soil remains scarce.
Thus, the primary objectives of this study were: (i) to examine the effects of single applications of biochar, lime, hydrogel, and their combinations, on green pepper growth and productivity, and (ii) to evaluate their impact on nutrient leaching and water retention through an outdoor field pot experiment. Green peppers, known for their appealing color, flavor, taste, and nutritional value [41], have become the world’s second most popular vegetable [42], making it an ideal choice for this study. While the individual application of biochar, lime, or hydrogel has distinct benefits, we hypothesized that combining two or three of these amendments would further reduce nutrient losses, increase water use efficient in a coarse-textured soil by enhancing soil water retention, and improve nutrient availability, ultimately promoting greater plant growth and yield.
2. Materials and Methods
2.1. Soil Collection and Characterization
The loamy sand soil, used for the study, was collected from the top 0.10 m of soil from an agricultural field, situated on the Macdonald Campus Farm, Ste-Anne-de-Bellevue, QC, Canada (45.41° N, 73.94° W). This soil was selected for the study because the soil has low pH, low nutrient and water retention capacity based on its soil characteristics analysis. The soil texture (sand, silt, and clay) was determined by the particle size distribution method (standard hydrometer method) for particle size analysis (ASTM: D 422-63). The soil pH was measured in a slurry of 1:2 soil: distilled water (w/w) with an electrode-type pH meter [43]. Soil organic matter (SOM) content was measured using the loss-on-ignition method [44]. All the available elements P (phosphorous), K (potassium), Ca (calcium), Mg (magnesium), and Al (aluminum) were determined following Mehlich III extraction [45], and the extracted solution was analyzed using an atomic adsorption flame spectrometer (Varian 220FS, Palo Alto, CA). The was measured using the 2.0 M KCl method [46]. The Cation Exchange Capacity (CEC) of the soil by the 0.1 M BaCl2 method [43], where 1 g air-dried soil was extracted with 25.0 mL of 0.1 M BaCl2 using an end-over shaker, centrifuged at 2500 rpm for 15 min, and filtered through a Whatman 42 filter paper. The filtrate was then analyzed for exchangeable Ca, Mg, K, Na, Mn, Fe, and Al using a flame spectrometer. The soil’s physical and chemical properties are given in Table 1.
2.2. Soil Amendments and Their Characterization
The biochar was produced from hardwood (pine) pyrolyzed in an auger retort carbonizer (ABRI—Tech, 1 Mg retort system, Alberta Biochar Initiative - AI-TF, Vegreville, Canada) operated between 500-550°C at 85-100°C min-1 heating rate. The details of this biochar’s production and its characterization are documented by Dugdug et al. [46]. Some of the biochar properties are presented in Table 1.
The High Calcium Hydrated Lime (HCHL) was purchased from Gramount Inc., Canada. HCHL is a fine white powder that was produced by combining quicklime with water to convert calcium oxide to calcium hydroxide [47]. The producer tested the properties of the HCHL, and the surface area was determined by the N adsorption method using a surface area analyzer (TriStar 3000, Norcross, GA), and then it was calculated according to Brunauer, Emmet, and Teller (BET) theory [48]. HCHL has an available calcium hydroxide of 92.8%, calcium oxide of 70.3%, and total calcium as calcium oxide of 73.4%. The HCHL has pH 12, a bulk density of 0.467g cm-3, and a BET surface area of 14 m2g-1. Table S1 in the supplementary information summarises the physical and chemical properties of the HCHL used in this study.
The hydrogel (super absorbent polymer, SUPER-AB-A200) was obtained from a Canadian environmental solutions company (Iramont Inc, Laval, Canada). It has a pH of 5.8, bulk density of 1.2 mg m-3, electrical conductivity of 0.9 dS m-1, and water absorbency of 200 to 500 g g-1. The producer tested the hydrogel’s properties, which are presented in Table S2 in the supporting document.
2.3. Experimental Site and Design
An outdoor pot study experiment was carried out on the Macdonald Campus Farm of McGill University, Sainte-Anne-de-Bellevue, QC, Canada, in 2018, 2019, and 2020. The pots (0.30 I.D. × 0.355 m height) were filled with a loamy sand soil to within 0.05 m from the top. The pots were filled with the soil, maintaining the field bulk density of 1.19 g/cm3, and arranged in a randomized complete block design with four blocks (rows). The eight treatments designed for this study were: (i) Soil only (Control, C), (ii) Soil + Biochar (B), (iii) Soil + Lime (L), (iv) Soil + Hydrogel (H), (v) Soil + Biochar + Lime (BL) (vi) Soil + Biochar + Hydrogel (BH), (vii) Soil + Hydrogel + Lime (HL), and (iv) Soil + Biochar + Hydrogel+ Lime (BHL). The biochar, lime, and hydrogel were applied to the soil at 1.0%, 1.0%, and 0.5% w/w, respectively, based on rates used in previous studies [49,50,51,52]. The quantities of biochar and hydrogel were calculated based on the weight of top 0.05-0.15 m deep soil. The treatments were mixed into the same depth of soil layer to prevent photo-degradation of the hydrogel [29,52]. In the second and third years of the study, 1.00 cm of soil was replaced in each pot to replenish the upper layer and cover the hydrogel. This was necessary because the soil had been disturbed due to harvesting root biomass All the pots were saturated with water two days before planting. After that, five-week-old green pepper seedlings (Red Knight, Capsicum annuum L.) were obtained from the Mac Market, situated at the Macdonald Campus of McGill University, and transplanted into the pots on June 8, 2018, 2019, and 2020.
Fertilizer was applied based on the Quebec fertilizer directives for green peppers (N – 140 kg ha-1, P – 190 kg ha-1, K – 160 kg ha-1), and NPK fertilizer requirements were calculated per plant per hectare basis (2500 plants ha-1). During the first year of the study, solid-form fertilizers, P and K, were applied once, while nitrogen was applied in three splits, according to the local recommended dose [53]. However, in the second and third year, the same amount of water-soluble fertilizer (NPK) was applied six times during the growing period, as per availability.
Bell peppers require roughly 600 to 900 mm of water across the growing season [54]. Before root establishment, plants received 500 ml (55 - 75 mm) of water daily [55]. In the first year, after plant root establishment, irrigation was initiated based on the readings from three tensiometers installed in spare soil-filled pots with green peppers plant. Tensiometers were not installed in main treatment pots to avoid preferential flow of irrigation water. However, in the second year, after a similar pre-root establishment irrigation, up to 700 ml water was applied daily, based on the weather conditions, to prevent blossom end rot [10]. Water was applied more frequently on hot days, especially during the flowering and fruiting season. For the second year, no tensiometers were installed, and personal experience, based on temperature and soil conditions, was used to schedule irrigation, similar to what farmers would do in real-world conditions.
2.4. Data Collection and Measurements
2.4.1. Plant Growth Parameters Measurement
Plant growth indicators were measured during growing, flowering, and fruiting seasons. The leaf greenness index (GI) of the plants was measured from the average of five leaves in the apex, following the method described by Netto et al. [56], using a portable relative chlorophyll content index (RCCI) meter (SPAD-502, MINOLTA Co. Ltd., Japan).
Canopy reflectance, which is a plant growth monitoring parameter [57], was measured with a reflectance sensor (Crop Circle, ACS-430, Holland Scientific, Nebraska, USA), placed approximately 0.10 m above the plant canopy. The NDVI (Normalized Difference Vegetative Index) was calculated using the canopy reflectance in the near-infra-red (NIR) and red (Red) portions of the spectrum.
The plant photosynthesis rate was measured using a portable photosynthesis system (LI- 6400 LI-COR Inc., Nebraska). Three fully expanded healthy leaves per plant per pot were randomly selected, and measurements were conducted between 10:00 a.m. and 3:00 p.m. [58]. During the third year, we refrained from measuring plant growth parameters because no significant differences were observed in the first two years.
2.4.2. Green Pepper Harvest and Biomass Analysis
Following the procedure described by Sigge et al. [59], green peppers (i.e., mature green bell peppers with pod length > 10 cm and a lime-green color) were harvested several times during the cropping season, and their fresh weights were recorded using a digital weighing balance. All measurements were replicated three times. Ninety days after transplanting, the plants were harvested, and the mass of leaves, stems, and peppers were recorded.
Root biomass and structure were analyzed using the method described in the “WinRHIZO 2013 Basic, Reg, Pro & Arabidopsis for Root Measurement” manual. Roots were excavated manually after the final harvest, and the soil was removed by gentle shaking and washing with tap water. Intact roots were preserved by soaking them in distilled water and refrigerating the samples at 4oC to avoid any bacterial infection before the scanning. The root traits such as total root length, total root surface area, average root diameter, and total root volume were measured on the following day using a root scanner and image analysis system (WinRHIZO Pro LA2400; Regent Instruments Canada Inc., Quebec, Canada). However, during scanning, some parts of the roots were cut by scissors and submerged in the water for better scanning as the roots were too large and dense for the equipment.
2.4.3. Leachate Collection and Analysis
Leachate samples were collected from each pot for the three sampling events in 2018 and 2019, and five sampling events in 2020 during the growing season. The total leachate volume per pot was also measured. An outlet was provided at the side of the tray for leachate collection into a small plastic pot. A subsample (approx. 50 ml) of the leachate was collected in a 50 ml Falcon tube, immediately after each irrigation, and transferred to the lab. Samples were then filtered through a 0.45 µm nylon filter and stored at 4˚C for further analysis. The leachate samples were analyzed for nitrate-N and orthophosphate-P for the first two years using a Lachat Flow Injection Analyzer (Lachat QuickChem 8000, WI).
In 2020, the samples were analyzed using a portable colorimeter (DR900, Hach, Canada), due to the impact of COVID-19, as it was not feasible to analyze the samples in the laboratory using the Lachat instrument. To check the accuracy of the portable colorimeter, we analyzed the known standard in the instrument using the same method; the technique yielded acceptable results. The nutrient leaching loss was calculated by multiplying the concentration (mg L-1) of and in the leachate by the total volume (L) of collected leachate. The normalized leachate volume and nutrient losses were calculated by dividing the parameter of interest by the pepper plant’s total fresh biomass (above and below ground) [10].
2.4.4. Soil Analysis
Soil samples were collected at the end of the season from the 0.10-0.15 m soil profile with a soil auger and were stored at -20°C until further analysis. Soil pH, organic matter, , available nutrients (P, K, Ca, Mg, and Al) and CEC were measured, using methods described earlier for soil characterization.
2.5. Data Analysis
All data were analyzed in SAS-JMP® Pro 17.2.0 (Copyright © 2016 SAS Institute Inc.) and ORIGIN-Pro 2023 (Origin Lab Inc., Northampton, Massachusetts, USA). The greenness, photosynthetic rate, and plant reflectance were subjected to repeated measures analysis of variance (ANOVA). The plant biomass, yield, leachate characteristics (leachate volume, nitrate-N, orthophosphate-P) and the data related to the soil chemical properties were subjected to one-way ANOVA analysis. The residual normality was tested with Shapiro-Wilk test. The student’s t-test was used to determine the difference between treatments at 5% (α = 0.05) significance level. Origin Pro 2023 was also used to graph all the figures.
3. Results
3.1. Soil Amendments Affected the Physio-Chemical Properties of the Soil
The application of soil amendments significantly altered soil chemical properties during the study (Table 2). Amending soil with B, L, BL, HL, and BHL significantly improved (p ≤0.05) soil pH (up to one to two units) for the three consecutive years of the study, compared to the control, while other treatments (H and BH) had no effect on soil pH. Overall, the soil pH ranged from 5.7 to 7.38. The lowest soil pH was observed for the non-amended soil for all seasons, while the lime-based amendments exhibited the highest pH. All the amendments significantly improved (p ≤0.05) soil organic matter (SOM) in the second and third years, compared to control, only HL improved SOM in the first year of the study (Table 2). The concentration of nitrate-N in the soil significantly improved (p ≤0.05) with the addition of soil amendment B, L, BH in 2018, and amendments B, L, HL, BHL in 2019. All the amendments B, H, L, BL, BH, HL, and BHL significantly improved (p ≤0.05) soil nitrate-N concentration, compared to control, in 2020 (Table 2).
The incorporation of soil amendments B, H, BL BH, HL, and BHL significantly improved p ≤0.05) soil available P concentration in 2019. Amendments B, HL, and BHL significantly improved (p ≤0.05) soil available P concentration in 2020, compared to control, while there was no treatment effect in 2018 (Table 2).
The mixed amendments BH, HL, and BHL significantly increased soil available K concentrations in 2018 and 2019 (p ≤ 0.05), with single amendment H also improving K levels in 2018. In 2020, HL and BHL further enhanced soil K concentration compared to the control (p ≤ 0.05). The amendments impacted soil Mg and Ca concentrations as well. Amendments L, BL, HL, and BHL consistently improved available Ca (p ≤ 0.05), while L, BL, HL, and BHL increased available Mg in the second season. In the first year, B, BL, and HL improved Mg levels, and in the third year, L, HL, and BHL again significantly boosted Mg concentrations compared to the control (p ≤ 0.05).
The CEC of the soil was significantly influenced by the amendments (Table 2). All amendments except H increased CEC in the first year: 33% (B), 98% (L), 101% (BL), 31% (BH), 121% (HL), and 80% (BHL). In the second year, the significant improvements were 60%, 130%, 69%, 93%, and 70% with the application of B, L, BL, HL, and BHL compared to control. In the third year, increases were 23%, 66%, 59%, 70%, and 60%, with the application of B, L, BL, HL, and BHL, respectively, compared to control (p ≤ 0.05). CEC values ranged from 6.71 cmol(+) kg⁻¹ to 16.92 cmol(+) kg⁻¹, with the L treatment showing the most significant increase of 16.92 cmol(+) kg⁻¹ compared to non-amended soil in 2019.The available Al content of the soil was significantly reduced (p ≤0.05) by the addition of L, BL, HL, and BHL, compared to the control, throughout the study, while other amendments did not affect the Al content in the soil.
3.2. Soil Amendments Impacted Leachate Volume
All mixed amendments (BL, BH, HL, and BHL) significantly reduced the total leachate volume per unit biomass compared to the control soil over the last two years (Figure 1a-c; p ≤ 0.05). In 2019, reductions were 48%, 75%, 64%, and 83% for BL, BH, HL, and BHL, respectively. In 2020, these reductions were 44%, 58%, 74%, and 80%. Amendment H also significantly decreased leachate volume by 54% in 2018, 65% in 2019, and 59% in 2020 (p ≤ 0.05). Amendments B and L reduced leachate volume by 62% and 55% in 2020. Except for B, the other amendments did not have a significant effect in 2018, while B significantly increased leachate volume by 108% compared to control p ≤ 0.05). Amendment H reduced leachate volume by 68% in 2018. The effect of amendments on total leachate volume without normalizing followed the same trend as the normalized leachate volume in 2019 and 2020 but differed in 2018 (Figure 1a-c in the supplementary information).
The treatments H, BL, BH, HL, and BHL significantly impacted non-normalized leachate volume. However, after normalization with total yield and biomass, only treatment H remained significant due to lower plant yields in 2018 (Figure 1a). The lowest cumulative normalized leachate volumes were 0.338 L/kg in 2018, 0.0829 L/kg in 2019, and 0.366 L/kg in 2020 for H and BHL, while the control had the highest cumulative volume.
3.3. Effects of Soil Amendments on Nutrient Leaching
3.3.1. Nutrient Leaching Concentration
The amendments and the leachate sampling event (timing) significantly impacted nitrate-N concentration throughout the study (Table S3 in the supplementary information). In the first-year study, B, H, and BH significantly reduced (p ≤0.05) nitrate-N leaching concentration, compared to non-amended soil, by 47%, 47%, and 40%, respectively. Likewise, in the third season, H, BH, and BHL significantly decreased (p≤0.05) nitrate-N leaching concentration by 39%, 31%, and 42%, respectively. However, only the H amendment significantly reduced (p ≤ 0.05) nitrate-N leaching concentration by 78% in 2019, compared to control, while others had no impact.
Biochar-hydrogel (BH) exhibited significantly higher (p≤0.05) losses of orthophosphate-P concentration, with increases of 109.4% compared to non-amended soil. Additionally, BH showed significant orthophosphate-P concentration reductions of 81%, 73%, 132%, 58%, 123%, and 77%, respectively, compared to amendments B, H, L, BL, HL, and BHL. All the amendments did not affect the concentration of orthophosphate-P leaching, except BH in 2018. In 2019, only H had a significantly lower (p ≤0.05) concentration of orthophosphate-P leaching (96%), compared to no-amended soil. However, L, BL, HL, and BHL showed significantly lower concentrations (p ≤0.05) of orthophosphate-P losses by 67%, 77%, 77%, 78%, and 335%, respectively, compared to BH in 2019. Similarly, in 2020, soil amendment B significantly increased (p ≤0.05) orthophosphate-P leaching concentration by 102%, compared to control, but H and BHL significantly reduced (p ≤0.05) orthophosphate-P concentration losses (64% and 69%) compared to biochar treatments.
3.3.2. Nutrient Losses:
The effects of single amendments (B and H) and mixed amendments (BH, HL, and BHL) on cumulative normalized nitrate (NO3--N) leaching losses were significant during the last two seasons (p ≤ 0.05; Figure 2a-c). In the first year, however, only H and BH showed a significant reduction in Nitrate-N loss. Greater normalized Nitrate-N (NO3--N) losses occurred under the non-amended control treatment, compared to any of the amendments.
For instance, in 2019, amendments B, H, BH, HL, and BHL reduced normalized NO3--N losses by 65%, 88%, 86%, 60%, and 70%, respectively, compared to the control. Similarly, in 2020, amendments B, L, H, BL, BH, HL, and BHL reduced normalized NO3--N losses by 62%, 59%, 74%, 45%, 66%, 78%, and 84%, respectively. However, in the first year (2018), only amendments H (79%) and BH (68%) significantly reduced nitrate-N leaching compared to the control.
The lowest normalized NO3--N losses observed under the H treatment was 7.40 mg/kg in 2018; 1.25 mg/kg and 1.41mg/kg of per unit biomass for H and BH, respectively, in 2019, and 3.78 mg/kg of per unit biomass for BHL in 2020), while the lowest losses were recorded under control treatment.
Soil amendments also had a significant impact on orthophosphate-P losses (Figure 2d-f). In 2018, amendment H reduced normalized orthophosphate-P losses by 56%, 72%, and 58% compared to the control, B, and BHL treatments, respectively. Other amendments, including L, BH, HL, and BHL, showed no significant effect on orthophosphate-P losses in 2018.
In 2019, amendments L, H, BL, BH, HL, and BHL significantly reduced orthophosphate-P leaching losses by 64%, 98%, 65%, 75%, and 84%, respectively, compared to the control. A similar trend was observed in 2020, with reductions of 57%, 78%, 34%, 56%, 52%, and 88% for L, H, BL, BH, HL, and BHL, respectively.
The trends observed for normalized leachate NO3--N and orthophosphate-P losses in 2019 and 2020 were consistent with the results for non-normalized leachate. However, in 2018, the normalized data differed due to adjustments for total yield and biomass. This discrepancy arose because the amendments did not significantly increase plant biomass production in 2018 (Figure 2a-f).
3.4. Soil Amendments Affected Plant Growth Parameters Based on Growth Stages
3.4.1. Plant Greenness (SPAD)
The SPAD readings of the green pepper plants were not affected by soil amendments or season in the first year, but the season (time) has an impact in the second year (Table 4). Adding amendments of B, L, H, or a combination of them except BL, had no significant effect on plant greenness in either year. The SPAD values fluctuated over time and showed the highest SPAD values during the flowering seasons (70.31 in 2018 and 69.85 in 2019), compared to the growing and fruiting seasons (Table 3).
3.4.2. NDVI
Overall, the soil amendments and season (time; growing, flowering and fruiting) significantly affected green pepper plant NDVI values in both years (Table 4). For instance, the average NDVI values for the plant were significantly higher (p ≤ 0.05) in the flowering season (by 13.6% and 6.59% in 2018; 5.51% and 2.07% in 2019) than in the growing and fruiting season (Table 3). Amending soil with H, BH, HL, and BHL treatments had no impact on NDVI values, compared to control, in the first season. However, B, L, and BL significantly reduced (p ≤ 0.05) NDVI by 9.07%, 11.71%, and 7.88%, compared to the control, in the first-year study. The green pepper plant NDVI was significantly enhanced (p ≤ 0.05) by amending soil with H by 11%, 15%, and 10%, and amending with BH by 12%, 15%, 10%, compared to B, L, and BL, in the first-year study. The maximum value of NDVI (0.86) was observed in the flowering and minimum (0.73) in the growing season, suggesting higher the NDVI values means the plants grow healthier than the lower values of plant NDVI.
In the second year the amendments L, H, BH, HL, and BHL significantly improved (p ≤ 0.05) NDVI by 3%, 3%, 2%, 2%, 2, compared to control. The maximum value of NDVI was in the flowering (0.93) and minimum in the growing (0.89) season. However, amendments B (0.91) and BL (0.91) had no effects on pepper plant NDVI, compared to control C (0.89) in the second year. Overall, the values indicated a similar trend in both years. The average NDVI values ranged from 0.74 to 0.85 in 2018 and 0.89 to 0.93 in 2019.
3.4.3. Photosynthesis Rate
The season (time) had a significant impact on photosynthesis in both years of the study. Notably, photosynthetic rates in pepper plants were significantly higher (p ≤ 0.05) during the flowering season (Table 3). Soil amendments did not affect photosynthetic rates in 2019 but had a significant effect in 2018. In the first year, amendments L, H, BH, HL, and BHL significantly improved (p ≤ 0.05) photosynthetic rates, compared to B, with increases of 21%, 13%, 23%, 14%, and 26%, respectively. However, throughout the study, amendments L, H, BL, BH, and HL did not significantly affect photosynthetic rates, compared to the non-amended control, while amendment B significantly reduced photosynthetic rates by 12% (p ≤ 0.05), compared to the control. The average photosynthetic rates ranged from 15.17 to 19.20 μmol CO2 m−2 s−1 in 2018 and from 16.25 to 18.74 μmol CO2 m−2 s−1 in 2019.
3.5. Soil Amendments Affected Plant Yield and Biomass
Soil amendments significantly influenced green pepper yield across all years of the study (Figure 3a-c). In the second year, mixed amendments BH, HL, and BHL significantly increased (p ≤ 0.05) yield by 24%, 29%, and 38%, respectively, compared to the control (C). When compared to lime (L), these amendments enhanced yield by 23%, 28%, and 37%, respectively (Figure 3b). Although single amendments showed numerically higher yields than the control in the second year, the differences were not statistically significant.
In the third year, all amendments (B, L, H, BL, BH, HL, and BHL) significantly improved (p ≤ 0.05) green pepper yield, compared to the control, with increases of 33%, 18%, 21%, 28%, 24%, 37%, and 53%, respectively. Average yields in the second year ranged from 1.22 kg/plant (control) to 1.69 kg/plant (BHL), while in 2020, they ranged from 0.858 kg/plant (control) to 1.31 kg/plant (BHL). In contrast, during the first year 2018, B, BL, and BHL significantly reduced (p ≤ 0.05) yield by 70%, 60%, and 34%, respectively, compared to the control (Figure 3a). First-year yields ranged from 0.337 to 1.26 kg/plant, with the lowest values observed in biochar (B) and biochar-lime (BL) treatments (0.33 kg/plant and 0.44 kg/plant, respectively), while other treatments showed no significant differences from the control.
Soil amendments also had a significant impact on aboveground biomass (Figure 3d-f). In 2018, amendments H and BH significantly increased (p ≤ 0.05) biomass, compared to the control, with BH producing the highest biomass (0.270 kg) and B producing the lowest (0.1187 kg). In 2019, amendments H, BH, HL, and BHL significantly enhanced (p ≤ 0.05) aboveground biomass, compared to the control (Figure 3b). Similarly, in 2020, H, L, BH, and BHL treatments significantly increased (p ≤ 0.05) biomass, while other amendments showed no significant effects. H produced the highest biomass in both years (0.297 kg in 2019 and 0.220 kg in 2020), while the control produced the lowest (0.2012 kg in 2019 and 0.165 kg in 2020).
Treatments influenced root traits, including root length, surface area, diameter, and volume, throughout the study (Figure 4a-h). In the first season, amendments L, BH, HL, and BHL significantly increased (p ≤ 0.05) root length, compared to the control. A similar trend was observed in the second season, where H, BH, HL, and BHL significantly enhanced (p ≤ 0.05) root length. Root-specific surface area was significantly greater (p ≤ 0.05) in L, BH, HL, and BHL treatments, compared to the control, in 2018. In 2019, amendments B, BH, and HL significantly increased (p ≤ 0.05) root-specific surface area, compared to the control. Amendment HL significantly increased (p ≤ 0.05) root diameter, compared to the control and BH, in 2018, although no significant effects were observed in 2019. Root volume was significantly improved (p ≤ 0.05) by L and HL in 2018, and by BHL in 2019. Overall, the HL amendment produced the highest root length (595.44 cm), surface area (23.31 cm²), diameter (2.13 mm), and volume (40.58 cm³) in 2018, while the control exhibited the lowest values. In 2020, the combined application of BHL resulted in the greatest root length (809.638 cm) and volume (34.674 cm³), while BH achieved the highest root surface area (23.53 cm²). The lowest root metrics were consistently observed in unamended soil (control), with root length (397.72 cm), surface area (18.06 cm²), and volume (17.88 cm³).
3.6. Correlation Between Leachate Properties, Soil and Plant Parameters
In the first season, leachate volume positively correlated with N and P losses and negatively correlated with root traits (root volume, root surface area, root length). Leachate volume, soil Mg, and pH positively correlated with leachate N losses. Leachate characteristics (Leachate volume, N and P lose) negatively correlated with biomass and yield, while root traits (root volume, root surface area, root length, and root diameter) positively correlated with NDVI, biomass, and only root surface area positively correlated with yield (Figure 5a). In the second season, the pepper yield was positively correlated with soil parameter (N, K) and root traits (root length and root surface area), whereas leachate volume, N losses, and P losses negatively correlated with plant NDVI, yield, and biomass (Figure 5b). Soil K and CEC, Root volume, root diameter, and root length positively correlated with NDVI, while only SOM and soil P positively correlated with SPAD. The leachate volume positively correlated with N and P losses. Soil K and SOM negatively correlated with Leachate N, P loss and volume, and soil P with leachate N loss and volume. Root traits (root volume, surface area, and length) negatively correlated with leachate volume. Root length and root volume negatively correlated with P losses, and surface area and root length negatively correlated with N losses (Figure 5b).
In the third season, a significant positive correlation was observed between pepper yield and soil properties (Ca, P, K, SOM, N, pH). Conversely, leachate characteristics exhibited a negative correlation with yield and biomass. Furthermore, soil N, K, SOM, and CEC negatively correlated with leachate volume, N, and P losses (Figure 5c).
3.7. Principal Component Analysis
In 2018, the first two principal components (PCA1 and PCA2) explained 30.82% and 18.52% of the variation, respectively, as shown in the PCA biplot (Figure 3a in the supplementary information documents). Principal component analysis (PCA) revealed that leachate volume and P loss were negatively correlated with root traits (root length and surface area), yield, and soil N. Additionally, soil pH, Mg, Ca, and CEC showed a strong positive relationship among themselves, while root traits, SPAD (chlorophyll content), yield, and soil nutrients (P, K, SOM) also exhibited positive correlations. A negative correlation was observed between soil CEC and Ca with soil Al. A similar pattern of relationships was observed in 2019 (Figure 6).
In 2020, PCA1 and PCA2 accounted for 49.02% and 20.66% of the total variation, respectively (Figure 3b in the supplementary information documents). The analysis highlighted that leachate volume and nutrient losses negatively correlated with plant biomass, yield, and soil nutrients, including Mg, N, and SOM. Soil pH, Ca, P, and K were positively correlated with each other, while plant biomass, yield, and soil nutrients (Mg, N, and SOM) also showed strong positive relationships. Along PCA2, the non-amended control exhibited the highest leachate volume and nutrient loss, emphasizing the effectiveness of amendments in reducing nutrient leaching and enhancing soil quality.
4. Discussion
Soil pH plays a vital role in driving the fate of other soil properties, such as the soil’s CEC. Incorporating B, L, BL, HL, and BHL in the soil significantly increased soil CEC (Table 2). Increased CEC of soil is associated with soil pH and other cations; this is supported by the positive correlation between soil pH, Ca, Mg, and CEC and the negative correlation with Al and CEC (Figure 5a-c). Previous studies have shown that incorporating biochar, lime, and their combination significantly increased (p ≤ 0.05) soil CEC because of increased soil pH and other associated cations [60]. However, in this study, H application alone did not affect soil CEC, which aligns with previous studies [18]. The increase of soil CEC for combined amendment BH, BL, HL and BHL can be justified by the incorporation of B and L into the topsoil, which also agrees with previous research findings [18,61]. The CEC of the soil or the exchangeable cations can be raised by the exchange reaction between the amendment’s (B, L, BL, HL, and BHL) exchangeable cations and the soil’s exchangeable anions [62], highlighting the practical implications of our research in improving soil fertility and nutrient retention.
The amendments B, L, and H and their combination significantly enhanced (p ≤ 0.05) SOM in the last two seasons. When biochar is added to the soil, the high specific surface area and the high pore structure of biochar (Table 1) can improve the capacity of the soil to adsorb and retain SOM [63]. SOM was positively correlated with soil K and P in 2019 and negatively correlated with nutrient losses and leachate volume (Figure 5b). The lime and lime-based combined amendments such as L, BL, HL, and BHL treatments enhanced soil N content, probably due to the increment of soil pH, Ca, and Mg content (Table 4), which is in agreement with other studies [64] and which is supported by the correlation study where we found a positive correlation between soil N and pH (Figure 5b). L and B did not affect soil P in the first year because the amendments took some time to get conditioned, which was reported in the previous studies [65,66,67]. The availability of P concentration in the soil may have increased in the second and third seasons with the addition of B, BL, HL, and BHL due to increased soil pH (Table 2). The total P content in the hardwood biochar and lime (Table 1 and 2) could also contribute available P enhancement in the soil. Biochar serves as a source of Ca and Mg, which can enhance soil P availability. The high Ca and Mg content in biochar can lead to the formation of Ca and Mg phosphates, reducing plant-available P loss. This process ultimately increases the concentration of available P in the soil [68,69,70].
The mixed amendments, BH, HL, and BHL, significantly improved (p ≤ 0.05) soil properties during the first two years, with HL and BHL continuing to show significant enhancements in the third season (Table 2). The synergistic interaction of biochar, hydrogel, and lime notably increased soil K, aligning with findings by Ahmed et al. [71], who reported that the application of BH enhanced the availability of soil nutrients. Treatment H alone also contributed to increased soil K levels, likely due to its slow nutrient release, as hydrogel contains K in its structure [18]. The observed rise in soil K concentrations may also be attributed to the inherent K content in biochar (Table 1). Furthermore, hydrogel, composed of copolymer K acrylate and acrylamide, acts as a direct source of K in the soil [72]. Another factor contributing to improved soil K is the combined action of biochar and lime, which supply additional cations, while hydrogel aids nutrient retention through its slow-release properties [73]. Additionally, a positive correlation was observed between soil K and soil pH, SOM, and P, while a negative correlation was noted between soil K and leachate volume (Figure 5b-c). These findings highlight the role of mixed amendments in enhancing soil nutrient dynamics.
Treating soil with L, BL, HL, and BHL significantly increased (p ≤ 0.05) soil Ca, while L, HL, and BHL also increased Mg concentrations throughout the study. Biochar only increased Mg in the first season. Our results are consistent with previous studies that have reported lime additions enhance available Ca and Mg in soil [64,74]. The increased concentrations of Ca and Mg in the soil can be attributed to the higher content of these elements in lime and biochar (Table 1 and Table 2). Furthermore, the combined application of BL, HL, and BHL resulted in higher levels of Ca and Mg, compared to individual amendments, likely because the combination of lime and biochar, along with other amendments, contributes additional Ca and Mg while improving the soil’s ability to retain these nutrients through enhanced water-holding capacity (Figure 1a-c). Another potential reason for the increased availability of Ca could be the improvement in soil pH and cations, as lime and biochar both positively influence the soil’s pH, which in turn increases the availability of Ca. This relationship is supported by the positive correlation between Ca, soil pH, and cation exchange capacity (CEC) (Figure 5a-c). Additionally, lime may indirectly enhance Mg availability by replacing Mg from exchange sites as it increases the soil’s overall cation exchange capacity [75].
Except for H, there was no significant treatment effect on total normalized leachate volume in 2018, likely due to lower yield and biomass production (Figure 2a; Figure 3a). The significantly lower (p ≤ 0.05) normalized leachate volume observed with the H amendment suggests that water retention in the loamy sand soil was primarily influenced by the addition of the polymer, which has been documented in several studies [72,76,77]. Another possible reason for improved water retention in hydrogel-amended soil could be the enhancement of soil aggregation, which results from the bond between the functional groups of the hydrogel polymer and the negatively charged surface of the soil [78]. Although mixed amendments significantly reduced (p ≤ 0.05) the total normalized leachate volume in the second and third years of the study, neither B nor L had any significant effect during the first two years. Similarly, previous studies have shown that some biochar additions had no significant impact on total leachate volume [79]. In column leaching studies, Laird et al. [80] and Lehmann et al. [81] also found that biochar did not significantly affect leachate volume. However, in contrast to our study, Purkaystha et al. [10] reported that wheat straw biochar significantly reduced total leachate volume in loamy sand and sandy soils, suggesting that biochar’s effectiveness depends on feedstock type and pyrolysis temperature. In our study, treatment B did not reduce total leachate volume in the first season (Figure 1a), which may have been due to its hydrophobic characteristics [83]. Over time, this effect diminished, and by the third year, B significantly enhanced (p ≤ 0.05) water retention in the soil (Figure 1b-c).
Our results showed that combined amendments, BH, HL, and BHL significantly reduced (p ≤ 0.05) total leachate volume. This reduction is likely due to the hydrogel (polymer and acrylamide) maintaining a polymer matrix, which allows biochar to attach and form a strong reservoir, effectively retaining a substantial amount of water in the soil [83]. The improvement of SOM through these amendments (Table 2) is an important factor, as it serves as a health indicator of soil and contributes to increased water-holding capacity, consistent with findings from previous studies [6,10,84]. The relationship between increased SOM and reduced leachate volume can be supported by the negative correlation observed between SOM and leachate volume (Figure 5b-c).
Although the treatments had a significant effect on nitrate-N leaching concentrations, there was no significant reduction in orthophosphate-P concentration in the leachate, compared to non-amended soil. B and BH amendments significantly increased (p ≤ 0.05) P concentration, which is in agreement with previous studies that reported biochar increased P concentrations in leachates from sandy soils and oxisols [85,86,87,88]. The higher available P concentration in biochar compared to loamy sand soil (Table 1) likely contributed to the increased P concentration in the leachate. Hydrogel demonstrated the greatest reduction in nitrate-N leaching concentration, likely due to its higher water retention capacity compared to other amendments (Figure 1a-c) [19].
Throughout the study, leaching of nitrate-N and orthophosphate-P was mediated by total leachate volume; as the leachate volume increased, so did the nutrient concentration, which aligns with findings from Campo et al. [19] and Purkaystha et al. [10]. Our correlation study revealed a strong positive correlation between total leachate volume and nitrate-N and orthophosphate-P losses (Figure 5a-c; Figure 6a-c), confirming that nutrient losses are dependent on leachate volume. The lowest cumulative leaching of nitrate-N and orthophosphate-P occurred in the hydrogel-amended treatment, which was attributed to the reduced leachate volume, compared to other amendments (Figure 1a-c). Hydrogel’s ability to enhance water retention and the slow water and nutrient in the soil actively reduced the leaching of N and P [19,89,90].
In the present study, the application of B significantly reduced (p ≤ 0.05) nitrate-N leaching, which aligns with previous research [10,91,92]. The high specific surface area (Table 1), porous structure, and functional groups of biochar improved water retention and nutrient retention in the soil, reducing nitrate-N leaching by decreasing water leaching volume [10,93]. However, biochar did not reduce orthophosphate-P losses in our study, which is consistent with findings from Lu et al. [95]. Biochar actually resulted in higher orthophosphate-P losses, compared to other amendments, due to the higher availability of phosphorus in biochar (Table 1), and the co-application of biochar with fertilizer increases water-soluble phosphorus in the soil, leading to higher concentrations of phosphorus in the leachate [10,88].
L amendment significantly reduced (p ≤ 0.05) orthophosphate-P leaching in the last two consecutive years, in line with studies by Ulen and Etana [24], Blomquist et al. [28], and Elsamian et al. [25]. However, liming did not affect phosphorus leaching in the first year, likely because lime requires time to react in the soil, a finding confirmed by Farina et al. [65] and Conyers et al. [66], who reported lime may take up to a decade to fully react.
The combination of BH was more effective at reducing nutrient leaching than biochar alone (Figure 2a-f), possibly due to the synergistic effect of both amendments. The greater effect of BH on nutrient loss indicated that hydrogel reduced biochar’s negative impact on leachate volume (Figure 1a-c). Biochar alone had a less significant impact on nutrient loss (nitrate-N and orthophosphate-P) due to its limited water retention properties (Figure 1).
Overall, soil properties (pH, SOM, CEC, N, Ca, Mg) and leachate volume had a direct influence on reducing nutrient losses when soil amendments were incorporated (Figure 2a-f). The negative correlation between soil properties (pH, N, K, Mg, SOM, CEC) and nutrient losses (nitrate-N and orthophosphate-P loss) confirmed that improved soil quality reduced N and P leaching (Figure 5a-c). Additionally, the increased water retention resulted in decreased nitrate-N and orthophosphate-P losses, supported by the negative correlation between leachate volume and nutrient losses (Figure 5a-c). The significantly enhanced green pepper plant root parameters were linked to decreased water and nutrient losses, as shown by the negative correlation between plant root traits (root length, surface area, and root volume) and leachate properties (Figure 5a-b). The correlation studies confirmed that soil nutrients (K, SOM) and leachate properties (leachate volume, N, P losses) were negatively correlated, suggesting that water retention and nutrient losses were chemically driven [10,95].
The overall improvement of soil properties (physical and chemical) had a significant impact on green pepper plant yield due to the incorporation of single and combined amendments (Figure 3a-c). The application of mixed amendments (BH, HL, and BHL) significantly increased (p ≤ 0.05) yield, compared to non-amended soil (control), in the second year (Figure 3b), due to improved soil nutrients (N, P, K, SOM, CEC) and water retention (Figure 2b). In 2020, all single and mixed amendments significantly improved (p ≤ 0.05) yield, suggesting that the adverse effects of treatments diminished over time [65,66,67].
In 2018, B, BL, and BHL amendments significantly reduced (p ≤ 0.05) green pepper yield in the first season (Figure 3a), which is consistent with previous studies [96,97]. However, in the second year, B increased yield by 2.35-fold, compared to the first year, and significantly improved (p ≤ 0.05) in the third year. This result suggests that biochar conditioning or aging improved its performance in soil, enhancing plant growth and yield [67]. A similar result was observed in a four-year study on maize yield, which increased in subsequent years (28%, 30%, and 140%, respectively) but not in the first year [67]. Despite improvements in soil N, K, and CEC (Table 4) and reductions in nitrate-N leaching (Figure 2), biochar did not significantly improve yield in the first two years, a finding that aligns with Sanger et al. [98], who also observed a lack of yield improvement due to biochar’s negatively charged surface and its potential to adsorb cationic nutrients, limiting their availability to plants [99,100,101].
In the present study, treatment H improved yield numerically in the second year and significantly (p < 0.05) in the third year, compared to non-amended soil, likely due to enhanced nutrient and water retention (Figure 1; Figure 2). Previous studies have also demonstrated that hydrogel-amended soils improve crop yields (tomato, potato, red bean) by increasing water holding capacity [16,52,102].
Amendment L reduced yield in the first year and did not significantly improve it in the second year, likely due to the slow reaction time of lime in the soil [103]. Similar findings were reported in several studies [104,105,106], indicating that lime requires time to fully react in the soil, possibly up to a decade [65,66].
Mixed amendments (BH, HL, BHL) increased yield, compared to individual treatments (B, H) (Figure 3b-c), due to increased water retention (Figure 1b-c), reduced nutrient losses, and improved soil nutrients such as N, K, and CEC in the second year (Table 4), and N, P, K, and CEC in the third year (Table 2) [34]. Our correlation results confirmed that plant yield was positively correlated with soil N and K in the second season (Figure 5b) and with soil P, K, Ca, pH, and SOM in the third year (Figure 5c). Moreover, mixed amendments increased plant root length and root-specific surface area, which promotes greater water and nutrient availability, thereby enhancing yield [107]. The correlation study supported this, as yield was positively correlated with root traits (root length, specific surface area, and root volume) in the second season (Figure 5b).
The increased yield and plant growth observed with mixed amendments (BH, HL) were likely due to their synergistic effects, which are consistent with studies by Youssef et al. [34] and Alkasha et al. [33]. However, the BL amendment did not significantly increase yield in the first two years but improved yield in the third year due to enhanced soil pH, CEC, and decreased Al toxicity (Table 2). Mosharrof et al. [108] documented that combining rice husk biochar and lime increased maize yield by improving soil pH, phosphorus availability, and reducing aluminum toxicity.
Overall, mixed amendments in 2019 and all amendments in 2020 significantly enhanced (p ≤ 0.05) green pepper plant yield by improving water and nutrient retention, which is confirmed by the negative correlation between plant yield and leachate properties (leachate volume, nitrate-N, and orthophosphate-P losses) (Figure 5a-c). Enhanced root networks through the application of soil amendments improved water and nutrient uptake by plants, resulting in increased plant yield, supported by the positive correlation between root traits and plant yield (Figure 5b).
The application of H and BH amendments significantly increased (p ≤ 0.05) aboveground biomass throughout the study (Figure 3d-f). Hydrogel-amended soil stores more water in the root zone, and biochar retains nutrients, which allows for better translocation of water and nutrients when plants need them. Therefore, the BH, HL, and BHL amendments significantly improved (p ≤ 0.05) plant biomass [109,110]. In our study, amendments (L, H, BH, HL, BHL) increased biomass due to improved soil properties. Orikiriza et al. [111] found that plant biomass improvement is linked to soil fertility, which aligns with our study, as soil nutrients (available K, P, and SOM in 2019, and soil N and Mg in 2020) were positively correlated with green pepper plant biomass (Figure 5b). Additionally, the application of mixed amendments (BH, HL, BHL) significantly increased (p ≤ 0.05) aboveground biomass in the third year, likely due to increased root and leaf growth as the combined amendments improved soil nutrients and water retention [106].
Adding soil amendments such as biochar, lime, hydrogel, or a combination of them (except biochar-lime) had no significant effect on plant greenness, which is consistent with other studies [112,113,114].
B, L, and BL reduced NDVI in the first year, most probably due to incomplete utilization of nutrients despite increasing soil nutrients (Table 2), and our correlation study showed that CEC and soil pH were negatively correlated with Plant NDVI in 2018. In contrast to the first year, amendments L, H, BH, HL and BHL significantly enhanced pepper NDVI in the second season, which was consistent with a previous study [115] reported that organic soil amendments (biochar, biochar-compost) significantly increased black pepper NDVI in sandy soil. This improvement may be because of conditioning or aging of the amendments (B and L) in the soil over time [66,67]. Another possible reason for this improvement can be attributed to the enhancement pepper root architectures, which can facilitate the capture of enough available water and nutrients for plants [116]. Our correlation results also supported the findings that the green pepper plant root volume, diameter, and length positively correlated with plant NDVI (Figure 5a-b). In our study, amendments improved the water and nutrient retention capacity of the soil by decreasing leachate volume (Figure 1a-c) and nutrient losses (Figure 2a-c), thereby, enhancing NDVI. These findings were also in line with our correlation results where leachate volume, N losses, and P losses negatively correlated with NDVI whereas Soil K and CEC correlated positively with NDVI (Figure 5b). The higher NDVI of H, BH, HL, and BHL can be attributed the higher biomass (Figure 3 d-f) which agrees with Dhimal et al., [18].
Apart from biochar, no other amendments significantly impacted pepper plant leaf photosynthesis (Table 3). Similarly, in a separate study, Dhiman et al. [18] documented that biochar, hydrogel, and biochar-hydrogel had no significant effect on potato plant photosynthesis rates. Studies have reported that chlorophyll content is positively correlated with plant photosynthetic rates [117], which is attributed to our findings where the lower NDVI value of biochar treatment corroborated the lower photosynthetic rates than other amendments (Table 3). Another possible reason for lower NDVI values is due to the fresh biochar application, and its negatively charged surface can adsorb cationic nutrients, which could lead to incomplete utilization of retained nutrients (especially nitrogen) in the soil by the plant, therefore negatively impacting plant growth, especially photosynthetic rates, in the first year. (Table 3) [102]. Overall, the SPAD, NDVI values, and photosynthetic rates were higher in the flowering season. This may be because of fertilizer application and vigorous up-taking of nutrients by the plants during the flowering season.
5. Environmental and Economic Implications
The amendment of soil with biochar, hydrogel, and lime, either individually or in combination, can significantly reduce water and nutrient leaching (nitrate-N and orthophosphate-P). This, in turn, can lead to a significant reduction of nutrient losses, and thus, nutrient loading in water bodies, helping to avoid groundwater pollution and eutrophication of surface water bodies. While the cost of these amendments may result in additional expense, their economic and environmental value would justify their application. For example, biochar, hydrogel, and lime can remain in the soil for many years, which avoids the cost of frequent reapplication. Moreover, they reduce the frequency of fertilizer applications and irrigation, preserving nutrients and retaining water in the soil. Research has also shown that biochar can boost plant growth and yield as much as seven years after its application [101,118]. As a result, farmers can benefit from higher yields by retaining soil nutrients and improving the soil’s water-holding capacity. However, the economic dynamics and implications of the use of the proposed amendments warrants a thorough investigation.
6. Conclusions
This study demonstrates the significant role of soil amendments, particularly mixed amendments of biochar, hydrogel, and lime, in improving soil properties, plant physiological performance, and yield in green peppers. The synergistic effects of these amendments noticeably enhanced key soil nutrients, such as K, SOM, and P, while also improving soil pH and reducing nutrient leaching losses, especially in a coarse-textured soil. These improvements translated into higher photosynthetic rates, greater aboveground biomass, and enhanced rooting systems, which collectively contributed to increased yields, particularly under the mixed amendments of BH, HL, and BHL.
The results highlight the dual benefit of these amendments in mitigating nutrient losses and enhancing nutrient availability, thereby, promoting sustainable crop production. Biochar and lime provided available nutrients, while hydrogel’s ability to retain nutrients and release them slowly further supported soil nutrient dynamics and plant growth. The principal component analysis (PCA) provided additional insights, showing strong correlations between soil properties, plant physiological traits, and yield, emphasizing the amendments’ effectiveness in maintaining soil fertility and enhancing crop productivity.
The three-year study revealed that the proposed soil amendments helped to reduce nitrate-N (an average 1 mg -13 mg) and orthophosphate-P losses (an average 0.09 mg - 0.49 mg) per unit biomass by improving water-holding capacity and nutrient availability. Adding combined amendments BL, BH, HL, and BHL to the soil significantly boosted (p ≤ 0.05) green pepper yields (average 1 kg - 1.69 kg per plant) by enhancing soil properties and water retention.
Overall, this study highlights the potential of integrated soil amendment strategies to improve soil health and support sustainable agriculture, particularly in systems vulnerable to nutrient loss. Future research should explore long-term effects and the economic feasibility of these amendments across diverse cropping systems and environmental conditions. Further research should also explore integrated approaches for different soil textures to understand how variations in soil texture, soil structure, porosity, and water-holding capacity influence the effectiveness of soil amendments. For instance, sandy soils with low nutrient retention and high permeability may respond differently to amendments like hydrogel and biochar, compared to clayey soils, which have higher nutrient retention but poor drainage. Investigating these interactions can help optimize amendment formulations and application rates tailored to specific soil types. Additionally, long-term studies are needed to assess the cumulative effects of these amendments on soil health, crop productivity, and nutrient dynamics under diverse soil textures. Such studies would provide valuable insights into designing targeted, sustainable soil management practices for a wide range of agricultural systems.
Supplementary Materials
The following supporting information can be downloaded at the website of this paper posted on Preprints.org.
Acknowledgments
The study was funded by the Natural Sciences and Engineering Research Council Canada (NSERC). The authors appreciate Dr. Ali Mawof, Ms. Tianai Zhou, and Mr. Ravi Dwivedi Leng for their assistance in data collection. We also thank Ms. Sedigheh Zarayan for providing support at the Soil and Water Quality Lab, McGill University.
References
- Kaur, S., & Chauhan, B. S. (2023). Challenges and opportunities to sustainable crop production. Plant Small RNA in Food Crops, 25-43. [CrossRef]
- Grassini, P., Bussel, v. L. G. J., Wart, v. J., Wolf, J., Claessens, L., Yang, H., Cassman, K. G. (2015). How good is good enough? Data requirements for reliable crop yield simulations and yield-gap analysis. Field Crops Research, 177, 49-63. [CrossRef]
- Yu, Y., Feng, K., & Hubacek, K. (2013). Tele-connecting local consumption to global land use. Global Environmental Change, 23(5), 1178-1186. [CrossRef]
- El Idrissi, A., Dardari, O., Metomo, F. N. N. N., Essamlali, Y., Akil, A., Amadine, O., Zahouily, M. (2023). Effect of sodium alginate-based superabsorbent hydrogel on tomato growth under different water deficit conditions. International Journal of Biological Macromolecules, 253, 127229. [CrossRef]
- Lehmann, J., Pereira da Silva, J., Steiner, C., Nehls, T., Zech, W., & Glaser, B. (2003). Nutrient availability and leaching in an archaeological Anthrosol and a Ferralsol of the Central Amazon basin: fertilizer, manure and charcoal amendments. Plant Soil, 249(2), 343-357. [CrossRef]
- Lehmann, J., Kuzyakov, Y., Pan, G., & Ok, Y. S. (2015). Biochars and the plant-soil interface. Plant and Soil, 395, 1-5. [CrossRef]
- Muñoz, E., Curaqueo, G., Cea, M., Vera, L., & Navia, R. (2017). Environmental hotspots in the life cycle of a biochar-soil system. Journal of Cleaner Production, 158, 1-7. [CrossRef]
- Singh Mavi, M., Singh, G., Singh, B. P., Singh Sekhon, B., Choudhary, O. P., Sagi, S., & Berry, R. (2018). Interactive effects of rice-residue biochar and N-fertilizer on soil functions and crop biomass in contrasting soils. Journal of Soil Science Plant Nutrition, 18(1), 41-59. [CrossRef]
- Tian, X., Li, C., Zhang, M., Wan, Y., Xie, Z., Chen, B., & Li, W. (2018). Biochar derived from corn straw affected availability and distribution of soil nutrients and cotton yield. PLoS ONE, 13(1), e0189924. [CrossRef]
- Purkaystha, J., Prasher, S., Afzal, M. T., Nzediegwu, C., & Dhiman, J. (2022). Wheat straw biochar amendment significantly reduces nutrient leaching and increases green pepper yield in a less fertile soil. Environmental Technology & Innovation, 28, 102655. [CrossRef]
- Arif, M., Ali, K., Jan, M. T., Shah, Z., Jones, D. L., & Quilliam, R. S. (2016). Integration of biochar with animal manure and nitrogen for improving maize yields and soil properties in calcareous semi-arid agroecosystems. Field Crops Research, 195, 28-35. [CrossRef]
- Agegnehu, G., Nelson, P. N., & Bird, M. I. (2016). Crop yield, plant nutrient uptake and soil physicochemical properties under organic soil amendments and nitrogen fertilization on Nitisols. Soil Tillage Research, 160, 1-13. [CrossRef]
- Yu, Y., Deng, C., Meng, F., Shi, Q., Feijen, J., & Zhong, Z. (2011). Novel injectable biodegradable glycol chitosan-based hydrogels crosslinked by Michael-type addition reaction with oligo (acryloyl carbonate)-b-poly (ethylene glycol)-b-oligo (acryloyl carbonate) copolymers. Journal of Biomedical Materials Research Part A, 99(2), 316-326. [CrossRef]
- Ahmed, E. M. (2015). Hydrogel: Preparation, characterization, and applications: A review. Journal of Advanced Research, 6(2), 105-121. [CrossRef]
- Fan, Z., Tian, X., Zhai, S., Liu, Z., Chu, P., Li, C., ... & Li, T. (2022). Co-application of controlled-release urea and a superabsorbent polymer to improve nitrogen and water use in maize. Archives of Agronomy and Soil Science, 68(7), 914-928. [CrossRef]
- Rezashateri, M., Khajeddin, S. J., Abedi-Koupai, J., Majidi, M. M., & Matinkhah, S. H. (2017). Growth characteristics of Artemisia sieberi influenced by super absorbent polymers in texturally different soils under water stress condition. Archives of Agronomy Soil Science, 63(7), 984-997. [CrossRef]
- Elbarbary, A. M., & Ghobashy, M. M. (2017). Controlled release fertilizers using superabsorbent hydrogel prepared by gamma radiation. Radiochimica Acta 105(10), 865-876. [CrossRef]
- Dhiman, J., Prasher, S. O., ElSayed, E., Patel, R. M., Nzediegwu, C., & Mawof, A. (2021). Effect of hydrogel based soil amendments on heavy metal uptake by spinach grown with wastewater irrigation. Journal of Cleaner Production, 311, 127644. [CrossRef]
- Del Campo, M. M., Esteller, M., Morell, I., Expósito, J., Bandenay, G., & Díaz-Delgado, C. (2019). A lysimeter study under field conditions of nitrogen and phosphorus leaching in a turf grass crop amended with peat and hydrogel. Science of the Total Environment, 648, 530-541. [CrossRef]
- Omogbohu Anetor, M., & Akinkunmi Akinrinde, E. (2007). Lime effectiveness of some fertilizers in a tropical acid alfisol. Journal of Central European Agriculture, 8(1), 17-24.
- Ayalew, A. (2011). The influence of applying lime and NPK fertilizers on yield of maize and soil properties on acid soil of Areka, southern region of Ethiopia. Innovative Systems Design and Engineering, 2(7), 33-42.
- Fageria, N. K., & Nascente, A. S. (2014). Management of soil acidity of South American soils for sustainable crop production. Advances in Agronomy, 128, 221-275. [CrossRef]
- Raboin, L.-M., Razafimahafaly, A. H. D., Rabenjarisoa, M. B., Rabary, B., Dusserre, J., & Becquer, T. (2016). Improving the fertility of tropical acid soils: Liming versus biochar application? A long-term comparison in the highlands of Madagascar. Field Crops Research, 199, 99-108. [CrossRef]
- Ulén, B., & Etana, A. (2014). Phosphorus leaching from clay soils can be counteracted by structure liming. Acta Agriculturae Scandinavica, Section B—Soil Plant Science, 64(5), 425-433. [CrossRef]
- Eslamian, F., Qi, Z., Tate, M. J., & Romaniuk, N. (2020). Lime application to reduce phosphorus release in different textured intact and small repacked soil columns. Journal of Soils Sediments, 20, 2053-2066. [CrossRef]
- Olsson, Å., Persson, L., & Olsson, S. (2019). Influence of soil characteristics on yield response to lime in sugar beet. Geoderma, 337, 1208-1217. [CrossRef]
- Holland, J. E., Bennett, A., Newton, A., White, P., McKenzie, B., George, T., Hayes, R. (2018). Liming impacts on soils, crops and biodiversity in the UK: A review. Science of the Total Environment, 610, 316-332. [CrossRef]
- Blomquist, J., Simonsson, M., Etana, A., & Berglund, K. (2018). Structure liming enhances aggregate stability and gives varying crop responses on clayey soils. Acta Agriculturae Scandinavica, Section B—Soil & Plant Science, 68(4), 311-322. [CrossRef]
- Dhiman, J., Prasher, S. O., ElSayed, E., Patel, R. M., Nzediegwu, C., & Mawof, A. (2020). Heavy metal uptake by wastewater irrigated potato plants grown on contaminated soil treated with hydrogel based amendments. Environmental Technology & Innovation, 19, 100952. [CrossRef]
- Dhiman, J., Prasher, S. O., ElSayed, E., Patel, R., Nzediegwu, C., & Mawof, A. (2020). Use of polyacrylamide superabsorbent polymers and plantain peel biochar to reduce heavy metal mobility and uptake by wastewater-irrigated potato plants. Transactions of the ASABE, 63(1), 11-28. [CrossRef]
- Zainul, A., Hans-Werner, K., Bernhard, H., Bilquees, G., & Ajmal, K. (2017). Impact of a Biochar or a Compost-Biochar Mixture on Water relation, Nutrient uptake and Photosynthesis of Phragmites karka.. In: Pedosphere.
- Naeem, M. A., Khalid, M., Aon, M., Abbas, G., Amjad, M., Murtaza, B., Ahmad, N. (2018). Combined application of biochar with compost and fertilizer improves soil properties and grain yield of maize. Journal of Plant Nutrition, 41(1), 112-122. [CrossRef]
- Alkhasha, A., Al-Omran, A., & Louki, I. (2019). Impact of deficit irrigation and addition of biochar and polymer on soil salinity and tomato productivity. Canadian Journal of Soil Science, 99(4), 380-394. [CrossRef]
- Youssef, M. E.-S., Al-Easily, I., & AS Nawar, D. (2017). Impact of biochar addition on productivity and tubers quality of some potato cultivars under sandy soil conditions. Egyptian Journal of Horticulture, 44(2), 199-217. [CrossRef]
- Kumar, A., Elad, Y., Tsechansky, L., Abrol, V., Lew, B., Offenbach, R., & Graber, E. R. (2018). Biochar potential in intensive cultivation of Capsicum annuum L. (sweet pepper): crop yield and plant protection. Journal of the Science of Food and Agriculture, 98(2), 495-503. [CrossRef]
- De Lima, W. B., Cavalcante, A. R., Bonifácio, B. F., da Silva, A. A. R., de Oliveira, L. D., de Souza, R. F. A., & Chaves, L. H. G. (2019). Growth and development of bell peppers submitted to fertilization with biochar and nitrogen.
- Wang, G., Govinden, R., Chenia, H. Y., Ma, Y., Guo, D., & Ren, G. (2019). Suppression of Phytophthora blight of pepper by biochar amendment is associated with improved soil bacterial properties. Biology Fertility of Soils, 55, 813-824. [CrossRef]
- Xu, D., Zhao, Y., Zhou, H., & Gao, B. (2016). Effects of biochar amendment on relieving cadmium stress and reducing cadmium accumulation in pepper. Environmental Science Pollution Research, 23, 12323-12331. [CrossRef]
- yan, U., & El-Shimi, N. (2015). Effect of using some treatments on sweet pepper irrigation and its effect on fruit yield and its quality. Arab Universities Journal of Agricultural Sciences, 23(1), 25-36.
- Rasanjali, K.,, De Silva, C., & Priyadarshani, K. (2019). Influence of super absorbent polymers (saps) on irrigation interval and growth of black pepper (Piper nigrum L.) in nursery management. [CrossRef]
- Zhang, J.,Wang, C., Wang, J., Yang, Y., Han, K., Bakpa, E. P.,... Xie, J. (2023). Comprehensive fruit quality assessment and identification of aroma-active compounds in green pepper (Capsicum annuum L.) Frontiers in Nutrition, 9, 1027605. [CrossRef]
- Benson, G., Obadofin, A., & Adesina, J. (2014). Evaluation of plant extracts for controlling insect pests of pepper (Caspicum spp.) in Nigeria humid rainforest. New York Science Journal, 7(1), 39-43.
- Hendershot, W. H., Lalande, H., & Duquette, M. (2008). Soil reaction and exchangeable acidity. Soil sampling and methods of analysis. In C. M.R. & GregorichE.G. (Eds.), Soil sampling and methods of analysis (2nd edition ed., pp. 173-178). Pinawa, Manitoba, Canada: CRC Press. [CrossRef]
- Schulte, E., Kaufmann, C., & Peter, J. (1991). The influence of sample size and heating time on soil weight loss-on-ignition. Communications in Soil Science Plant Analysis, 22(1-2), 159-168. [CrossRef]
- Ziadi, N., & Tran, T. S. (2008). Mehlich 3-extractable elements. Soil sampling and methods of analysis. In M. R. Carter & E. G. Gregorich (Eds.), Soil sampling and methods of analysis (2nd edition ed., pp. 81-88). Pinawa, Manitoba: CRC press. [CrossRef]
- ugdug, A. A., Chang, S. X., Ok, Y. S., Rajapaksha, A. U., & Anyia, A. (2018). Phosphorus sorption capacity of biochars varies with biochar type and salinity level. Environmental science and pollution research international, 25(26), 25799-25812. [CrossRef]
- Lewis, C. J. (2005). Chemical facts pertaining to environmental uses for lime. USA: Graymont Inc. Booklet.
- Brunauer, S., Emmett, P. H., & Teller, E. (1938). Adsorption of gases in multimolecular layers. Journal of the American Chemical Society, 60(2), 309-319. [CrossRef]
- El-Tohamy, W. A., El-Abagy, H. M., Ahmed, E. M., Aggor, F. S., & Hawash, S. I. (2014). Application of super absorbent hydrogel poly (acrylate/acrylic acid) for water conservation in sandy soil. Transaction of the Egyptian Society of Chemical Engineering, 40(2), 1-8.
- Ahmed, E. M., Aggor, F. S., Nada, S. S., & Hawash, S. J. I. J. S. E. R. (2015). Synthesis and characterization of super absorbent polymers for agricultural purposes. International Journal of Scientific and Engineering Research, 6(3), 282-287.
- Batool, A., Taj, S., Rashid, A., Khalid, A., Qadeer, S., Saleem, A. R., & Ghufran, M. A. (2015). Potential of soil amendments (Biochar and Gypsum) in increasing water use efficiency of Abelmoschus esculentus L. Moench. Frontiers in plant science, 6, 733. [CrossRef]
- Suresh, R., Prasher, S. O., Patel, R. M., Qi, Z., Elsayed, E., Schwinghamer, T., & Ehsan, A. M. (2018). Super absorbent polymer and irrigation regime effects on growth and water use efficiency of container-grown cherry tomatoes. Transactions of the ASABE, 61(2), 523-531. [CrossRef]
- Pellerin, A. (2010). Les grilles de référence. In L. o.-E. t. Parent & G. Gagné (Eds.), Guide de Référence en Fertilisation (2e édition ed., pp. 359-471). Québec, Canada: Centre de Référence en Agriculture et Agroalimentaire du Québec.
- Food and Agriculture Organization of the United Nations (FAO). (2008). Chapter 2: Crop water needs. Retrieved from http://www.fao.org/3/s2022e/s2022e02.
- Smittle, D. A., Dickens, W. L., & Stansell, J. R. (1994). Irrigation regimes affect yield and water use by Bell Pepper. Journal of the American Society for Horticultural Science., 119(5), 936. [CrossRef]
- Netto, A. T., Campostrini, E., de Oliveira, J. G., & Bressan-Smith, R. E. (2005). Photosynthetic pigments, nitrogen, chlorophyll a fluorescence and SPAD-502 readings in coffee leaves. Scientia Horticulturae, 104(2), 199-209. [CrossRef]
- Prasad, A. K., Chai, L., Singh, R. P., & Kafatos, M. (2006). Crop yield estimation model for Iowa using remote sensing and surface parameters. International Journal of Applied Earth Observations and Geoinformation, 8(1), 26-33. [CrossRef]
- Hui, D., Yu, C.-L., Deng, Q., Saini, P., Collins, K., & Koff, J. (2018). Weak effects of biochar and nitrogen fertilization on Switchgrass photosynthesis, biomass, and soil respiration. Agriculture, 8(9), 143. [CrossRef]
- Sigge, G. O., Hansmann, C. F., & Joubert, E. (1998). Effect of temperature and relative humidity on the drying rates and drying times of green bell peppers (Capsicum annuum L.) Drying Technology, 16(8), 1703-1714. [CrossRef]
- Achalu, C., Heluf, G., Kibebew, K., Abi, T. (2012). Status of selected physicochemical properties of soils under different land use systems of Western Oromia, Ethiopia. Journal of Biodiversity and Environmental Sciences, 2(3), 57-71.
- Liang, B., Lehmann, J., Solomon, D., Kinyangi, J., Grossman, J., O’Neill, B., . . . Petersen. (2006). Black carbon increases cation exchange capacity in soils. Soil Science Society of America Journal, 70(5), 1719-1730. [CrossRef]
- Maru, A., Haruna, A. O., Asap, A., Majid, N. M. A., Maikol, N., & Jeffary, A. V. (2020). Reducing acidity of tropical acid soil to improve phosphorus availability and Zea mays L. Productivity through efficient use of chicken litter biochar and triple superphosphate. Applied Sciences, 10(6), 2127. [CrossRef]
- Suliman, W., Harsh, J. B., Abu-Lail, N. I., Fortuna, A. M., Dallmeyer, I., & Garcia-Pérez, M. (2017). The role of biochar porosity and surface functionality in augmenting hydrologic properties of a sandy soil. Science of the Total Environment, 574, 139-147. [CrossRef]
- Barman, M., Shukla, L. M., Datta, S. P., & Rattan, R. K. (2014). Effect of applied lime and boron on the availability of nutrients in an acid soil. Journal of Plant Nutrition, 37(3), 357-373. [CrossRef]
- Farina, M. P. W., Channon, P., & Thibaud, G. R. (2000). A Comparison of Strategies for Ameliorating Subsoil Acidity I. Long-Term Growth Effects. Soil Science Society of America Journal, 64(2), 646-651. [CrossRef]
- Conyers, M., Heenan, D., McGhie, W., & Poile, G. (2003). Amelioration of acidity with time by limestone under contrasting tillage. Soil and Tillage Research, 72(1), 85-94. [CrossRef]
- Major, J., Rondon, M., Molina, D., Riha, S. J., & Lehmann, J. (2012). Nutrient Leaching in a colombian savanna oxisol amended with biochar. Journal of Environmental lity, 41(4), 1076-1086. [CrossRef]
- Parvage, M. M., Ulén, B., Eriksson, J., Strock, J., & Kirchmann, H. (2013). Phosphorus availability in soils amended with wheat residue char. J Biology fertility of soils, 49(2), 245-250. [CrossRef]
- Vandecasteele, B., Sinicco, T., D’Hose, T., Nest, T. V., & Mondini, C. (2016). Biochar amendment before or after composting affects compost quality and N losses, but not P plant uptake. Journal of Environmental Management, 168, 200-209. [CrossRef]
- Chintala, R., Schumacher, T. E., McDonald, L. M., Clay, D. E., Malo, D. D., Papiernik, S. K., . . . Julson, J. L. (2014). Phosphorus sorption and availability from biochars and soil/B iochar mixtures. CLEAN–Soil, Air, Water, 42(5), 626-634. [CrossRef]
- Ahmed, S., Fahmy, A. J. J. o. S. S., & Engineering, A. (2019). Applications of natural polysaccharide polymers to overcome water scarcity on the yield and quality of tomato fruits. Journal of Soil Sciences Agricultural Engineering10(4), 199-208. [CrossRef]
- Costa, M. C. G., Freire, A. G., Lourenço, D. V., Sousa, R. R. d., Feitosa, J. P. d. A., & Mota, J. C. A. (2021). Hydrogel composed of potassium acrylate, acrylamide, and mineral as soil conditioner under saline conditions. Scientia Agricola, 79. [CrossRef]
- Abobatta, W. (2018). Impact of hydrogel polymer in agricultural sector. Adv. Agric. Environ. Sci. Open Access, 1(2), 59-64. [CrossRef]
- Wu, X., Sun, L., Qin, B., Wang, T., Wang, Y., Zhao, J., & Fu, Y. (2024). Novel antimicrobial polysaccharide hydrogel with fertilizer slow-release function for promoting Sesamum indicum L. seeds germination. Polymer, 311, 127491. [CrossRef]
- Tariq, M., & Mott, C. J. B. (2006). Effect of boron supply on the uptake of micronutrients by radish (Raphanus sativus L.). Journal of Agricultural and Biological Science, 1(2), 1-8.
- Yu, J., Shi, J., Ma, X., Dang, P., Yan, Y., Mamedov, A. I., Levy, G. J. (2017). Superabsorbent polymer properties and concentration effects on water retention under drying conditions. Soil Science Society of America Journal, 81(4), 889-901. [CrossRef]
- Mohawesh, O., & Durner, W. (2019). Effects of bentonite, hydrogel and biochar amendments on soil hydraulic properties from saturation to oven dryness. Pedosphere, 29(5), 598-607. [CrossRef]
- Paluszek, J. (2010). Quality of structure and water-air properties of eroded Haplic Luvisol treated with gel-forming polymer. Polish Journal of Environmental Studies, 19(6), 1287.
- Knowles, O., Robinson, B., Contangelo, A., & Clucas, L. (2011). Biochar for the mitigation of nitrate leaching from soil amended with biosolids. Science of the total Environment, 409(17), 3206-3210. [CrossRef]
- Laird, D., Fleming, P., Wang, B., Horton, R., & Karlen, D. (2010). Biochar impact on nutrient leaching from a Midwestern agricultural soil. Geoderma, 158(3-4), 436-442. [CrossRef]
- Jeffery, S., Meinders, M. B., Stoof, C. R., Bezemer, T. M., van de Voorde, T. F., Mommer, L., & van Groenigen, J. W. (2015). Biochar application does not improve the soil hydrological function of a sandy soil. Soil Science Society of America Journal, 251, 47-54. [CrossRef]
- Wu, Y., Brickler, C., Li, S., & Chen, G. (2021). Synthesis of microwave-mediated biochar-hydrogel composites for enhanced water absorbency and nitrogen release. Polymer Testing, 93, 106996. [CrossRef]
- Yu, Y., Yang, L., & Xue, L. (2019). Effects of biochar addition on nitrogen leaching loss in the vegetable soil. Journal of Advanced Agricultural Technologies, 6(2). [CrossRef]
- Hardie, M. A., Oliver, G., Clothier, B. E., Bound, S. A., Green, S. A., & Close, D. C. (2015). Effect of biochar on nutrient leaching in a young apple orchard. Journal of Environmental Quality, 44(4), 1273-1282. [CrossRef]
- Bu, X., Xue, J., Zhao, C., Wu, Y., & Han, F. (2017). Nutrient leaching and retention in riparian soils as influenced by rice husk biochar addition. Soil Science, 182(7), 241-247. [CrossRef]
- Silva, I. C. B. d., Basílio, J. J. N., Fernandes, L. A., Colen, F., Sampaio, R. A., & Frazão, L. A. (2017). Biochar from different residues on soil properties and common bean production. Scientia Agricola, 74, 378-382. [CrossRef]
- Nguyen, B. T., Phan, B. T., Nguyen, T. X., Nguyen, V. N., Van Tran, T., & Bach, Q.-V. (2020). Contrastive nutrient leaching from two differently textured paddy soils as influenced by biochar addition. Journal of Soils Sediments, 20(1), 297-307. [CrossRef]
- yvertsen, J., & Dunlop, J. (2004). Hydrophilic gel amendments to sand soil can increase growth and nitrogen uptake efficiency of citrus seedlings. Horticultural Science, 39, 267-271. [CrossRef]
- Arbona, V., Iglesias, D. J., Jacas, J., Primo-Millo, E., Talon, M., & Gómez-Cadenas, A. (2005). Hydrogel substrate amendment alleviates drought effects on young citrus plants. Plant Soil, 270, 73-82. [CrossRef]
- Rubin, R. L., Anderson, T. R., & Ballantine, K. A. (2020). Biochar simultaneously reduces nutrient leaching and greenhouse gas emissions in restored wetland soils. Wetlands, 40(6), 1981-1991. [CrossRef]
- Kalu, S., Oyekoya, G. N., Ambus, P., Tammeorg, P., Simojoki, A., Pihlatie, M., & Karhu, K. (2021). Effects of two wood-based biochars on the fate of added fertilizer nitrogen—a 15 N tracing study. Biology Fertility of Soils, 57, 457-470. 10.1007/s00374-020-01534-0. [CrossRef]
- Alkharabsheh, H. M., Seleiman, M. F., Battaglia, M. L., Shami, A., Jalal, R. S., Alhammad, B. A., . . . Al-Saif, A. M. (2021). Biochar and its broad impacts in soil quality and fertility, nutrient leaching and crop productivity: A review. Agronomy, 11(5), 993. [CrossRef]
- Lu, Y., Silveira, M. L., O’Connor, G. A., Vendramini, J. M., Erickson, J. E., Li, Y. C., & Cavigelli, M. (2020). Biochar impacts on nutrient dynamics in a subtropical grassland soil: 1. Nitrogen and phosphorus leaching (0047-2425). [CrossRef]
- Venkatesan, S., & Jayaganesh, S. (2010). Characterisation of magnesium toxicity, its influence on amino acid synthesis pathway and biochemical parameters of tea. Phytochem, 4, 67-77. [CrossRef]
- Haider, G., Steffens, D., Moser, G., Müller, C., & Kammann, C. I. (2016). Biochar reduced nitrate leaching and improved soil moisture content without yield improvements in a four-year field study. Agriculture, Ecosystems and Environment, 237, 80-94. [CrossRef]
- Sadaf, J., Shah, G. A., Shahzad, K., Ali, N., Shahid, M., Ali, S., ... & Rashid, M. I. (2017). Improvements in wheat productivity and soil quality can accomplish by co-application of biochars and chemical fertilizers. Science of the Total Environment, 607, 715-724. [CrossRef]
- Sänger, A., Reibe, K., Mumme, J., Kaupenjohann, M., Ellmer, F., Roß, C.-L., & Meyer-Aurich, A. (2017). Biochar application to sandy soil: effects of different biochars and N fertilization on crop yields in a 3-year field experiment. Archives of Agronomy Soil Science, 63(2), 213-229. [CrossRef]
- Kammann, C. I., Schmidt, H. P., Messerschmidt, N., Linsel, S., Steffens, D., Müller, C., ... & Joseph, S. (2015). Plant growth improvement mediated by nitrate capture in co-composted biochar. Scientific Reports, 5(1), 11080. [CrossRef]
- Yao, Y., Gao, B., Zhang, M., Inyang, M., & Zimmerman, A. R. (2012). Effect of biochar amendment on sorption and leaching of nitrate, ammonium, and phosphate in a sandy soil. Chemosphere, 89(11), 1467-1471. [CrossRef]
- Cong, M., Hu, Y., Sun, X., Yan, H., Yu, G., Tang, G., . . . Jia, H. (2023). Long-term effects of biochar application on the growth and physiological characteristics of maize. Frontiers in Plant Science, 14, 1172425. [CrossRef]
- Hou, X., Li, R., He, W., Dai, X., Ma, K., & Liang, Y. (2018). Superabsorbent polymers influence soil physical properties and increase potato tuber yield in a dry-farming region. Journal of Soils and Sediments, 18, 816-826. [CrossRef]
- Blumenschein, T. G., Nelson, K. A., & Motavalli, P. P. (2018). Impact of a new deep vertical lime placement practice on corn and soybean production in conservation tillage systems. Agronomy, 8(7), 104. [CrossRef]
- Godsey, C. B., Pierzynski, G. M., Mengel, D. B., & Lamond, R. E. (2007). Management of soil acidity in no-till production systems through surface application of lime. Agronomy Journal, 99(3), 764-772. [CrossRef]
- Brown, T. T., Koenig, R. T., Huggins, D. R., Harsh, J. B., & Rossi, R. E. (2008). Lime effects on soil acidity, crop yield, and aluminum chemistry in direct-seeded cropping systems. Soil Science Society of America Journal, 72, 634-640.
- Caires, E., Joris, H., & Churka, S. (2011). Long-term effects of lime and gypsum additions on no-till corn and soybean yield and soil chemical properties in southern Brazil. Soil Use and Management, 27(1), 45-53. [CrossRef]
- Wan, H., Liu, X., Shi, Q., Chen, Y., Jiang, M., Zhang, J., . . . Hossain, M. A. (2023). Biochar amendment alters root morphology of maize plant: Its implications in enhancing nutrient uptake and shoot growth under reduced irrigation regimes. Frontiers in Plant Science, 14, 1122742. [CrossRef]
- Mosharrof, M., Uddin, M. K., Sulaiman, M. F., Mia, S., Shamsuzzaman, S. M., & Haque, A. N. A. (2021). Combined Application of Rice Husk Biochar and Lime Increases Phosphorus Availability and Maize Yield in an Acidic Soil. Agriculture, 11(8), 793. [CrossRef]
- Guan, X., Zhou, J., Ma, N., Chen, X., Gao, J., & Zhang, R. (2015). Studies on modified conditions of biochar and the mechanism for fluoride removal. Desalination and ter Treatment, 55(2), 440-447. [CrossRef]
- Palta, J. A., & Yang, J. C. (2014). Crop root system behaviour and yield preface. Field Crops Res 165:1–4. [CrossRef]
- Orikiriza, L. J., Agaba, H., Tweheyo, M., Eilu, G., Kabasa, J. D., & Huettermann, A. (2009). Amending soils with hydrogels increases the biomass of nine tree species under Non-water stress conditions. Clean–Soil, Air, Water, 37(8), 615-620. [CrossRef]
- Najafinezhad, H., Tahmasebi Sarvestani, Z., Modarres Sanavy, S. A. M., & Naghavi, H. (2015). Evaluation of yield and some physiological changes in corn and sorghum under irrigation regimes and application of barley residue, zeolite and superabsorbent polymer. Archives of Agronomy Soil Science, 61(7), 891-906. [CrossRef]
- Liu, R., Gu, M., Huang, L., Yu, F., Jung, S.-K., & Choi, H.-S. (2019). Effect of pine wood biochar mixed with two types of compost on growth of bell pepper (Capsicum annuum L.). Horticulture, Environment, and Biotechnology, 60(3), 313-319. [CrossRef]
- Mawof, A., Prasher, S., Bayen, S., & Nzediegwu, C. (2021). Effects of Biochar and Biochar-Compost Mix as Soil Amendments on Soil Quality and Yield of Potatoes Irrigated with Wastewater. Journal of Soil Science and Plant Nutrition, 21(4), 2600-2612. [CrossRef]
- Paulus, A., & Anyi, W. (2011). Pepper production technology in Malaysia,(eds.). In L. K. F. a. S. S. Liang (Ed.), (pp. 3-2). Kuching, Malaysia: Malaysian Pepper Board.
- Sulok, K. M. T., Ahmed, O. H., Khew, C. Y., Zehnder, J. A. M., Lai, P. S., Jalloh, M. B., Abdu, A. (2021). Effects of Organic Amendments Produced from Agro-Wastes on Sandy Soil Properties and Black Pepper Morpho-Physiology and Yield. Agronomy, 11(9), 1738. [CrossRef]
- Heidari, F., Tilaki, G. A. D., & Kooch, Y. (2022). Effects of Drought Stress on Morphological and Physiological Traits of Kochia Prostrata (L.). International Journal of Natural Sciences Research, 10(2), 102-115.
- hang, Y.-s., Tang, G.-m., Long, X.-s., Ge, C.-h., & Xu, W.-l. (2021). Effects of one\| time biochar input on soil properties and corn yield in irrigation sandy soil.
Figure 1.
Normalized leachate volume (a-c) per unit biomass. The error bars in each graph represents the standard deviation of four replicates. The different letters in each bar show a significant difference (p ≤ 0.05). The amendments are as follows: C: Control; B: Biochar; L: Lime; H: Hydrogel; BL: Biochar-Lime; BH: Biochar-Hydrogel; HL: Hydrogel-Lime; BHL: Biochar-Hydrogel-Lime.
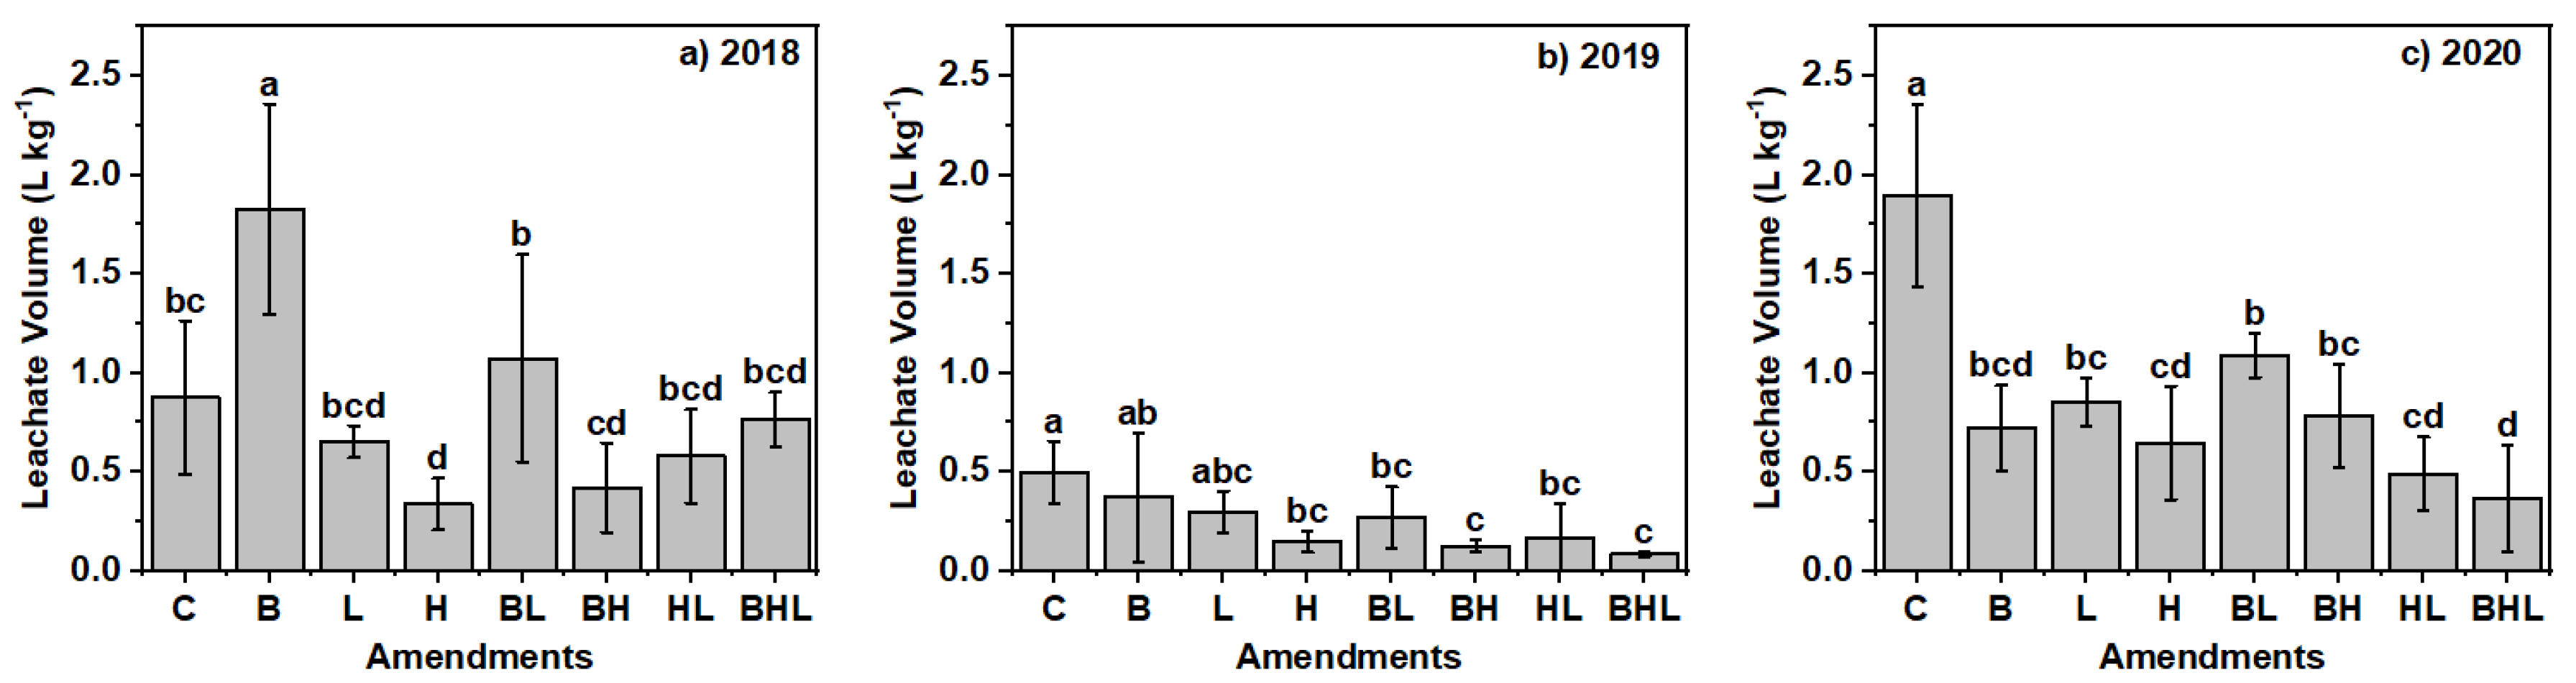
Figure 2.
Normalized nutrient losses (Nitrate-N, a-c, and Orthophosphate-P, d-f) per unit biomass in the three years of the study. Errors bars represent the standard deviation of four replicates. The different letters in each graph bar represent a significant difference (p ≤ 0.05). The amendments are as follows: C: Control; B: Biochar; L: Lime; H: Hydrogel; BL: Biochar-Lime; BH: Biochar-Hydrogel; HL: Hydrogel-Lime; BHL: Biochar-Hydrogel-Lime.
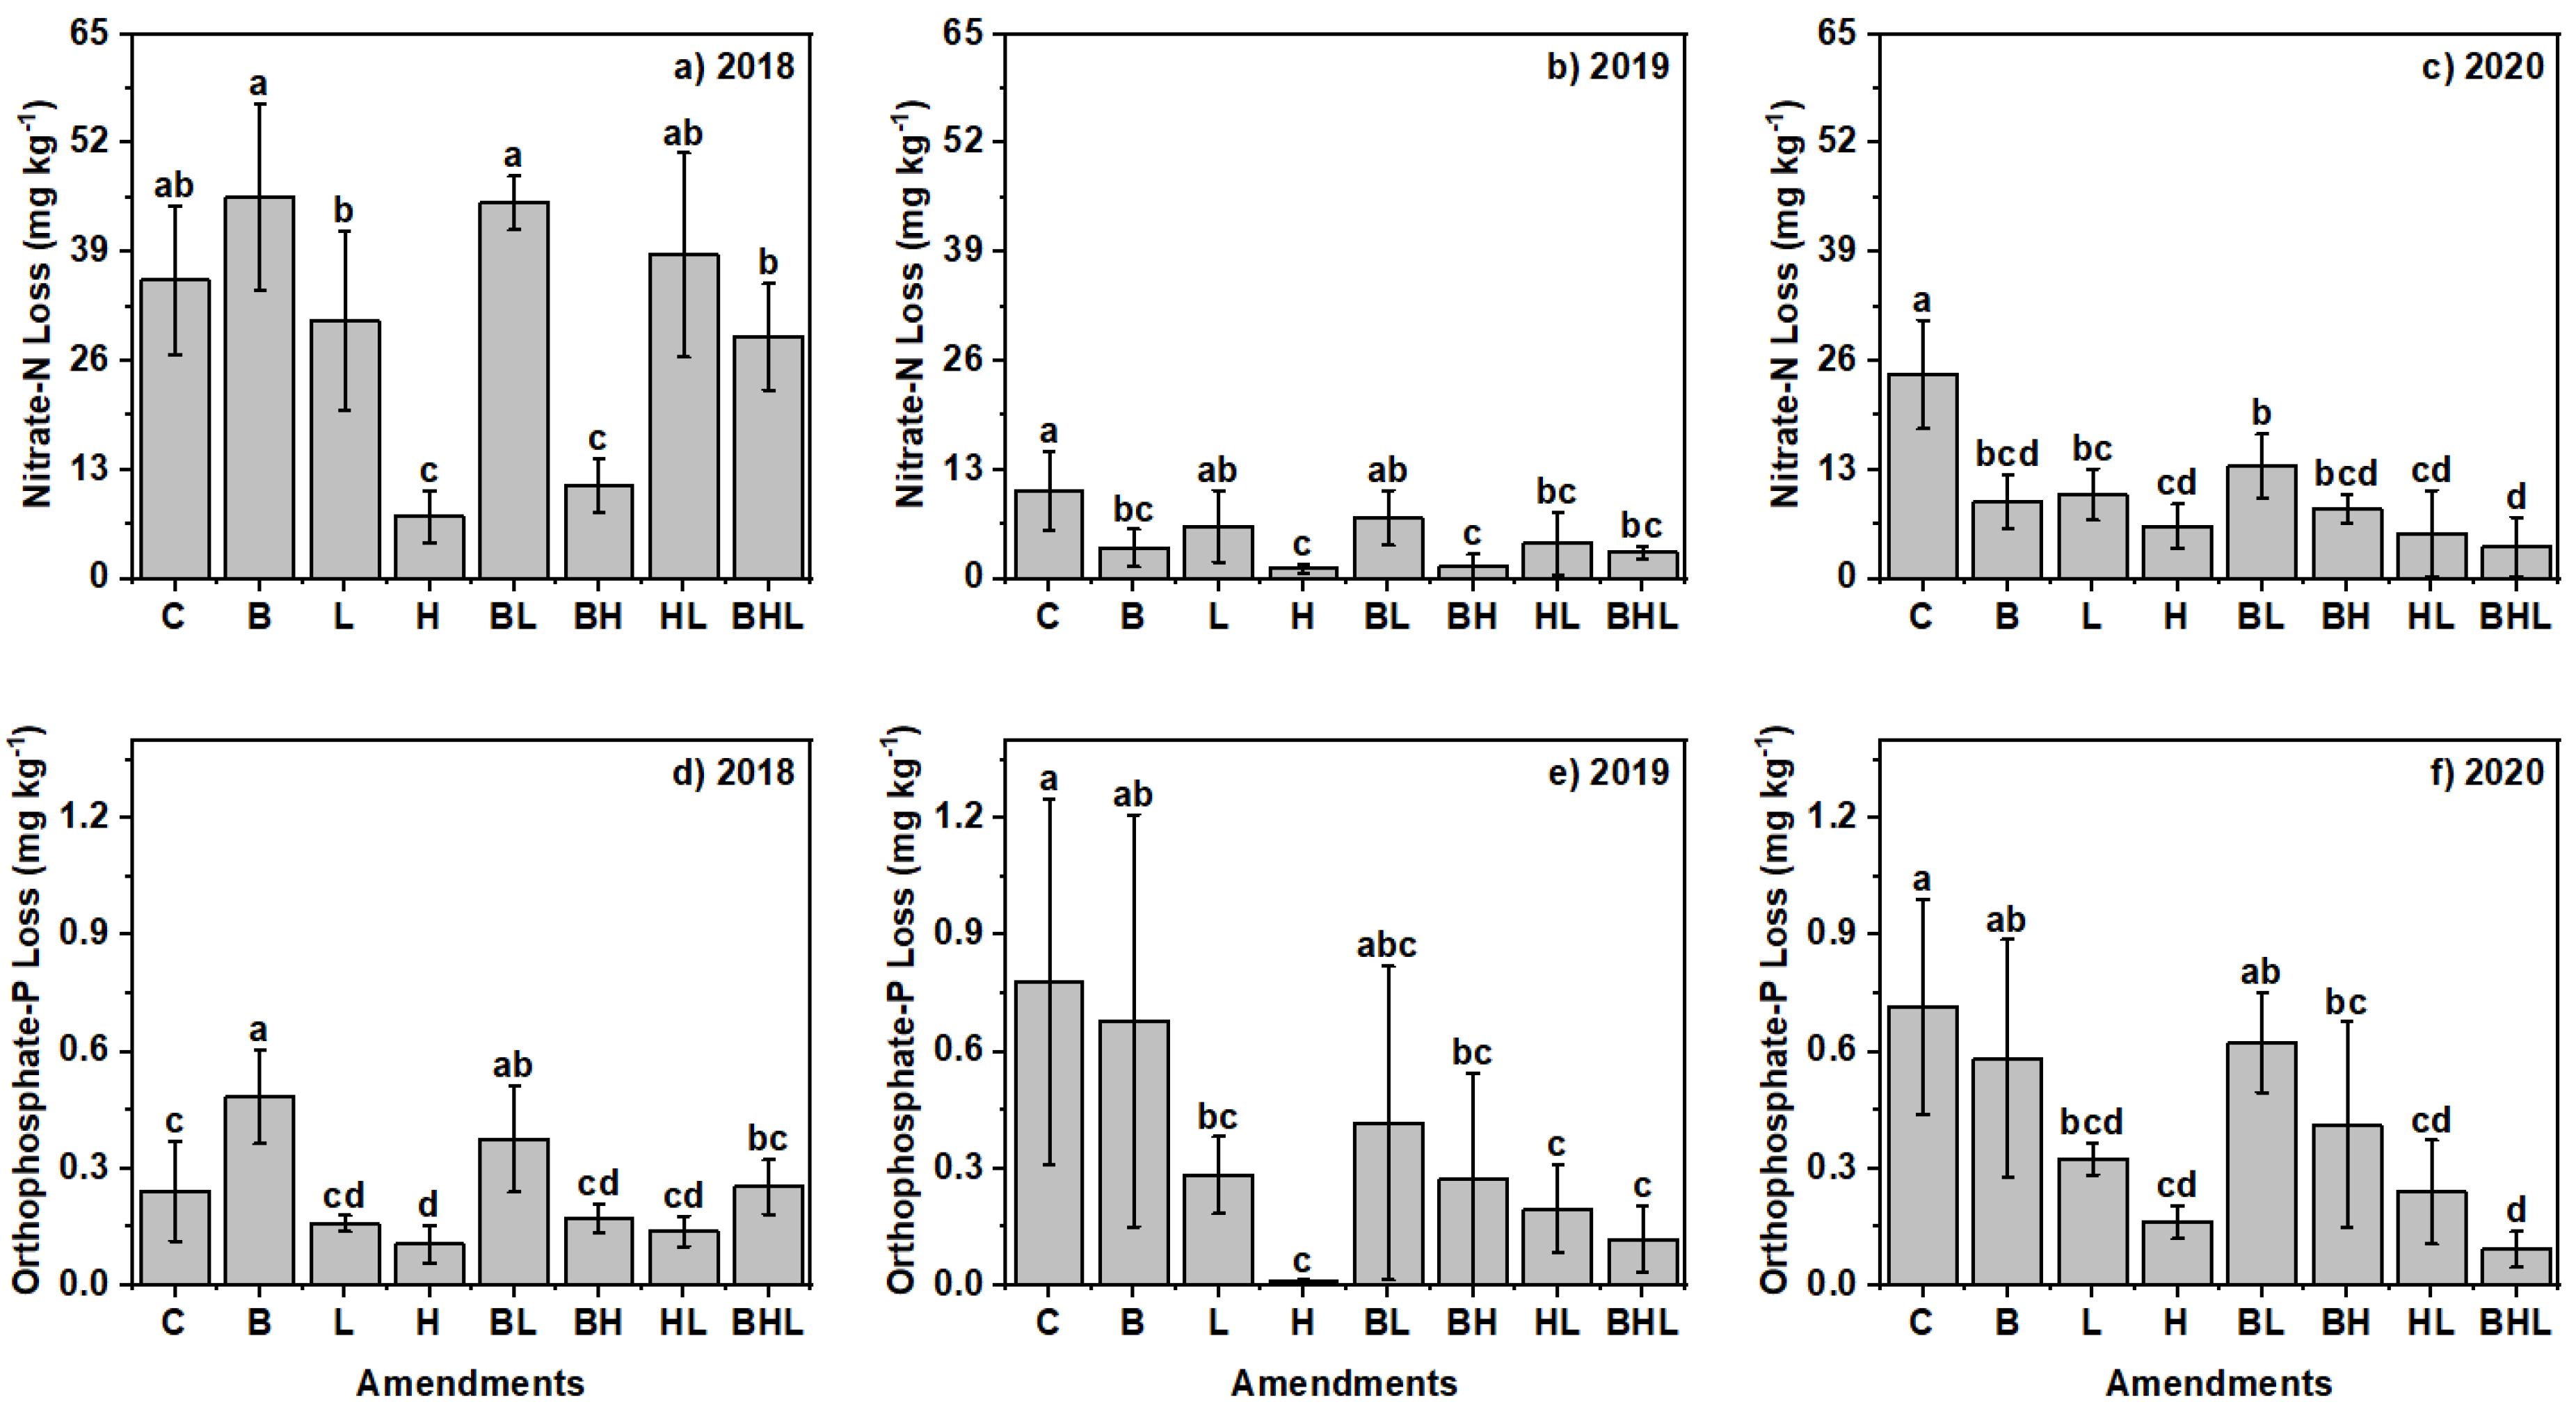
Figure 3.
Green pepper yield (a-c) and above biomass (d-f) during the three years of the study. Errors bars represent the standard deviation of four replicates. The different letters in each graph bar represent a significant difference (p ≤ 0.05). The amendments are as follows: C: Control; B: Biochar; L: Lime; H: Hydrogel; BL: Biochar-Lime; BH: Biochar-Hydrogel; HL: Hydrogel-Lime; BHL: Biochar-Hydrogel-Lime.
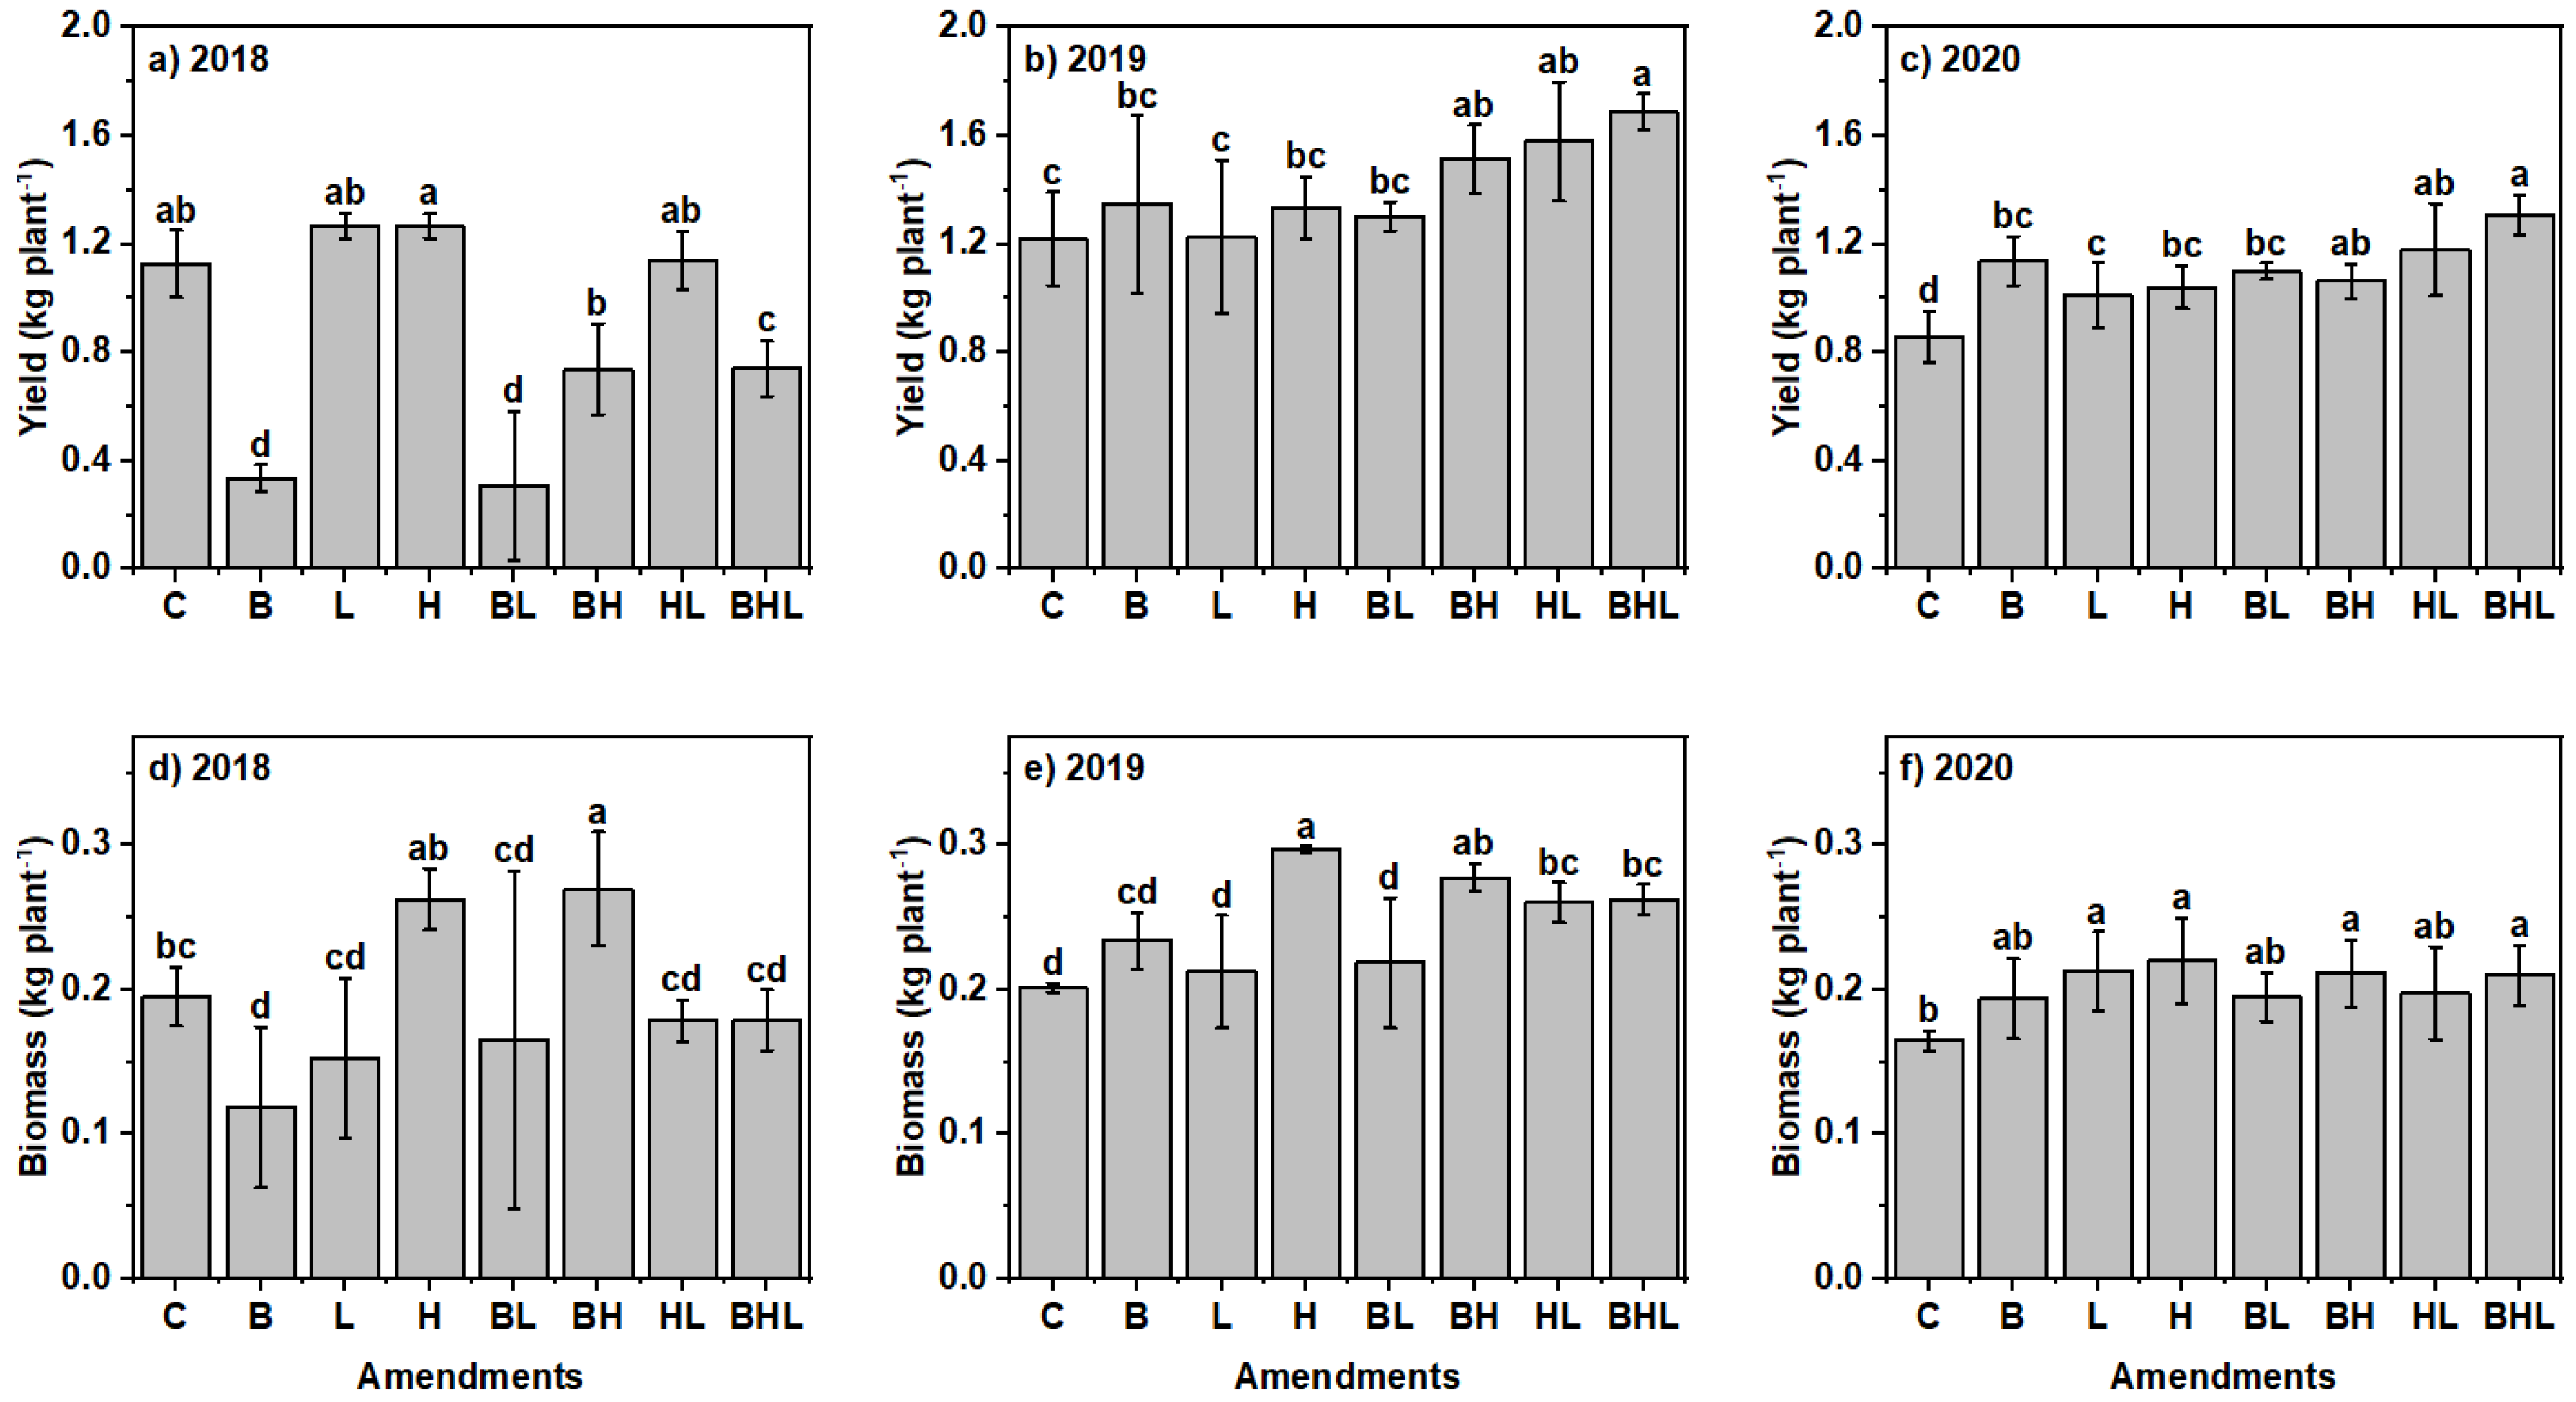
Figure 4.
Effects of soil amendments on green pepper plant root biomass in 2018 (a, b, c, d) and 2019 (e, f, g, h) during the study. Errors bars represent the standard deviation of four replicates. The different letters in each bar of the graph represent a significant difference (p ≤ 0.05); The amendments are as follows: C: Control; B: biochar; L: Lime; H: Hydrogel; BL: Biochar-Lime; BH: Biochar-Hydrogel; HL: Hydrogel-Lime; BHL: Biochar-Hydrogel-Lime.
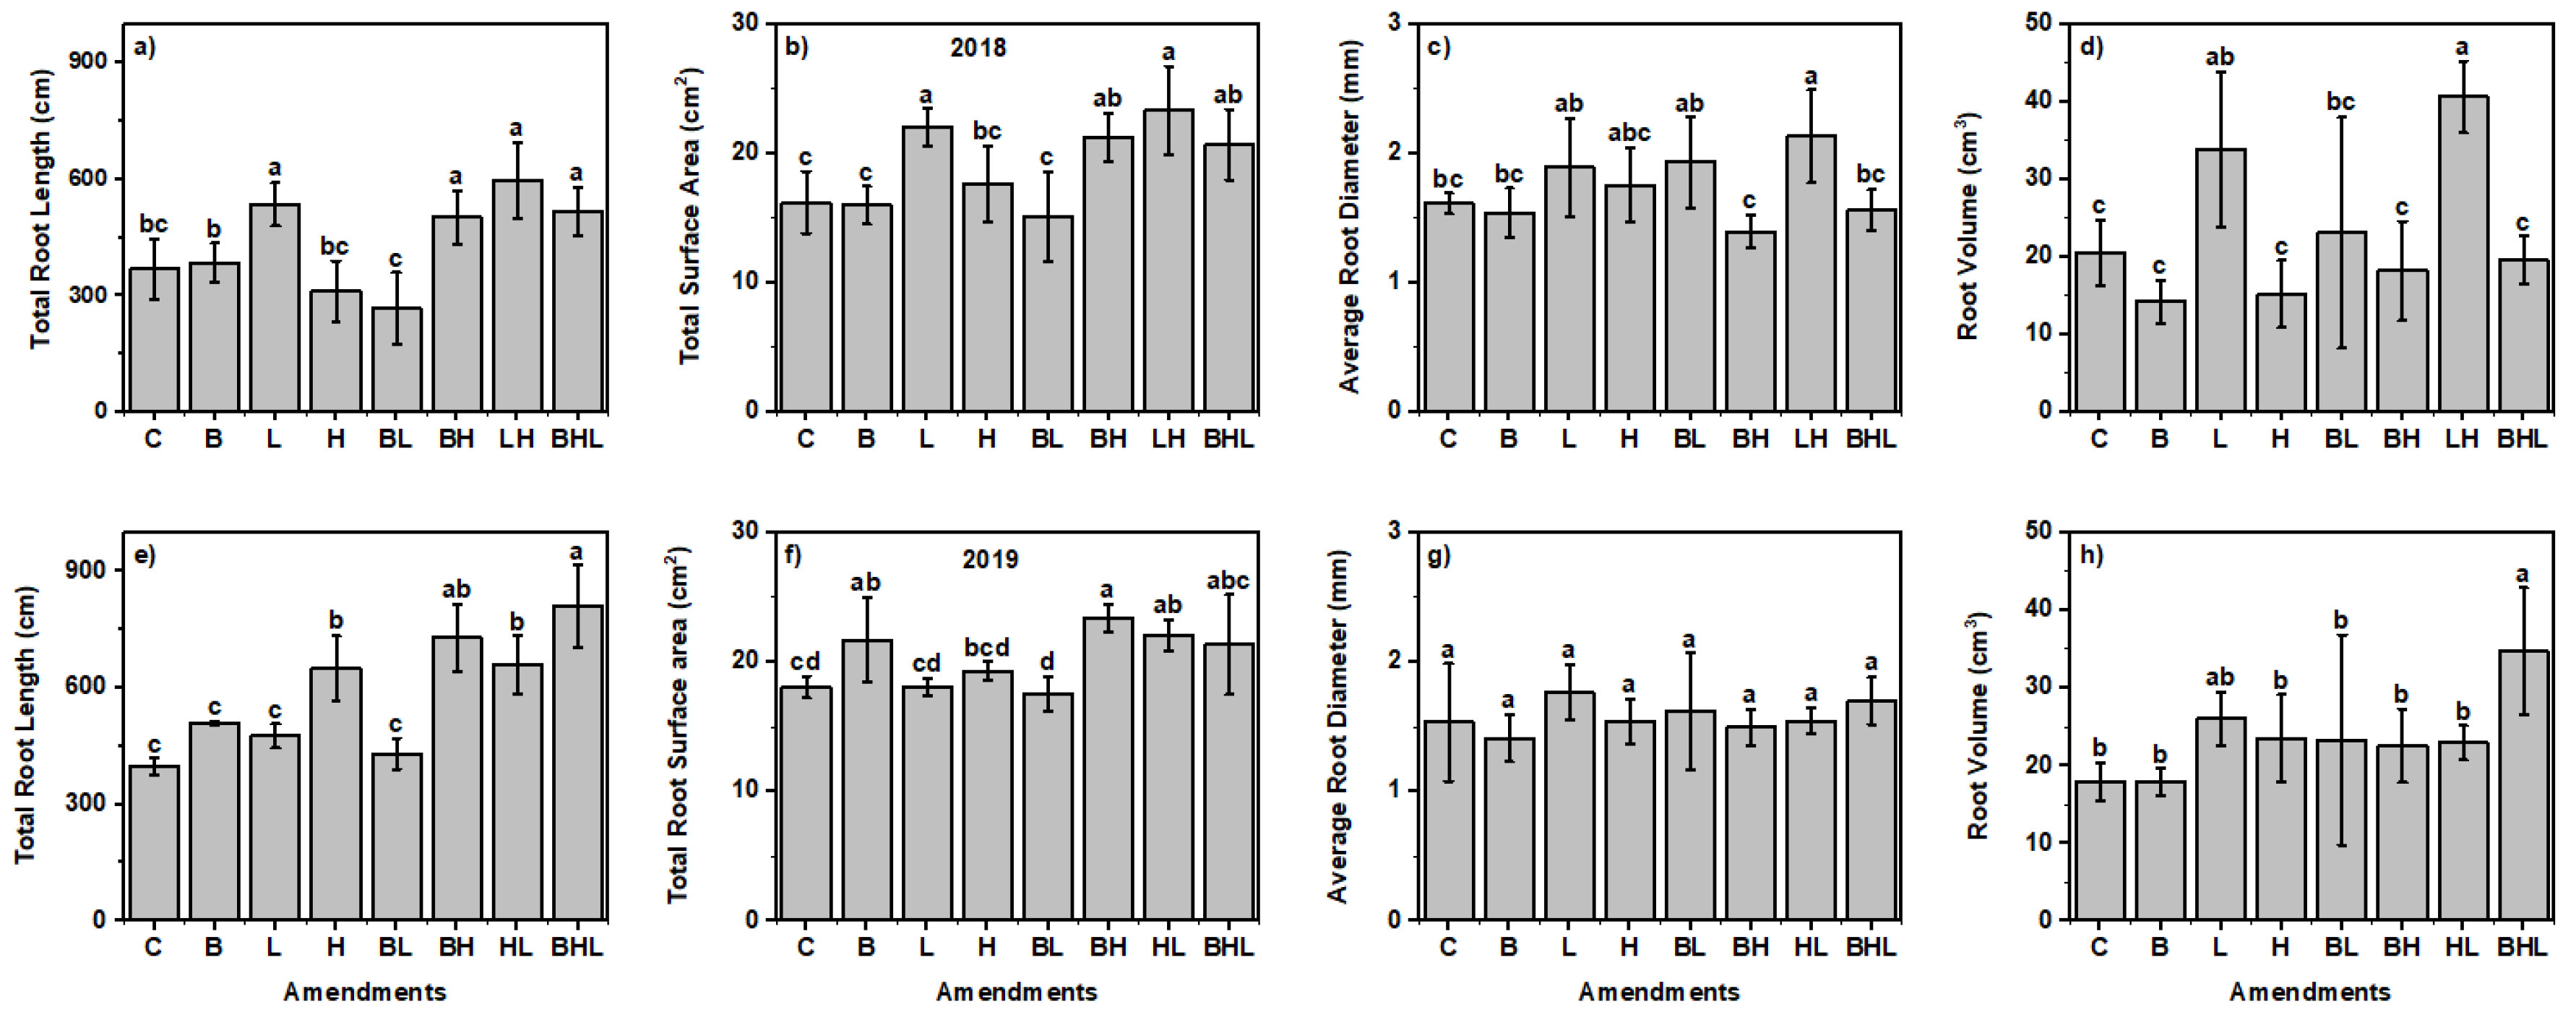
Figure 5.
Correlation between leachate properties, Soil and Plant Parameters. The star in the square represents a significant correlation at p ≤ 0.05. Square colors match -1 to 1 with the correlation coefficient indicated by the enclosed number.
Figure 5.
Correlation between leachate properties, Soil and Plant Parameters. The star in the square represents a significant correlation at p ≤ 0.05. Square colors match -1 to 1 with the correlation coefficient indicated by the enclosed number.
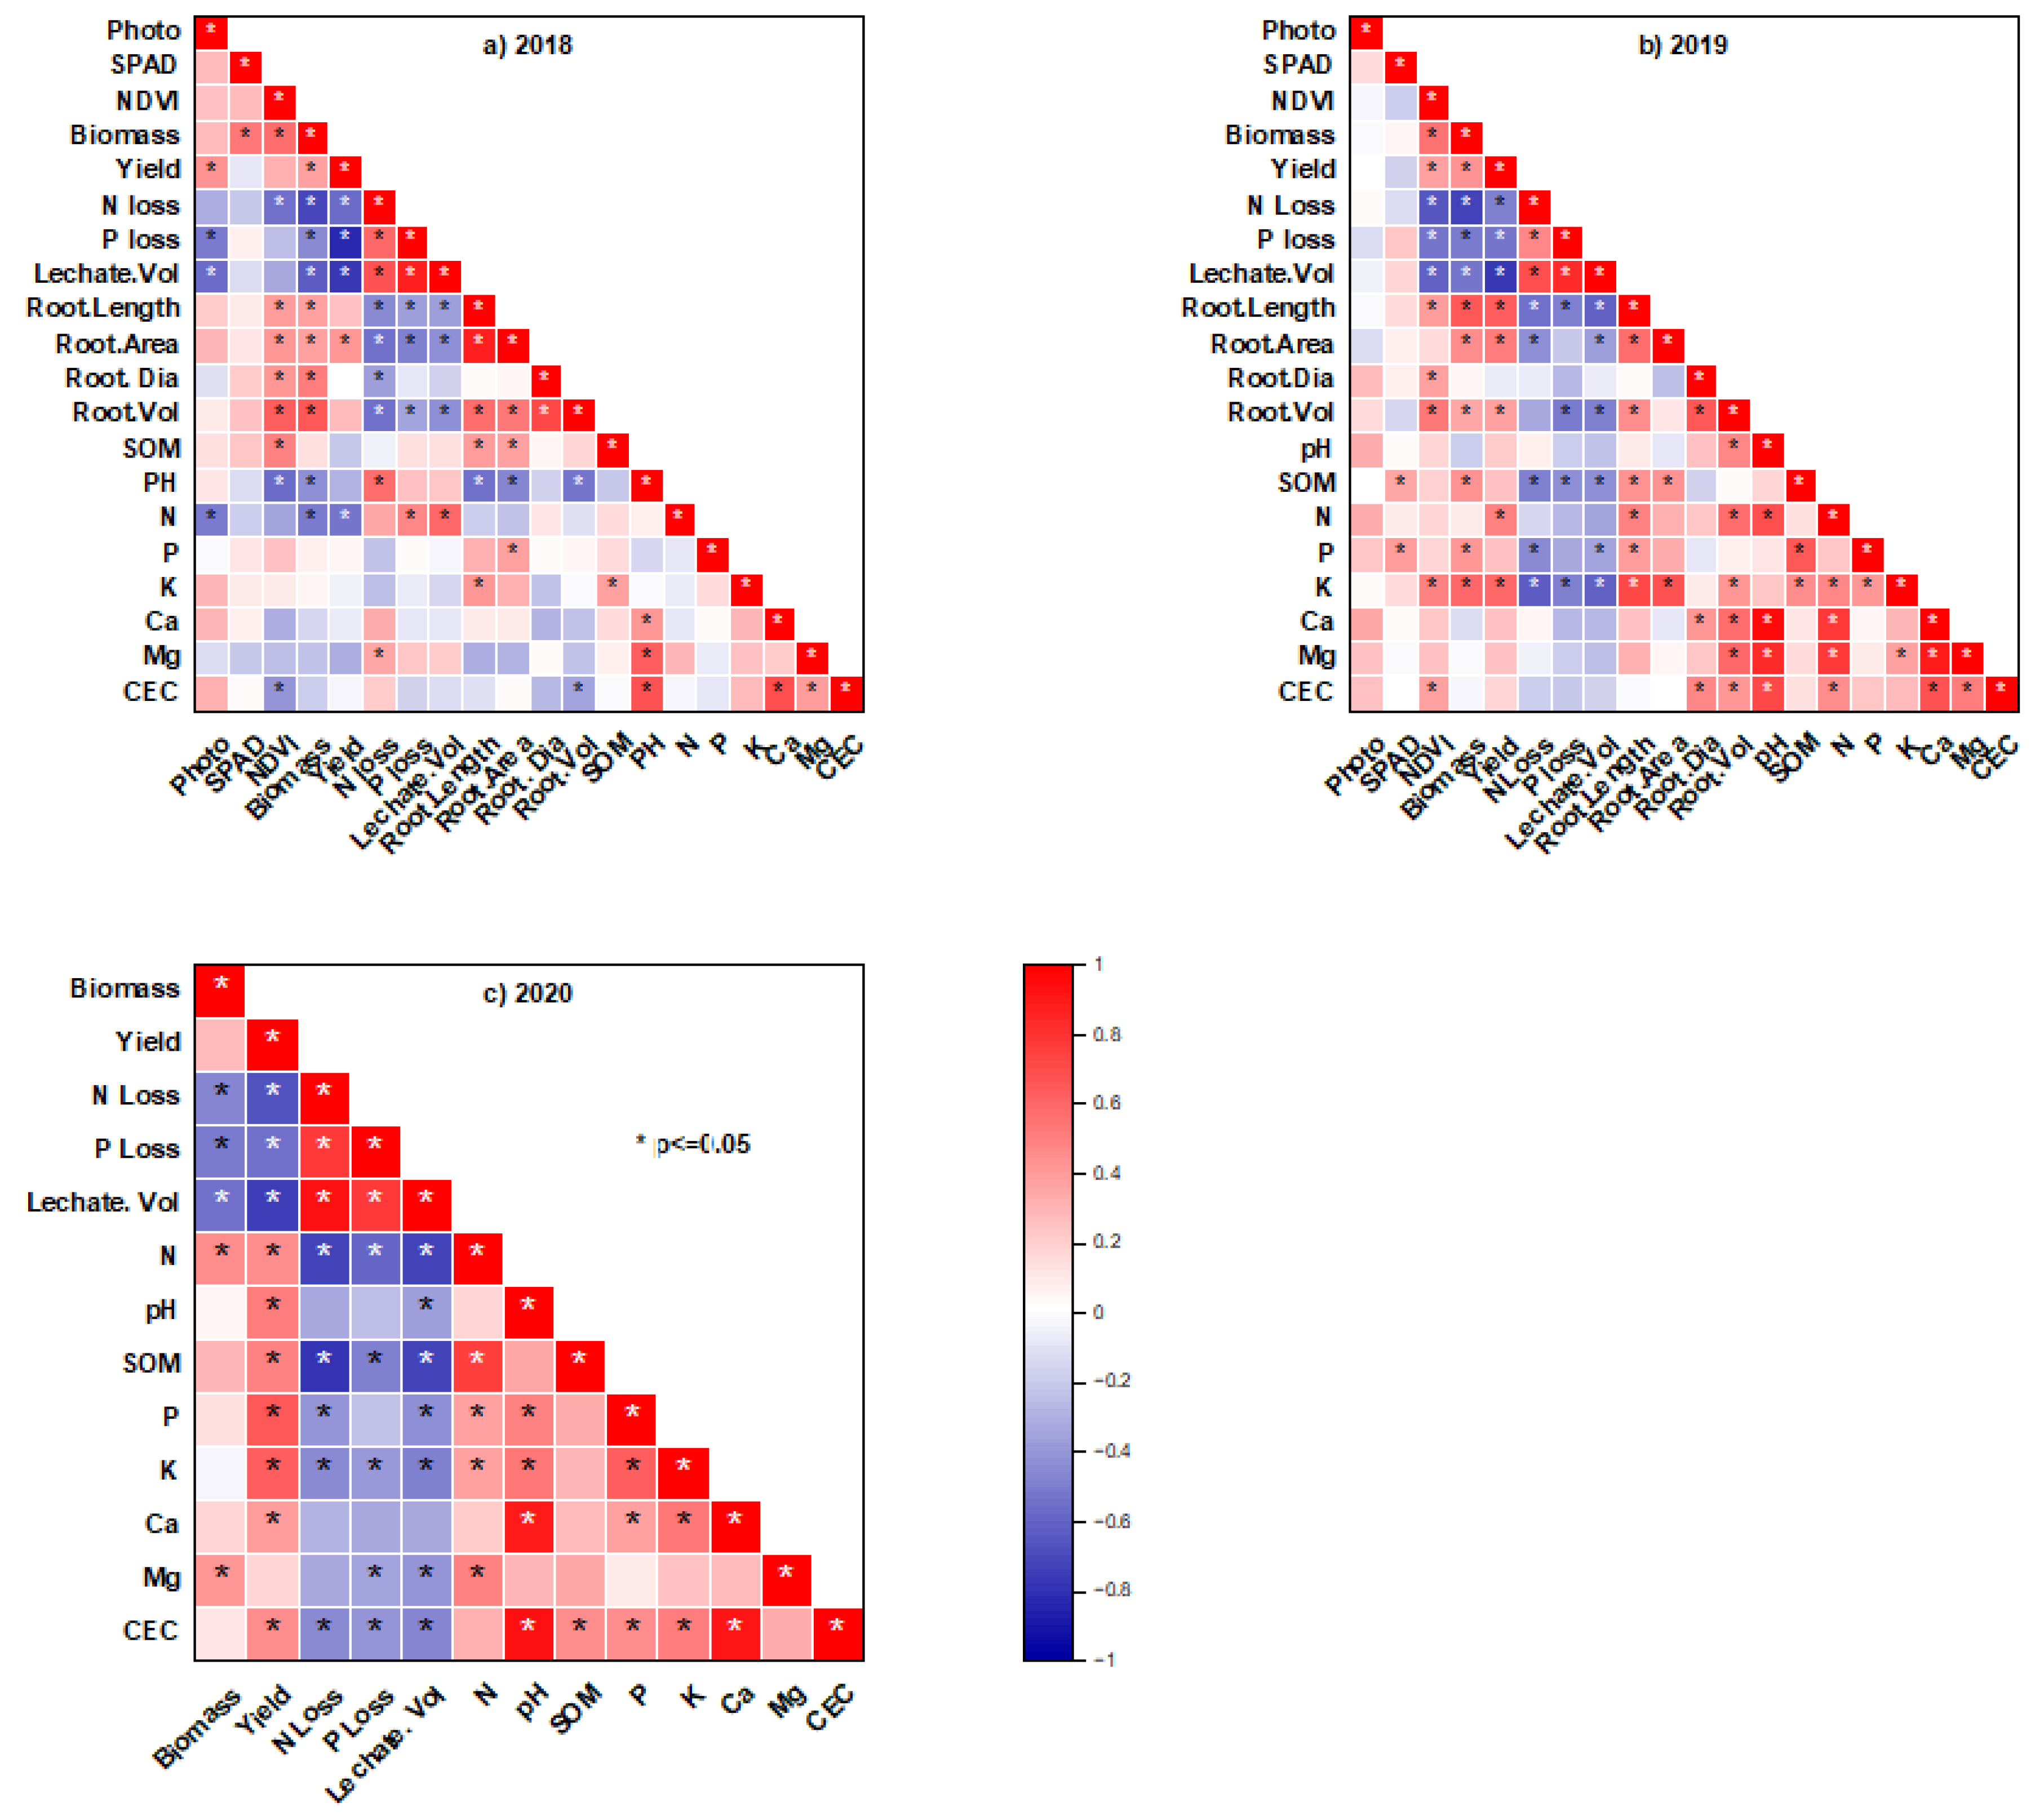
Figure 6.
Principal component analysis (PCA) biplot based on soil, plant growth, and leachate properties during 2019. PC1 is the principal component one and PC2 is principal component two. Values in parentheses are variations explained by the principal component.
Figure 6.
Principal component analysis (PCA) biplot based on soil, plant growth, and leachate properties during 2019. PC1 is the principal component one and PC2 is principal component two. Values in parentheses are variations explained by the principal component.
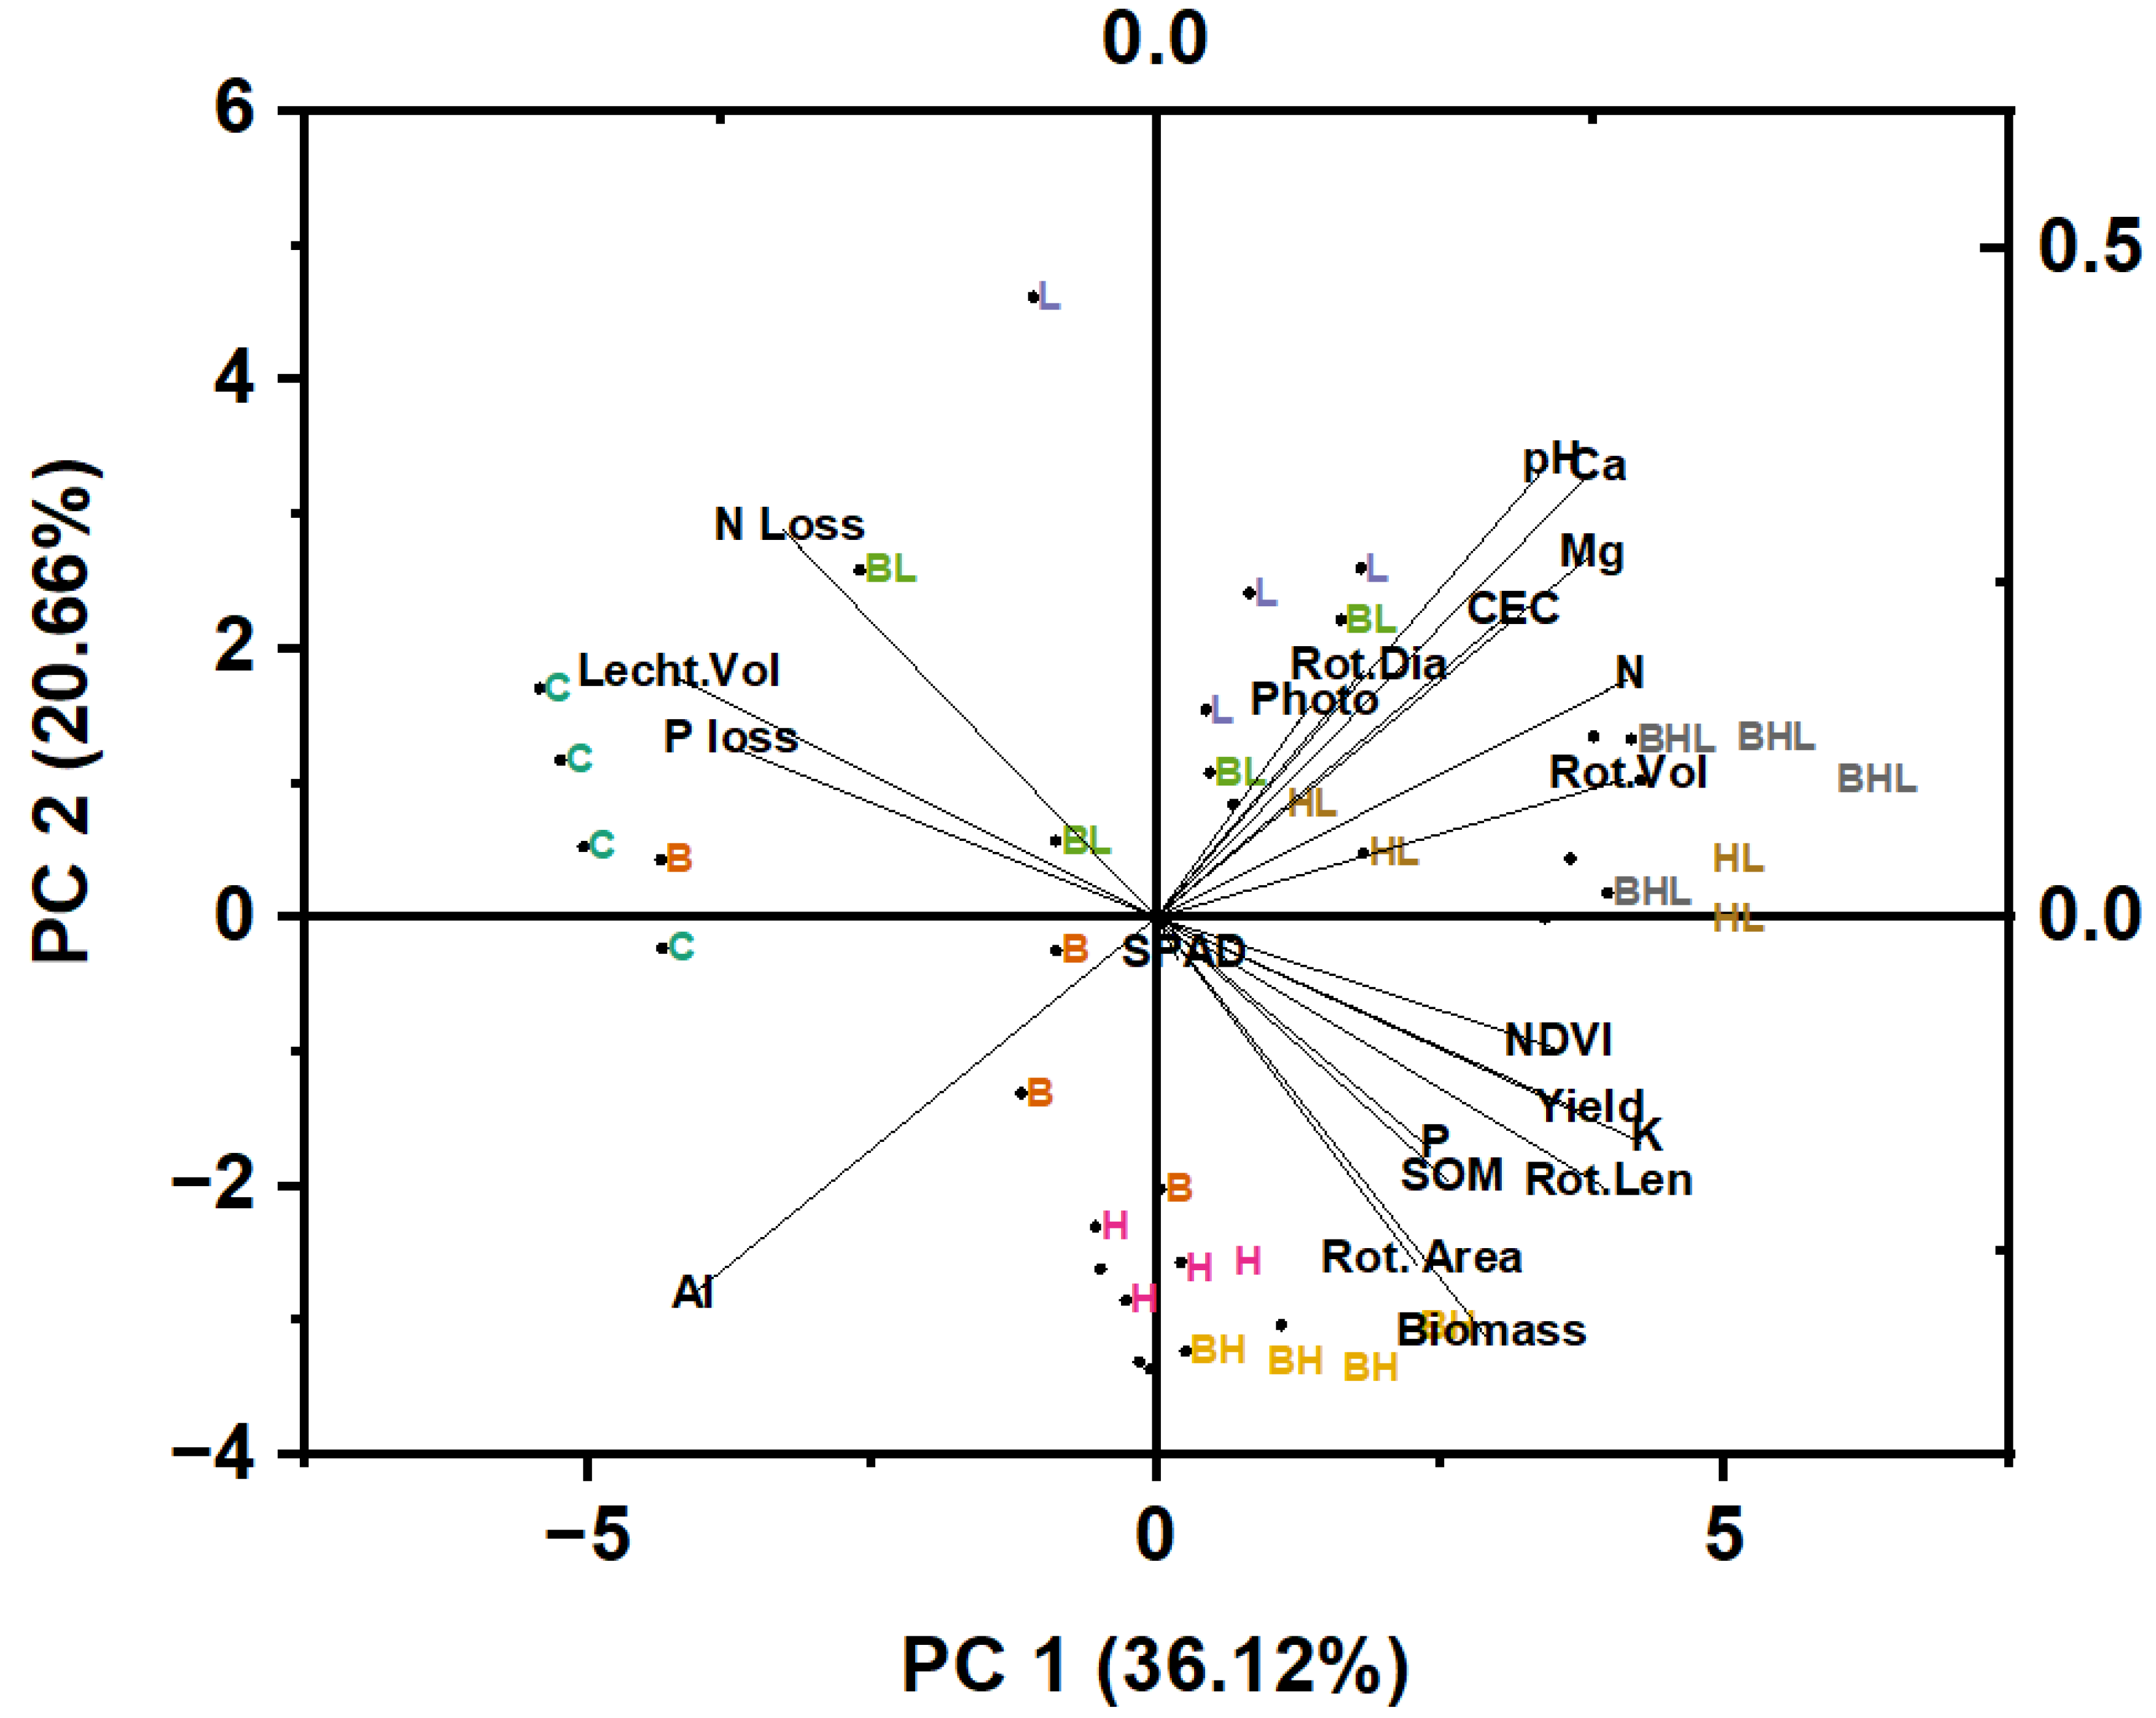

Table 1.
Physio-chemical Properties of Soil and Biochar.
| Properties | Soil | Hardwood Biochar |
|---|---|---|
| Particle size distribution (%) | ||
| Sand | 83 | - |
| Silt | 13 | - |
| Clay | 4 | - |
| Texture | Loamy sand | - |
| Bulk density (Mg m-3) | 1.29 ± 0.05 | |
| pH | 5.57+0.087 | 9.96 ± 0.01 |
| EC (1:5) (dS m−1) | 0.27 ± 0.01 | |
| SOM (%) | 3.28+0.42 | - |
| BET Surface area (m2 g−1) | - | 324.6 |
| Pore volume (cm3 g−1) | 0.02 | |
| Ash content (%) | 35.8 ± 1.4 | |
| Pore size (nm) | 17.44 | |
| Pyrolysis temperature (°C) | 500–550 | |
| Available nutrients (mg kg-1) | ||
| C | - | 892200 |
| H | - | 26700 |
| O | - | 79000 |
| S | - | 100 |
| N | 15.2±7.65 | 2000 |
| NH4+ | 4.59±0.54 | 3130 ± 0.34 |
| P | 125.36±9.71 | 350 |
| K | 121.40±35.68 | 2700 ± 0.24 |
| Ca | 1602.33±99.81 | 1700± 0.23 |
| Mg | 85.73±21.95 | 180± 0.01 |
| Al | 1453.47±12.89 | - |
| Na | 380± 0.06 | |
| CEC (cmol (+) kg-1) | 8.19±0.39 | 18 |
| Base saturation (%) | 99.68±0.32 | - |
BET: Brunauer, Emmet, and Teller; CEC: cation exchange capacity; EC: electrical conductivity; —: data not available/does not apply; Values are mean ± standard deviation of four replicates.
Table 2.
The effects of soil amendments on pH, soil organic matter (SOM) content, cation exchange capacity (CEC), and available nutrient concentrations in a loamy sand soil at the end of the growing seasons.
Table 2.
The effects of soil amendments on pH, soil organic matter (SOM) content, cation exchange capacity (CEC), and available nutrient concentrations in a loamy sand soil at the end of the growing seasons.
| Year | Amendments | pH | SOM (%) | NO3- -N (mg kg-1) | AV P (mg kg-1) | AV K (mg kg-1) | AV Ca (mg kg-1) | AV Mg (mg kg-1) | AV Al (mg kg-1) | CEC (cmol (+) kg-1) * |
|---|---|---|---|---|---|---|---|---|---|---|
| 2018 | C | 5.7 ± 0.28 d | 2.04 ± 0.08 bc | 3.77 ± 1.06 c | 132.00 ± 38.14 a | 109.50 ± 35.50 d | 1252.50 ± 316.90 c | 53.22 ± 8.26 c | 1420.00 ± 48.30 a | 6.71 ± 1.33 d |
| B | 6.20 ± 0.12 c | 2.62 ± 0.15 ab | 13.38 ± 4.06 a | 148.50 ± 33.21 a | 174.50 ± 29.35 bcd | 1400.00 ± 153.84 c | 68.50 ± 9.38 ab | 1447.50 ± 12.58 a | 8.94 ± 0.84 c | |
| L | 6.95 ± 0.48 ab | 1.75 ± 0.76 c | 7.66 ± 1.76 b | 145.00 ± 35.29 a | 113.25 ± 25.51 d | 2062.5 ± 241.72 bc | 62.52 ± 4.60 abc | 1237.50 ± 26.30 b | 13.31 ± 1.55 ab | |
| H | 5.35 ± 0.25 d | 2.14 ± 0.45 abc | 4.39 ± 2.27 bc | 176.33 ± 62.22 a | 182.00 ± 45.96 bc | 1070.00 ± 229.20c | 51.20 ± 16.12 c | 1435.00 ± 78.52 a | 9.00 ± 1.94 c | |
| BL | 7.1 ± 0.10 a | 2.044 ± 0.83 bc | 7.32 ± 3.48 bc | 136.00 ± 8.75 a | 140.75 ± 26.45 cd | 2837.50 ± 1000.00 ad | 73.52 ± 4.03 a | 1197.51 ± 49.91 bc | 13.48 ± 1.31 ab | |
| BH | 5.32 ± 0.47 d | 2.78 ± 0.20 ab | 7.89 ± 1.91 b | 149.67 ± 4.76 a | 181.67 ± 11.90 bc | 1827.50 ± 1354.93 bc | 55.93 ± 16.08 bc | 1455.00 ± 90.36 a | 8.79 ± 0.61 c | |
| HL | 6.65 ± 0.23 abc | 2.85 ± 0.13 a | 5.21 ± 1.55 bc | 172.66 ± 27.18 a | 216.75 ± 79.35 ab | 3840.00 ± 179.63 a | 71.25 ± 5.68 a | 1132.49 ± 20.61 c | 14.84 ± 1.31 a | |
| BHL | 6.55 ± 0.40 bc | 2.56 ± 0.21 ab | 5.64 ± 0.71 bc | 178.50 ± 17.60 a | 264.25 ± 72.03 a | 2645.00 ± 1085.56 b | 63.60 ± 7.44 abc | 1185.00 ± 69.52 bc | 12.09 ± 0.85 b | |
| 2019 | C | 5.55 ± 0.51 c | 2.58 ± 0.12 b | 1.37 ± 0.06 de | 227.60 ± 12.78 b | 95.00 ± 11.53 d | 1145.67 ± 371.54 d | 47.00 ± 13.00 e | 1584.00 ± 89.01 a | 7.36 ± 2.72 c |
| B | 6.11 ± 0.20 b | 3.18 ± 0.23 a | 2.67 ± 0.38 c | 338.38 ± 33.16 a | 148.66 ± 31.08 bcd | 1352.33 ± 204.96 d | 55.00 ± 5.00 bcde | 1551.00 ± 44.24 a | 11.82 ± .86 b | |
| L | 7.38 ± 0.09 a | 3.16 ± 0.10 a | 2.78 ± 0.44 c | 287.03 ± 30.87 ab | 138.67 ± 68.06 d | 3459. 35 ± 442.56 ab | 65.68 ± 9.30 ab | 1334 .00 ± 23.34 bc | 16.92 ± 5.26 a | |
| H | 5.73 ± 0.04 c | 3.46 ± 0.15 a | 1.57 ± 0.04 de | 329.27 ± 68.00 a | 145.66 ± 1.15 cd | 1266.68 ± 146.96 d | 50.33 ± 4.93 de | 1524. 34 ± 43.57 a | 8.61 ± 0.94 bc | |
| BL | 7.17 ± 0.08 a | 3.44 ± 0.27 a | 2.24 ± 0.60 cd | 314.17 ± 54.29 a | 131.33 ± 21.47 d | 2869.33 ± 293.68 c | 63.00 ± 4.36 bc | 1377.68 ± 30.02 b | 12.44 ± 2.64 a | |
| BH | 5.82 ± 0.06 bc | 3.52 ± 0.15 a | 1.32 ± 0.34 e | 308.30 ± 32.70 a | 211.00 ± 18.73 a | 1341.33 ± 101.95 d | 51.57 ± 5.85 cde | 1560.00 ± 52.74 a | 9.58 ± 0.41 bc | |
| HL | 7.26 ± 0.11 a | 3.22 ± 0.23 a | 3.98 ± 0.57 b | 309.43 ± 26.91 a | 203.33 ± 28.94 ab | 3148.69 ± 411.63 bc | 62.00 ± 6.08 bcd | 1276.35 ± 56.20 c | 14.23 ± 0.95 a | |
| BHL | 7.26 ± 0.2 a | 3.31 ± 0.44 a | 5.67 ± 1.01 a | 318.50 ± 23.52 a | 200.68 ± 13.20 abc | 3811.00 ± 376.26 a | 75.68 ± 2.31 a | 1272.68 ± 16.07 c | 12.54 ± 0.65a | |
| 2020 | C | 5.33 ± 0.21 c | 2.60 ± 0.21 b | 2.78 ± 1.14 b | 283.27 ± 59.25 c | 98.44 ± 3.75 b | 946.47 ± 223.08 b | 31.38 ± 10.72 c | 2617.33 ± 313.46 a | 8.61 ± 0.68 d |
| B | 5.95 ± 0.25 b | 3.41 ± 0.28 a | 5.71 ± 0.51 a | 474.00 ± 181.03 ab | 131.97 ± 38.38 b | 977.13 ± 349.37 b | 48.78 ± 8.53 abc | 2641.21 ± 586.62 a | 10.63 ± 0.58 bc | |
| L | 6.96 ± 0.27 a | 3.37 ± 0.23 a | 4.78 ± 0.75 a | 366.93 ± 97.04 abc | 103.84 ± 27.27 b | 2566.67 ± 310.31 a | 65.98 ± 33.19 a | 1038.67 ± 209.77 b | 14.29 ± 1.10 a | |
| H | 5.16 ± 0.15 c | 3.36 ± 0.17 a | 5.78 ± 0.57 a | 370.07 ± 31.66 abc | 112.61 ± 42.48 b | 821.07 ± 66.81 b | 47.14 ± 9.28 abc | 2242.67 ± 65.86 a | 9.60 ± 0.41 cd | |
| BL | 7.01 ± 0.11 a | 3.21 ± 0.21 a | 4.70 ± 0.65 a | 427.13 ± 62.34 abc | 128.50 ± 16.92 b | 2558.62 ± 256.85 a | 36.64 ± 5.02 bc | 1132.47 ± 156.11 b | 13.72 ± 0.76 bc | |
| BH | 5.33 ± 0.11 c | 3.32 ± 0.21 a | 5.70 ± 0.91 a | 319.80 ± 44.35 bc | 116.74 ± 11.98 b | 953.93 ± 125.31 b | 50.98 ±6.52 abc | 2304.68 ± 234.83 a | 9.75 ± 0.58 cd | |
| HL | 7.00 ± 0.21 a | 3.35 ± 0.21 a | 5.56 ± 1.54 a | 494.53 ± 130.30 a | 199.80 ± 36.13 a | 2682.00 ± 633.75 a | 57.94 ± 6.74 ab | 1192.66 ± 310.72 b | 14.70 ± 1.52 ab | |
| BHL | 6.98 ± 0.15 a | 3.45 ± 0.29 a | 6.09 ± 0.19 a | 464.8 ± 83.66 ab | 204.25 ± 9.88 a | 2800.00 ± 675.56 a | 56.68 ± 9.22 ab | 1418.00 ± 152.00 b | 13.83 ± 1.16 bc |
The amendments are as follows: C: Control; B: biochar; L: Lime; H: Hydrogel; BL: Biochar-Lime; BH: Biochar-Hydrogel; HL: Hydrogel-Lime; BHL: Biochar-Hydrogel-Lime; AV: available; P: Mehlich -3P; values are mean ± standard deviation of three replicates; Different lowercase letters in each column denote a significant difference between amendments.
Table 3.
Effects of biochar amendment on plant growth indicators collected in the growing, flowering, and fruiting stages of the pepper plant during the study.
Table 3.
Effects of biochar amendment on plant growth indicators collected in the growing, flowering, and fruiting stages of the pepper plant during the study.
| Amendments | Plant Growth Parameters and Growing Stages | ||||||||
|---|---|---|---|---|---|---|---|---|---|
| GI (SPAD) | NDVI | PS | |||||||
| Growing | Flowering | Fruiting | Growing | Flowering | Fruiting | Growing | Flowering | Fruiting | |
| 2018 | |||||||||
| C | 66.90 ±1.57 | 71.15 ± 1.70 | 70.50 ± 2.07 | 0.76 ± 0.05 | 0.91 ± 0.01 | 0.84 ± 0.01 | 17.3 ± 1.67 | 18.27 ± 4.03 | 16.30 ± 1.18 |
| B | 70.76 ±4.40 | 70.42 ± 3.61 | 66.16 ± 6.30 | 0.73 ± 0.04 | 0.82 ± 0.09 | 0.74 ± 0.05 | 14.20 ± 1.69 | 15.18 ± 4.14 | 16.15 ± 2.58 |
| L | 65.64 ± 2.27 | 71.04 ± 3.63 | 69.59 ± 7.27 | 0.69 ± 0.05 | 0.83 ± 0.04 | 0.69 ± 0.01 | 17.25 ± 2.11 | 19.52 ± 5.82 | 14.37 ± 2.22 |
| H | 69.90 ± 0.72 | 71.93 ± 0.56 | 70.98 ± 2.04 | 0.79 ± 0.04 | 0.90 ± 0.03 | 0.85 ± 0.02 | 13.73 ± 2.98 | 20.27 ± 2.41 | 15.2 ± 2.63 |
| BL | 64.8 ± 10.09 | 63.65 ±15.25 | 65.36 ± 14.43 | 0.69 ± 0.08 | 0.81 ± 0.14 | 0.81 ± 0.13 | 13.73 ± 2.18 | 11.94 ± 10.09 | 15.13 ± 0.90 |
| BH | 68.8 ± 1.45 | 73.52 ± 1.75 | 69.09 ± 4.34 | 0.79 ± 0.6 | 0.89 ± 0.03 | 0.88 ± 0.01 | 15.47 ± 1.68 | 22.72 ± 1.18 | 18.00 ± 0.97 |
| HL | 70.19 ± 2.67 | 70.11 ± 4.53 | 68.58 ± 1.54 | 0.69 ± 0.5 | 0.87 ± 0.03 | 0.83 ± 0.1 | 16.07 ± 1.88 | 20.70 ± 1.83 | 13.03 ± 4.73 |
| BHL | 69.27 ± 2.05 | 70.71 ± 4.96 | 70.77 ± 1.23 | 0.74 ± 0.06 | 0.85 ± 0.05 | 0.83 ± 0.01 | 15.10 ± 3.54 | 21.65 ± 1.04 | 19.85 ± 2.21 |
| 2019 | |||||||||
| C | 64.95 ± 2.84 | 68.98 ± 0.45 | 63.03 ± 2.60 | 0.87 ± 0.1 | 0.92 ± 0.02 | 0.89 ± 0.01 | 17.66 ± 2.80 | 18.10 ± 1.06 | 15.42 ± 1.67 |
| B | 62.06 ± 2.45 | 72.08 ± 2.77 | 68.4 ± 6.67 | 0.88 ± 0.01 | 0.93 ± 0.02 | 0.91 ± 0.01 | 18.10 ± 3.47 | 19.42 ± 1.36 | 14.83 ± 2.13 |
| L | 62.71 ± 2.65 | 68.48 ± 1.22 | 67.27 ± 2.92 | 0.90 ± 0.03 | 0.94 ± 0.01 | 0.93 ± 0.02 | 18.42 ± 1.66 | 19.60 ± 1.71 | 15.79 ± 1.05 |
| H | 63.03 ± 2.57 | 70.45 ± 1.56 | 67.71 ± 1.61 | 0.91 ± 0.01 | 0.94 ± 0.01 | 0.92 ± 0.02 | 17.30 ± 1.52 | 18.10 ± 2.21 | 16.23 ± 1.83 |
| BL | 62.72 ± 1.21 | 70.81 ± 2.53 | 68.23 ±1.89 | 0.88 ± 0.04 | 0.93 ± 0.02 | 0.92 ± 0.03 | 17.15 ± 1.11 | 18.32 ± 0.80 | 17.79 ± 2.50 |
| BH | 62.56 ± 2.18 | 68.81 ± 1.40 | 68.72 ± 1.91 | 0.90 ± 0.01 | 0.94 ± 0.02 | 0.92 ± 0.02 | 15.11 ± 2.39 | 18.57 ± 0.87 | 14.94 ± 1.38 |
| HL | 64.96 ± 1.28 | 68.7 ± 1.69 | 68.26 ± 1.76 | 0.89 ± 0.03 | 0.95 ± 0.02 | 0.91 ± 0.04 | 17.15 ± 1.32 | 18.91 ± 1.75 | 16.32 ± 1.96 |
| BHL | 61.53 ± 2.58 | 70.51 ± 0.66 | 68.05 ± 2.47 | 0.88 ± 0.03 | 0.95 ± 0.01 | 0.92 ± 0.01 | 16.79 ± 1.32 | 19.14 ± 1.20 | 16.84 ± 2.58 |
The amendments are as follows: C: Control; B: biochar; L: Lime; H: Hydrogel; BL: Biochar-Lime; BH: Biochar-Hydrogel; HL: Hydrogel-Lime; BHL: Biochar-Hydrogel-Lime; GI: leaf greenness index; NDVI: normalized difference vegetative index; PS, photosynthetic rate (μmol CO2 m−2 s−1). Values are mean ± standard deviation of four replicates.
Table 4.
Overall, the Significant Results of Repeated Measures Analysis of Plant Growth Parameters.
| Effect/Year | Plant Growth Parameters | ||
|---|---|---|---|
| GI (SPAD) | NDVI | PS | |
| 2018 | |||
| Amendment | ns | * | * |
| Season | ns | * | * |
| Amendment*season | ns | ns | ns |
| 2019 | |||
| Amendment | ns | * | ns |
| Season | * | * | * |
| Amendment*season | ns | ns | ns |
GI: leaf greenness index; NDVI: normalized difference vegetative index; PS, photosynthetic rate (μmol CO2 m−2 s−1). * Represents the plant growth parameters as significant based on soil amendments and seasons; ns means not significant.
Disclaimer/Publisher’s Note: The statements, opinions and data contained in all publications are solely those of the individual author(s) and contributor(s) and not of MDPI and/or the editor(s). MDPI and/or the editor(s) disclaim responsibility for any injury to people or property resulting from any ideas, methods, instructions or products referred to in the content. |
© 2025 by the authors. Licensee MDPI, Basel, Switzerland. This article is an open access article distributed under the terms and conditions of the Creative Commons Attribution (CC BY) license (http://creativecommons.org/licenses/by/4.0/).
Copyright: This open access article is published under a Creative Commons CC BY 4.0 license, which permit the free download, distribution, and reuse, provided that the author and preprint are cited in any reuse.


