Submitted:
11 April 2025
Posted:
18 April 2025
You are already at the latest version
Abstract
Market penetration of residential heat pump water heaters (HPWHs) is accelerating due to advancements in highperformance designs, purchase incentives, and regulatory energy efficiency requirements in the United States. Electric utilities can aggregate and leverage these customer-owned flexible loads to provide grid services, such as demand response. However, replacing electric resistance water heaters (ERWHs) with HPWHs introduces new challenges to grid service dispatch. The objective of this paper is to highlight conformance issues and grid service asset performance deficiencies that arise due to inherent HPWH characteristics. The results of this study show that the reduced energy consumption and slower response times of HPWHs, compared against ERWHs, limit their use in grid services, as do non-conformant responses to protocol messaging. To improve grid service planning, utilities need to account for restricted energy capacities and slower response times, and HPWH manufacturers need to ensure conformant behavior and accurate capacity reporting. The latter could be achieved by developing an ANSI/CTA-2045-B implementation guide for HPWHs. By addressing these concerns, utilities can better plan for flexible load-based grid service programs and manufacturers can provide higher quality products to appliance owners.
Keywords:
distributed energy resources
; heat pump water heater
; conformance testing
; grid services
; ANSI/CTA-2045-B
1. Introduction
As the HPWH markets expand, demand response (DR) strategies must adapt to unique heat pump characteristics to maintain the same capabilities as their electric resistance coun- terparts. Integrating grid-interactive residential loads using advanced communication technologies can provide additional capacity for essential reliability services without building addi- tional electrical grid infrastructure. However, variations in the behavior of distributed energy resources (DERs), particularly water heaters (WHs), add difficulty to planning and their deployment for grid-DER services.
DERs are customer-owned, grid-interactive assets— residential loads, generation, or storage assets—that load managing entitys (LMEs) can aggregate to perform grid services [1,2,3]. LMEs, such as Utilities, have had access to customer-owned assets for providing grid services for decades through direct load control (DLC) [4,5]. However, customer enrollment in DR programs remains low, one reason among several being that customers do not have control over their DER during service events, regardless of customer preference [6].
This work is supported by the Northwest Energy Efficiency Alliance.
Technological advancements and smart grid communication protocols, like ANSI/CTA-2045-B (CTA-2045) and Smart En- ergy Protocol (SEP), create opportunities for customers to be proactive participants in DR programs, without giving up total control over their devices. Coordinating large aggregations of DER for grid-DER services using a service-oriented load participation (SOLP) architecture relies on customer partici- pation and unit compliance with said protocols. And, program success must also consider unit conformance. Conformant WHs behave in ways that makes them useful program assets. CTA-2045 specifies communication compliance, but specific WH behaviors in response to requests is determined by the original equipment manufacturers (OEMs).
WH OEMs design responses to CTA-2045 requests. For example, a request could be sent to a WH to defer energy consumption to varying degrees, known as shedding. An OEM may design their WH products to defer a small capacity during a light shed event, compared to a larger deferment for a deep shed event. AHRI 1430-2022 and CA Title 24 JA13 provide recommendations for such deferral capacities, but how these recommendations are achieved are left up to the OEMs [7,8]. Specific energy deferral definitions were intentionally left out of CTA-2045 so that OEMs could retain design and performance freedom over their products. However, the result of this flexibility creates variance in interpretations of performance between OEMs [9].
HPWHs draw significantly less power than ERWHs, ∼0.4 kW compared to ∼4.5 kW respectively. Although HP- WHs typically have longer heating cycles than ERWHs, they operate much more efficiently, consuming a half or a third of the energy that an ERWH would consume due to high compressor Coefficient of Performance (CoP).
However, this efficiency introduces complexities that af- fect the contributions of HPWHs to grid-DER services. For instance, compressors take time to turn on, unlike resis- tance elements, as a start-up procedure must be followed to bring the compressor up to rated conditions. Similarly, compressors cannot be turned off immediately upon requests, again requiring several minutes to shut down properly. And, compressor-based heating cycles take longer to reach set point temperature compared to resistance-based heating due to lower heat transfer rates. All of these factors affect the response of how HPWHs can contribute to grid-DER services.
Grid-DER Services
DERs have unique characteristics that lend themselves to certain types of grid services [10]. For example, DERs that can be leveraged for primary frequency response services must be able to act within 100’s of milliseconds when requested to do so. ERWHs and inverter-based DERs are good candidates for such services [11,12]. However, compressor-based DERs such as HPWHs are too slow to act as primary frequency response resources. While HPWHs consume less energy com- pared to ERWHs, they also have a much slower response time, on the order of minutes, and therefore have reduced grid services applications. Table 1 shows three grid-DER services specifically applicable to HPWHs.
An Energy service uses flexible loads for load shifting based on demand planning or price forecasting. LMEs can plan to request aggregated flexible loads to defer energy during periods of energy deficit, or consume energy during periods of surplus. A Reserve service holds a source or load capacity in reserve for unanticipated events. For example, a WH can be maintained at the set point temperature by placing assets in a Load Up state so that it is “ready” to defer energy consumption in the event of an unplanned peak demand. A Blackstart Support service requests loads to defer consumption during power system restoration periods, thereby mitigating cold-load pickup from thermostatic loads and in- rush currents from compressor-based loads. Flexible loads can participate in Grid Emergency events by removing instances of energy consumption during restoration. Once substations are re-energized, loads can return to normal operation.
HPWHs and ERWHs may function similarly from a cus- tomer’s perspective, but their energy storage capacities and response times are distinct, which introduces new challenges to flexible load-based grid service programs.
2. Testing Methods
Grid-capable WHs can be used to curtail or increase energy consumption by supporting ANSI/CTA-2045-B, a modular communications interface that enables WH participation in grid-DER services. CTA-2045 enables curtailments at three levels of intensity, with LMEs deploying lower-intensity cur- tailments with greater frequency. More about this protocol, interfacing technology, and testing methods are described in previous work [9].
2.1. Water Heater Communications Protocol
Flex load WHs should respond to CTA-2045 messages according to the protocol, known as compliance, and behave in response to those messages in a manner that makes them useful participants, known as conformance. The CTA-2045 protocol has a set of requests and responses functions that enable grid service participation. Commodity Read enables the exchange of attributes such as Operation State Code, Present EnergyTake (EnergyTake), Total EnergyTake Capacity, and Power. The protocol defines multiple modes, including Normal, Shed (a light shed request), Critical Peak (a deep shed request), Grid Emergency (a full shed request), and Load Up (a request to consume energy).
Behavioral responses are defined by the OEM. The re- sponses must provide the LME with means for dynamic use of customers’ WHs. For example, the Shed request is designed to be used frequently, and may be tailored by the OEM to consider customer comfort by decreasing Tset or widening the Tset dead band. For greater shifting capacity, OEMs may use larger Tset setbacks or broader dead bands when the unit is sent Critical Peak and Grid Emergency requests.
2.2. Water Draw Events and Curtailments
This work uses a 48-hour testing period to test baseline and curtailment requests. The WH is subjected to a series of water draws for the first 24 hours of testing, and left to idle for the second half of testing. These CTA-2045 requests are managed by an automated test program.
Additionally, Energy conformance tests place WHs in a Load Up state for half an hour, followed by transition to a Shed or Critical Peak state for four hours. The WHs are subjected to a sequence of water draws to observe energy deferral and EnergyTake dead bands.
2.3. Water Heater EnergyTake
EnergyTake is an estimate of the electrical energy needed to heat the water in the tank to the customer set point. OEMs calculate EnergyTake based on water heater thermal properties and upper and lower temperature sensors within the tank, Equations 1 and 2. Weighted values A and B are unique to individual OEMs.
Ttank = ATlow + BThi
ETHP = cρVtank(Tset − Ttank)CoP−1
c and ρ are the specific heat capacity and density of water. Vtank is the WH tank volume. As water temperature decreases, EnergyTake increases. Therefore, if a tank temperature is at the customer set point, Tset, EnergyTake should be 0 Wh.
Two ways that OEMs can change how WHs respond to grid service requests is by adjusting the tank set point temperature, Tset, and changing EnergyTake dead band. For example, if a unit lowers the internal set point from 130oF to 125oF with a CoP = 3, the heating cycle will be satisfied once EnergyTake reaches ∼ 300 Wh. A change in the dead band could increase or decrease the region where EnergyTake can operate without activating or deactivating a heating cycle.
EnergyTake accuracy is measured through a series of Load Up tests. A unit is placed into Shed mode and cooled to its upper EnergyTake threshold. It is then sent a Load Up request. The magnitude of EnergyTake prior to sending a Load Up is compared with the total energy consumed for the tank to heat to the set point temperature.
3. Results
3.1. EnergyTake Accuracy
Table 2 shows EnergyTake error and standard deviation of reported EnergyTake values across various HPWHs. Most WHs reported high precision but low accuracy EnergyTake estimates, except HPWH D, which exhibited a substantial standard deviation of 170%. The variance may partially be attributed to differences in reported EnergyTake data resolu- tion, ranging from 1 Wh to 75 Wh. However, for HPWH D in particular, reported Total EnergyTake Capacity oscillated throughout testing, causing the unit to misreport Present EnergyTake. This inconsistency is non-conformant behavior, as total EnergyTake capacity is a fixed value based on Tset.
When the test operator changed modes between Electric (resistance-based heating) and Heat Pump (compressor-based heating), there was no observed change in present Energy- Take. It is expected for EnergyTake estimates to differentiate between Electric and Heat Pump modes at the same Ttank, since heat pumps (HPs) typically operate with CoP > 1. EnergyTake error is likely the primary factor contributing to the observed miscalculation.
3.2. Shed and Critical Peak
CTA-2045 states that the Shed and Critical Peak modes should elicit different behaviors, which can be achieved in various ways. A lowered internal set point between a light and deep Shed looks like Figure 1, which shows two different adjusted Tset values for Shed (left) and Critical Peak (right) requests. The left subplot adjusted Tset to correspond with a lower EnergyTake threshold of 75 Wh, just slightly cooler than the customers preferred set point. The right subplot adjusted Tset to correspond with a lower EnergyTake threshold of 525 Wh, which is consistent with recommendations made by Air Conditioning, Heating, and Refrigeration Institute (AHRI). Figure 2 shows identical changes to Tset, whether the unit is in the Shed or Critical Peak mode.
Both HPWH C and HPWH E showed significant Ener- gyTake accuracy issues due to an internal miscalculation. In the upper subplot of Figure 4, the unit starts at Tset, which should report an EnergyTake of 0 Wh. Instead, the unit reports ∼ 1.25 kWh at Tset. With access to upper and lower temperature sensor data, the test operator was able to reconstruct the EnergyTake curve for both HPWH C and HPWH E. These units do not report EnergyTake calculated using the customer’s Tset. EnergyTake is instead calculated assuming Tset = 140oF, regardless of customer preference. EnergyTake accuracy would likely be improved if the unit design accounted for a changing Tset and Ttank.
Some tested HPWHs change their dead band between Normal, Shed, and Critical Peak modes. Figure 1 shows an increase between upper and lower EnergyTake thresholds, due to different dead bands between Shed and Critical Peak modes. Figure 2 shows identical dead bands and Tset in Shed and Critical Peak for HPWH C.
Larger dead bands can cause instances of longer heating cycles. Table 3 shows two examples of dead band differ- entiation compared with total energy consumed during each testing period. HPWH B has a 62% increase in dead band. which corresponds with a 50% increase in energy consumption in Critical Peak, compared to its Shed test event. HPWH C has identical dead bands, and has similar energy consumption during Shed and Critical Peak test events.
3.3. Load Flexibility
When subjected to identical water draw schedules, HPWH A was able to consume ∼36% less energy during a Shed event compared to its Normal operation, shown in Figure 3. The unit delayed energy consumption by ∼70 minutes.
HPWH E did not show any energy consumption deferral, as shown in Figure 4. The unit consumed ∼18% less energy in Shed mode compared to Normal mode. Time delayed energy consumption varied by unit and was proportionate to each WHs change in upper EnergyTake threshold between operating modes. Typically, more dependable upper and lower Energy- Take thresholds showed more consistent energy deferral.
Figure 5 compares Electric and Heat Pump modes di- rectly, on a per unit basis. The WH was cooled to an EnergyTakebase = 1.5 kWh. Then, the WH was sent a Load Up request to observe the complete heating cycle duration in both modes. Electric mode power rating is Pbase = 4.5 kW. The unit spent ∼350% more time actively heating using the compressor, compared to resistance-based heating.
4. Discussion
Effective use of flexible loads will rely heavily on Ener- gyTake accuracy and precision. Inaccurate EnergyTake will affect EnergyTake capacity estimates, but those values can be statistically compensated over time, so long as they are precise. Table 2 shows relatively precise reported EnergyTake, except for HPWH D which reported extremely volatile data.
HPWH D reports an erroneous, oscillating Total Energy- Take Capacity commodity code. Total EnergyTake Capacity is calculated using the customer’s temperature set point, Tset, and a zero-capacity threshold value determined by the OEM. When this value oscillates, reported EnergyTake also oscillates, which causes inconsistent heating thresholds and provides poor prediction of the electrical energy needed to return the tank to Tset. An aggregation of WHs of this brand could not reliably make positive contributions for any grid service.
4.1. Energy Service
An Energy service needs flexible loads that can heat to set point during a Load Up request before shedding energy during peak pricing or high demand periods. Figure 5 shows a significant difference in response times based on WH type. To ensure that all aggregated DER are “ready” to defer energy, LMEs will need to lengthen Load Up times to accommodate compressor-based heating.
Alternatively, as duck curves deepen due to mid-day solar resources, flexible loads should be able to store excess thermal energy based, expressed as EnergyTake. Table 2 shows that every evaluated unit has overestimated reported EnergyTake. Aggregators may need to overcompensate with more loads if DERs are erroneously reporting available capacity.
Figure 3 and Figure 4 show two different behaviors to the same Energy service request. The responses for HPWH E are iden- tical during Normal and Shed events, which means there is no meaningful deferral during peak demand. LMEs expect grid- participating flexible loads to function as useful participants for different grid services.
As HPWHs replace ERWHs, LMEs will see a reduction in load shifting capacity. Currently, none of the WHs change EnergyTake capacity when switching from electric to HP modes. A 5oF reduction in Ttank has different implications for reported EnergyTake due to HPWHs CoP. More units will need to be aggregated to have the same shifting effect during peak demand load shedding events.
Some units required a particularly high EnergyTake thresh- old to respond to a Load Up request. For example HPWH C required a minimum EnergyTake of 600 Wh to start consuming energy. This unit does not return to 0 Wh due to an incorrect calculation for EnergyTake, which would impact actual avail- able capacity reported to utilities.
4.2. Reserve Service
There are some limitations to Reserve-type grid services for HP units as they are currently designed. Table 2 shows large overestimates of reported EnergyTake. Accurate reported capacity is important for deploying grid services, to ensure there are sufficient participating aggregated resources.
HPWHs have a much slower response speed, seen in Figure 5. This could be of concern if a shed-type Reserve service and a unit has reached its upper EnergyTake threshold. For wide dead bands, the unit will need to continuously heat for a longer duration to meet the demand. In particular, HPWH D would be unreliable in reporting an accurate and precise EnergyTake.
4.3. Blackstart Support Service
A Blackstart Support commitment interval can last for many hours. Extended energy deferral of aggregated assets increases the occurrence of cold load pick-up upon re-energizing feed- ers. Typical usage patterns of appliances are diversified among users. However, the user’s diversity is lost when all loads cool simultaneously over an extended event. As a result, all loads will consume energy once the event has ended. Such behavior may create issues as compressors have much higher inrush current than rated, impeding Blackstart Support efforts as the service is restored.
A participating DER during Blackstart Support should defer all energy consumption for the event duration, without causing damage to the device. For all conformance tests, none of the WHs turned on during a Grid Emergency event. Our WH test bays are not equipped to provide inlet water at temperatures lower than the city supply, nor does our lab get cold enough to bring the tank temperature below standard room temperature. It is possible the WHs could be capable of heating if the tank temperature dropped below a threshold we cannot provide.
5. Conclusions
Transitioning from ERWHs to HPWHs is an important step in reducing overall demand on the electric grid. With higher efficiency and lower power usage, HPWHs are a sustainable solution to mitigate the trend in increasing energy consump- tion. For grid-DER services to be successful, manufacturers must continue designing their products to report accurate EnergyTake and to behave in a way that will ultimately support a more stable and reliable grid.
Effective use of compressor-based DER will depend on electric utilities adapting their grid services programs to ac- commodate slower DER response times and lower EnergyTake capacities. Accelerating customer participation could make up for EnergyTake capacity limitations, making it a priority to ad- dress customer comfort and improve participation incentives.
References
- S. Widergren, R. Melton, A. Khandekar, B. Nordman, and M. Knight, “The plug-and-play electricity era: Interoperability to integrate anything, anywhere, anytime,” IEEE P.&En. Mag., vol. 17, no. 5, pp. 47–58, 2019.
- “IEEE guide for distributed energy resources management systems (DERMS) functional specification,” IEEE Std 2030.11-2021, 2021.
- FERC Order No. 2222-A. U.S. Department of Energy, Federal Energy Regulator Commission, Docket No. RM18-9-002, March 18, 2021.
- J. Stitt, “Implementation of a large-scale direct load control system,”.
- IEEE Trans. Pwr App. & Sys., vol. 104, no. 7, pp. 1663–1669, 1985.
- B. F. Hastings, “Ten years of operating experience with a remote controlled water heater load management system at Detroit Edison,” IEEE Trans. Pwr App. & Sys., vol. PAS-99, no. 4, pp. 1437–1441, 1980. [CrossRef]
- Sheth, K., Patel, D., & Swami, G. (2024). Reducing electrical consumption in stationary long-haul trucks. Open Journal of Energy Efficiency, 13(3), 88–99. [CrossRef]
- “Appendix JA13—qualification requirements for heat pump water heater demand management systems,” California Title 24 Building Energy Efficiency Standards, 2022.
- “AHRI 1430-2022 (I-P) standard for demand flexible electric storage water heaters,” Air-Conditioning, Heating, & Refrigeration Institute, September 2023.
- Swami, G., Sheth, K., & Patel, D. (2024). PV capacity evaluation using ASTM E2848: Techniques for accuracy and reliability in bifacial systems. Smart Grid and Renewable Energy, 15(9), Article 159012. [CrossRef]
- J. T. Kolln, J. Liu, S. E. Widergren, and R. Brown, “Common grid services: Terms and definitions report,” Pacific Northwest.
- National Laboratory, PNNL-34483, Tech. Rep., July 2023.
- Sheth, K., & Patel, D. (2024). Strategic placement of charging stations for enhanced electric vehicle adoption in San Diego, California. Journal of Transportation Technologies, 14(1), 64–81. [CrossRef]
- J. Johnson, J. C. Neely, J. J. Delhotal, and M. Lave, “Photovoltaic fre- quency–watt curve design for frequency regulation and fast contingency reserves,” IEEE J. of Photovoltaics, vol. 6, no. 6, pp. 1611–1618, 2016.
- Sheth, K., & Patel, D. (2024). Comprehensive examination of solar panel design: A focus on thermal dynamics. Smart Grid and Renewable Energy, 15(1), 12–28. [CrossRef]
Figure 1.
HPWH B conformance test behaviors during Shed & Critical Peak.
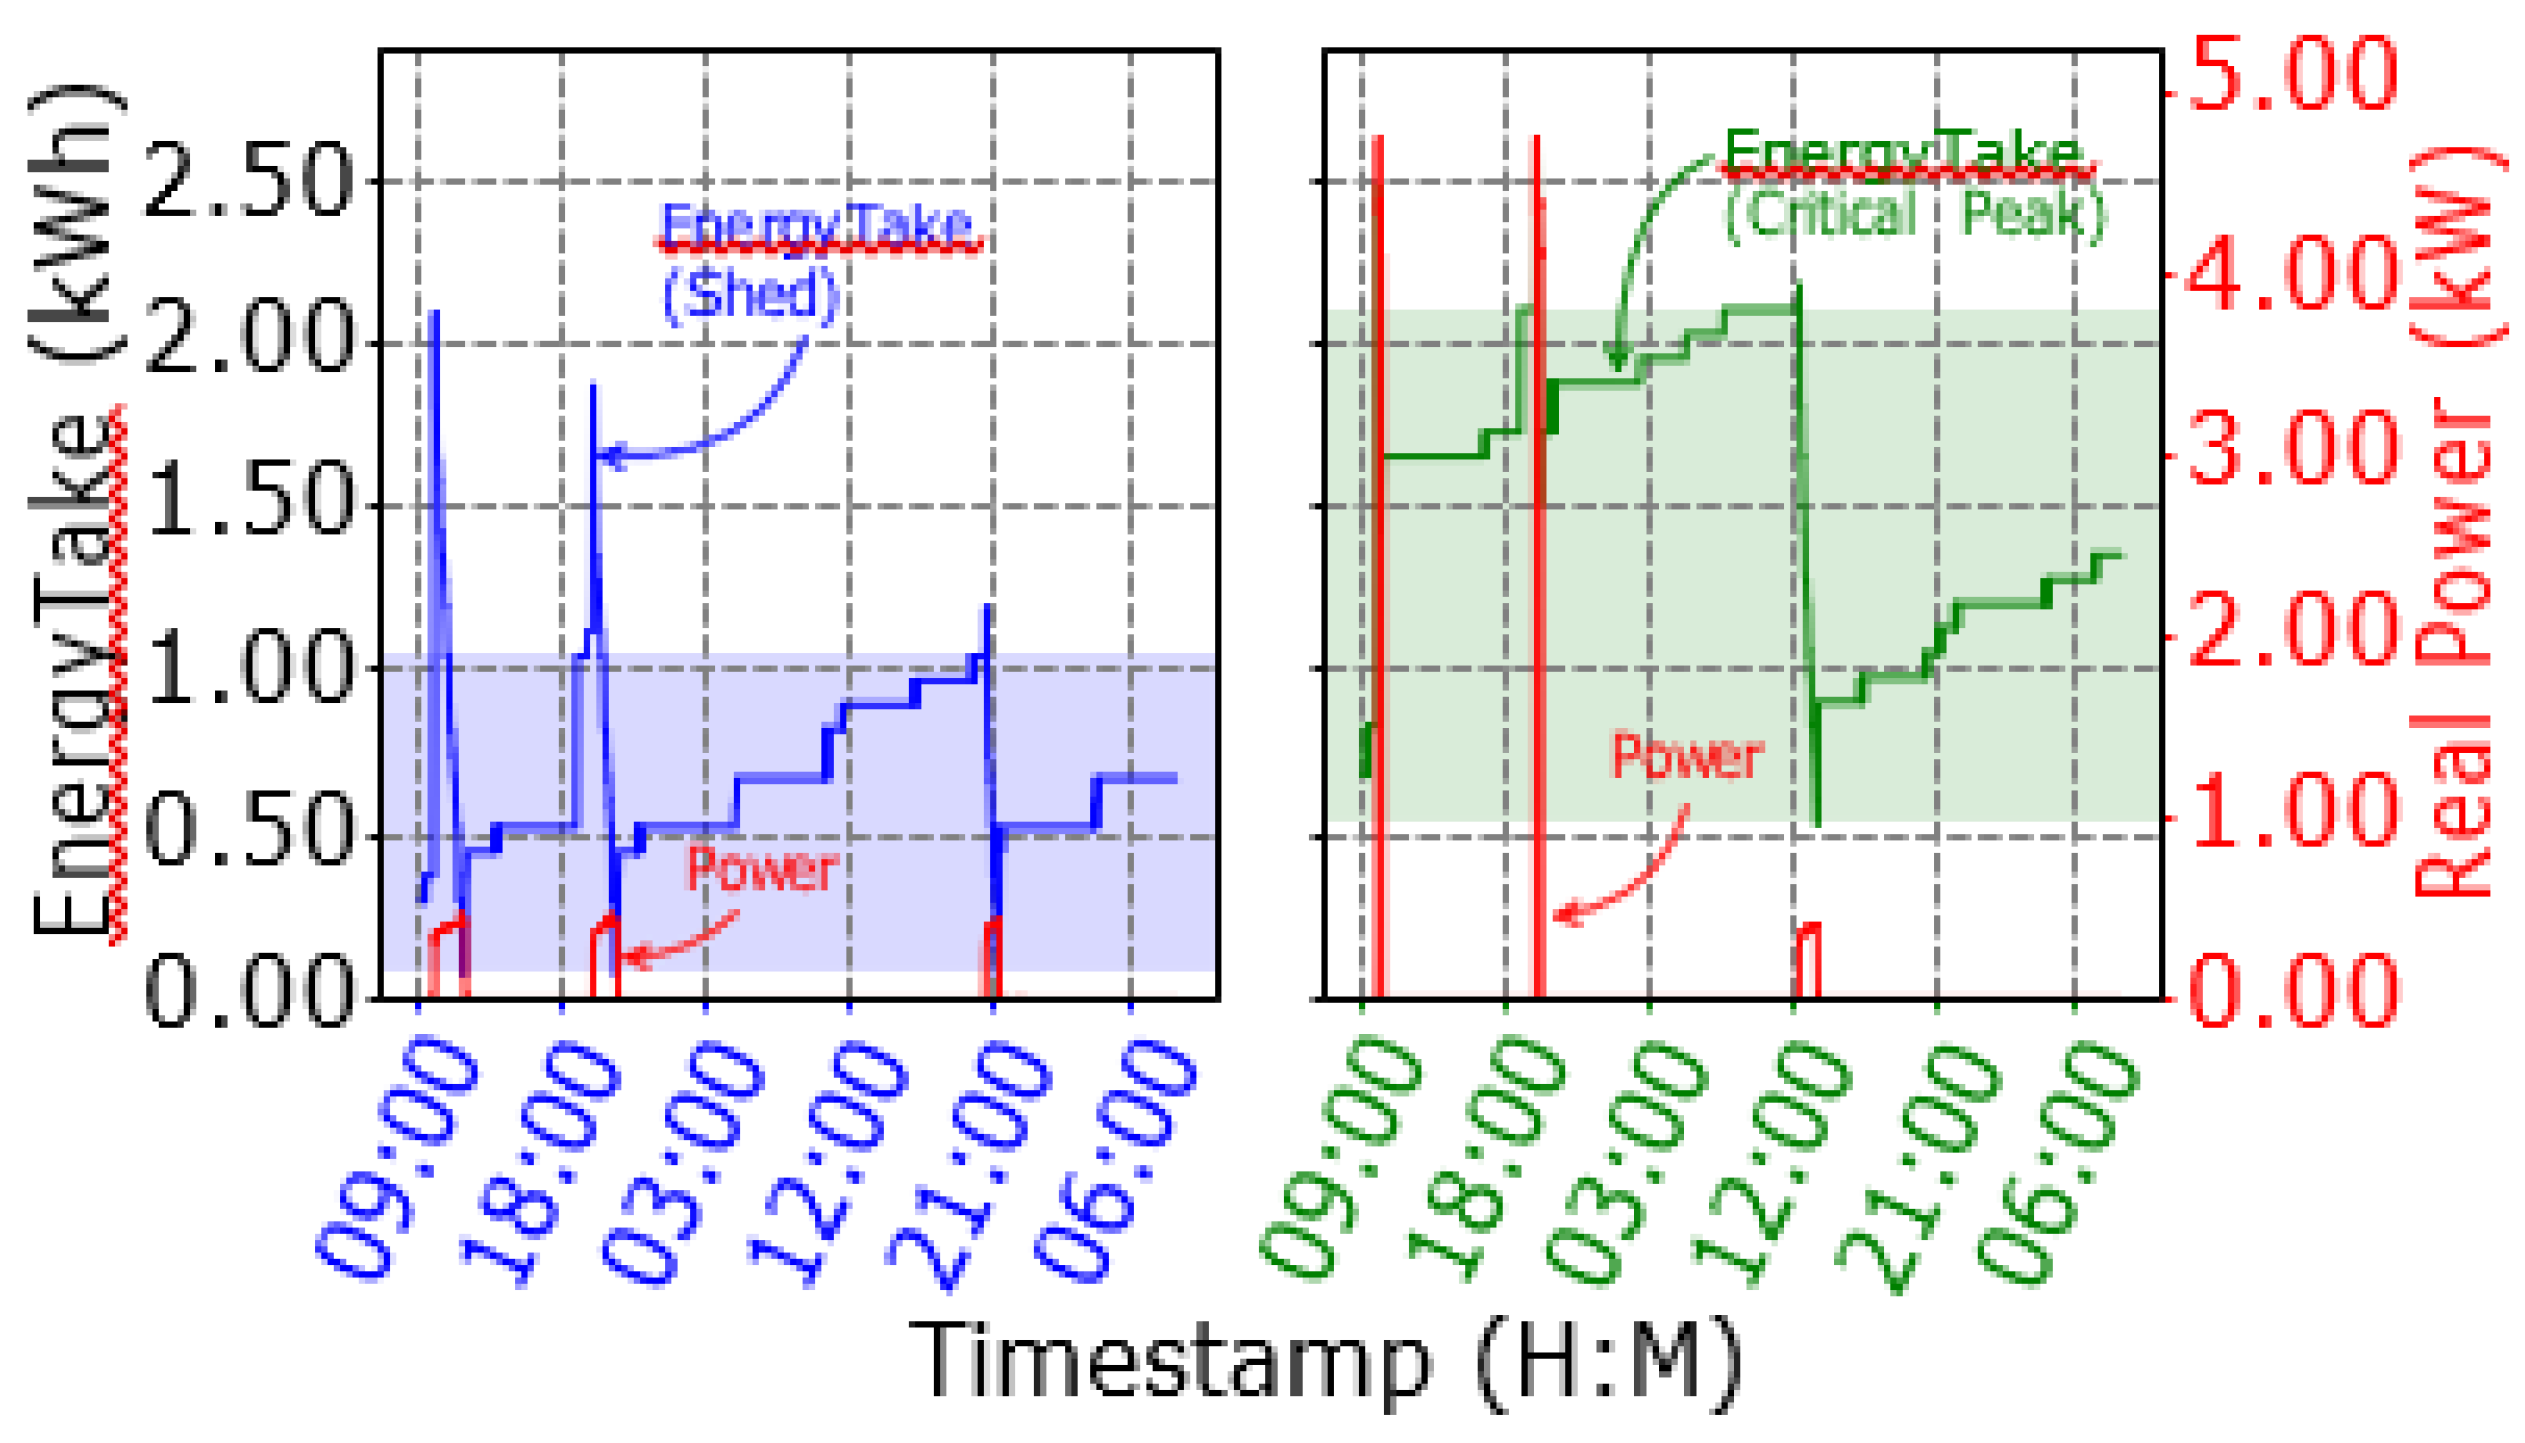
Figure 2.
HPWH C conformance test behaviors during Shed and Critical Peak.
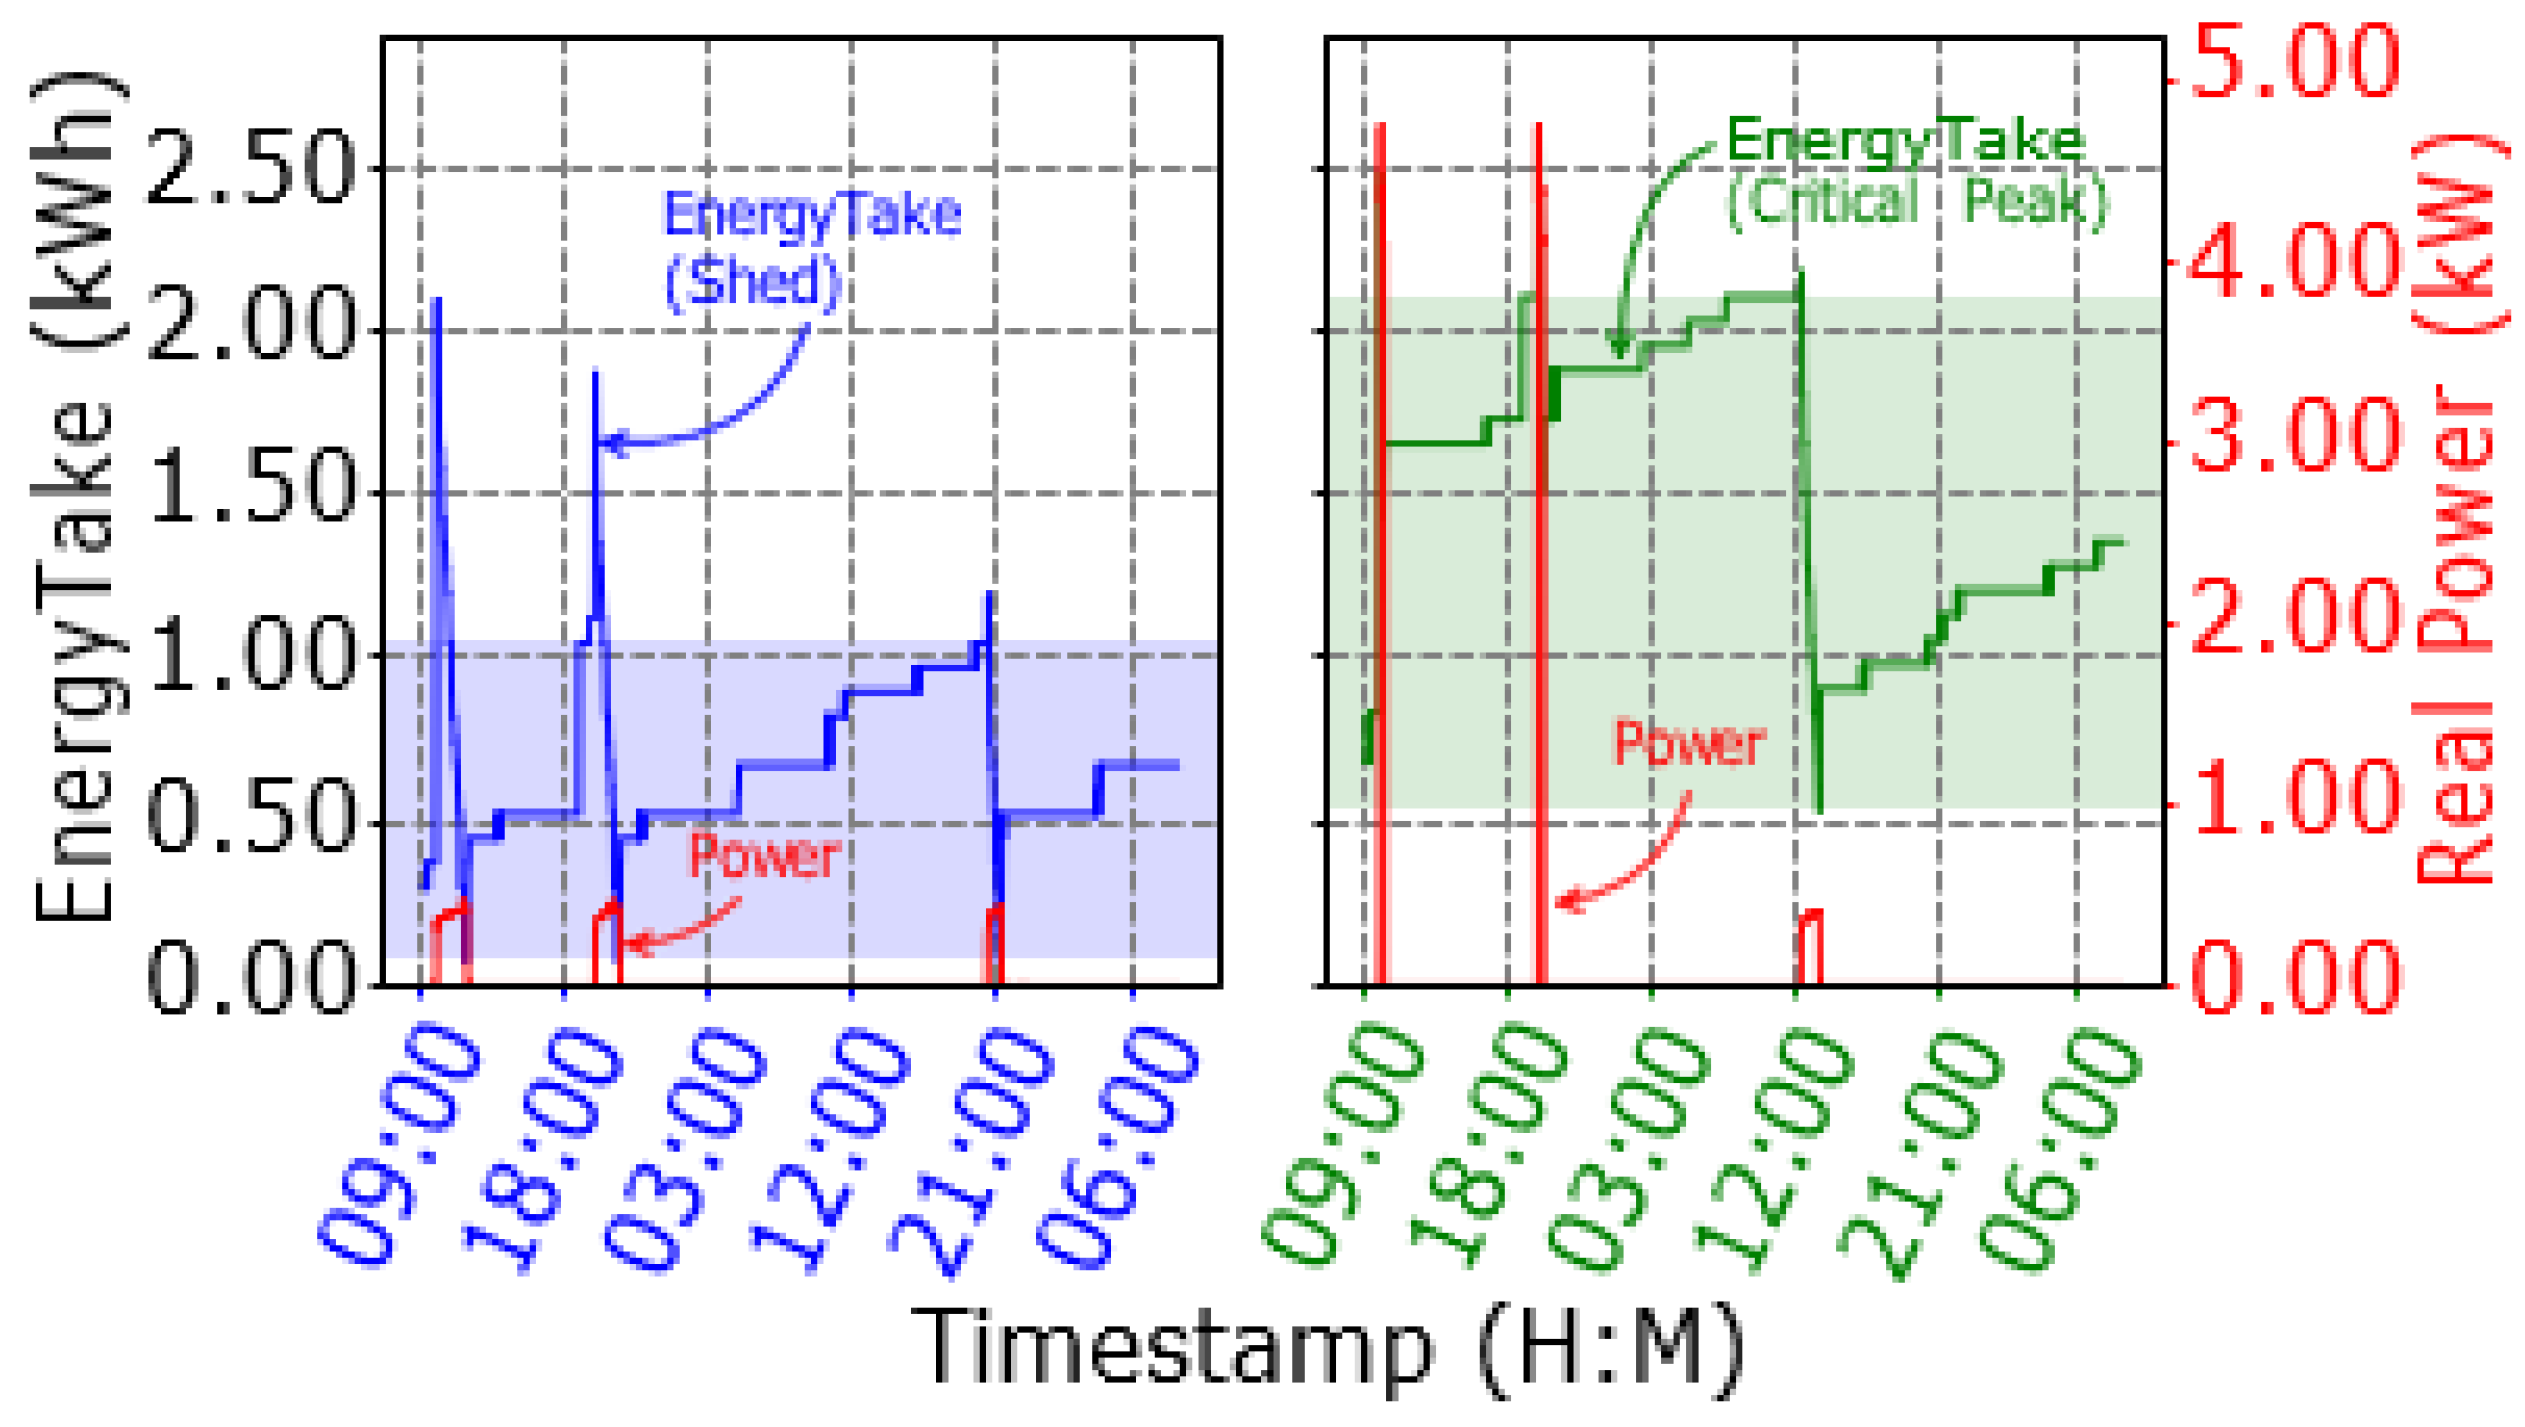
Figure 3.
HPWH A conformance test response during Normal and Shed events. The unit consumes ∼36% less energy while in Shed mode.
Figure 3.
HPWH A conformance test response during Normal and Shed events. The unit consumes ∼36% less energy while in Shed mode.
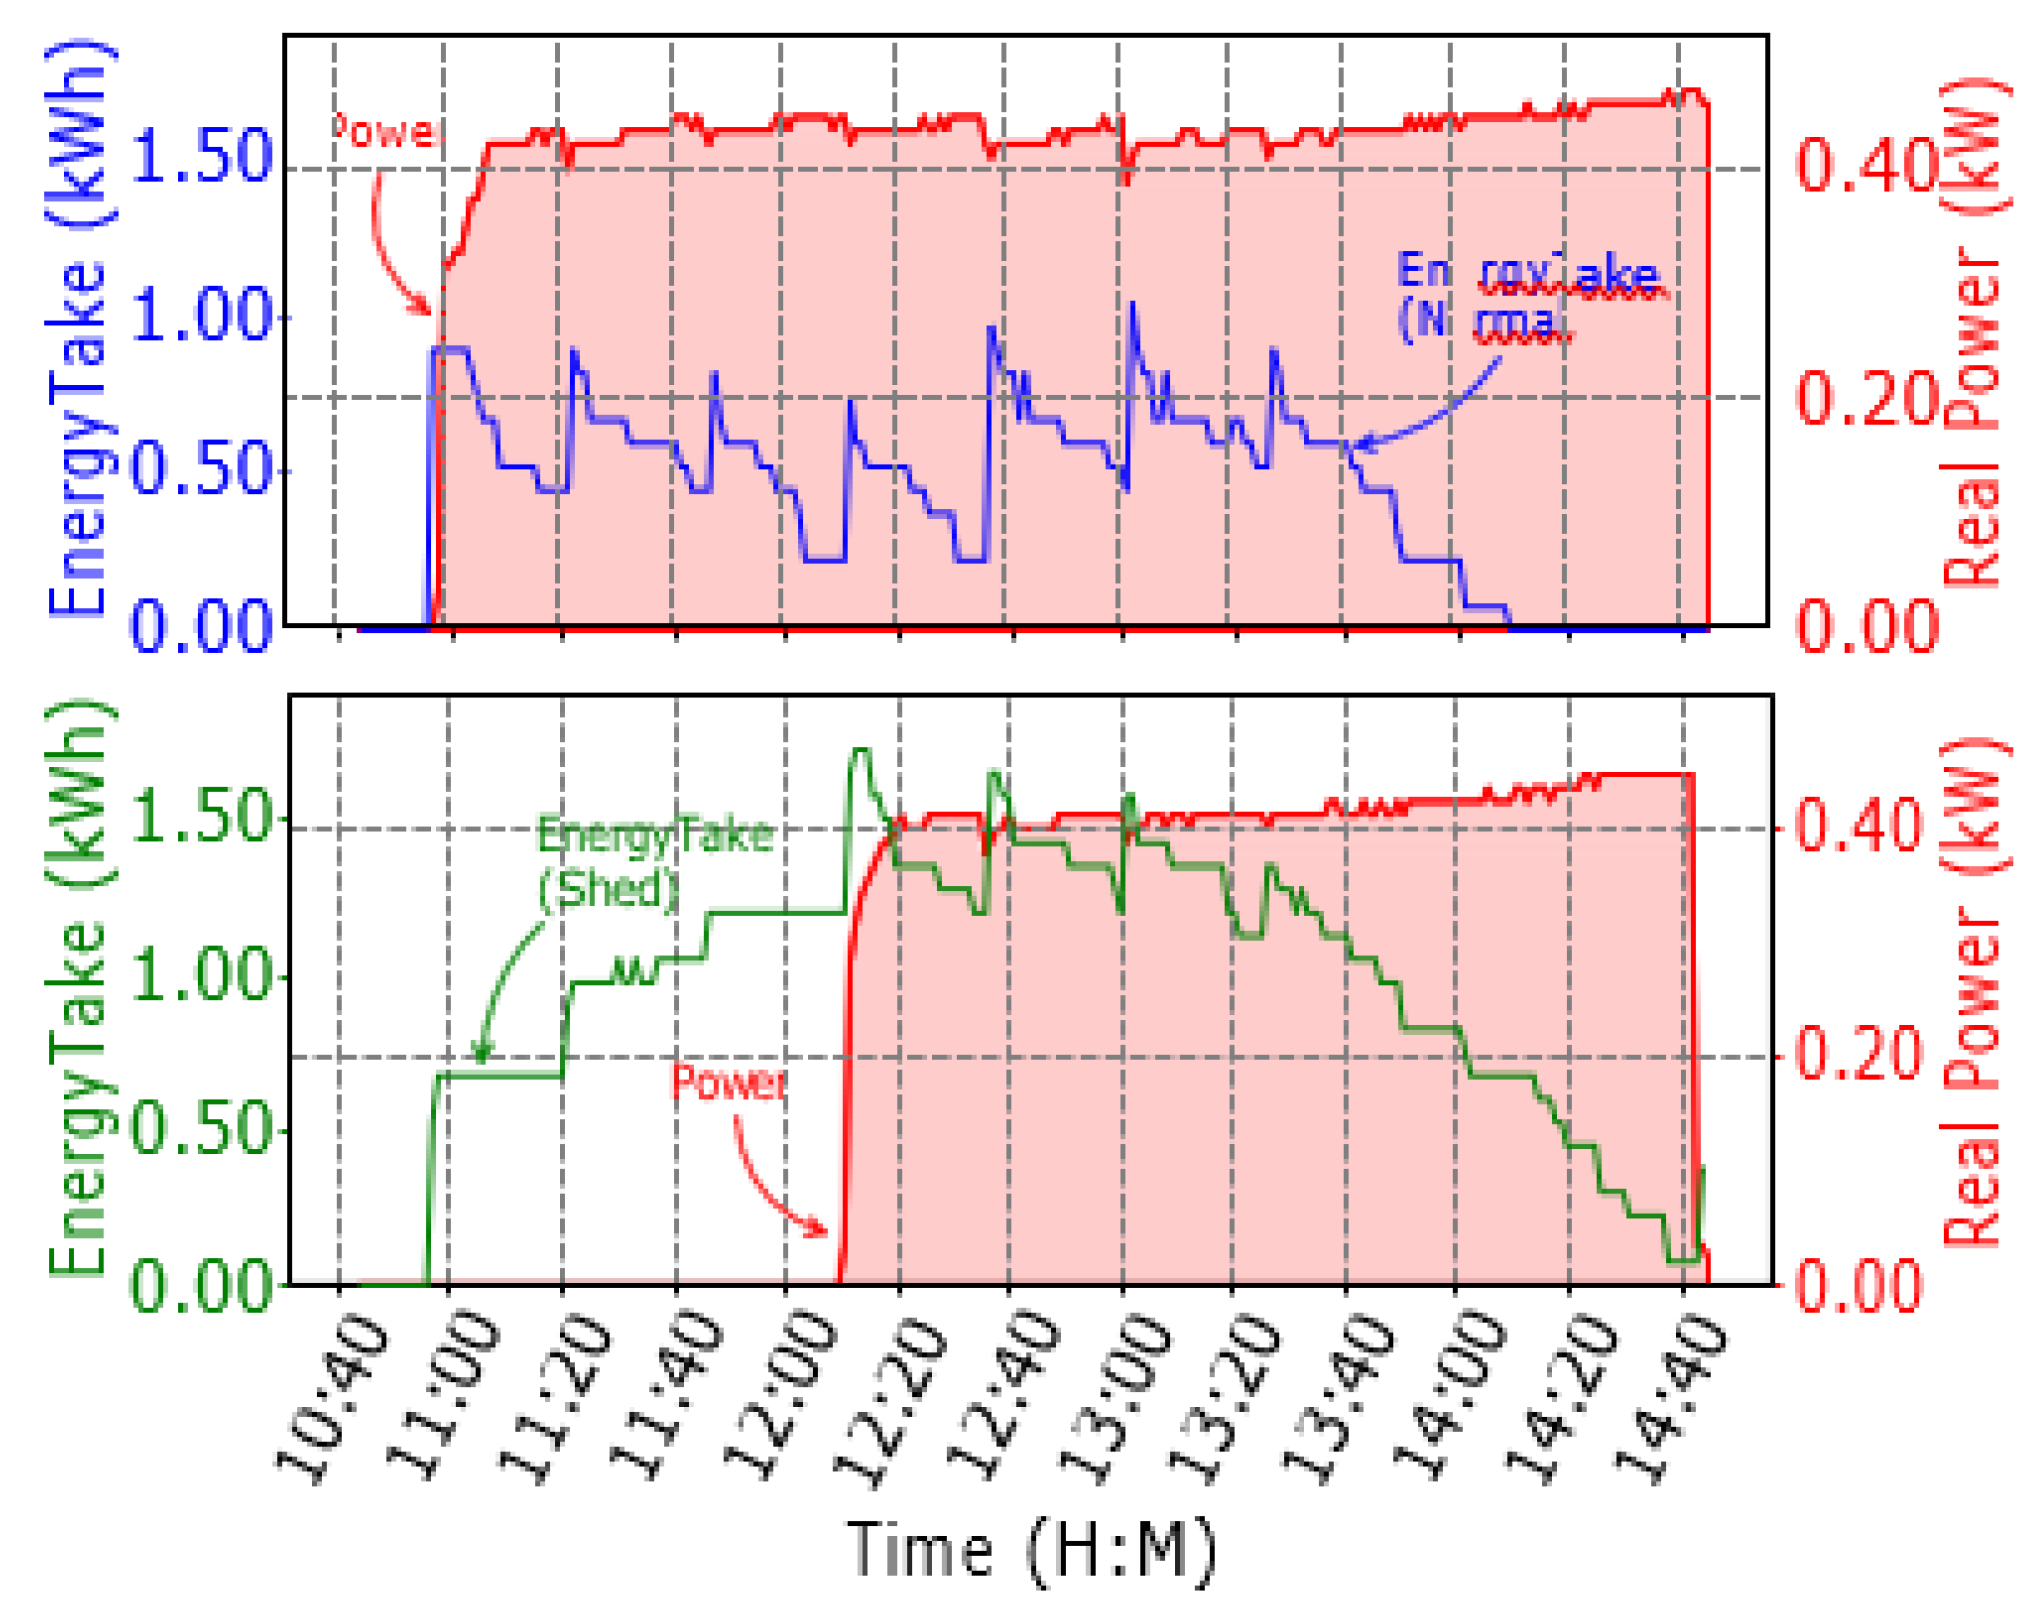
Figure 4.
HPWH E conformance test response during Normal and Shed events. The unit consumes ∼18% less energy in Shed. However, the load is not shifted to a later time.
Figure 4.
HPWH E conformance test response during Normal and Shed events. The unit consumes ∼18% less energy in Shed. However, the load is not shifted to a later time.
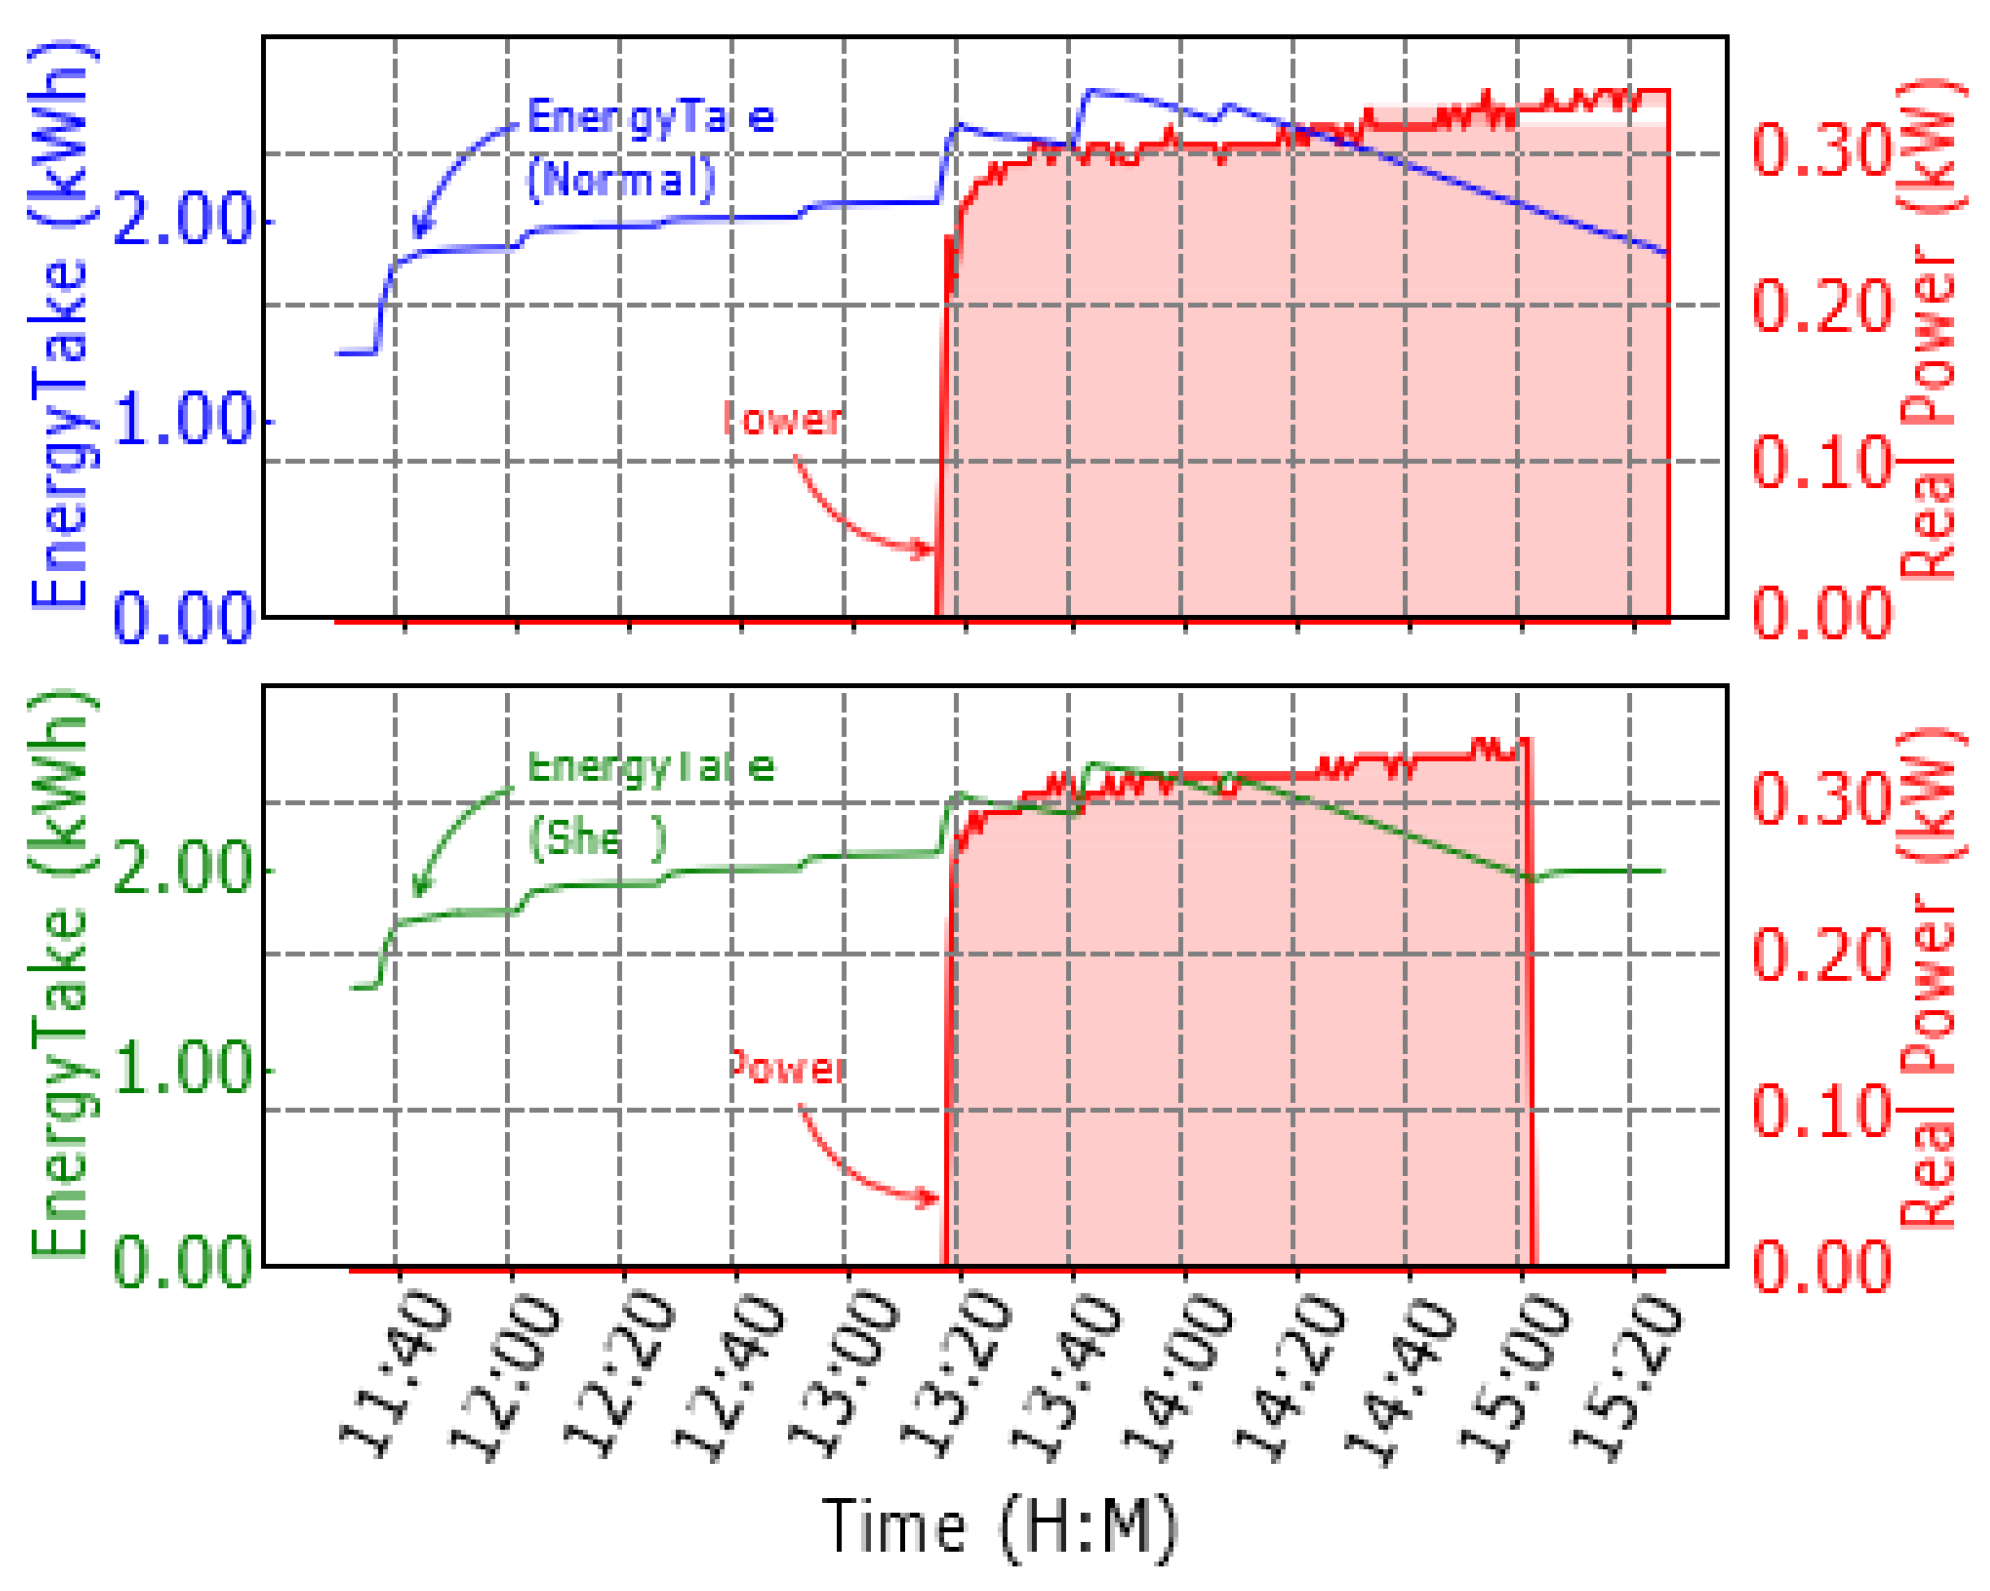
Figure 5.
HPWH B EnergyTake was cooled to 1.5 kWh (base) in both Electric and Heat Pump modes. The WH was then sent a Load Up request. In Heat Pump mode, the unit consumed less energy but had a longer heating duration compared to when the unit was in Electric mode.
Figure 5.
HPWH B EnergyTake was cooled to 1.5 kWh (base) in both Electric and Heat Pump modes. The WH was then sent a Load Up request. In Heat Pump mode, the unit consumed less energy but had a longer heating duration compared to when the unit was in Electric mode.
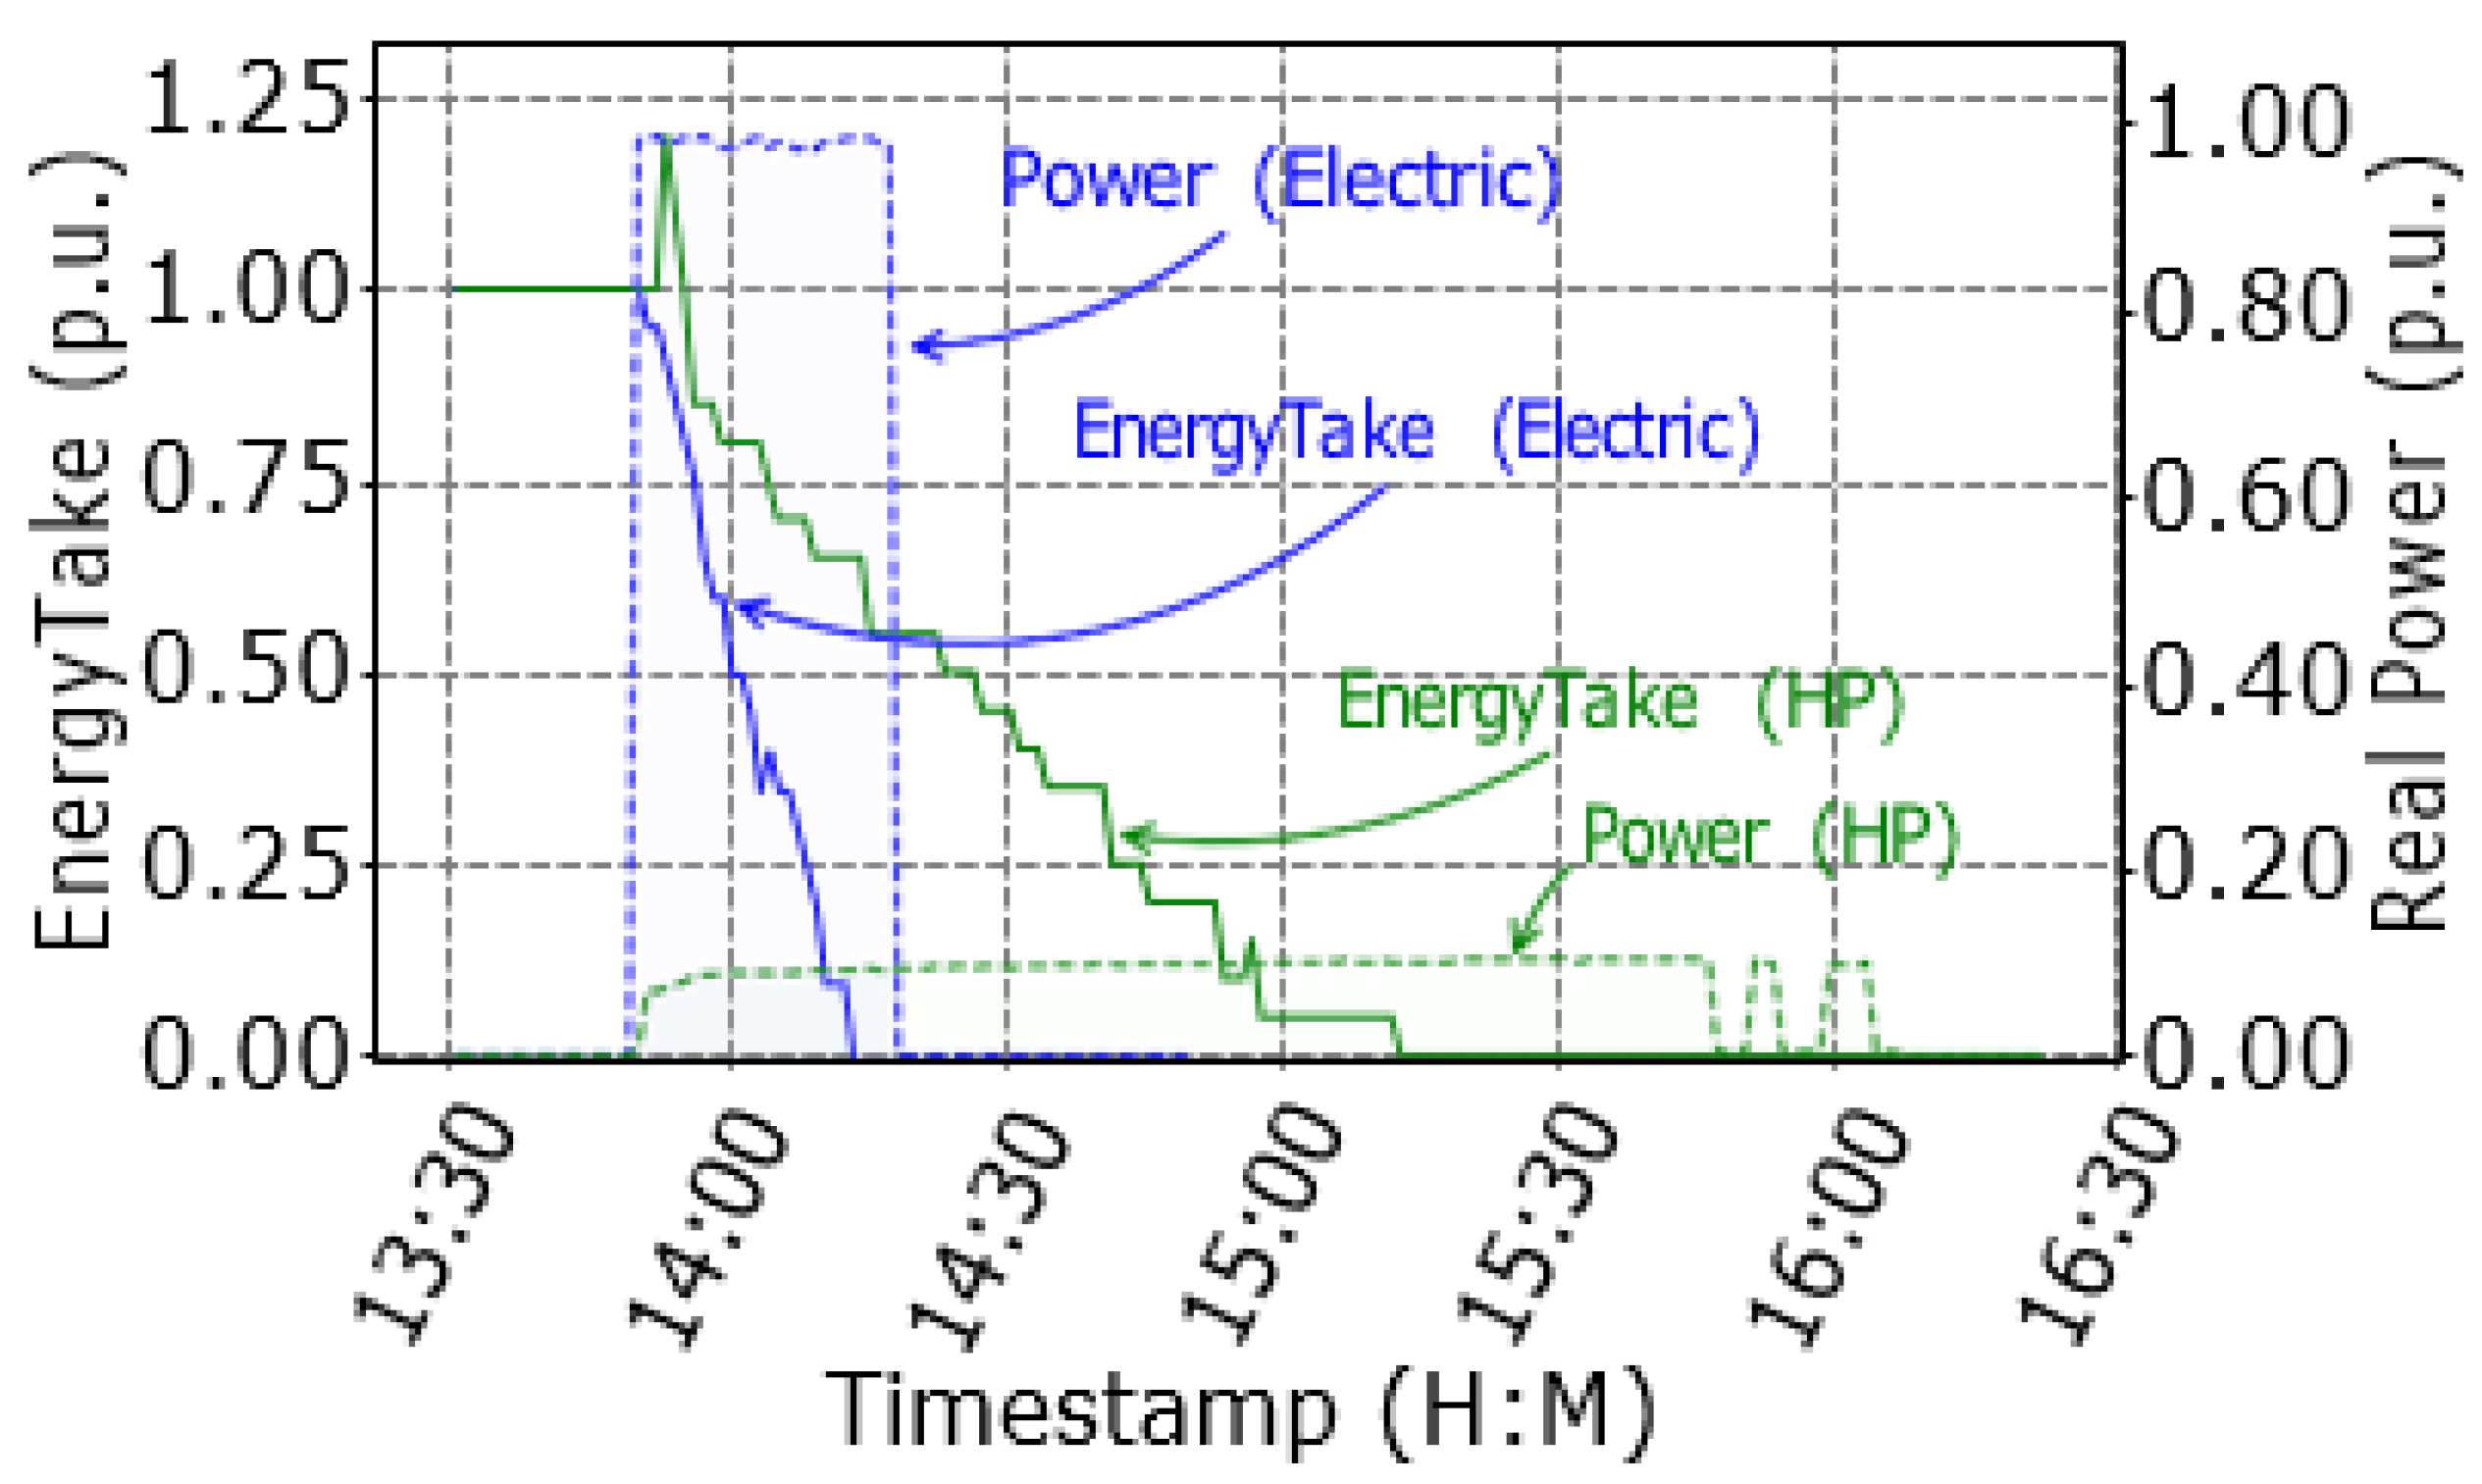

Table 1.
Grid-DER Services Definitions for heat pump water heaters [13].
Table 1.
Grid-DER Services Definitions for heat pump water heaters [13].
| Purpose | Actions | |
| Energy | Ensure adequate energy resource supply. |
Consume or produce a specified amount of energy over a scheduled period of operation. |
| Reserve | Reserve source or load capacity. | Adjust real power of sources or loads within a 5 to 30 minute time frame for dispatched in a contingency. |
| Blackstart Support | Support recovery of a collapsed electrical power system. |
Sources supply power and support voltage. Loads defer post-recovery consumption. |
Table 2.
HPWHs start in a steady-state shed mode, then requested to Load Up. Energytake estimates are compared with energy consumed during Load Up.
Table 2.
HPWHs start in a steady-state shed mode, then requested to Load Up. Energytake estimates are compared with energy consumed during Load Up.
|
Total EnergyTake Cap. (Wh) |
% Error | Std. Dev. | |
| A | 4290 | 52% | 6.1% |
| B | 4290 | 44% | 6.7% |
| C | 4023 | 89% | 11% |
| D | 2924, 3196, 4692, 5134 |
340% | 170% |
| E | 6436 | 98% | 7.8% |
| Average | 125% | 40% | |
Table 3.
Dead band differentiation for HPWH B and HPWH C show that wide dead bands may lead to more energy consumed over the Event Interval.
Table 3.
Dead band differentiation for HPWH B and HPWH C show that wide dead bands may lead to more energy consumed over the Event Interval.
| Shed | Critical Peak | |||
|---|---|---|---|---|
| Dead Band (Wh) |
Total Energy Consumed (Wh) |
Dead Band (Wh) |
Total Energy Consumed (Wh) |
|
| B | 975 | 3800 | 1575 | 5700 |
| E | 200 | 1200 | 200 | 1400 |
Disclaimer/Publisher’s Note: The statements, opinions and data contained in all publications are solely those of the individual author(s) and contributor(s) and not of MDPI and/or the editor(s). MDPI and/or the editor(s) disclaim responsibility for any injury to people or property resulting from any ideas, methods, instructions or products referred to in the content. |
© 2025 by the authors. Licensee MDPI, Basel, Switzerland. This article is an open access article distributed under the terms and conditions of the Creative Commons Attribution (CC BY) license (http://creativecommons.org/licenses/by/4.0/).
Copyright: This open access article is published under a Creative Commons CC BY 4.0 license, which permit the free download, distribution, and reuse, provided that the author and preprint are cited in any reuse.


