Submitted:
16 April 2025
Posted:
17 April 2025
You are already at the latest version
Abstract
Background/Objectives: Nutritional labels, often based solely on chemical analysis, may not fully represent a food’s in vivo biological value. This study aimed to determine if differences in protein content declared on commercial brown sugar labels translate into functional nutritional differences, evaluated using nutritional ecology assays. We hypothesized that higher labeled protein content would correspond to superior biological performance in consumer organisms. Methods: Commercial brown sugars were categorized as high-protein (HPBS) or low-protein (LPBS) based specifically on their nutritional label information. Using Drosophila melanogaster (fruit flies) and Pardosa pseudoannulata (wolf spiders) as models, we compared the effects of diets/solutions containing HPBS, LPBS, or a control. Measured outcomes included Drosophila total developmental time, cumulative fecundity (F1-F3 generations), and climbing ability (negative geotaxis), and Pardosa survival duration under starvation conditions. Results: Spiders provided with the HPBS solution exhibited significantly longer survival than those given LPBS or water. While Drosophila developmental time did not differ significantly between HPBS and LPBS groups, flies reared on the HPBS diet showed significantly higher cumulative fecundity and superior climbing ability compared to both the LPBS and control groups. Conclusions: Brown sugars labeled with higher protein content provide demonstrably greater biological benefits in invertebrate models, particularly impacting survival, fecundity, and physical performance. These findings validate the physiological relevance of this specific label information and highlight the value of integrating label data with functional ecological assays for a more comprehensive assessment of food quality beyond chemical composition alone.
Keywords:
brown sugar
; protein content
; nutritional value
; nutrition ecology
; food labeling
1. Introduction
The nutritional quality of food is fundamental to health, arising not just from individual nutrients but from their synergistic interplay and balance [1,2]. Accurately assessing a food’s nutritional value—defined as its capacity to meet physiological requirements for energy and nutrients [2,3]—is therefore crucial. Conventionally, this assessment relies heavily on chemical analysis to quantify macronutrient (e.g., protein, carbohydrates, fats) and micronutrient content, often presented to consumers via nutritional labels [4,5], While indices derived from such analyses (e.g., INQ, PDCAAS) offer further insights [6,7], this compositional approach has limitations. It requires sophisticated techniques vulnerable to error or even deliberate adulteration (as exemplified by the Melamine incident, which inflated apparent protein levels) [8], and critically, compositional data alone may not fully predict the in vivo biological consequences or overall health impact of consuming a food [[9[11].
Directly evaluating nutritional effects through animal or human feeding trials provides functional validation but is often resource-intensive and ethically complex [11]. Nutritional ecology presents a powerful and practical alternative methodology [3]. This field investigates how dietary components directly influence key fitness parameters such as survival, growth, development, and reproduction in model organisms [1][14]. Insects and other arthropods, with their short lifecycles and sensitivity to dietary variation, are particularly valuable models for rapidly assessing the biological impact of different foods or nutrient compositions [15,16]. Insights gained from these models can reflect fundamental nutritional principles relevant across species, including humans [11,17].
Brown sugar, a common food ingredient, presents an interesting case study for nutritional evaluation, as it is available in various forms with notable market heterogeneity in China [18]. Preliminary surveys of commercial brown sugar products revealed a distinct categorization based on the protein content declared on nutritional labels: a smaller fraction (~20%) labelled as ‘high-protein’ (2.8-3.5 g/100g) and a larger fraction (~80%) labelled as ‘low-protein’ (e.g., ~0.7 g/100g). This label-based difference raises the hypothesis that brown sugars marketed with higher protein content confer superior nutritional benefits compared to those marketed as low-protein. However, whether this difference stated on the label translates into tangible biological advantages requires empirical validation beyond simple chemical composition.
This study employs a nutritional ecology framework to experimentally test this hypothesis. We aimed to assess whether the label-indicated difference in protein content between commercially sourced high-protein brown sugar (HPBS) and low-protein brown sugar (LPBS) results in measurable differences in fitness-related outcomes in two standard invertebrate models. Specifically, we compared the effects of diets incorporating HPBS, LPBS, or a control (no added sugar) on the total developmental time, cumulative fecundity (F1-F3 generations), and climbing ability (negative geotaxis) of the fruit fly Drosophila melanogaster. Additionally, we evaluated the impact of HPBS and LPBS solutions (versus a water control) on the survival duration of second-instar juvenile wolf spiders, Pardosa pseudoannulata, under starvation conditions. By comparing these in vivo performance outcomes, this research provides an ecological validation of the nutritional value implied by the protein declarations on commercial brown sugar labels.
2. Materials and Methods
2.1. Brown Sugar Samples
This study assessed the nutritional value of different commercial brown sugar brands using a nutritional ecology approach. Based on the protein content declared on the nutritional labels of products available in local retail markets (Xiaogan City, Hubei Province, China), brown sugars were categorized as either high-protein or low-protein. Two representative products were selected for subsequent experiments based on this label information. The product designated as high-protein brown sugar (HPBS) was Original Brown Sugar (manufactured by A Co., Ltd.), chosen for its labeled protein content of 2.8 g per 100 g. Concurrently, the product selected as low-protein brown sugar (LPBS) was Pure Brown Sugar (manufactured by B Co., Ltd.), distinguished by its labeled protein content of 0.7 g per 100 g. Both products were purchased locally. Detailed nutritional information for these selected sugars, including carbohydrate content, is provided in Table 1.
2.2. Drosophila Melanogaster Experiments
2.2.1. Rearing Conditions and Diet Preparation
The effects of different brown sugar diets on D. melanogaster life-history traits were assessed using three diet treatments, each replicated ten times in glass culture tubes (5 cm diameter × 12 cm height). All flies were reared on a base medium prepared from Carolina medium formula 4-24 (Carolina Biological Supply, Burlington, NC, USA), reconstituted with water according to the manufacturer’s instructions. The Control diet consisted of this base medium only. The High-protein brown sugar (HPBS) diet was prepared by supplementing the base medium with 3 g of HPBS per tube. Similarly, the Low-protein brown sugar (LPBS) diet involved supplementing the base medium with 3 g of LPBS per tube. Detailed formulations for each diet are provided in Table 2. Each replicate tube was initially seeded with ten parental flies (5 male-female pairs; 3-5 days old). All cultures were maintained in an incubator under a 14-hour light/10-hour dark cycle at 25±1°C and 60–80% relative humidity. To prevent generational overlap, parental flies were removed from the tubes approximately 7-8 days post-introduction, once significant larval activity and initial pupation were observed.
2.2.2. Developmental Time
The total developmental time for the F1 generation on each diet was determined through daily observation of each replicate culture tube, commencing from the day the parental (P) generation flies were introduced (designated as Day 0). The primary metric recorded was the Date of First Adult Emergence for each tube, defined as the day on which the first F1 adult fly emerged. The total developmental time for each replicate was calculated as the number of days from Day 0 to the Date of First Adult Emergence. This metric was used for statistical comparison among the dietary treatments.
2.2.3. Fecundity Assessment (Cumulative over Three Generations)
Cumulative reproductive output was assessed over three generations (F1-F3) for each dietary treatment (Control, HPBS, LPBS). Parental (P) Generation: For each treatment, ten replicate culture tubes (5 cm diameter × 12 cm height, see Table 2 for media) were established, each seeded with five male-female pairs of newly eclosed adults (collected within 8h, anesthetized with diethyl ether, sexed). Cultures were maintained at 25±1℃ and 60-80% RH. Parental flies were removed after 7 days. For each replicate line, the number of emerging progeny was counted over a 7-day window following the appearance of the first adult of that generation (F1, F2, or F3). Specifically, daily monitoring commenced after P removal to count F1 progeny. To obtain F2 progeny, newly eclosed F1 adults (within 8h) were collected from each line, and new cultures were set up under identical conditions (5 pairs/tube, 5 reps/treatment). These F1 parents were removed after 7 days, and emerging F2 progeny were counted over the 7-day window. This process was repeated using newly eclosed F2 adults to obtain the F3 progeny count. The total fecundity for each replicate line was calculated as the sum of the F1, F2, and F3 progeny counts. This cumulative value (F1+F2+F3) was used for statistical comparison among treatments.
2.2.4. Negative Geotaxis (Climbing) Assay
The flight and climbing capability of F1 generation adults reared on the different diets was assessed using a negative geotaxis assay, adapted from [19]. Approximately 15 days after the initial culture setup (coinciding with peak F1 emergence), 250 F1 flies were randomly collected from each treatment group and divided into 10 technical replicate groups of 50 flies each. Each group of 50 flies was transferred into a clean, empty glass tube identical to the culture tubes (5 cm diameter × 12 cm height). The flies were gently tapped to the bottom of the tube. After allowing flies to settle briefly, the number of flies climbing past a designated height mark (8 cm from the bottom) within 5 seconds was recorded. This procedure was repeated 3 times for each group with a 2 h rest period in between trials. A climbing index was calculated for each technical replicate as: (mean number of flies climbing past the mark within 5 seconds / 50) × 100%.
2.3. Spider Survival Assay
To assess the effect of brown sugar type on survival under nutritional stress, experiments were conducted using second-instar juvenile wolf spiders, Pardosa pseudoannulata. Three treatment solutions were prepared: a high-protein brown sugar solution (HPBS solution; 5 g HPBS dissolved in 250 mL of distilled water), a low-protein brown sugar solution (LPBS solution; 5 g LPBS dissolved in 250 mL of distilled water), and a control of distilled water only. Note that the brown sugars used (HPBS and LPBS) are characterized in Table 1.
A single cohort of 67 second-instar spiders, obtained from the egg sac of one female to minimize genetic variability, was used. Spiders were randomly assigned to one of the three treatment groups : water control (n = 23), HPBS solution (n = 22), or LPBS solution (n = 22). Each spider was individually housed in a glass test tube (Length × diameter: 6 cm × 2 cm) containing a small piece of sterile sponge at the bottom. Approximately 2 mL of the corresponding treatment solution was added to the sponge in each tube. Solutions were replenished every three days to prevent dehydration and spoilage. The tubes were sealed with breathable cotton plugs to allow air exchange while preventing escape.
Spiders were maintained under these conditions without any additional food source, relying solely on the provided solution for hydration and potential nutrient intake. Survival was monitored daily by checking each tube for spider activity. Care was taken during handling and monitoring to avoid accidental injury or escape. The experiment was conducted in a laboratory maintained at a constant temperature of 25±1℃ and approximately 60-80% relative humidity, under a 14:10 h L:D cycle.
2.4. Statistical Analysis
Data were initially organized using Microsoft Excel 2016, while all statistical analyses and graphical representations were performed using GraphPad Prism version 6.0 (GraphPad Software, La Jolla, CA, USA). Juvenile spider survival across the three treatment groups (water control, HPBS solution, LPBS solution) was analyzed using Kaplan-Meier survival analysis, with differences among survival curves compared using the log-rank (Mantel-Cox) test. For D. melanogaster experiments comparing the three dietary treatments (Control, HPBS diet, LPBS diet), assumptions of normality and homogeneity of variances for Total Developmental Time, Total Fecundity (cumulative F1+F2+F3 progeny), and F1 Climbing Index data were first verified using the Shapiro-Wilk test and Levene’s test, respectively. Following confirmation of assumptions, differences among the treatment groups for these three variables were evaluated using one-way Analysis of Variance (ANOVA). Pairwise post-hoc comparisons were then conducted using Tukey’s honestly significant difference (HSD) test only where the overall ANOVA indicated significant differences (P < 0.05) to identify specific variations between group means. Statistical significance for all analyses was set at an alpha level of P < 0.05.
3. Results
3.1. Effects of Brown Sugar Diets on Drosophila melanogaster Performance
3.1.1. Total Developmental Time
There was no significant difference in the Total Developmental Time (Day 0 to first F1 adult emergence) of fruit flies among the three dietary treatments (Control, HPBS diet, LPBS diet) (One-Way ANOVA: F2,27 = 0.876, P = 0.428; Figure 1).
3.1.2. Total Fecundity
Total Fecundity (cumulative F1+F2+F3 progeny) differed significantly among the dietary treatments (One-Way ANOVA: F2,27 = 15.41, P < 0.001, Figure 2). Post-hoc Tukey’s HSD tests revealed that flies fed the HPBS diet had significantly higher fecundity compared to both the Control group (P < 0.01) and the LPBS group (P < 0.05). No significant difference in fecundity was observed between the Control and LPBS groups (P > 0.05).
3.1.3. Climbing Ability
The Climbing Index of F1 generation flies varied significantly among the three dietary treatments (One-Way ANOVA: F2,27 = 17.04, P < 0.001; Figure 3). Post-hoc Tukey’s HSD tests indicated that flies reared on the HPBS diet exhibited a significantly higher Climbing Index than those reared on the Control diet (P < 0.01) and the LPBS diet (P < 0.05). The Climbing Index did not differ significantly between the Control and LPBS groups (P > 0.05).
3.2. Effect of Brown Sugar Solutions on Juvenile Spider Survival
Survival duration of juvenile P. pseudoannulata under starvation conditions differed significantly among the three hydration treatments (water control, HPBS solution, LPBS solution) (Log-rank test: χ² = 91.51, df = 2, P < 0.0001; Figure 4). Pairwise comparisons using the log-rank test revealed significant differences between all groups: spiders provided with the HPBS solution survived significantly longer than those provided with the LPBS solution (Log-rank test: χ² = 5.886, df = 1, P = 0.0153), and both sugar groups survived significantly longer than the water control group (HPBS vs Control: χ² = 48.45, P < 0.0001; LPBS vs Control: χ² = 50.06, P < 0.0001 ). The observed maximum survival times were approximately 58 days for the HPBS group, 41 days for the LPBS group, and 30 days for the water control group.
4. Discussion
This study employed a nutritional ecology approach to investigate whether the protein content difference declared on the nutritional labels of commercially available brown sugars translates into tangible biological performance benefits in invertebrate models. Our findings demonstrate that high-protein brown sugar (HPBS), selected based on its higher labeled protein content, generally conferred significant advantages over low-protein brown sugar (LPBS) and a control diet/solution. Specifically, Drosophila melanogaster reared on the HPBS diet exhibited significantly higher total fecundity and superior climbing ability compared to those on the LPBS diet. Similarly, juvenile Pardosa pseudoannulata spiders provided with an HPBS solution showed markedly enhanced survival under starvation conditions compared to those receiving the LPBS solution or water alone. These results strongly suggest that the higher protein content indicated on the HPBS label corresponds to functionally superior nutritional value, particularly impacting demanding physiological processes like reproduction, locomotion, and stress resistance.
The pronounced positive effects of HPBS on fecundity and survival align well with established principles in nutritional ecology, which highlight dietary protein as a critical limiting nutrient for growth, reproduction, and overall fitness in many organisms, especially invertebrates [11,14]. Protein provides essential amino acids necessary for synthesizing tissues, enzymes, and reproductive components (eggs). Studies on fruit flies have consistently shown that increased dietary protein or specific amino acids can boost reproductive output [20,21], while protein limitation often restricts it. Likewise, in spiders and other predatory arthropods, protein intake is frequently linked to better body condition, higher fecundity, and increased survival, particularly under stressful conditions like starvation [2][24]. Our findings extend these principles, demonstrating that even the relatively subtle difference in protein content indicated between two commercial brown sugar products can elicit significant fitness consequences in sensitive model organisms.
Interestingly, we observed no significant difference in the total developmental time of D. melanogaster among the dietary treatments. This suggests that while the higher protein in HPBS was crucial for maximizing reproductive output and physical performance (climbing), the baseline nutrients in the standard medium, possibly combined with the readily available carbohydrates from both sugar types, were sufficient to support a similar rate of development to adulthood across all groups. It is plausible that the quantitative demands for protein are higher for sustained egg production and optimal locomotor function than for simply reaching adult eclosion within a typical timeframe [25,26]. This highlights the value of assessing multiple fitness components, as different life-history traits can respond differently to nutritional variation.
A key contribution of this study lies in its methodology – using in vivo ecological performance assays to validate nutritional information presented on commercial food labels. While standard chemical analysis provides essential compositional data, it may not fully capture the biological availability or functional impact of nutrients, and can be susceptible to inaccuracies or even adulteration [8]. Our nutritional ecology approach provides a functional, biological assessment that complements traditional methods. The consistent superiority of the HPBS group across multiple demanding fitness metrics (fecundity, climbing, survival) provides strong empirical evidence supporting the claim implied by its label – that it offers greater nutritional benefit, likely mediated by its higher protein content, compared to the LPBS product. This approach offers a potentially valuable framework for evaluating the functional quality of other food products where label information suggests nutritional differences.
However, certain limitations should be acknowledged. First, our study focused on only one representative brand for each category (HPBS and LPBS). While selected based on typical label values, further research incorporating a wider range of brands within each category would be necessary to generalize these findings across the entire market. Second, the protein content itself was based on label declarations; future studies could benefit from independent chemical analysis of the specific batches used to precisely quantify the protein and other nutrient differences. Third, experiments were conducted under controlled laboratory conditions, which may not fully replicate the complex environmental factors influencing nutrition in natural settings. Finally, while fruit flies and spiders are powerful models for revealing fundamental nutritional principles, direct extrapolation of the magnitude of these effects to human health requires caution. The study demonstrates a functional difference relevant to these organisms based on label-indicated protein, supporting the relative nutritional value, but does not quantify the specific impact on human consumers.
In conclusion, this study successfully utilized a nutritional ecology framework, employing Drosophila melanogaster and Pardosa pseudoannulata as model organisms, to assess the functional nutritional value associated with the labeled protein content of commercial brown sugars. The consistent findings across fecundity, climbing performance, and stress survival assays provide strong ecological validation that the high-protein brown sugar confers superior biological benefits compared to the low-protein brown sugar. This research highlights the utility of integrating ecological performance metrics with compositional data for a more comprehensive and functionally relevant evaluation of food quality.
Author Contributions
Conceptualization, W.L. and W.LL.; methodology, W.M., Y.K. and L.W.; software, W.L. and W.LL.; validation, W.LL., Y.K. and L.W.; formal analysis, W.LL.; investigation, W.L. and W.M.; resources, W.LL. and Y.K; data curation, W.L.; writing—original draft preparation, W.LL. and Y.K.; writing—review and editing, W.L. and L.W.; visualization, W.L. and L.M.; supervision, W.LL.; project administration, W.LL.; funding acquisition, W.LL.. All authors have read and agreed to the published version of the manuscript.
Funding
This study was supported by the Outstanding Young and Middle-aged Science and Technology Innovation Team Project in Colleges and Universities of Hubei Province (T2022030), Guiding Project of Scientific and Technical Research Plan of Hubei Provincial Department of Education (B2022177).
Institutional Review Board Statement
The organisms employed in this study were common arthropods, specifically spiders Pardosa pseudoannulata and fruit flies Drosophila melanogaster, which are not subject to regulatory oversight.
Data Availability Statement
The data presented in this study are available on request from the corresponding author.
Acknowledgments
During the preparation of this manuscript/study, the authors used GPT-4o mini for the purposes of language editing, grammar checking, and formatting assistance. The authors have reviewed and edited the output and take full responsibility for the content of this publication.
Conflicts of Interest
The authors declare no conflict of interest.
References
- Burlingame, B.; Nishida, C.; Uauy, R.; Weisell, R. Fats and Fatty Acids in Human Nutrition: Introduction. Ann Nutr Metab 2009, 55, 5–7. [CrossRef]
- Gibney, M.J.; Lanham-New, S.A.; Cassidy, A.; Vorster, H.H. Introduction to Human Nutrition; John Wiley & Sons, 2013; ISBN 1-118-68470-2.
- Mann, J.; Truswell, A.S. Essentials of Human Nutrition; Oxford University Press, 2017; ISBN 0-19-875298-9.
- Gad, A.S.; Kholif, A.M.; Sayed, A.F. Evaluation of the Nutritional Value of Functional Yogurt Resulting from Combination of Date Palm Syrup and Skim Milk. American J. of Food Technology 2010, 5, 250–259. [CrossRef]
- Pereira, E.; Encina-Zelada, C.; Barros, L.; Gonzales-Barron, U.; Cadavez, V.; Ferreira, I.C.F.R. Chemical and Nutritional Characterization of Chenopodium Quinoa Willd (Quinoa) Grains: A Good Alternative to Nutritious Food. Food Chemistry 2019, 280, 110–114. [CrossRef]
- Sorenson, A.W.; Wyse, B.W.; Wittwer, A.J.; Hansen, R.G. An Index of Nutritional Quality for a Balanced Diet. Journal of the American Dietetic Association 1976, 68, 236–242. [CrossRef]
- Millward, D.J. Amino Acid Scoring Patterns for Protein Quality Assessment. British Journal of Nutrition 2012, 108, S31–S43. [CrossRef]
- Gossner, C.M.-E.; Schlundt, J.; Ben Embarek, P.; Hird, S.; Lo-Fo-Wong, D.; Beltran, J.J.O.; Teoh, K.N.; Tritscher, A. The Melamine Incident: Implications for International Food and Feed Safety. Environmental health perspectives 2009, 117, 1803–1808. [CrossRef]
- Tapsell, L.C.; Neale, E.P.; Satija, A.; Hu, F.B. Foods, Nutrients, and Dietary Patterns: Interconnections and Implications for Dietary Guidelines. Advances in Nutrition 2016, 7, 445–454. [CrossRef]
- Geissler, C.; Powers, H.J. Human Nutrition; Oxford University Press, 2017; ISBN 0-19-876802-8.
- Raubenheimer, D.; Simpson, S. Eat like the Animals: What Nature Teaches Us about the Science of Healthy Eating; Houghton Mifflin, 2020.
- Raubenheimer, D.; Simpson, S.J. Integrative Models of Nutrient Balancing: Application to Insects and Vertebrates. Nutr. Res. Rev. 1997, 10, 151–179. [CrossRef]
- Raubenheimer, D.; Simpson, S.J.; Mayntz, D. Nutrition, Ecology and Nutritional Ecology: Toward an Integrated Framework. Functional Ecology 2009, 23, 4–16. [CrossRef]
- Wilder, S.M. Spider Nutrition. In Advances in Insect Physiology; Elsevier, 2011; Vol. 40, pp. 87–136 ISBN 978-0-12-387668-3.
- Scriber, J.M.; Slansky Jr, F. The Nutritional Ecology of Immature Insects. Annual review of entomology 1981, 26, 183–211. [CrossRef]
- Simpson, S.J.; Clissold, F.J.; Lihoreau, M.; Ponton, F.; Wilder, S.M.; Raubenheimer, D. Recent Advances in the Integrative Nutrition of Arthropods. Annu. Rev. Entomol. 2015, 60, 293–311. [CrossRef]
- Raubenheimer, D.; Rothman, J.M. Nutritional Ecology of Entomophagy in Humans and Other Primates. Annu. Rev. Entomol. 2013, 58, 141–160. [CrossRef]
- Xu, L.; Yuan, Y.; Hu, X. Present Situation and Comparative Analysis between Refined Sugar and Brown Sugar in China. Food Research and Development 2017, 38, 209–214.
- Wu, S.-C.; Cao, Z.-S.; Chang, K.-M.; Juang, J.-L. Intestinal Microbial Dysbiosis Aggravates the Progression of Alzheimer’s Disease in Drosophila. Nature communications 2017, 8, 24. [CrossRef]
- Lee, K.P.; Simpson, S.J.; Clissold, F.J.; Brooks, R.; Ballard, J.W.O.; Taylor, P.W.; Soran, N.; Raubenheimer, D. Lifespan and Reproduction in Drosophila : New Insights from Nutritional Geometry. Proc. Natl. Acad. Sci. U.S.A. 2008, 105, 2498–2503. [CrossRef]
- Grandison, R.C.; Piper, M.D.W.; Partridge, L. Amino-Acid Imbalance Explains Extension of Lifespan by Dietary Restriction in Drosophila. Nature 2009, 462, 1061–1064. [CrossRef]
- Blamires, S.J.; Hochuli, D.F.; Thompson, M.B. Prey Protein Influences Growth and Decoration Building in the Orb Web Spider Argiope Keyserlingi. Ecological Entomology 2009, 34, 545–550. [CrossRef]
- Barry, K.L.; Wilder, S.M. Macronutrient Intake Affects Reproduction of a Predatory Insect. Oikos 2013, 122, 1058–1064. [CrossRef]
- Reifer, M.L.; Harrison, S.J.; Bertram, S.M. How Dietary Protein and Carbohydrate Influence Field Cricket Development, Size and Mate Attraction Signalling. Animal Behaviour 2018, 139, 137–146. [CrossRef]
- Mirth, C.K.; Riddiford, L.M. Size Assessment and Growth Control: How Adult Size Is Determined in Insects. BIOESSAYS 2007, 29, 344–355. [CrossRef]
- Chapman, R.F. The Insects: Structure and Function; Cambridge University Press: New York, 2013.
Figure 1.
Total developmental time (days from parental introduction to first F1 adult emergence) of Drosophila melanogaster reared on control, high-protein brown sugar (HPBS), or low-protein brown sugar (LPBS) diets. Data are presented as mean + SD (n=10 replicates per group). No significant differences were detected among the dietary treatments (One-Way ANOVA, F2,27 = 0.876, P = 0.428).
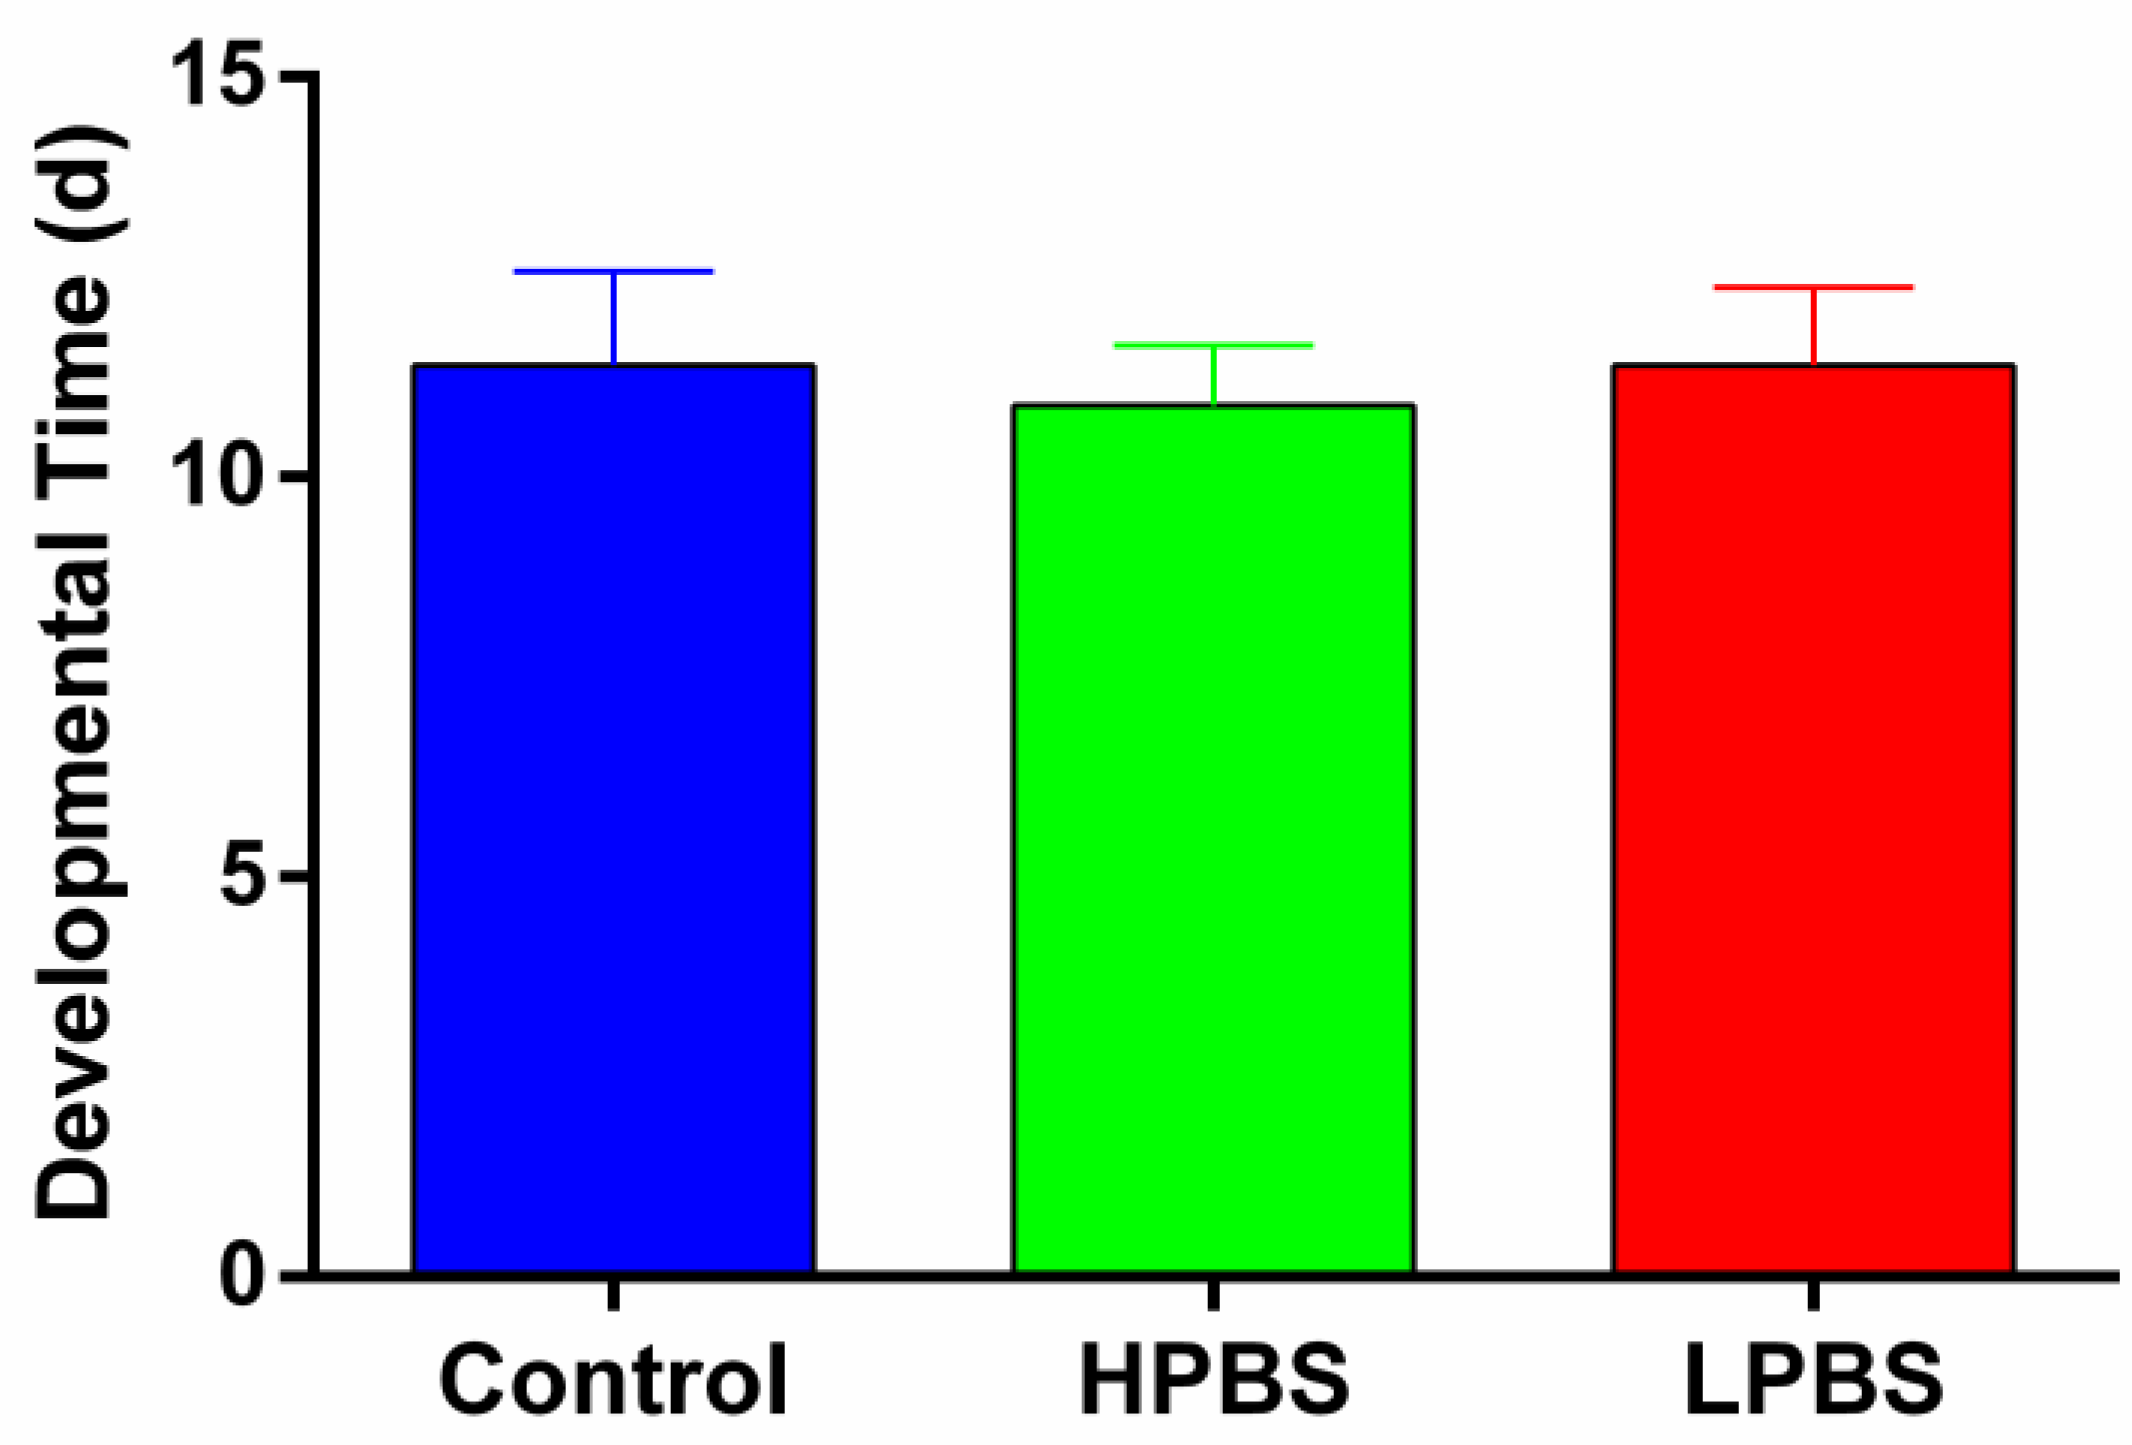
Figure 2.
Total fecundity (cumulative F1+F2+F3 progeny) of Drosophila melanogaster reared on control, high-protein brown sugar (HPBS), or low-protein brown sugar (LPBS) diets. Data are presented as mean ± SEM (n=10 replicates per group). Different letters above the bars indicate significant differences between groups determined by One-Way ANOVA followed by Tukey’s HSD post-hoc test (P < 0.05).
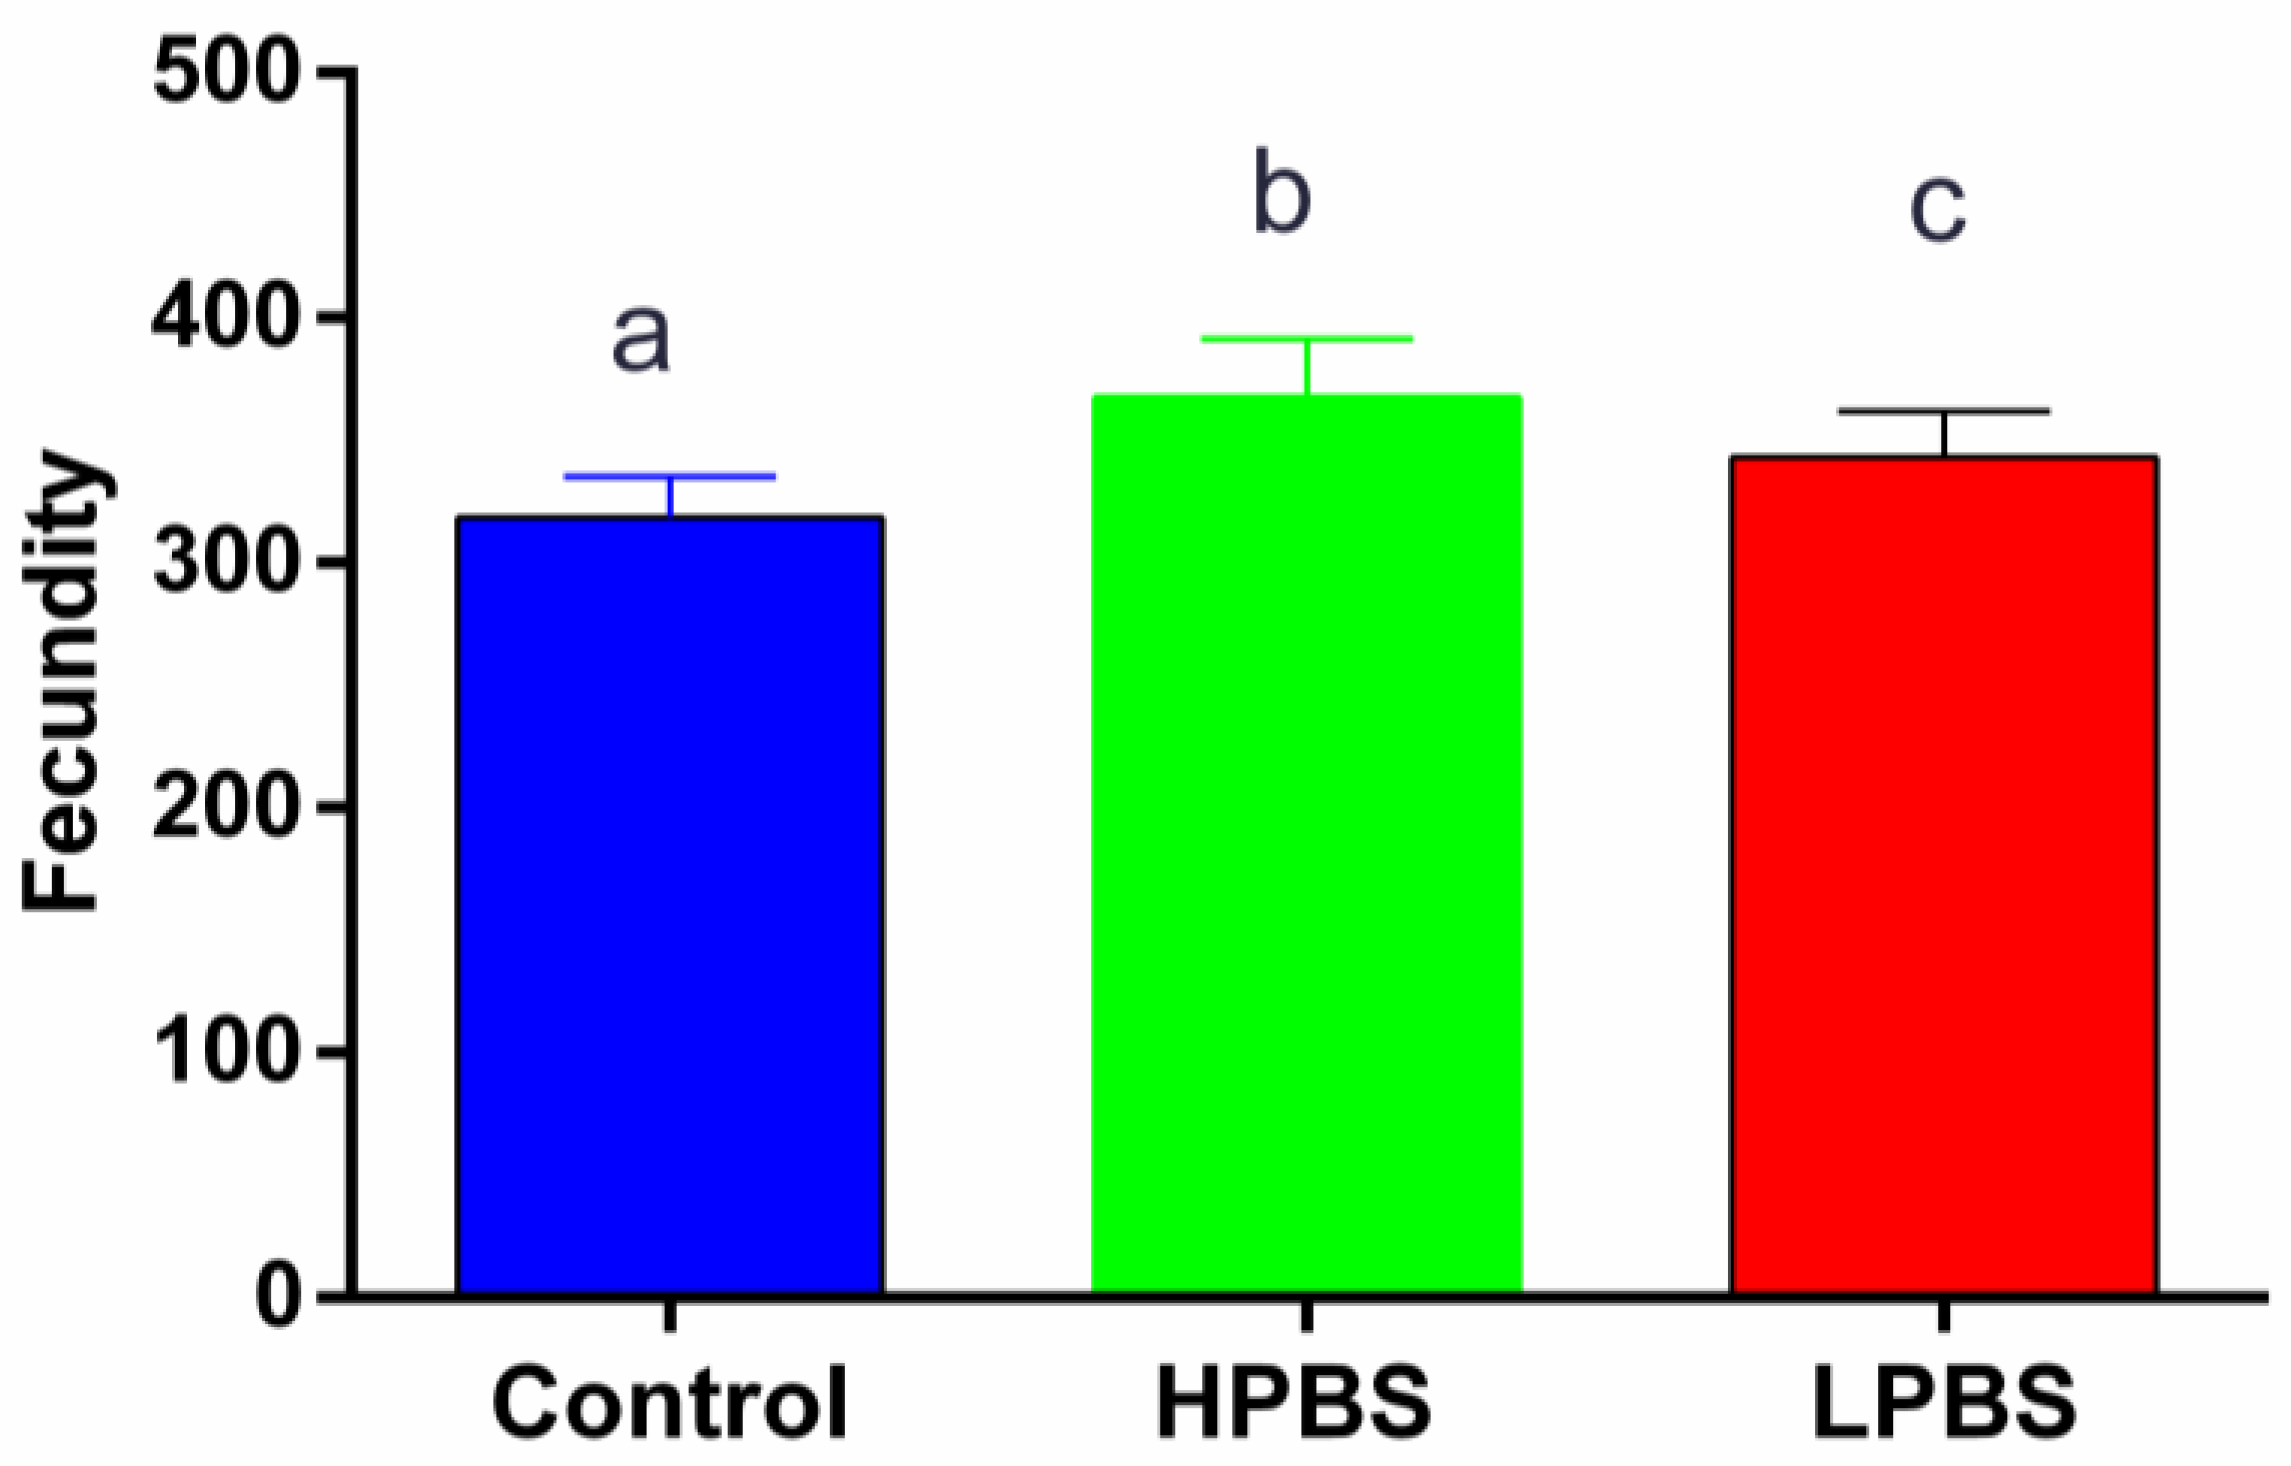
Figure 3.
Climbing performance (Climbing Index, %) of F1 generation Drosophila melanogaster adults reared on control, high-protein brown sugar (HPBS), or low-protein brown sugar (LPBS) diets. Data are presented as mean + SD (n=10 technical replicates per group). Different letters above the bars indicate significant differences between groups determined by One-Way ANOVA followed by Tukey’s HSD post-hoc test (P < 0.05).
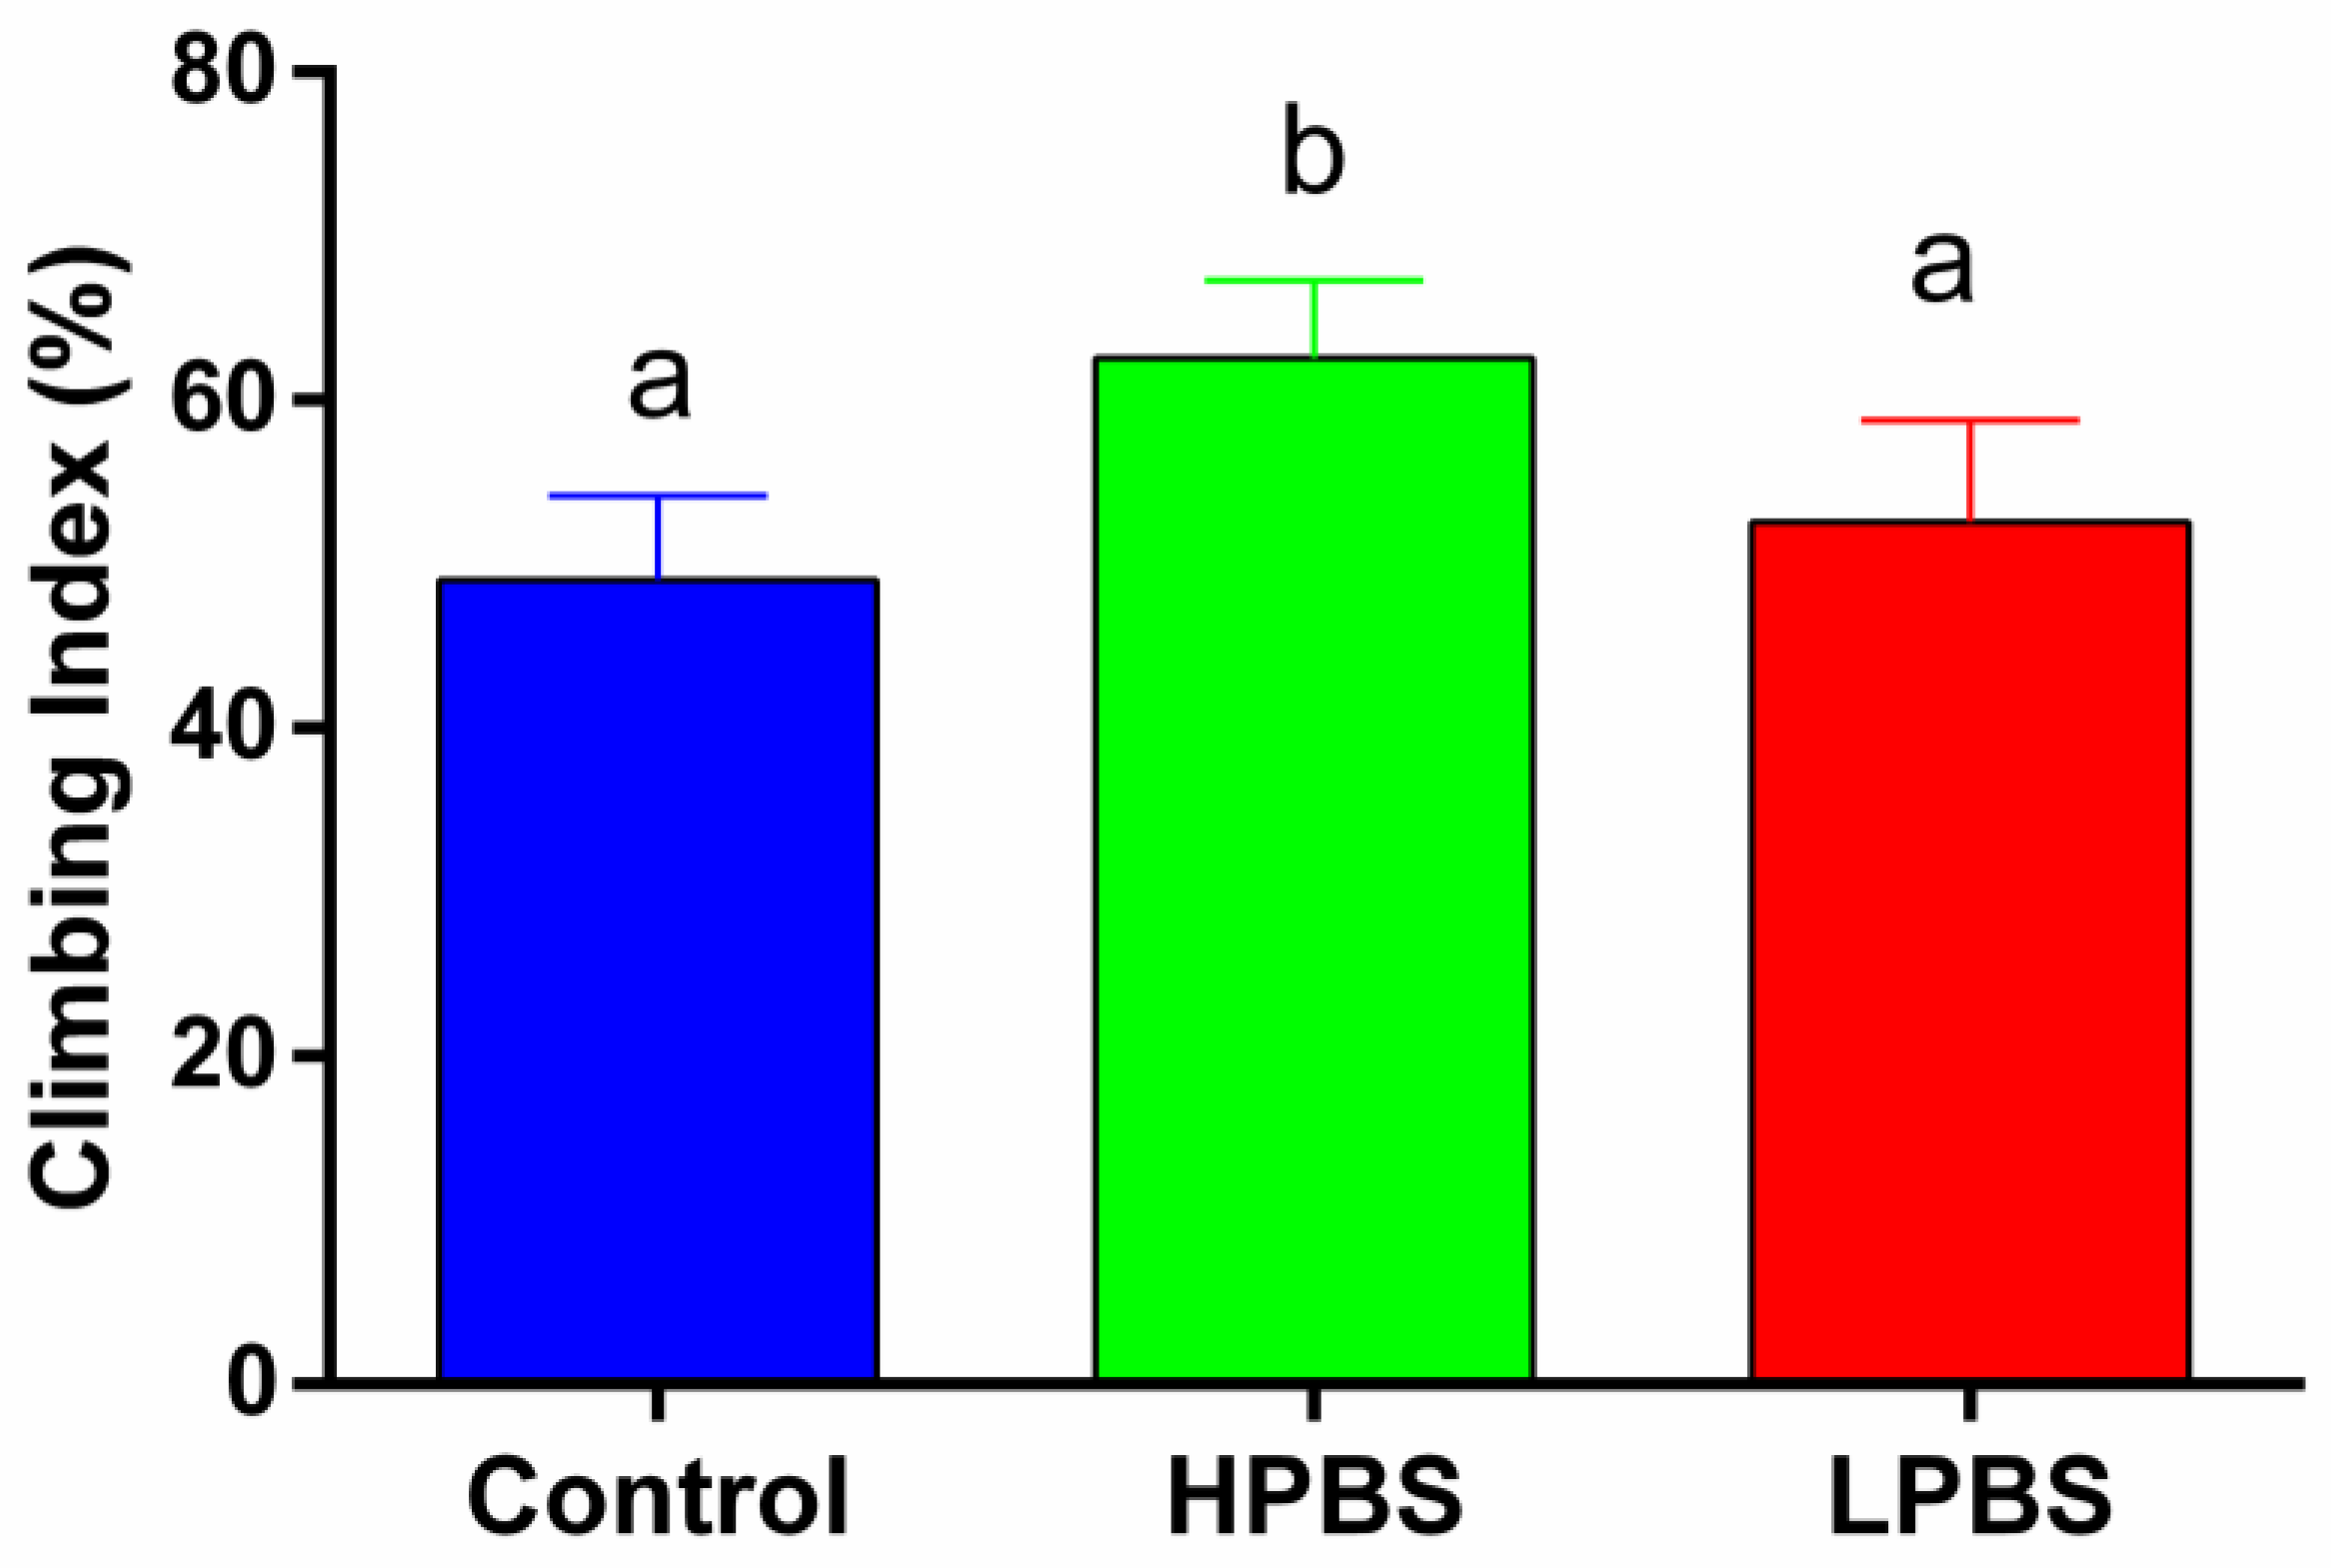
Figure 4.
Kaplan-Meier survival curves for juvenile Pardosa pseudoannulata spiders provided with water (Control, n=23), high-protein brown sugar (HPBS, n=22) solution, or low-protein brown sugar (LPBS, n=22) solution under starvation conditions. Survival distributions differed significantly among all three groups (Log-rank test, χ² = 91.51, P < 0.0001). Pairwise comparisons using the log-rank test indicated significant differences between all pairs (P < 0.05).
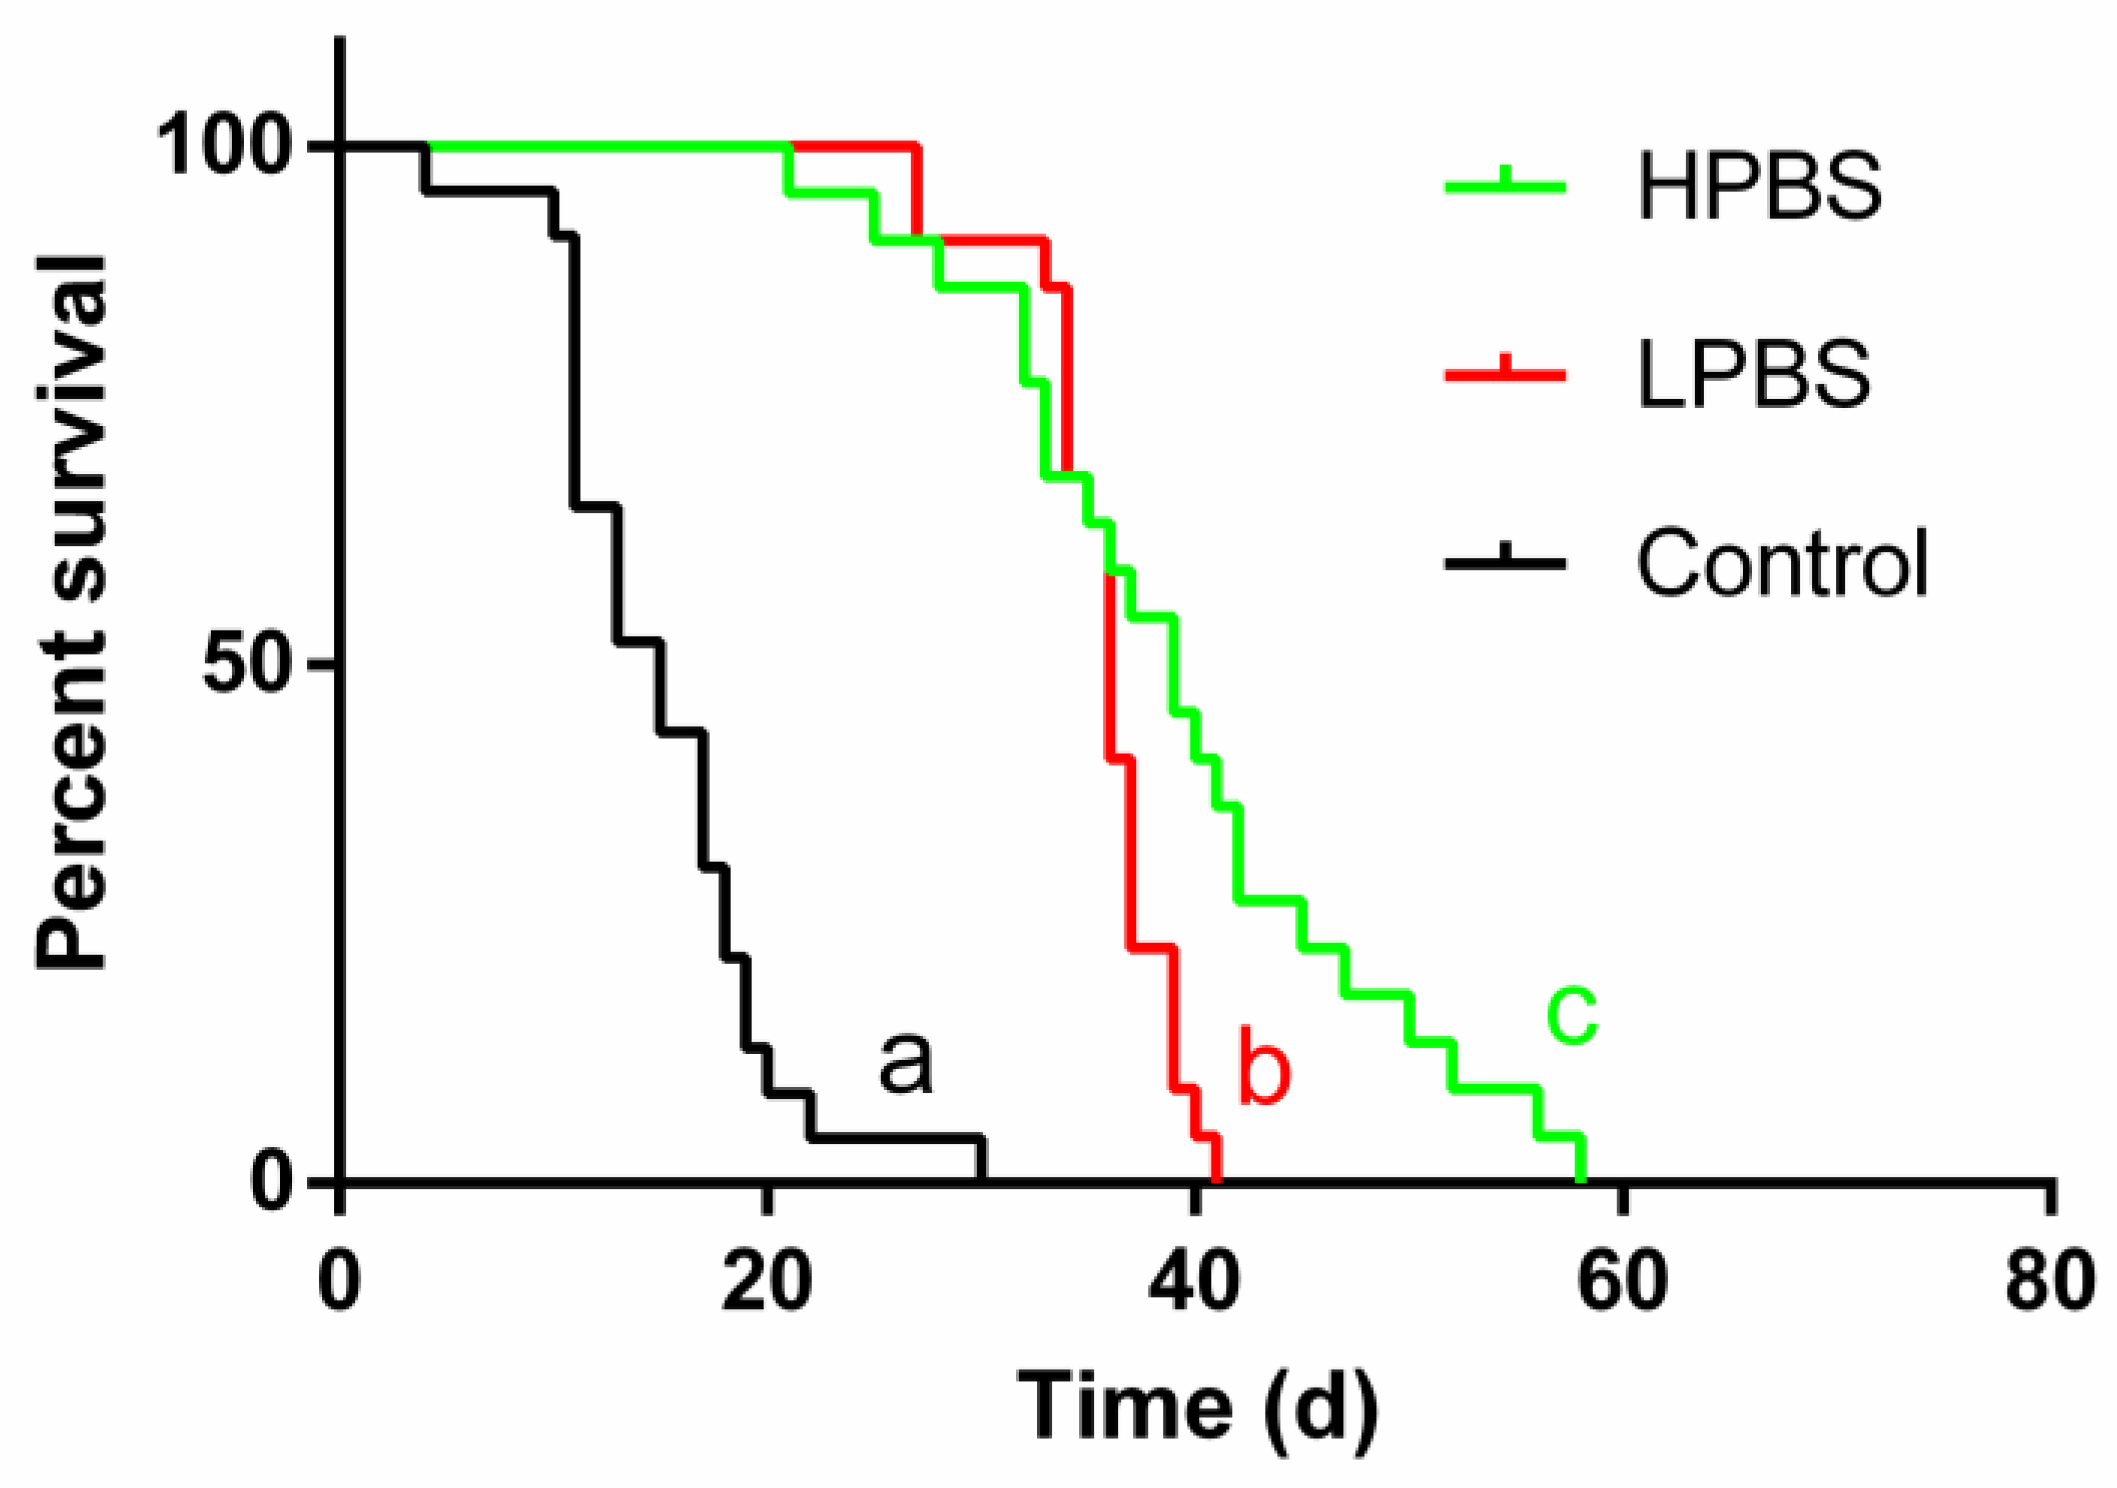

Table 1.
Nutritional information and classification of tested brown sugars.
| Type | Nutrition Facts (per 100 g) |
Nutritional classification | Producer |
|---|---|---|---|
| Original Brown Sugar | 2.8 g protein; 90.4 g carbohydrate |
High protein brown sugar | A Co., Ltd. |
| Pure Brown Sugar | 0.7 g protein; 96.6 g carbohydrate |
Low protein brown sugar | B Co., Ltd. |
Table 2.
Formulation of three groups of Drosophila culture medium (each culture tube).
| Culture medium group | Original brown sugar (g) |
Pure brown sugar (g) |
Yeasts (g) |
Medium powder (g) |
water (ml) |
|---|---|---|---|---|---|
| Control | 0 | 0 | 0.02 | 16 | 30 |
| High protein brown sugar | 3 | 0 | 0.02 | 16 | 30 |
| Low protein brown sugar | 0 | 3 | 0.02 | 16 | 30 |
Disclaimer/Publisher’s Note: The statements, opinions and data contained in all publications are solely those of the individual author(s) and contributor(s) and not of MDPI and/or the editor(s). MDPI and/or the editor(s) disclaim responsibility for any injury to people or property resulting from any ideas, methods, instructions or products referred to in the content. |
© 2025 by the authors. Licensee MDPI, Basel, Switzerland. This article is an open access article distributed under the terms and conditions of the Creative Commons Attribution (CC BY) license (http://creativecommons.org/licenses/by/4.0/).
Copyright: This open access article is published under a Creative Commons CC BY 4.0 license, which permit the free download, distribution, and reuse, provided that the author and preprint are cited in any reuse.


