
Submitted:
16 April 2025
Posted:
16 April 2025
You are already at the latest version
Preprints on COVID-19 and SARS-CoV-2
Abstract
Plastic pollution is a critical issue in rapidly developing cities. A nuanced understanding of consumer behavior related to single-use plastic (SUP) usage is therefore essential for effective interventions, in light of the global plastic treaty. This study conducts a survey of 1,492 participants across five Asian cities to analyze SUP consumption and disposal patterns amid the post-COVID “new normal”. Results reveal significant inter-city differences: Shanghai and Harbin demonstrate high overall SUP usage despite lower consumption of plastic shopping bags; Hanoi and Depok exhibit lower total consumption but distinct product preferences, such as elevated use of plastic shopping bags and party cups; and Phnom Penh recorded the highest consumption of plastic shopping bags, bottles, and straws. Plastic shopping bags were the most used item in all cities, ranging from 18 to 34 bags weekly, with no significant differences by urban versus rural areas, age, or gender. Conversely, urban areas showed higher usage of plastic take out containers, cutlery, coffee cups, and party cups. The COVID-19 pandemic has notably reshaped SUP consumption trends. Moreover, over half of SUPs were disposed of without proper separation. These findings underscore that reducing SUPs requires flexible, phased, and region-specific interventions to build a resilient circular economy.
Keywords:
single‑use
; plastic waste
; Asian city
; COVID‑19
; ILBI
; INC
1. Introduction
While plastics have revolutionized modern life, their widespread use has contributed to a global waste crisis of unprecedented scale, primarily due to the pervasive reliance on inexpensive, disposable materials [1]. Global plastic production has doubled—from 234 million tons (Mt) in 2000 to 460 Mt in 2019—while plastic waste more than doubled during the same period, rising from 156 Mt to 353 Mt [2]. Forecasts suggest that plastic production could reach 736 Mt by 2040—a 70% increase from 435 Mt in 2020 [3]. The United Nations Environment Programme (UNEP) has also highlighted a major shift from durable plastics to single-use plastics (SUPs), which now account for approximately 50% of global plastic production [4]. A growing body of scientific evidence indicates that this rapid expansion is causing substantial damage to both terrestrial and aquatic ecosystems, threatening marine biodiversity, contributing to climate change, and posing serious risks to human health [4].
In response to this escalating crisis, the mitigation of marine plastic pollution—including microplastics—has become a central focus in global environmental governance [5]. At the UN Environment Assembly held in Nairobi in March 2022, 175 UN Member States adopted the resolution “End Plastic Pollution: Towards an Internationally Legally Binding Instrument (ILBI),” thereby initiating negotiations through an Intergovernmental Negotiating Committee (INC), with the objective of establishing a legally binding international agreement by the end of 2024 [6].
Against this global backdrop, this study focuses on SUPs in the ASEAN+3 region, which comprises the ten ASEAN member states along with China, Japan, and South Korea. This region has been identified as a critical hotspot for plastic pollution. Notably, emerging economies within ASEAN+3—such as China, Indonesia, Malaysia, Myanmar, the Philippines, Thailand, and Vietnam—are responsible for approximately 65% of global annual marine plastic emissions [7]. Several interrelated factors contribute to the region’s severe plastic pollution problem, including extensive coastlines, rapid population growth, accelerating economic development and urbanization, inefficient waste management and recycling systems, and the environmental pressures associated with tourism [8,9,10,11,12,13].
SUPs, defined by UNEP as “items intended to be used only once before being discarded or recycled” [14], represent a significant environmental challenge and have become a central focus of recent waste prevention policies. This is attributable to their low cost, pervasive usage, limited recyclability, ease of environmental dispersion, frequent presence in litter, and propensity to fragment into harmful microplastics [15,16,17].
Policies and strategies to curb SUP pollution have been implemented at both regional and national levels. At the regional level, ASEAN member states have progressively addressed marine debris through a series of declarations and action plans. The first ASEAN declaration on combating marine debris was adopted in 2019, followed by a framework of action in the same year, and a regional action plan in 2021 [18]. Most recently, in October 2024, under Lao PDR’s ASEAN Chairmanship, the ASEAN Declaration on Plastic Circularity was adopted, building on previous efforts and emphasizing the transition toward a circular economy for plastics [19].
At the national level, China has taken several regulatory steps to address plastic pollution. Beginning with the Implementation Plan for Prohibiting the Entry of Foreign Garbage and Advancing the Reform of the Solid Waste Import Administration System in 2017, China banned 24 types of imported waste, including plastic waste. This was followed by the New Restrictions on Plastic issued in 2020, which banned the use of non-degradable plastic bags and plastic tableware, among other products [20]. In Indonesia, the government launched the National Action Plan on Marine Plastic Debris (2018–2025), which aims to reduce plastic waste by 70% compared to 2017 levels by the end of 2025 [21]. Key strategies include the regulation of SUPs and the promotion of alternative materials. In Vietnam, the National Action Plan for the Management of Marine Plastic Litter by 2030 was introduced in 2020. Under this plan, the production and import of non-biodegradable plastic bags smaller than 50 cm × 50 cm and thinner than 50 µm will be prohibited by 2026. By the end of 2030, the production and import of SUP products, non-biodegradable plastic packaging, and goods containing microplastics will be completely banned [22]. In Cambodia, the government enacted Sub-Decree 168 on the Management of Plastic Bags, which imposes a fee to discourage consumption. Additionally, permits are required for manufacturing and importing plastic bags, and these permits mandate a minimum thickness of 30 microns [23]. The Malaysian government has implemented the Roadmap Towards Zero Single-Use Plastics 2018–2030, which aims to eliminate 100% of SUPs by 2030 [24]. In Thailand, the government adopted the Thailand Roadmap on Plastic Waste Management (2018–2030) [25]. The roadmap focuses on phasing out specific plastic products—such as cap seals and plastic bags thinner than 36 microns—while promoting the use of biodegradable alternatives.
Although market-based policies and bans on SUPs can contribute to reducing waste generation and littering, they are insufficient on their own to fully resolve the plastic pollution crisis. As plastics are deeply embedded in everyday consumption habits, a more nuanced understanding of consumer behavior related to SUP usage is essential for crafting effective interventions—particularly in light of the emerging global plastic treaty. This study undertakes a comprehensive cross-city survey across five Asian cities to analyze SUP consumption patterns and disposal methods. It also examines the influence of regional and demographic factors on consumer behavior and evaluates the impact of the COVID-19 pandemic. Finally, it explores the implications of the findings for future research and the formulation of targeted policy measures to reduce SUP consumption.
2. Literature Review on Single-Use Plastics Reduction Research
2.1. Overall Perspective
Research on SUP reduction has expanded rapidly in recent years, with a growing number of peer-reviewed publications addressing four key domains: (1) policy measures and their evaluation, (2) technological approaches in alternative materials and recycling, (3) environmental impact assessments, and (4) consumer behavior and behavioral interventions. The following section briefly summarizes recent review articles in each of these thematic areas.
(1) Policy Measures and Evaluation
Policy-focused research has emerged as a major area of study within the field of plastic pollution. Xanthos and Walker [26] reviewed international strategies aimed at reducing plastic bag use, highlighting varying degrees of policy success. Nielsen et al. [27] analyzed over 180 scientific articles and identified a growing body of research on plastic pollution—particularly related to marine environments and microplastics—alongside a policy shift from targeting simple items (e.g., bags, bottles) to more complex plastic products (e.g., food packaging, textiles). Similarly, Knoblauch and Mederake [28] examined 45 studies on government regulations addressing plastic pollution and found that most national-level policies have predominantly targeted plastic bags and cosmetic microbeads. Schnurr et al. [29] documented legislative measures introduced since 2017, as well as emerging non-legislative actions at the individual and private sector levels, demonstrating that policies targeting SUP bags can reduce usage by 33–96%.
However, Schmidt and Laner [30] emphasized that legislative interventions often involve trade-offs. While the majority of reviews have focused on plastic bags, other product categories have also received attention: Wagner [31] explored policies regulating polystyrene food ware, and Heidbreder et al. [32] assessed broader regulatory approaches targeting items such as straws, cutlery, and tableware.
(2) Technological Approaches in Alternative Materials and Recycling
Technological advancements in alternative materials and recycling technologies have been increasingly recognized as critical strategies for reducing SUP consumption. Research on biodegradable plastics has gained momentum, with studies such as Zhao et al. [33] focusing on poly lactic acid (PLA) and Koller and Mukherjee [34] explored the potential of polyhydroxyalkanoate (PHA) bioplastics, while Korley et al. [1] emphasized the promise of chemical recycling and upcycling of polymer in addressing the challenges posed by the heterogeneity of plastic waste. Similarly, Lin et al. [35] reviewed key factors influencing plastic degradation, underscoring the importance of enzymatic processes in accelerating biodegradation.
Despite these innovations, scaling up such technologies remains a significant challenge. As noted by Tyagi et al. [36] in their study on sustainable food packaging, the transition from laboratory-scale research to widespread industrial application requires substantial investment, infrastructure, and regulatory support.
(3) Environmental Impact Assessments
Environmental impact assessments offer critical insights into the effects of SUP production and waste management across the life cycle of plastic products. Chen et al. [37] conducted a global review of SUP production and its environmental consequences, similarly, Jiao et al. [38] employed life cycle analysis (LCA) to evaluate plastic waste flows and proposed strategies to enhance the sustainability of waste management systems.
(4) Consumer Behavior and Behavioral Interventions
Consumer behavior research has become a central focus in recent efforts to reduce SUP consumption. Heidbreder et al. [32] reviewed 187 studies on plastic consumption and found that, despite widespread awareness of the environmental consequences, plastic use persists due to entrenched habits, social norms, and contextual factors. Borg et al. [15] examined interventions designed to reduce SUP consumption through behavioral mechanisms, emphasizing that individual behavioral change is strongly influenced by external factors, including corporate practices and government policies. Their study advocated for holistic, multi-stakeholder approaches and emphasized the need for systemic strategies that extend beyond individual responsibility.
2.2. ASEAN+3 Region
Research on plastic waste management in the ASEAN+3 region has grown significantly in recent years. Ng et al. [13] identified systemic challenges in Southeast Asia, exacerbated by global waste imports, and proposed policy solutions such as import restrictions and improvements in recycling infrastructure. Several country-specific studies have provided insights into SUP regulation and management. One of these studies by He [39] examined the impact of China’s 2008 plastic bag charge policy, which successfully reduced new plastic bag usage by 49%. Liu et al. [40] and Liu & Liu [20] analyzed China’s 2020 plastic pollution legislation. Wang & Li [41] found that perceived behavioral control strongly influences the adoption of reusable bags in China.
In Japan, Nakatani & Nishijima [42] evaluated the 2020 plastic bag charge, reporting a decrease in weekly plastic bag use from 5.8 to 1.7–1.9 per person. In Vietnam, Thanh et al. [43] quantified household plastic waste, showing that 45.72% originated from shopping bags. In Thailand, Oludoye & Supakata [44] found that moral considerations universally influenced consumer behavior, while rational decision-making had a stronger effect among rural residents. Similarly, Wongprapinkul & Vassanadumrongdee [45] analyzed Thailand’s SUP challenges in food delivery business, emphasizing the importance of aligning stakeholders to enhance policy effectiveness.
2.3 Research Gaps
Despite the growing body of research, significant knowledge gaps remain in understanding SUP consumption and disposal patterns across the ASEAN+3 region. Most existing studies have focused on policy evaluation and general trends in plastic waste, while empirical data on specific SUP usage and disposal behaviors remain limited. To date, the only comprehensive study on this topic is Liu et al. [46]. However, there is a critical need for more detailed insights into regional consumption habits, disposal practices, and the socioeconomic factors influencing plastic use.
This gap is especially salient in the context of the emerging global plastic treaty, where robust baseline data are essential for evidence-based policymaking and for tracking the effectiveness of SUP reduction measures over time. To address these gaps, this study conducts a cross-city survey to:
(1) Examine the consumption and disposal patterns of specific SUP products;
(2) Assess the influence of socioeconomic factors on SUP consumption behaviors;
(3) Investigate the impacts of the COVID-19 pandemic on SUP consumption; and
(4) Discuss the policy implications for reducing SUP usage.
By generating empirical evidence on consumer behavior, this study aims to inform and support evidence-based policymaking for mitigating plastic pollution in the ASEAN+3 region.
3. Methodology
The survey was conducted between September 2022 and February 2023 accross five cities in four countries (Figure 1): Hanoi (Vietnam) in September 2022, Phnom Penh (Cambodia) and Depok (Indonesia) in December 2022, Harbin (China) from October to December 2022, and Shanghai (China) from January to February 2023. The fieldwork took place during the early stages of the “new normal” period following the COVID-19 pandemic.
According to the World Bank classification [47], the global economy is categorized into four income groups: low-income, lower-middle-income, upper-middle-income, and high-income. Based on per capita GDP, the five selected cities span a range of these categories: Shanghai is classified as a high-income city; Phnom Penh, Harbin, and Hanoi fall into the upper-middle-income category; and Depok is categorized as a low-income area. This diverse income representation provides a valuable basis for examining differences in SUP consumption across varying socioeconomic contexts within the ASEAN+3 region.
Adults aged 18 and above were surveyed using a stratified random sampling method. The sample size for each city was determined using the formula proposed by Yamane [48]. At a 95% confidence level with a 5% margin of error, the minimum required sample size was calculated to be 385. For studies accepting wider error margins, a 6% margin of error required a minimum of 267 respondents, while a 7% margin required 196 respondents. The feasibility of data collection varied across cities depending on their size and logistical constraints, which affected the final number of responses collected in each location.
To examine differences between urban and rural areas, each city was initially divided into two primary zones: urban and rural. In the case of Shanghai, a mega-city, the classification was adjusted to distinguish between the central urban area and suburban districts. Using a stratified random sampling method, survey locations were selected to ensure coverage of approximately 30–50% of each zone. The number of respondents was then proportionally distributed across the selected locations.
Data collection was conducted by pre-trained investigators through a combination of face-to-face, telephone, and online interviews, depending on each country’s contextual factors such as internet accessibility and COVID-19-related restrictions. Respondents were interviewed directly, rather than being asked to complete the questionnaire independently. This approach resulted in highly accurate responses and a high response completion rate.
The survey in Hanoi was conducted in collaboration with the Department of Environment and Sustainable Development within the Institute of Strategy and Policy on Natural Resources and Environment (ISPONRE) in Vietnam. In partnership with the Economic Research Institute for ASEAN and East Asia (ERIA) and the Regional Knowledge Centre for Marine Plastic Debris (RKC-MPD), the survey was extended to additional cities: in Phnom Penh, the study was conducted in collaboration with the Royal University of Phnom Penh; in Depok, in partnership with the Center for Southeast Asian Students (CSEAS); in Harbin and Shanghai, through collaboration with Northeast Forest University and a local consulting firm.
The questionnaire collected data on a range of demographic characteristics, including gender, age, education level, and living area. In addition, respondents were asked to report the weekly quantity of SUP products consumed in each category and the disposal method used for each item. The survey addressed nine categories of SUPs: plastic shopping bags, plastic bottles for water and beverages, plastic food packaging, plastic take out containers, plastic cutlery, plastic wrap and film, plastic straws, coffee cups with plastic lids, and plastic party cups. Respondents were presented with four disposal method options: (1) reuse to line the kitchen bin (only for plastic shopping bags), (2) dispose without separation, (3) separate before disposal, and (4) separate and sell. To assess the impact of the COVID-19 pandemic on SUP consumption, the questionnaire included a five-point Likert scale (1 = "Definitely less", 2 = "Less", 3 = "No change", 4 = "More", 5 = "Definitely more") to evaluate perceived changes in consumption patterns. This section also included questions on hygiene-related SUPs, such as wet tissues and thermal food bags commonly used for online food delivery and take out during the pandemic period.
Data were analyzed using IBM SPSS Statistics (Statistical Package for the Social Sciences). To assess the statistical significance of differences in SUP consumption across cities and demographic groups, the distribution of the data was evaluated using the Shapiro–Wilk test, and non-parametric tests were employed to evaluate differences: the Mann–Whitney U test for two groups; and the Kruskal–Wallis test for three or more groups. The Chi-square test was used to assess differences in disposal methods for each SUP item across cities. The impact of the COVID-19 pandemic on SUP consumption was also analyzed using the Kruskal–Wallis test.
4. Results
4.1. Attributes of the respondents
Table 1 presents a detailed summary of the demographic characteristics of the survey respondents, including gender, age, education level, and living area. A total of 1,492 valid responses were collected across five cities: 248 respondents (16.6%) from Hanoi, 260 (17.4%) from Phnom Penh, 252 (16.9%) from Depok, 390 (26.1%) from Harbin, and 342 (22.9%) from Shanghai. The distribution of respondents across the cities was relatively balanced.
In terms of gender, 584 respondents (39.1%) were male, while 908 (60.9%) were female. The largest age group consisted of respondents aged 20–39 years, comprising 883 individuals (59.2%). The second largest group was the 40–59 years age group, accounting for 488 respondents (32.7%). Regarding living area, 48.5% of respondents resided in urban areas, while 51.5% lived in rural areas. Notably, Shanghai is categorized into central urban and suburban areas, whereas the other four cities are classified more simply into urban and rural zones.
With respect to education level, 26.9% (401 respondents) had a relatively low level of education, including no formal schooling, primary education, or lower secondary education. Meanwhile, 25.1% (375 respondents) had completed upper secondary education or vocational and technical training, and a significant portion—42.8% (638 respondents)—held a university degree or higher qualifications (i.e., a master’s degree or above).
4.2. City-specific Consumption Patterns of single-use plastics
Table 2 presents the average weekly consumption of nine types of SUP products across the five surveyed cities. A Kruskal–Wallis test was conducted to examine whether the differences in SUP consumption across cities were statistically significant. The test revealed significant differences across all product categories (p < 0.05), suggesting that variations in plastic consumption are shaped by city-specific factors. The key findings are summarized as follows:
In the two Chinese cities, overall SUP consumption was consistently high. Shanghai recorded the highest total consumption (131.96 items/week), followed by Harbin (108.60 items/week), with consumption relatively evenly distributed across all nine product categories. Notably, despite the high overall consumption, plastic shopping bag usage in both cities was the lowest among the five surveyed cities. This trend likely reflects the impact of national plastic regulations introduced in 2007 and reinforced in 2020 (Liu et al., 2023). Since 2008, retailers have been prohibited from providing free plastic shopping bags, and pricing for bags must be clearly marked and charged separately from product prices. Although plastic bag usage appears to have been successfully curbed through regulation, reliance on other SUPs remains substantial.
The propensity to use disposable takeout containers, cutlery and food packaging materials highlights a significant reliance on the food service industries, particularly food delivery services. Furthermore, the increased consumption of bottles for water and beverages, straws, coffee cups with lids, and party cups indicates that globalization and economic growth have driven the diversification and westernization of urban food culture, especially in Shanghai.
In Phnom Penh, overall SUP consumption was moderate (92.51 items/week), but the city reported the highest consumption of plastic shopping bags (33.65 items/week), bottles (16.50 items/week), and straws (16.75 items/week) among the surveyed cities. It also had the second-highest consumption of coffee cups, after Shanghai. Conversely, consumption of plastic cutlery, plastic wrap and film, and party cups was relatively low. Notably, the consumption of plastic shopping bags aligns with previous research; a 2015 study reported that urban Cambodians use over 2,000 plastic bags per year on average, which is approximately ten times higher than the consumption rate observed in the European Union [49].
Hanoi and Depok exhibited more moderate consumption patterns, with total SUP usage in both cities around 55 items per week. In Hanoi, usage of bottles, straws, take out containers, and cutlery was particularly low, while plastic shopping bags and plastic wrap and film were used more frequently. This pattern may reflect a cultural preference for home-cooked meals over dining out or food delivery. Although Depok had the lowest total SUP consumption, its party cup usage was the second highest, possibly reflecting a cultural emphasis on communal events and social gatherings.
These distinct consumption patterns underscore the importance of city-specific strategies for SUP reduction, tailored to local consumption behavior, lifestyle habits, and cultural practices.
4.3. Influence of demographic factors on single-use plastics consumption behavior
Demographic factors are widely recognized as key determinants of consumer behavior [32]. To evaluate their influence on SUP consumption across the five surveyed cities, non-parametric statistical tests were employed due to the non-normal distribution of the data, as confirmed by the Shapiro–Wilk test. Specifically, the Mann–Whitney U test was used for variables with two independent groups (i.e., gender and living area), while the Kruskal–Wallis test was applied to variables with more than two groups (i.e., age and education level).
This study examined the effects of five demographic variables—gender, age, education level, and living area—on SUP consumption behavior. Figure 2 displays the total consumption of each SUP product across the five cities, along with statistical significance indicators (* denotes p < 0.05). Detailed, city-specific results are presented in the supplementary materials (Tables S1–S5). The following sections summarize the key consumption trends associated with each demographic attribute.
- Gender
The analysis indicates that female respondents generally reported slightly higher usage of plastic shopping bags, whereas male respondents exhibited greater consumption of plastic food packaging, take out containers, plastic cutlery, plastic wrap and film, coffee cups, and plastic party cups. One possible explanation is that females are more frequently involved in daily shopping activities—such as purchasing fresh produce at local markets—while males may be more inclined to shop at supermarkets and utilize ready-made or convenience food services.
- Age
Although the number of respondents under the age of 20 was relatively small, plastic shopping bags were used widely across all age groups. However, the consumption of other SUP items tended to decline with increasing age. Older adults (aged 60 and above) reported lower overall levels of SUP usage, while younger individuals demonstrated higher consumption of plastic straws, take out containers, and coffee cups. This pattern likely reflects the lifestyle habits of younger populations, who are more frequent consumers of prepared food, coffee, and soft drinks.
- Education Level
Regarding plastic shopping bags, respondents with higher education levels reported the lowest levels of usage. However, for other SUP items—such as bottles, packaging materials, and take out containers—University/Higher group exhibited higher levels of consumption. This contrast suggests that although individuals with higher education may demonstrate greater environmental awareness and actively reduce plastic bag use, their busier lifestyles and preference for convenience-oriented food and beverage consumption may contribute to increased reliance on other disposable plastic products.
- Living Area (Urban/Rural)
For commonly used SUP items such as plastic shopping bags, food packaging, and straws, no statistically significant differences were observed between respondents in urban and rural areas, suggesting high consumption levels across both settings. However, for take out-related items—including plastic take out containers, cutlery, and coffee cups with lids—as well as convenience products like plastic wrap and film and party cups, urban residents exhibited significantly higher consumption. This finding indicates a greater reliance on convenience and take out services in urban environments.
The supplementary materials provide additional details on the influence of demographic factors on SUP consumption in each city. Notably, regional variations were observed. For example, plastic shopping bag consumption was higher in rural areas of Hanoi compared to its urban counterparts, whereas in Phnom Penh and Harbin, consumption levels were higher in urban areas. These geographic differences in consumption patterns are likely attributable to a combination of socio-economic conditions, cultural practices, and local infrastructure.
4.4. Disposal method of each single-use plastics
A total of 137,747 SUP items were reported by 1,492 respondents across five cities, averaging 92 items per person per week, or approximately 13 items per day. Among the cities, Shanghai had the highest per capita daily usage (18.8 items), followed by Harbin (15.5 items), Phnom Penh (13.0 items), Depok (7.7 items), and Hanoi (7.6 items).
Figure 3 categorizes SUP disposal into four pathways: (1) reuse (applied only to plastic shopping bags reused as bin liners); (2) disposal without separation; (3) separation followed by disposal; and (4) separation for sale. The results reveal significant differences in waste management practices across the cities, as summarized below:
- Reuse: Plastic shopping bags were most frequently reused in Depok (93.8%), followed by Hanoi (76.7%), Shanghai (68.7%), Harbin (48.7%), and least in Phnom Penh (37.5%). Reuse is primarily for lining household waste bins—a practice that has developed out of convenience and may be difficult to change in the short term. While reuse reduces immediate disposal, these bags are ultimately discarded, contributing to overall plastic waste. Therefore, any policy aimed at banning or charging for plastic shopping bags must also consider alternatives for garbage bag use and assess the behavioral impacts of such measures.
- Disposal Without Separation: This was the most prevalent disposal method, accounting for 55.9% of all SUPs. The highest rates were observed in Harbin (67.2%) and Phnom Penh (66.2%), while Hanoi recorded the lowest (34.3%).
- Separation Followed by Disposal: This practice was relatively common in Shanghai (34.3%) and Harbin (21.9%), likely due to the enforcement of national waste separation policies. China’s Implementation Plan for Household Waste Classification, introduced in 2017, mandated municipal waste separation in major cities such as Shanghai and Harbin by 2020, including penalties for non-compliance. These policies appear to have had a measurable impact on improving source separation practices.
- Separation for Sale: Selling recyclable plastics (e.g., bottles) to the informal sector was the least common method, ranging from 2.7% in Harbin to 8.6% in Hanoi. Although this practice has traditionally been widespread in many Asian developing countries, recent declines in the market value of recyclables may have reduced its prevalence. In Phnom Penh, only plastic bottles are separated for sale, while in Shanghai, most plastic bottles enter the municipal waste stream.
These findings highlight significant disparities in SUP disposal behaviors across the five cities. Hanoi and Shanghai demonstrate more sustainable practices through active source separation and recycling initiatives. In contrast, Phnom Penh and Depok face greater challenges, with higher rates of improper disposal and limited infrastructure for waste management. Notably, plastic bottles, which retain relatively high market value, are properly separated in Phnom Penh, while in Harbin and Depok, a substantial share is disposed of without separation. These patterns underscore the importance of improving waste management infrastructure, strengthening policy enforcement, and conducting public awareness campaigns to promote sustainable plastic disposal practices tailored to local conditions.
4.5. Impact of COVID-19 pandemic on SUPs consumption
Figure 4 illustrates the changes in SUP consumption before and after the COVID-19 pandemic across the five surveyed cities. A Kruskal–Wallis test confirmed that the variation in SUP consumption changes across cities was statistically significant (p < 0.05). In the figure, bar length represents the number of respondents, while numerical values on the right side of each bar indicate the mean scores based on a five-point Likert scale (1 = "Definitely less," 2 = "Less," 3 = "No Change," 4 = "More," 5 = "Definitely more"). The midpoint of the horizontal axis (value = 3) indicates "No Change in Consumption"; values above 3 represent an overall increasing trend, while values below 3 indicate a decreasing trend.
As shown in Figure 4, the COVID-19 pandemic had a significant impact on SUP consumption patterns across cities, with notable product-specific and regional variations. At the product category level, hygiene-related plastic items (e.g., face masks, wet tissues, and sanitizer packaging) and food packaging materials (e.g., plastic food packaging, plastic wrap, and film) displayed a general upward trend, likely due to heightened health concerns and increased reliance on packaged goods. According to our investigation of single-use face mask usage in the region, these masks were used at an average rate of 1.46 pieces per week before COVID-19 and 6.81 pieces per week during the pandemic—an approximate 4.66-fold increase—with notable variations among the surveyed cities [50]. In contrast, items such as coffee cups, plastic cutlery, plastic straws, and plastic bottles showed a general decline, likely attributable to reduced outdoor activities and social interactions. Trends for takeout containers and insulated food bags—which are closely associated with online food delivery and takeout services—varied across cities, reflecting differences in local lifestyle adaptations and food consumption practices during the pandemic.
At the regional level, Phnom Penh demonstrated a predominant “Less” and “Definitely less”, whereas Shanghai and Harbin exhibited more “More” and “Definitely more” compared to the other cities. City-level differences in SUP consumption were likely influenced by factors such as the severity of local outbreaks, the strictness of lockdown policies, and the capacity for emergency logistics management. For example, Phnom Penh implemented one of the most stringent lockdowns beginning on April 15, 2021, dividing the city into "Red," "Yellow," and "Orange" zones. In the Red Zones, non-essential businesses were closed, a food rationing system was introduced, and strict restrictions on movement and gatherings were enforced. Reports indicated that residents faced substantial difficulties in accessing food and essential goods [51]. These restrictions likely contributed to the notable decline in SUP consumption observed in Phnom Penh. In contrast, while Shanghai and Harbin also experienced strict citywide lockdowns, their adoption of digital health code systems and rapid shifts towards e-commerce and online food delivery services likely contributed to an overall increase in SUP consumption compared to pre-pandemic levels.
5. Discussion and Policy Implication
This study reveals that SUPs continue to be widely consumed in the surveyed cities (Table 2), despite the implementation of various reduction policies. For instance, while the average annual consumption of plastic bags is approximately 200 per EU citizen [52], the consumption levels in the surveyed cities are exceptionally high. Our analysis of SUP consumption and disposal across five Asian cities reveals pronounced regional and demographic variations, which necessitate an integrated, context-sensitive policy framework. In light of these findings, we propose targeted recommendations that address city-specific challenges, demographic differences, and the broader need for a circular economy.
5.1. Tailored Strategies for Reducing Single-Use Plastics in Daily Life
The varying consumption patterns observed across the five cities highlight the importance of implementing city-specific reduction strategies. The following high-priority recommendations are tailored to each city's unique consumption profile and contextual factors:
Shanghai and Harbin
Shanghai and Harbin exhibited the highest total SUP consumption—131.96 and 108.60 items/week, respectively—with usage distributed across all product categories. Although plastic shopping bag use was the lowest among the five cities—likely due to China's 2007/2020 plastic shopping bag regulations, both cities demonstrated high usage of food- and drink-related SUPs, suggesting a reliance on the food service industry and a westernization of food culture. As SUPs are symptomatic of a time-constrained modern lifestyle that promote reliance on convenience food [53], policymakers should consider broadening the scope of plastic reduction policies. Particular emphasis should be placed on promoting the minimal packaging as well as the circular use of containers and packaging in the food and beverage supply chain through mechanisms such as deposit-return systems and container-sharing schemes, as well as facilitating the adoption of alternative materials. Notably, many plastic shopping bags are repurposed as trash bin liners (Figure 3), indicating that policies to reduce plastic bag use could be integrated with complementary waste management strategies—for example, by introducing designated trash bags—to further enhance policy effectiveness [42].
Phnom Penh
Phnom Penh showed a moderate overall consumption level (92.51 items/week) but recorded the highest usage of shopping bags, bottles, and straws. Given that shopping bags and straws are priority items and considering weak law enforcement in Cambodia, the implementation of charging schemes may prove effective. Cambodia's 2017 Plastic Bag Management Act introduced fees for plastic bags in large shopping malls and supermarkets. Extending this policy to small markets and grocery stores—where most consumption occurs, could further enhance its effectiveness. Moreover, since nearly half of PET bottles are sorted and sold to the informal sector (Figure 3), policies should build on this practice by strengthening the recycling industry. A robust waste management system is also urgently needed to address the wider issue of plastic mismanagement.
Hanoi and Depok
Hanoi and Depok exhibited lower consumption levels, averaging approximately 55 items per week. In Hanoi, it likely reflects a preference for home cooking, while in Depok—despite its lower overall consumption—party cup usage ranked second highest. This may stem from the cultural importance of communal events, such as Friday prayer gatherings, Eid al-Fitr feasts, and other festivities, which reinforce social bonds through shared meals. These diverse consumption patterns underscore the need for context-specific SUP reduction strategies that account for local behaviors and cultural practices.
• Hanoi: Policy measures should leverage the prevalent home-cooking culture to build a circular model. Strategies could include promoting reusable bags, and eco-friendly food wrap alternatives through targeted incentives and public awareness campaigns—such as discount programs for individuals who bring their own bags or containers—along with household waste oil collection and biodegradable wrap exchange programs.
• Depok: Culturally adaptive reduction should capitalize on the strong social capital associated with community gatherings. Initiatives might include distributing or lending of "eco-party kits" at mosques and community centers, and organizing awareness-raising activities during social events.
5.2. Demographic-Specific SUP Reduction Strategies
Based on our findings, implementing targeted strategies to reduce SUP consumption among different demographic groups represents an efficient approach to behavioral intervention. Our analysis revealed distinct consumption patterns across demographic variables that warrant tailored policy responses.
Plastic shopping bags are primarily used by women, the elderly, and individuals with lower education levels. To encourage behavioral change in these groups, making reusable bags more affordable and visually appealing may increase adoption. Additionally, retailers could introduce incentive programs, such as point-based rewards or small discounts, to motivate consumers to bring their own bags.
Food-related plastics—including packaging, takeout containers, cutlery, and plastic wrap—are predominantly consumed by young males, urban residents, and individuals with higher education levels. Since convenience is a major factor in their consumption behavior, interventions should focus on making sustainable alternatives equally convenient. For instance, food vendors and delivery service providers can offer discounts to customers who bring their own reusable containers. Furthermore, replacing the default provision of disposable plastic utensils with an opt-in system can substantially reduce unnecessary plastic waste.
Beverage-related plastics—such as plastic bottles, straws, coffee cups, and party cups—are mainly consumed by younger urban populations. The introduction of rental systems for reusable coffee cups in cafes and convenience stores can help reduce disposable cup waste. Encouraging event organizers and retailers to adopt compostable or reusable cup options can further contribute to reducing plastic consumption. Moreover, given that younger generations are highly active on digital media, leveraging social media influencers and campaigns can reinforce sustainable beverage consumption habits.
By implementing demographically targeted interventions, these measures can enhance the effectiveness of SUP reduction strategies and support long-term behavioral shifts toward more sustainable consumption patterns.
5.3. SUPs Management and the Circular Economy Framework
The analysis of disposal practices (Section 4.4) reveals significant inter-city differences (p < 0.01) in the management of SUPs. In Shanghai, relatively effective waste separation practices have enabled more sustainable disposal. In contrast, in Phnom Penh and Depok, a large proportion of SUPs are discarded without separation, indicating the lack of sophisticated plastic waste management systems that cause mismanagement of plastics and contribute to marine plastic pollution.
Notably, many plastic shopping bags are frequently repurposed as trash bin liners in Depok (93.8%) and Hanoi (76.7%), a habit that has developed over time due to convenience and that may be difficult to change over the short term. However, such reuse is only a temporary mitigation measure, as these items ultimately enter the waste stream and do not provide a long-term solution. When deciding to charge for or ban plastic shopping bags, it is necessary to also consider alternatives to replace their function as garbage bags and the potential effects this action may have. The issue of plastic waste is closely related to waste management, and integrating shopping bag reduction policies with complementary waste management strategies—such as introducing Pay-As-You-Throw (PAYT) schemes and designated trash bags—could further enhance policy effectiveness.
As outlined in the Circular Economy Framework for the ASEAN Economic Community, the ASEAN region is proactively promoting a circular economy, with national roadmaps to facilitate the transition. In this context, reducing SUP and mandating Extended Producer Responsibility (EPR) have emerged as key policy priorities. Establishing robust source separation is essential to building a functioning circular economy. By separating waste at source, valuable materials can be recovered more efficiently, contributing to resource conservation and economic sustainability [54]. The following policy actions are therefore recommended:
1. Strengthening Source Separation and Recycling Infrastructure: Prioritize investments in developing a comprehensive, citywide sorting system tailored to different SUP products that aligns with recycling infrastructure. For example, if the goal is material-to-material recycling of plastic bottles, it is imperative to implement individual collection systems for these items; conversely, if the focus is on utilizing refuse-derived fuel (RDF), then separating waste into combustible and non-combustible fractions may suffice. To ensure that each SUP category is efficiently directed to its optimal recycling pathway, standardized recycling containers and designated collection points should be established. Furthermore, the implementation of advanced systems—such as smart waste sorting and recycling systems based on IT technologies, and door-to-door collection support—could further enhance the efficiency and accuracy of waste separation [55]. Additionally, introducing deposit-return schemes for products like take out containers, wherein consumers receive monetary incentives upon returning the items, can significantly promote proper recycling practices. Complementary to these measures, public awareness campaigns and behavioral nudges aimed at encouraging proper separation and reducing plastic consumption should be concurrently executed.
2. Integration of Extended Producer Responsibility (EPR) Schemes: Build on robust source separation by mandating that producers take responsibility for the post-consumer management of their products. By integrating EPR mechanisms, governments can improve overall recycling efficiency and resource recovery. This approach not only reinforces effective source separation practices but also encourages producers to innovate sustainable SUP designs that are easier to recycle and manage at the end of their lifecycle. Furthermore, the implementation of modulated EPR fees—where producers of difficult-to-recycle plastics are charged higher contributions—can serve as a financial incentive to promote the adoption of eco-friendly alternatives.
3. Promotion of Reusable Alternatives and Prevention of Rebound Effects: As Zink and Geyer [56] argue, the circular economy (CE) does not always lead to absolute reductions in virgin plastic use due to rebound effects. This occurs when efficiency gains in recycling and material recovery lower costs and drive increased consumption of plastics, counteracting the intended environmental benefits. To counteract these rebound effects, it is essential to eliminate disposable habits and promote the reuse of reusable products to the greatest extent possible. Consumer preferences for convenience should be addressed by designing reusable products with comparable convenience and usability to their single-use plastic counterparts. Furthermore, introducing incentives that encourage reuse—such as discounts for utilizing reusable containers, or rental services for reusable packaging materials—can effectively stimulate consumer participation. Additionally, raising awareness about the environmental impacts of rebound effects through education and marketing campaigns can foster more responsible consumption behavior, ensuring that the transition to a circular economy contributes to an overall reduction in plastic waste.
Collectively, these measures focus on establishing a robust source separation framework as the foundation for a resilient circular economy in the region while leveraging producer responsibility and promoting reusable alternatives to drive long-term reductions in SUP waste. By integrating recycling infrastructure with sustainable consumption habits, stakeholders can create a more holistic and effective strategy to mitigate plastic pollution and enhance resource efficiency.
5.4. COVID-19 Impact and Adapting to the New Normal
The COVID-19 pandemic had a complex and varied impact on single-use plastic (SUP) consumption patterns, with significant variation across regions and product categories (Section 4.5). In cities such as Phnom Penh, strict lockdowns and mobility restrictions led to 'postponed' anthropogenic activities, resulting in a decrease in overall SUP use. In contrast, cities such as Shanghai and Harbin showed a mixed pattern—some SUP categories declined while others increased—resulting in an overall upward trend in consumption.
From a product perspective, general SUPs (e.g., coffee cups and plastic bottles) declined due to restrictions on outdoor activities and social interactions. Conversely, hygiene-related SUPs (e.g., face masks and wet wipes) and plastic packaging used in food delivery (e.g., takeaway containers and insulated food bags) increased, driven by heightened public health concerns and the expansion of online food delivery services.
In the post-COVID 'new normal', the use of hygiene-related SUPs—particularly face masks—is expected to persist at a certain levels even after the immediate health crisis subsides [50,57]. These trends highlight the need to integrate hygiene-related consumption concerns into SUP policies, particularly in the context of global efforts to end plastic pollution. For example, as governments seek to stimulate the economy by helping businesses survive the pandemic, there is an opportunity to rebuild new industries that can innovate new reusable or non-plastic personal protective equipment (PPE).
Furthermore, as economic and social activities resume, there is a possibility of a rebound in the consumption of general SUPs [57,58,59]. This anticipated recovery underscores the necessity for proactive policy measures. The utilization of emerging digital economy platforms, such as e-commerce and online food delivery, presents a valuable opportunity to implement deposit schemes and incentive mechanisms. These initiatives have the potential to promote the adoption of reusable packaging solutions and encourage environmentally responsible consumer behavior.
In conclusion, it is evident that the consumption dynamics of SUP have become increasingly complex due to the impact of the COVID-19 pandemic. Addressing these challenges necessitates an integrated strategy that balances sustainability goals, public health priorities, and regional specifics. It is imperative for policymakers to formulate comprehensive contingency plans that can address urgent hygiene requirements during any future health crises while concurrently pursuing long-term SUP reduction targets.
5.5. International Policy Context and Systematic Approaches
In recent years, growing concerns about plastic pollution have accelerated international negotiations toward a legally binding instrument on plastics. According to Article 3 of the INC Chair's Text [60], countries may be required to identify SUP items that pose significant environmental challenges. Literature reviews have demonstrated that governmental bans, taxes, levies, or charges—when properly implemented and enforced—can effectively reduce excessive SUP consumption, at least in the short term [28]. However, systematic policy implementation that carefully considers trade-offs while accounting for each country's specific circumstances is crucial.
For example, banning thin plastic bags may prompt companies to switch to thicker bags that generate more greenhouse gas emissions during production, thereby necessitating multiple uses to offset their environmental impact [29]. Moreover, while bans and fees tend to increase the use of reusable and paper bags and significantly reduce single-use plastic bag consumption, their success depends on complementary measures such as offering affordable reusable bags and higher charges for disposable paper bags [61]. Furthermore, the introduction of new alternatives may increase environmental impacts [62], requiring systematic deployment under full life cycle analysis to avoid unintended consequences.
There remains a substantial gap between international initiatives and local implementation efforts, highlighting the need for international academic support for evidence-based policy making in this domain. This research serves to provide foundational information on the current state of SUP consumption and disposal across diverse urban contexts in ASEAN+3 region.
6. Conclusion
This study investigated the consumption and disposal practices of single-use plastics (SUPs) in five cities within the ASEAN+3 region, surveying 1,492 respondents. The findings indicate substantial inter-city differences in SUP usage and disposal, influenced by demographic factors and the impact of the COVID-19 pandemic. Despite the implementation of various SUP reduction policies, overall consumption remains exceptionally high, with significant variability driven by the distinct socioeconomic and cultural contexts of each city.
These results underscore the complexity of reducing SUPs and emphasize the need for flexible, phased policy interventions tailored to regional characteristics. Strengthening waste management through robust source separation and integrating Extended Producer Responsibility (EPR) schemes are identified as critical steps toward building a resilient circular economy. Moreover, targeted awareness campaigns and incentive programs should be designed to address the specific needs of high-consumption demographic groups, complementing waste management policies for more effective outcomes.
In the context of the emerging global plastic treaty, this research provides valuable insights into SUP consumption and disposal in the ASEAN+3 region—a setting where large-scale surveys are rare. However, limitations such as sample size constraints within certain demographic segments and the inherent variability of self-reported data suggest that further longitudinal studies are necessary. Long-term monitoring and policy evaluation are also essential to develop and refine sustainable SUP reduction strategies.
In conclusion, the persistently high and even rising levels of SUP usage across diverse urban environments call for integrated actions at regional, national, and international levels. Combining top-down legislative interventions, such as bans and levies, with bottom-up non-legislative measures—ranging from individual and community initiatives to efforts by NGOs and the private sector—can yield synergistic effects. Although single interventions may produce modest outcomes, their cumulative impact, when systematically integrated with partnerships, stakeholder collaboration, infrastructure development, and research and development, can trigger behavioral changes that serve as "windows of opportunity" [32,63]. Such changes have the potential to shift social norms and initiate a spiral of collective action, ultimately reaching a critical mass capable of significantly mitigating the environmental impacts of SUPs and advancing the transition toward a sustainable, circular society.
Supplementary Materials
The following supporting information can be downloaded at www.mdpi.com/xxx/s1, Table S1: Average usage of single-use plastics in 5 cities by gender, Table S2: Average usage of single-use plastics in 5 cities by living area, Table S3: Average usage of single-use plastics in 5 cities by age, Table S4: Average usage of single-use plastics in 5 cities by education, Table S5: Average usage of single-use plastics in 5 cities by household size.
Author Contributions
Conceptualization, methodology and investigation, C.L.; questionnaire design, C.L. and Y.I.; data curation, Y.I., Q.Z. and C.L.; writing— C.L. and Q.Z.; supervision, C.L.; project administration, Y.H., C.A. and A.W. All authors have read and agreed to the published version of the manuscript.
Funding
This research was funded by the ERIA-IGES Fund 2022–2025, Institute for Global Environmental Strategies (IGES), under the Strategic Research Fund 2021–2024 and supported by the Environment Research and Technology Development Fund (JPMEERF23S12107, Ministry of the Environment, Japan).
Institutional Review Board Statement
This study was exempt from ethical review as the surveys were anonymous and did not collect personally identifiable information. The surveys focused on general behaviors related to single-use plastic usage/disposal, and did not include sensitive or high-risk questions. We followed ethical guidelines to ensure participants' privacy and confidentiality.
Informed Consent Statement
Not applicable.
Data Availability Statement
The original contributions presented in the study are included in the article/supplementary material, further inquiries can be directed to the corresponding author.
Acknowledgments
The authors would like to express their gratitude to the local partners—Institute of Strategy and Policy on Natural Resources and Environment (ISPONRE), Vietnam; Center for Southeast Asian Studies (CSEAS), Indonesia; Royal University of Phnom Penh, Cambodia; and Cedian Guanli Consultant, Inc., China—as well as the respondents and reviewers for their invaluable contributions to this study. Special thanks are extended to Vivek Anand ASOKAN for his valuable contributions to discussions and project management support, and to Emma Fushimi for proofreading this paper. Additionally, the authors would like to thank the referees for their insightful comments and suggestions.
Conflicts of Interest
The authors declare no conflicts of interest.
References
- Korley, L.T.J.; Epps, T.H.; Helms, B.A.; Ryan, A.J. Toward Polymer Upcycling—Adding Value and Tackling Circularity. Science 2021, 373, 66–69. [Google Scholar] [CrossRef] [PubMed]
- OECD Full Report. Available online: https://www.oecd.org/en/publications/global-plastics-outlook_de747aef-en/full-report.html (accessed on 11 February 2025).
- Policy Scenarios for Eliminating Plastic Pollution by 2040. Available online: https://www.oecd.org/en/publications/policy-scenarios-for-eliminating-plastic-pollution-by-2040_76400890-en.html (accessed on 8 March 2025).
- Chen, J.; Cheng, Y.-R.; Wen, W.; Wang, C.; Ni, J.; Jiang, J.; Fu, X.; Zhou, M.; Ye, L.; Ge, Z.-J.; et al. The Dilemma of Masks During the COVID-19 Outbreak. RMHP 2021, Volume 14, 2369–2375. [Google Scholar] [CrossRef]
- Wang, J.; Zheng, L.; Li, J. A Critical Review on the Sources and Instruments of Marine Microplastics and Prospects on the Relevant Management in China. Waste Manag Res 2018, 36, 898–911. [Google Scholar] [CrossRef] [PubMed]
- UNEP Environment Assembly 5/14. End Plastic Pollution: Towards an International Legally Binding Instrument :: Resolution /: Adopted by the United Nations Environment Assembly. 2022.
- Meijer, L.J.J.; van Emmerik, T.; van der Ent, R.; Schmidt, C.; Lebreton, L. More than 1000 Rivers Account for 80% of Global Riverine Plastic Emissions into the Ocean. Science Advances 2021, 7, eaaz5803. [Google Scholar] [CrossRef]
- Geyer, R.; Jambeck, J.R.; Law, K.L. Production, Use, and Fate of All Plastics Ever Made. Sci. Adv. 2017, 3, e1700782. [Google Scholar] [CrossRef]
- Lebreton, L.C.M.; Van Der Zwet, J.; Damsteeg, J.-W.; Slat, B.; Andrady, A.; Reisser, J. River Plastic Emissions to the World’s Oceans. Nat Commun 2017, 8, 15611. [Google Scholar] [CrossRef]
- Jambeck, J.R.; Geyer, R.; Wilcox, C.; Siegler, T.R.; Perryman, M.; Andrady, A.; Narayan, R.; Law, K.L. Plastic Waste Inputs from Land into the Ocean. Science 2015, 347, 768–771. [Google Scholar] [CrossRef]
- Lebreton, L.; Andrady, A. Future Scenarios of Global Plastic Waste Generation and Disposal. Palgrave Communications 2019, 5. [Google Scholar] [CrossRef]
- Omeyer, L.C.M.; Duncan, E.M.; Aiemsomboon, K.; Beaumont, N.; Bureekul, S.; Cao, B.; Carrasco, L.R.; Chavanich, S.; Clark, J.R.; Cordova, M.R.; et al. Priorities to Inform Research on Marine Plastic Pollution in Southeast Asia. Science of The Total Environment 2022, 841, 156704. [Google Scholar] [CrossRef]
- Ng, C.H.; Mistoh, M.A.; Teo, S.H.; Galassi, A.; Ibrahim, A.; Sipaut, C.S.; Foo, J.; Seay, J.; Taufiq-Yap, Y.H.; Janaun, J. Plastic Waste and Microplastic Issues in Southeast Asia. Front. Environ. Sci. 2023, 11. [Google Scholar] [CrossRef]
- Environment, U.N. Single-Use Plastics: A Roadmap for Sustainability | UNEP - UN Environment Programme Available online:. Available online: https://www.unep.org/resources/report/single-use-plastics-roadmap-sustainability (accessed on 4 April 2025).
- Borg, K.; Lennox, A.; Kaufman, S.; Tull, F.; Prime, R.; Rogers, L.; Dunstan, E. Curbing Plastic Consumption: A Review of Single-Use Plastic Behaviour Change Interventions. Journal of Cleaner Production 2022, 344, 131077. [Google Scholar] [CrossRef]
- Barone, A.S.; Maragoni-Santos, C.; Farias, P.M. de; Cortat, C.M.G.; Maniglia, B.C.; Ongaratto, R.S.; Ferreira, S.; Fai, A.E.C. Rethinking Single-Use Plastics: Innovations, Polices, Consumer Awareness and Market Shaping Biodegradable Solutions in the Packaging Industry. Trends in Food Science & Technology 2025, 158, 104906. [Google Scholar] [CrossRef]
- Preventing Single-Use Plastic Waste. Available online: https://www.oecd.org/en/publications/preventing-single-use-plastic-waste_c62069e7-en.html (accessed on 7 April 2025).
- ASEAN Secretariat ASEAN Regional Action Plan for Combating Marine Debris in the ASEAN Member States Available online:. Available online: https://asean.org/wp-content/uploads/2021/05/FINAL_210524-ASEAN-Regional-Action-Plan_Ready-to-Publish_v2.pdf (accessed on 29 March 2025).
- ASEAN Declaration on Plastic Circularity - ASEAN Circular Economy Stakeholder Platform (ACESP) 2024.
- Liu, C.; Liu, C. Exploring Plastic-Management Policy in China: Status, Challenges and Policy Insights. Sustainability 2023, 15, 9087. [Google Scholar] [CrossRef]
- National Action Plan on Marine Plastic Debris (2018–2025) Available online:. Available online: https://www.bing.com/search?q=National+Action+Plan+on+Marine+Plastic+Debris+ (accessed on day month year).
- Châu, www moitruongachau com | M.T.Á. Circular No. 02/2022/TT-BTNMT - Detailing a Number of Articles of Law on Environmental Protection. Available online: https://moitruongachau.com/en/circular-no.02-2022-TT-BTNMT-detailing-a-number-of-articles-of-law-on-environmental-protection.html (accessed on 7 April 2025).
- Ministry of Environment; CAMBODOIA Update on National Regulations and The Implementation of the Basel Convention. Available online: https://www.env.go.jp/en/recycle/asian_net/ (accessed on 7 April 2025).
- Malaysia’s Roadmap Towards Zero Single-Use Plastics 2018-2030. | FAOLEX. Available online: https://www.fao.org/faolex/results/details/en/c/LEX-FAOC220622/ (accessed on 7 April 2025).
- Public Relations Department [PRD] Roadmap on Plastic Waste Management. Available online: https://www.pcd.go.th/wp-content/uploads/2021/10/pcdnew-2021-10-19_08-59-54_995414.pdf (accessed on 7 April 2025).
- Xanthos, D.; Walker, T.R. International Policies to Reduce Plastic Marine Pollution from Single-Use Plastics (Plastic Bags and Microbeads): A Review. Marine Pollution Bulletin 2017, 118, 17–26. [Google Scholar] [CrossRef]
- Nielsen, T.D.; Hasselbalch, J.; Holmberg, K.; Stripple, J. Politics and the Plastic Crisis: A Review throughout the Plastic Life Cycle. WIREs Energy and Environment 2020, 9, e360. [Google Scholar] [CrossRef]
- Knoblauch, D.; Mederake, L. Government Policies Combatting Plastic Pollution. Current Opinion in Toxicology 2021, 28, 87–96. [Google Scholar] [CrossRef]
- Schnurr, R.E.J.; Alboiu, V.; Chaudhary, M.; Corbett, R.A.; Quanz, M.E.; Sankar, K.; Srain, H.S.; Thavarajah, V.; Xanthos, D.; Walker, T.R. Reducing Marine Pollution from Single-Use Plastics (SUPs): A Review. Marine Pollution Bulletin 2018, 137, 157–171. [Google Scholar] [CrossRef]
- Schmidt, S.; Laner, D. The Multidimensional Effects of Single-Use and Packaging Plastic Strategies on German Household Waste Management. Waste Management 2021, 131, 187–200. [Google Scholar] [CrossRef]
- Wagner, T.P. POLICY INSTRUMENTS TO REDUCE CONSUMPTION OF EXPANDED POLYSTYRENE FOOD SERVICE WARE IN THE USA. Detritus 2020, 11. [Google Scholar] [CrossRef]
- Heidbreder, L.M.; Bablok, I.; Drews, S.; Menzel, C. Tackling the Plastic Problem: A Review on Perceptions, Behaviors, and Interventions. Science of The Total Environment 2019, 668, 1077–1093. [Google Scholar] [CrossRef]
- Zhao, X.; Liu, J.; Li, J.; Liang, X.; Zhou, W.; Peng, S. Strategies and Techniques for Improving Heat Resistance and Mechanical Performances of Poly(Lactic Acid) (PLA) Biodegradable Materials. International Journal of Biological Macromolecules 2022, 218, 115–134. [Google Scholar] [CrossRef] [PubMed]
- Koller, M.; Mukherjee, A. A New Wave of Industrialization of PHA Biopolyesters. Bioengineering 2022, 9, 74. [Google Scholar] [CrossRef] [PubMed]
- Lin, Z.; Jin, T.; Zou, T.; Xu, L.; Xi, B.; Xu, D.; He, J.; Xiong, L.; Tang, C.; Peng, J.; et al. Current Progress on Plastic/Microplastic Degradation: Fact Influences and Mechanism. Environmental Pollution 2022, 304, 119159. [Google Scholar] [CrossRef] [PubMed]
- Tyagi, P.; Salem, K.S.; Hubbe, M.A.; Pal, L. Advances in Barrier Coatings and Film Technologies for Achieving Sustainable Packaging of Food Products – A Review. Trends in Food Science & Technology 2021, 115, 461–485. [Google Scholar] [CrossRef]
- Chen, Y.; Awasthi, A.K.; Wei, F.; Tan, Q.; Li, J. Single-Use Plastics: Production, Usage, Disposal, and Adverse Impacts. Science of The Total Environment 2021, 752, 141772. [Google Scholar] [CrossRef]
- Jiao, H.; Ali, S.S.; Alsharbaty, M.H.M.; Elsamahy, T.; Abdelkarim, E.; Schagerl, M.; Al-Tohamy, R.; Sun, J. A Critical Review on Plastic Waste Life Cycle Assessment and Management: Challenges, Research Gaps, and Future Perspectives. Ecotoxicology and Environmental Safety 2024, 271, 115942. [Google Scholar] [CrossRef]
- He, H. Effects of Environmental Policy on Consumption: Lessons from the Chinese Plastic Bag Regulation. Envir. Dev. Econ. 2012, 17, 407–431. [Google Scholar] [CrossRef]
- Liu, J.; Yang, Y.; An, L.; Liu, Q.; Ding, J. The Value of China’s Legislation on Plastic Pollution Prevention in 2020. Bull Environ Contam Toxicol 2022, 108, 601–608. [Google Scholar] [CrossRef]
- Wang, B.; Li, Y. Consumers’ Intention to Bring a Reusable Bag for Shopping in China: Extending the Theory of Planned Behavior. IJERPH 2022, 19, 3638. [Google Scholar] [CrossRef]
- Nishijima, A.; Nakatani, J. Survey and Analysis on the Use and Disposal of Plastic Shopping Bags before and after the Introduction of Charges. J Mater Cycles Waste Manag 2024, 26, 741–754. [Google Scholar] [CrossRef]
- Thanh, N.P.; Matsui, Y.; Fujiwara, T. Assessment of Plastic Waste Generation and Its Potential Recycling of Household Solid Waste in Can Tho City, Vietnam. Environ Monit Assess 2011, 175, 23–35. [Google Scholar] [CrossRef] [PubMed]
- Oludoye, O.O.; Supakata, N. Breaking the Plastic Habit: Drivers of Single-Use Plastic Reduction among Thai University Students. PLoS ONE 2024, 19, e0299877. [Google Scholar] [CrossRef] [PubMed]
- Wongprapinkul, B.; Vassanadumrongdee, S. A Systems Thinking Approach towards Single-Use Plastics Reduction in Food Delivery Business in Thailand. Sustainability 2022, 14, 9173. [Google Scholar] [CrossRef]
- Liu, C.; Thang Nguyen, T.; Ishimura, Y. Current Situation and Key Challenges on the Use of Single-Use Plastic in Hanoi. Waste Management 2021, 121, 422–431. [Google Scholar] [CrossRef]
- New World Bank Country Classifications by Income Level: 2022-2023. Available online: https://blogs.worldbank.org/en/opendata/new-world-bank-country-classifications-income-level-2022-2023 (accessed on 7 April 2025).
- Yamane: Statistics: An Introductory Analysis - Google Scholar. Available online: https://scholar.google.com/scholar_lookup?title=Statistics%2C%20An%20Introductory%20Analysis&author=T.%20Yamane&publication_year=1967 (accessed on 4 April 2025).
- Koeng, S.; Sharp, A.; Hul, S.; Kuok, F. Plastic Bag Management Options in Phnom Penh, Cambodia. 2020.
- Liu, C.; Liu, C.; Hotta, Y.; Appleby, D. Comparative Analysis of Face Mask Usage and Environmental Impact in Asian Cities during and after the COVID-19 Pandemic. Sustainability 2024, 16, 6683. [Google Scholar] [CrossRef]
- Bopha, P. Mounting Desperation in Cambodia amid COVID Lockdown. Available online: https://www.aljazeera.com/news/2021/5/2/mounting-desperation-in-cambodia-amid-covid-lockdown (accessed on 7 April 2025).
- EP Spotlight on Parliaments in Europe. Available online: https://www.bing.com/search?q=Spotlight+on+Parliaments+in+Europe&cvid=3bafc784cad1425492e523b3262c0eb9&gs_lcrp=EgRlZGdlKgYIABBFGDkyBggAEEUYOdIBCDQ1NjFqMGo0qAIIsAIB&FORM=ANAB01&PC=LCTS (accessed on 7 April 2025).
- Chakori, S.; Aziz, A.A.; Smith, C.; Dargusch, P. Untangling the Underlying Drivers of the Use of Single-Use Food Packaging. Ecological Economics 2021, 185, 107063. [Google Scholar] [CrossRef]
- Dickella Gamaralalage, P.J.; Ghosh, S.K.; Onogawa, K. Source Separation in Municipal Solid Waste Management: Practical Means to Its Success in Asian Cities. Waste Manag Res 2022, 40, 360–370. [Google Scholar] [CrossRef]
- Zhuo, Q.; Liu, C.; Wang, B.; Yan, W. Bridging Local Governments and Residents for Household Waste Source Separation Using a Business-Driven, Multi-Stakeholder Cooperative Partnership Model—A Case Study of HUGE Recycling in Yuhang, Hangzhou, China. Sustainability 2023, 15, 11727. [Google Scholar] [CrossRef]
- Zink, T.; Geyer, R. Circular Economy Rebound. Journal of Industrial Ecology 2017, 21. [Google Scholar] [CrossRef]
- Vanapalli, K.R.; Sharma, H.B.; Ranjan, V.P.; Samal, B.; Bhattacharya, J.; Dubey, B.K.; Goel, S. Challenges and Strategies for Effective Plastic Waste Management during and Post COVID-19 Pandemic. Science of The Total Environment 2021, 750, 141514. [Google Scholar] [CrossRef]
- Khoo, K.S.; Ho, L.Y.; Lim, H.R.; Leong, H.Y.; Chew, K.W. Plastic Waste Associated with the COVID-19 Pandemic: Crisis or Opportunity? Journal of Hazardous Materials 2021, 417, 126108. [Google Scholar] [CrossRef]
- Patrício Silva, A.L.; Prata, J.C.; Walker, T.R.; Duarte, A.C.; Ouyang, W.; Barcelò, D.; Rocha-Santos, T. Increased Plastic Pollution Due to COVID-19 Pandemic: Challenges and Recommendations. Chemical Engineering Journal 2021, 405, 126683. [Google Scholar] [CrossRef] [PubMed]
- Intergovernmental Negotiating Committee on Plastic Pollution | UNEP - UN Environment Programme. Available online: https://www.unep.org/inc-plastic-pollution (accessed on 7 April 2025).
- Taylor, R.L.; Villas-Boas, S.B. Bans vs. Fees: Disposable Carryout Bag Policies and Bag Usage. Applied Eco Perspectives Pol 2016, 38, 351–372. [Google Scholar] [CrossRef]
- Tan, Y.; Wen, Z.; Hu, Y.; Zeng, X.; Kosajan, V.; Yin, G.; Zhang, T. Single-Use Plastic Bag Alternatives Result in Higher Environmental Impacts: Multi-Regional Analysis in Country with Uneven Waste Management. Waste Management 2023, 171, 281–291. [Google Scholar] [CrossRef] [PubMed]
- Schäfer, M.; Jaeger-Erben, M.; Bamberg, S. Life Events as Windows of Opportunity for Changing Towards Sustainable Consumption Patterns? J Consum Policy 2012, 35, 65–84. [Google Scholar] [CrossRef]
Figure 1.
Survey sites and samplings
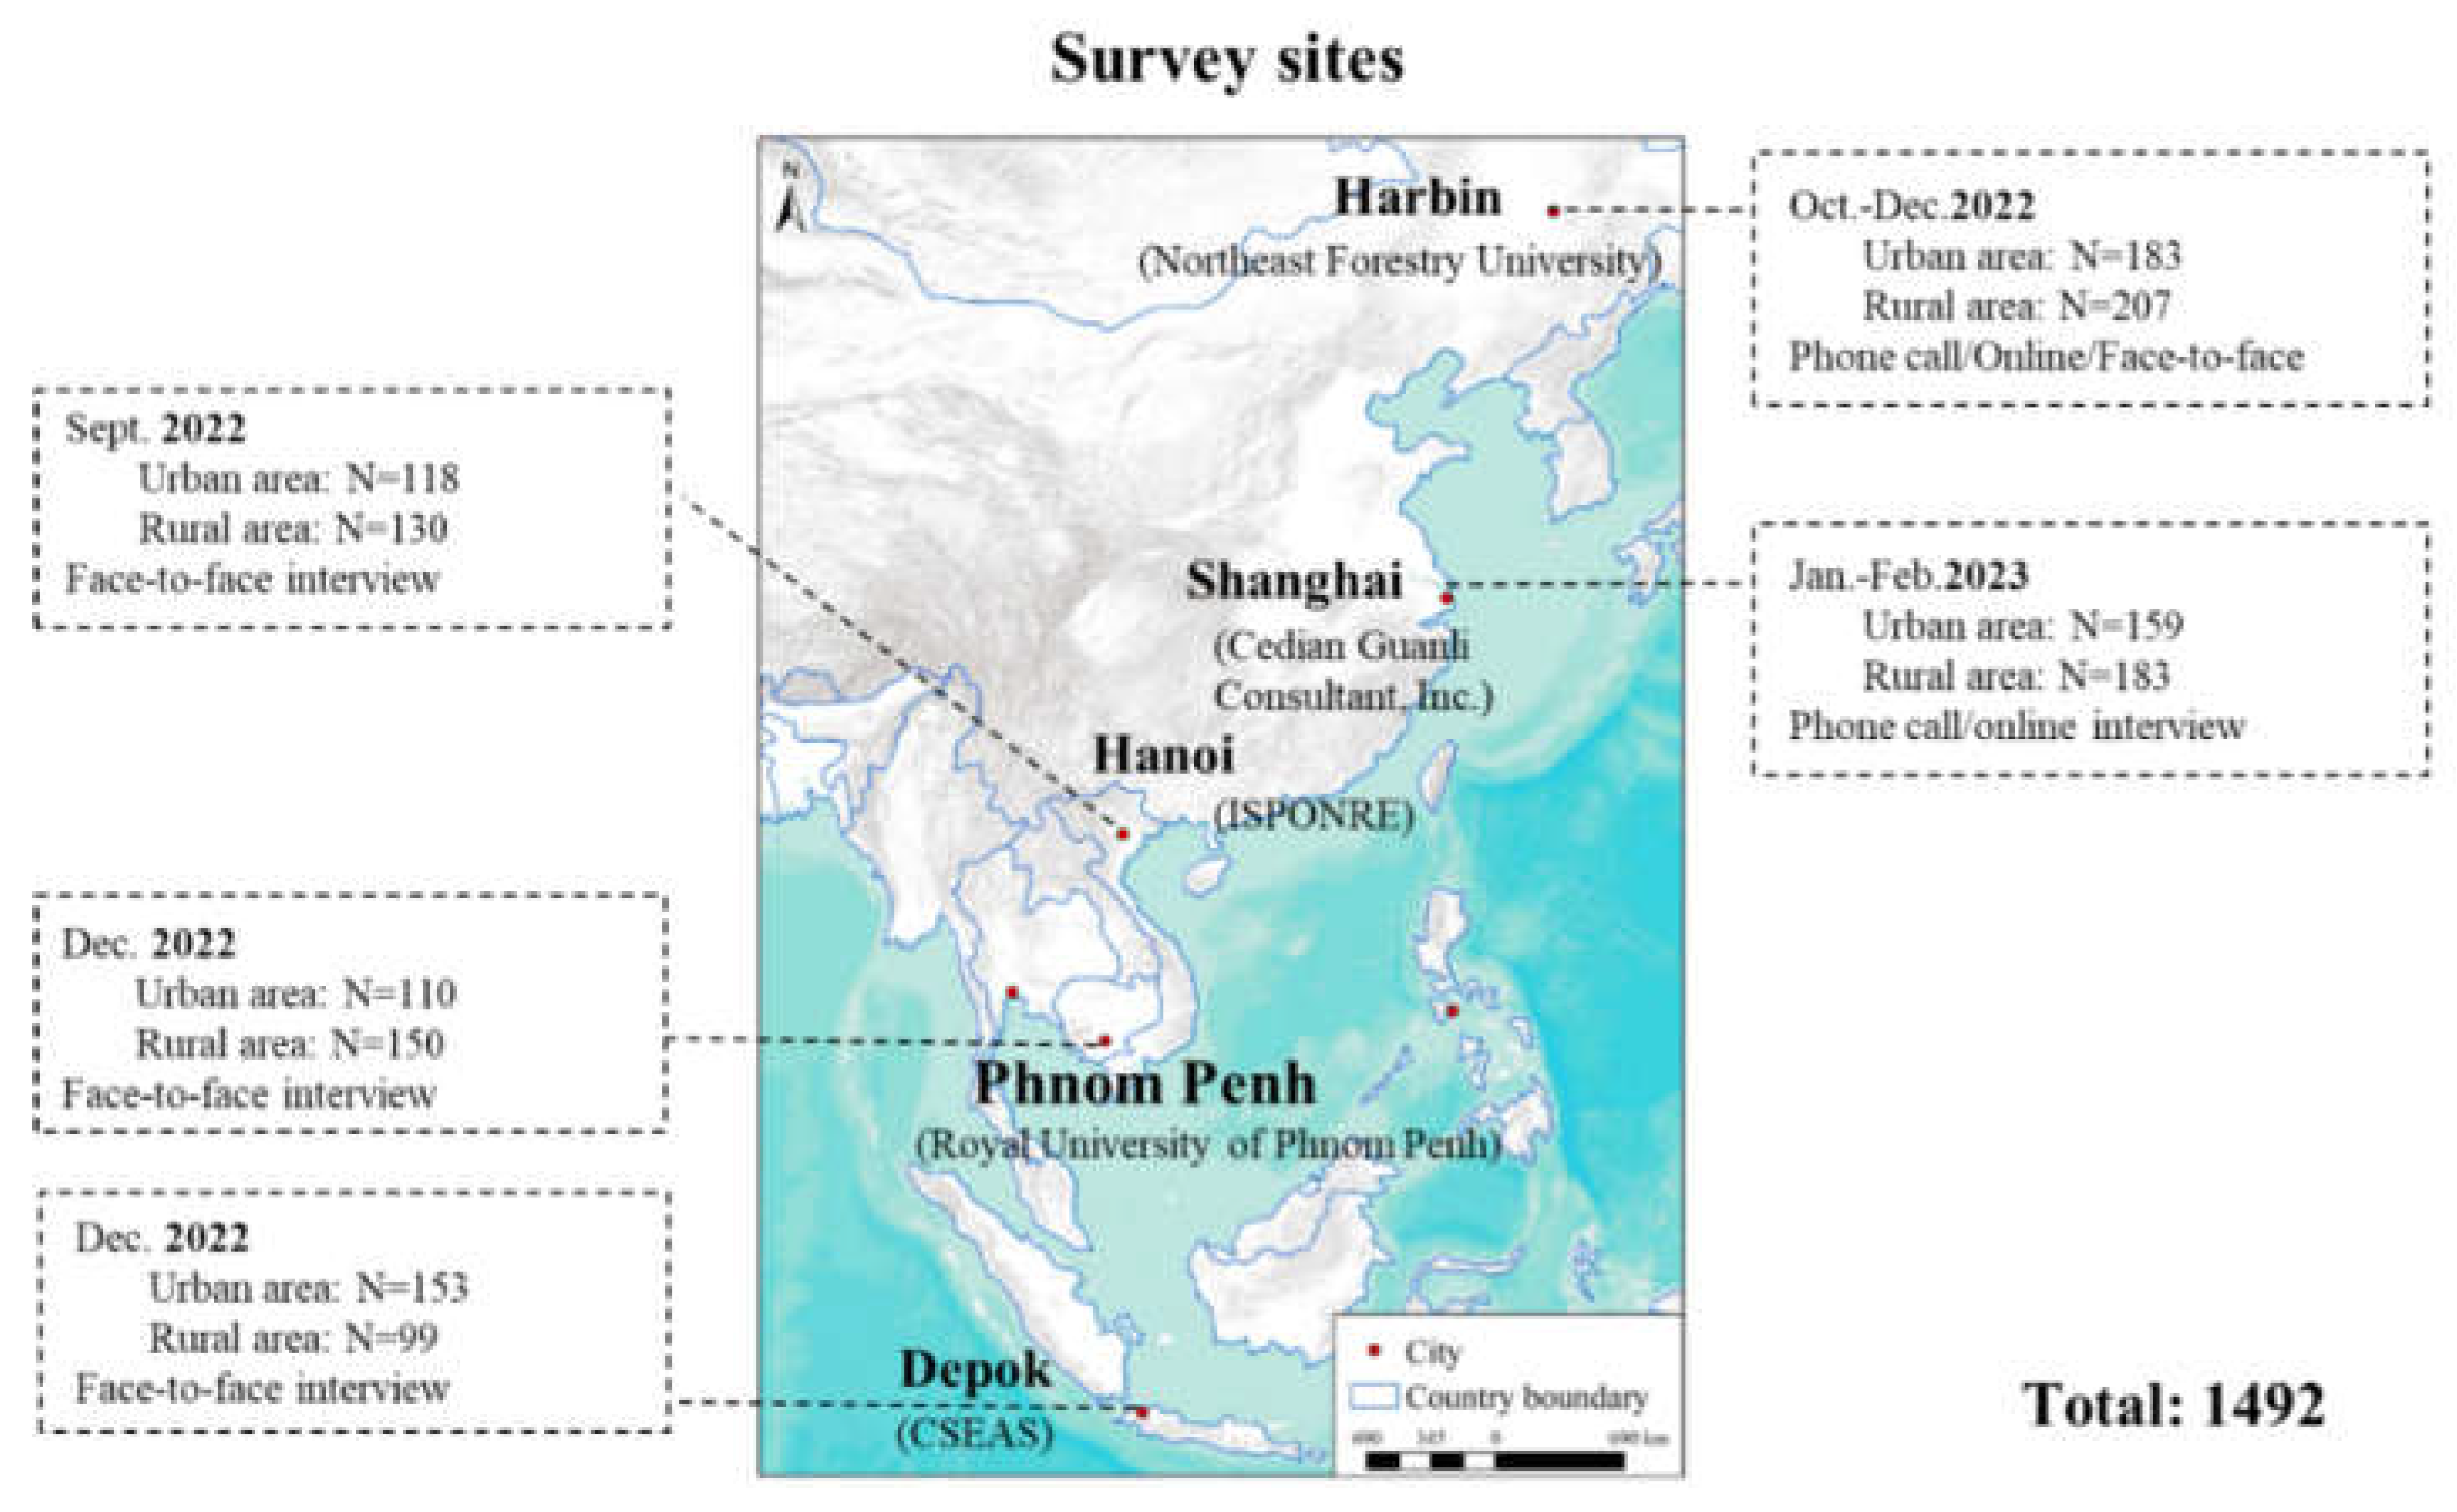
Figure 2.
The impact of demographic factors to single-use plastics usage
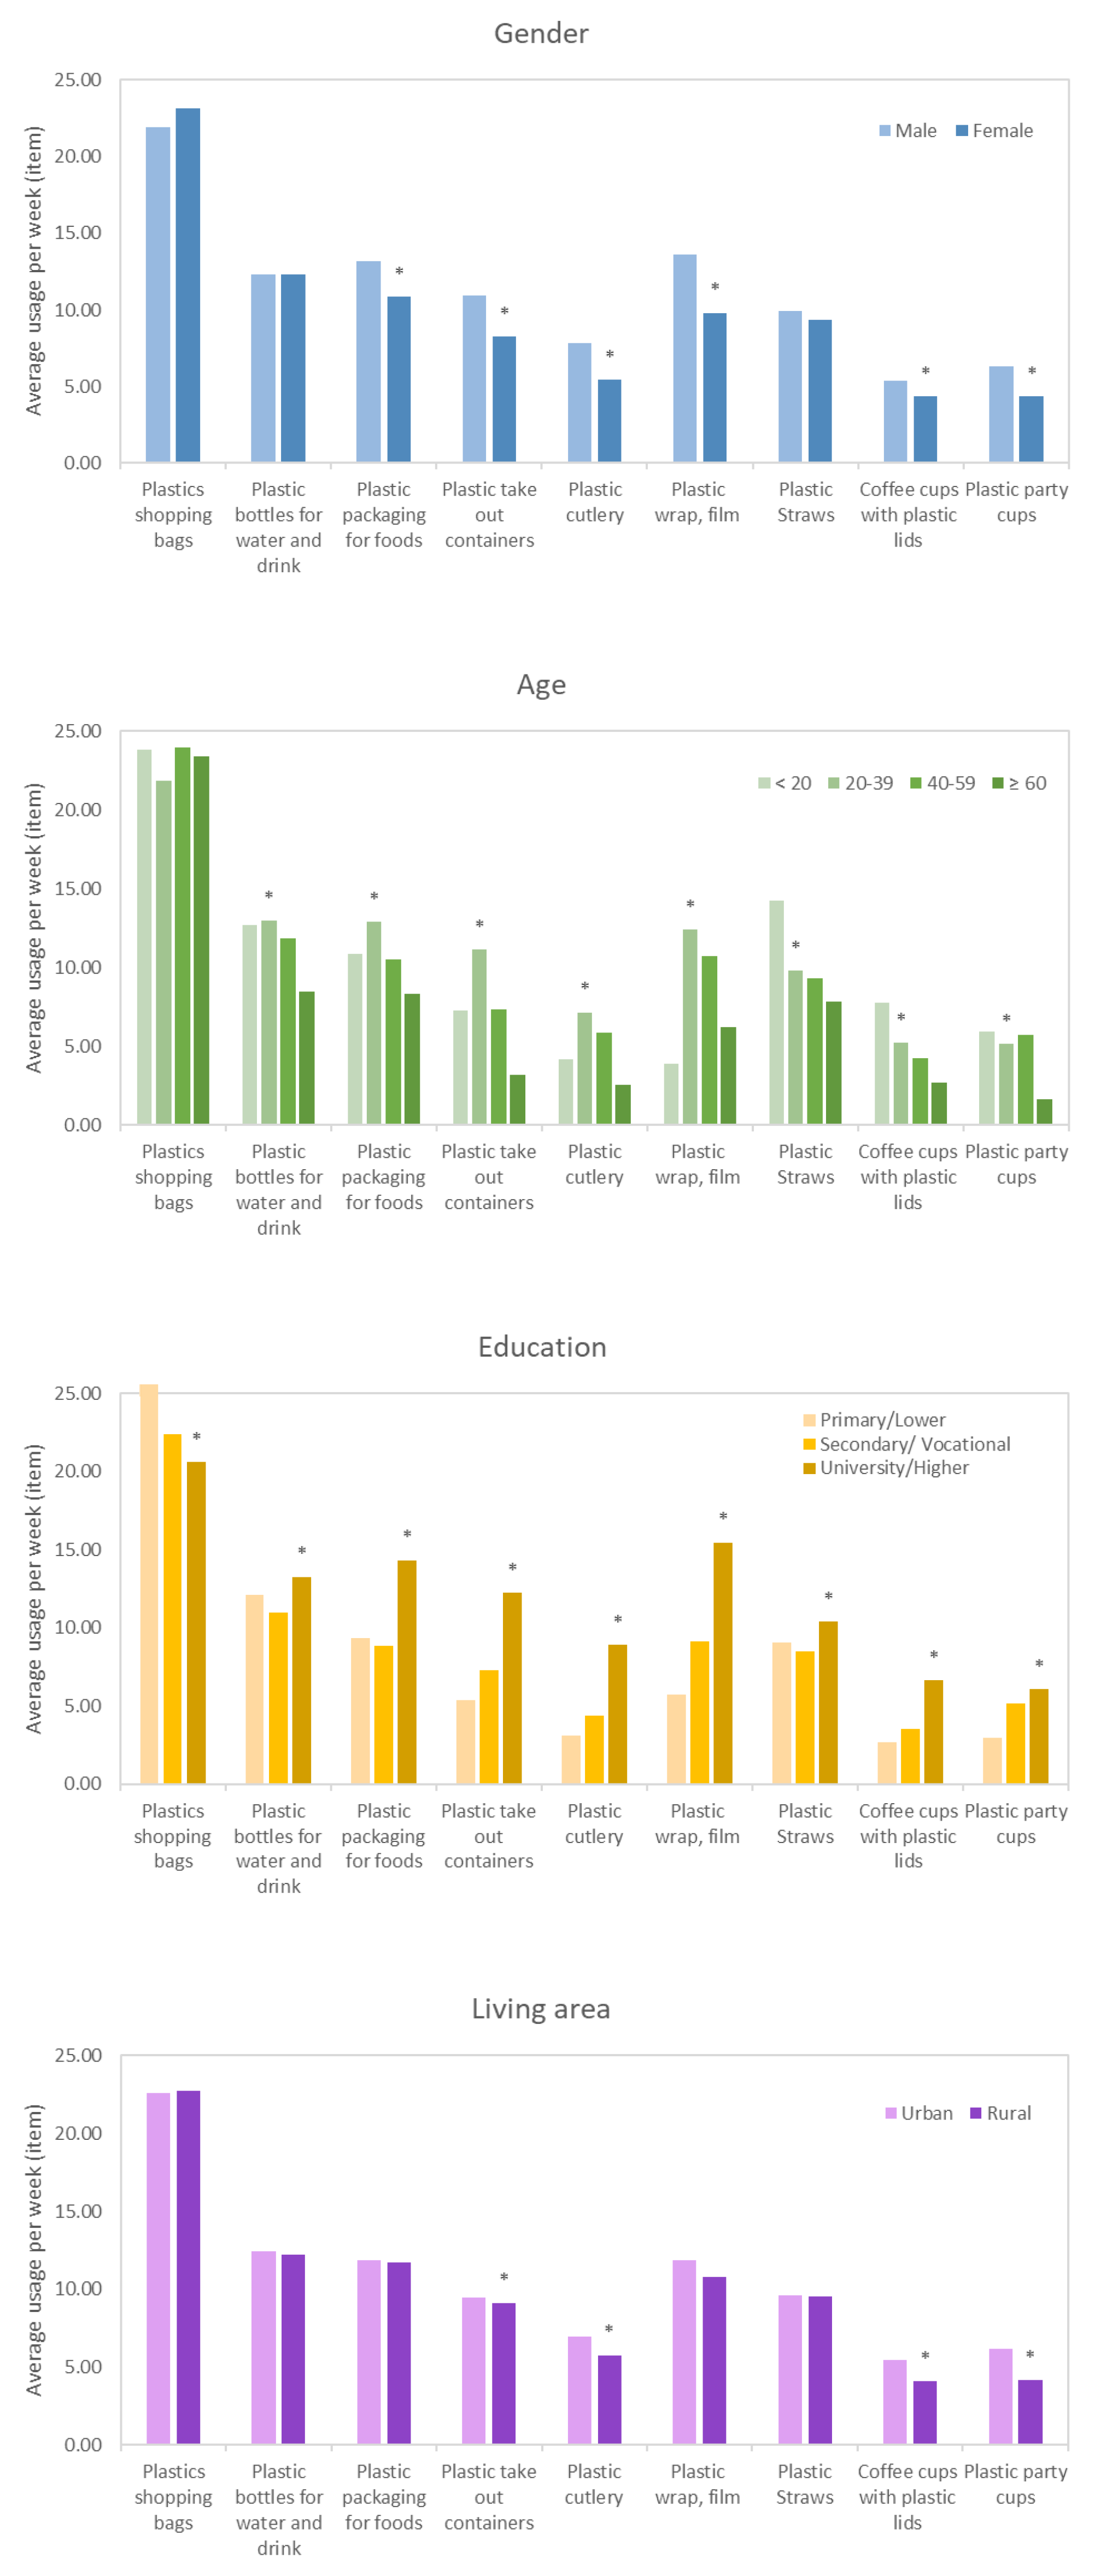
Figure 3.
Disposal methods of each single-use plastic in five cities (item)
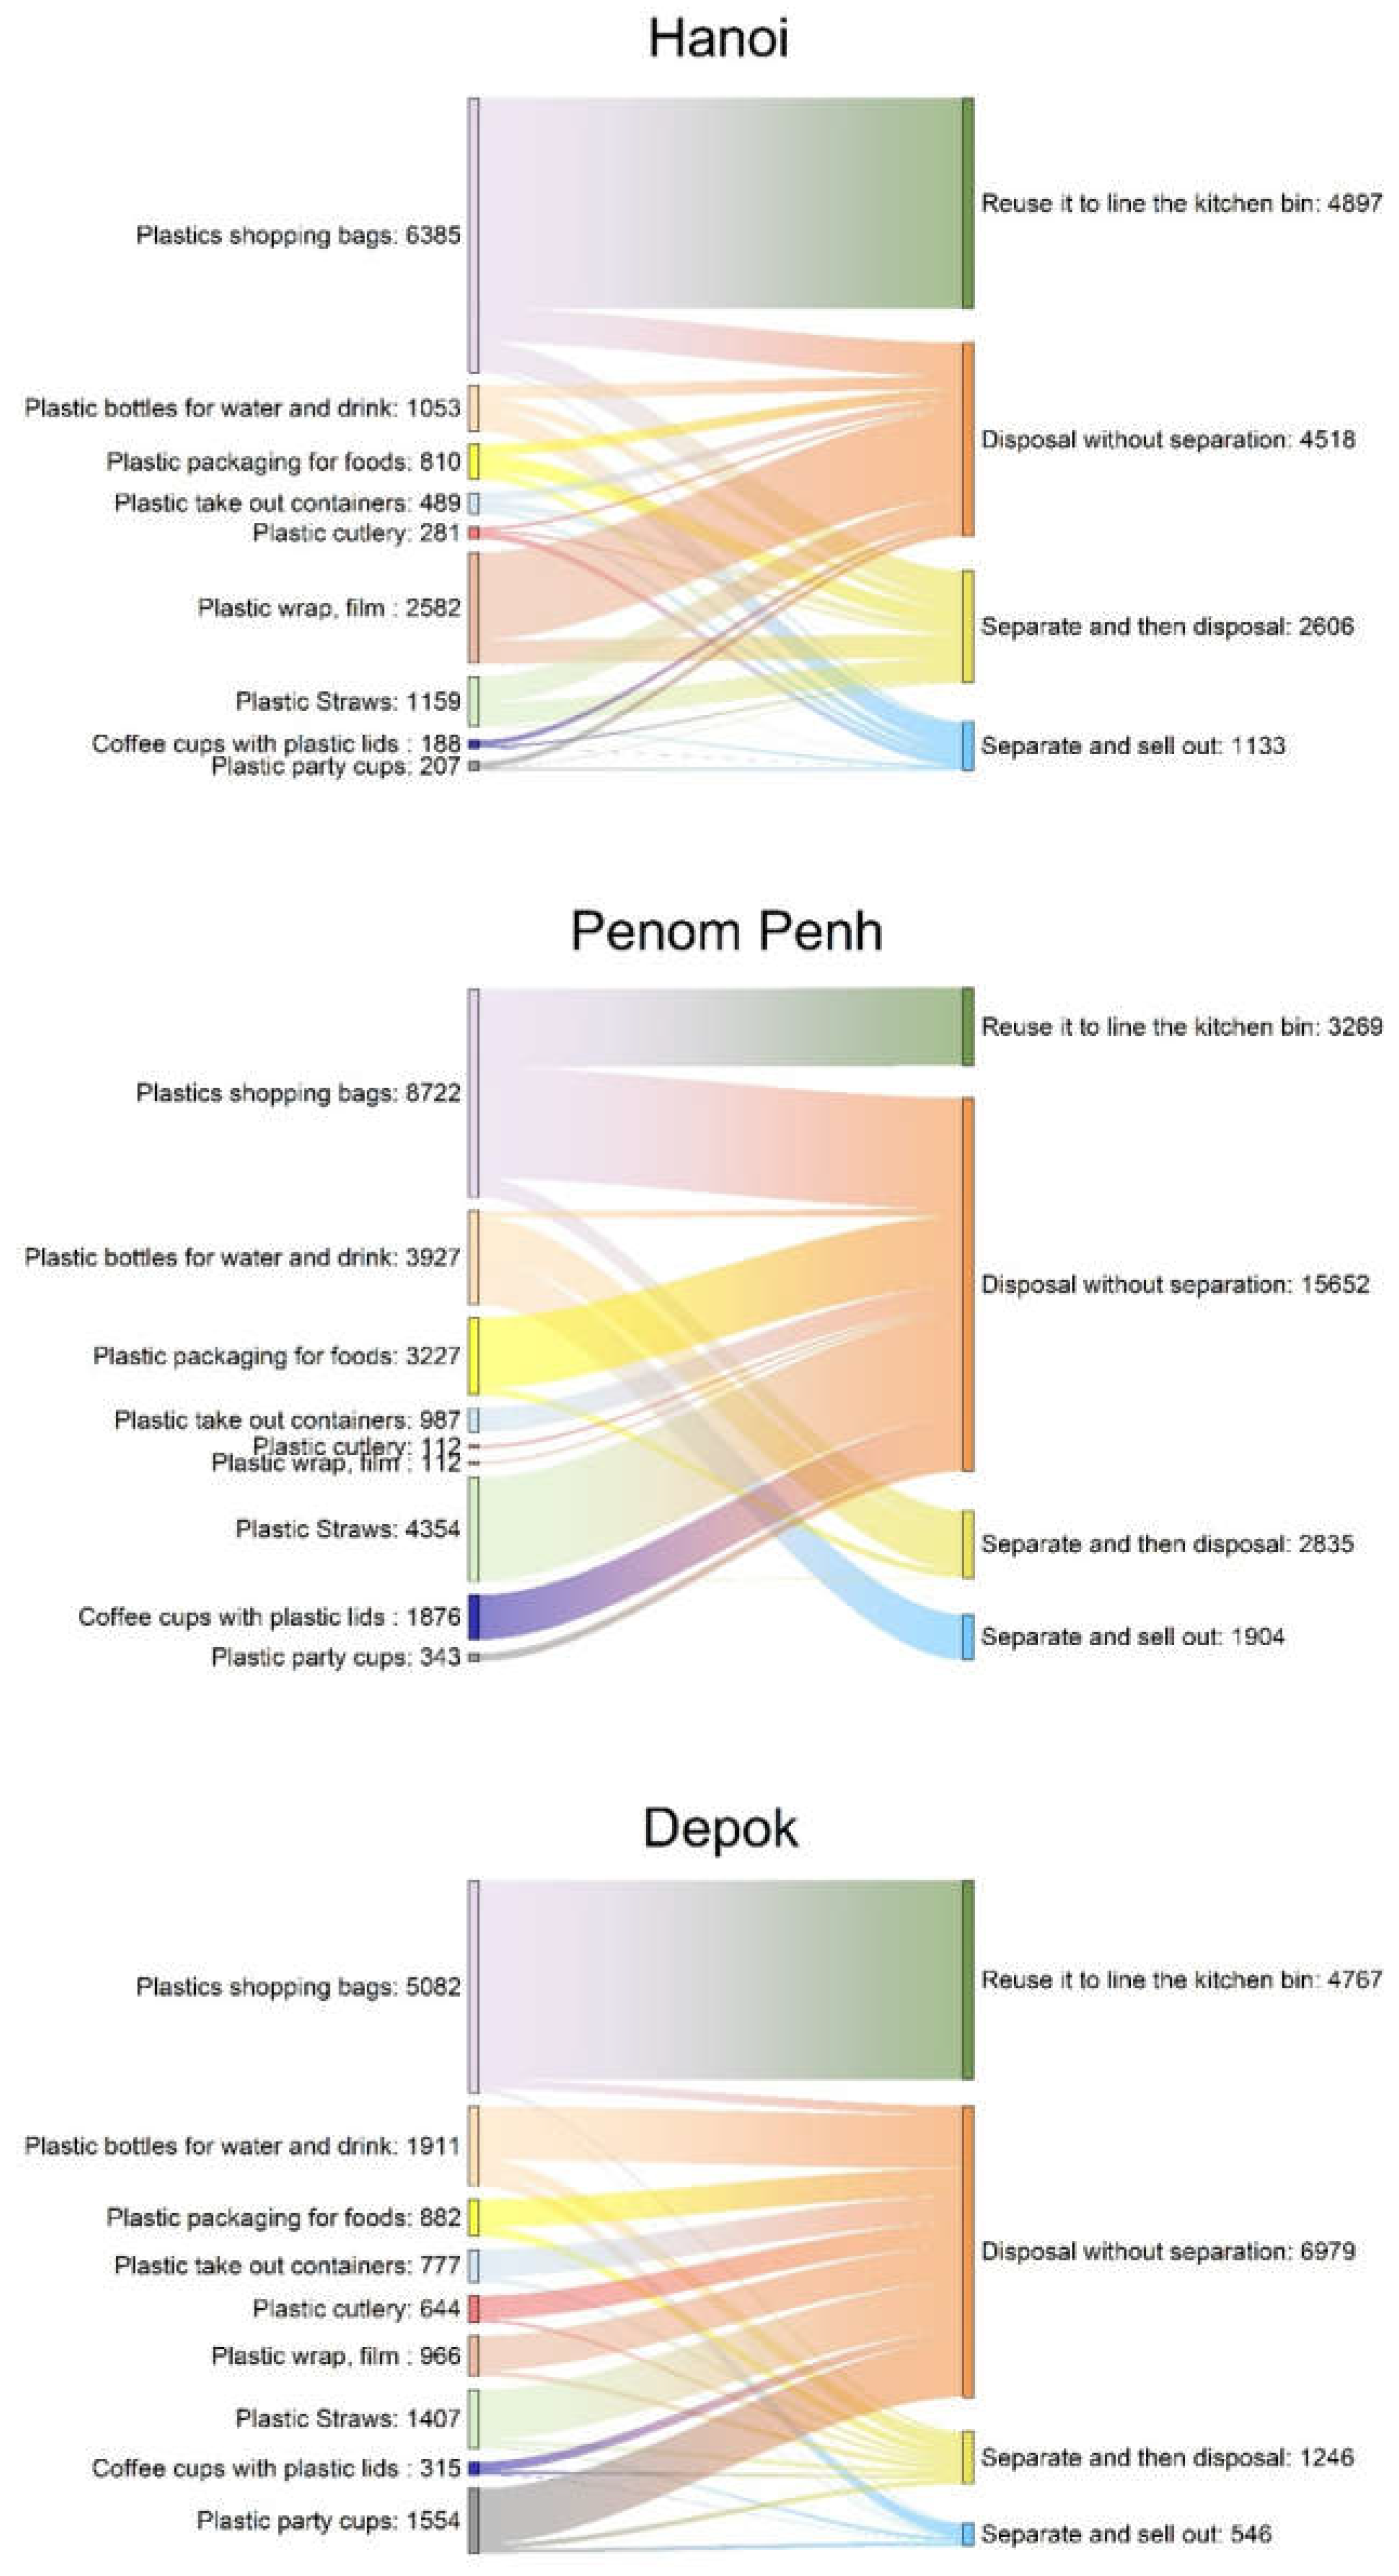
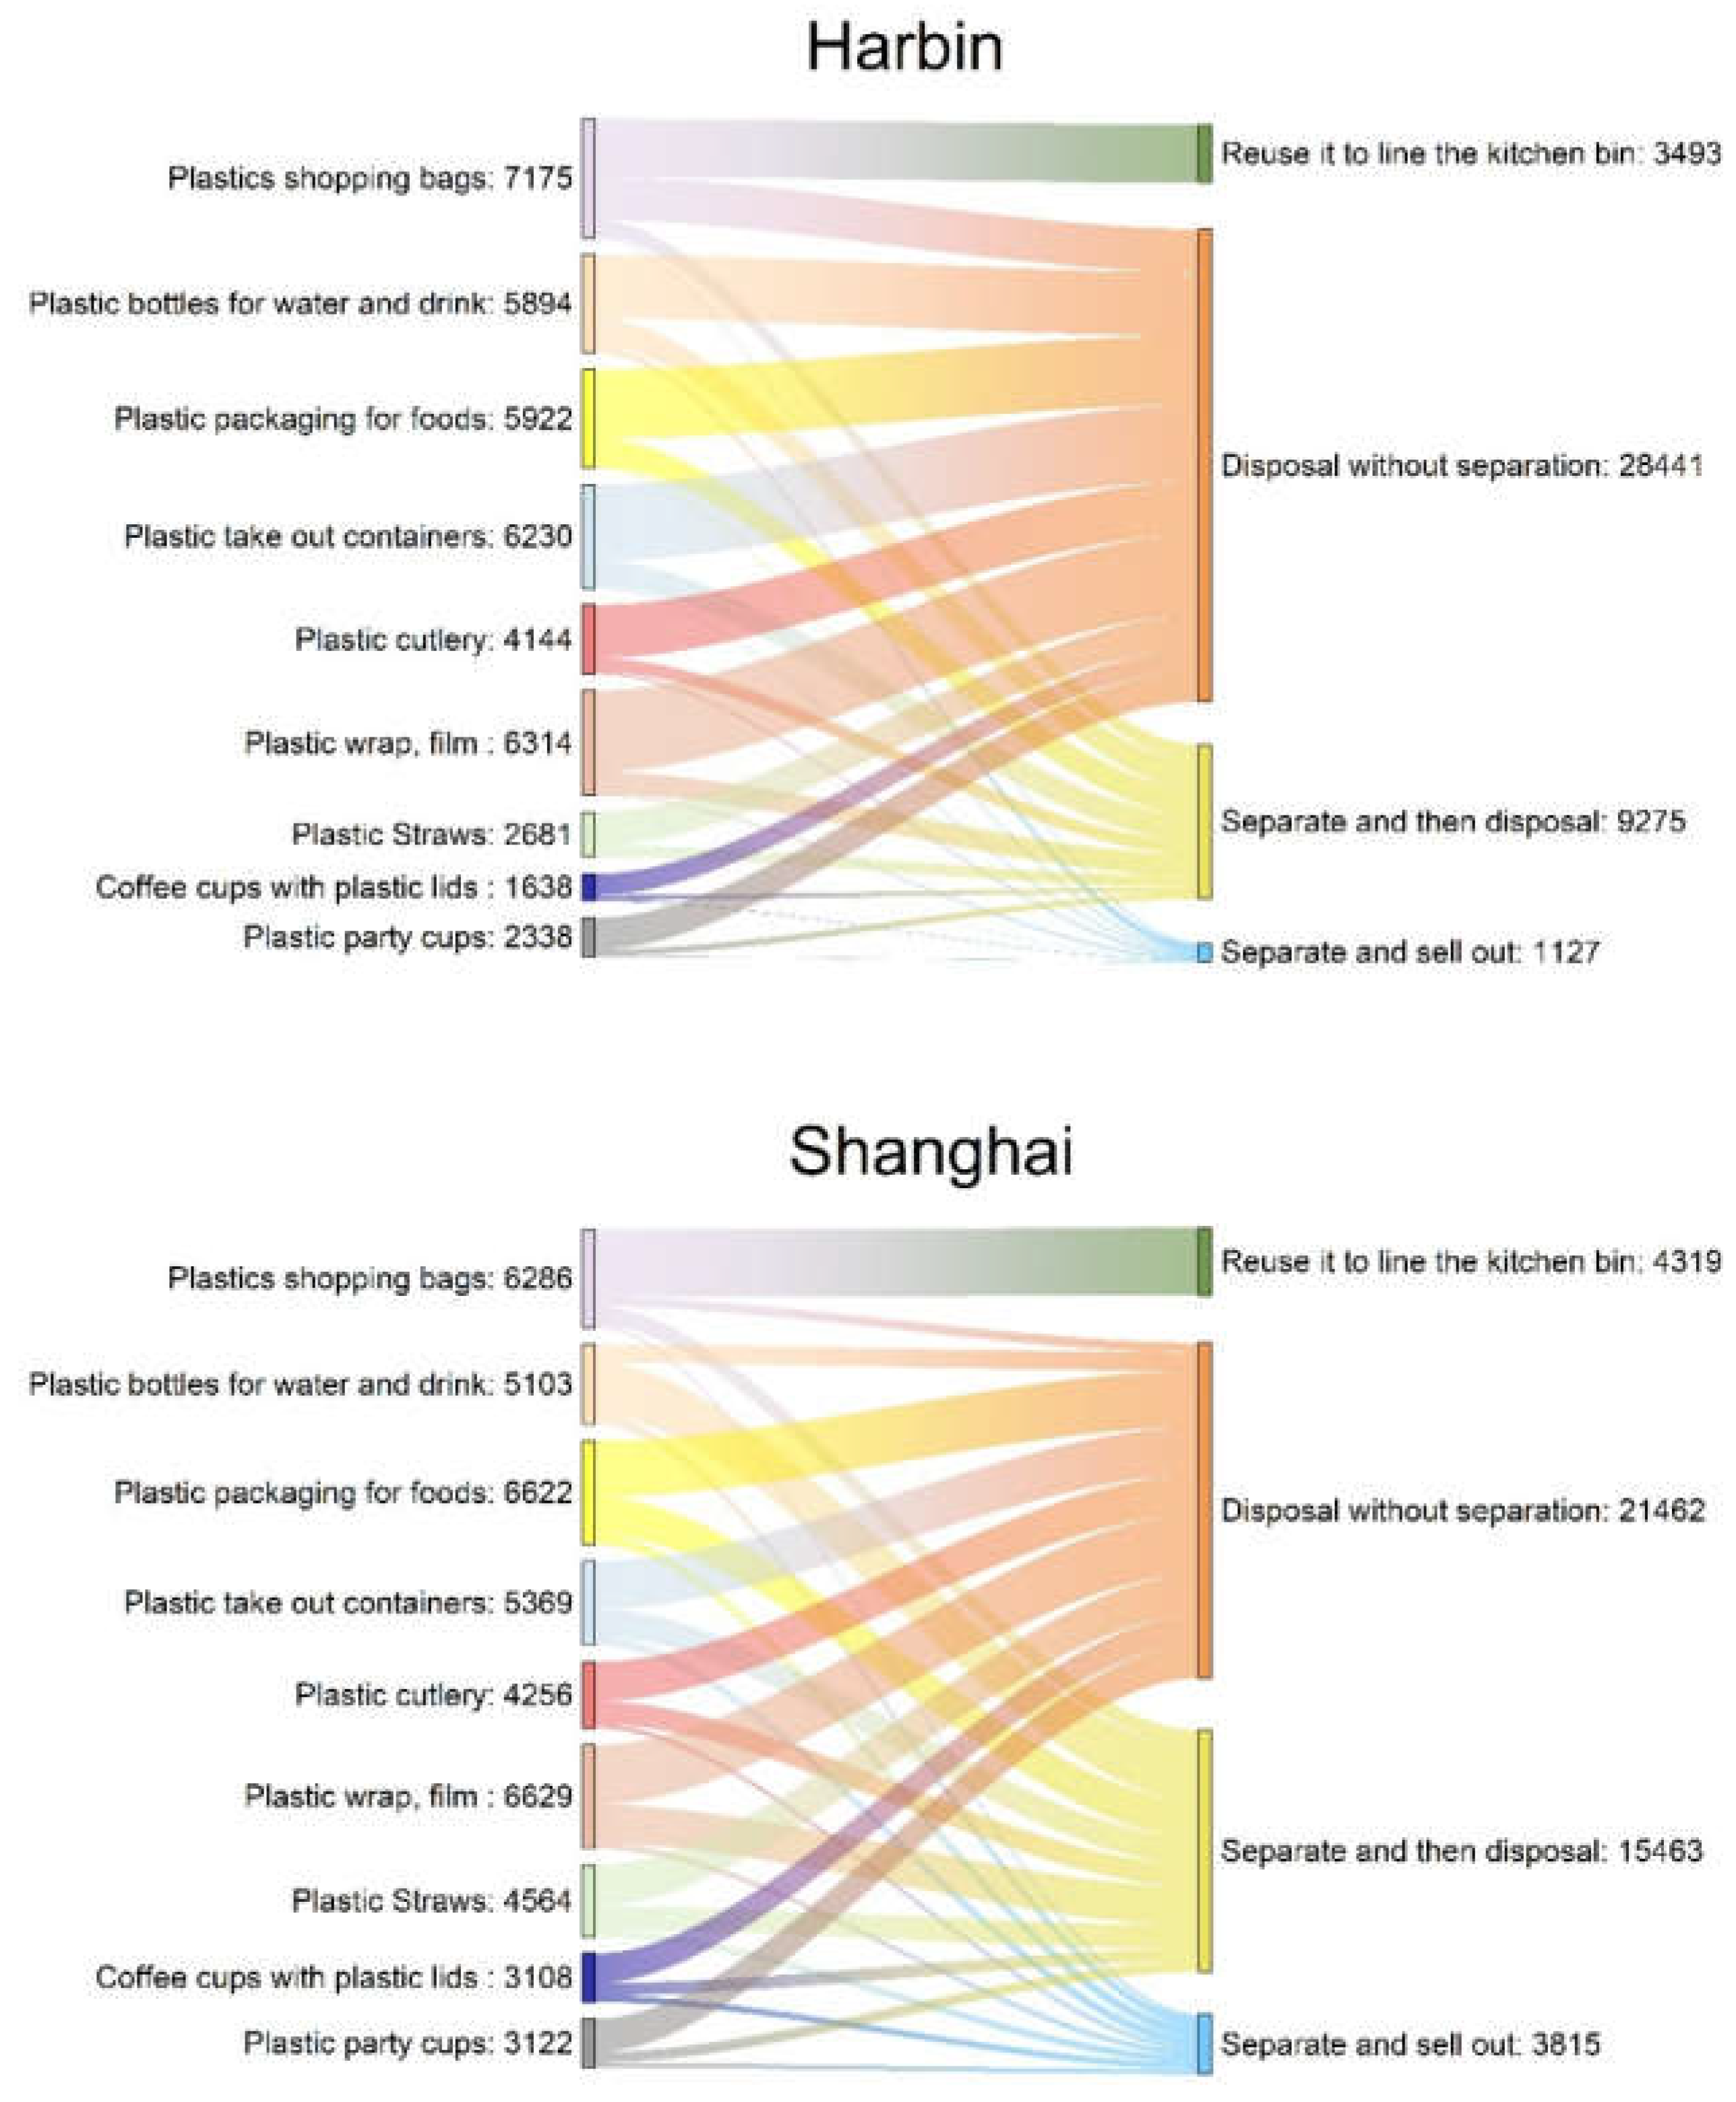
Figure 4.
Impact of COVID-19 pandemic on SUPs consumption in five Asian cities
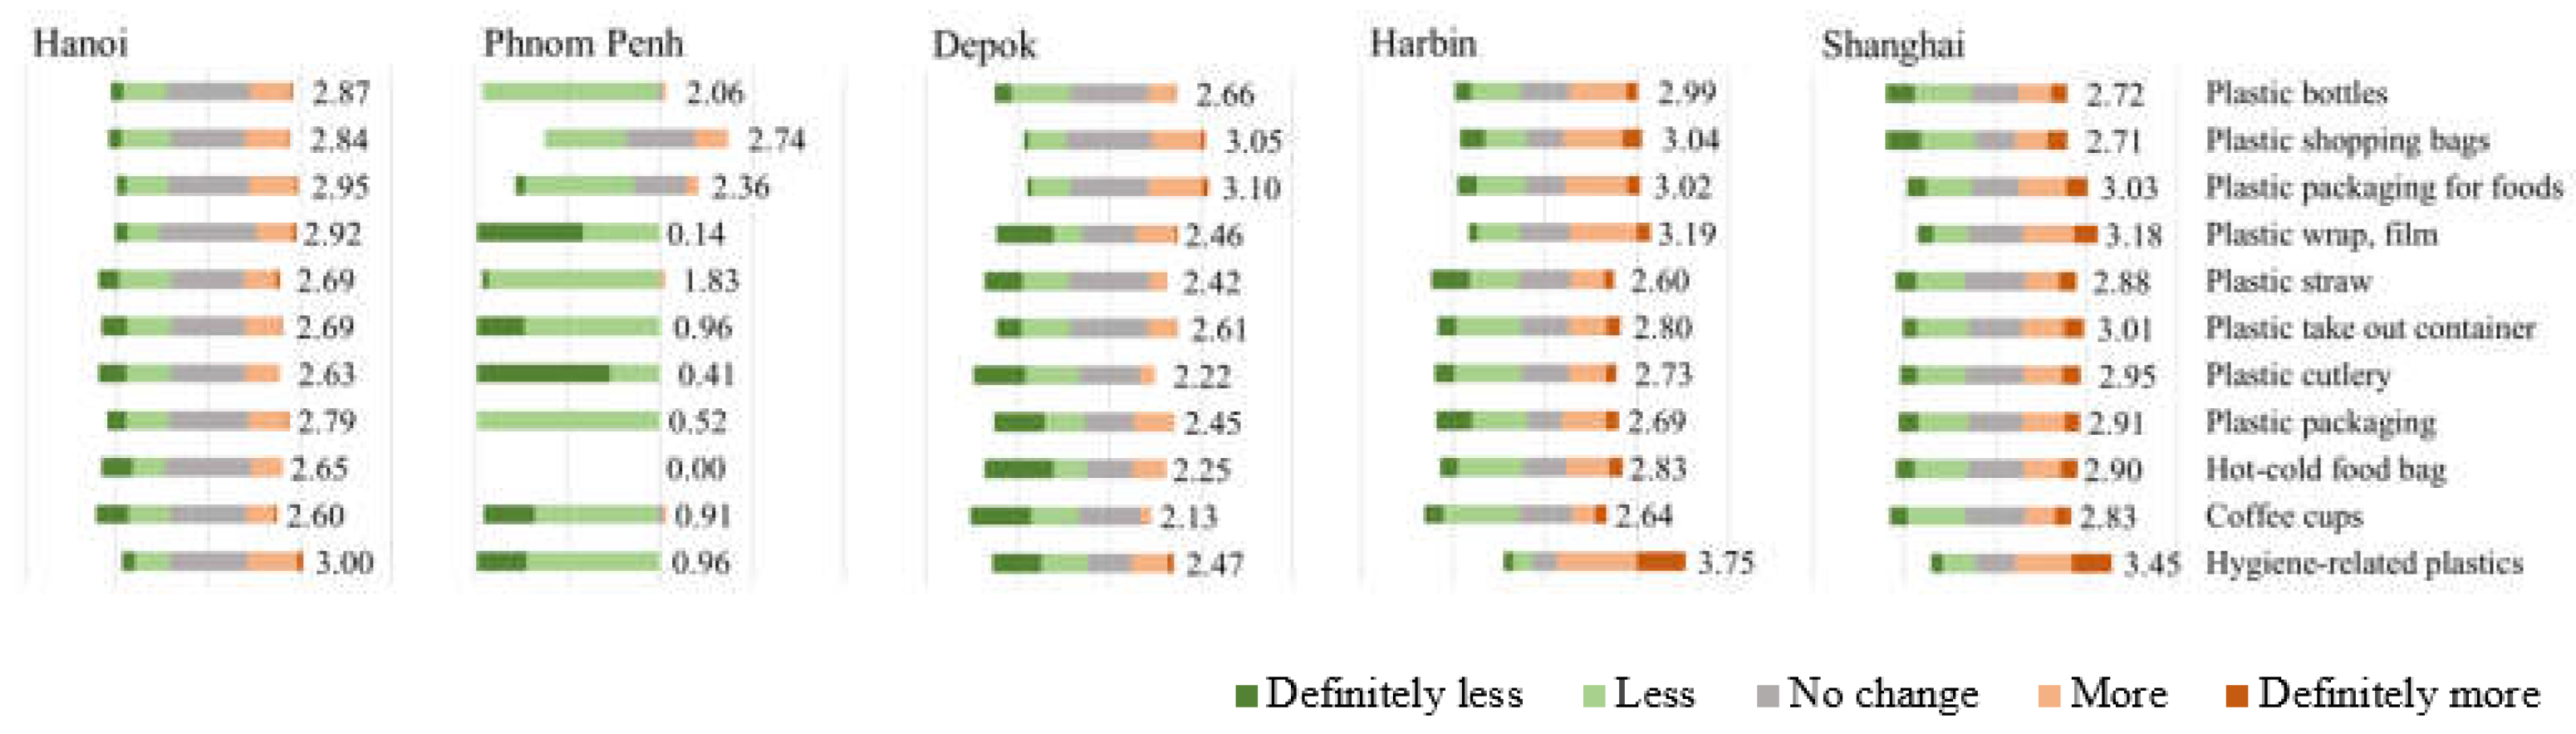

Table 1.
Demographic information of respondents (n=1492)
| Demographic | Category | Frequency (Percentage) | ||||
|---|---|---|---|---|---|---|
| Hanoi | Phnom | Depok | Harbin | Shanghai | ||
| Penh | ||||||
| Gender | Male | 92(37.1%) | 71(27.3%) | 67(26.6%) | 174(44.6%) | 180(52.6%) |
| Female | 156(62.9%) | 189(72.7%) | 185(73.4%) | 216(55.4%) | 162(47.4%) | |
| Age | < 20 | 0(0%) | 15(5.8%) | 3(1.2%) | 1(0.3%) | 8(2.3%) |
| 20-39 | 143(57.7%) | 123(47.3%) | 100(39.7%) | 261(66.9%) | 256(74.9%) | |
| 40-59 | 84(33.9%) | 93(35.8%) | 121(48%) | 115(29.5%) | 75(21.9%) | |
| ≥ 60 | 18(7.3%) | 29(11.2%) | 28(11.1%) | 13(3.3%) | 3(0.9%) | |
| Education | Primary/Lower | 44(17.7%) | 152(58.5%) | 110(43.7%) | 75(19.2%) | 20(5.8%) |
| Secondary/ Vocational | 62(25%) | 54(20.8%) | 115(45.6%) | 119(30.5%) | 25(7.3%) | |
| University/Higher | 138(55.6%) | 54(20.8%) | 27(10.7%) | 158(40.5%) | 261(76.3%) | |
| Living Area | Urban | 118(47.6%) | 110(42.3%) | 153(60.7%) | 183(46.9%) | 159(46.5%) |
| Rural | 130(52.4%) | 150(57.7%) | 99(39.3%) | 207(53.1%) | 183(53.5%) | |
| Total respondents | 248(16.6%) | 260(17.4%) | 252(16.9%) | 390(26.1%) | 342(22.9%) | |
Table 2.
The weekly average of each category of single-use plastic products used (item)
| Average per week | Hanoi | Phnom Penh | Depok | Harbin | Shanghai |
|---|---|---|---|---|---|
| Plastics shopping bags | 26.13 | 33.65 | 20.25 | 18.40 | 18.38 |
| Plastic bottles for water and drink | 4.52 | 16.50 | 7.64 | 15.17 | 15.00 |
| Plastic packaging for foods | 3.41 | 12.41 | 3.78 | 15.18 | 19.36 |
| Plastic take out containers | 2.08 | 3.80 | 3.14 | 15.97 | 15.70 |
| Plastic cutlery | 1.24 | 0.43 | 2.64 | 10.63 | 12.53 |
| Plastic wrap, film | 11.50 | 0.43 | 3.83 | 16.19 | 19.40 |
| Plastic straws | 4.95 | 16.75 | 5.78 | 6.87 | 13.35 |
| Coffee cups with plastic lids | 0.76 | 7.22 | 1.28 | 4.20 | 9.11 |
| Plastic party cups | 0.89 | 1.32 | 6.53 | 5.99 | 9.13 |
Disclaimer/Publisher’s Note: The statements, opinions and data contained in all publications are solely those of the individual author(s) and contributor(s) and not of MDPI and/or the editor(s). MDPI and/or the editor(s) disclaim responsibility for any injury to people or property resulting from any ideas, methods, instructions or products referred to in the content. |
© 2025 by the authors. Licensee MDPI, Basel, Switzerland. This article is an open access article distributed under the terms and conditions of the Creative Commons Attribution (CC BY) license (http://creativecommons.org/licenses/by/4.0/).
Copyright: This open access article is published under a Creative Commons CC BY 4.0 license, which permit the free download, distribution, and reuse, provided that the author and preprint are cited in any reuse.


