Submitted:
15 April 2025
Posted:
16 April 2025
You are already at the latest version
Abstract
The present work, optimization of ceramic-based composite WC (Co, Ni) welds by laser cladding through the response surface methodology based on finite element analysis. The heat distribution and temperature field of laser melted WC(Co,Ni) ceramic coatings were simulated using ANSYS software which allowed the computation of the distribution of residual stresses. The results show that the isotherms in the simulation of the temperature field are elliptical in shape, and the isotherms in front of the moving heat source are dense with a larger temperature gradient, and the isotherms behind the heat source are sparse with a smaller temperature gradient. In addition, the observed microstructural evolution shows that the domains of the melting zone of WC(Co,Ni) are mainly composed of unmelted carbides, dendritic, rod-like, leaf-like, net-like, and smaller agglomerates of carbides in which the W content of unmelted carbides exceeds more than 80%, and the C content is about 1.5-3.0%, while the grey areas are composed of WC, Co, and Ni compounds. Based on the regression model, a quadratic model was successfully constructed. A three-dimensional profile model of the residual stress behavior was further explored. The predicted values of RSM-based FEA model for residual stress are very close to the experimental data, which proves the effectiveness of model in improving the residual stress by laser cladding.
Keywords:
WC(Co
; Ni)
; residual stress
; laser cladding
; temperature field
; finite element analysis
; response surface methodology
1. Introduction
Laser cladding is a new surface modification technology, which adds a cladding element to the surface of the substrate. It uses a high-energy-density laser beam to form a cladding layer on the surface of the substrate[1,2,3]. Compared with surfacing, spraying, electroplating and vapour phase deposition, Laser cladding has the advantages of low dilution, dense structure, good adhesion between the coating and the substrate, better selection of suitable cladding materials, as well as variations in particle size and composition, etc[4,5,6,7,8]. So the application of laser cladding technology has a very great potential.
By applying laser cladding of tungsten carbides to steel surfaces, the wear resistance of these parts can be significantly increased, thereby extending their service life and reducing maintenance costs and down-time. There are extensive fields of industrial use in which steel is coated with cemented carbide[9,10,11,12,13]. Turning tools, milling cutters, drills and other cutting tools are coated with cemented carbide material on a steel substrate, which effectively maintains the cutting edge of the tool with a long-lasting sharpness[14,15,16]. This process not only significantly improves cutting efficiency, more smoothly and efficiently, but also greatly improves machining accuracy, so that the quality of the workpiece can be reliably guaranteed. Meanwhile, the service life of the tool is also significantly extended, reducing the time and economic costs associated with frequent tool changes.These tools are extensively used in high-tech manufacturing industries such as automotive, aerospace, and mold and die[17,18]. As a result, they are able to excellently perform cutting tasks on a wide range of metal materials.
Among them, cemented carbide WC is widely used in the manufacture of various cutting tools, such as turning tools, milling cutters, drills, boring tools, etc., which can efficiently machine a variety of metal materials[19,20]. Moreover, tungsten carbide is brittle compared to certain metallic materials. Its impact resistance and fracture resistance are relatively weak. When subjected to a large impact force or stress concentration, it is easy to crack or even fracture, which affects its service life and safety, thereby limiting its application in some high-impact intensity environments. In addition, during the laser cladding process, a series of complex heat and mass transfer phenomena are generated, such as temperature-dependent phase transitions of the material, transient laser beam absorption and reflection[21,22]. Hence, the large amount of residual stresses, deformations, and cracks generated in WC welds by laser cladding result in failure problems. However, residual stresses can adversely affect the dimensional stability, yield strength, fatigue strength, and corrosion resistance of clad specimens. Excessive stresses are likely to cause brittle damage, cracking, deformation, delamination, etc. during cladding or in service [23,24,25].Therefore, the cracking of tungsten carbide on the surface of laser-melted steel is a tremendous challenge. However, the study of the mechanism of stress generation during laser cladding is particularly important for the improvement of laser cladding technology. It is required to propose a new method to reduce and eliminate residual stresses. Recently, a number of studies have been published by researchers that aim to overcome the above-mentioned drawbacks of the laser cladding process[26,27,28]. A way to solve the above problems is provided by the development of numerical simulation methods.
Finite Element Analysis (FEA) is a powerful numerical analysis method, which has many advantages in the field of laser cladding, such as simulating the temperature and stress fields, optimizing the process parameters, characterizing the structure and properties of the cladding layer, analyzing the effects of multi-physical coupling, reducing the cost and cycle time, as well as guiding the design of the cladding layer[29,30,31]. The application of numerical simulation in the study of laser cladding temperature field has been increasingly emphasized by researchers. These studies have laid a groundwork for the further development of numerical simulation of coating by laser cladding. They also show that the influence of the heat source model on the calculation results requires further in-depth study. In view of this, the laser melting temperature field under the heat source model is calculated by using ANSYS APDL software with WC(Co,Ni) welds, and the calculated results are compared with the experimental results, in order to improve the reliability of the simulations[32,33,34,35]. However, the numerical simulation of temperature field which is usually adopted to characterize the action of laser on the surface of metal material by heat source model. The heat transfer control equation is established according to the conservation of energy which is solved by the finite element method by means of finite element software[36,37,38]. The results of the calculations can only be used to provide a basis for the optimization of the process parameters of the welds of the laser cladding.
As mentioned above, there are already several reports on finite element studies of the mechanical properties of WC(Co,Ni), but the results of residual stress obtained by numerical simulation can only be used to explain some complex physical phenomena of the coating layer in laser cladding. Accordingly, It is incapable of solving the problem of optimizing the process parameters in the experimental domain, thereby failing to address the relationship between each parameter and the residual stresses, as well as their significance[27,28,29,30,31,32,33,34,35,36,37,38]. However, the residual stresses in the cladding layer are mainly due to the thermal stresses during the cladding process. It is necessary to have a better understanding of the mechanism of finite element analysis on the mechanical properties of laser clad WC(Co,Ni) coatings. Therefore, it is particularly important to determine how to select the parameters of the optimal process in the model simulation of finite elements such that favorable residual stress distributions in the cladding deposit can be obtained. Therefore, the integration of finite element simulation with the response surface method is a reasonably effective solution.
Response surface methodology (RSM) that can be used for extraction optimization is a group of mathematical and statistical techniques, that are widely used in the manufacturing industry in order to evaluate the relationship between the predicted values of the independent and dependent variables[39,40]. The primary advantage of RSM is that it reduces the number of experiments required to evaluate multiple variables and their interactions. As a result, RSM is more effort- and time-efficient than other methods. Several studies have shown that RSM can be effective in investigating optimal extraction conditions for the mechanical properties of welding[41,42,43]. However, there is no information on the FEM-based optimization of RSM for WC(Co,Ni) welds.
In this study, a mixed WC(Ni,Co) powder was deposited by laser cladding that formed a composite metal-ceramic weld by the use of FEA and RSM, which reduced the properties of residual stresses in high-hard WC. A three-dimensional finite element simulation is carried out for the temperature field and stress field in the process of laser cladding using professional ANSYS software. An novel method was developed by optimize the parameters of residual stress using RSM-based on FEA that could improve the residual stress properties of laser-coated WC(Ni,Co) welds. Furthermore, it was studied the residual stress behaviour, microstructural evolution and fracture crack formation of WC deposits with different Co/Ni ratios in composite welds by laser cladding [58–61]. The effect of parameters on the residual stress response was evaluated through the RSM models. It allows a better understanding of the effect of each parameter on the residual stress of the coating. The results not only provide optimized process parameters for laser welding of WC (Co,Ni) welds, but also clarify the correlation between process parameters and residual stresses in the experimental domain. This will help to make more reasonable and appropriate adjustments in the selection of process conditions and the optimization of quality control, thus significantly improving production efficiency.
2. Experiments and Methods
2.1. Materials and Preparations
The fiber laser cladding system represents an advanced surface treatment technique. By utilizing a fiber laser as the heat source, it enables the accomplishment of surface modification or repair through the melting of specific materials on the substrate's surface. The device was manufactured by IPG Laser in Germany. A fiber laser cladding system in this study consisted of an IPG YLS-3000 fiber laser, a 6-axis robot, an induction power supply, a computed digital control system, and a powder feeder (HUST III). Figure 1a shows the schematic diagram of coxial powder delivery by laser cladding. The alloy powder is driven by the nozzle and air flow through the powder feeder, which is heated by the laser. It enters the liquid melt pool on the surface, thereby solidifying and forming the cladding layer. An IPG YLS-3000 fibre laser was used. It has a maximum power of 3000 W and a wavelength of 1.07μm. The powder feeder of the HUST III is used to feed metal powder to the cladding area. The powder is usually blown by an air stream to the position where the laser beam is to be irradiated.WC(Co,Ni) blends consist of 125 lm to 300 lm of WC, Co and Ni alloy powders.As shown in Figure 1b, a X-ray diffraction (XRD) is a portable or benchtop XRD instrument based on Bragg's law that calculates stresses by measuring lattice strains at different diffraction angles using the Proto iXRD device. Also, the microstructure of the WC(Co,Ni) welds was analyzed using a scanning electron microscope (SEM) with a Hitachi S-2600H, Tokyo, Japan. As shown in Figure 2a, the work metals are #45 steel and #40Cr steel with dimensions of 40mm X 20mm X 10mm. The left-hand side of Table 1 shows the datum for the control factors and levels in this study.The values on the right side of the table are the residual stresses on the surface of the coating. As shown in Table 1, 18 sets of experiments were conducted through experimental design by Taguchi using 8 parameters and 3 levels. Each experiment was repeated 3 times to check the reproducibility of the results. It can significantly reduce the variance in systems where there are a large number of variables. Due to the residual stress characteristics, and the smaller and better the type, it is the better the quality of the product. In this study, the modeling of laser cladding is carried out based on ANSYS software, which contains mesh, Gaussian heat source, boundary conditions. It realizes the numerical simulation of temperature field and stress field as shown in Figure 2b. On the other hand, laser cladding is performed based on the proposed Taguchi experiments, which accomplish the examination of coating metallurgy and residual stresses.
2.2. Finite Element Models
Laser cladding is a metallurgical process with rapid melting and solidification. The process offers great advantages in terms of characterising materials. However, laser cladding is a complex thermodynamic process and the changes of various parameters are difficult to be determined experimentally, which makes numerical simulation methods have great potential for application in this field. In recent years, many models have been developed to explain the heat transfer and flow processes in laser cladding. The accuracy of the transient welding temperature field, especially in the vicinity of the heat source, is strongly influenced by the choice of the heat source model. A Gaussian distribution of the heat source is often used for laser cladding, where the heat distribution is
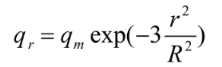 where qr denotes the density of the heat source, r is the distance from the centre point of the spot, R is the radius of the spot, and qm is the maximum value in the heat flow density.The parameters of the material, both thermal and mechanical, are given for numerical finite element simulation using ANSYS[28]. Gaussian heat source is a commonly used model for heat source distribution, and its heat flow density is Gaussian distributed in space. The heat flow density of a Gaussian heat source model commonly takes the form of the following formulas:
- The heat flow density q(x,y,t) of a Gaussian heat source in a two-dimensional plane, assuming that the heat source is moving along the z-axis with velocity v, is given by the following equation:
- The equation for the heat flow density q(x,y,z,t) for a moving Gaussian heat source in three dimensions, assuming that the heat source is moving along the z-axis with velocity v, is:where q(x,y,z,t) is the density of heat flow, Q is the total laser power, R0 is the radius of the laser spot, v is the moving speed of the heat source, h is the depth of the heat source, t is the time, and x, y, and z are the coordinates in space. In this study, WC (Co,Ni) composite coatings were used in simulations and experiments.
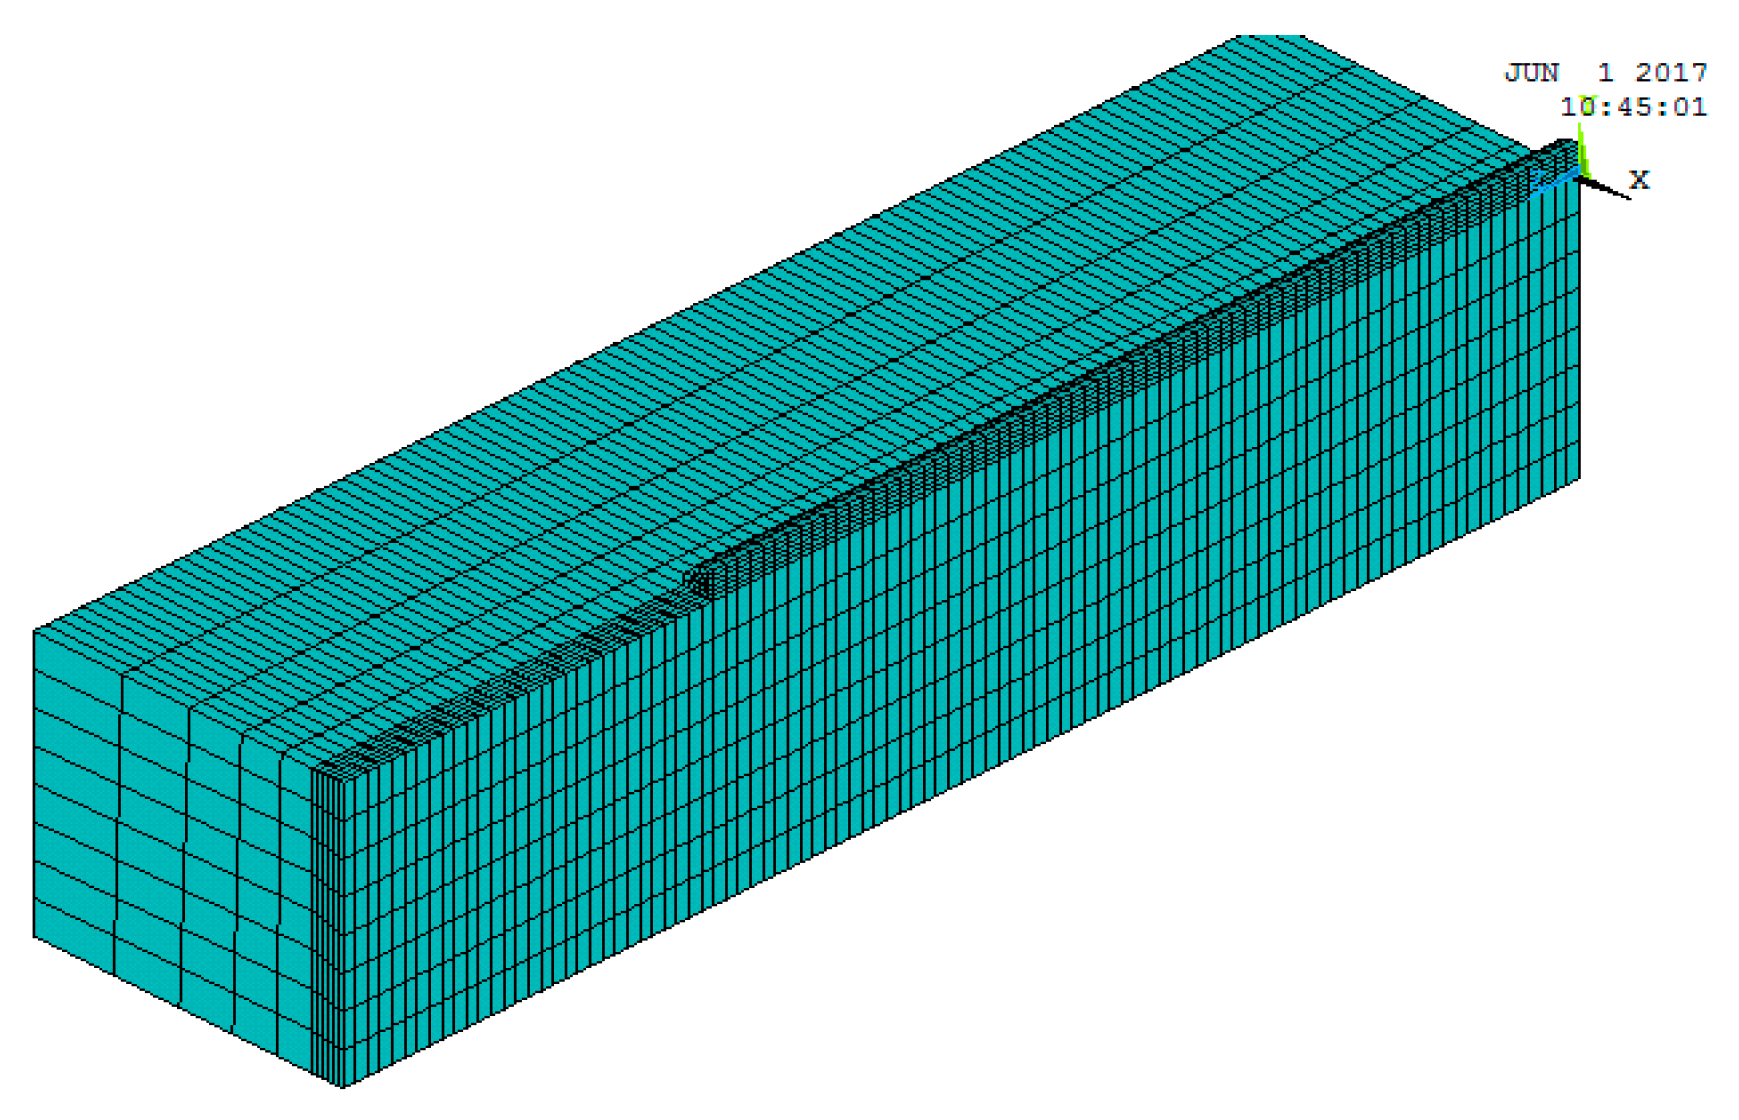
All thermal and mechanical properties are considered as a function of temperature in the model to obtain more accurate results. The calculation of the temperature field of laser cladding is a nonlinear problem of transient heat transfers, in which the thermal conductivity and specific heat of the material change with the temperature. The calculation of laser cladding temperature field falls into the problem of nonlinear transient heat transfer, and the thermal conductivity and specific heat of the material change with the temperature. Therefore, the eigenvalues of material properties at several points of special temperature are determined in the calculation. Then the eigenvalues at other points of temperature are calculated according to the rule of change of the eigenvalues of the material by using the difference method. The variations of thermal conductivity, coefficient of linear expansion, specific heat capacity and modulus of elasticity with temperature for various materials in the coating such as #45 steel and powder ratios are shown in Figure 3. The model is presented with symmetry considered, and the choice of a half section along the cladding direction is determined to reduce the amount of computation. The dimensions of the model in this study are 40mm*10mm*10mm as in shown Figure 2a. The cross-section of the coaxial coating is a quarter-circle with a radius of 1 mm. The material unit type is defined as solid70 3D thermal solid unit. The number of model cells for the synchronous cladding layer is 2700 (27×100), and the number of matrix cells is 8800 (11×100×8).The ANSYS model is realised through the operation of the GUI interface, which generates a command flow, facilitating the subsequent modification of the material parameters and the heat source model settings, etc. This operation generally appears at the beginning of the programme, thereby effectively improving work efficiency. ANSYS uses APDL to program the movement process of the heat source in Cartesian coordinate system in which the load is applied in the local coordinate system, so that the transformation from time to space is achieved by the coordinate transformation in the direction of cladding, i.e., in the direction of O-Z axis. Meanwhile, the growth process of the cladding unit is simulated by using the technique of “live and dead” in ANSYS [2]. The relevant program for the APDL is as follows:
- ESEL, S,MAT,, 2
- EPLOT Killed all the units
- EKILL, ALL
- EPLOT
- EPLOT
- EALIVE, ALL
- CM,E_1, ELEM Activation of units at the scan of the laser
- CM,N_1,NODE
Figure 3.
Thermophysical properties of various powders and #45 steel as a function of temperature (a) Coefficient of thermal conductivity (b) Specific heat capacity (c) Young’s Modulus (d) Coefficient of thermal expansion.
Figure 3.
Thermophysical properties of various powders and #45 steel as a function of temperature (a) Coefficient of thermal conductivity (b) Specific heat capacity (c) Young’s Modulus (d) Coefficient of thermal expansion.
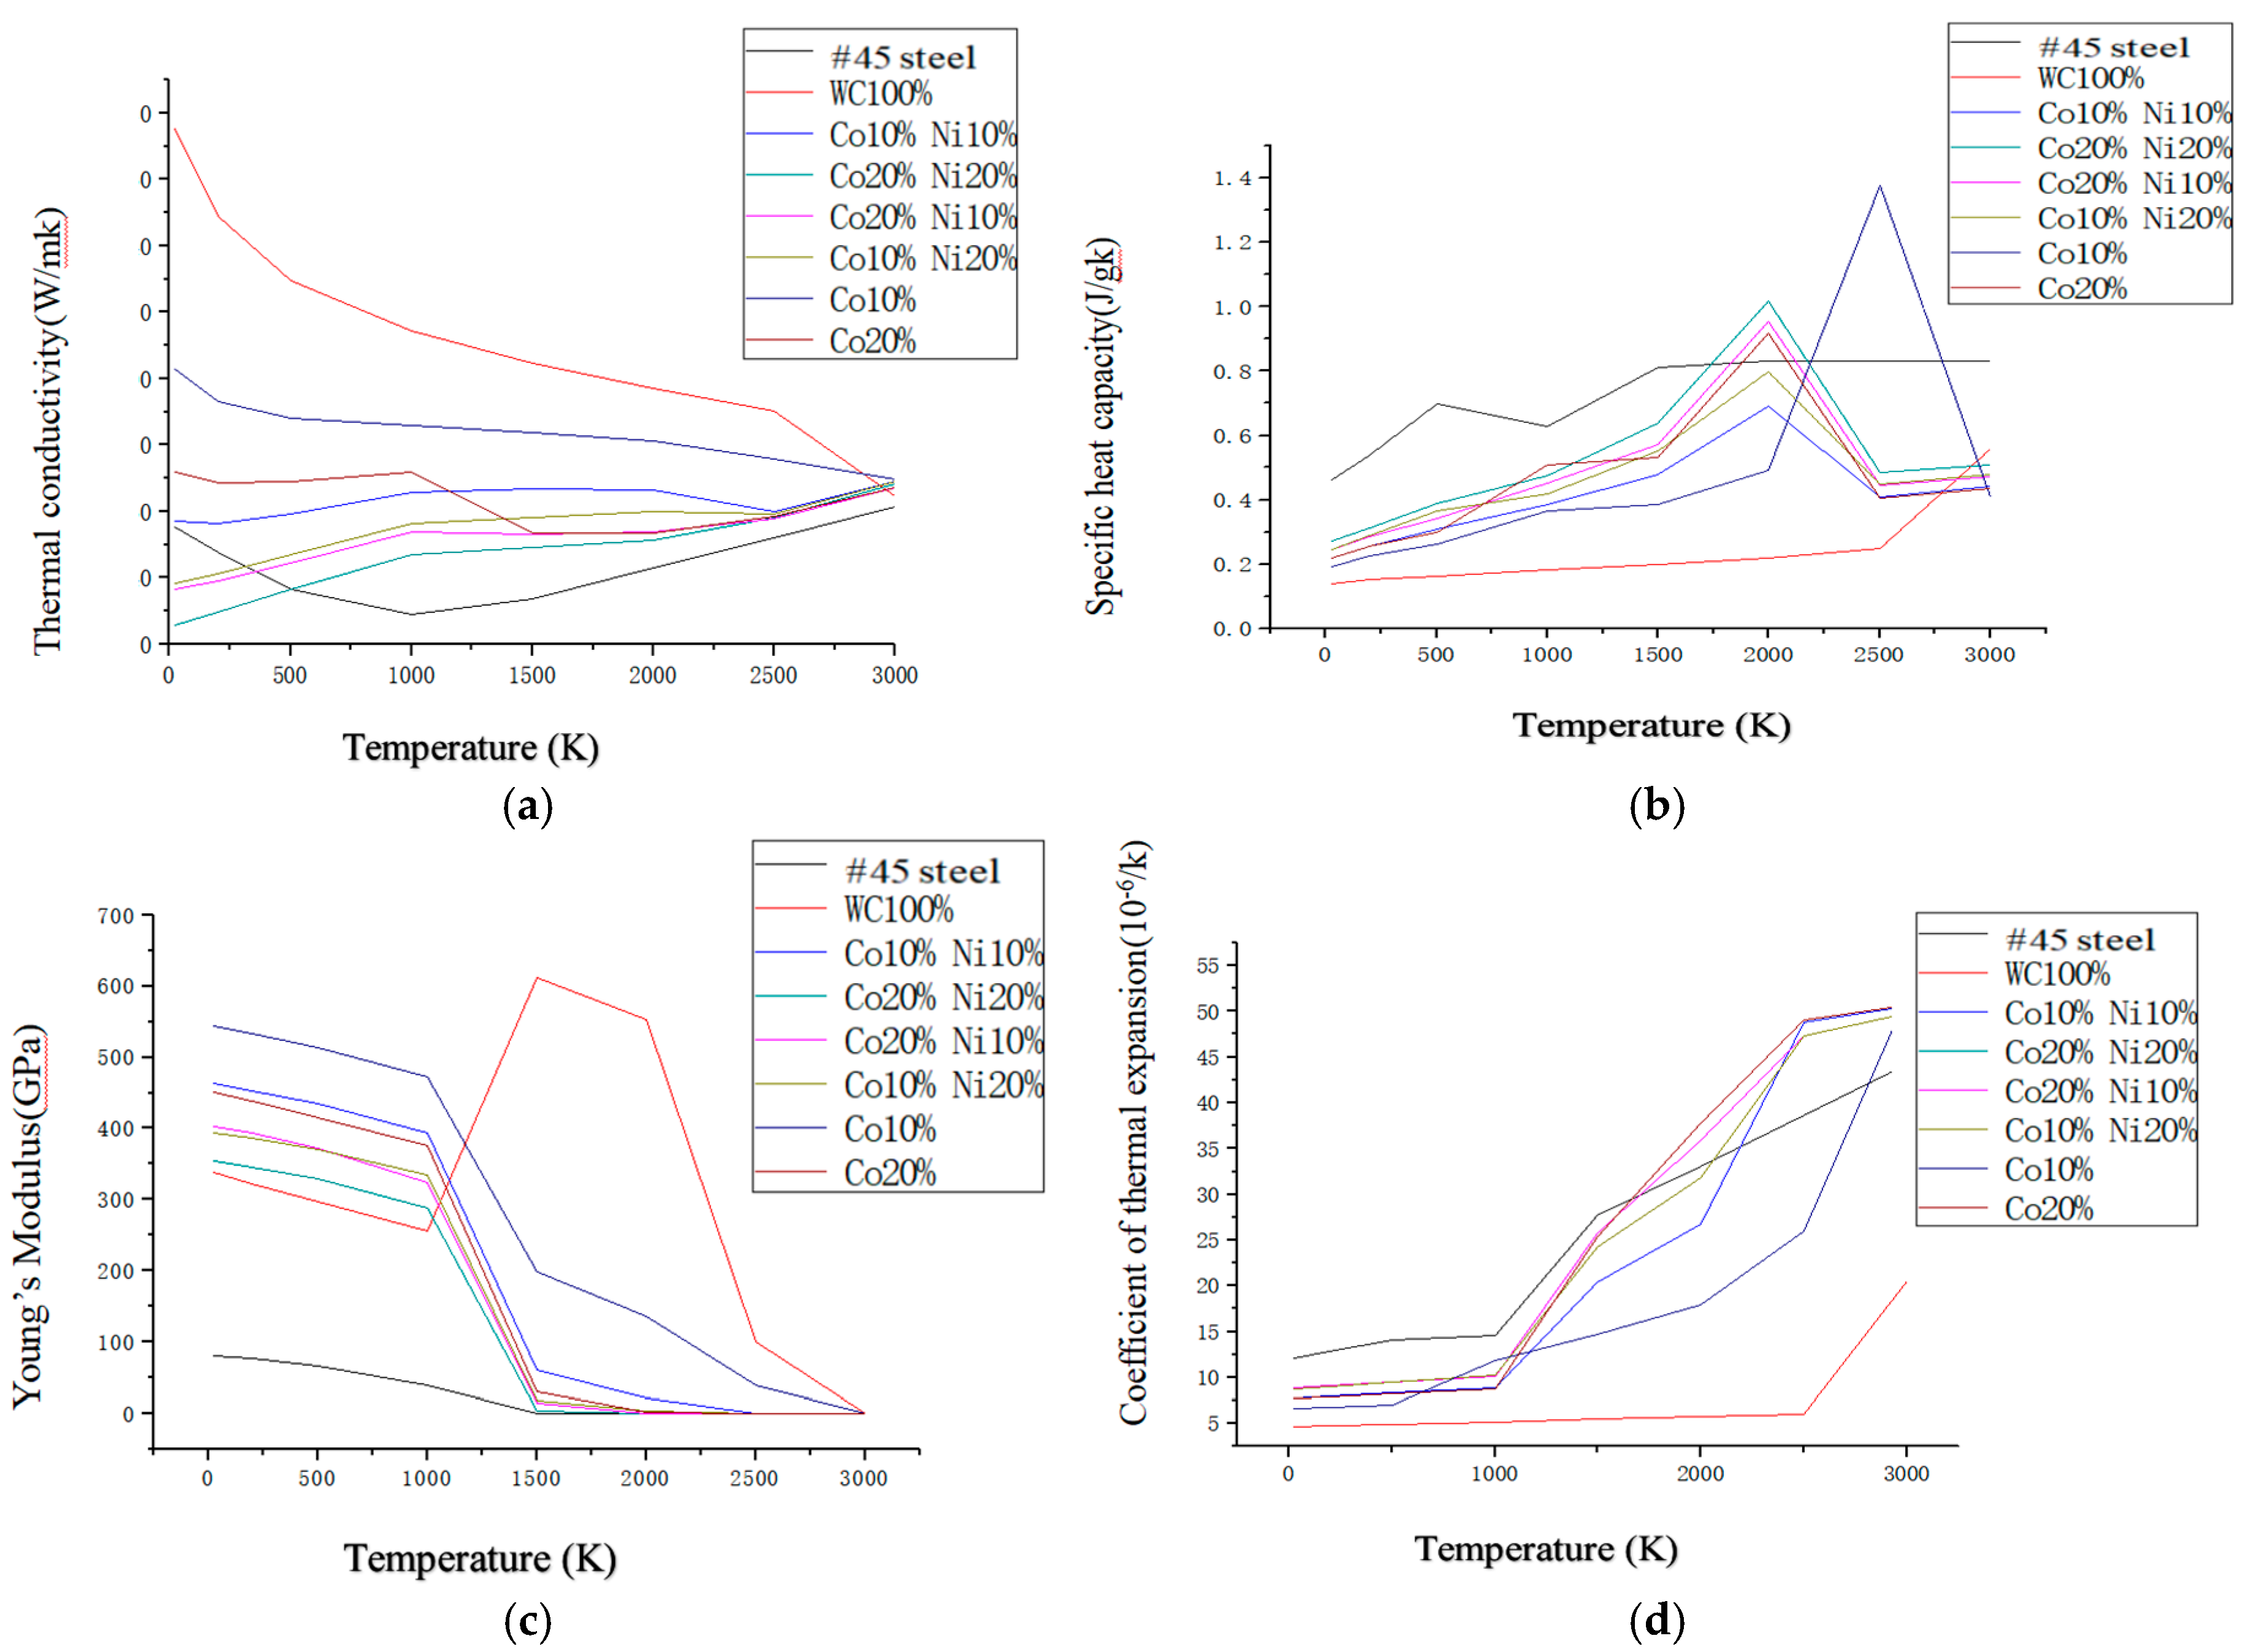
Figure 4.
The cells activated at t1 sec to be loaded with the laser heat source.
2.3. Response Surface Methodology
In this study, many controlling factors are involved in the residual stresses in WC/Co/Ni welds during laser cladding as shown in Table 1. Therefore, RSM was used as an alternative method to analyse the properties of residual stresses, which is performed based on the RSM developed by Taguchi[40]. An ANOVA table containing quadratic terms was created based on regression function was created. The detailed statistical analyses were carried out using the SPSS 22 software package. A quadratic polynomial model was defined to fit the response to the following questions. The quadratic model of the stress response, Y, with the independent variable, X is shown in Eq.(4):
where Y is the predicted response: residual stress. a0 is the is constant coefficient, a1, a2,a3 and a4 are linear effects, and a11, a22,a33, and a44 are quadratic effects, a12, a13,a14, a23,a24, and a34 are interaction effects. X1, X2, X3, and X4 are study factors.
3. Experimental Results and Discussion
3.1. Validation of Models in Finite Element Analysis
To establish that a simulation model was available, a series of simulations were carried out using various physical parameters detailed in Figure 3, in which the simulated stress results were compared with the experimental data. Due to the accurate modelling of the heat of the coatings during the laser process, the model is able to calculate reliable predictions of the thermal stresses by forming a temperature gradient in the resulting thermal cycle according to the above Eqs. 2-3. Figure 5a shows a detailed schematic of the profiles of the molten pool that were measured by the simulation model. Trial 9 of the group of 18 shown in Table 1 is an example chosen for comparison purposes, illustrating the behaviour of a typical molten pool under the conditions.The results show that the melt pool is in the shape of a comet with an elliptical front and a stretched tail, indicating a wide front and narrow front of the melt pool width. The figure shows one of the 18 sets of simulation results in this study and a typical example of temperature change during the movement of the heat source in the experiment, which can be used as a case study for the experimental confirmation of the model. A localized enlargement of the molten pool is shown in Figure 5b, where the width of the simulated molten pool is compared with the actual weld of the laser weld. Three-dimensional modeling of the laser cladding process using a Gaussian- distributed heat source yields cladding shapes that are in good agreement with experimental results for weld beads.
3.2. Validation of Temperature Field in Finite Element Analysis
The simulation was carried out using the process parameters of trial 5 in Table 1, similar to the study of Zhirnov et al [51]. This is shown in Figure 6 for 1s, 10s and 20s along the direction of the laser beam. It can be seen that the temperature rises extremely rapidly and reaches a maximum temperature of about 3478 K, 3801 K and 4779 K, respectively, above the melting point at which WC(Co,Ni) and #45 steel melt together by photoimpact, leading to the formation of a molten pool. The molten pool is ellipsoidal, in which the highest temperature occurs behind the center of the molten pool. In the early stage of cladding, the flow rate of the melt pool is low, and the energy transfer in the melt pool is by heat conduction. While with the progress of cladding, the molten metal in the molten pool is mainly convected by heat. Figure 6a–c show the temperature field distribution at different times, and the order of melting is from top to bottom. Figure 6a shows the temperature field distribution at the beginning of the melting for 1 second, in which the temperature field is in the front half elliptic shape like a comet; Figure 6b shows the distribution of the temperature field at 10 seconds after the laser travelled forward, and the temperature field is a large ellipsoid like a zucchini bag that is dragged backward, and the maximum temperature of the dark green area inside the bag (3801K) is compared with the minimum temperature of the light green area (894K). The WC(Co,Ni) in the light source area has been melted, and the temperature difference between the melting area in the gourd bag is very large and decreases rapidly. Figure 6c shows the distribution of the temperature field at 20 seconds after the coating is finished, the temperature field is in the shape of a back-dragging partial ellipse, and the temperature field of the ellipse is symmetrical to the centre of the spot. In addition, Figure 6d shows the distribution of 2D temperature field at 10 seconds. It can be seen that the temperature in the middle of the workpiece is higher than that in the surrounding area to form a closed ring, the red zone is larger than 4439K, the average temperature in the light green zone is 1788K and the average temperature in the dark green zone is 897K, which show that the temperature field in the unstable state, i.e., the cladding layer is rapid cooling phenomenon. As shown in Figure 6e, the temperature change process along the direction of the weld bead changes drastically with the time 1s, 10s and 20s, while the temperature of the three changes exceeds the melting point of the substrate at 750K. Based on the welding order, the maximum temperature of the curve increases gradually from the green line to the pink line and then to the red line. When the laser spot enters the green, pink and red lines, respectively, the temperature of each increases rapidly. When the laser spot moves out, the temperature decreases rapidly. The pattern is apparently consistent. It can be seen that the laser cladding process is a rapidly heating and cooling behaviour. This is mainly due to the heat build-up of the material as it continues to absorb the laser input. In addition, it can be seen that the node temperature decreases steadily until it approaches 1000K, which is mainly due to the phase transformation of the liquid metal as it solidifies slowly, thus causing the overall temperature to change relatively slowly. Whilst heating is forced during the warming process, the trend is less pronounced. Figure 6f shows the temperature-time curves perpendicular to the direction of the melting track. The temperature profiles at 1s, 10s and 20s respectively are consistent. The maximum temperature at 1s (green) is much larger than that at 10s (pink) and 20s (red). It can be seen that when the laser heat source passes through the surface and the inner (vertical) layer at the location of the node, the temperature reaches the maximum value, which is 3800K, 800K and 400Krespectively. As the heat source gets closer to the surface of the coating, the temperature rises. This is mainly due to the fact that the energy of the heat source on the upper surface is more concentrated and relatively more energy is absorbed. The temperature at the surface is higher than the melting point, while the temperature underneath is lower than the melting point, indicating partial melting of the powder along the thickness. These may give an insight into the properties of the melt pool, the heat affected zone and the substrate in the cladding. However, the temperature distributions at the three selected points (A, B, and C) are similar to each other, while the temperature increase rate is slightly higher than the temperature decrease rate.
3.3. Evaluation of Residual Stress
Due to the nature of the coatings produced by the laser process, including high thermal gradients coupled with high cycles of melting and solidification, the generation of residual stresses is inevitable. To analyse the formation of residual stresses, we have carried out single-track simulations using the conditions of trial 1, based on model validation of the maximum temperature and melt pool size. Figure 7a shows the stress distribution of the model at different positions (A, B and C) along the z-axis welding bead. The stresses at position A of the welding zone are shown in the upper right corner of the model, and the stresses at positions B and C are shown in the following order. It can be seen that the red area of the welding bead along the z-axis is more stressful. Various positions of the z-axis are modelled to show the stress distribution when the melt is cooled down to room temperature. It can be seen that the red area of the welding bead along the z-axis is more stressful. This is because the material is heated by the laser along its path (z-axis), which results in the expansion of the material. The values of their stresses range from 162-183MPa, 176-198MPa and 168-189MPa respectively. In addition, the areas on both sides of the z axis show rings of green and dark green, which have the values of 20.3-60.9 MPa, 22-66 MPa and 21-63 MPa respectively. A comparison of the above results shows that the residual stresses along the z-axis (laser scanning direction) are more noticeable than in the other two directions. However, the red area that was heated by the laser is rapidly cooled and contracted when the laser is moved forward, which generates high stress. This is mainly due to the fact that the xy-direction of the material is limited by the surrounding cooler material, so it is not free to expand or contract. Due to the influence of the laser movement, it leads to higher stresses in the z-direction. The x and y directions, on the other hand, are not directly affected by the rapid heating and cooling of the laser beam. As a result, they have less thermal expansion and contraction compared to the z-axis. Accordingly, the residual stresses along the xy-axis are less. To further validate the model of residual stresses, the surface of the cladding was examined for residual stresses using an IXRD type apparatus for residual stress measurement.The surface residual stresses of trial 1, determined by X-ray diffraction, were measured for three different combinations of WC(Co,Ni) components, as shown in Figure 8a,b. Figure 8a shows the X-ray diffraction results of one of the measured peaks fitted to a Gaussian function. Through the fitting operation of the measured peak, it could accurately extract the information of various parameters related to this peak Figure 8b shows the residual stresses derived from the slope of the plot of lattice distance spacing(d-spacing) versus sin2ψ for five diffraction anglesψ. Further calculations and analyses of these parameters by means of Figure 8b make it possible to derive a numerical value of the residual stress in the material, thereby enabling an accurate calculation of the residual stress on the surface of WC(Co,Ni). The values of 196 MPa were measured as mentioned above. The three predicted values of A, B and C for WC(Co,Ni) after modelling in this study are 189MPa, 183MPa and 198MPa, respectively, which mean value is 190MPa.The results above show that the simulated values of the model are very similar to the experimental values. Therefore, the proposed model is reliable.
3.4. Evolution of Microstructure in the WC(Co,Ni) Welds
As shown in Figure 9, the structural features of the Co/Ni added WC weld are shown in SEM, which shows the etched structure of the weld as well as the microstructural evolution of the WC composite material. Also, a cross-section of the weld bead is shown in the upper left of Figure 9. The resulting cross-section shows a highlighted WC/Ni/Co deposit, which shows the molten zone, the heat-affected zone, and the zone of the substrate. Figure 9a shows trial 7 of Table 1, which is the morphology of the 20%Co+80% WC melt pool. It exhibits a large mass of dissolved white carbides surrounded by a large portion of fine, elongated carbide structures. The microstructure consists mainly of tungsten carbide-rich blocky and dendritic solid solutions, with metallurgical defects and some unmelted tungsten carbide particles. In addition, Table 2 shows the EDS of three different locations (A, B and C) of the WC mixture in Figure 9 which is labeled as WC, Co and Ni atoms. There are highly unmelted tungsten carbide particles in the melt pool region, which has 94.43% W in region A. The surrounding area of highly hard tungsten carbide particles that have high stress concentrations is likely to lead to the growth of cracks during the rapid solidification process. Some pores can be seen in the upper left section of the melt pool in trial 7. This is related to the fact that these pores contribute to stress release, in addition, the melt in the B and C regions contains close to 0.25% Co particles in the melt pool region. This is due to the good wettability of the molten Co based alloy which appears to wet the carbide particles in this region. As mentioned above, it is known that the porosity and wettability of carbide grains can inhibit cracking[22], thus reducing the possibility of cracking. In trial 9, white carbides with some large particles, eutectic small massive carbides and gray oxides were detected. As shown in the WC/Co/Ni weld in the upper left of Figure 9b, the white WC particles in the melting zone of trial 9 were uniformly distributed. No pores or cracks were found in the cross-sectional image of the coatings . There is a low degree of dilution, good metallurgical bonding and few metallurgical defects. The microstructure of the weld by laser cladding is shown in Figure 9b, where a large number of white carbides can be seen, such as region A, leaf-like carbides such as region B and grey areas such as region C. As shown in Table 2 in area A, the massive carbide is rich in C, Co and Ni, in which the contents of C, Co and Ni are much less, while the content of W is much more than the others, which was 88.85%. Most of the grey areas in Zone B contain turbid gray oxides and coarse particles of molten tungsten carbide, which are less W but more O and Fe. They are much fewer than 25% W, 32.08% Co and 27.92% Ni, which are clearly visible. The effect of cobalt-nickel/base alloys on stress is greater than that of WC. The C region precipitates carbides in the shape of leaves, which contain more Co and Ni elements, that solidify to form M(Co,Ni)6C, M(Co,Ni)12C and M(Co,Ni)7C3 compounds, thereby inhibiting crack initiation and reducing susceptibility to cracking. Overall, there is a high stress generation in this region with a value of 265.21 MPa, but no cracks existed. This is mainly due to the fact that the compounds in this region are resistant to crack initiation thereby reducing the susceptibility to cracking. As shown in Figure 9c, the observation of the cross-section at the upper left in trial 14 shows that the tungsten carbide particles were almost completely melted. The melted tungsten carbide was found to be loose with a small amount of dendritic carbide in area A. The EDS corresponding to Table 2 shows 89.98% W, 11.11% Co, and 11.95% Ni, with a small amount of C, O, and Fe elements. These structures may be due to the melting of cobalt/nickel in tungsten carbide since they are the binding phase of tungsten carbide-based cemented carbides. The networked white carbides of the B-area are rich in 4.09% C, 33.36% Fe and 5.98% O, 11.49% Co, and 6.49% Ni content. They also contain a significant amount of 38.02%W. Similarly, the carbide content in zone C is similar to that in zone B. Only W decreases to 30.01%, while Ni increases to 9.6%. It exhibits a lower stress of 96.32 MPa. This is mainly due to the active diffusion of Co and Ni atoms in the molten state, which significantly affects the crystallization process of WC, resulting in the formation of a network-like structure of WC. As shown in the upper left weld in trial17 of Figure 9d, the structure of the welded bead is uniformly distributed with white particles in the melting zone. Zone A contains coarse particles of finely melted WC, which appear loosely structured to be clearly visible at a W value of 91.86%, but there are a small number of Co and Ni approximation near 2.5%. The distribution of W is 84% in region B, where the smaller clustered carbides approximate the structure of A. The W is reduced only by 3.46% Ni and 9.02% Co. The melting zone shows a decrease in W while the 9.02% Co element increases considerably. Based on the results of the EDS in area C, the W in the weld bead is minimal among the three areas, which is about 46.27%. Meanwhile, the content of O (oxygen) in the weld reaches 12.66% and Co (Cobalt) is 28.9%, which shows a sharp increase in the content of these two elements. In contrast, the increase in Ni (Nickel) and C (Carbon) in the weld beads is relatively small. The effect of Ni-based alloys on WC is likely to be less than that of Co-based alloys. It has higher stress of 261.36MPa, but no cracks were generated. This may be due to the favorable Co and Ni ratios, which form new carbide phases that can affect the interfacial properties between WC and the binder phase that enhances the binding force between them while inhibiting the growth of cracks.
3.5. Effect of Control Factors on Residual Stress Properties
The experimental results were analyzed by analysis of variance (ANOVA) with respect to the sources of variation of residual stress in wc(Co,Ni) coatings. Based on ANOVA, it was determined which factors were most important for the residual stress. Therefore, these important factors can be monitored very carefully in the simulated results of residual stress in order to obtain robust results. As shown in Table 3, the important control factors include preheated temperature (D), laser power (E), defocusing depth (G) and flowrate of shielding gas (H). The secondary control factors are (A) substrate, (B) rate of Co%, (C) rate of Ni%, and (F) scanning speed, which exhibit much weaker effects on the variance.A pparently, the largest contributor to the residual stress characteristics is laser power at 66.21%, followed by preheated temperature at 12.07%, defocusing depth at 6.47%, and the flow rate of shielding gas at 5.74, which account for 90.49% of the total.As a result, these four parameters are representative of all parameters that can be used for further in-depth analysis of the residual stress. The above-mentioned important parameters are further analyzed by the response surface methodology.
3.6. Construction of Empirical Models
Table 1 shows the parametric design and observed responses based on Taguchi's design, which shows the residual stress response of the laser-melted weld. The important parameters of preheating temperature (D), laser power (E), defocusing depth (G) and flowrate of shieling gas (H) based on the ANOVA in Taguchi's design were included in the regression analysis of the residual stress by laser cladding. SPSS22 was used to construct and analyse the experimental data for this design, which makes use of regression modelling. Table 1 presents the design variable representations in natural units. A model containing a quadratic term has been used in the response surface methodology.
Y=-563.727121-0.756609D-0.175676E-22.983093G+1.372029H+0.000320DE-0.014414DG-0.000043DH+0.006460EG+0.000047EH + 0.013667GH+0.001872D2+ 0.000031E2- 0.194505G2- 0.000542H2 Adjust R2=0.841
Three important parameters such as preheated temperature, laser power, defocusing depth and flowrate of shielding gas were selected based on Table 1 after ANOVA of Taguchi's design. The experimental data were fitted using the above model.The fitting equation of the RSM model was calculated using Eq. 3, while the residual stresses were determined using Eq. 7. Based on the ANOVA results as shown in Table 4, the linear model, quadratic model and the interaction model showed that all the three models were very significant with ‘Prob > F’ values of 0.0000508, 0.004006 and 0.00621 respectively, which is less than 0.05, i.e. ‘Prob > F’, indicating that the interaction regression model is significant. In addition, the adjusted R2 values of the regression coefficient of determination for the linear, interaction and quadratic models were 0.779, 0.822 and 0.841, respectively. However, the higher values of the adjusted coefficient of determination for the quadratic model suggest that there is higher significance for these models. In Table 4, the fitting statistics of the selected quadratic prediction model for residual stress (Y) are presented. An analysis of variance through the ANOVA coefficient (R2 = 0.841) indicated that only 15.8% of the total variance could not be explained by the model, which indicated good agreement between the experimental and predicted values of residual stress yield. By performing multiple regression analysis on the experimental data, the relationship between the response variable and the test variable is shown in Eq.7. Its coefficient of regression is on the left side of the Table 5. Based on the information obtained above, a secondary model was successfully constructed on the basis of the regression model. Furthermore, a three-contour model of the residual stress behavior was further explored.
3.7. Effects of Variables on Modeling of Residual Stresses
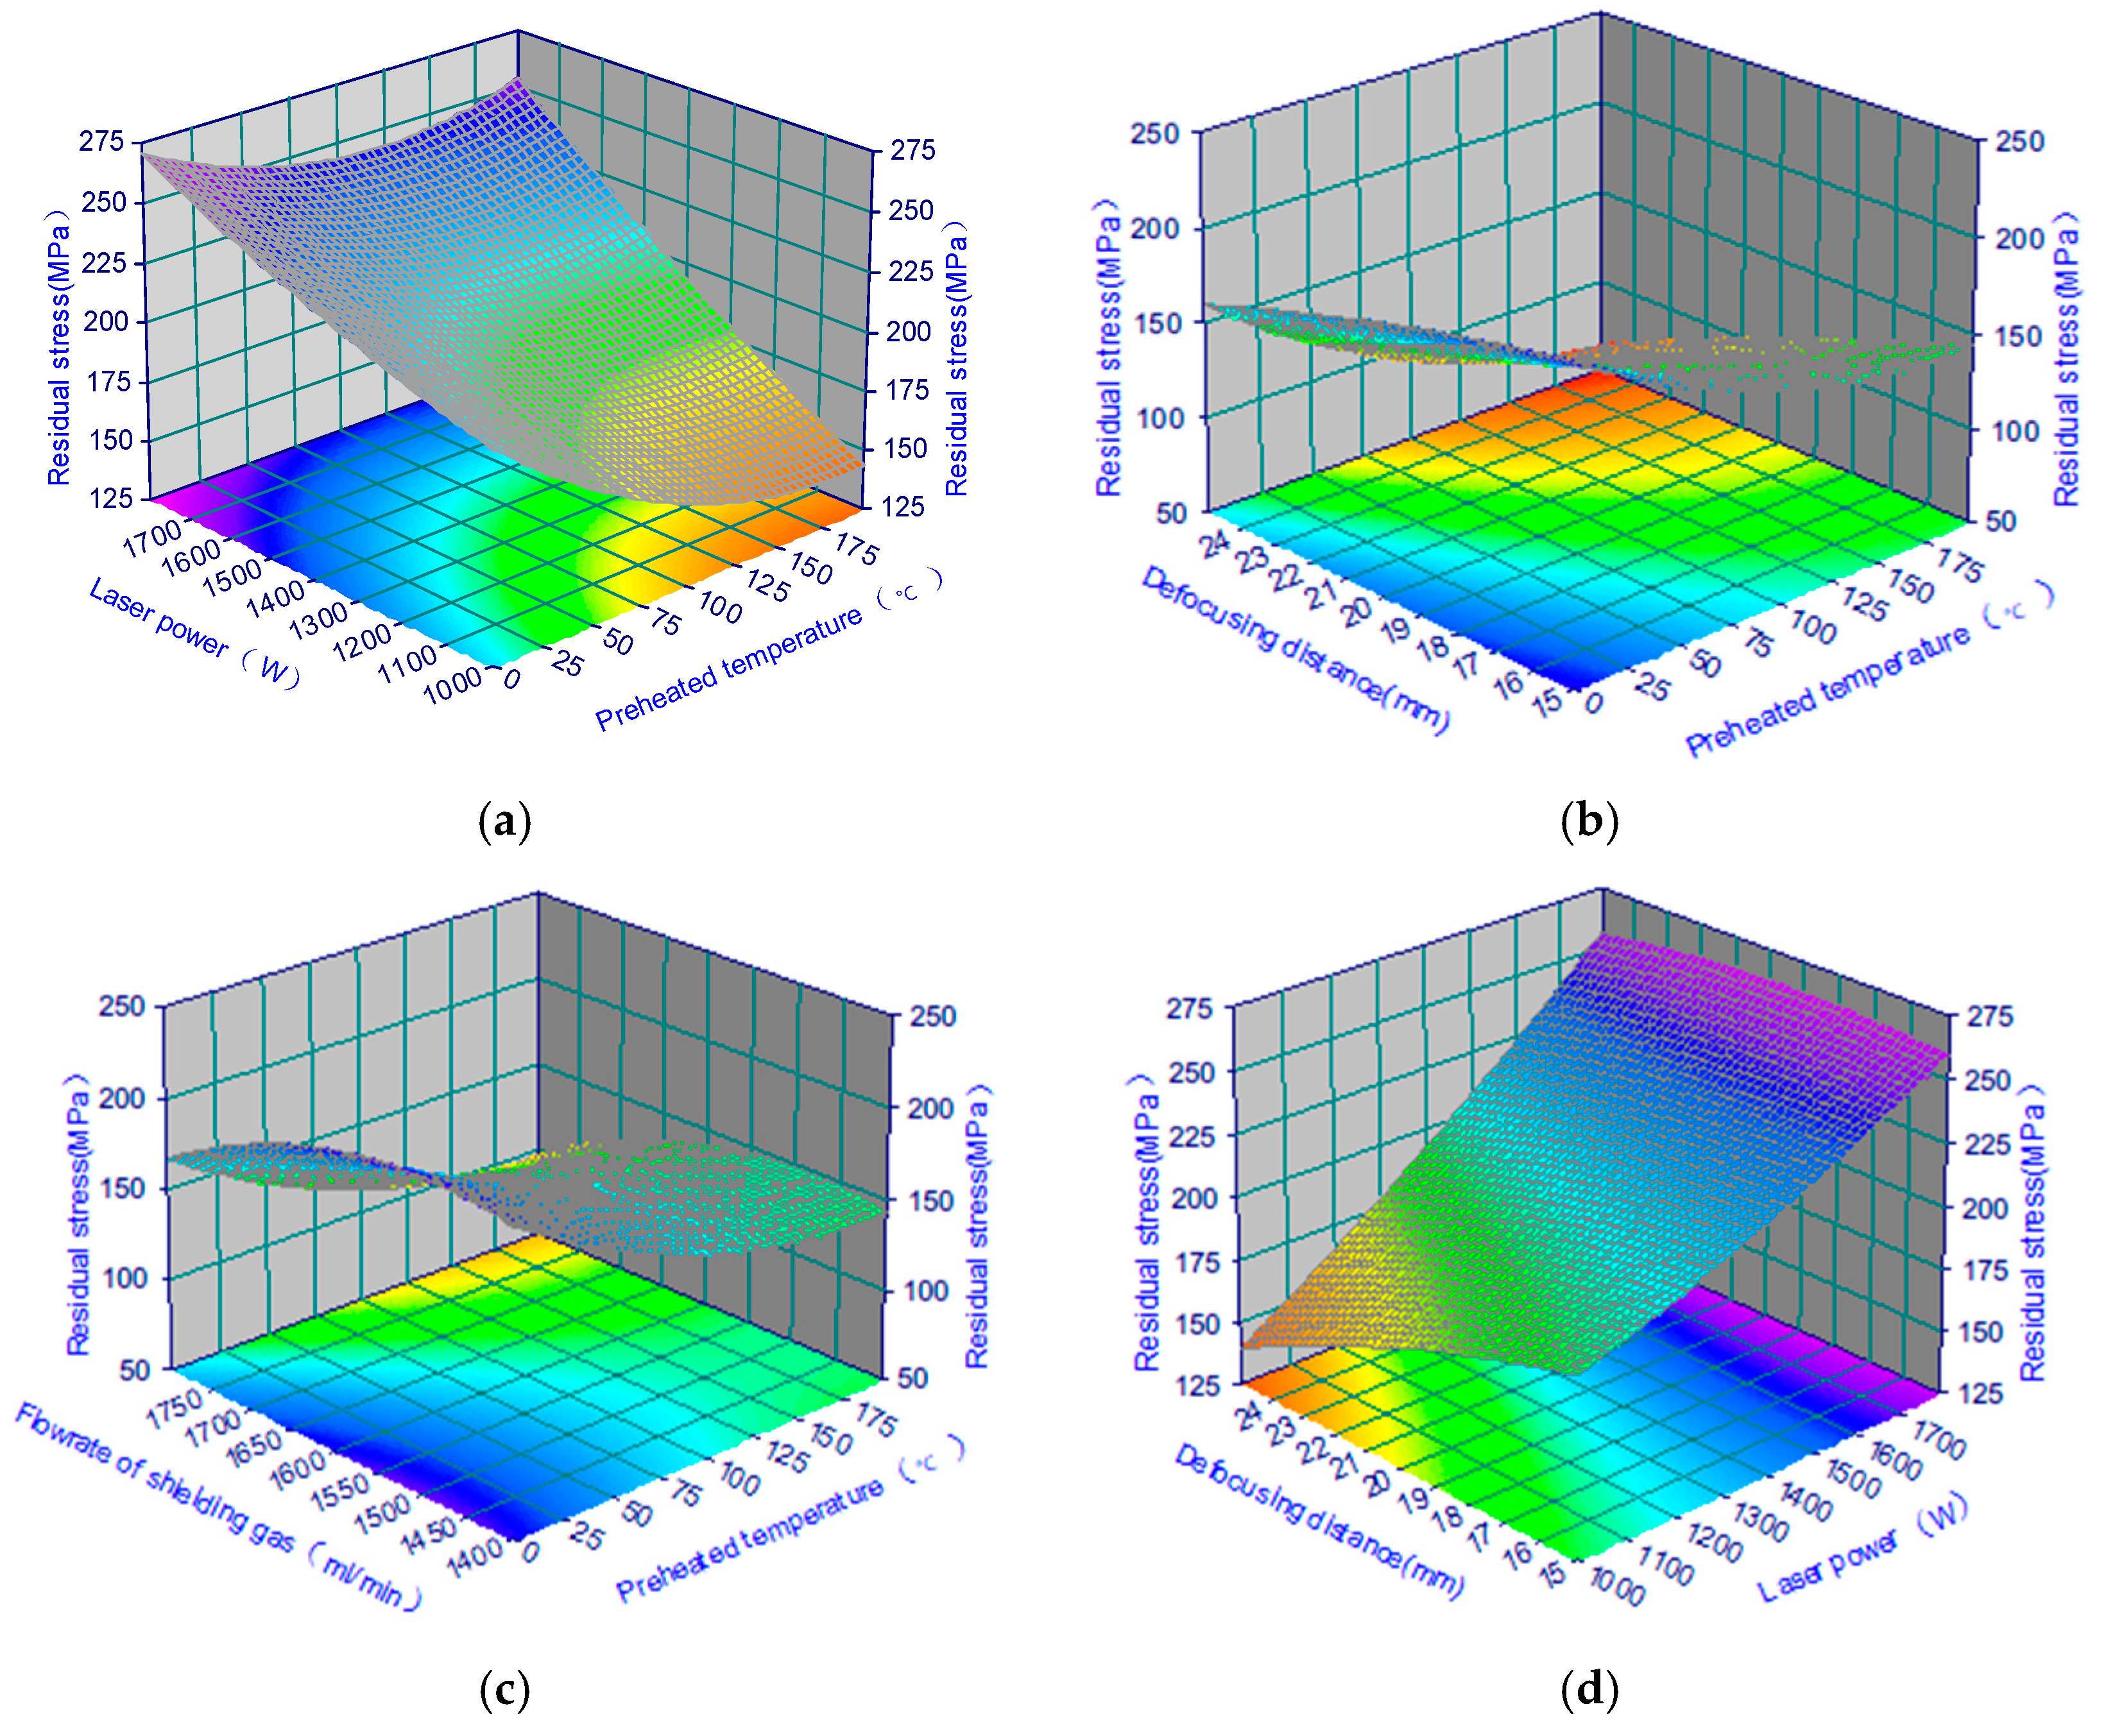
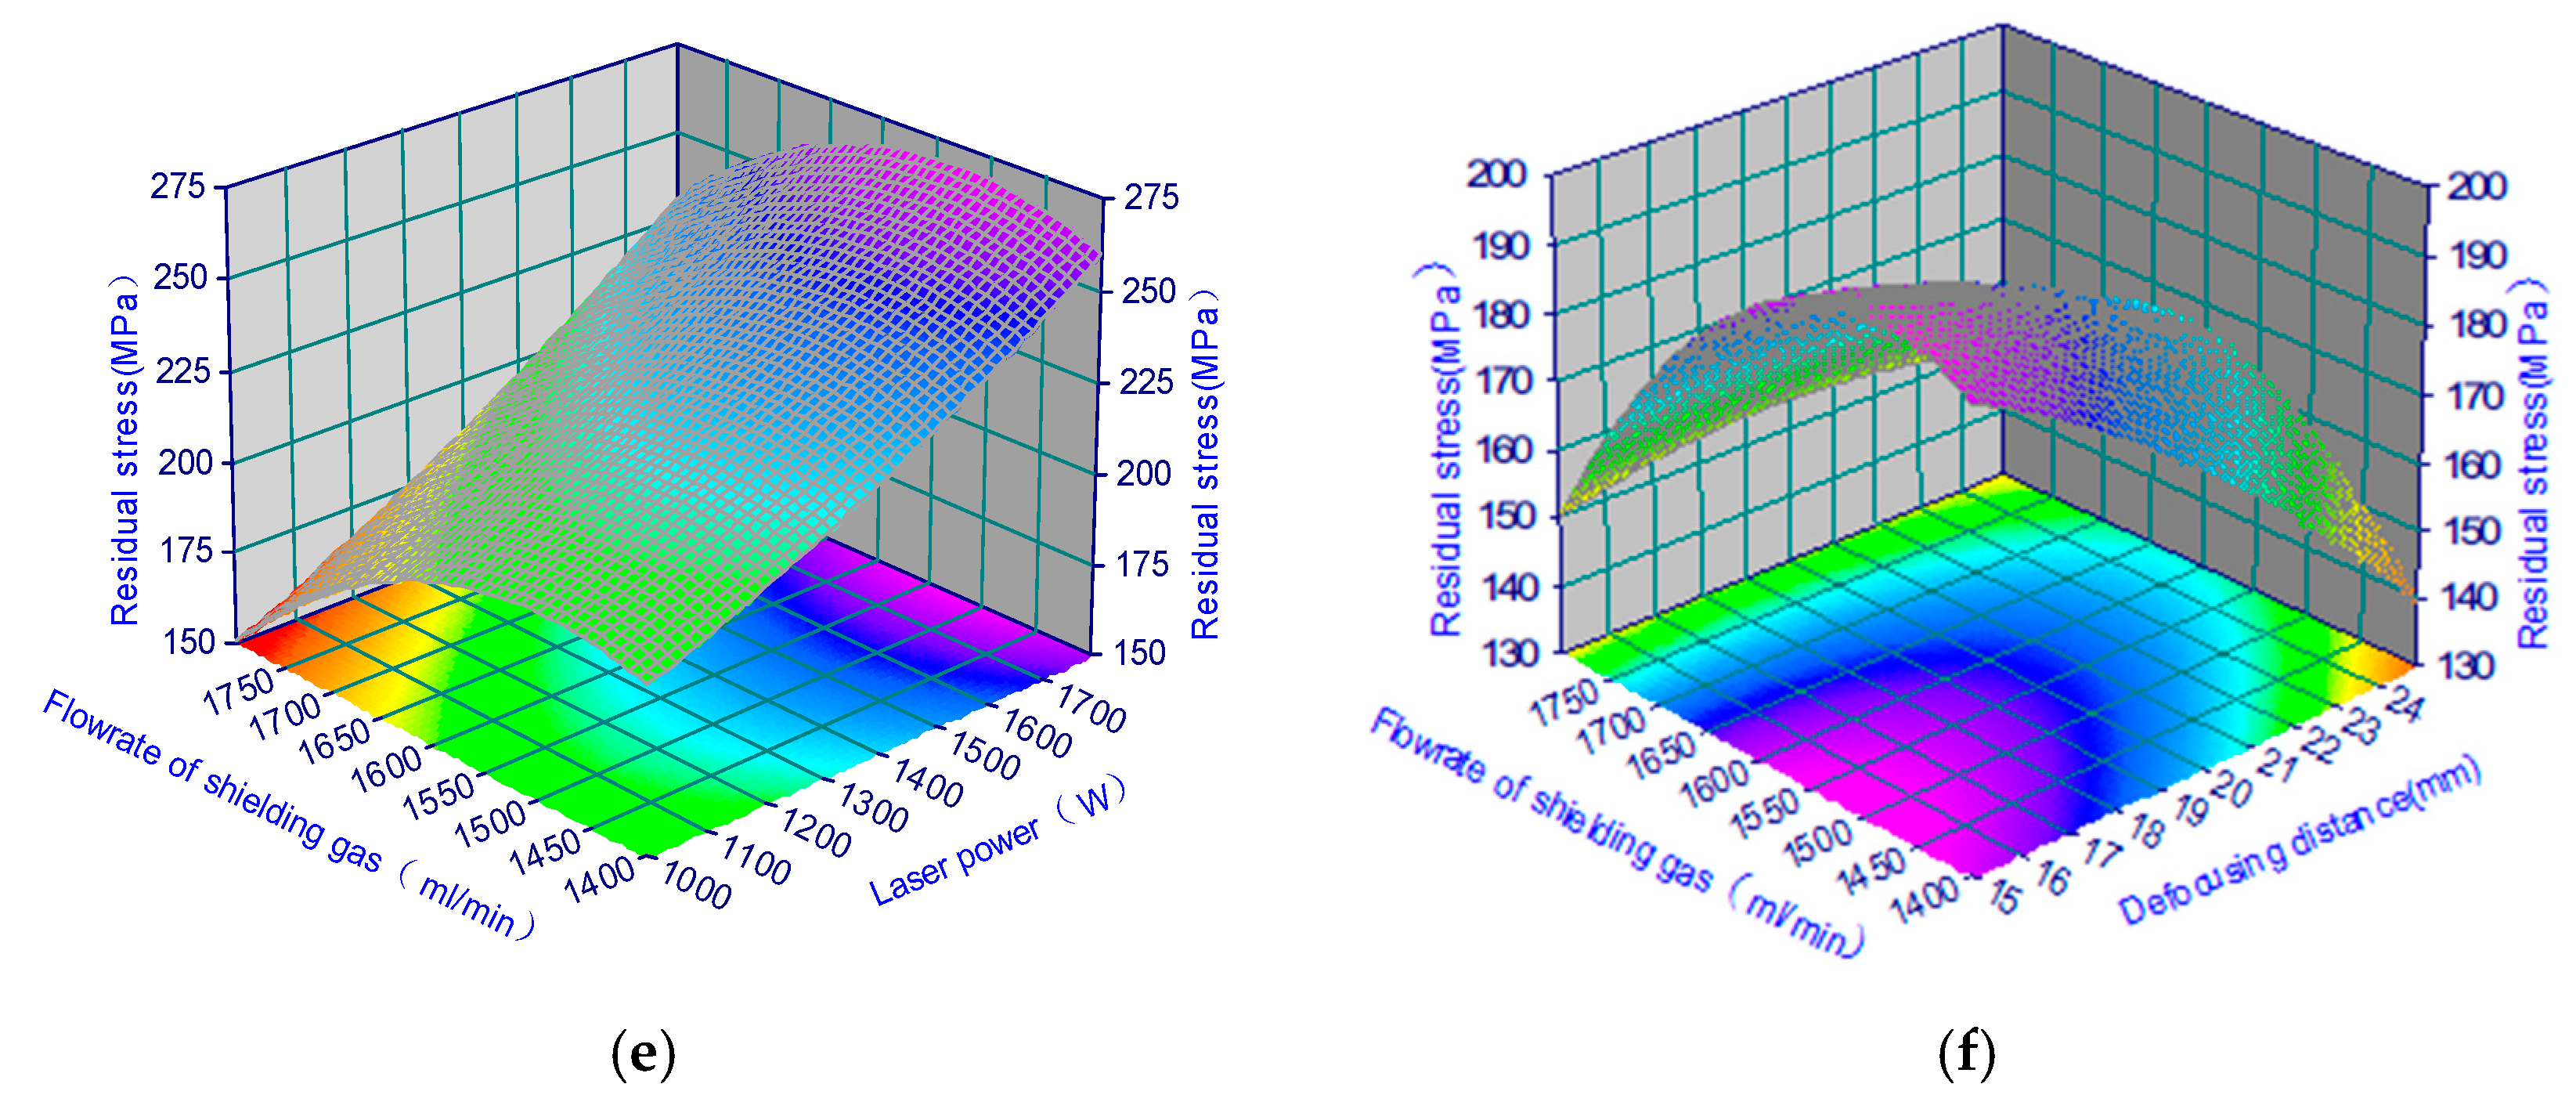
To more readily understand the behavior of the residual stresses in the WC/Co/Ni deposits, three-dimensional plots of the second-order functions used in Eq.6 need to be illustrated. The second-order function is shown in Figure 10, which displays a three- dimensional contour plot of the response surface of the residual stress yield under the significant control factors, which were selected by an analysis of variance (ANOVA) for the four significant parameters.The contour plots of the quadratic model are shown in Figure 10, where two of the variables are kept at fixed values at low levels while the other two variables are varied within the experimental domain.The shape of the contours of the 3D plots of the second-order functions nearly approximates the contours of the saddle-shaped patterns. The contour of the three dimensional graph of quadratic function approximates to the shape of saddle contour. In Figure 10, all of the plots are in the saddle-shaped pattern, which indicates that there is a significant interaction between the variables.The effect of pre-heated temperature and laser power on the residual stress is shown in a rough graph in Figure 10a. The results show that an increase in laser power has a significant effect on the increase in residual stress when the preheated temperature is in the range of 25-200°C. It is also shown that the WC results in less residual stress in the cladding zone when the preheated temperature reaches 200 °C at the lower power of 1000 W. The saddle contour in Figure 4b shows that the residual stress on the surface of the coating appears to be smaller in the pink area if the defocusing distance is 25 mm and the preheated temperature is 200°C. As mentioned above, the laser power is an important factor affecting the residual stress which needs to be properly controlled. The pattern in Figure 4c is similar to that in Figure 4b, with the residual stress fluctuating between 100 MPa and 150 MPa. Its contour plot is a saddle pattern.As described above, the residual stress in Figure 4c has a lighter pink area in the upper left corner of the 2D than that in Figure 4b, indicating that Figure 4c has a higher degree of stress behaviour.As shown in the 3D saddle contour plot in Figure 4d, the effect of laser power on residual stress is remarkably increased from 130 MPa to 260 MPa when the defocusing distance is stayed in the range of 15-25 mm. In short, defocusing distance influences the residual stress much less than the laser power. Clearly, the pink area in the picture has smaller residual stress. Likewise, the residual stress is about 140MPa for a defocusing distance of 25mm and a laser power of 1400W. Figure 4e shows a three-dimensional photograph and a two-dimensional contour plot of the saddle pattern for residual stress as a function of laser power and shielding gas flow rate. The pattern in Figure 4e is similar to that in Figure 4d, where the residual stress decreases from 275 MPa to 150 MPa when the shielding gas flow rate is from 1400 (ml/min) to 1800 (ml/min). Figure 4f shows the effect of defocusing distance and flowrate of shielding gas on the residual stress. When the defocusing distance varies from 15 to 25 mm, the flowrate of shielding gas has a significant effect on the residual stress while the residual stress fluctuates greatly. The graph shows that flowrate of shielding gas at 1600 (ml/min), the residual stress is higher. However, the graph shows a saddle shape, with high stress values in the middle and low stress values on both sides. Overall, laser power and flowrate of shielding gas have a greater effect on residual stress than preheated temperature and defocusing distance, which agrees well with the results in Table 6. In this study, contour maps were utilized to find the best areas in the 3D images, and these maps clearly show the relationship between the residual stress and the key factors. In addition, it provides useful information about the cracks generated in the coating.
Figure 10.
Contour plots of the effect on residual stress for the second order model. (a) The surface plot of preheated temperature and laser power on residual stress.(b) The graph of preheated temperature and defocusing distance on residual stress in the WC(Co,Ni) welds.(c)Surface plane plot of residual stress in the preheated temperature and flowrate of shielding gas.(d)Surface plot of residual stress in the defocusing distance and laser power. (e) The effect of the flowrate of shielding gas and laser power on residual stress.(f) Saddle contour plots in the flowrate of shielding gas and defocusing distance on residual stress.
3.8. Analysis of Model Confirmation Experiments
The prediction of the performance by the parameters provided by the model validates the validity of the model. A better understanding of the effect of the parameters on the residual stress behaviour is provided. The model was analyzed by ANOVA as shown in Table 3, where four significant factors including preheated temperature, laser power, defocusing distance and flowrate of shielding gas were selected due to the fact that the four factors contributed 90.49% of the total. These factors were applied to build the model while making model predictions. Both the experimental and quadratic model predictions were compared in terms of validating the predictive ability of the model. Figure 11 shows the distributions of the experimental and predicted patterns. It also shows the resulting errors in the predictions of the quadratic model. A comparison of all the experiments was made. The results showed that the predictions were closer to the experimental values in most cases, except for trials 4, 9, 12 and 13 where the errors were more than 10%, indicating that the model was reliable.There are, however, smooth fluctuations in the distribution of prediction errors for the quadratic model. The predictive errors of the model are not more than twice the standard deviation of the experimental values.This implies that the predicted values are remarkably closer to the experimental values, which suggests that the model is to be trusted. In addition, As the above graph shows, the preheated temperature of 200℃, the laser power of 1000W, the defocusing distance of 25mm and the flowrate of shielding gas of 1800ml/min make it possible to obtain the lower residual stress, which is about 108MPa. It is confirmed three times, 109MPa, 97MPa, 112MPa, whose average value is 106MPa. It showed to be reliable. Consequently, it can be drawn that the quadratic model developed can effectively forecast the residual stress behavior of laser-coated WC(Co,Ni ) welds.
5. Concluding Remarks
In this study, a thermal coupling model based on finite element analysis was developed by laser cladding of WC(Co,Ni) welds. By applying the APDL language of ANSYS software to write the program, the model of finite element calculation is established using meshing technology that gives a fine mesh near the weld area. The Gaussian distribution of the welding heat source can be applied to simulate the temperature field. The welding stresses can be further calculated by using the finite element analysis.The following conclusions are drawn from this study:
- The temperature field and stress field of the coating were investigated by the simulation based on finite element analysis. The temperature field of WC(Co,Ni) alloy by laser cladding is a dynamical temperature field, which has the same thermal cycling curves at each node, only the sequence of time is different.
- Using the parametric design language of ANSYS software, a model of laser melting WC(Co,Ni) welds with continuous loading of a moving laser spot was established. Through this model, the distribution pattern of the temperature field and stress field can be derived during solidification by laser coaxial powders.
- The white areas of the WC(Co,Ni) melting zone are dominated by carbides with more than 80% of W while the C is about 1.5-3.0%. In addition, the large area of the melting zone is composed of dendritic, strip-like, leaf-like, net-like, and smaller clustered carbides, while the grey area is composed of WC,Co and Ni compounds.
- The ANOVA results based on the experimental design showed that the effects of the four variables on residual stress were very significant. Among them, the factors including preheated temperature, laser power, defocusing distance and the flow rate of shielding gas exhibited notable effects, which accounted for 90.46% of the total variance.
- The relationship between the parameters and the residual stresses was established by applying the response surface methodology. By optimizing the design and using RSM model, the residual stress performance of the coating was improved.
- A comparison of all the experiments showed that the average error of the quadratic function was 6.52%, while the prediction error of the model was not more than twice the standard deviation of the experimental values. This means that the predicted values are very close to the experimental values, indicating that the model is credible.
Author Contributions
Data curation, formal analysis, software (optimization), validation, writing, and proofreading- original draft, D.-H W; conceptualization, resources, project administration, data curation, C.-Y D; conceptualization, resources, supervision, project administration, formal analysis, validation, writing, proofreading-original draft, and review and editing, M.-D. J. All authors have read and agreed to the published version of the manuscript.
Funding
The authors gratefully acknowledge financial support from the Industry University Cooperative Education Projects of the Ministry of Education ( 231103231121958), and Research on the Sustainable Development of Fujian Rural Landscape under the Concept of Green and Low Carbon Research Project of Fujian Province (No. LJZX2024-D004); Key Project of Xiamen Social Science Federation (2024B31) and Key Issues of Xiamen Humanities and Social Sciences Research Centre (2024B31).
Data Availability Statement
The raw data supporting the conclusions of this article will be made available by the authors on request.
Conflicts of Interest
The authors declare no conflict of interest.
References
- R. Suryanarayanan. (1993). Plasma Spraying: Theory and Applications. WORLD SCIENTIFIC.
- Y. Huang, X. Zeng. (2010). Investigation on cracking behavior of Ni-based coating by laser-induction hybrid cladding. Applied Surface Science, 256(20), 5985-5992.
- U.D. Oliveira, V. Ocelík, J.T.M.D. Hosson. (2006). Residual stress analysis in Co-based laser clad layers by laboratory X-rays and synchrotron diffraction techniques. Surface & Coatings Technology, 201(3-4), 533-542.
- G. Sun, R. Zhou, J. Lu, J. Mazumder. (2015). Evaluation of defect density, microstructure, residual stress, elastic modulus, hardness and strength of laser-deposited AISI 4340 steel. Acta Materialia, 84(84), 172-189.
- M. Afzal, M. Ajmal, A.N. Khan, A. Hussain, R. Akhter. (2014). Surface modification of air plasma spraying WC–12%CO cermet coating by laser melting technique. Optics & Laser Technology, 56(1), 202-206.
- G. Montay, A. Cherouat, A. Nussair, J. Lu. (2004). Residual stresses in coating technology. Journal of Materials Science & Technology, 20(Supl.), 81-84.
- J. Qian, Y. Yin, T.J. Li, X.T. Hu, C.Wang, S.Q. Li. (2015). Structure, micro-hardness and corrosion behaviour of the AL–SI/AL 2 O 3, coatings prepared by laser plasma hybrid spraying on magnesium alloy.Vacuum, 117, 55-59.
- C.Z. Chen, T.Q. Lei, Q.H. Bao, S.S. Yao. (2002). Problems and the improving measures in laser remelting of plasma sprayed ceramic coatings. Material Science & Technology. 431-435.
- P. Wen, Z. Feng, S. Zheng. (2015). Formation quality optimization of laser hot wire cladding for repairing martensite precipitation hardening stainless steel. Optics & Laser Technology, 65, 180-188.
- P. Farahmand, R. Kovacevic. (2015). Laser cladding assisted with an induction heater (LCAIH) of NI–60%WC coating. Journal of Materials Processing Technology, 222, 244-258.
- M. Afzal, A.N. Khan, T.B. Mahmud, T.I. Khan, M. Ajmal. (2015). Effect of Laser Melting on Plasma Sprayed WC-12 wt.%Co Coatings. Surface & Coatings Technology, 266, 22-30.
- M. Rakhes, E. Koroleva, Z. Liu. (2010). Improvement of Corrosion Performance of HVOF MMC Coatings by Laser Surface Treatment. Proceedings of the 36th International MATADOR Conference. Springer London. 729-733.
- Q. Luo, A.H. Jones. (2010). High-precision determination of residual stress of polycrystalline coatings using optimised XRD-sin 2 ψ technique. Surface & Coatings Technology, 205(5), 1403-1408.
- W. Luo, U. Selvadurai, W. Tillmann. (2016). Effect of Residual Stress on the Wear Resistance of Thermal Spray Coatings. Journal of Thermal Spray Technology, 25(1), 321-330.
- M.S. Zoei, M.H. Sadeghi, M. Salehi. (2016). Effect of grinding parameters on the wear resistance and residual stress of HVOF-deposited WC-10Co-4Cr coating. Surface & Coatings Technology, 307, 886-891.
- J.M. Guilemany, S. Dosta, J.R. Miguel. (2006). The enhancement of the properties of WC-Co HVOF coatings through the use of nanostructured and microstructured feedstock powders. Surface & Coatings Technology, 201(3), 1180-1190.
- P. Kapadia, C. Davies, T. Pirling, M. Hofmann, R. Wimpory, F. Hosseinzadeh, D. Dean, K. Nikbin. (2017). Quantification of residual stresses in electron beam welded fracture mechanics specimens. International Journal of Solids & Structures, s 106–107, 106-118.
- R. Stadelmann, M. Lugovy, N. Orlovskaya, P. Mchaffey, M. Radovic, V.M. Sglavo, S. Grasso, M.J. Reece. (2016). Mechanical properties and residual stresses in ZrB2–SiC spark plasma sintered ceramic composites. Journal of the European Ceramic Society, 36(7), 1527-1537.
- Liu, S.; Zhu, H.; Peng, G.; Yin, J.; Zeng, X. Microstructure prediction of selective laser melting AlSi10Mg using finite element analysis. Mater. Des. 2018, 142, 319–328. [Google Scholar] [CrossRef]
- Chen, C.; Yin, J.; Zhu, H.; Xiao, Z.; Zhang, L.; Zeng, X. Effect of overlap rate and pattern on residual stress in selective laser melting. Int. J. Mach. Tools Manuf. 2019, 145, 103433. [Google Scholar] [CrossRef]
- Mansouri, M.; Fallah, M.M.; Kazerooni, A. The influence of hatch distance on the surface roughness, microhardness, residual stress, and density of inconel 625 specimens in the laser powder bed fusion process. Adv. Mater. Process. Technol. 2024, 10, 1–15. [Google Scholar] [CrossRef]
- Fallah V, Alimardani M, Corbin S. F., et al. Temporal Development of Melt-Pool Morphology and Clad Geometry in Laser Powder Deposition. Computational Materials Science, 2011, 50(7): 2124-2134.
- C. Wang, C. Jiang, V. J., Thermal stability of residual stresses and work hardening of shot peened tungsten cemented carbide. Journal of Materials Processing Technology. 2016, 240, 98–103.
- Gao, J.L., Wu Ch-zu, HAO Yun-bo, et al. Numerical Simulation and Experimental Investigation on Three-Dimensional Modelling of Single-Track Geometry and Temperature Evolution by Laser Cladding. Optics & Laser Technology, 2020, 129: 106287.
- Li C, Yu Z. B, Gao J.X. et al. Numerical Simulation and Experimental Study on the Evolution of Multi-Field Coupling in Laser Cladding Process by Disk Lasers. Welding in the World, 2019, 63(4): 925-945.
- Andrzej Wójcik, Kamil Jonak, Robert Karpi´nski, Józef Jonak, Marek Kalita and Dariusz Prosta´nski. Mechanism of Rock Mass Detachment Using Undercutting Anchors: A Numerical Finite Element Method (FEM) Analysis. Materials 2024, 17, 4468. [CrossRef]
- C. W. Liu, M. D. Jean, Q. T. Wang, Optimization of residual stresses in laser-mixed WC(Co,Ni) coatings. Strength of Materials, 2019,51(1): 95-101.
- Liu, H.M. Qin X.P. Wu M.W. et al. Numerical Simulation of Thermal and Stress Field of Single Track Cladding in Wide-Beam Laser Cladding. The International Journal of Advanced Manufacturing Technology, 2019, 104(9): 3959-3976.
- Song, J. Chew Y. Bi G.J. et al., Numerical and Experimental Study of Laser Aided Additive Manufacturing for Melt-Pool Profile and Grain Orientation Analysis. Materials & Design, 2018, 137: 286-297.
- Heeling, T. Cloots M. Wegener K. Melt Pool Simulation for the Evaluation of Process Parameters in Selective Laser Melting. Additive Manufacturing, 2017, 14: 116-125.
- Jin, P. Tang Q. Song J. et al. Numerical Investigation of the Mechanism of Interfacial Dynamics of the Melt Pool and Defects during Laser Powder Bed Fusion. Optics & Laser Technology, 2021, 143: 107289.
- Tian, H.C. Chen X.D. Yan Z.H. et al. Finite-Element Simulation of Melt Pool Geometry and Dilution Ratio during Laser Cladding. Applied Physics A, 2019, 125(7): 485.
- Gan, Z.T. Yu G. He X.L. et al. Numerical Simulation of Thermal Behavior and Multicomponent Mass Transfer in Direct Laser Deposition of Co-Base Alloy on Steel. International Journal of Heat and Mass Transfer, 2017, 104: 28-38.
- Jiaqi Zhang, Jianbo Lei, Zhenjie Gu, Fanliang Tantai, Hongfang Tian, Jiajie Han, Yan Fang. Effect of WC-12Co content on wear and electrochemical corrosion properties of Ni-Cu/WC-12Co composite coatings deposited by laser cladding. Surface and Coatings Technology, 393, 2020, 125807.
- Lin, Z.; Zhou, Y.; Zuo, S.; Cai, X.; Feng, K.; Wang, K.; Wei, H.; Xiao, F.; Jin, X. Controlling the crystal texture and microstructure of NiTi alloy by adjusting the thermal gradient of laser powder bed melting. Mater. Sci. Eng. A 2024, 912, 146970. [Google Scholar] [CrossRef]
- Liu L, Huang M. Ma Y. H. et al. Simulation of Powder Packing and Thermo-Fluid Dynamic of 316L Stainless Steel by Selective Laser Melting. Journal of Materials Engineering and Performance, 2020, 29(11): 7369-7381.
- Zhang J.Q., Lei J.B., Gu Z.J., Tantai F.L. Tian H.F. Han.J.J. Fang Y. Effect of WC-12Co content on wear and electrochemical corrosion properties of Ni-Cu/WC-12Co composite coatings deposited by laser cladding. Surface and Coatings Technology, 393, 2020, 125807.
- Cheng P., Tuo S, Fu G.Y. et al. Study on Temperature Control of Powdered Pool in Hollow Laser Light. Machine Building & Automation, 2021, 50(2): 99-101.
- Marques, B.M.; Andrade, C.M.; Neto, D.M.; Oliveira, M.C.; Alves, J.L.; Menezes, L.F. Numerical Analysis of Residual Stresses in Parts Produced by Selective Laser Melting Process. Procedia Manuf. 2020, 47, 1170–1177. [Google Scholar] [CrossRef]
- R. H. Myers, D. C. Montgomery, C. M. Anderson-Cook. Response surface methodology: Process and Product Optimization Using Designed Experiments. 3rd ed, John Wiley & Sons, Inc., Hoboken, New Jersey. 2009.
- B.T. Lin, M.D. Jean, J.H. Chou (2007). Using response surface methodology for optimizing deposited partially stabilized zirconia in plasma spraying. Applied Surface Science, 253(6), 3254-3262.
- Y. Sun, M. Hao. (2012). Statistical analysis and optimization of process parameters in TI6AL4V laser cladding using Nd:YAG laser. Optics & Lasers in Engineering, 50(7), 985-995.
- Helia Mohammadkamal and Fabrizia Caiazzo. Numerical Study to Analyze the Influence of Process Parameters on Temperature and Stress Field in Powder Bed Fusion of Ti-6Al-4V. Materials 2025, 18, 368. [CrossRef]
Figure 1.
(a) A fiber laser cladding system(b) The tester for residual stresses of Proto i-XRD devices.
Figure 1.
(a) A fiber laser cladding system(b) The tester for residual stresses of Proto i-XRD devices.
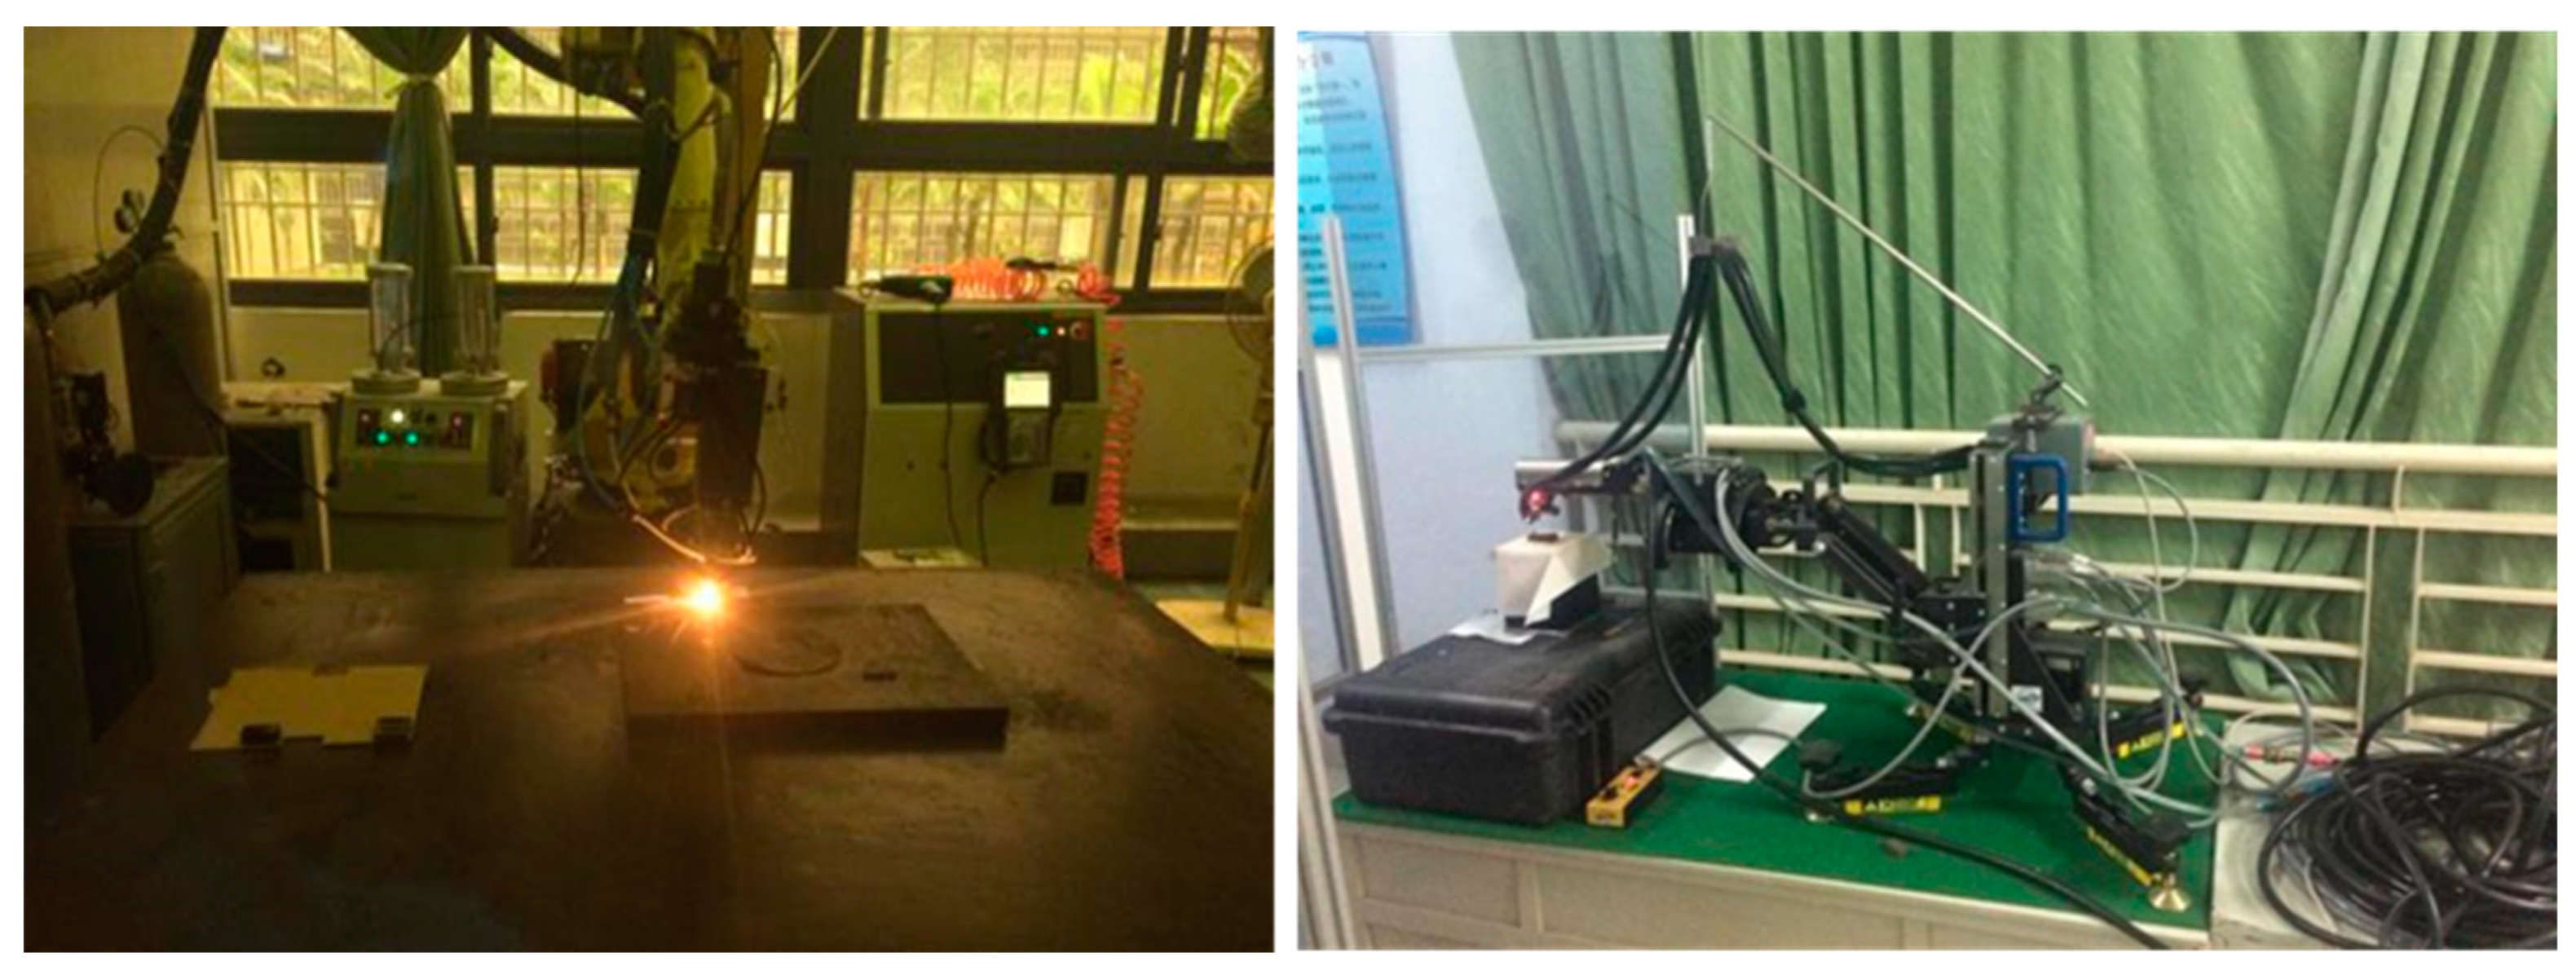
Figure 2.
(a) Dimension of the model construction (b)Schematic of the heat source model for the Gaussian surface.
Figure 2.
(a) Dimension of the model construction (b)Schematic of the heat source model for the Gaussian surface.
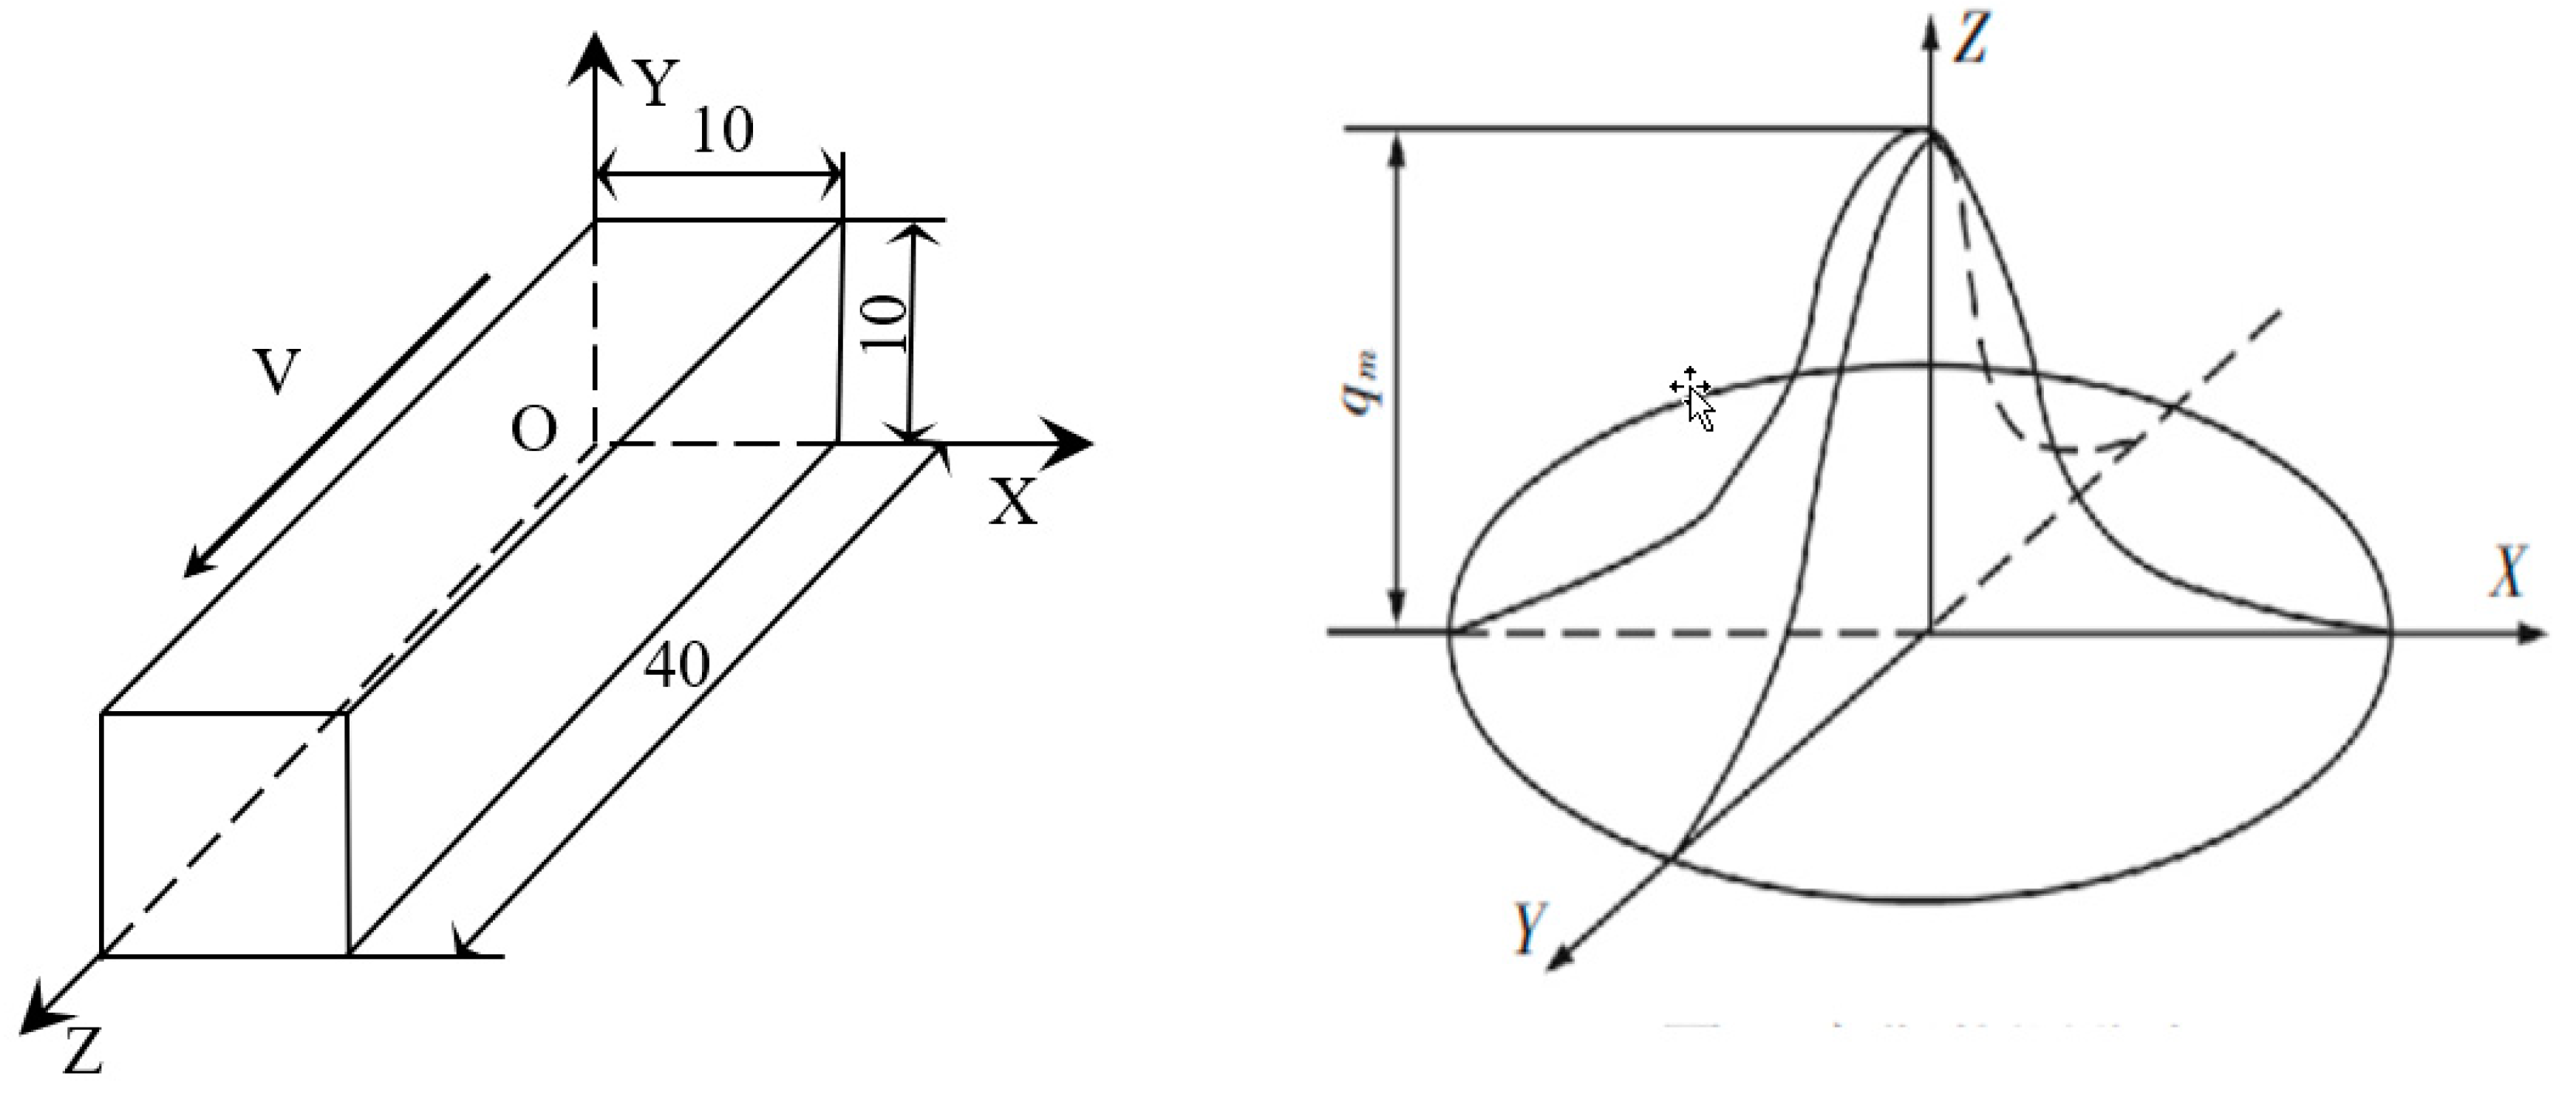
Figure 5.
(a) Melt pool dimensions obtained from simulations at trial 9. (b) Local enlargement of the molten pool, where the width of the simulated molten pool is compared with the actual weld bead of the laser welding.
Figure 5.
(a) Melt pool dimensions obtained from simulations at trial 9. (b) Local enlargement of the molten pool, where the width of the simulated molten pool is compared with the actual weld bead of the laser welding.
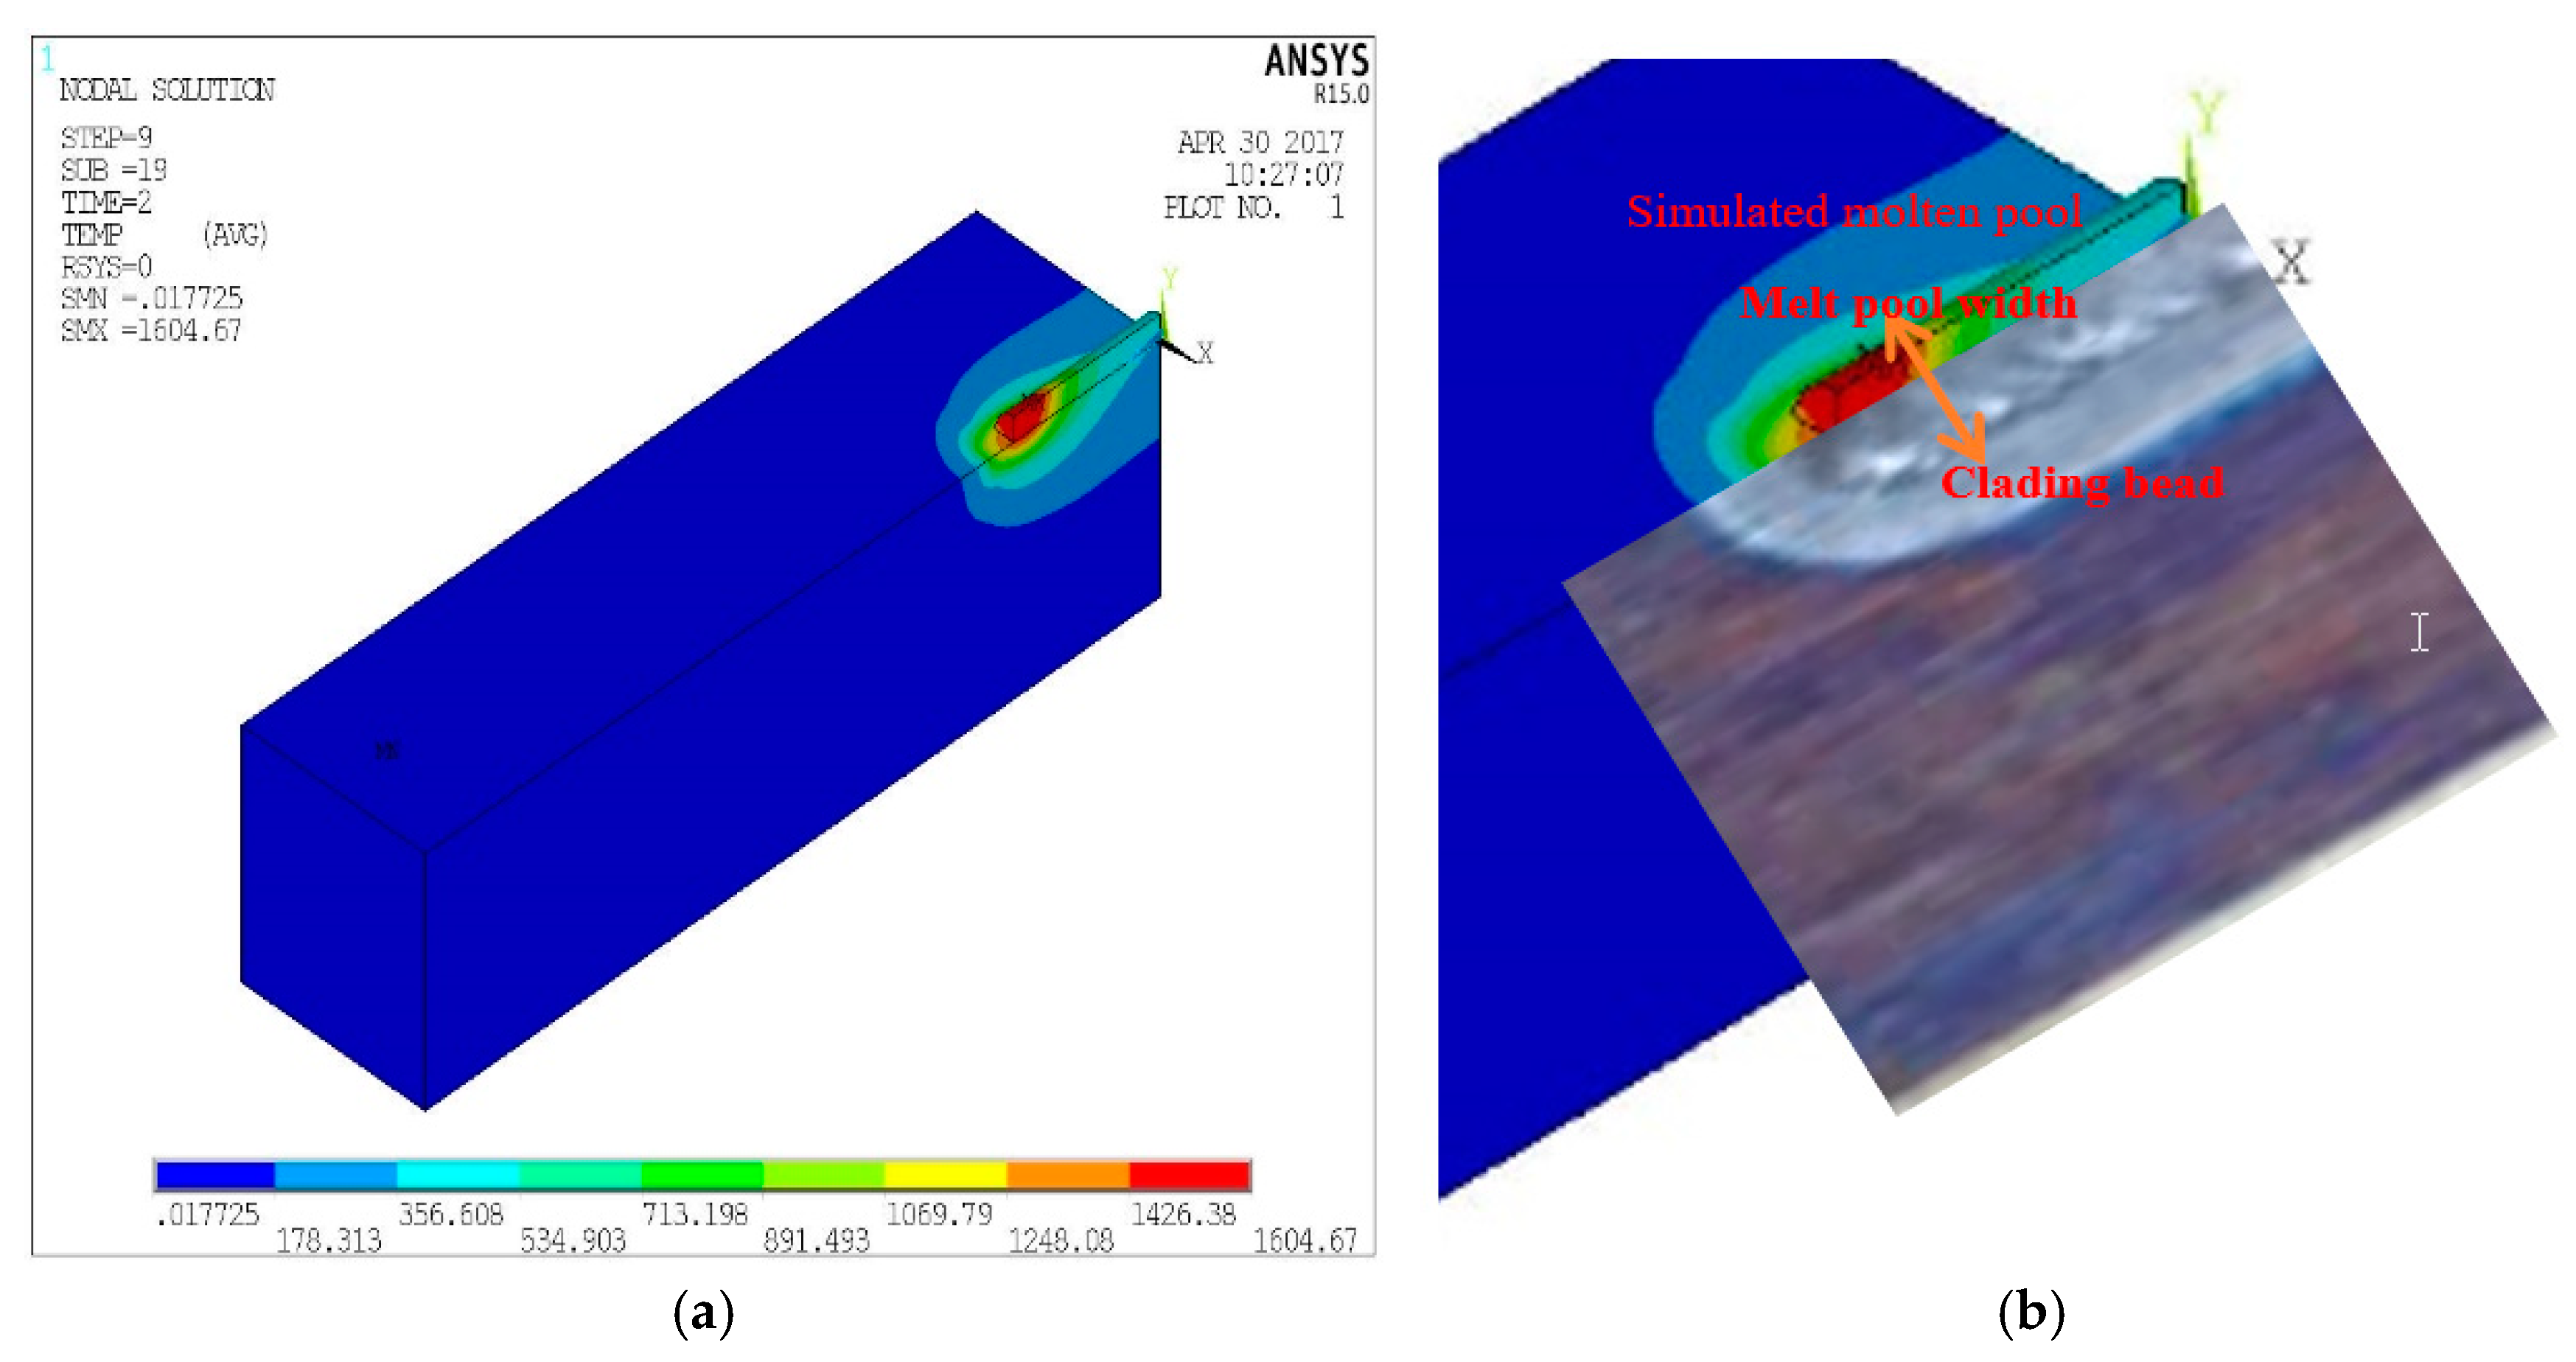
Figure 6.
A view of the temperature field for the 5th trial at 1s,10s and 20s .(a) The cloud of temperature field at time 1 s. (b) The cloud of temperature field at time 10 s (c) The distribution of temperature field at 20 S. (d) The cloud of temperature field above the symmetry plane at 10 s. € Temperature-time profile along the direction of the welding track (f) Temperature-time profile along the direction of the perpendicular melting track The maximum temperature of the molten pool of the group is 4779K and the minimum temperature is 3478.78K.
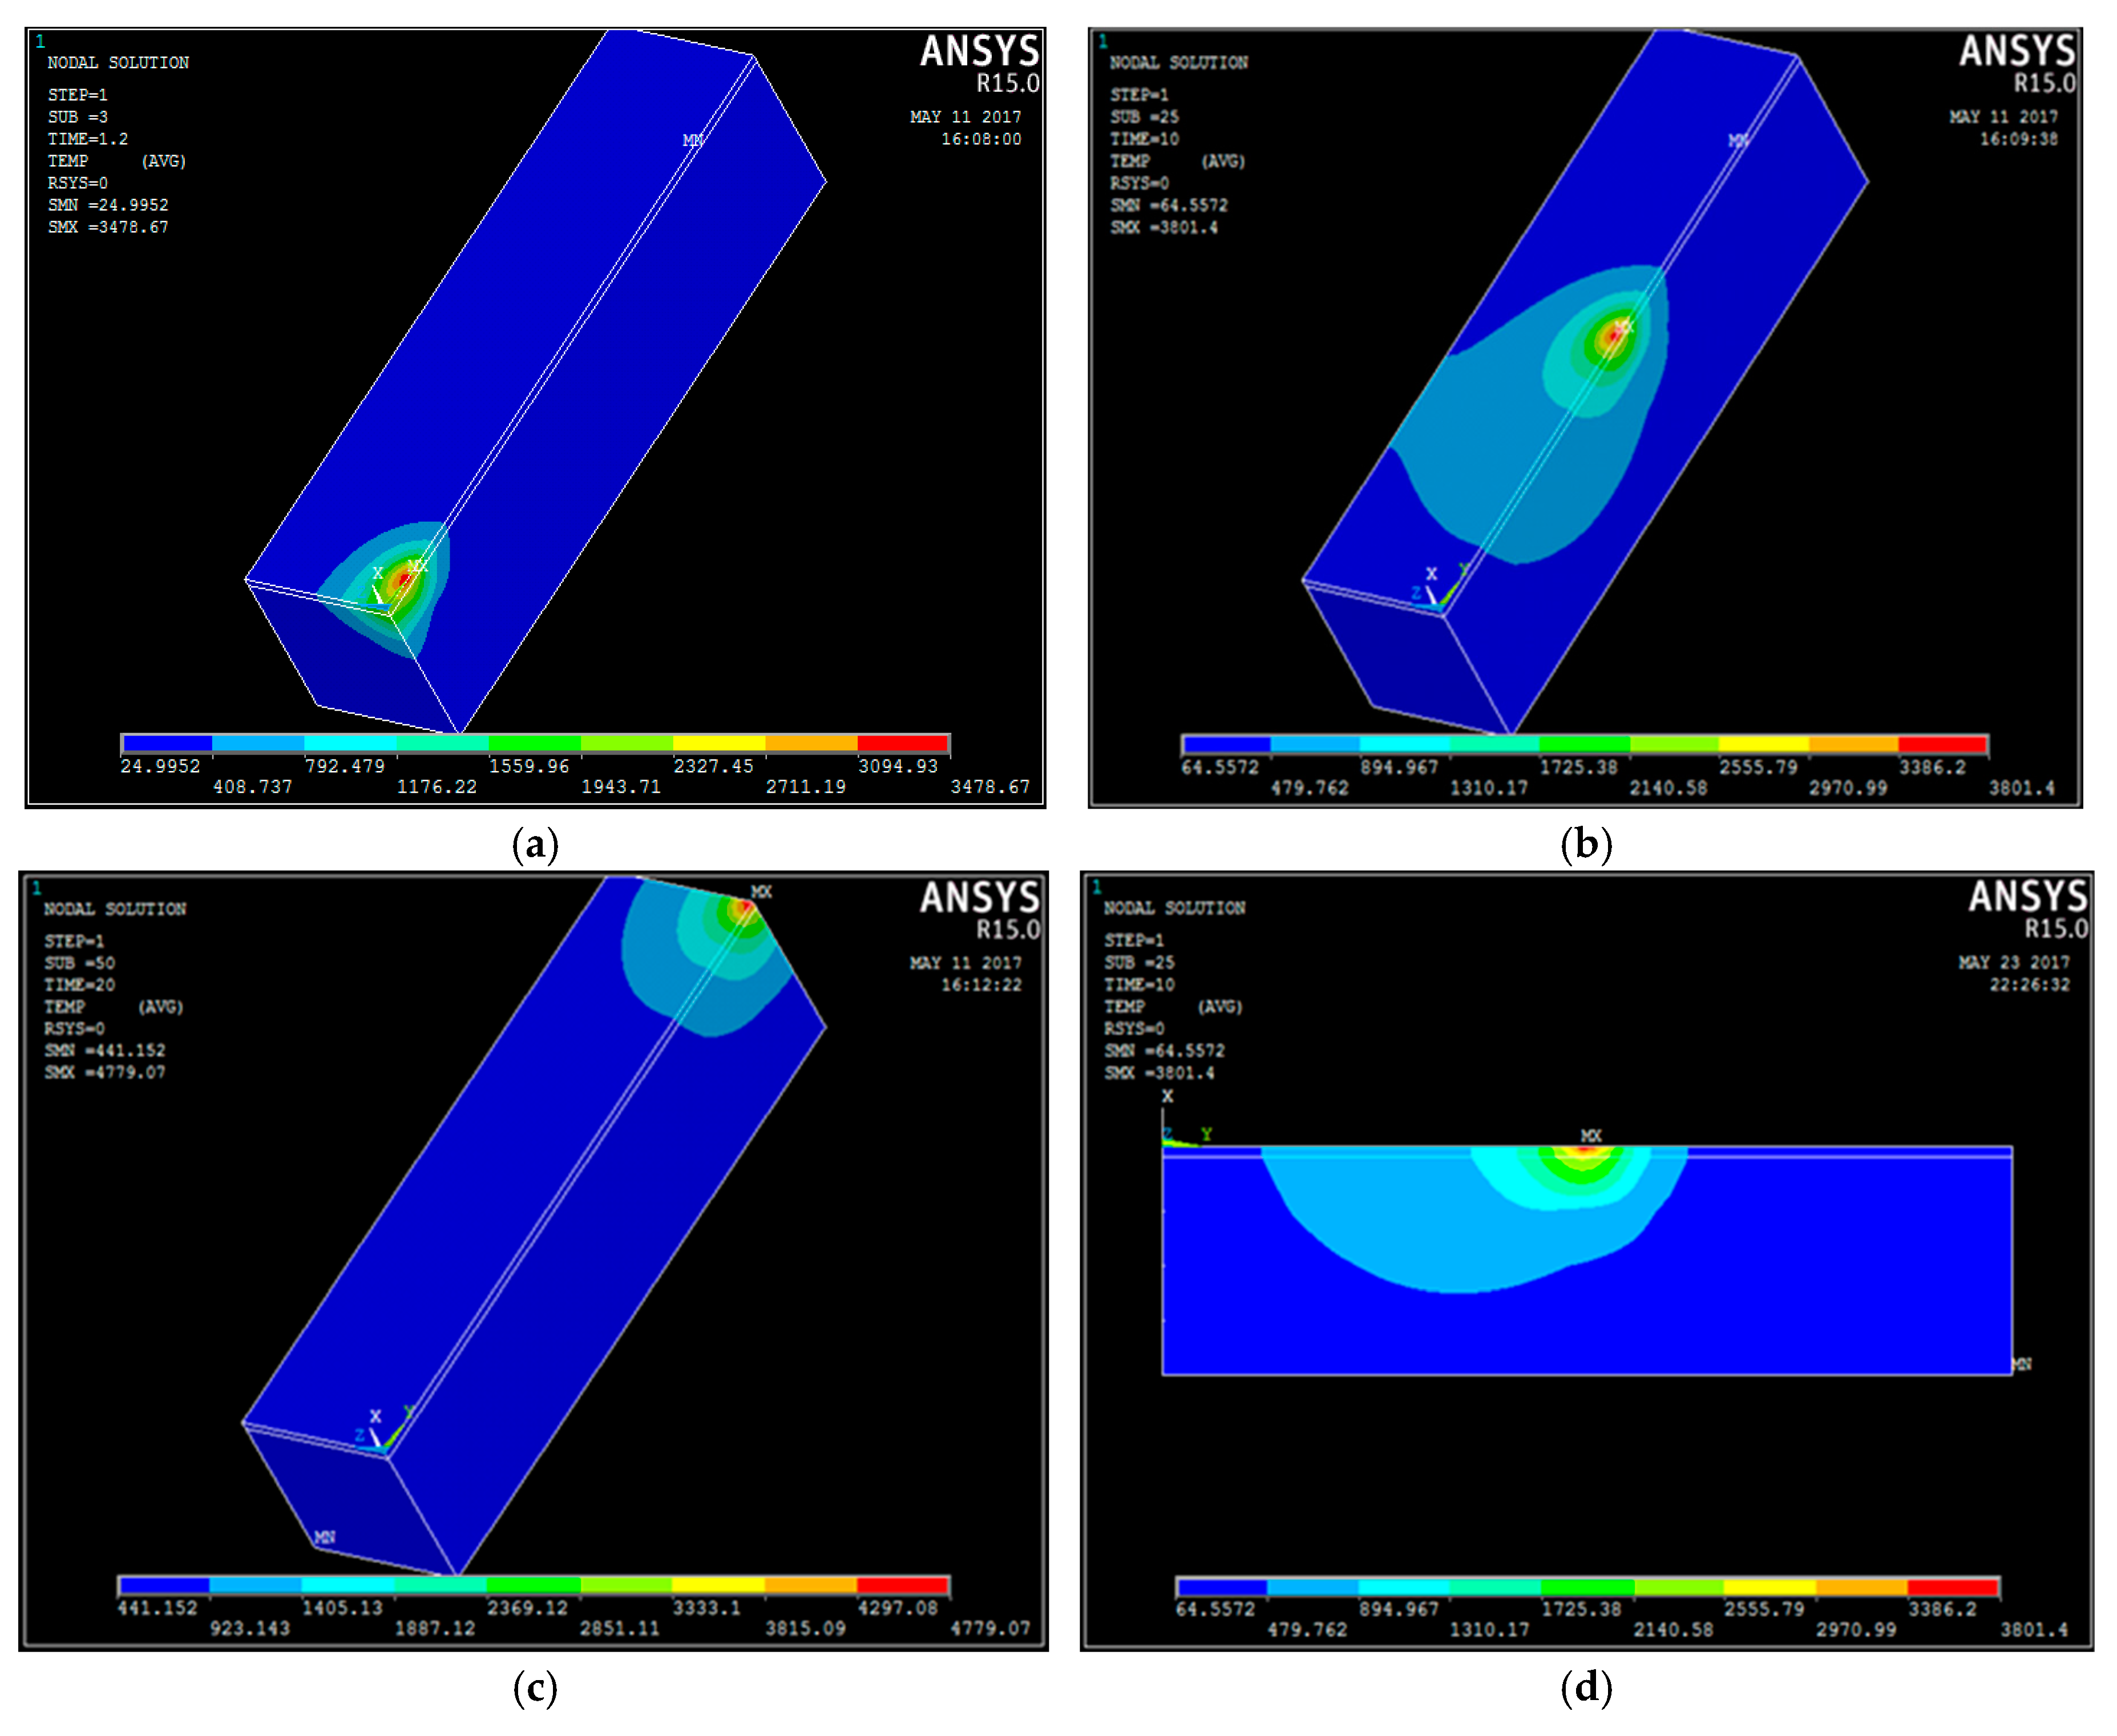
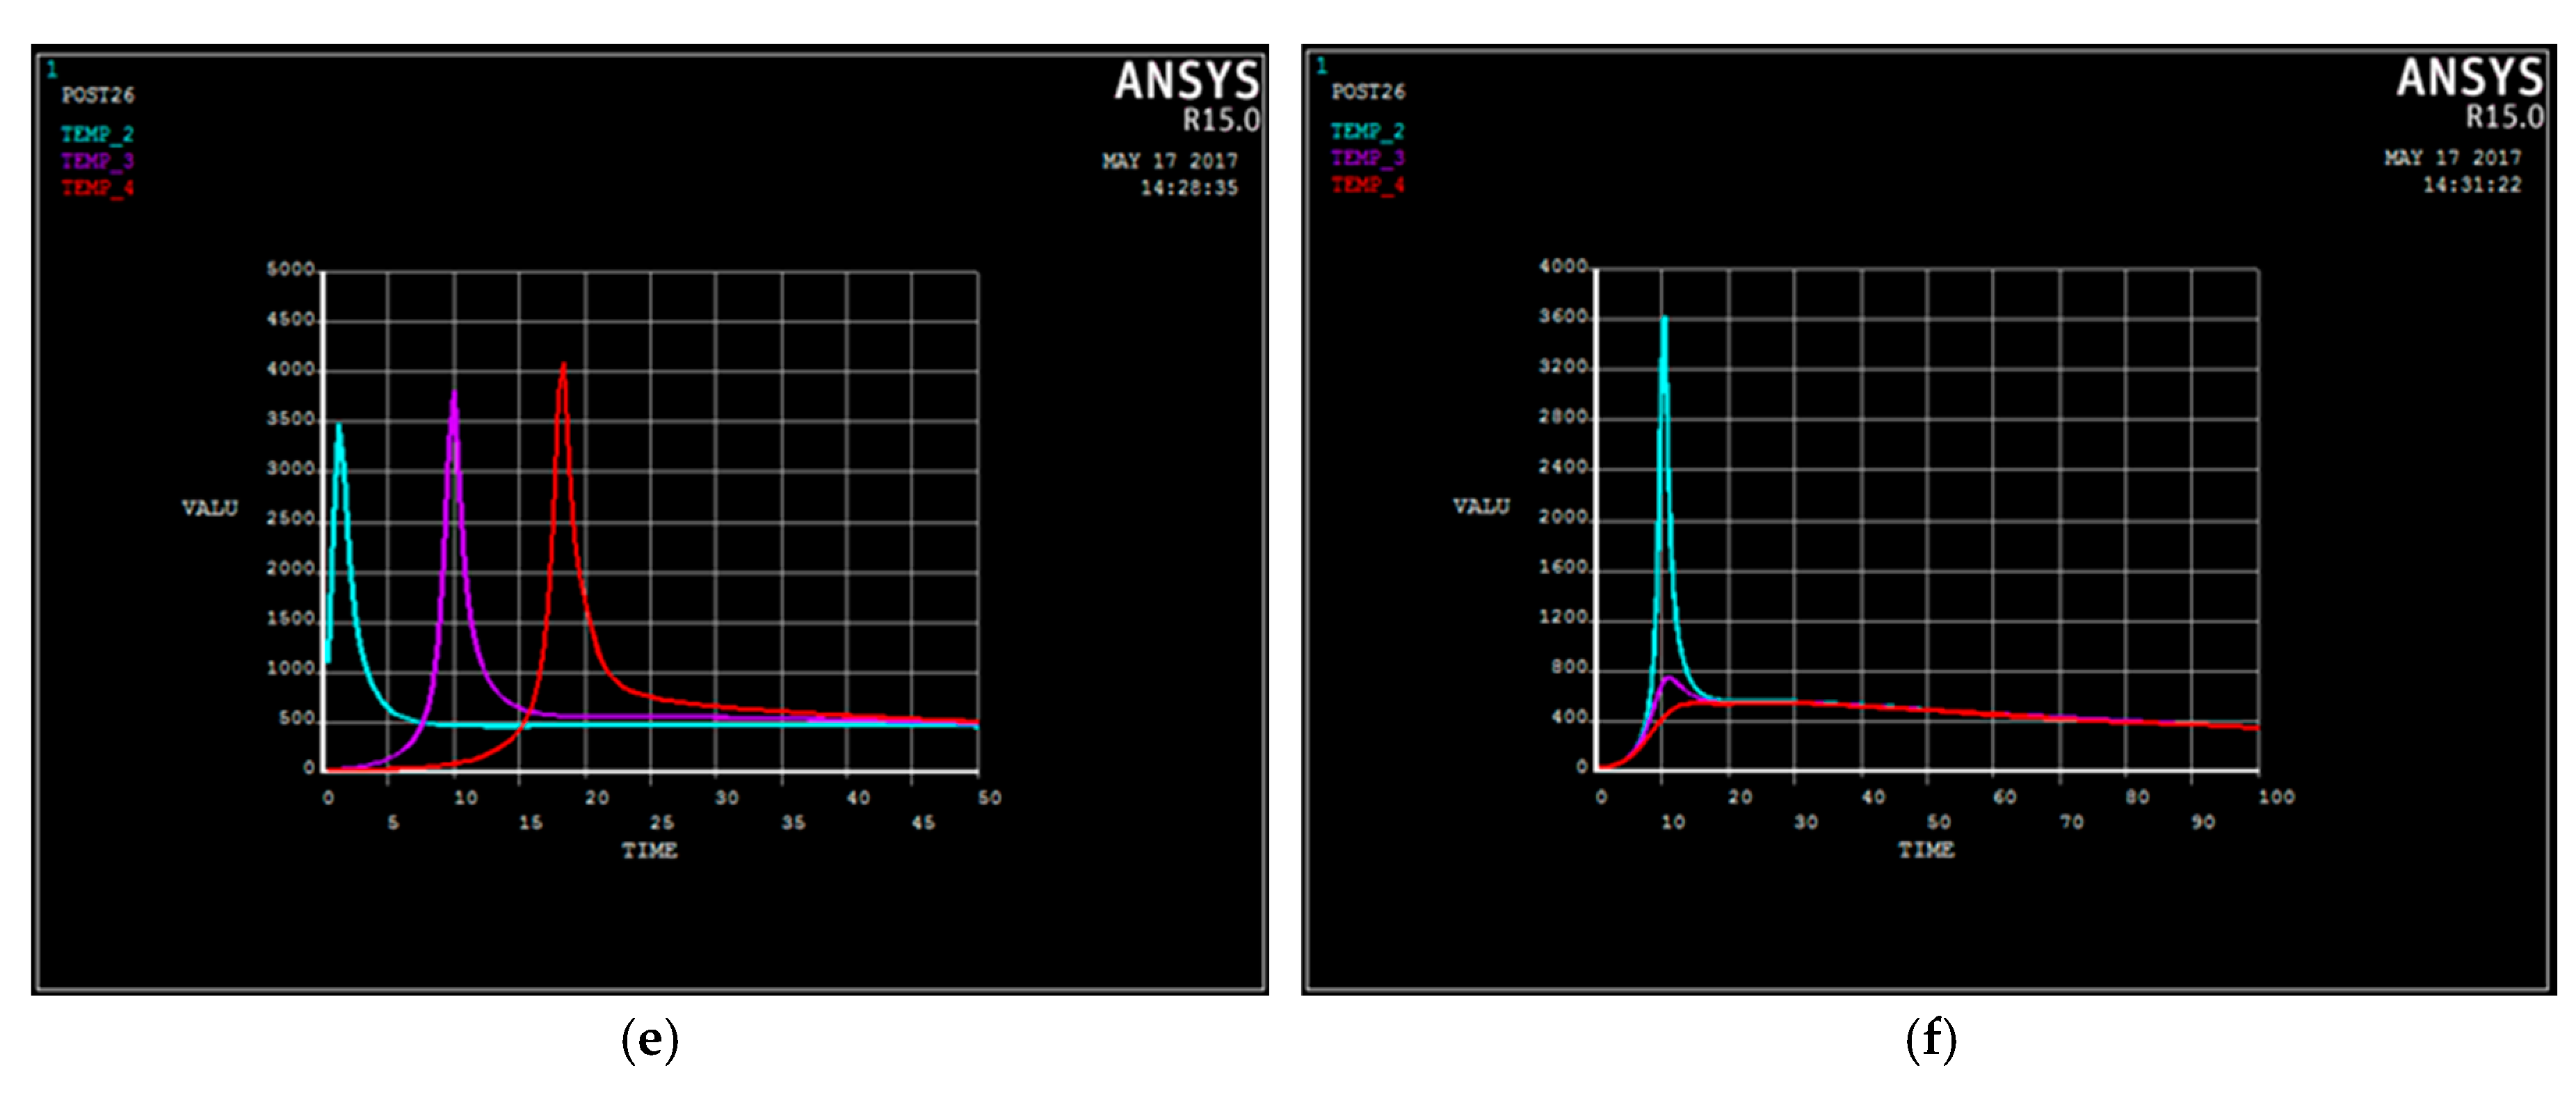
Figure 7.
Stress distribution in the Z-axis weld of the model at the A, B, and C marked locations .
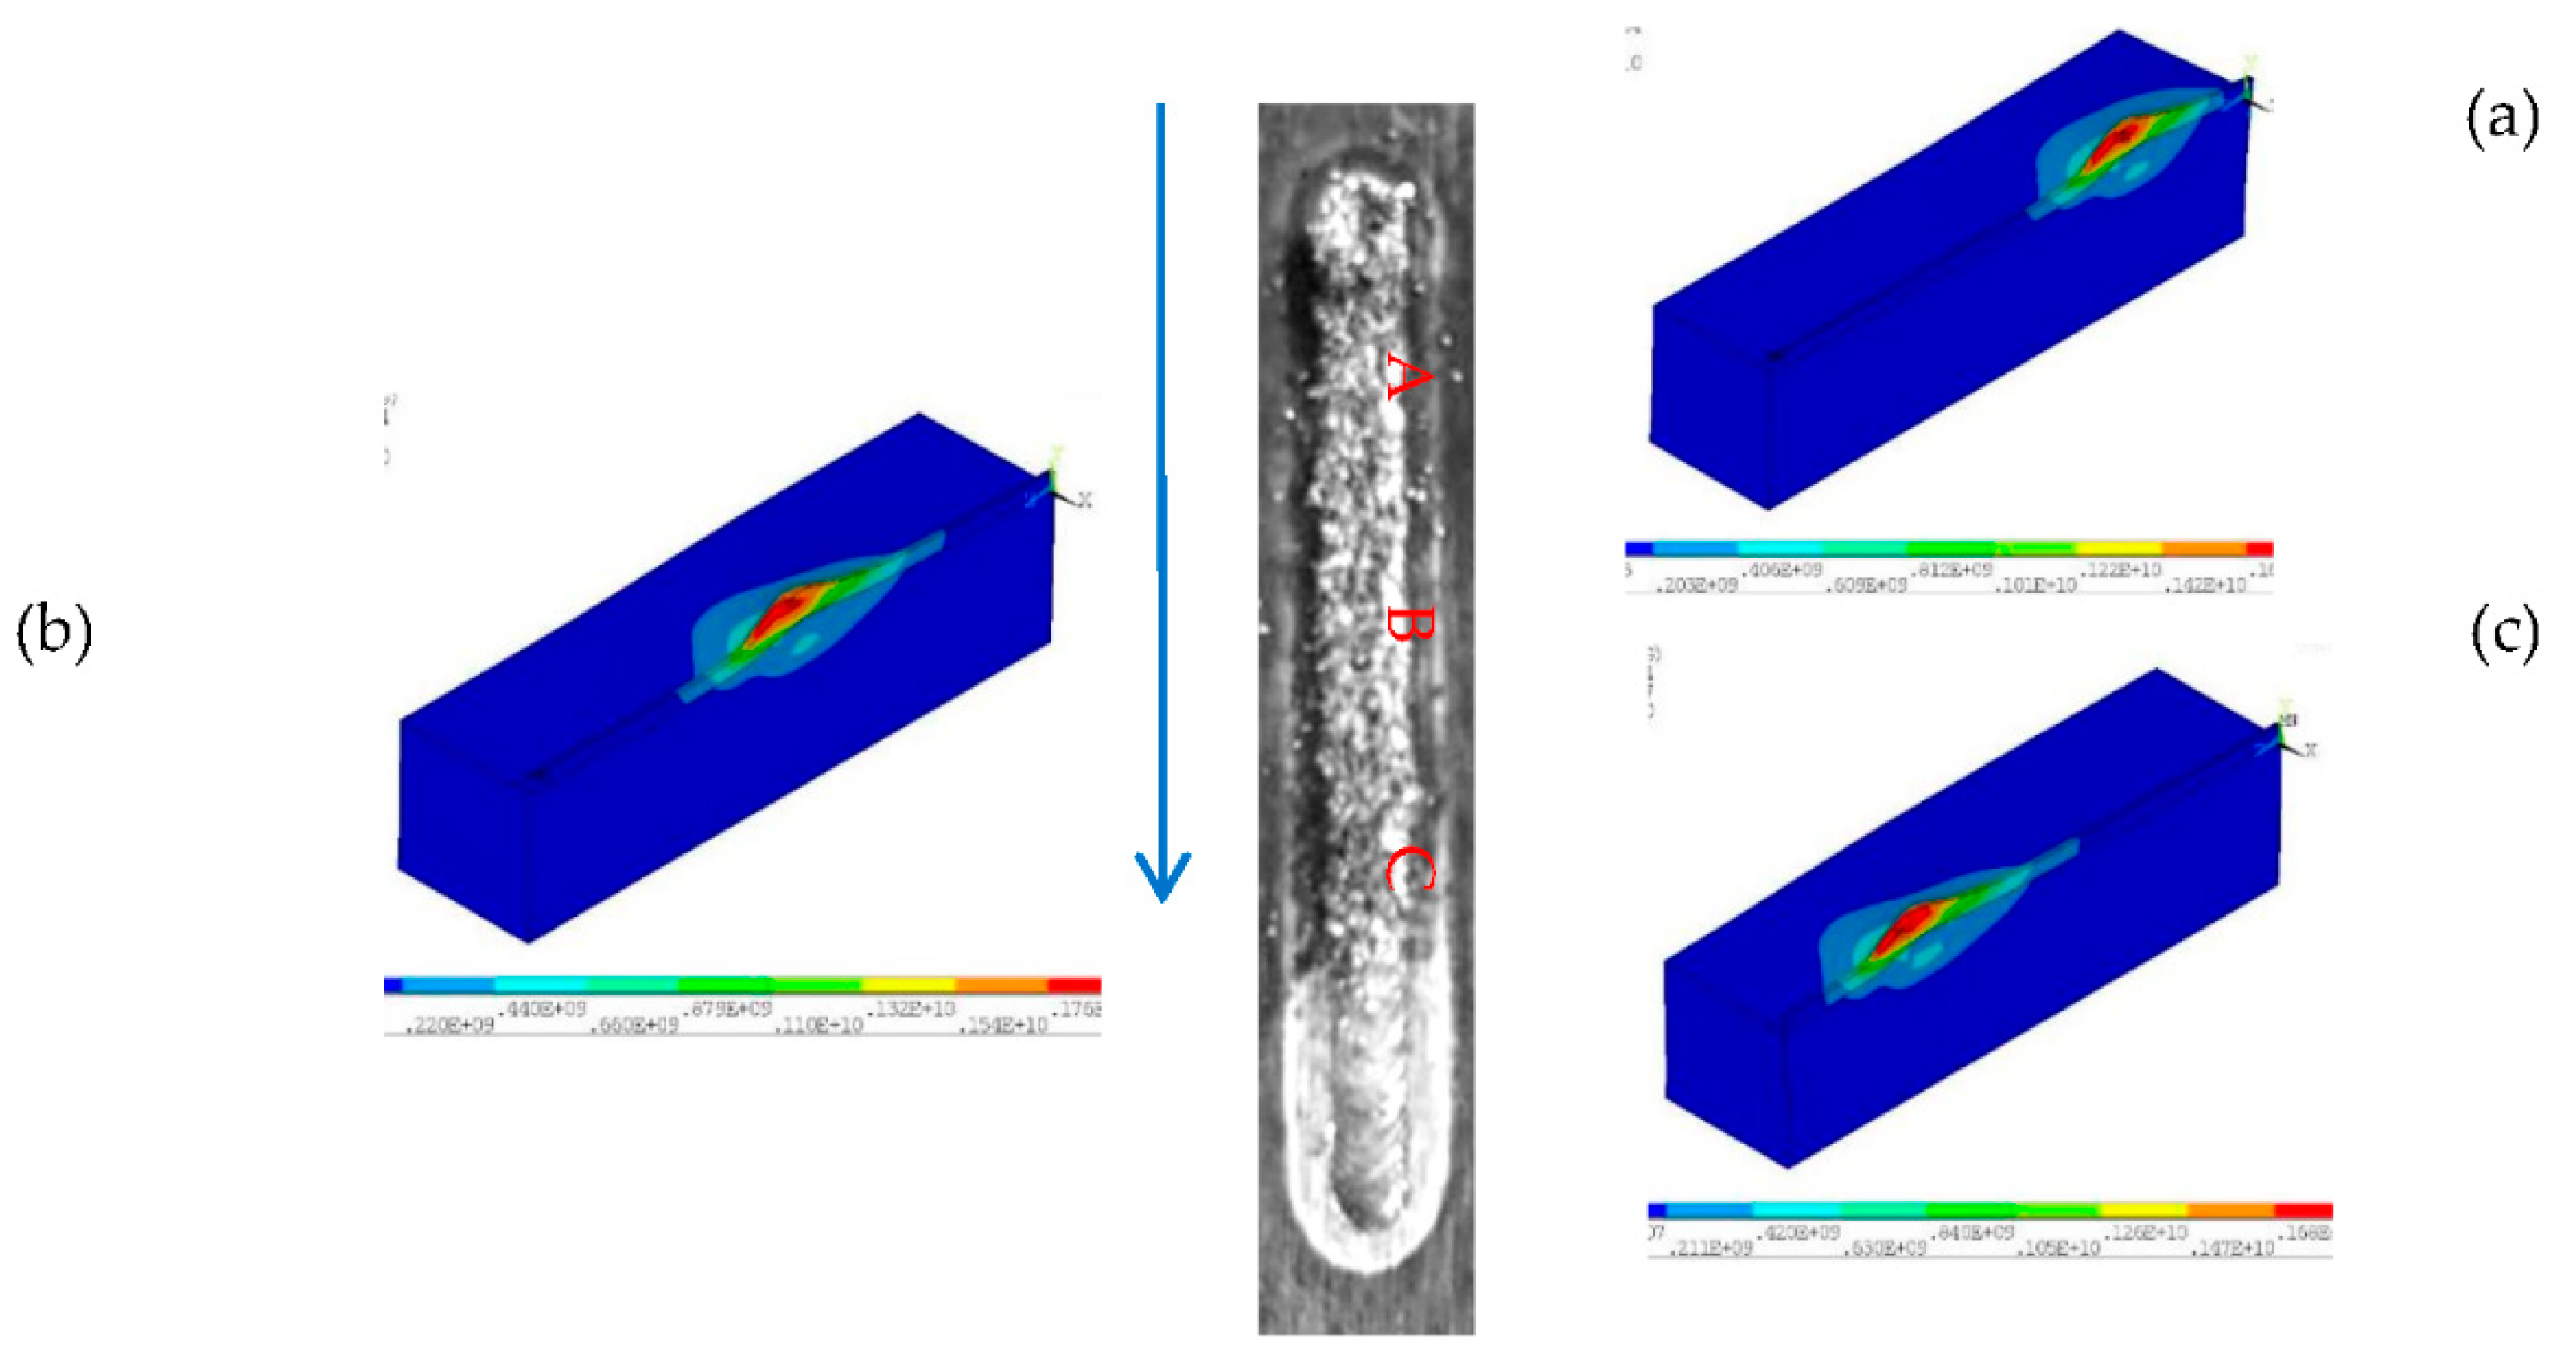
Figure 8.
(a)The measured residual stresses of the pattern of fitting a Gaussian function to a measured peak by X-ray diffraction.(b) Value derived from the slope of the calculation of the lattice spacing versus sin 2ψ.
Figure 8.
(a)The measured residual stresses of the pattern of fitting a Gaussian function to a measured peak by X-ray diffraction.(b) Value derived from the slope of the calculation of the lattice spacing versus sin 2ψ.
Figure 9.
SEM microstructures of various tests with WC/Co/Ni deposits by laser cladding including trial 7 ( b) trial 9 (c) trial 14 (d) trial 17. .
Figure 9.
SEM microstructures of various tests with WC/Co/Ni deposits by laser cladding including trial 7 ( b) trial 9 (c) trial 14 (d) trial 17. .

Figure 11.
The distributions of the experimental and predicted patterns with the resulting standard errors .
Figure 11.
The distributions of the experimental and predicted patterns with the resulting standard errors .
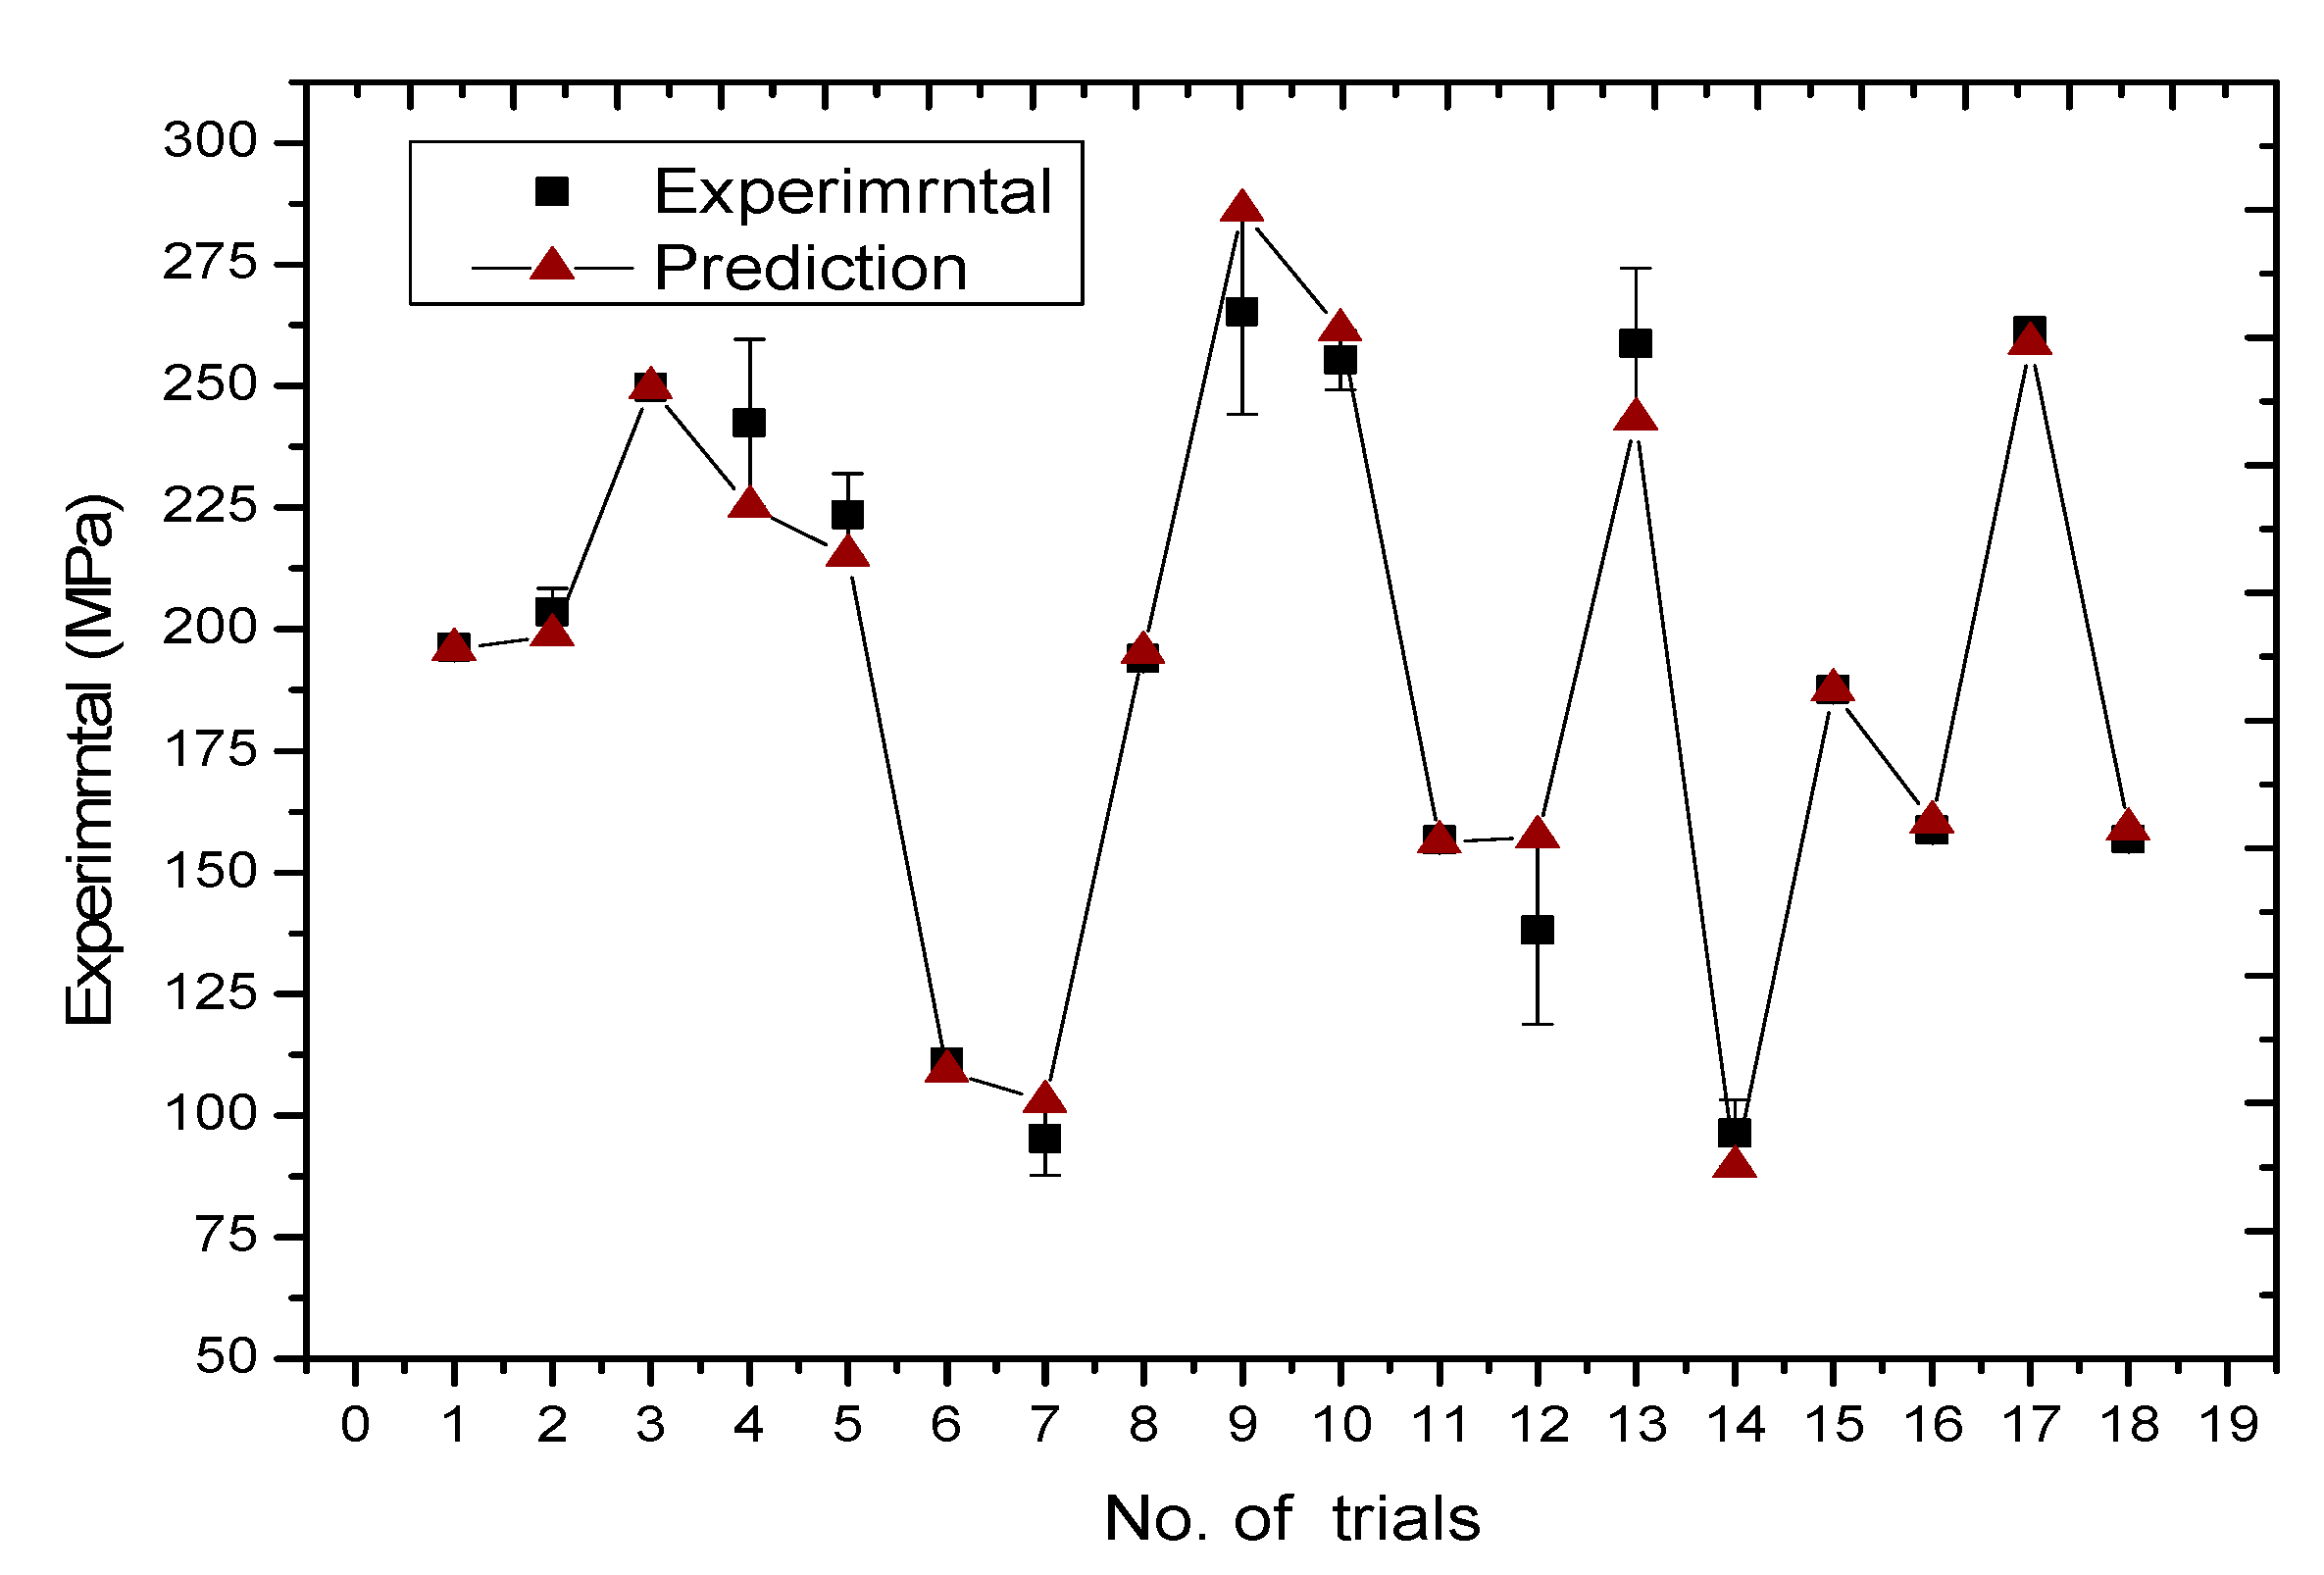

Table 1.
An experimental design by Taguchi for 18 runs of simulations of FSM for residual stress and S/N calculations for control factors and levels.
Table 1.
An experimental design by Taguchi for 18 runs of simulations of FSM for residual stress and S/N calculations for control factors and levels.
| No. of trials | Control factors and levels | |||||||
|---|---|---|---|---|---|---|---|---|
| Substrate | Ratio of Co (%) |
Ratio of Ni (%) |
Preheated temperature (℃) |
Laser power (W) |
Scannig speed (mm/sec) |
Defocusing distance (mm) |
Flowrate of shielding gas(ml/min) | |
| 1 | #45 | 0 | 0 | 25 | 1000 | 2 | 15 | 1400 |
| 2 | #45 | 0 | 10 | 100 | 1400 | 4 | 20 | 1600 |
| 3 | #45 | 0 | 20 | 200 | 1800 | 6 | 25 | 1800 |
| 4 | #45 | 10 | 0 | 25 | 1400 | 6 | 25 | 1600 |
| 5 | #45 | 10 | 10 | 100 | 1800 | 2 | 15 | 1800 |
| 6 | #45 | 10 | 20 | 200 | 1000 | 4 | 20 | 1400 |
| 7 | #45 | 20 | 0 | 100 | 1000 | 4 | 25 | 1800 |
| 8 | #45 | 20 | 10 | 200 | 1400 | 6 | 15 | 1400 |
| 9 | #45 | 20 | 20 | 25 | 1800 | 2 | 20 | 1600 |
| 10 | #40Cr | 0 | 0 | 200 | 1800 | 4 | 15 | 1600 |
| 11 | #40Cr | 0 | 10 | 25 | 1000 | 6 | 20 | 1800 |
| 12 | #40Cr | 0 | 20 | 100 | 1400 | 2 | 25 | 1400 |
| 13 | #40Cr | 10 | 0 | 100 | 1800 | 6 | 20 | 1400 |
| 14 | #40Cr | 10 | 10 | 200 | 1000 | 2 | 25 | 1600 |
| 15 | #40Cr | 10 | 20 | 25 | 1400 | 4 | 15 | 1800 |
| 16 | #40Cr | 20 | 0 | 200 | 1400 | 2 | 20 | 1800 |
| 17 | #40Cr | 20 | 10 | 25 | 1800 | 4 | 25 | 1400 |
| 18 | #40Cr | 20 | 20 | 100 | 1000 | 6 | 15 | 1600 |
Table 2.
Chemical composition of the WC(Co,Ni) particles, interface, eutectics and dendrites in the cladding beads marked location in Figure 10 by EDX analysis.
Table 2.
Chemical composition of the WC(Co,Ni) particles, interface, eutectics and dendrites in the cladding beads marked location in Figure 10 by EDX analysis.
| No. of trials | W | C | O | Fe | Ni | Co | |
|---|---|---|---|---|---|---|---|
| Trial7 | A | 94.43 | 2.08 | 1.87 | 1.17 | 0.00 | 0.068 |
| B | 92.08 | 1.53 | 3.12 | 2.81 | 0.00 | 0.28 | |
| C | 90.74 | 1.32 | 4.37 | 2.93 | 0.00 | 0.25 | |
| Trial9 | A | 88.85 | 1.61 | 1.08 | 3.12 | 2.89 | 2.15 |
| B | 25.00 | 2.34 | 6.49 | 5.84 | 27.92 | 32.08 | |
| C | 66.22 | 1.93 | 4.48 | 3.76 | 11.95 | 11.11 | |
| Trial 14 | A | 89.98 | 2.97 | 1.54 | 2.42 | 1.479 | 0.99 |
| B | 38.02 | 4.09 | 5.98 | 33.36 | 6.49 | 11.49 | |
| C | 30.01 | 4.99 | 7.14 | 36.07 | 9.60 | 11.30 | |
| Trial17 | A | 91.86 | 1.55 | 1.03 | 0.53 | 2.32 | 2.49 |
| B | 84.00 | 0.99 | 1.74 | 0.71 | 3.46 | 9.02 | |
| C | 46.27 | 1.74 | 12.66 | 3.37 | 5.81 | 28.91 | |
Table 3.
An analysis of variance based on the experimental design for WC(Co,Ni) welds.
| Control factors |
Sum of squares |
Degrees of Freedom |
Mean square |
F-value | Percent contribution |
|---|---|---|---|---|---|
| A | 1.323 | 1.0 | 1.323 | 0.542 | 0.89 |
| B | 3.222 | 2.0 | 1.611 | 0.660 | 2.17 |
| C | 1.419 | 2.0 | 0.710 | 0.291 | 0.96 |
| D | 17.917 | 2.0 | 8.958 | 3.671 | 12.07 |
| E | 98.303 | 2.0 | 49.152 | 20.144 | 66.21 |
| F | 3.262 | 2.0 | 1.631 | 0.669 | 2.20 |
| G | 9.610 | 2.0 | 4.805 | 1.969 | 6.47 |
| H | 8.529 | 2.0 | 4.264 | 1.748 | 5.74 |
| Error | 4.880 | 2.0 | 2.440 | 1.000 | 3.29 |
| Total | 148.466 | 17.0 | 8.733 | 3.579 | 100.00 |
Table 4.
Analysis of variance of response of wear volume based on linear, interaction and quadratic functions.
Table 4.
Analysis of variance of response of wear volume based on linear, interaction and quadratic functions.
| Source | Degree of freedom | Sum of Squares | Mean Square | F-test | Prob< F | Adjust-R2 |
|---|---|---|---|---|---|---|
| Linear model | 4 | 47617.08 | 11904.27 | 16.00383 | 6.08E-05 | 0.779 |
| Interaction model | 10 | 53161.47 | 5316.147 | 9.020209 | 0.004006 | 0.822 |
| quadratic model | 14 | 55681.99 | 3977.285 | 7.434195 | 0.00621 | 0.841 |
Table 5.
The estimated coefficient of regression and p-value for the quadratic model.
| Source | Quadratic model | |||
|---|---|---|---|---|
| Coefficient Estimate |
Standard error | t-statistical | Prob > F | |
| Intercept | -563.727 | 936.196 | -0.602 | 0.590 |
| D | -0.757 | 1.283 | -0.590 | 0.597 |
| E | -0.176 | 0.361 | -0.486 | 0.660 |
| G | -22.983 | 30.477 | -0.754 | 0.506 |
| H | 1.372 | 1.078 | 1.272 | 0.293 |
| DE | 0.000 | 0.000 | 0.977 | 0.401 |
| DG | -0.014 | 0.026 | -0.551 | 0.620 |
| DH | 0.000 | 0.001 | -0.066 | 0.951 |
| EG | 0.006 | 0.006 | 1.121 | 0.344 |
| EH | 0.000 | 0.000 | 0.336 | 0.759 |
| GH | 0.014 | 0.011 | 1.222 | 0.309 |
| D2 | 0.002 | 0.002 | 1.131 | 0.340 |
| E2 | 0.000 | 0.000 | 0.404 | 0.714 |
| G2 | -0.195 | 0.499 | -0.390 | 0.723 |
| H2 | -0.001 | 0.000 | -1.759 | 0.177 |
Disclaimer/Publisher’s Note: The statements, opinions and data contained in all publications are solely those of the individual author(s) and contributor(s) and not of MDPI and/or the editor(s). MDPI and/or the editor(s) disclaim responsibility for any injury to people or property resulting from any ideas, methods, instructions or products referred to in the content. |
© 2025 by the authors. Licensee MDPI, Basel, Switzerland. This article is an open access article distributed under the terms and conditions of the Creative Commons Attribution (CC BY) license (http://creativecommons.org/licenses/by/4.0/).
Copyright: This open access article is published under a Creative Commons CC BY 4.0 license, which permit the free download, distribution, and reuse, provided that the author and preprint are cited in any reuse.


