Submitted:
14 April 2025
Posted:
15 April 2025
You are already at the latest version
Abstract
Relying solely on aggregated ethnicity-based population counts has limited utility for ethnic minority groups. Accurate and relevant population counts are critical for monitoring and improving outcomes related to health, social welfare, and education. This article examines additional dimensions of identity to provide a revised estimate of the total population count for Peoples of Fiji (PF) living in Aotearoa. Customized data tables from the Census of Population and Dwellings, provided by Statistics New Zealand, were analyzed using ethnicity and additional recorded characteristics, such as country of birth, and parents’ ethnicity, to obtain more accurate counts for the major ethnic groups from Fiji living in Aotearoa. Our analysis revealed that almost 50,000 Fijian Indians were misclassified. Utilizing additional variables, we estimate the revised count for the Fijian Indian ethnic group alone exceeds 70,000 and the PF total count exceeds 2% of Aotearoa’s current population. Accurate population counts and granularity within aggregated groups are essential for informing funding formulas and health policies. We highlight significant variations in ethnicity coding for PF and their implications for health monitoring and risk assessment, data quality, and interpretation. We make key recommendations to improve granular reporting for minority migrant groups in Aotearoa.
Keywords:
Fijian
; Fijian Indian
; Census
; population estimate
; Aotearoa
; New Zealand
1. Introduction
The objective of this paper is to analyse the available population counts for Peoples of Fiji (PF) living in Aotearoa/New Zealand (NZ), with a special focus on the subgroup most affected by ethnicity misclassifications, Fijian Indian, and to evaluate the utility of additional dimensions of identity in to arrive at a more accurate count for the overall PF population. The two largest ethnic groups in Fiji are the ī-Taukei (indigenous peoples of Fiji) and Indo-Fijian (Fijian Indian) groups. While immigration of both groups to NZ has steadily increased, the census does not accurately reflect this growth. Without accurate population counts, it is nearly impossible to assess and evaluate health, wellbeing, and disease prevalence for Peoples of Fiji, and without adequate granularity, it is near impossible to address the unique health needs of this heterogenous population.
Fiji consists of an archipelago of greater than 300 islands in the South Pacific Ocean, approximately 1,100 nautical miles north-northeast of New Zealand. It boasts the second largest land mass in the Pacific after Papua New Guinea and is the second most populous country in the region today (current population exceeds 936,000). The vanua is as diverse as its peoples and cultures within and is uniquely comprised of i-Taukei (57%), Indo-Fijian (37%), Rotuman (1%) other Pacific Islanders (1%, including: Kioa, Rabi, Banaban and Tongan), Chinese (1%) and European (2.5%).
After the first European landing in Fiji in 1792, European commercial interest in Fiji’s fertile land was piqued. In the decades that followed, new settlers pursued economic growth within the region leading to the 1860’s plantation era in Fiji. An estimated 26,000 labourers were trafficked to Fiji from Vanuatu, Solomon Islands, New Guinea and Kiribati to sustain the sea island cotton and copra plantations [1,2]. The colonial pressures culminated in Fiji officially becoming a British crown colony in 1874. The extraordinarily high death rate among labourers of Pacific origin (who had no prior exposure to the infectious diseases introduced by settlers) [2], led recruiters to demand labour from further afield. Between 1879-1920, more than 60,000 labourers were trafficked from India to Fiji through the indenture system/Girmit, to work on the plantations and sustain the colonial economy [3,4,5,6].
It is the descendants of indentured labourers who form much of the Fijian Indian population alive today. This group has a distinct cultural identity that combines elements of Indian heritage with influences from Fiji’s diverse cultural landscape. For example, Fijian Indians typically speak Fiji Hindi, a koiné language [7,8]. Remnants of a creole variously referred to as Fiji Baat or Pidgin Hindi can also still be heard [9] (pp. 8-13). The population in Fiji has decreased with the ethno-political instability associated with each successive coup d’état in Fiji; this has correlated with increased rates of PF immigration to NZ, Australia, Canada, and the USA. Over the last four decades, the PF population, living in NZ, has grown considerably, however this growth is not accurately reflected in Census data.
The concern for an effective count for Peoples of Fiji is not new [10]. An investigation into ethnicity was undertaken by Statistics NZ as part of ongoing research into potential ways in which censuses could be derived from or augmented by administrative data sources [11]. It was found that each administrative data source had more people recorded as Fijian than the number of people identifying with the Fijian ethnic group according to the census. For example, more than two-thirds of individuals identifying as Fijian Indian in the census were coded as Fijian in Ministry of Education tertiary data [11]. These examples highlight the necessity for improved ethnicity coding and data collection quality. The risk of misidentifying minority groups can lead to misallocation of resources and underserving populations facing greater health inequities.
The ethnicity data protocols issued by the Ministry of Health noted that there have been data quality issues in the recording of Fijian Indian respondents and stated: “The Ethnicity New Zealand Standard Classification codes ‘Fijian Indian’ as level 4 code 43112 (which aggregates at level 1 output to ‘Asian’). Some respondents and some providers have chosen to alter collection forms or allow respondents to select ‘Fijian’ and ‘Indian’ separately. This creates two codes – ‘Fijian 36111 (level 1 Pacific Peoples)’ and ‘Indian 43100 (level 1 Asian)’ – with prioritised output, this aggregates to ‘level 1 Pacific Peoples’. This has implications for funding formulae and health status monitoring for both Pacific and Asian populations. Respondents identifying as ‘Fijian Indian’ must be coded 43112” [12].
However, in practice, most administrative data collection across, for example, schools, hospitals, and medical centres, lacks the administrative infrastructure to select accurate ethnicity codes and put such guidelines into practice. For example, in electronic platforms, respondents are frequently unable to select level 4 ethnic codes, because the drop-down menus only offer up to level 2 ethnic code options. To change the drop-down menu options for ethnicity across all administrative databases would require a mandated change to ensure consistent collection; however, this has not been instigated nationally to date. Figure 1 depicts a screenshot of an online enrolment form currently used within the education sector in NZ. The response: ‘No results found’ is returned when for example ‘Fijian Indian’ is entered into the ‘student ethnic information’ field. To progress through such forms, one must select at least one option that returns a ‘valid’ result. In the absence of options that relate to level 4 codes such as ‘Fijian Indian,’ no matter how motivated a respondent is to accurately capture their ethnicity, the options ‘Fijian’ or ‘Indian,’ or a combination of the two, are likely selected to enable the respondent to complete and submit the enrolment form.
Furthermore, when information is coded in the census process, text responses are edited and transformed to meet a preset classification. For example, when a respondent enters ‘Fiji Indian,’ ‘Fijian Indian,’ or ‘Indo-Fijian,’ as one of their ethnicities, this will be coded as 43112 (Fijian Indian). However, if ‘Indian Fijian’ is stated by a respondent, this may be recorded as two ethnicities– Indian (43100) and Fijian (36100) - when it is unclear whether one response or two is being provided. Such processing has the potential to introduce a mismatch between what the respondent intended as their ethnic identification and how it is coded and later interpreted. The numerical representation of ethnic counts should not overshadow the significance of the social context itself [13].
The objectives of this paper are (a) to estimate the growth and current size of the population from Fiji that now lives in NZ using ethnicity and other data dimensions from available censuses, (b) to provide a revised estimate for the two largest ethnic groups contributing to the PF population count, using additional dimensions such as country of birth and parental ethnicity. In this paper, we outline the growth and current size of the population from Fiji that now lives in NZ. This is a crucial step in deriving a denominator of total population size that correlates with the resident population and therefore can be used to estimate and monitor changes in, for example, access to health, education, and social welfare services for this population over time.
2. Materials and Methods
Data Sources
The analysis of population counts utilized data from the Censuses of Population and Dwellings conducted between 1976 and 2018 in NZ. All counts refer to the usually resident population. These data tables are static and sourced from published volumes of Census data for each relevant year. Notably, detailed cross-tabulations of ethnicity by birthplace were not available for all years; thus, only the 2018 Census was used to estimate revised total population counts.
Data Licensing and Access
The 2018 Census customized data tables from Stats NZ are licensed for re-use under the Creative Commons Attribution 4.0 International license. These tables were provided through CONZUL (University of Auckland) under Job reference #JOB-11551.
Data Processing
Customized ad-hoc tables of census data were provided by Statistics NZ. The tables and cross-tabulations were specified by the authors (RD and PN). Data extraction and tabulation from the census output datasets were made using Supercross and SAS-EG to obtain counts for relevant variables in the following order:
- Coded as Fijian Indian (43112)
- Country of birth (born in Fiji and coded to Indian ethnicity 43000)
- Children of parents coded as Fijian Indian (43112) within a family not captured by steps 1 or 2
- Language spoken (Fiji Hindi speakers not captured by steps 1-3)
Filter 3 above refers to children still living at home, born in NZ, and having at least one parent coded with Fijian Indian ethnicity. This category does not include children who identify as Fijian Indian (already counted in the first slice) or children recorded as having Indian ethnicity and born in Fiji (accounted for in a previous step).
To ensure each unique individual was counted only once, the counts from each consecutive criterion included only the remaining population not already counted. All data was de-identified by Statistics NZ prior to release in accordance with data confidentiality and privacy protocols.
Longitudinal Data
As noted above, the analysis in this paper was primarily limited to data from the 2018 Census. An additional source utilized was the NZ Linked Census which is a database of longitudinal data in the censuses 1981-2018, available to researchers within the Statistics NZ Datalab environment [14]. This resource enabled counts of children no longer living at home with their parents in 2018 who reported a different ethnicity from their Fijian Indian parents. An assessment of the quality of the linking and historical family coding lead us to the conclusion that only an approximate estimate was possible, finding an additional 2,568 people potentially of Fijian Indian ethnicity not observed in the 2018 Census (because they were no longer living at home in 2018 with their parents, though this may include a few who were deceased prior to 2018, or no longer lived in NZ).
3. Results
This section illustrates how populations from Fiji moving to NZ have grown over time and additional dimensions that assist in estimating a more accurate combined total of the now resident population in NZ. People of Fijian ethnicity and Fijian Indian ethnicity may be born in Fiji, NZ or elsewhere, contributing to the growth of the ethnic communities in NZ.
Population Change for Fijian Ethnicity Over Time
As shown in Table 1, the number of respondents identifying with Fijian ethnicity increased steadily from 1976 to 2018, with the largest increase (146%) observed after 2006. This surge potentially coincides with significant emigration from Fiji following the 2006 coup [15,16]. The gender distribution remained relatively balanced, with 5.2% more men than women, possibly due to the influx of male seasonal workers in this period or a higher likelihood of Fijian Indian men identifying along nationality lines.
Population Change for Fijian Indian Ethnicity Over Time
Table 2 summarises the growth of the Fijian Indian population from 1991 to 2018. Significant increases were observed following the 1987 (253%), 2000 (202%), and 2006 (81%) coups [17,18,19,20]. As expected for recent migration flows, most respondents were born in Fiji, albeit with an emerging component of the population born in NZ.
Population Change for the Fiji-Born Population Over Time
Consistent with the previous tables, Table 3 shows the number of people resident in NZ but born in Fiji significantly increasing after each coup. The numbers are nearly double the combined total of respondents coded as Fijian and Fijian Indian. A large proportion of the counts correlate with people born in Fiji who are coded to Indian ethnicity 43000 (see Table 4), this indicates the scale of the potential misclassification of ethnic groups from Fiji, especially of Fijian Indians. These counts also include people of other ethnicities such as i-Kiribati or Rotuman or people of European ethnicities born in Fiji, as well as people without specified ethnicities, albeit in smaller numbers.
Misclassification in Ethnicity
Table 4 highlights a significant misclassification issue in census data. Many Fijian Indians were recorded simply as "Indian" due to the presence of tick-box labelled “Indian” [21]. In 1976, the Indian population in NZ exceeded 10,000, with 47% born locally and 15% born in Fiji. By 2018, this population had grown to 239,193, with 20% born in Fiji. Consistent with patterns emerging in Table 1, Table 2 and Table 3, the growth correlates with migration surges following the Fijian coups of 1987, 2000, and 2006.
Within the context of this paper, the 49,365 Fiji-born Indians in New Zealand may be regarded as Fijian Indian. This is consistent with the small number (1,400) of Non-Resident Indians (NRIs), registered as overseas citizens of India, residing in Fiji out of a total Indian-origin population of 315,198, as reported by India’s Ministry of External Affairs [22]. A similar trend is observed in Australia, where the 2021 Census recorded 68,947 Fiji-born individuals coded with Indian ethnicity, 58% of whom spoke Fijian Hindustani or Hindi [23].
Ethnicity of Children with a Fijian Indian Parent
Table 5 tabulates children who did not identify as Fijian Indian but lived with at least one Fijian Indian parent. In the 2018 Census, 15,711 children met this criterion. This count refers only to people coded as a child resident with a family on Census night, by definition living at home with a parent. This excludes children not living with their parents on census night.
Using the NZ Linked Census longitudinal data, we can estimate the number of individuals who would be classified as children of Fijian Indian parentage not in a census family in 2018 because they were no longer living at home. Given that the Fijian Indian diaspora in NZ is a relatively recent migrant population, by 2018, only a small number of children were old enough to fall into this category. This suggests that a minimum additional 2,568 people may be of Fijian Indian descent, and by implication ethnicity, according to these criteria. These counts are included in the 18,279 total for children of Fijian Indian parents noted in table 6 below.
Associated with differences in ethnic identification of children is the phenomenon of ethnic mobility [24]. Ethnicity, as defined and operationalized in NZ, is self-defined and people may legitimately change their ethnicities over time and in response to changing environments. We have made assumptions here that the coding issues far outweigh the expected level of ethnic mobility for children both living at home and who have left home. Uncertainties in the available data do not invalidate our assumption that these people have at least Fijian Indian ancestry and that this is equivalent to Fijian Indian ethnicity for the purposes of estimating a more accurate total count for PF.
Towards a Revised Estimate Population Count for Peoples of Fiji
An accurate denominator for PF is dependent on the reliable representation of the diverse groups that fall within this larger grouping. While we can be confident the 2023 Census ethnic group summaries for Fijian code 36100 and Fijian Indian code 43112 (25,038 [25] and 23,808 [26] respectively) belong in the PF denominator, they remain a significant undercount for the total PF population based on the 2018 counts shown in Table 1, Table 2, Table 3, Table 4 and Table 5. Table 6 provides a revised estimate of the Fijian Indian subgroup which is most affected by the misclassification in NZ, totalling 73,056 people, (31% of the total Indian population resident in NZ on census night in 2018) and brings the revised estimate for the PF denominator to 92,778 for 2018.
The Fijian Indian revised estimate includes various dimensions such as ethnicity, birthplace and language spoken, as described:
To the count of people identifying with at least one ethnic code as Fijian Indian (n=15,132), we added the number of people recorded as “Indian ‘not further defined’ (nfd)” with country of birth, Fiji (n=38,190). The estimate of children of Fijian Indian parentage, who were living with their parents on Census night but were not themselves coded as Fijian Indian, together with children who had left home, estimated through the NZ Linked Census longitudinal data, made it possible to add an estimated further 18,279 people.
Arguably, we can include other people who speak Fiji Hindi but did not report any of the above ethnicity criteria. There were 1,365 people who were Fiji-born speakers of Fiji Hindi but not coded as Indian or Fijian Indian. In addition, there is a small number of NZ-born Fiji-Hindi or Hindi speakers of Fijian ethnicity who were not coded as either Indian or Fijian Indian (n=90) who have been, tentatively, included in our revised estimate.
Census net undercount is a further source of uncertainty which will tend to result in an under-estimation of communities. The 2018 Census Post Enumeration Survey (PES) found that for ethnicities within the broad Asian and Pacific groupings had a net undercount of 3.3% and 4.9% respectively [27]. The sample for the PES was too small to estimate coverage at a more detailed ethnic level. Considering that the primary issue with PF counts pertains to the Fijian Indian ethnic grouping, this paper demonstrates that these counts significantly differ from the census data.
4. Discussion
The results of this study highlight the significant undercount of populations originally from Fiji in NZ’s census data. This undercount is primarily due to the limitations of the ethnicity data, which fails to capture the complexity of minority migrant groups [28]. Previous studies have similarly noted the challenges of accurately representing diverse populations using a single ethnic category [10,11]. The additional granularity obtained from dimensions such as country of birth, and language spoken demonstrates their utility in providing revised estimates for population counts and delineating the demographic characteristics of the groups of interest.
Ethnic mobility, where an individuals’ ethnic identification changes over time and between contexts, further complicates the interpretation of census data [29]. This phenomenon is particularly prevalent among younger age groups in NZ, who may identify with multiple ethnicities or as "New Zealander", changing their ethnicities as they progress through life stages. The absence of a dedicated tick box for Fijian Indians and the misclassification of people because of the presence of the ‘Indian” tick box further exacerbates the undercount. Language barriers and the failure, in some collections (such as health and education administrative data), to account for level 4 codes also contribute to the inaccuracies.
The implications of these findings are significant. Accurate population data is crucial for effective health planning, early intervention in health risks, and equitable resource allocation across education, health, and social services. The undercount of the Fijian and Fijian Indian populations means that these communities are likely underserved in these areas. Compared to UK and US, data for ethnicity is collected for over 200 different ethnic groups in NZ, however despite the potential to collect and report extremely granular data, government agencies and academia frequently collapse the granularity to a handful of heterogenous ethnic categories for reporting purposes [30]. Grouping multiple heterogenous groups together has the potential to mask important inequalities. We see this in Fiji. The constant pooling of data from both i-Taukei and Indo-Fijian groups into one heterogenous group masks the health risks that affect one group more than the other, for example diabetes related limb complications are more prevalent among i-Taukei [30,31,32], while diabetes related kidney complications are more common among Indo-Fijian [33]. When the results are pooled, the risks unique to each respective group becomes masked or averaged out.
The debate over updating ethnicity classifications to include all relevant subgroups within the "Fijian" category involves compelling arguments on both sides, as discussed in the next two paragraphs:
For: The current classification system, which does not specify subgroups such as i-Taukei, Rotuman, or Indo-Fijian, is inadequate. "Fijian" is a nationality, not an ethnicity, and thus could be broken down into more specific categories. For example, the "Indian" category includes diverse subgroups with distinct ancestries and geographic origins, yet they are pooled together in one larger ‘subcontinent’ category [34]. Ethnicity is an arbitrary, social construct with no biological basis, is a relatively subjective, self-determined classification that can change throughout life [35]. With increasing numbers of people who identify with multiple ethnicities, the utility of this dimension in distinguishing between distinct people groups becomes increasingly redundant [36]. Unlike ancestry, which is a dimension that remains static for an individual throughout life and can be correlated with extreme environments such as prolonged famine exposure. Additionally, as demonstrated by limb versus renal complications among i-Taukei versus Indo-Fijian groups respectively in Fiji, it is important to distinguish between subgroups at a more granular level of detail. This granularity can help address specific health needs linked to place of origin and ancestry especially when paired with other metrics like birthweight and urban/rural status. The inclusion of a Fijian Indian subgroup within the Fijian grouping is accurate and necessary for effective policy-making.
Against: The term "Fijian" can refer to nationality when discussing birthplace and citizenship, but in English, it is often used to mean i-Taukei ethnicity. In Vosa vakaviti the word i-Taukei translates in English to “owners of the land” [37]. Rotuman, with roots in central Polynesia, is an ethnicity within the Pacific groupings, and its political connection to Fiji is a separate issue [38]. The current classification is already a mix of ethnicities, ancestries, nationalities, and religions, making it complex [21,39,40]. Adding more granularity could further complicate data collection and analysis, especially given the realities of the data ecosystem. There is misunderstanding of the potential funding impacts if further ethnic data granularity were to be incorporated. It could be perceived this work will reduce funding for i-Taukei. However, the current discrepancy between numerators and denominators highlighted in this article demonstrate that statistics relating to Peoples of Fiji living in New Zealand do not effectively influence funding decisions.
Improving the ethnicity standard for major groups of Fijian origin in NZ requires a multifaceted strategy. A balanced approach could involve a phased implementation of subgroups, starting with extensive consultations with the affected communities to ensure their perspectives and needs are adequately represented. This community-driven approach will help identify specific areas requiring attention and ensure that health services are tailored to meet the unique needs of people from Fiji. One key approach is to enhance capability through scholarships for ethnic minority groups, enabling them to become proficient in using microdata, such as the Integrated Data Infrastructure (IDI) [41] for more granular exploration of ethnicity and birthplace information. In addition, given the established link between birthweight and the developmental origins of diseases such as diabetes and heart disease [42,43], incorporating birthweight as a function of gestational age and ethnic group, into diabetes and CVD risk assessments and routine screening could enhance the effectiveness of risk classification system within the health context, particularly for ethnic minority groups. Finally, campaigns to promote awareness about the importance of accurate ethnicity data collection among healthcare providers and the community require better resourcing and collaboration.
Future research should focus on developing methods to account for ethnic mobility and its impact on population counts. Additionally, there is a need for more inclusive data collection practices that capture the diversity of minority groups (both migrant and locally born), a problem not unique to NZ [44]. This could include the use of additional dimensions such as ancestry and birthplace, which can provide a more comprehensive view of the population and help in predicting health risks. This is particularly relevant for groups who have experienced (or descend from) extreme environments of famine or trauma.
5. Conclusions
This study examined the discrepancies in ethnicity capture for the Peoples of Fiji living in NZ. The 2018 census counts fail to accurately represent the estimated 73,056 Fijian Indian individuals identified using additional dimensions such as birthplace. The significant undercount of Fijian Indian ethnicity in the census is largely due to people being coded as Indian, with fewer being miscoded as Fijian. This miscoding does not significantly affect the census counts of i-Taukei. The total count for PF in NZ is estimated to be between 95,000 and 100,000, assuming that the census count for Fijian ethnicity is not heavily undercounted. Miscoding Fijian Indian as Fijian in other data sources complicates data comparison across different sets and has a greater differential effect on i-Taukei. The impact of this miscoding on i-Taukei counts and their health challenges requires further investigation. These findings indicate that the collection and coding of the ethnicity dimension alone poorly represents groups from Fiji and is often confounded by ethnic mobility and the availability or absence of a dedicated tick box or, limitations in electronic data systems to accurately capture level 4 ethnic codes. There is an urgent need for enhanced data collection, mining, and reporting for ethnic minority groups who are already underserved in a system not designed for the ethnically diverse and multi-ethnic society NZ is today. Evidence-based intervention for health planning and delivery, as well as partnerships with community representatives to increase census participation, and uptake of interventions are crucial for moving towards equitable health outcomes for ethnic minority groups in NZ.
Author Contributions
For research articles with several authors, a short paragraph specifying their individual contributions must be provided. The following statements should be used “Conceptualization, P.N. and R.D.; methodology, R.D.; writing—original draft preparation, P.N. and R.D.; writing—review and editing, I.V and A.T.; funding acquisition, P.N. All authors have read and agreed to the published version of the manuscript.”
Funding
PN is funded by the National Heart Foundation of New Zealand Research Fellowship and Project grant
Data Availability Statement
Data used in this paper were derived from customized, confidentialised, ad hoc cross-tabulations provided by Statistics NZ from the 2018 Census of Population and Dwellings. These tables are available from the corresponding authors.
Conflicts of Interest
“The authors declare no conflicts of interest.”
Abbreviations
The following abbreviations are used in this manuscript:
| PF | Peoples of Fiji |
References
- Summy: Hilary. Fiji’s forgotten people: the legatees of “blackbirding”. [Paper in special issue: Australia and the Pacific Islands: A Neighbourhood with Histories. Quanchi, Max (ed.)]. Social Alternatives, 2009, 28, 39-44.
- Shlomowitz, Ralph. The Fiji Labor Trade in Comparative Perspective, 1864-1914. Pacific studies, 1986, 9, 107.
- Gillion, Kenneth L. Fiji’s Indian migrants: a history to the end of indenture in 1920. Oxford University Press in association with the Australian National University: Melbourne, 1962.
- Tinker, Hugh. A new system of slavery; the export of Indian labour overseas, 1830-1920. published for the Institute of Race Relations by Oxford University Press: London, 1974.
- Lal, B. V. Girmitiyas, the origins of the Fiji Indians. Australian National University: Canberra, 1983.
- Singh, N. and Chapparban, S. Literature of Girmitiya: History, Culture and Identity. Palgrave Macmillan: Singapore, 2023.
- Willans, Fiona and Prasad, Rajendra. From Hindustani to (Fiji) Hindi and Back to Fiji Baat? Metalinguistic Reconstructions of the National Variety of Hindi in Fiji. The Journal of Pacific History, 2021, 56, 101-18. [CrossRef]
- Shameem, N. Fiji Hindi in Fiji. In Heritage Language Policies around the World. 1, C. Seals and S. Shah. Routledge: London 2017; 254-68.
- Gounder, F. Restorying indenture. The first Fiji Hindi speakers narrate girmit. PhD, Massey University, Palmerston North, 2011.
- Lang, K. Measuring ethnicity in the New Zealand Population Census. Statistics New Zealand, Wellington; Statistics New Zealand: Wellington, 2002; Available online: https://statsnz.contentdm.oclc.org/digital/api/collection/p20045coll4/id/48/download (accessed on 17 January 2025).
- Statistics New Zealand. Experimental ethnic population estimates from linked administrative data; Statistics New Zealand: Wellington, 2018. Available online: www.stats.govt.nz (accessed on 23 January 2025).
- Ministry of Health, Govt of NZ. Ethnicity Data Protocols. Ministry of Health: Wellington, 2017. HISO 10001. Available online: https://www.health.govt.nz/system/files/documents/publications/hiso_10001-2017_ethnicity_data_protocols_may-21.pdf (accessed on 17 January 2025).
- Didham, R. and Callister, P. The effect of ethnic prioritisation on ethnic health analysis: a research note. N Z Med J, 2012, 125, 58-66.
- Didham, R., Nissen, K. and Dobson, W. Linking censuses: New Zealand longitudinal census 1981–2006. Statistics New Zealand: Wellington, 2014. Available online: https://www.stats.govt.nz/assets/Uploads/Retirement-of-archive-website-project-files/Methods/Linking-censuses-New-Zealand-longitudinal-census-19812006/linking-censuses-nzlc-1981-2006.pdf (accessed on 17 January 2025).
- Fraenkel, J., Firth, S. and Lal, B. V. The 2006 Military Takeover in Fiji. ANU Press: Canberra, 2009.
- Lee, H. Pacific migration and transnationalism: historical perspectives. In Migration and transnationalism Pacific Perspectives. H. Lee and S. Francis. ANU Press: Canberra 2009.
- Ratuva, S. The Military Coups in Fiji: Reactive and Transformative Tendencies. Asian Journal of Political Science, 2011, 19, 96-120. [CrossRef]
- Lal, B. V. and Pretes, M. Coup: reflections on the poltiical crisis in Fiji. 2. ANU Press: Canberra, 2008.
- Bedford, R. Out of Fiji… A Perspective on Migration after the Coups. Pacific Viewpoint, 1989, 30, 142-53. [CrossRef]
- Voigt-Graf, Carmen. Migration and Transnational Families in Fiji: Comparing Two Ethnic Groups. International Migration, 2008, 46, 15-40. [CrossRef]
- Rocha, Z. L. and Didham, R. Not Indian, Not African: Classifying the East African Asian Population in Aotearoa New Zealand. Genealogy, 2024, 8. [CrossRef]
- Ministry of External Affairs, Govt of India. Population of Overseas Indians. OIA Publications. Available online: www.mea.gov.in/images/pdf/3-population-overseas-indian.pdf (accessed on 17 January 2025).
- Australian Bureau of Statistics. People in Australia who were born in Fiji. 2021 Census Country of birth QuickStats. 2021. 2021. Available online: https://www.abs.gov.au/census/find-census-data/quickstats/2021/1502_AUS (accessed on 17 January 2025).
- Didham, R. and Rocha, Z. L. Where You Feel You Belong: Classifying Ethnicity and Mixedness in New Zealand. In The Palgrave International Handbook of Mixed Racial and Ethnic Classification. Z. L. Rocha and P. J. Aspinall. Palgrave Macmillan Cham: Switzerland 2020; 587-604.
- Statistics New Zealand. 2023 Census Ethnic Gorup summaries. Fijian Quick Stats. Statistics New Zealand: Wellington, 2024. Available online: https://tools.summaries.stats.govt.nz/ethnic-group/fijian (accessed on 23 January 2025).
- Statistics New Zealand. 2023 Census Ethnic Gorup summaries. Fijian Indian Quick Stats. Statistics New Zealand: Wellington, 2024. Available online: https://tools.summaries.stats.govt.nz/ethnic-group/fijian-indian (accessed on 23 January 2025).
- Statistics New Zealand. Post enumeration survey 2018: methods and results. Statistics New Zealand: Wellington, 2020. Available online: www.stats.govt.nz/methods/post-enumeration-survey-2018-methods-and-results (accessed on 23 January 2025).
- Didham, R. Reflections of identity: ethnicity, ethnic recording and ethnic mobility. In Mana Tangatarua: Mixed heritages, ethnic identity and biculturalism in Aotearoa/New Zealand. Z. L. Rocha and M. Webber. Routledge: London 2018; 32-52.
- Didham, R. Ethnic mobility in the New Zealand Census, 1981–2013: A preliminary look. New Zealand Population Review, 2016, 42, 27–42.
- Stanaway, F., Zhu, L., McDonald, B., Ravulo, J., Dickson, M., Nassar, N. and Allen, L. Using linked Census data to categorise the population by ethnicity and enhance understanding of ethnic inequalities in health in Australia. OSF Preprint, 2024. [CrossRef]
- Kumar, K., Snowdon, W., Ram, S., Khan, S., Cornelius, M., Tukana, I. and Reid, S. Descriptive analysis of diabetes-related amputations at the Colonial War Memorial Hospital, Fiji, 2010-2012. Public Health Action, 2014, 4, 155-8. [CrossRef]
- Khan, S., Mohammadnezhad, M., Ratu, A., Ghosh, A., Ali, W., Nand, D. and Mangum, T. Patterns and risk factors associated with index Lower Extremity Amputations (LEA) among Type 2 Diabetes Mellitus (T2DM) patients in Fiji. Prim Care Diabetes, 2021, 15, 1012-18. [CrossRef]
- Chandra, Y., Malani, J., Irvine, J. H., Krishnan, A., Johnson, D. W., Ritchie, A. G. and Palmer, S. C. Incidence, treatment patterns and clinical outcomes associated with acute kidney injury in Fiji: a retrospective cohort study. J Nephrol, 2023, 36, 1689-92. [CrossRef]
- Statistics New Zealand. Statistical standard for ethnicity V1.0.0. Statistics New Zealand: Wellington, 2023. Available online: https://aria.stats.govt.nz/aria/#StandardView:uri=http://stats.govt.nz/cms/StatisticalStandard (accessed on 28 March 2025).
- Andreasen, Robin O. Race: Biological Reality or Social Construct? Philosophy of Science, 2000, 67, S653-S66. [CrossRef]
- Yao, Esther S., Meissel, Kane, Bullen, Pat, Clark, Terryann C., Morton, Susan and Atatoa Carr, Polly. Classifying multiple ethnic identifications: Methodological effects on child, adolescent, and adult ethnic distributions. Demographic Research, 2021, 44, 481-512. [CrossRef]
- Williksen-Bakker, S. Vanua—a Symbol with Many Ramifications in Fijian Culture. Ethnos, 1990, 55, 232-47. [CrossRef]
- Titifanue, J., Varea, R. R., Varea, R., Kant, R. and Finau, G. Digital diaspora, reinvigorating Indigenous identity and online activism: social media and the reorientation of Rotuman identity. Media International Australia, 2018, 169, 32-42. [CrossRef]
- Shoup, B. D. Ethnic redistribution in bipolar societies: The crafting of asymmetric policy claims in two Asia-Pacific states. Perspectives on Politics, 2011, 9, 785-802. [CrossRef]
- Teaiwa, M. K. South Asia down under: Popular kinship in Oceania. Cultural Dynamics, 2007, 19, 193-232. [CrossRef]
- Milne, Barry J., Atkinson, June, Blakely, Tony, Day, Hilary, Douwes, Jeroen, Gibb, Sheree, Nicolson, Meisha, Shackleton, Nichola, Sporle, Andrew and Teng, Andrea. Data Resource Profile: The New Zealand Integrated Data Infrastructure (IDI). International Journal of Epidemiology, 2019, 48, 677-77e. [CrossRef]
- Gluckman, P. D., Hanson, M. A., Cooper, C. and Thornburg, K. L. Effect of in utero and early-life conditions on adult health and disease. New England Journal of Medicine, 2008, 359, 61. [CrossRef]
- Hales, C. N., Barker, D. J. P., Clark, P. M. S., Cox, L. J., Fall, C., Osmond, C. and Winter, P. D. Fetal and infant growth and impaired glucose tolerance at age 64. British Medical Journal, 1991, 303, 1019-22. [CrossRef]
- Aspinall, Peter J. Answer Formats in British Census and Survey Ethnicity Questions: Does Open Response Better Capture ‘Superdiversity’? Sociology, 2012, 46, 354-64. [CrossRef]
Figure 1.
‘Fijian Indian’ is not an option on online enrolment forms within the education sector.
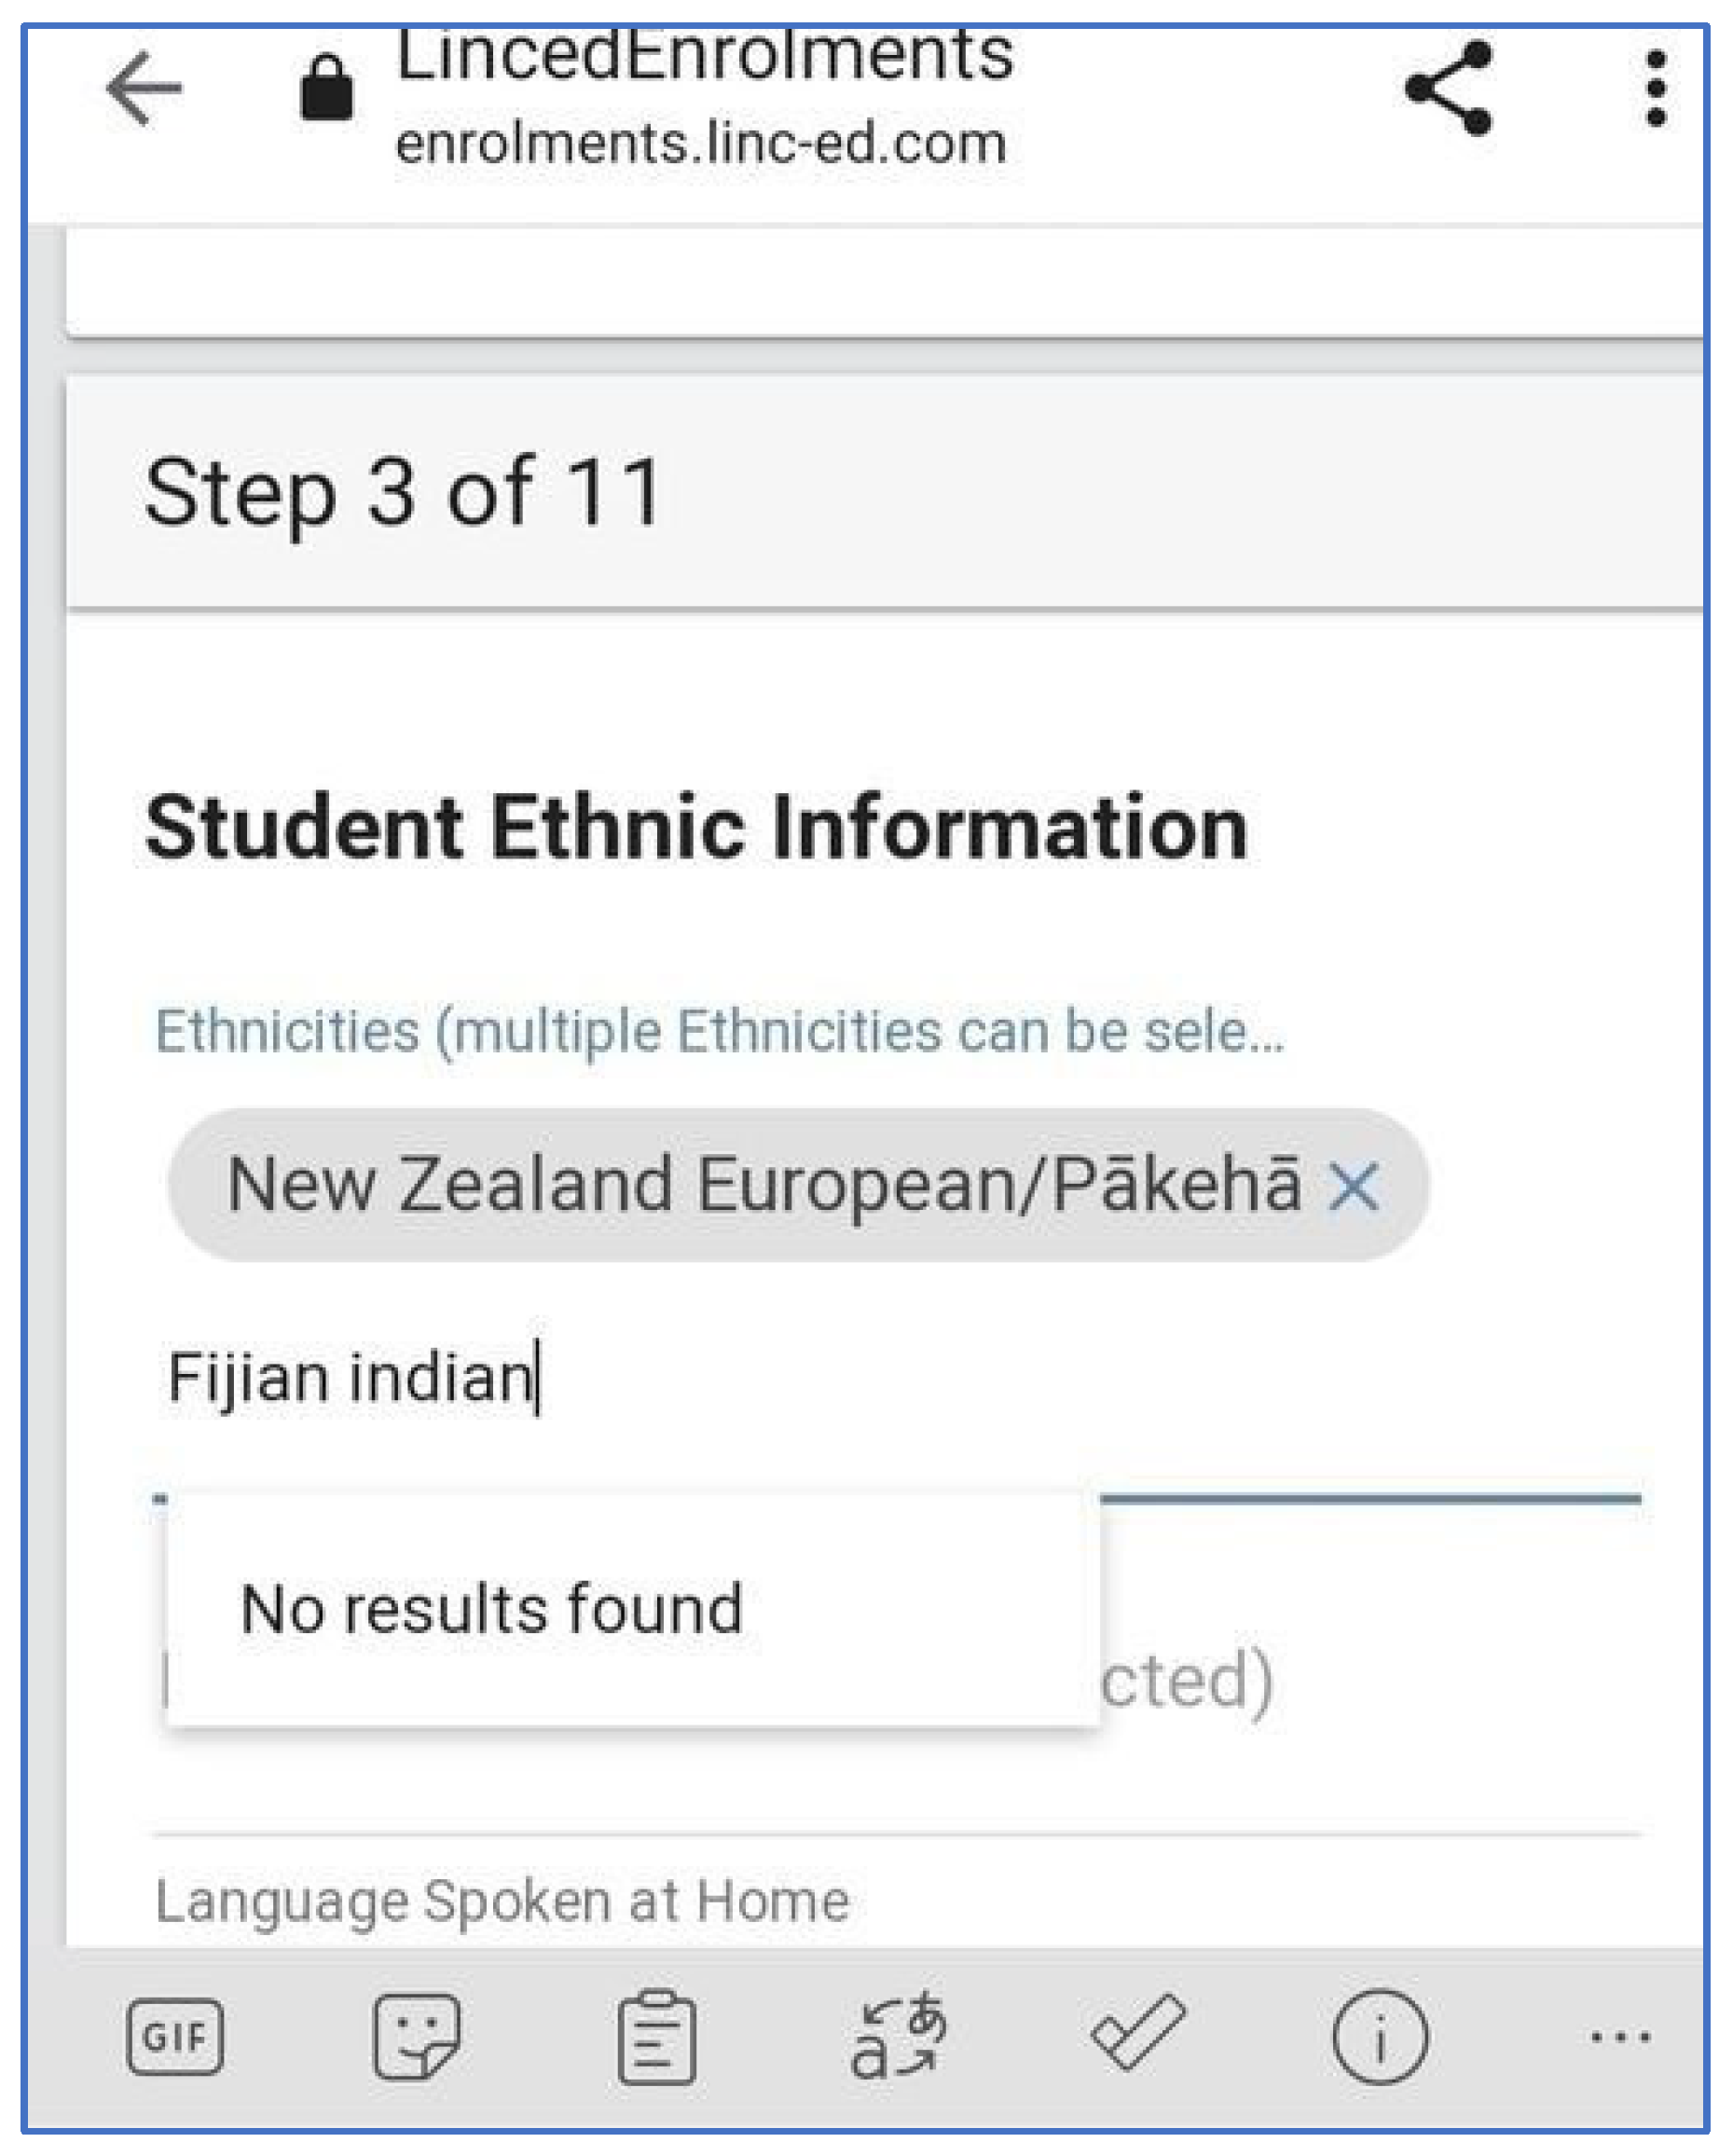

Table 1.
People of Fijian (361) ethnicity. 1.
| Census Year | Female | Male | Total |
|---|---|---|---|
| 2018 | 9612 | 10110 | 19722 |
| 2013 | 7278 | 7167 | 14445 |
| 2006 | 5007 | 4854 | 9861 |
| 2001 | 3675 | 3366 | 7041 |
| 1996 | 3909 | 3786 | 7695 |
| 1991 | 2610 | 2490 | 5100 |
| 1986 | 2085 | 2178 | 4263 |
| 1981 | 1427 | 1577 | 3004 |
| 1976 | 1141 | 1171 | 2312 |
1 Source: Censuses of population and dwellings, 1976-2018.
Table 2.
People of Fijian Indian (43112) ethnicity. 2.
| Census Year | Total | Born in NZ |
Born in Fiji | Born elsewhere |
|---|---|---|---|---|
| 2018 | 15132 | 3648 | 11175 | 309 |
| 2013 | 10929 | 1833 | 8874 | 222 |
| 2006 | 5616 | 717 | 4824 | 75 |
| 2001 | 1983 | 345 | 1599 | 39 |
| 1996 | 2970 | 390 | 2490 | 90 |
| 1991 | 783 | 63 | 705 | 15 |
2 Source: Censuses of population and dwellings, 1991-2018.
Table 3.
People of any ethnicity with country of birth listed as Fiji. 3.
| Census Year | Female | Male | Total |
|---|---|---|---|
| 2018 | 32046 | 30261 | 62307 |
| 2013 | 27366 | 25389 | 52755 |
| 2006 | 19917 | 18762 | 38679 |
| 2001 | 13455 | 12267 | 25725 |
| 1996 | 9648 | 9126 | 18774 |
| 1991 | 8307 | 8406 | 16713 |
| 1986 | 3579 | 3657 | 7239 |
| 1981 | 3042 | 3330 | 6372 |
| 1976 | 2906 | 3276 | 6182 |
3 Source: Censuses of population and dwellings, 1976-2018.
Table 4.
People of Indian (431) ethnicities. 4.
| Census Year | Total | Born in NZ | Born in Fiji | Born elsewhere |
|---|---|---|---|---|
| 2018 | 239193 | 55839 | 49365 | 133989 |
| 2013 | 155178 | 36012 | 42033 | 77133 |
| 2006 | 104583 | 23832 | 29736 | 51015 |
| 2001 | 61842 | 17796 | 19290 | 24756 |
| 1996 | 42408 | 14619 | 12720 | 15069 |
| 1991 | 30609 | 9501 | 10770 | 10338 |
| 1986 | 15180 | 7863 | 2157 | 5160 |
| 1981 | 11244 | 5157 | 1512 | 4575 |
| 1976 | 10308 | 4869 | 1545 | 3894 |
4 Source: Censuses of population and dwellings, 1976-2018.
Table 5.
Children (not recorded as Fijian Indian) in families with at least one Fijian Indian parent. 5.
Table 5.
Children (not recorded as Fijian Indian) in families with at least one Fijian Indian parent. 5.
| Age at 2018 Census | Count | Percent |
|---|---|---|
| Under 5 years | 4251 | 27.1 |
| 5-9 years | 3969 | 25.3 |
| 10-14 years | 3036 | 19.3 |
| 15-19 years | 2016 | 12.8 |
| 20-24 years | 1281 | 8.2 |
| 25 years and over | 1158 | 7.4 |
| Total | 15711 | 100 |
5 Source: Censuses of population and dwellings, 2018.
Table 6.
Estimating a revised count for the Fijian Indian population living in NZ, 2018 Census. 6.
| Ethnicity coding and additional dimensions | Total | Male | Female |
|---|---|---|---|
| Coded as Fijian Indian (43112) | 15132 | 7275 | 7857 |
| Coded as Indian nfd* (43100) and Fiji-born | 38190 | 18251 | 19939 |
| Children of Fijian Indian parent(s) not coded elsewhere | 18279 | 8620 | 9659 |
| Fiji Hindi speakers not coded as Indian | 1365 | 735 | 630 |
| Fiji Hindi speakers born in NZ | 90 | 51 | 39 |
| Total | 73056 | 34932 | 38124 |
6 Source: Censuses of population and dwellings, 2018.
Disclaimer/Publisher’s Note: The statements, opinions and data contained in all publications are solely those of the individual author(s) and contributor(s) and not of MDPI and/or the editor(s). MDPI and/or the editor(s) disclaim responsibility for any injury to people or property resulting from any ideas, methods, instructions or products referred to in the content. |
© 2025 by the authors. Licensee MDPI, Basel, Switzerland. This article is an open access article distributed under the terms and conditions of the Creative Commons Attribution (CC BY) license (http://creativecommons.org/licenses/by/4.0/).
Copyright: This open access article is published under a Creative Commons CC BY 4.0 license, which permit the free download, distribution, and reuse, provided that the author and preprint are cited in any reuse.


