Submitted:
12 April 2025
Posted:
15 April 2025
You are already at the latest version
Abstract
There are many uncertainties in the process of technology projects “Unveiling and Commanding” system which can easily lead to the risk of failing to achieve the expected effect of technology quality. In order to ensure that the implementation of the system can achieve the expected results, the indicator system for risk assessment of technology projects “Unveiling and Commanding” system is established on the basis of expert interviews and field research. The improved game theory multiple combination weighting method is used to weight the indicators to reduce error risk of the weight results. This paper makes a comprehensive risk assessment of technology projects “Unveiling and Commanding” system from the two dimensions of risk possibility and risk impact degree based on two-dimensional cloud model, so as to reduce the subjectivity, randomness and fuzziness of assessment results. The example verifies that the model is reasonable and effective, and has a certain guiding role in the improvement of technology projects “Unveiling and Commanding” system.
Keywords:
technology projects
; “Unveiling and Commanding” system
; two-dimensional cloud model
; risk assessment
; multiple combination weighting
1. Introduction
The “Unveiling and Commanding” system is a kind of scientific research incentive mechanism that stimulates innovation vitality with market competition, in essence, it is a technology reward system1. This system is a mechanism to cash in scientific research funding investment with scientific research achievements, and a non-periodic scientific research funding arrangement organized by government to openly collect scientific and technological innovation achievements for the whole society2. The “Unveiling and Commanding” system is a new mode of scientific research organization that deepens the reform of scientific and technological system, strengthens the innovation and research organization, and solves the problem of disconnection between scientific research and achievement application in the process of industrial technology research organization. The system helps to mobilize the intellectual potential of all sectors of society to the greatest extent and find practical solutions at the fastest speed for the most urgent scientific research problems in the form of open innovation.
Although there are a large number of existing “Unveiling and Commanding” lists and the amount of the list is relatively large, a series of problems are gradually emerging in the specific practice process, such as the failure to set the list, the failure to select the candidate, the failure to tackle key problems, and the failure to honor the award list. In addition, the innovation of science and technology projects itself has the characteristics of high difficulty, high investment and high risk. The risk of technology projects “Unveiling and Commanding” has become increasingly apparent, which seriously affects the expected effect of this system and also restricts the breakthrough of key core technologies3. At present, there are few studies on the “Unveiling and Commanding” system, which mainly focus on its connotation, operation mechanism and process optimization, and almost no studies have discussed the risks related to the “Unveiling and Commanding” system. Therefore, it is necessary to study the risk of the technology projects “Unveiling and Commanding” system to ensure that the implementation of the system can achieve the expected effect.
The methods of risk assessment can be divided into two categories: qualitative assessment methods and quantitative assessment methods4-6. The former mainly includes expert scoring method7, risk matrix method8, Delphi method9, fuzzy analytic hierarchy process (FAHP) and so on10. The latter includes Monte Carlo simulation11, system dynamics model12, exponential creation, entropy weight method (EW) and so on13,14. At present, the more advanced risk assessment methods mainly include BP neural network assessment method15, hierarchical variable weight theory16, improved EW method17, grey correlation analysis method18, improved CRITIC method and so on19. These methods improve the objectivity and accuracy of risk assessment results to a certain extent. However, there is a large risk of error when using a single assessment method, so the combination of multiple methods has become a more popular assessment method. The game theory combination weighting method can effectively integrate weights obtained from different assessment methods, but this method cannot ensure that the linear combination coefficient is greater than zero, which limits the application of this method20,21. In order to overcome this problem, we can consider improving the existing game theory combination weighting method, and propose an improved game theory multiple combination weighting method to fuse the weights obtained by multiple weighting methods, thereby reducing the error of indicator weight calculation.
The two-dimensional cloud model is an extension of the one-dimensional cloud model, which uses the transformation between qualitative concepts and quantitative data to comprehensively evaluate the uncertainty and randomness under the joint action of two dimensions22. The risk of technology projects “Unveiling and Commanding” system is determined by the risk possibility occurrence and risk impact degree, which conforms to the application conditions of the two-dimensional cloud model. Therefore, it is scientific and effective to use the two-dimensional cloud model to establish the risk assessment model of technology projects “Unveiling and Commanding” system.
In summary, this paper constructs the risk assessment indicator system according to the characteristics of technology projects “Unveiling and Commanding” system. The indicators weights are calculated using the improved game theory multiple combination weighting method. The risk possibility and risk impact degree are taken as the basic variables of assessment, and substituted into the two-dimensional cloud model to complete the risk assessment of technology projects “Unveiling and Commanding” system.
2. Construction of Risk Assessment Indicator System of Technology Projects “Unveiling and Commanding” System
Through the sorting of previous relevant literature and field research, it is found that the process of technology projects “Unveiling and Commanding” system is roughly the same, which can be summarized into three stages: unveiling the list and selecting the candidate, tackling the key technical problems, and awarding the list. The stage of unveiling the list and selecting the candidate can be subdivided into setting the list, publishing the list, and selecting the candidate. Therefore, this study divides the risks of technology projects “Unveiling and Commanding” system into five categories: setting the list risk, publishing the list risk, selecting the candidate risk, tackling the key technical problems risk and awarding the list risk23.
(1) Setting the list risk. The quality of the list itself directly affects the effect of “Unveiling and Commanding”, which is mainly reflected in the failure to focus on major scientific and technological bottlenecks, resulting in the failure to accurately collect key core technical requirements, and the inadequate assessment of projects in the list. On the one hand, due to insufficient collection channels or insufficient mobilization of collection personnel and collection objects, some lists are mainly derived from the common scientific and technological problems put forward by local enterprises or the technical problems of individual enterprises themselves, and their overall situation, frontier and driving force are not enough, so that the key core technology needs cannot be accurately collected. On the other hand, the positioning of the technical indicators of the projects in the list is not accurate enough or the relevant requirements are not clear enough, resulting in the projects that are not suitable for “Unveiling and Commanding” are not eliminated, resulting in the low rate of unveiling the list and even the consequences of “flowing the list”. At the same time, the review of the qualifications and scientific research capabilities of the demand side is not in place, and the expert diagnosis, peer review, field research and other measures taken during the review have not been truly put into practice, which will affect the smooth development of the follow-up process of “Unveiling and Commanding”.
(2) Publishing the list risk. First of all, the publishing the list plan is not in place, which is manifested as insufficient attraction and weak operability. The relevant plan setting is similar to the general scientific research plan. Similar to general scientific research planning, some provisions are not enough incentive to effectively attract talented candidate, and the program's research and development timeliness, bonus amount and other settings are not reasonable enough to cause the talented candidate to participate in the enthusiasm is not high. Secondly, the publicity of publishing the list is not enough. It is mainly reflected in that the platform of the list is not wide enough and the way of the list is not rich enough, which leads to a small range of communication and narrow range of awareness, resulting in fewer participants, resulting in a low rate of listing disclosure or a low quality of listing disclosure.
(3) Selecting the candidate risk. The risk is mainly due to the imperfect selection mechanism of the handsome talents, which is manifested in three aspects: the qualification restrictions of the handsome talents still exist, the lack of competition among the candidates, and the lack of standardization of the selection process. Compared with the traditional vertical commissioned scientific research declaration system, the biggest difference is that the open innovation model without threshold is constructed, but in reality, this model has not been well practiced, and education background and qualifications are still the implicit screening conditions for the selection of candidates. In addition, according to the survey, at present, there is still a single revealer, with few parallel studies conducted by multiple revealers. The lack of competition leads to the revealer being easy to slack off in the research and development process, thus increasing the risk of research and development failure. Finally, there may be collusion to defraud government funds in the process of selecting commanders such as the qualification review of the revealers and the assessment of the revealers' plan. At the same time, when experts are organized to review the qualifications of the list revealers, they often organize a review meeting without conducting a field and comprehensive investigation of the list revealers, so that experts cannot deeply understand the scientific research literacy, innovation ability and other qualifications of the list revealers, which may lead to the poor adaptability of the selected talents to the technical requirements of the list.
(4) Tackling the key technical problems risk. The risk is mainly reflected in both external and internal aspects. The external risk aspect refers to the failure of the revealers to fully integrate the superior resources such as industry, university and research, which leads to the failure of technological research. At the same time, the fault tolerant mechanism, compensation mechanism, risk sharing mechanism and other collaborative research mechanisms are not perfect, which leads to the difficulty of tackling the problem, and then chooses to withdraw. The internal risk aspect refers to the problems existing in the revealers themselves, including inadequate project management (such as change of project management team, lack of leadership ability of project leaders, unreasonable work planning, etc.), insufficient cost identification of the project, resulting in excess of later costs, insufficient capacity of research and development personnel and difficulty in meeting the technical requirements of the list.
(5) Awarding the list risk. The risk is also divided into internal and external aspects. The internal risk performance includes: First, it fails to effectively combine the process assessment and the result assessment, resulting in the mismatch between the results of the disclosure and the task or scheme of the disclosure. Second, the ownership of intellectual property rights and honors finally formed by “Unveiling and Commanding” is not clear, resulting in difficulties in ranking. The external risks are mainly manifested in the lack of funds on the demand side and the list maker side, which makes it difficult to meet the funds agreed on the list, as well as the promised research and development subsidies, talent support, financial support are not provided as promised.
According to the above analysis, the indicator system for risk assessment of technology projects “Unveiling and Commanding” system is constructed, as shown in Figure 1.
Risk is the overall reflection of the occurrence possibility of a certain foreseeable emergency situation and the severity of its consequences. Risk is widespread in the technology projects “Unveiling and Commanding” system. The complexity of science and technology projects and the uncertainty of internal and external conditions make the technology projects “Unveiling and Commanding” system with great risks. Through the analysis, it can be seen that the above indicators have an impact on the “Unveiling and Commanding” system from the two dimensions of the risk possibility and risk impact degree. Therefore, the risk possibility and the risk impact degree are selected as the basic variables of assessment, and the assessment is more comprehensive from two dimensions.
3. Multiple Combination Weighting of Risk Assessment Indicator System of Technology Projects “Unveiling and Commanding” System
At present, the research on indicator weighting is relatively mature. The subjective weighting method can well reflect the intention of the evaluator, but the human subjective factors have a greater impact. The objective weighting method can make good use of objective data, but it may cause the situation that the indicators with greater impact occupy a smaller weight. In order to make effective use of objective data and consider expert opinions and suggestions, the method of multiple combination weighting is generally adopted to make the indicator weights more scientific and reasonable. In this regard, four latest research weighting methods, including hierarchical variable weight theory, improved EW method, grey correlation analysis method and improved CRITIC weight method, are selected to calculate indicator weights respectively. The improved game theory method is used to combine the weight results calculated by these four methods to obtain multiple combination weights.
3.1. Hierarchical Variable Weight Theory
The analytic hierarchy process (AHP) theory only considers the relative importance of each influencing factor in decision making, and ignores the preference for state equilibrium. Variable weight theory is essentially a dynamic modeling principle. Considering that the indicator weight should change with the change of the state of the indicator value, in order to eliminate the bias effect of the constant weight on the actual decision making in the case of extreme state value. The expert judgment matrix is obtained through the analytic hierarchy process, and then the judgment matrix is processed by formulas (1) and (2) to obtain the constant weight of each indicator. The process of solving the weight is as follows:
Combined with the existing research on variable weight theory and the research content of this paper, the variable weight formula suitable for the risk assessment of technology projects “Unveiling and Commanding” system is obtained, as shown in formula (3).
In the formula, , , and are the constant weight, state value, exponential number and variable weight of each indicator respectively. is the equilibrium coefficient, and is generally 0.2 ~ 0.3 in engineering.
3.2. Improved EW Method
The improved EW method is based on data analysis and calculation to solve the indicator weight, which can reflect the differences and importance between different indicators, and has the characteristics of consistency and stability, which is suitable for solving the assessment system with more underlying indicators. The improved EW method can ensure the objectivity of indicator weights. The process of solving the weight is as follows:
The improved EW method is used to determine the objective importance of the indicator quantity in the sample set, and the decision matrix of sample set is used to standardize the indicators of the evaluated scene. Let the sample set have J objects and M assessment indicators, and its initial decision matrix B is:
In the formula, represents the value of the β th assessment indicator of the α th object in the initial decision matrix B.
The indicators are standardized, and all the indicators are very small indicators with positive values, which are converted into very large indicators by formula (5), which are expressed as:
In the formula, is the maximum value of the th assessment indicator column, is the standardized value of the th assessment indicator of the α th object.
The information entropy of each indicator in the sample set is calculated, and the information entropy of the β th assessment indicator is as follows:
In the formula, is the proportion of the α th object in the β th assessment indicator column.
Because the method in this paper needs to calculate EW weights of a large number of objects, and the boundaries of the secondary indicators involved are subjective division, it may lead to the dispersion of some indicators is too small. In order to adapt to the application scenario of this paper, the improved EW weight calculation method is used to solve the weight of the β th assessment indicator as an example, as follows:
In the formula, τ is the correction coefficient of information entropy redundancy, and the larger the value, the smaller the dispersion of the improved EW weight. ε is a constant to limit the dispersion of the indicator from the improved EW weight. In this paper, the value of ε is 2, which means that the maximum value of the improved EW weight in the indicator does not exceed 2 times of the minimum value.
3.3. Grey Correlation Analysis
Grey correlation analysis can determine the degree of similarity or dissimilarity between two sets of system vectors. According to the grey correlation analysis, the correlation coefficient between the score vector of each indicator and the score vector of the relatively optimal indicator can be calculated. Then calculate the correlation degree of each indicator, and finally normalize the correlation degree to the weight of each indicator. The process of solving the weight is as follows:
The judgment matrix is sorted to determine the reference data column .
Calculate the absolute difference between the evaluated object sequence and the reference sequence, and determine the maximum value using formulas (10) and (11).
Using formula (12), the correlation coefficients of the corresponding values of each comparison object sequence and reference sequence are calculated respectively.
In the formula, is the resolution coefficient. If is large, the difference between the correlation coefficients is small, and the discriminant ability is weak. In general, takes 0.5.
According to the formula (13), the correlation degree of each indicator is calculated respectively, and the grey correlation analysis weight of each indicator in the formula (14) is used.
3.4. Improved CRITIC Weight Method
CRITIC method is an objective weighting method to determine the weight of assessment indicators by calculating the correlation between them. This method cannot overcome the information conflict between indicators when calculating the weights. Therefore, the improved CRITIC weight method is proposed, and the conflict coefficient is introduced to represent the information conflict between indicators. The process of solving the weight is as follows:
Firstly, the judgment matrix is transposed, and then standardized to obtain the standardized matrix , where formula (15) is used for cost indicator and formula (16) is used for benefit indicator.
The improved CRITIC method uses the coefficient of variation to measure the discrimination of indicator information, and its calculation formula is shown in formula (17).
The conflict between indicators is expressed by the conflict coefficient, and the calculation formula is shown in formula (18).
In the formula, .
is the correlation coefficient between indicators, and its calculation formula is shown in formula (19).
The information quantity of each indicator is calculated. According to the principle that the larger the information quantity is, the greater the weight of the corresponding indicator is, the corresponding weight is calculated by formulas (20) and (21).
3.5. Improved Game Theory Multiple Combination Weighting Method
In order to overcome the shortcomings of the traditional combination weighting method, the improved game theory method is used to scientifically and reasonably couple the hierarchical variable weight theory weight , the improved EW method weight , the grey correlation analysis weight , and the improved CRITIC method weight . The combination weighting process is as follows:
(1) Construct weight factor vectors set .
(2) The sub-target weight factor vectors , , and are linearly combined.
In the formula, is the comprehensive weight factor vector of the sub-target. is the linear combination coefficient. is the sub-target weight factor vector calculated by the single weighting method.
(3) Based on the idea of game aggregation model, the weight factor vectors of each sub-target are linearly combined to minimize the deviation between the comprehensive weight factor vector and vectors , , and , so as to seek the comprehensive weight compromise solution . Construct a game model to optimize the linear combination coefficient :
In the formula, .
(4) The optimal first derivative condition of formula (23) is:
The traditional game theory method cannot ensure that the linear combination coefficient is greater than zero. If it is not regular, it is contrary to the assumption. Therefore, combining formula (24) and optimizing the game model to establish a new objective function.
(5) The constraint function of formula (26) is established by referring to the constraint conditions of objective weighting method of maximizing deviation.
In the formula, .
(6) Combined with formulas (25) and (26), the optimization model of multiple combination weighting strategy of improved game theory is established as follows:
(7) In order to solve the above optimization model, the Lagrange function is established. The partial derivative is obtained to get the linear combination coefficient , and then it is normalized to get the combination coefficient solution :
(8) Finally, the multiple combination weighting vector is expressed as:
The calculation process of the improved game theory multiple combination weighting method is shown in Figure 2.
Based on the above assessment indicator system and multiple combination weighting methods, a number of experts in related fields of risk assessment of technology projects “Unveiling and Commanding” system are invited to judge the importance of risk from two dimensions of risk possibility and risk impact degree in this system. The weights of all indicators are calculated by the above weight calculation formula, and the results are shown in Table 1 and Table 2.
4. Risk Assessment of Technology Projects “Unveiling and Commanding” System Based on Two-Dimensional Cloud Model
4.1. Two-Dimensional Cloud Model Theory of Risk Assessment
The two-dimensional cloud model is improved on the basis of the one-dimensional cloud model. It expands from one assessment dimension to two assessment dimensions, and assesses advantages and disadvantages of uncertainty problem by transforming the qualitative concepts and quantitative data of the two dimensions. The model has advantages in dealing with the comprehensive assessment of uncertainty under the joint influence of two factors24.
Assuming that in the random function F of two-dimensional normal distribution, and are the expected values in X and Y directions respectively, and are the standard deviations in X and Y directions respectively, and are the standard deviations of and respectively, then the cloud model of cloud droplet satisfying formula (30) is two-dimensional cloud model:
In the formula, is the cloud droplet coordinate, is the membership degree.
The two-dimensional cloud model is obtained by combining two one-dimensional cloud models, as shown in Figure 5.
4.2. Risk Assessment of Two-Dimensional Standard Cloud
In order to make the scoring results more intuitive, the risk level of technology projects “Unveiling and Commanding” system is divided into five standard intervals, which are respectively expressed by minimal risk (level I), low risk (level II), medium risk (level III), high risk (level IV) and great risk (level V). Considering the habit of expert scoring, the improved golden section method is used to determine the five standard cloud eigenvalues25. The calculation formula is as follows:
In the formula, , and are the expectation, entropy and super entropy of the intermediate standard cloud, respectively. and are the expectations of the standard cloud on the left. and are the expectations of the standard cloud on the right. Suppose the domain value is [0, 10] and the value of is 0.1. The eigenvalues of standard cloud are calculated according to formulas (31)~(33), as shown in Table 3. The standard cloud images are generated by combining the cloud generator, as shown in Figure 6 and Figure 7.
4.3. Two-Dimensional Comprehensive Cloud of Risk Assessment of Technology Projects “Unveiling and Commanding” System
Aiming at the problem of risk assessment of technology projects “Unveiling and Commanding” system, this paper analyses the risk possibility and risk impact degree from two dimensions, and selects two dimensional eigenvalues of each assessment indicator as two groups of basic variables of two-dimensional cloud. The risk possibility and risk impact degree of each assessment indicator form a cloud droplet, which constitutes the risk possibility assessment cloud and risk impact degree assessment cloud of the indicator, collectively referred to as the secondary cloud. The reverse cloud generator is used to generate the eigenvalues of risk possibility assessment cloud and risk impact degree assessment cloud26:
In the formula, is the sample variance.
The cloud matrix of the second-level risk possibility and the cloud matrix of the second-level risk impact degree are combined with the second-level weight matrix to obtain the cloud eigenvalues of the first-level risk possibility and the first-level risk impact degree, and further obtain the cloud eigenvalues of the comprehensive risk possibility and the comprehensive risk impact degree:
In the formula, are higher-level cloud eigenvalues.
Because of the similarity between the comprehensive risk cloud image and the standard cloud image, there are some visual errors in the three-dimensional view observation. In order to determine the risk level more accurately, the closeness degree is used to reflect the degree of fit between the two. The greater the closeness degree, the closer the comprehensive risk cloud to be evaluated is to the corresponding standard cloud level. The calculation formula of closeness degree is as follows27:
In the formula: is the closeness degree; and are the expected values of the two basic variables of comprehensive risk cloud; and are the expected values of two basic variables of standard cloud.
5. Experimental Analysis
Ten experts in related fields were invited to score the risk possibility and risk impact degree of each indicator, which were recorded as and respectively. The maximum score is 10 points, and the higher the score is, the greater the risk possibility or risk impact of the indicator is. In the early stage, according to the opinions of experts in related fields, the indicators weights of risk assessment of technology projects “Unveiling and Commanding” system were determined, as shown in Table 1 and Table 2. The cloud eigenvalues of the two basic variables can be obtained by substituting the expert scores of the secondary indicators into formula (34). The above results are combined with their corresponding weights through formula (35) to finally obtain the eigenvalues of the comprehensive risk cloud. The calculation results are shown in Table 4.
Through MATLAB forward cloud generator input the eigenvalues of risk assessment cloud of technology projects “Unveiling and Commanding” system in table 4, and the first-level indicators assessment cloud images and comprehensive assessment cloud images of risk of technology projects “Unveiling and Commanding” system are obtained, as shown in Figure 8, Figure 9, Figure 10, Figure 11, Figure 12, Figure 13, Figure 14, Figure 15, Figure 16, Figure 17, Figure 18 and Figure 19.
From Figure 8, Figure 9, Figure 10, Figure 11, Figure 12, Figure 13, Figure 14, Figure 15, Figure 16, Figure 17, Figure 18 and Figure 19, it can be seen that setting the list risk is between level II and level III, and the closeness degree is similar to level II and level III. The publishing the list risk is between level III and level IV, and the closeness degree is similar to level III and level IV. The selecting the candidate risk is between level Ⅳ and level Ⅴ, but closer to level Ⅴ. The tackling the key technical problems risk is at level II. The awarding the list risk is at level IV. The technology projects “Unveiling and Commanding” system risk is between level III and level IV, but it is closer to level III. It can be found that the selecting the candidate risk is the highest, and the tackling the key technical problems risk is the lowest. It is necessary to focus on strengthening the research of selecting the candidate risk and reducing its risk.
6. Conclusion
This paper proposes the risk assessment method of technology projects “Unveiling and Commanding” system based on multiple combination weighting two-dimensional cloud model. The advantages compared with the existing methods are as follows:
1) The subjectivity and randomness of weight calculation are reduced by improved game theory multiple combination weighting method.
2) The risk of technology projects “Unveiling and Commanding” system is subdivided into two basic variables: risk probability and risk impact degree, which can reflect the system risk characteristics more comprehensively and objectively.
3) Combined with two-dimensional cloud model to assess the risk of technology projects “Unveiling and Commanding” system, effectively solve the problem of high ambiguity in risk assessment, and help to improve the objectivity of assessment results.
Author Contributions
Conceptualization, H.L. and T.C.; methodology, H.L.; software, T.C.; validation, H.L.; formal analysis, T.H.; investigation, H.L.; resources, L.Z.; data curation, H.L.; writing—original draft preparation, H.L.; writing—review and editing, T.C.; visualization, M.L.; supervision, T.H.; project administration, L.Z.; funding acquisition, M.L. All authors have read and agreed to the published version of the manuscript.
Funding
This research was funded by the National Natural Science Foundation of China (71501183).
Institutional Review Board Statement
Not applicable.
Informed Consent Statement
Not applicable.
Data Availability Statement
Not applicable.
Conflicts of Interest
The authors declare that they have no conflicts of interest to report regarding the present study.
References
- Balamurugan, G.D.; Princia, A. Conceptual Framework on Reward Systems in Organizations for Success and its Impacts A Wide View. Journal of Trend in Scientific Re-search and Development 2019, 3, 734–740. [Google Scholar] [CrossRef]
- Fangyi Y, Jiangjing X, Kai W. On the Optimization of Chinese Reward System of Science and Technology under the Perspective of System Theory. Proceedings of the 12th International Conference on Innovation and Management, 2015:05.
- Central Technology, Inc.; Researchers Submit Patent Application, "Multi-Platform Data Gathering and Rewards Administration for Automated Library Systems", for Approval (USPTO 20170076314). Journal of Engineering,2017.
- Crotta M, Chinchio E, Tranquillo V, et al. Pairwise summation as a method for the additive combination of probabilities in qualitative risk assessments. Risk analysis: an official publication of the Society for Risk Analysis, 2024, 44(11):2569-2578. [CrossRef]
- Finn, Victoria. A qualitative assessment of QCA: method stretching in large-N studies and temporality. Quality & Quantity, 2022,56(5):1-16. [CrossRef]
- Liju A M, P.G. S. Qualitative analysis of different lean assessment methods: A comprehensive review of applications. Materials Today: Proceed-ings,2022,58(P1):387-392. [CrossRef]
- Liu, P. Determination of the Weights for the Ultimate Cross Efficiency Using Expert Scoring Method. Engineering Letters 2021, 29. [Google Scholar]
- Vaezi A, Jones S, Asgary A. Integrating Resilience into Risk Matrices: A Practical Approach to Risk Assessment with Empirical Analysis. Journal of Risk Analysis and Crisis Response,2023,13(4):. [CrossRef]
- Syaimak S A, Khim G N. Environmental indicators for sustainability assessment in edible oil processing industry based on Delphi Method. Cleaner Engineering and Technology,2022,10. [CrossRef]
- Liu Q, Han Z, Liu F, et al. Comfort evaluation of carrier-based aircraft missile handling operation based on fuzzy analytic hierarchy process. Advances in Mechanical Engineering,2024,16(9):. [CrossRef]
- Ban Y, Li C, Wang B, et al. Reliability assessment of grid-connected microgrid based on sequential Monte Carlo simulation method. Journal of Physics: Conference Series,2024,2846(1):012017-012017. [CrossRef]
- Li X, Liu Y, Zhang W, et al. Research on an Evaluation Model of Urban Seismic Resilience Based on System Dynamics: A Case Study of Chengdu, China. Sustainability, 2023, 15 (13):. [CrossRef]
- Ma J, Lu N, Sun Q, et al. Energy efficiency evaluation of wind turbines based on entropy weight method and stacked autoencoder. Journal of Physics: Conference Se-ries,2024,2846(1):012004-012004. [CrossRef]
- Junjie J, Wenhao S, Yuan W. A risk assessment approach for road collapse along tunnels based on an improved entropy weight method and K-means cluster algorithm. Ain Shams Engineering Journal,2024,15(7):102805-. [CrossRef]
- Lu L, Liang L, Zhou J, et al. Dynamic risk assessment method for road transport of hazardous chemicals based on BP neural network algorithm. International Journal of Modeling, Simulation, and Scientific Computing,2023,15(02):. [CrossRef]
- Minghong L, Yuanxiang G, Danyuan L, et al. A Hybrid Variable Weight Theory Approach of Hierarchical Analysis and Multi-Layer Perceptron for Landslide Susceptibility Evaluation: A Case Study in Luan chuan County, China. Sustainability,2023,15(3):1908-1908. [CrossRef]
- Liu H, Wang X, Tan G, et al. System Reliability Evaluation of a Bridge Structure Based on Multivariate Copulas and the AHP–EW Method That Considers Multiple Failure Criteria. Applied Sciences,2020,10(4):. [CrossRef]
- Xiaoling R, Zhenfu L, Shuyu Q, et al. A new method for evaluating air quality using an ideal grey close function cluster correlation analysis method. Scientific Reports,2021,11(1):23342-23342. [CrossRef]
- Yumei L, Ting H, Jiaojiao Z, et al. Optimal design of variable suspension parameters for variable-gauge trains based on the improved CRITIC method. Journal of the Chinese Institute of Engineers,2023,46(6):638-648. [CrossRef]
- WenGang H, ShaoWei Z, GuoZhi W, et al. Modeling Methodology for Site Selection Evaluation of Underground Coal Gasification Based on Combination Weighting Method with Game Theory. ACS omega,2023,8(12):11544-11555. [CrossRef]
- Li W W, Gu B X, Yang C, et al. Level evaluation of concrete dam fractures based on game theory combination weighting-normal cloud model. Frontiers in Materials,2024,11. [CrossRef]
- Sun H, Rui Y, Lu Y, et al. Construction risk probability assessment of shield tunneling projects in karst areas based on improved two-dimensional cloud model. Tunnelling and Underground Space Technology incorporating Trenchless Technology Re-search, 2024, 154106086-106086. [CrossRef]
- Zhou, T.; Yi, G. Research on the System Risk Assessment of "Open Bidding for Selecting the Best Candidates" of Scientific and Technological Projects Based on Entropy-Bayesian Network. 2023, 43, 79–87. [Google Scholar]
- Jin L, Liu P, Yao W, et al. A Comprehensive Evaluation of Resilience in Abandoned Open-Pit Mine Slopes Based on a Two-Dimensional Cloud Model with Combination Weighting. Mathematics,2024,12(8):. [CrossRef]
- Wang L, Jin R, Zhou J, et al. Construction Risk Assessment of Yellow River Bridges Based on Combined Empowerment Method and Two-Dimensional Cloud Model. Applied Sciences,2023,13(19):. [CrossRef]
- Wang C J, Chun J W, Xuan X Z. Evaluation Method of Highway Safety Maintenance Based on the Two-Dimensional Cloud Model Considering Equilibrium. IOP Conference Series: Earth and Environmental Science,2020,587(1):012017-. [CrossRef]
- Lyu J, Cheng X, Shaw P. Terrain Hazard Risk Analysis for Flood Disaster Management in Chaohu Basin, China, Based on Two-Dimensional Cloud. Journal of Advanced Computational Intelligence and Intelligent Informatics,2020,24(4):532-542. [CrossRef]
Figure 1.
Risk assessment indicator system of technology projects “Unveiling and Commanding” system.
Figure 1.
Risk assessment indicator system of technology projects “Unveiling and Commanding” system.
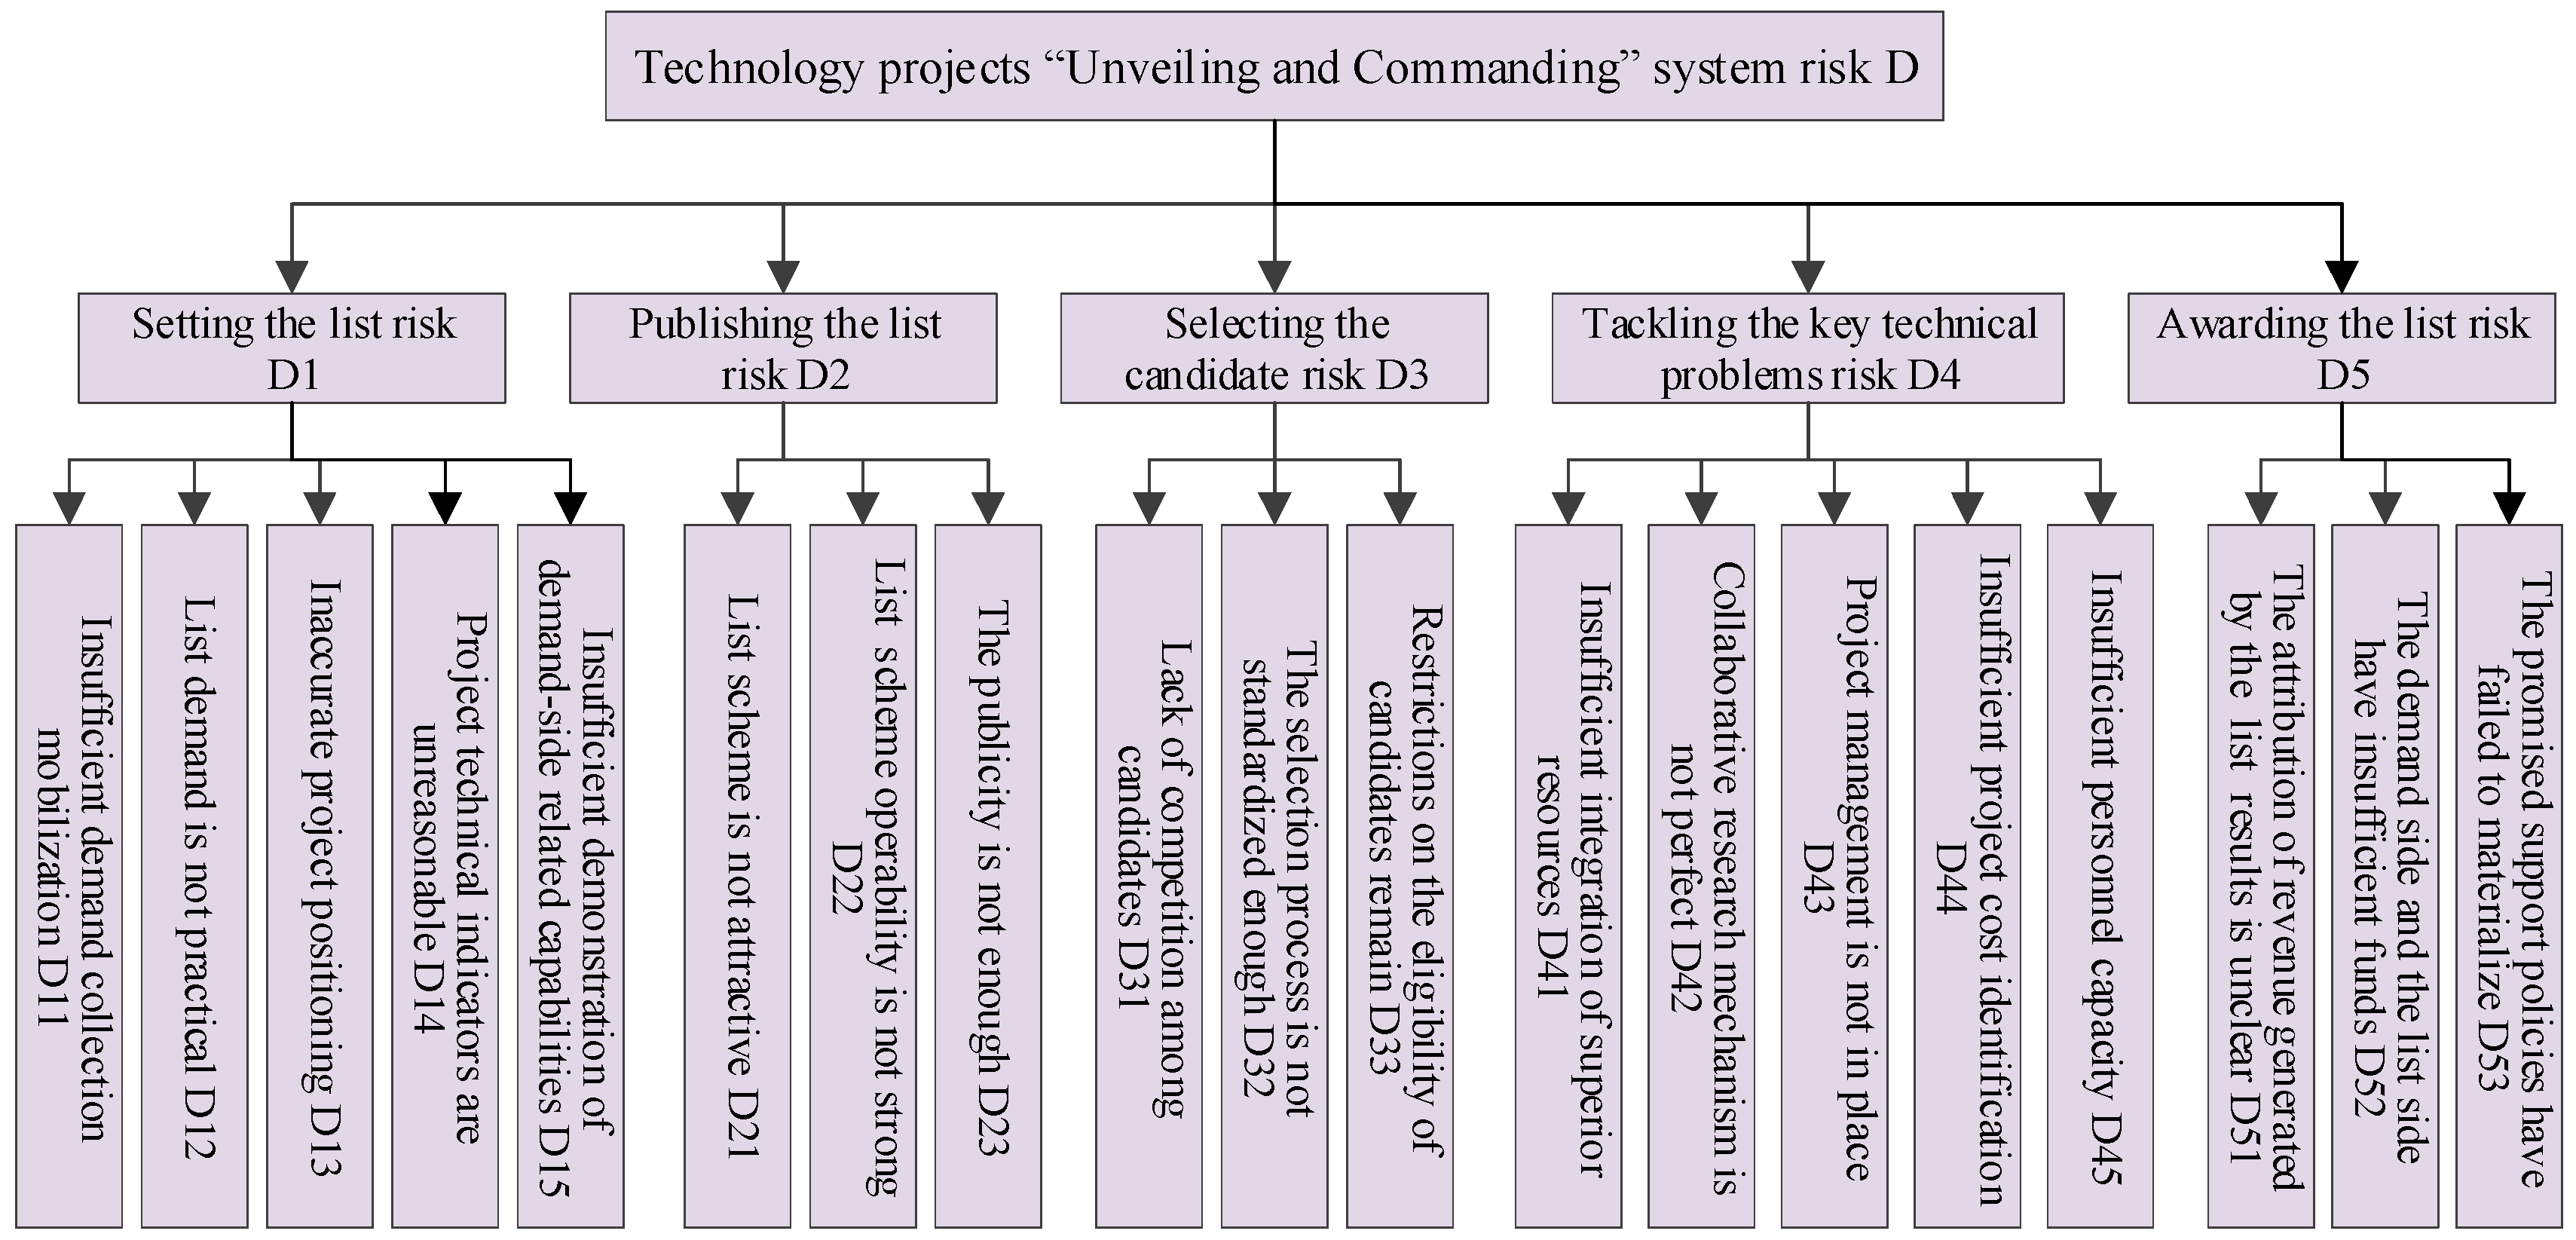
Figure 2.
The calculation process of the improved game theory multiple combination weighting method.
Figure 2.
The calculation process of the improved game theory multiple combination weighting method.
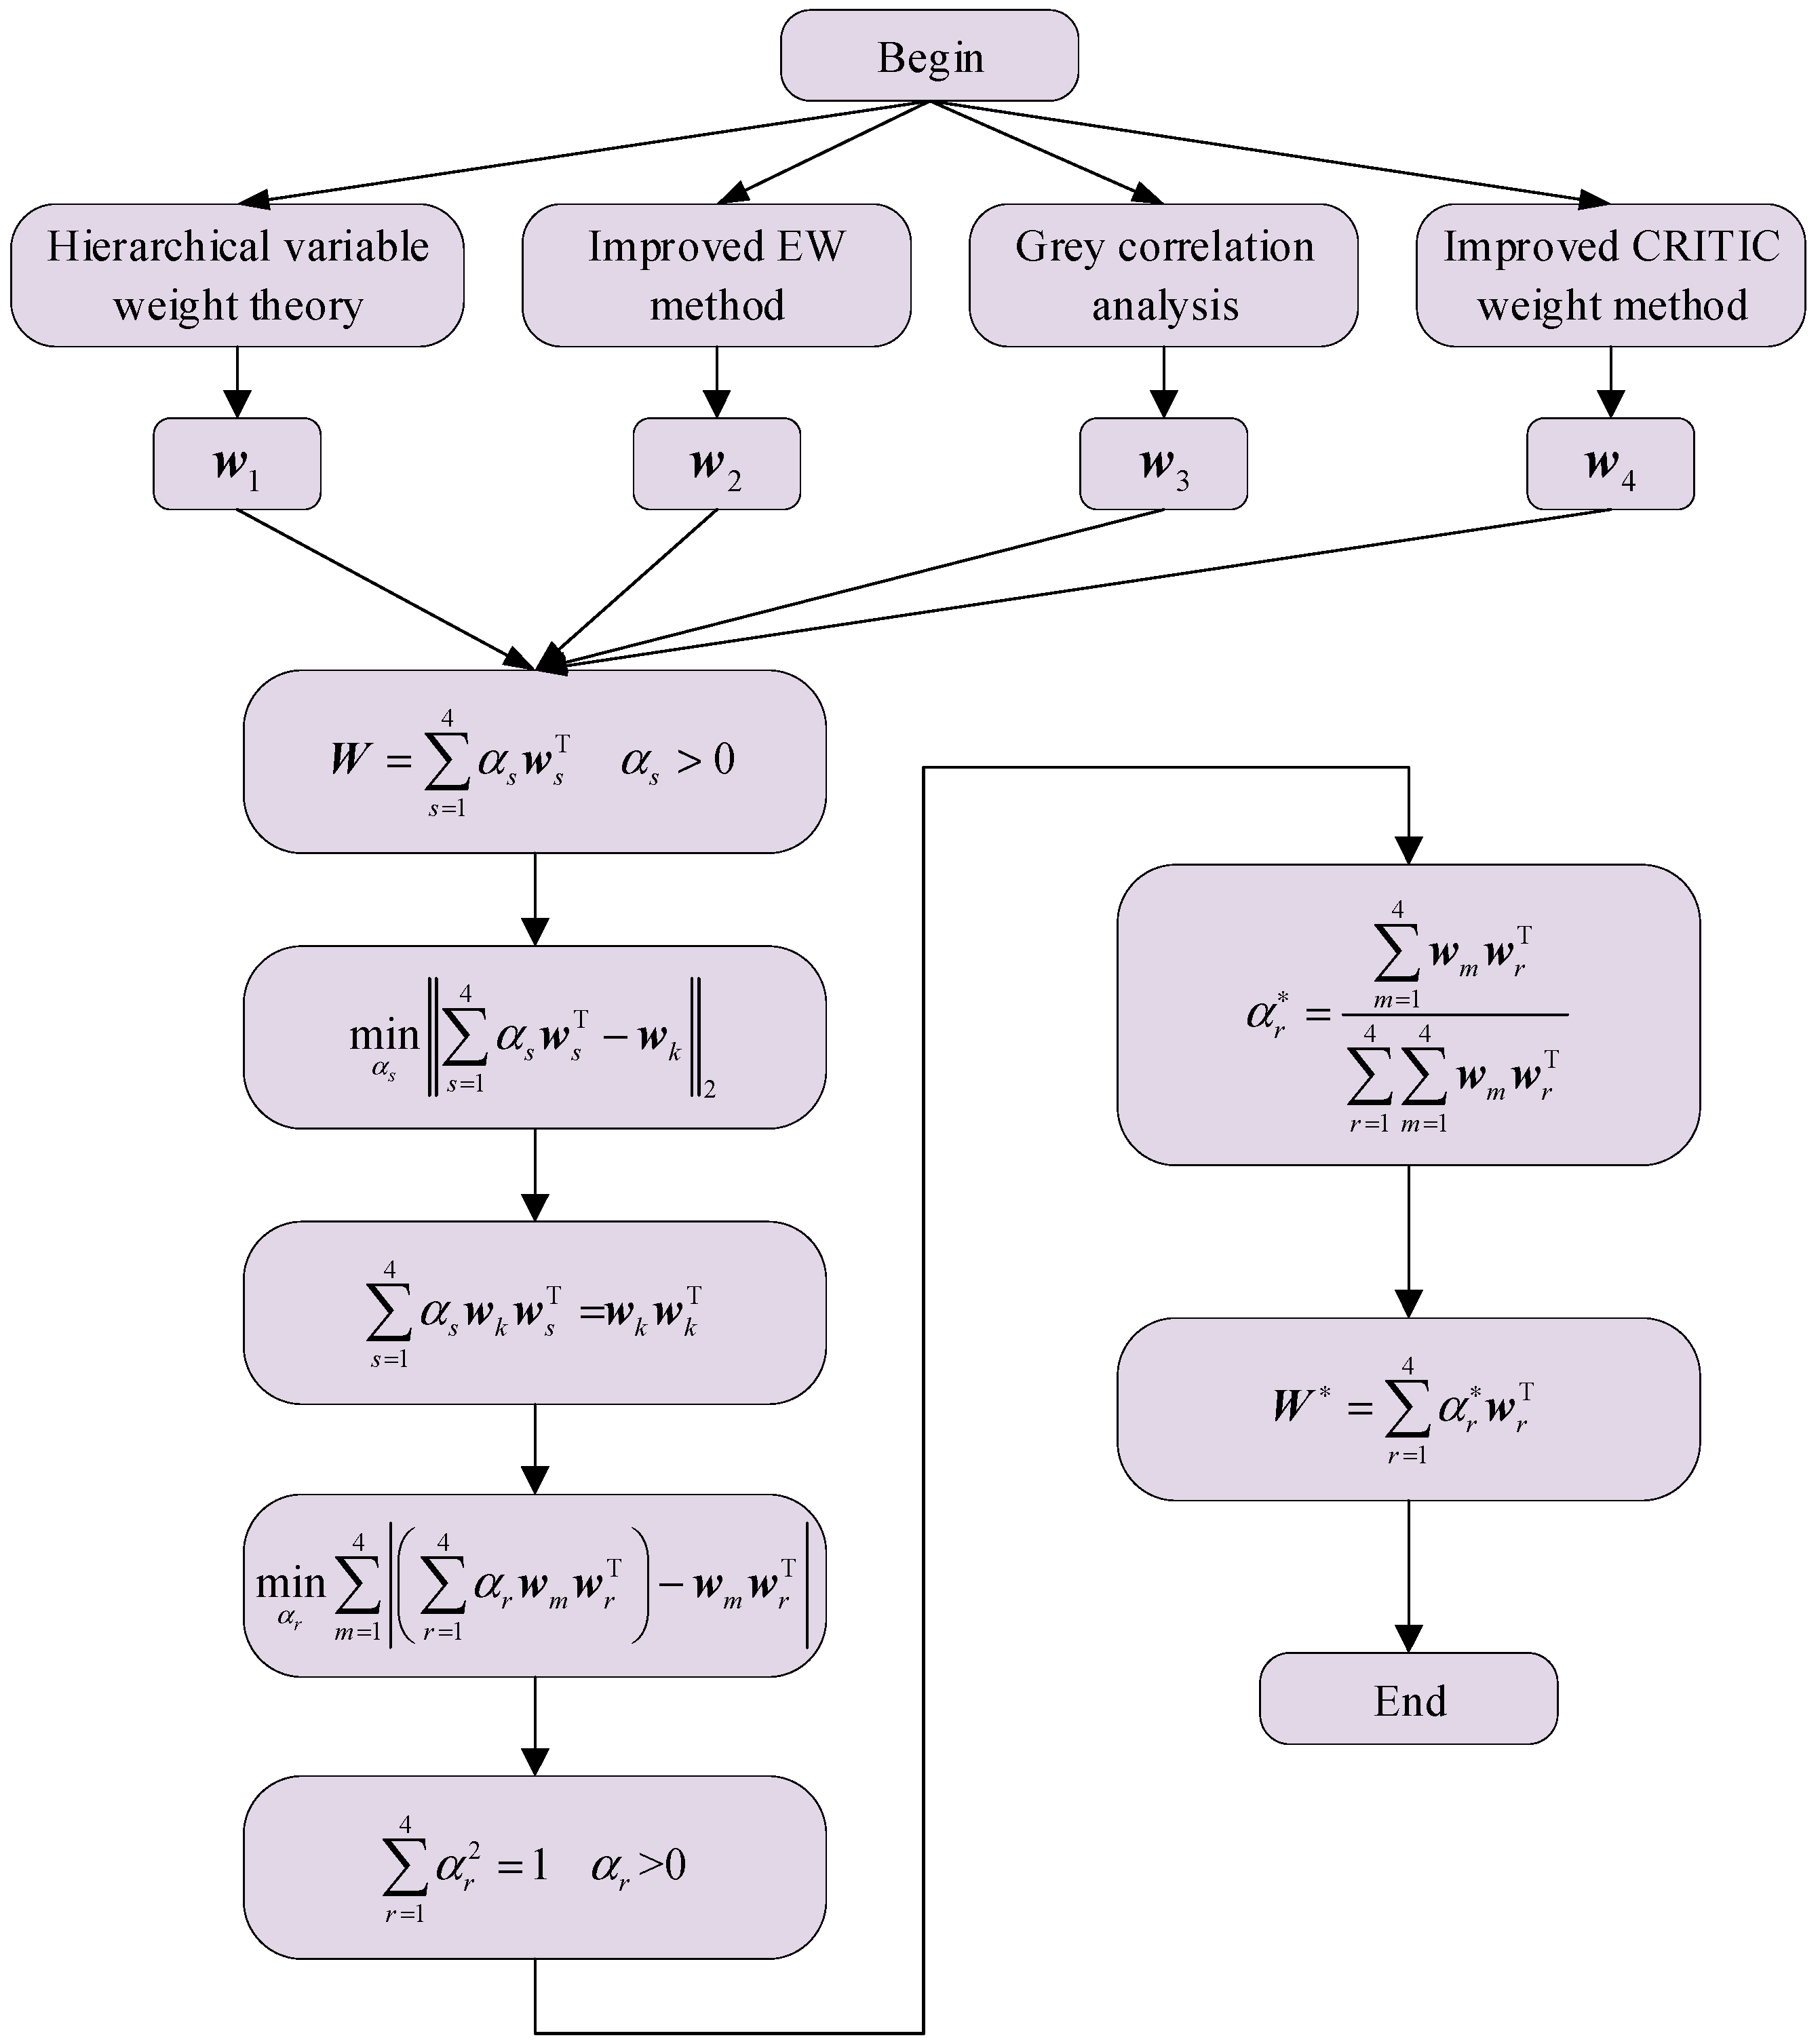
Figure 3.
Indicators weights distribution of risk probability of technology projects “Unveiling and Commanding” system.
Figure 3.
Indicators weights distribution of risk probability of technology projects “Unveiling and Commanding” system.
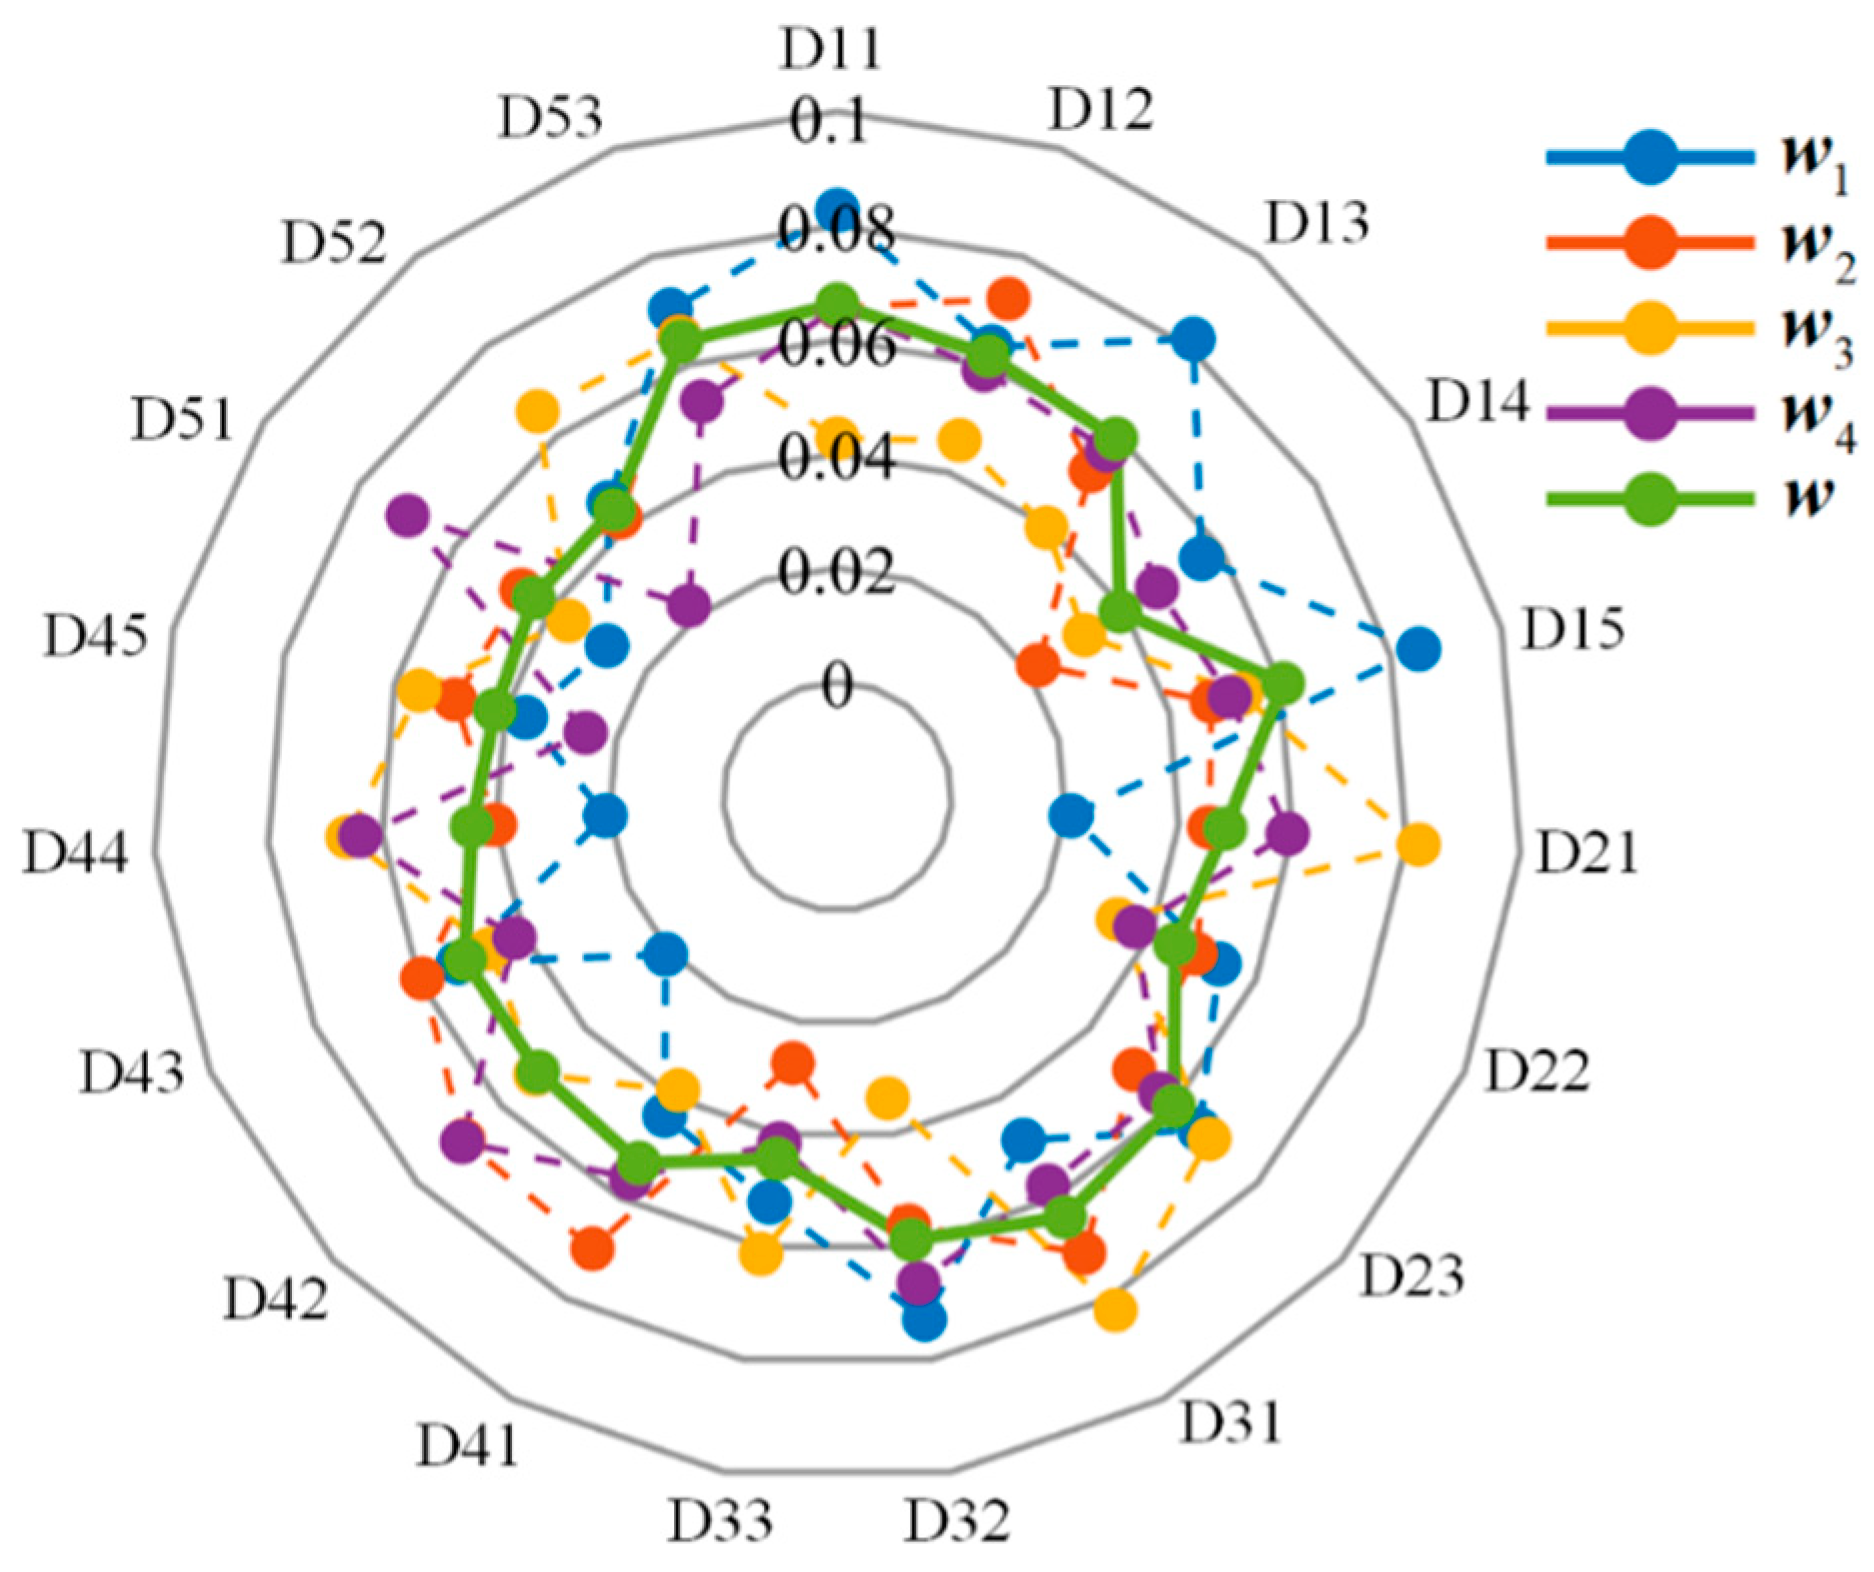
Figure 4.
Indicators weights distribution of risk impact degree of technology projects “Unveiling and Commanding” system.
Figure 4.
Indicators weights distribution of risk impact degree of technology projects “Unveiling and Commanding” system.
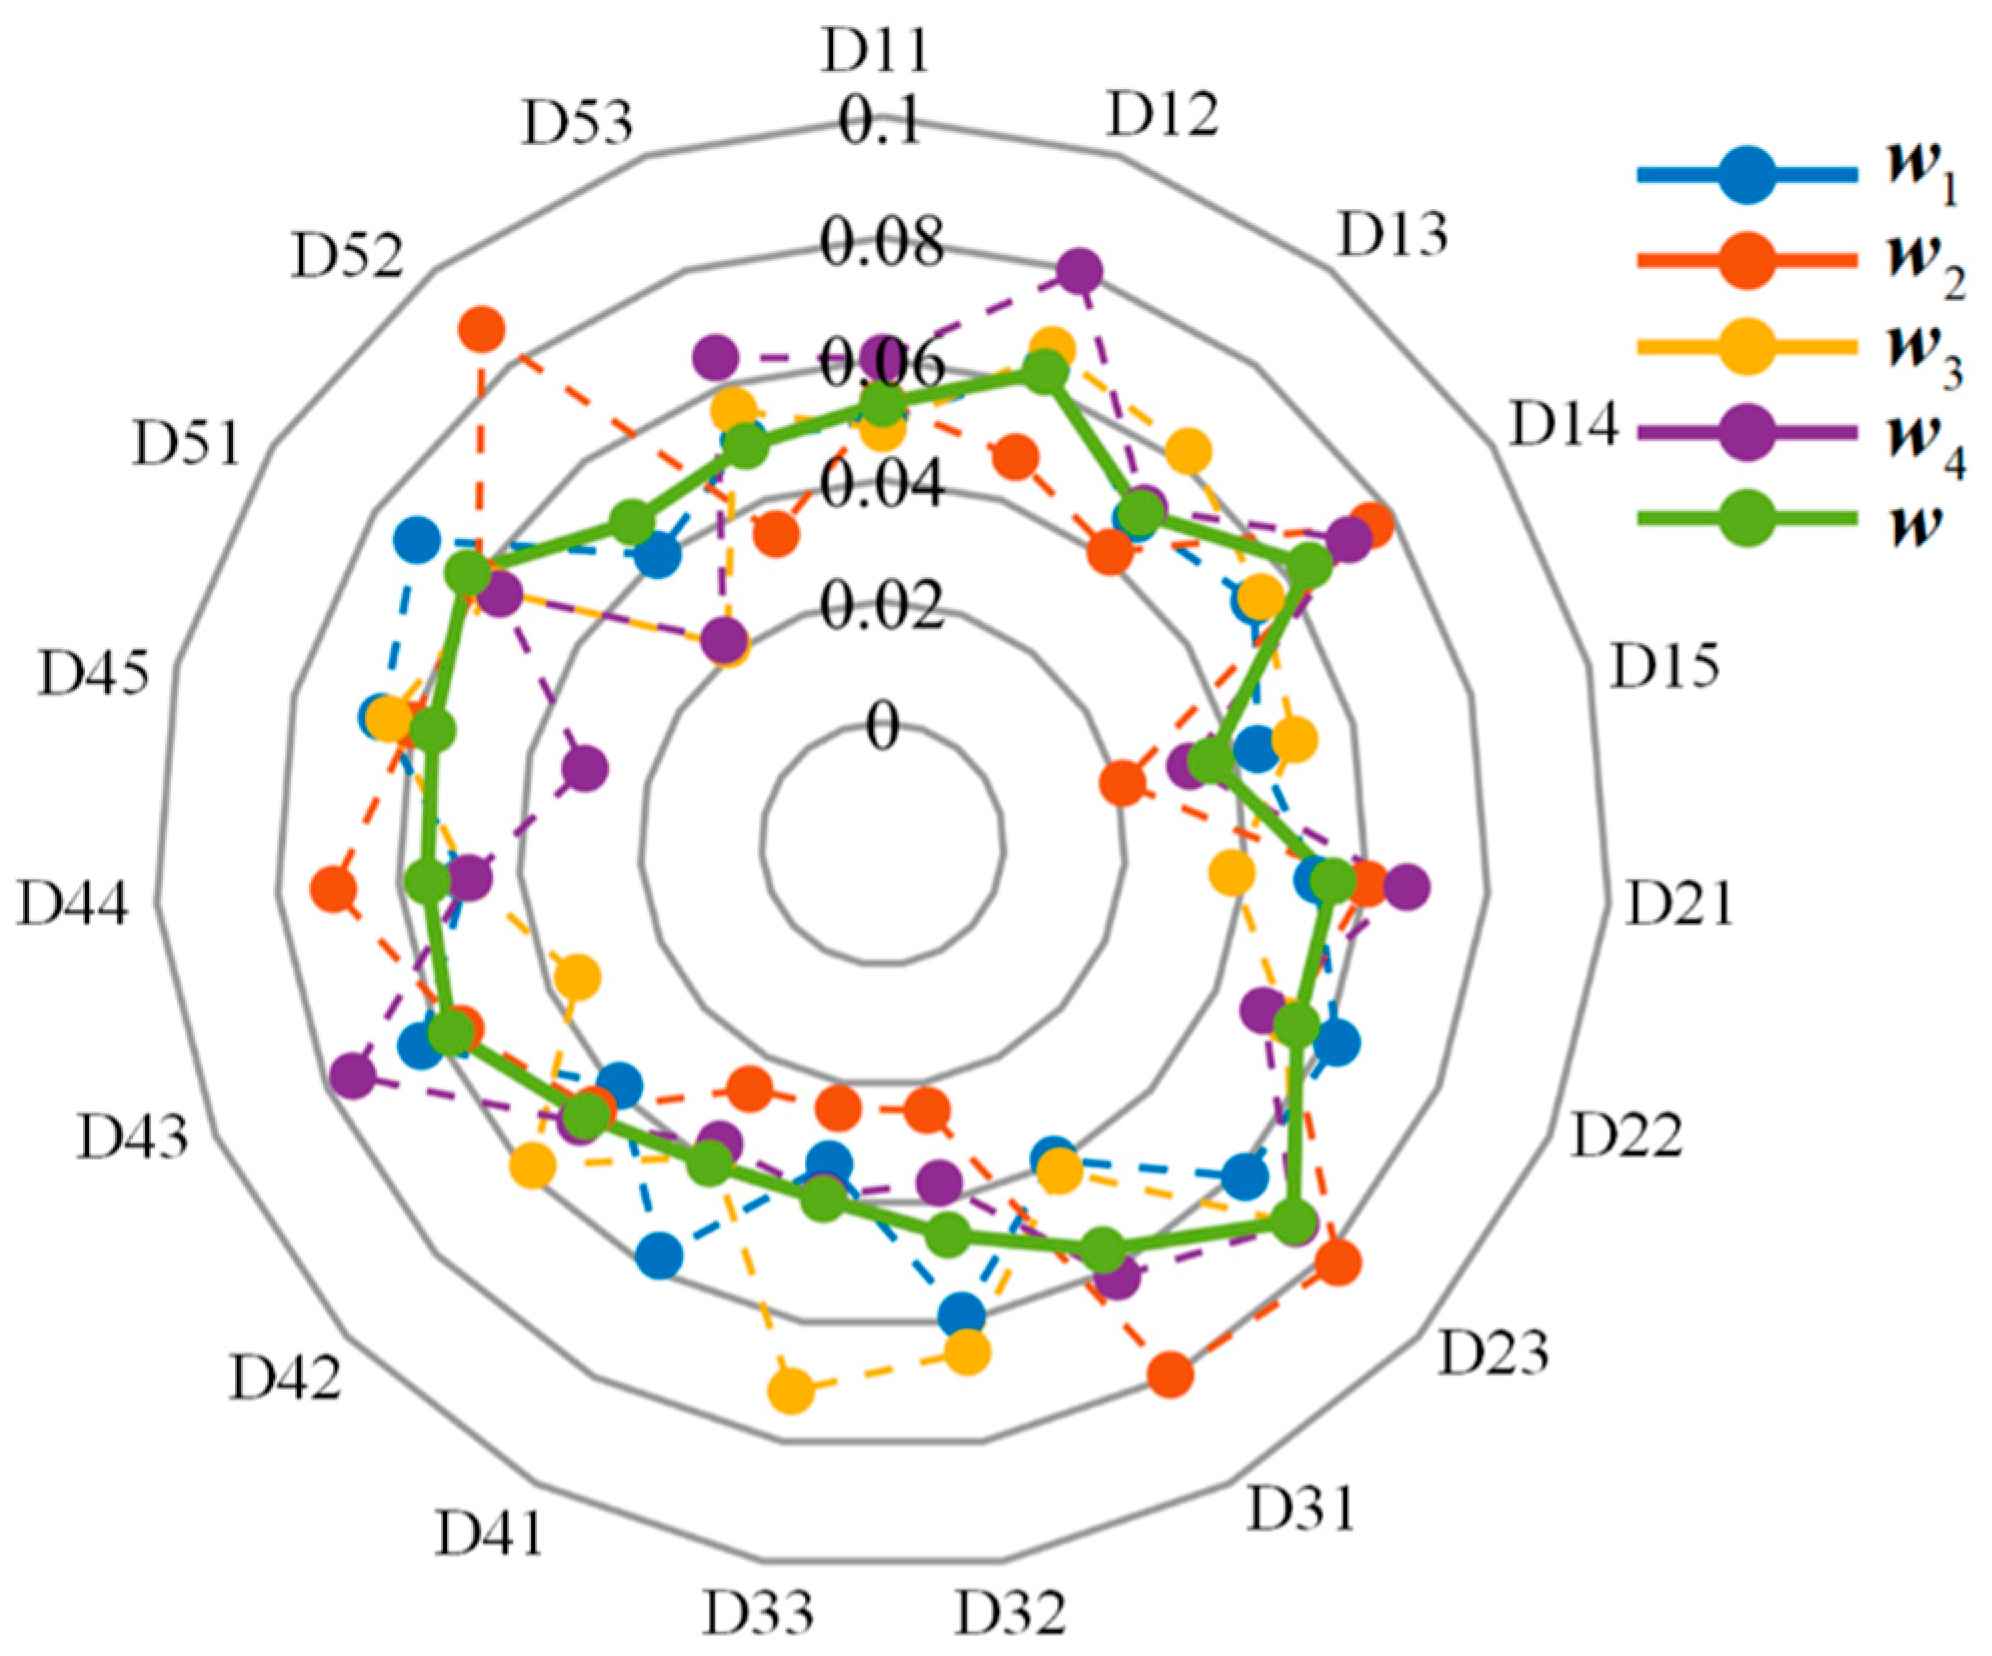
Figure 6.
Standard cloud image of risk assessment of technology projects “Unveiling and Com-manding” system.
Figure 6.
Standard cloud image of risk assessment of technology projects “Unveiling and Com-manding” system.
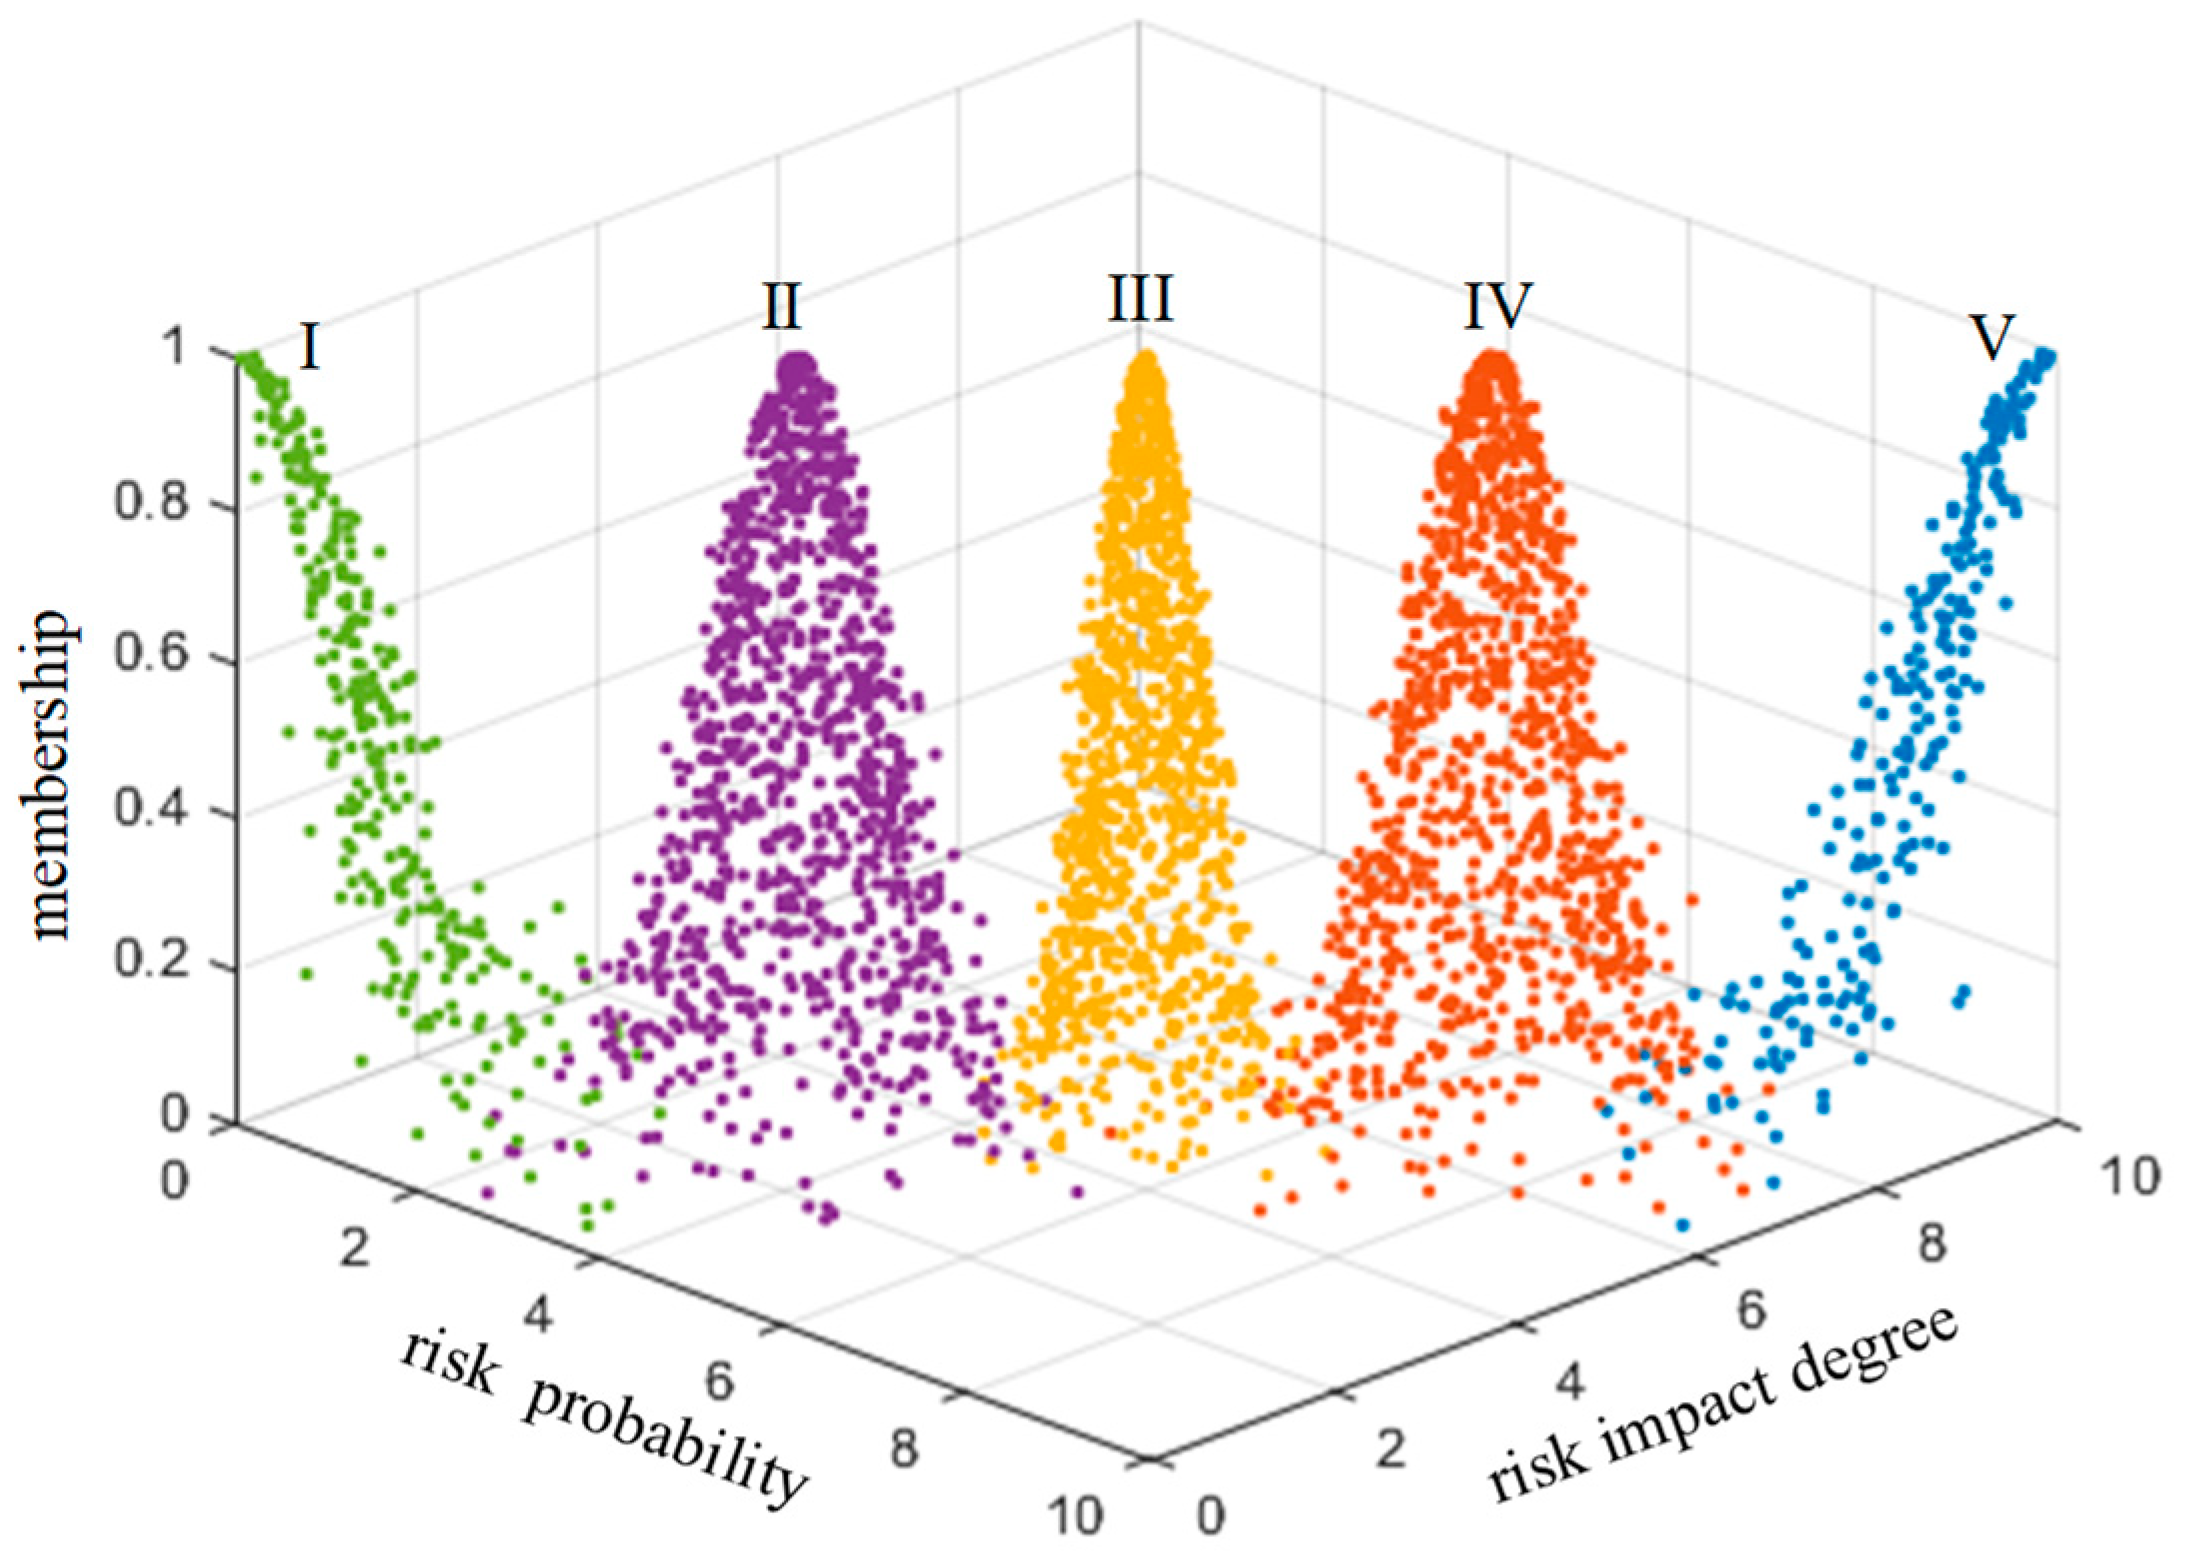
Figure 7.
Top view of standard cloud image of risk assessment of technology projects “Unveiling and Commanding” system.
Figure 7.
Top view of standard cloud image of risk assessment of technology projects “Unveiling and Commanding” system.
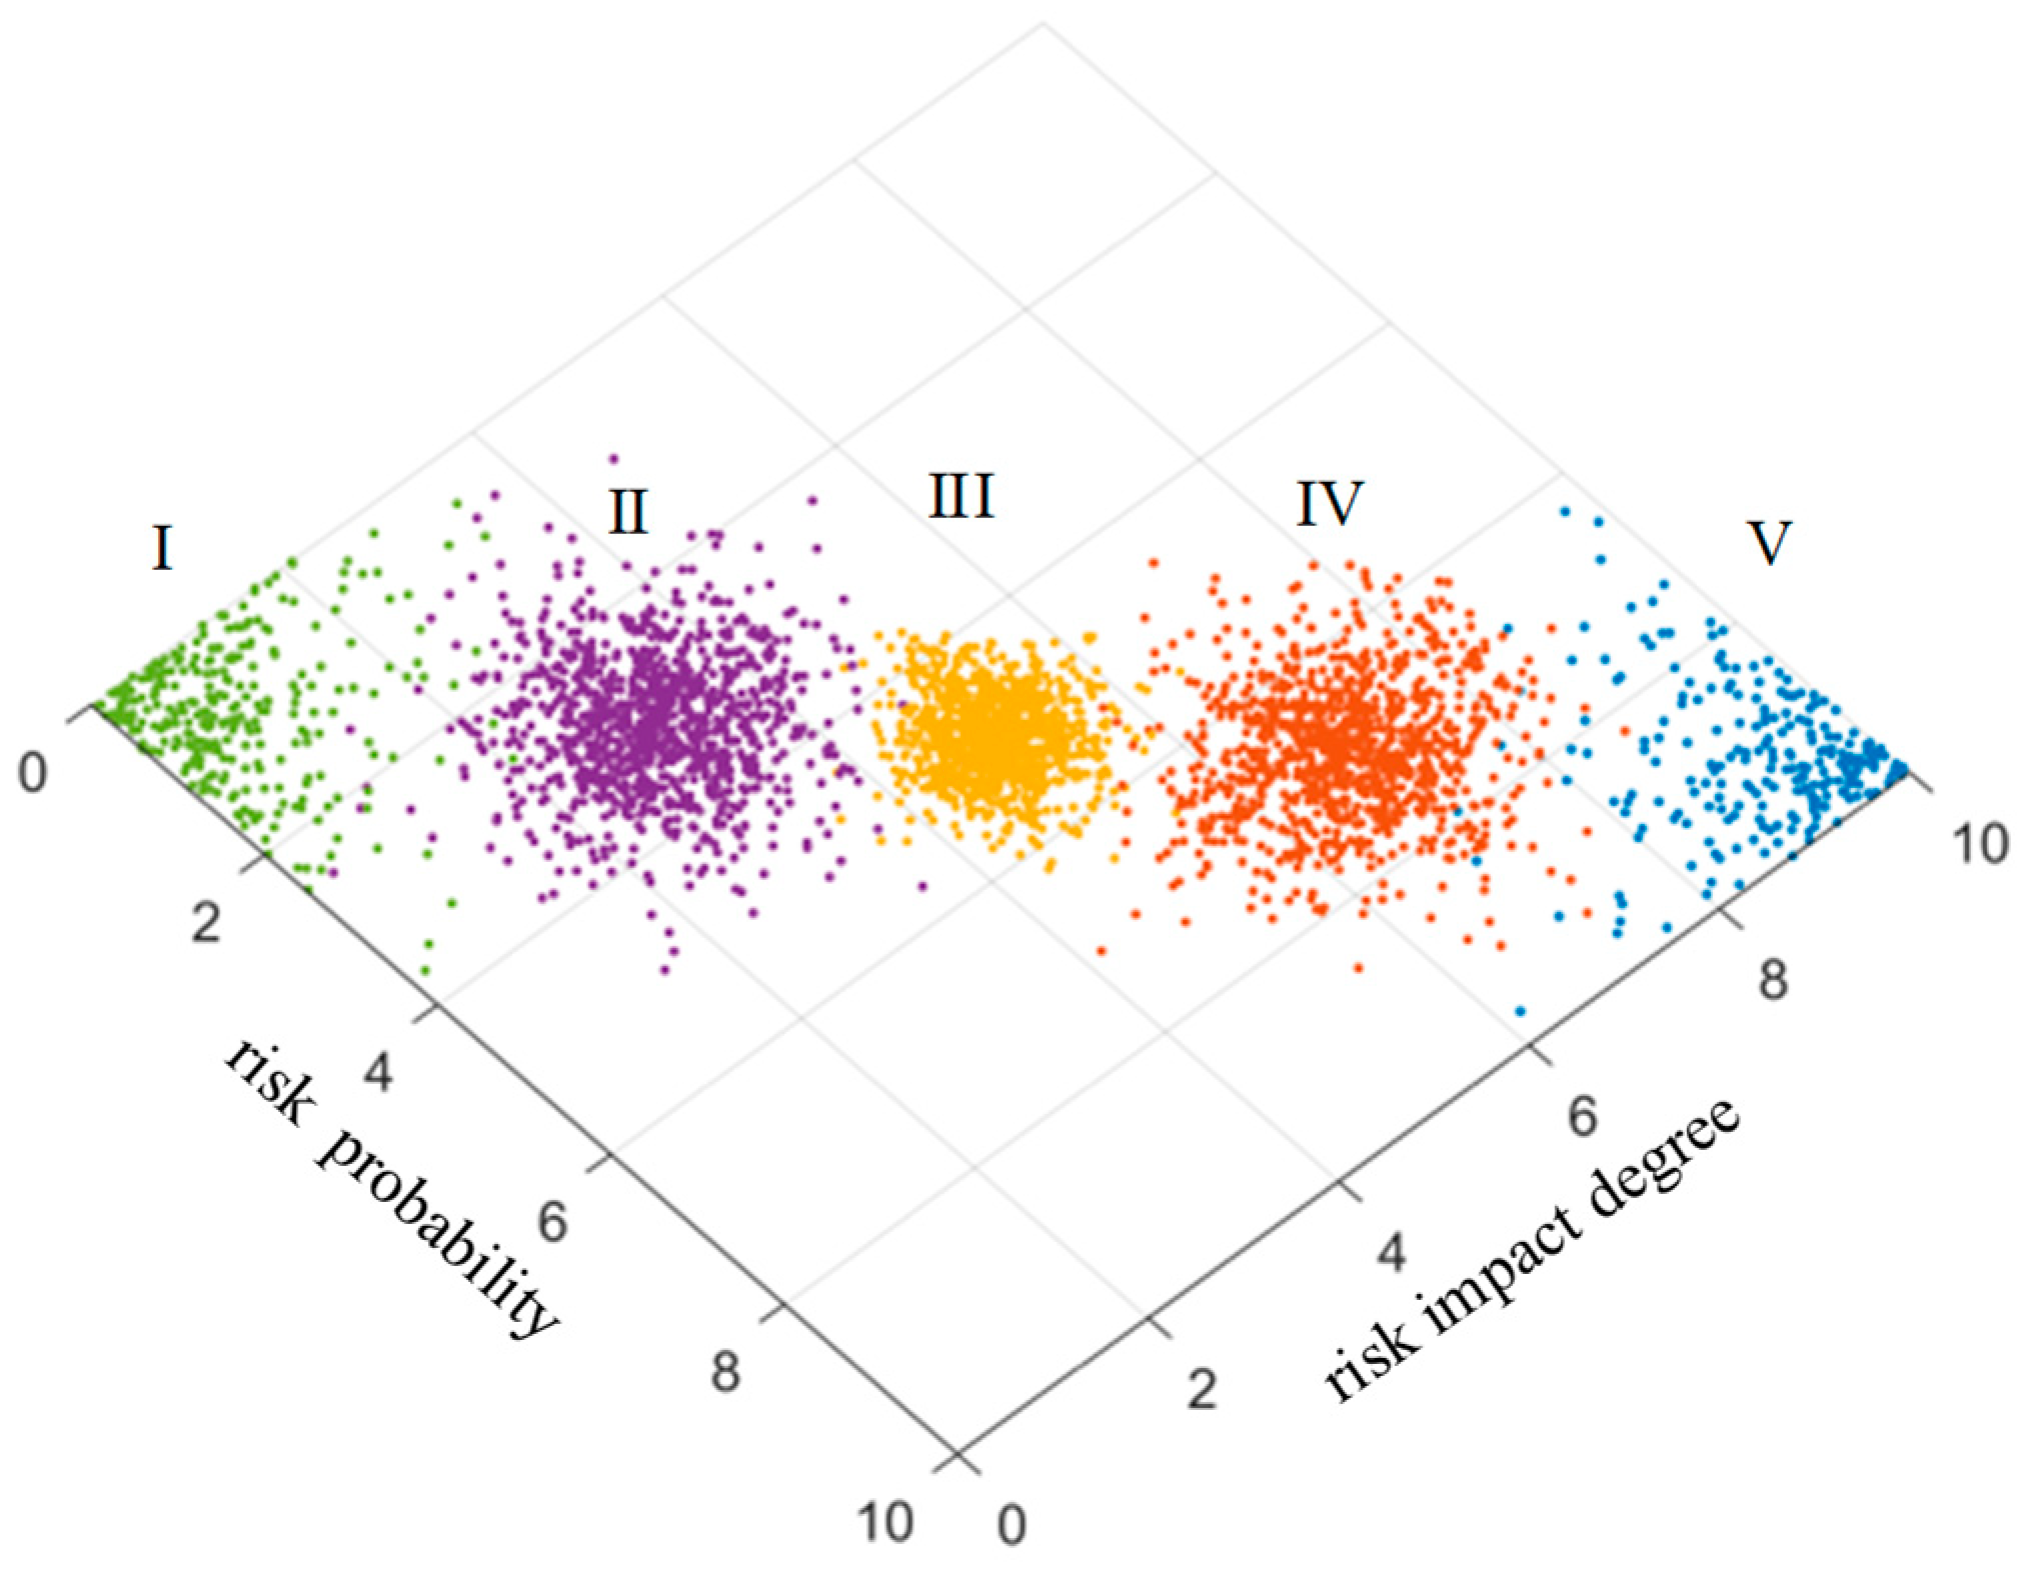
Figure 5.
Schematic diagram of two-dimensional cloud model.
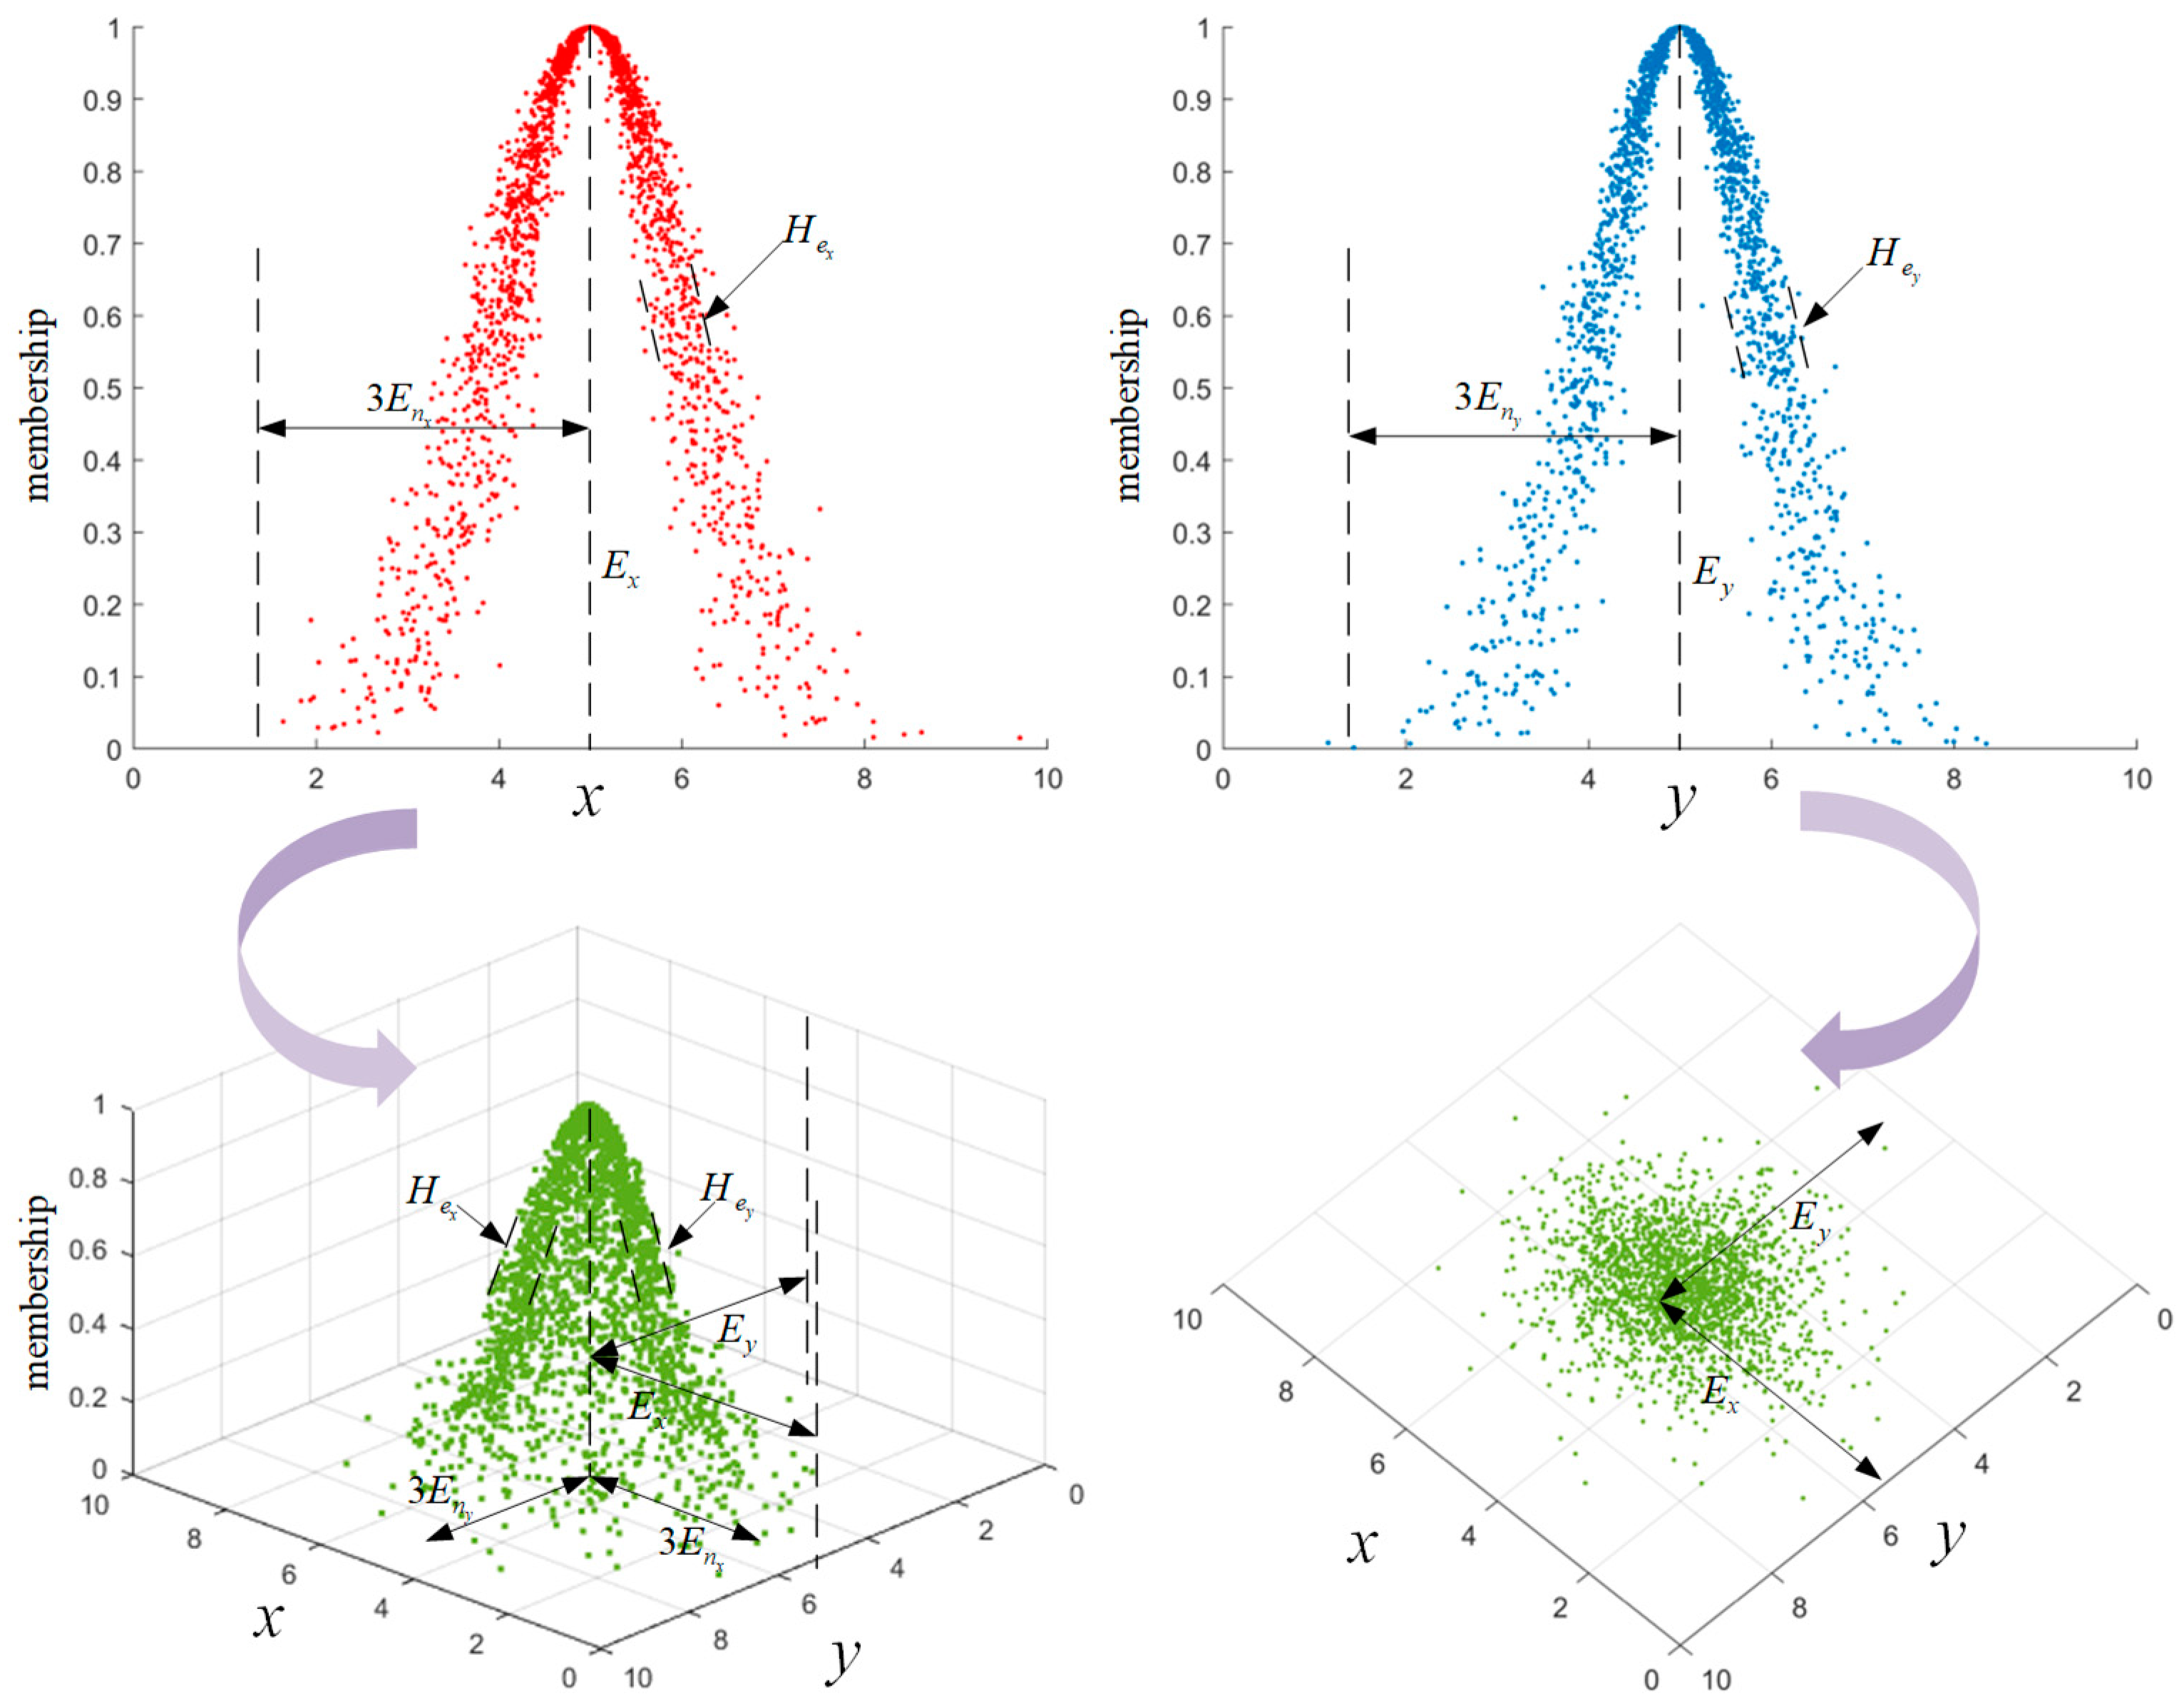
Figure 8.
Risk assessment cloud image of setting the list.
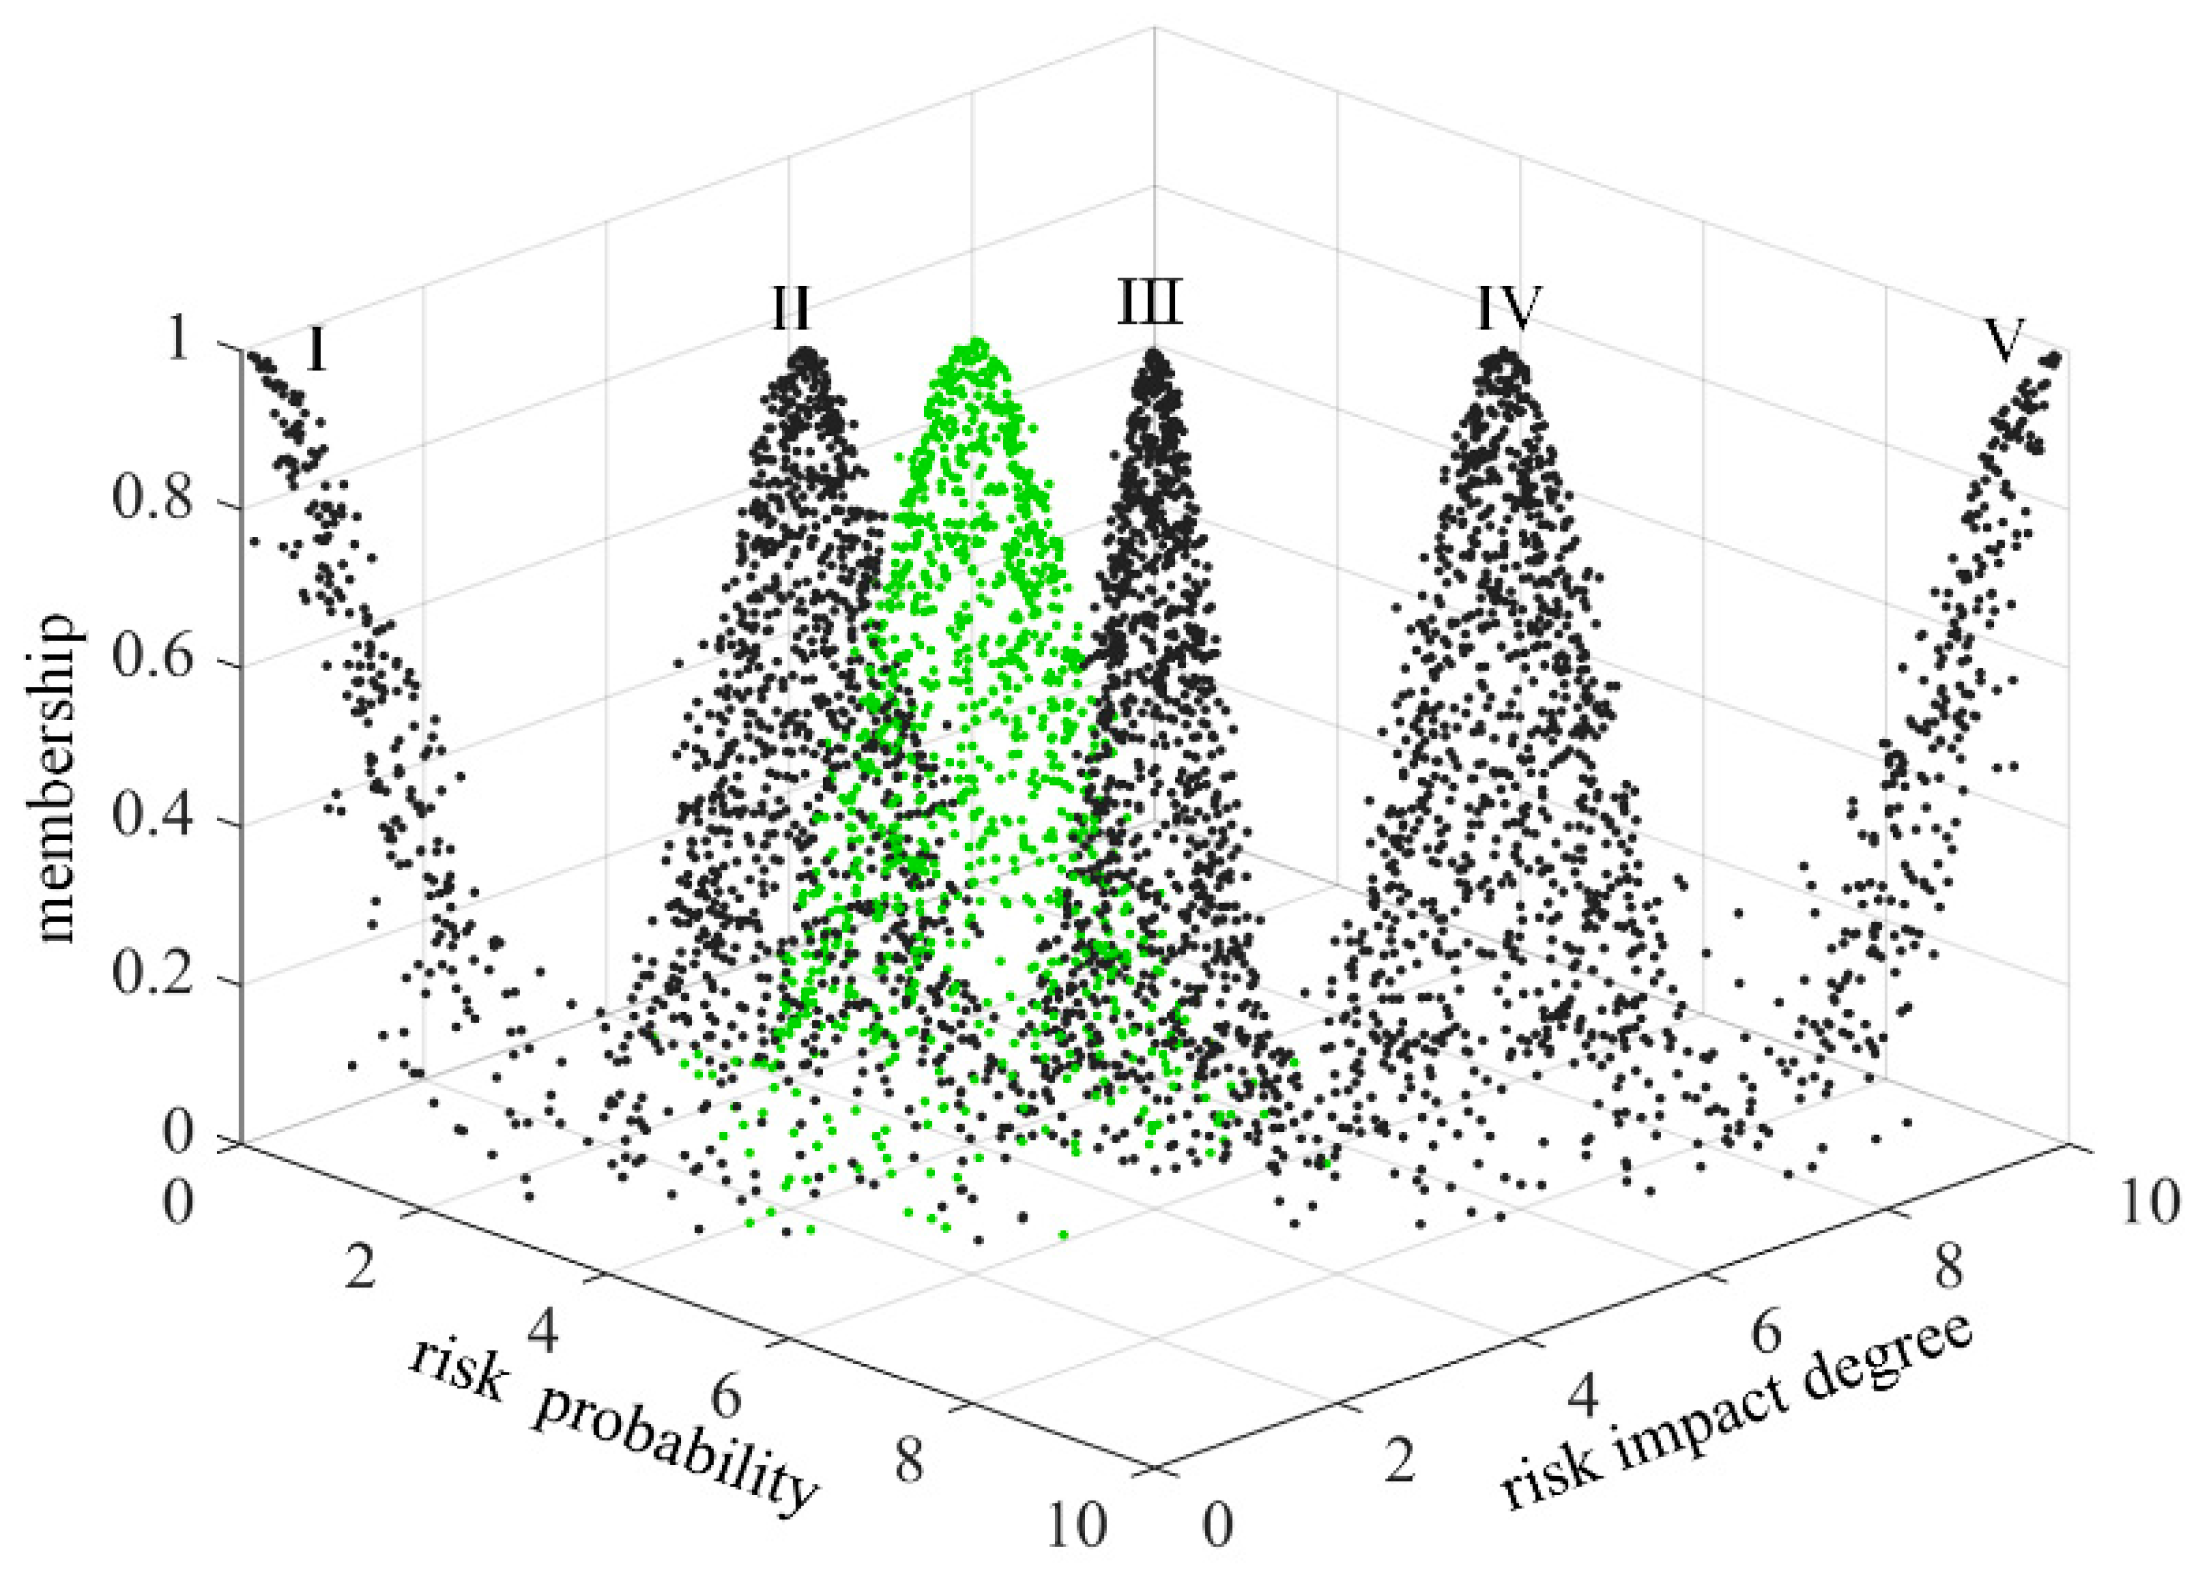
Figure 9.
Top view of risk assessment cloud image of setting the list.
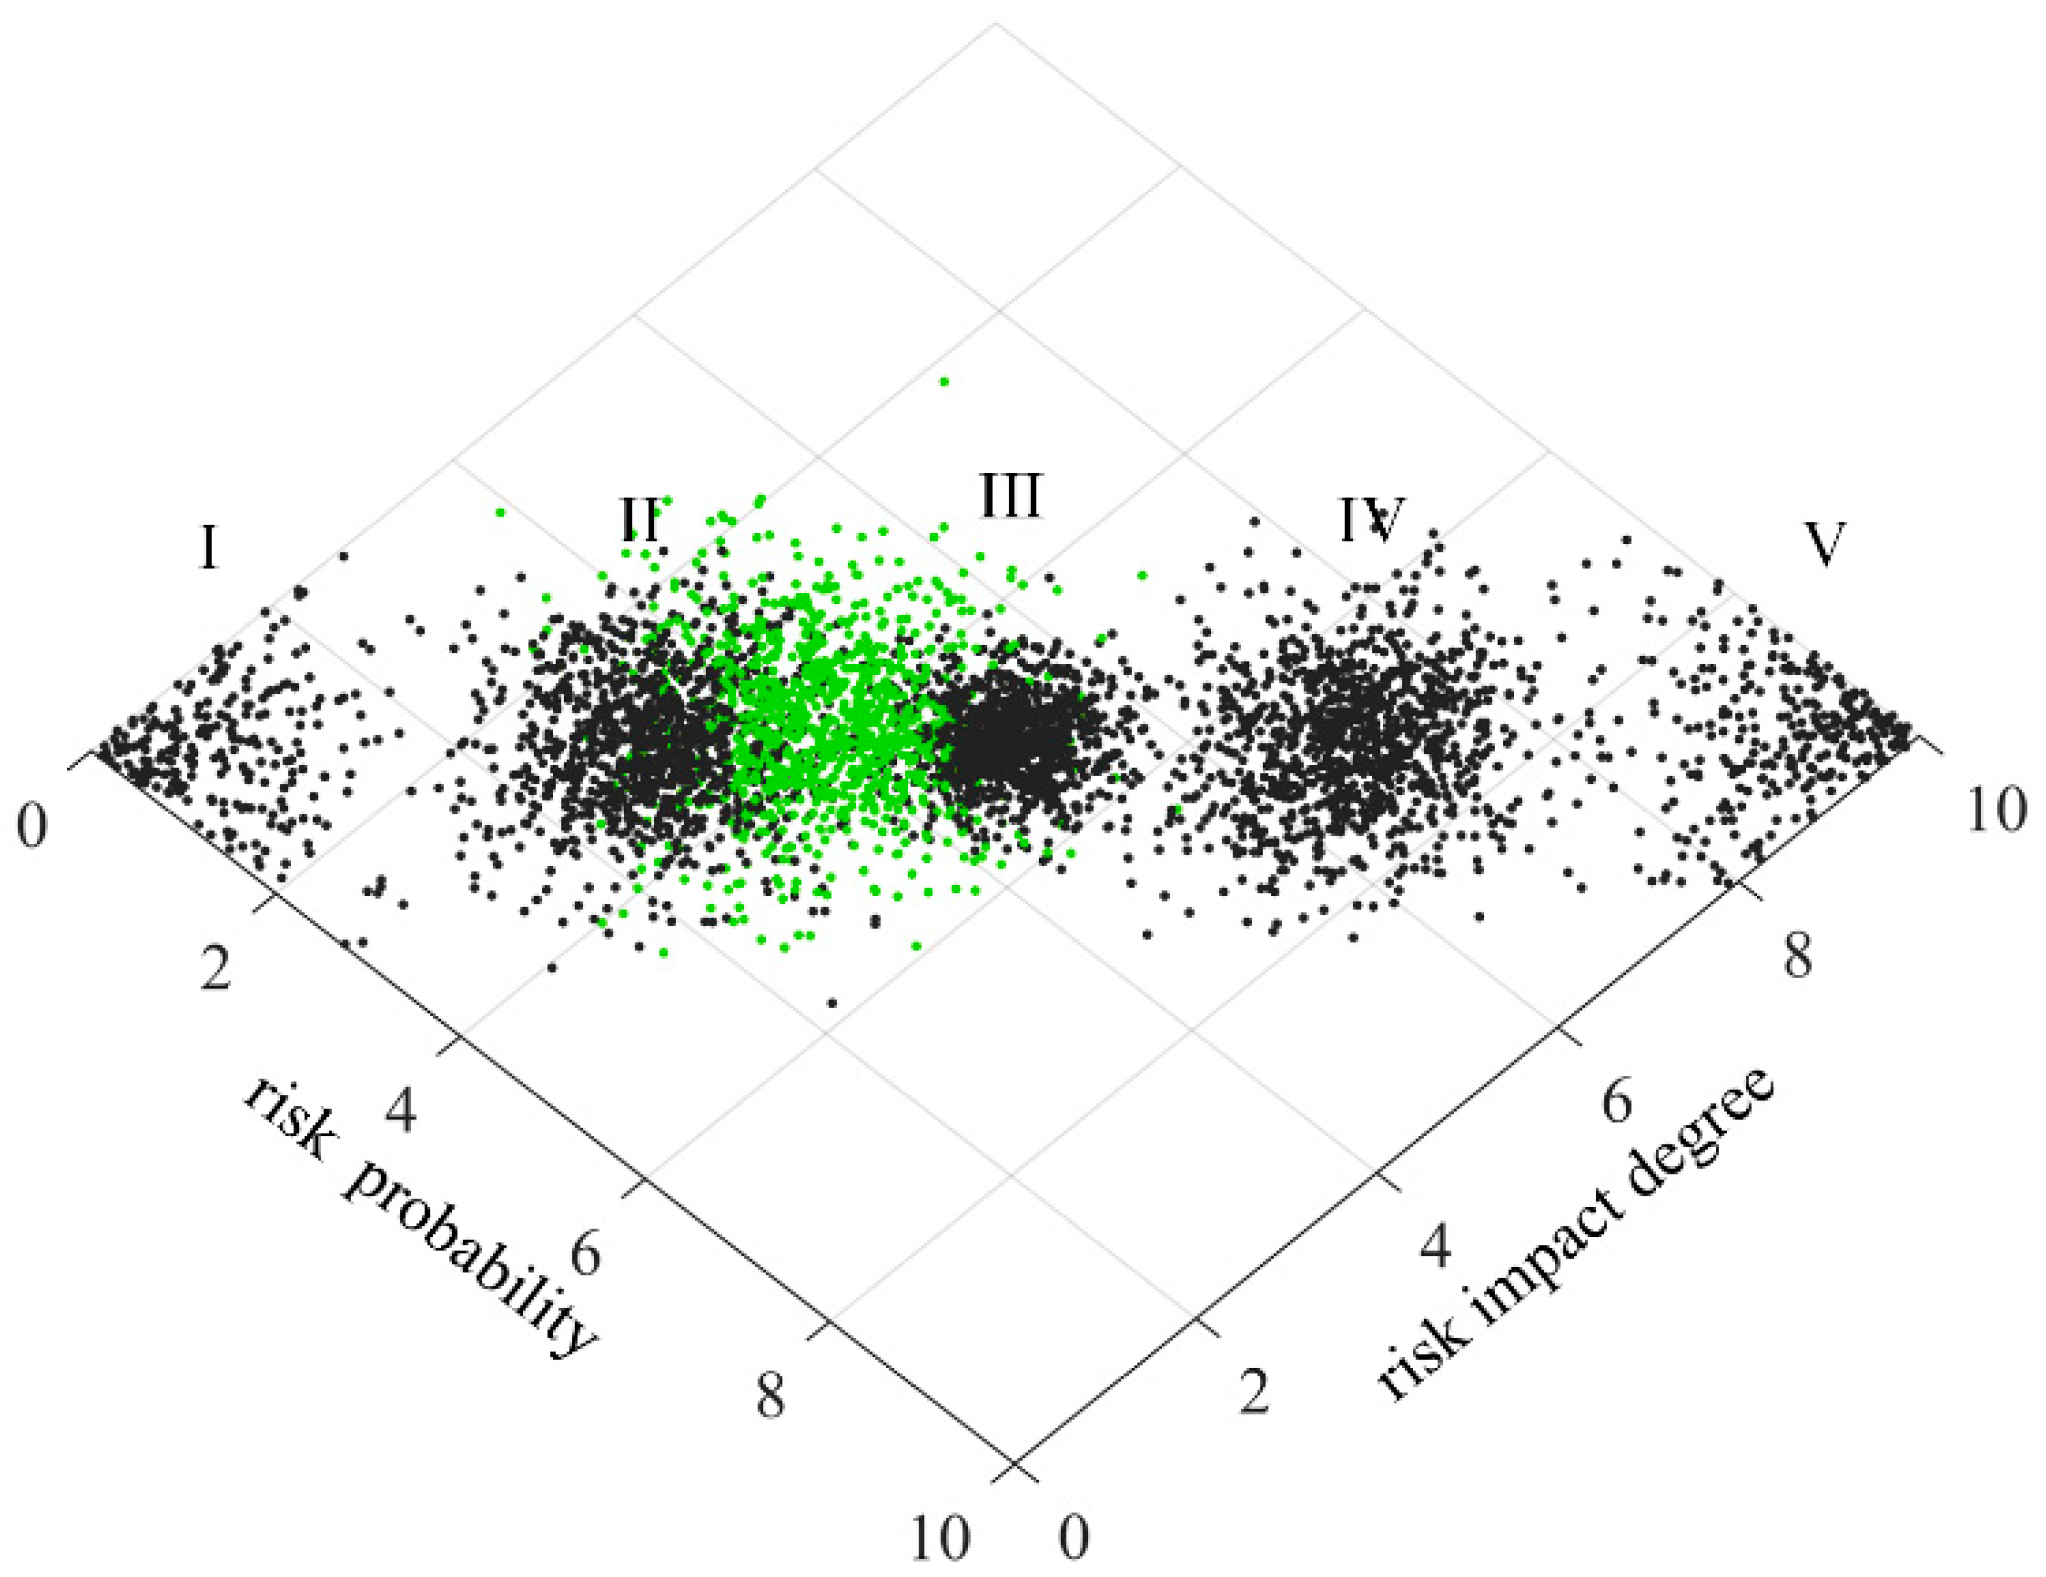
Figure 10.
Risk assessment cloud image of publishing the list.
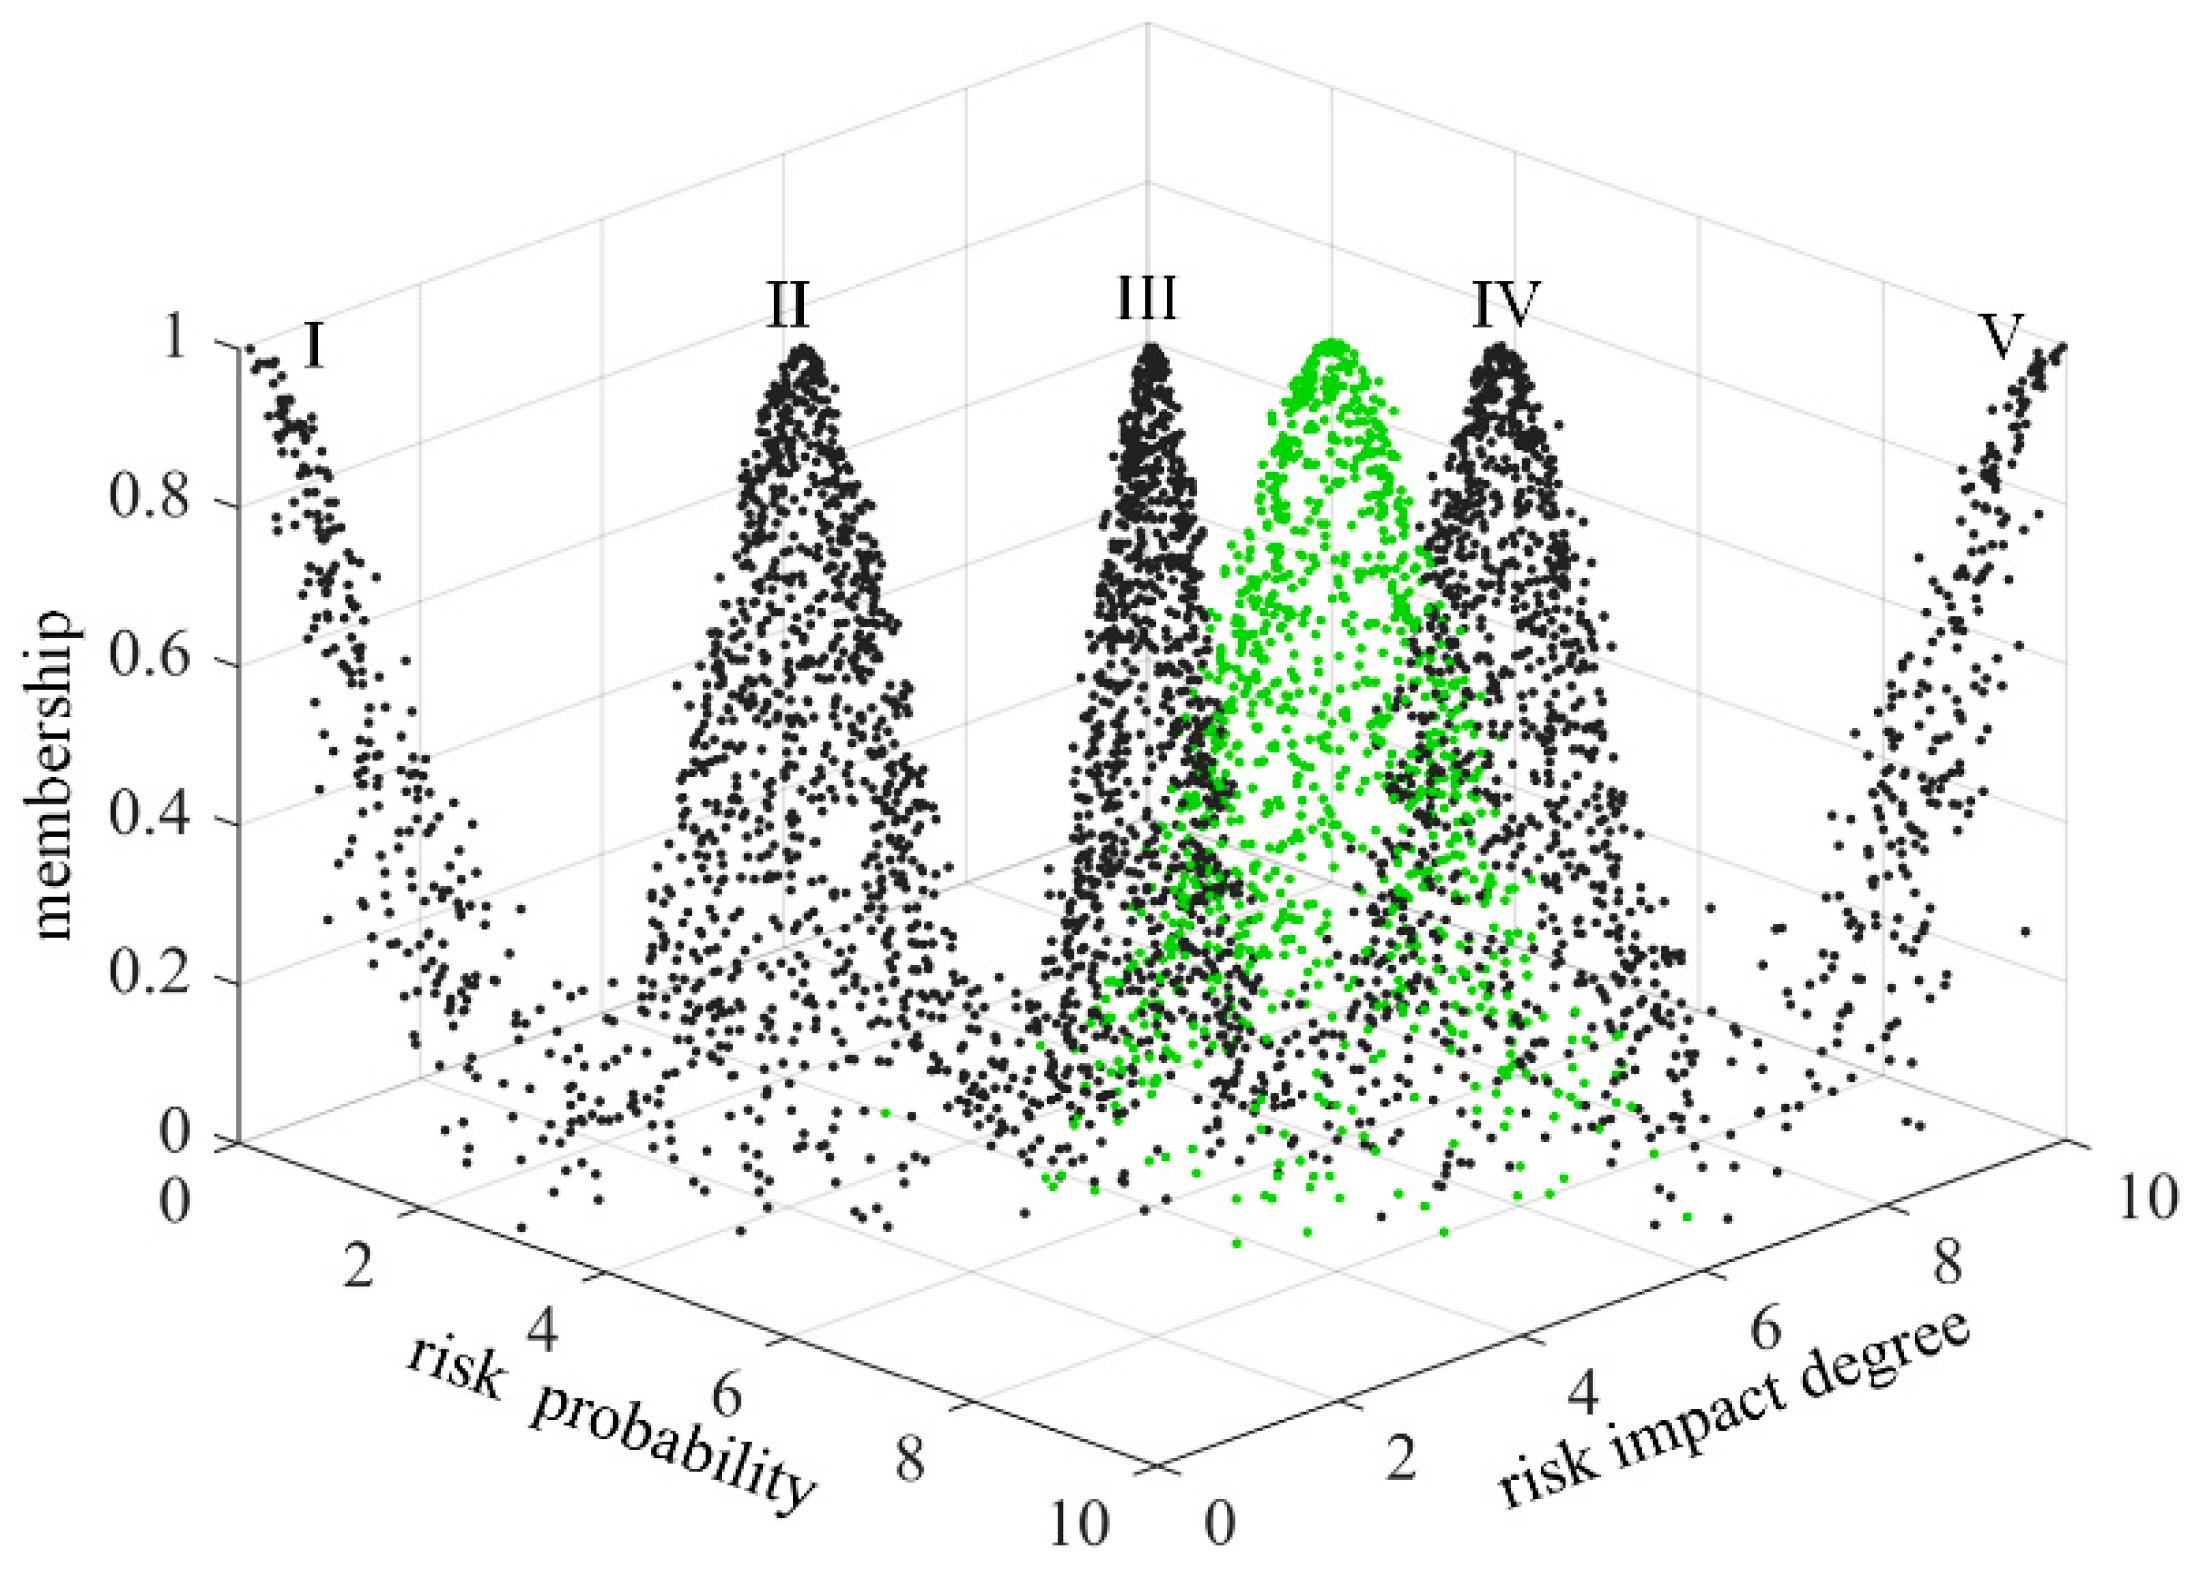
Figure 11.
Top view of risk assessment cloud image of publishing the list.
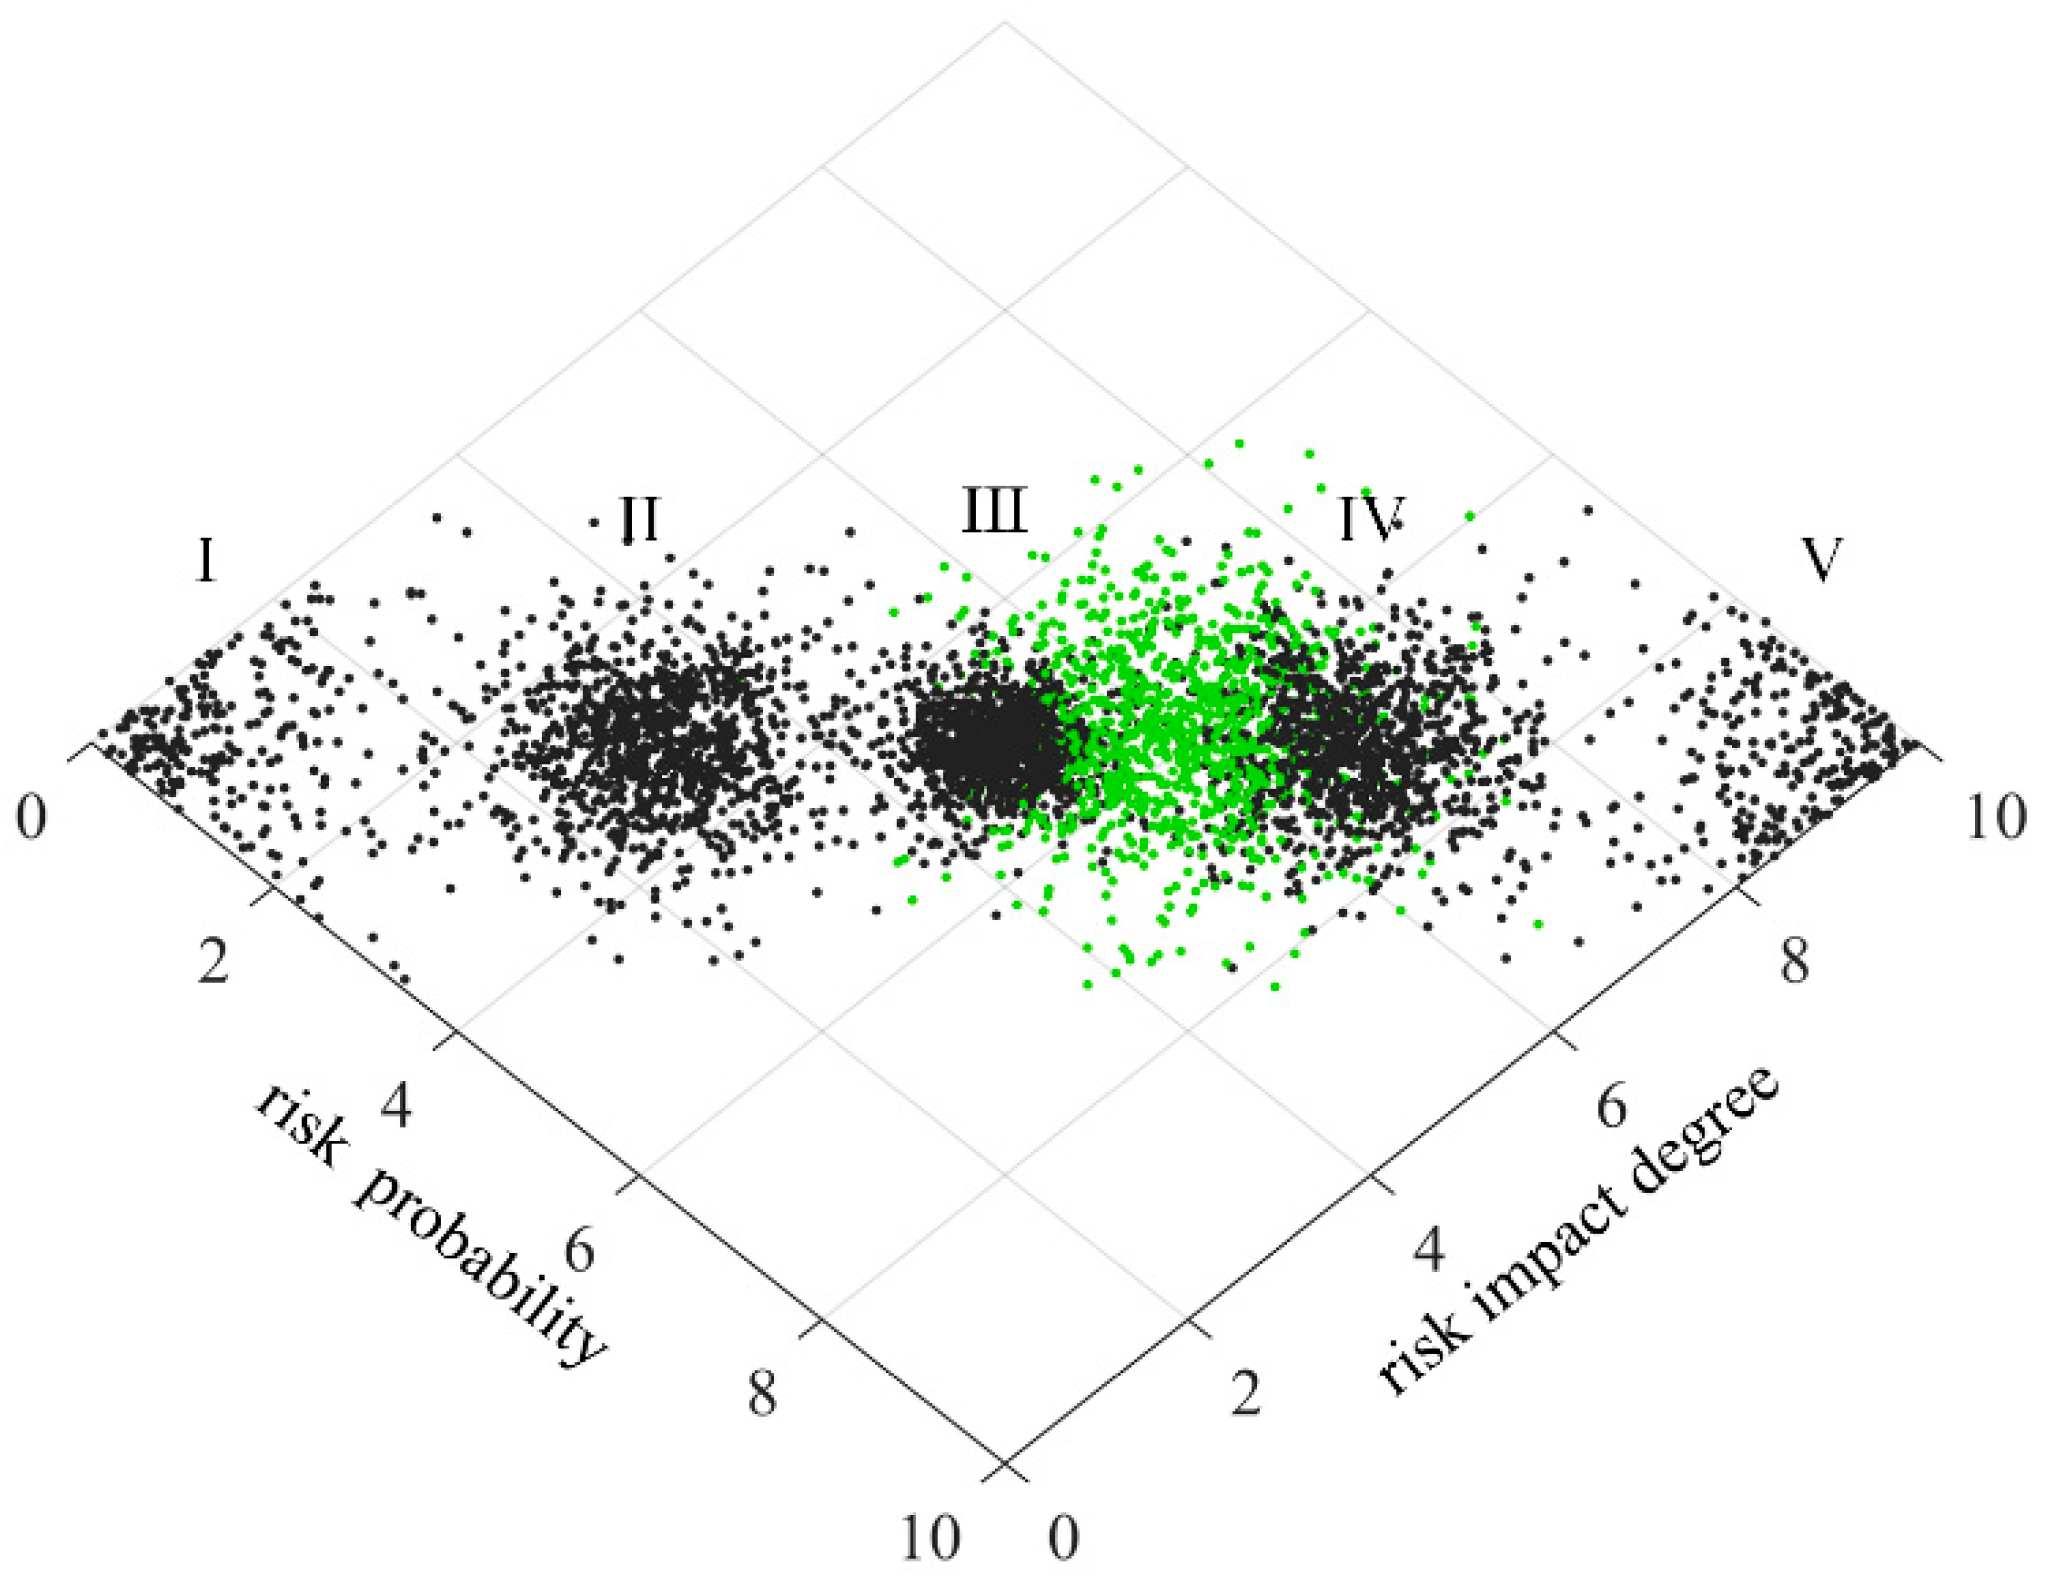
Figure 12.
Risk assessment cloud image of selecting the candidate.
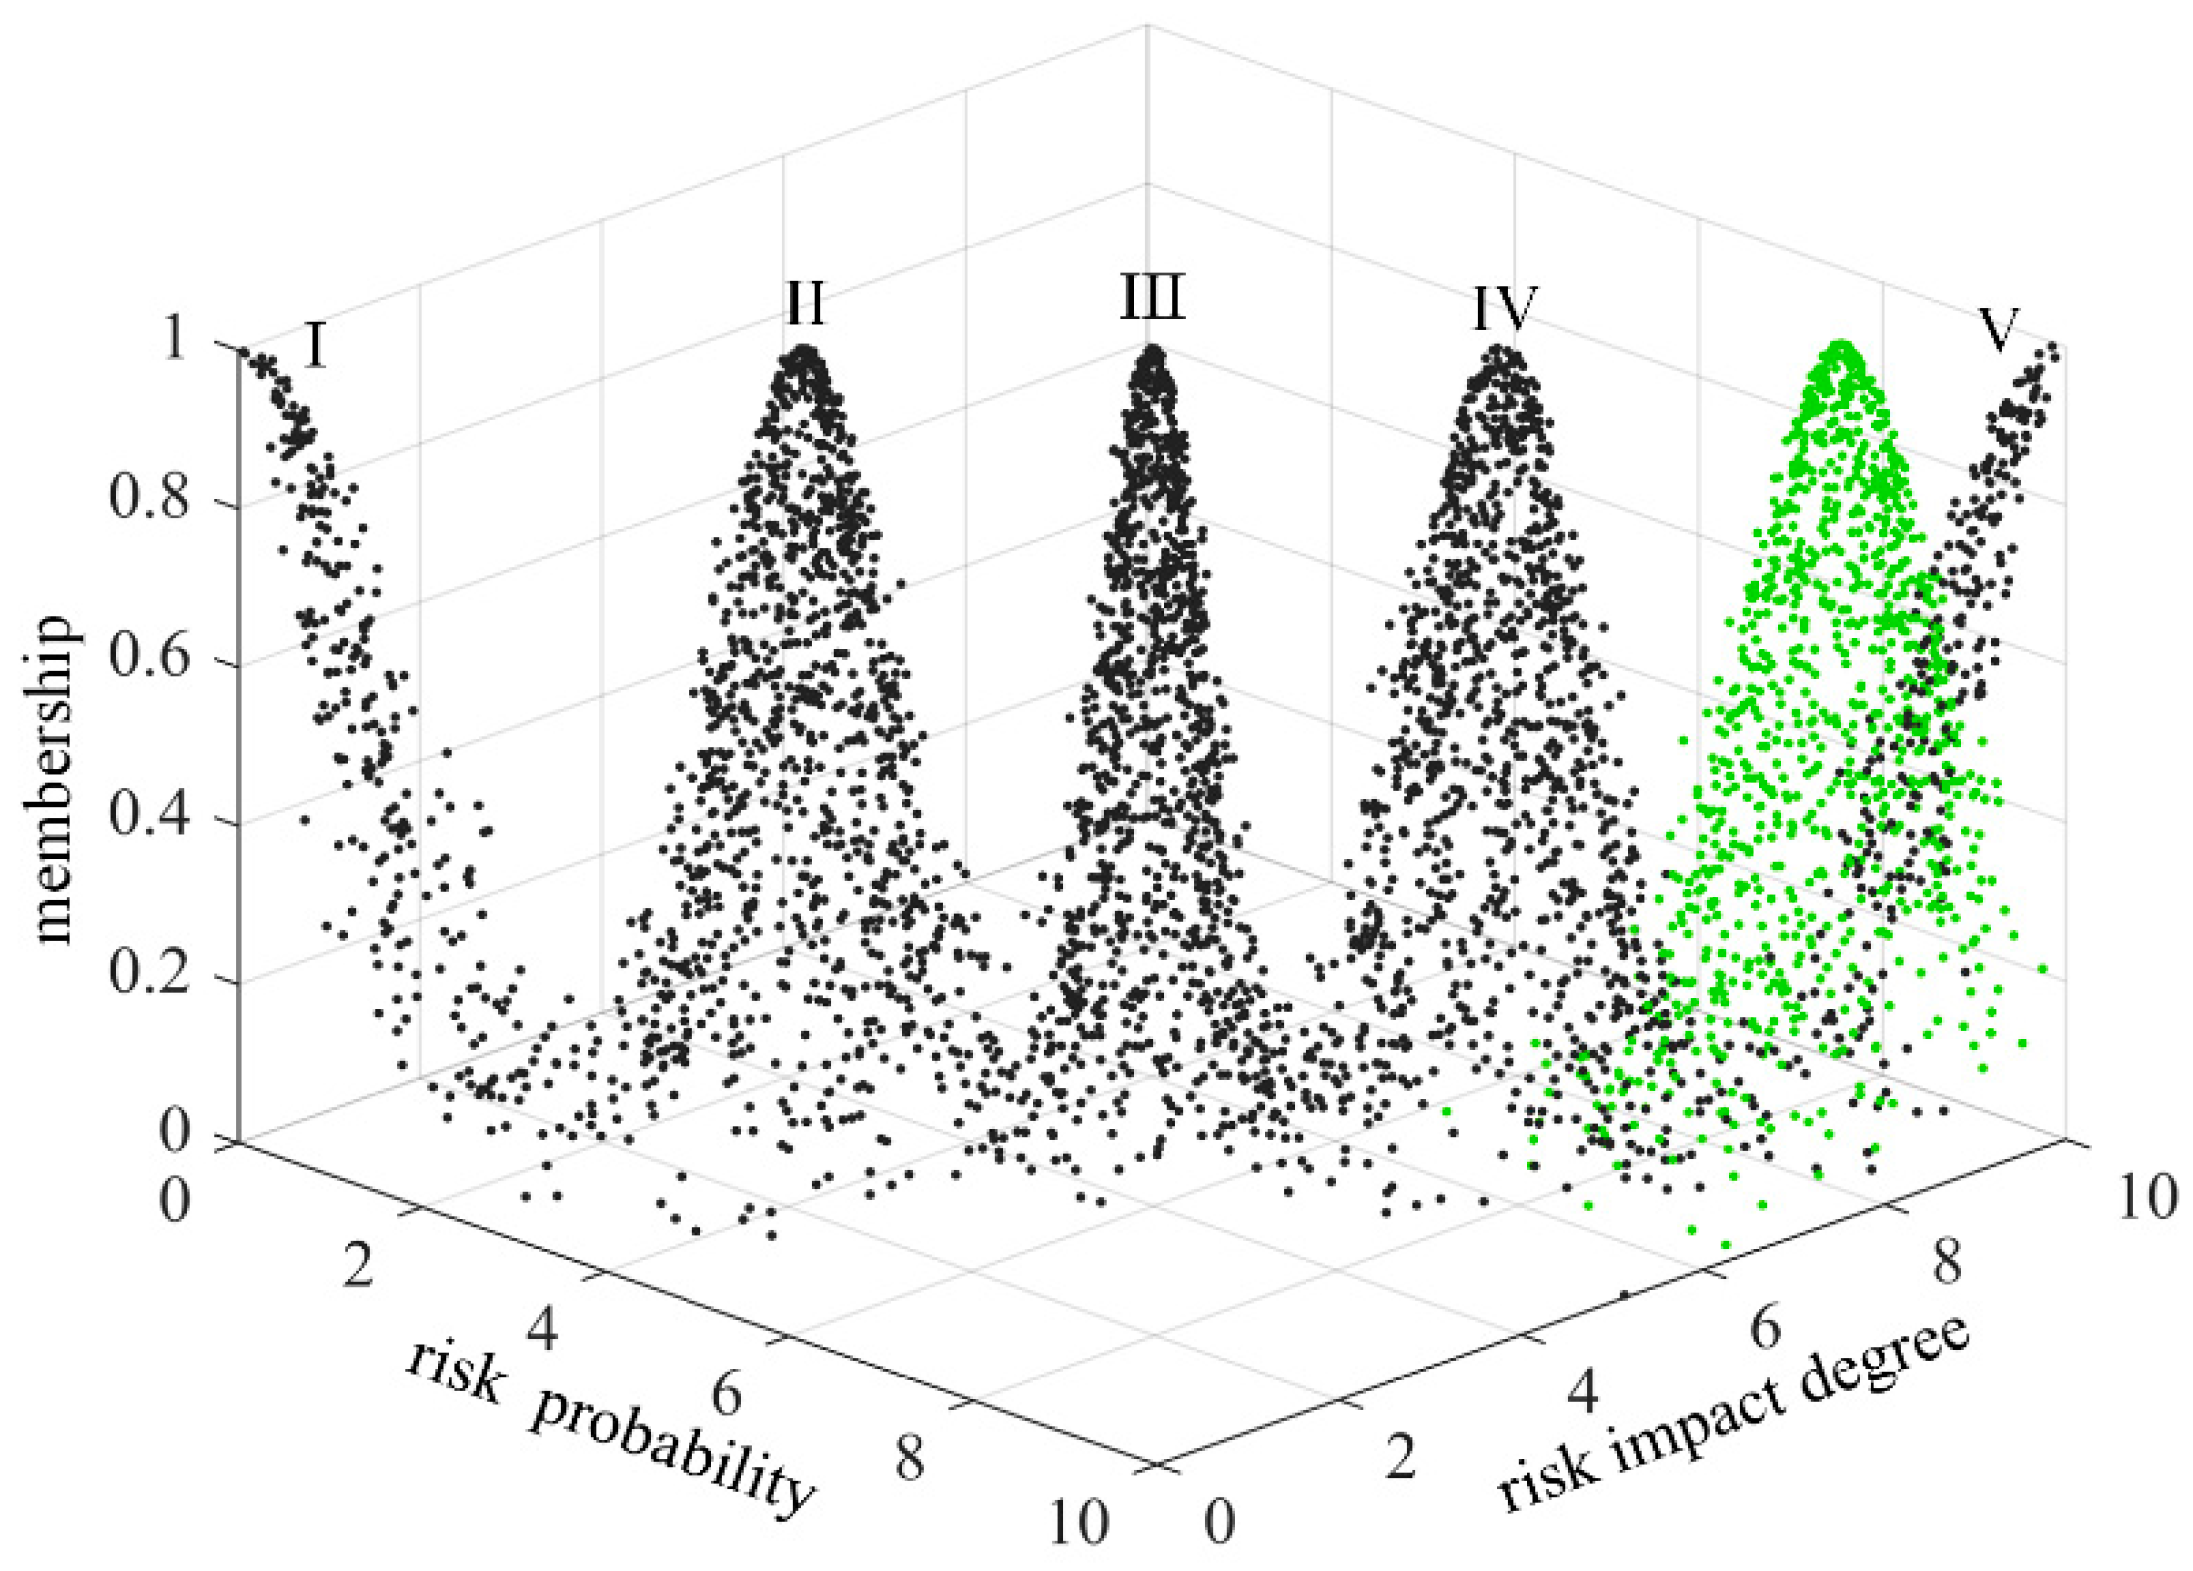
Figure 13.
Top view of risk assessment cloud image of selecting the candidate.
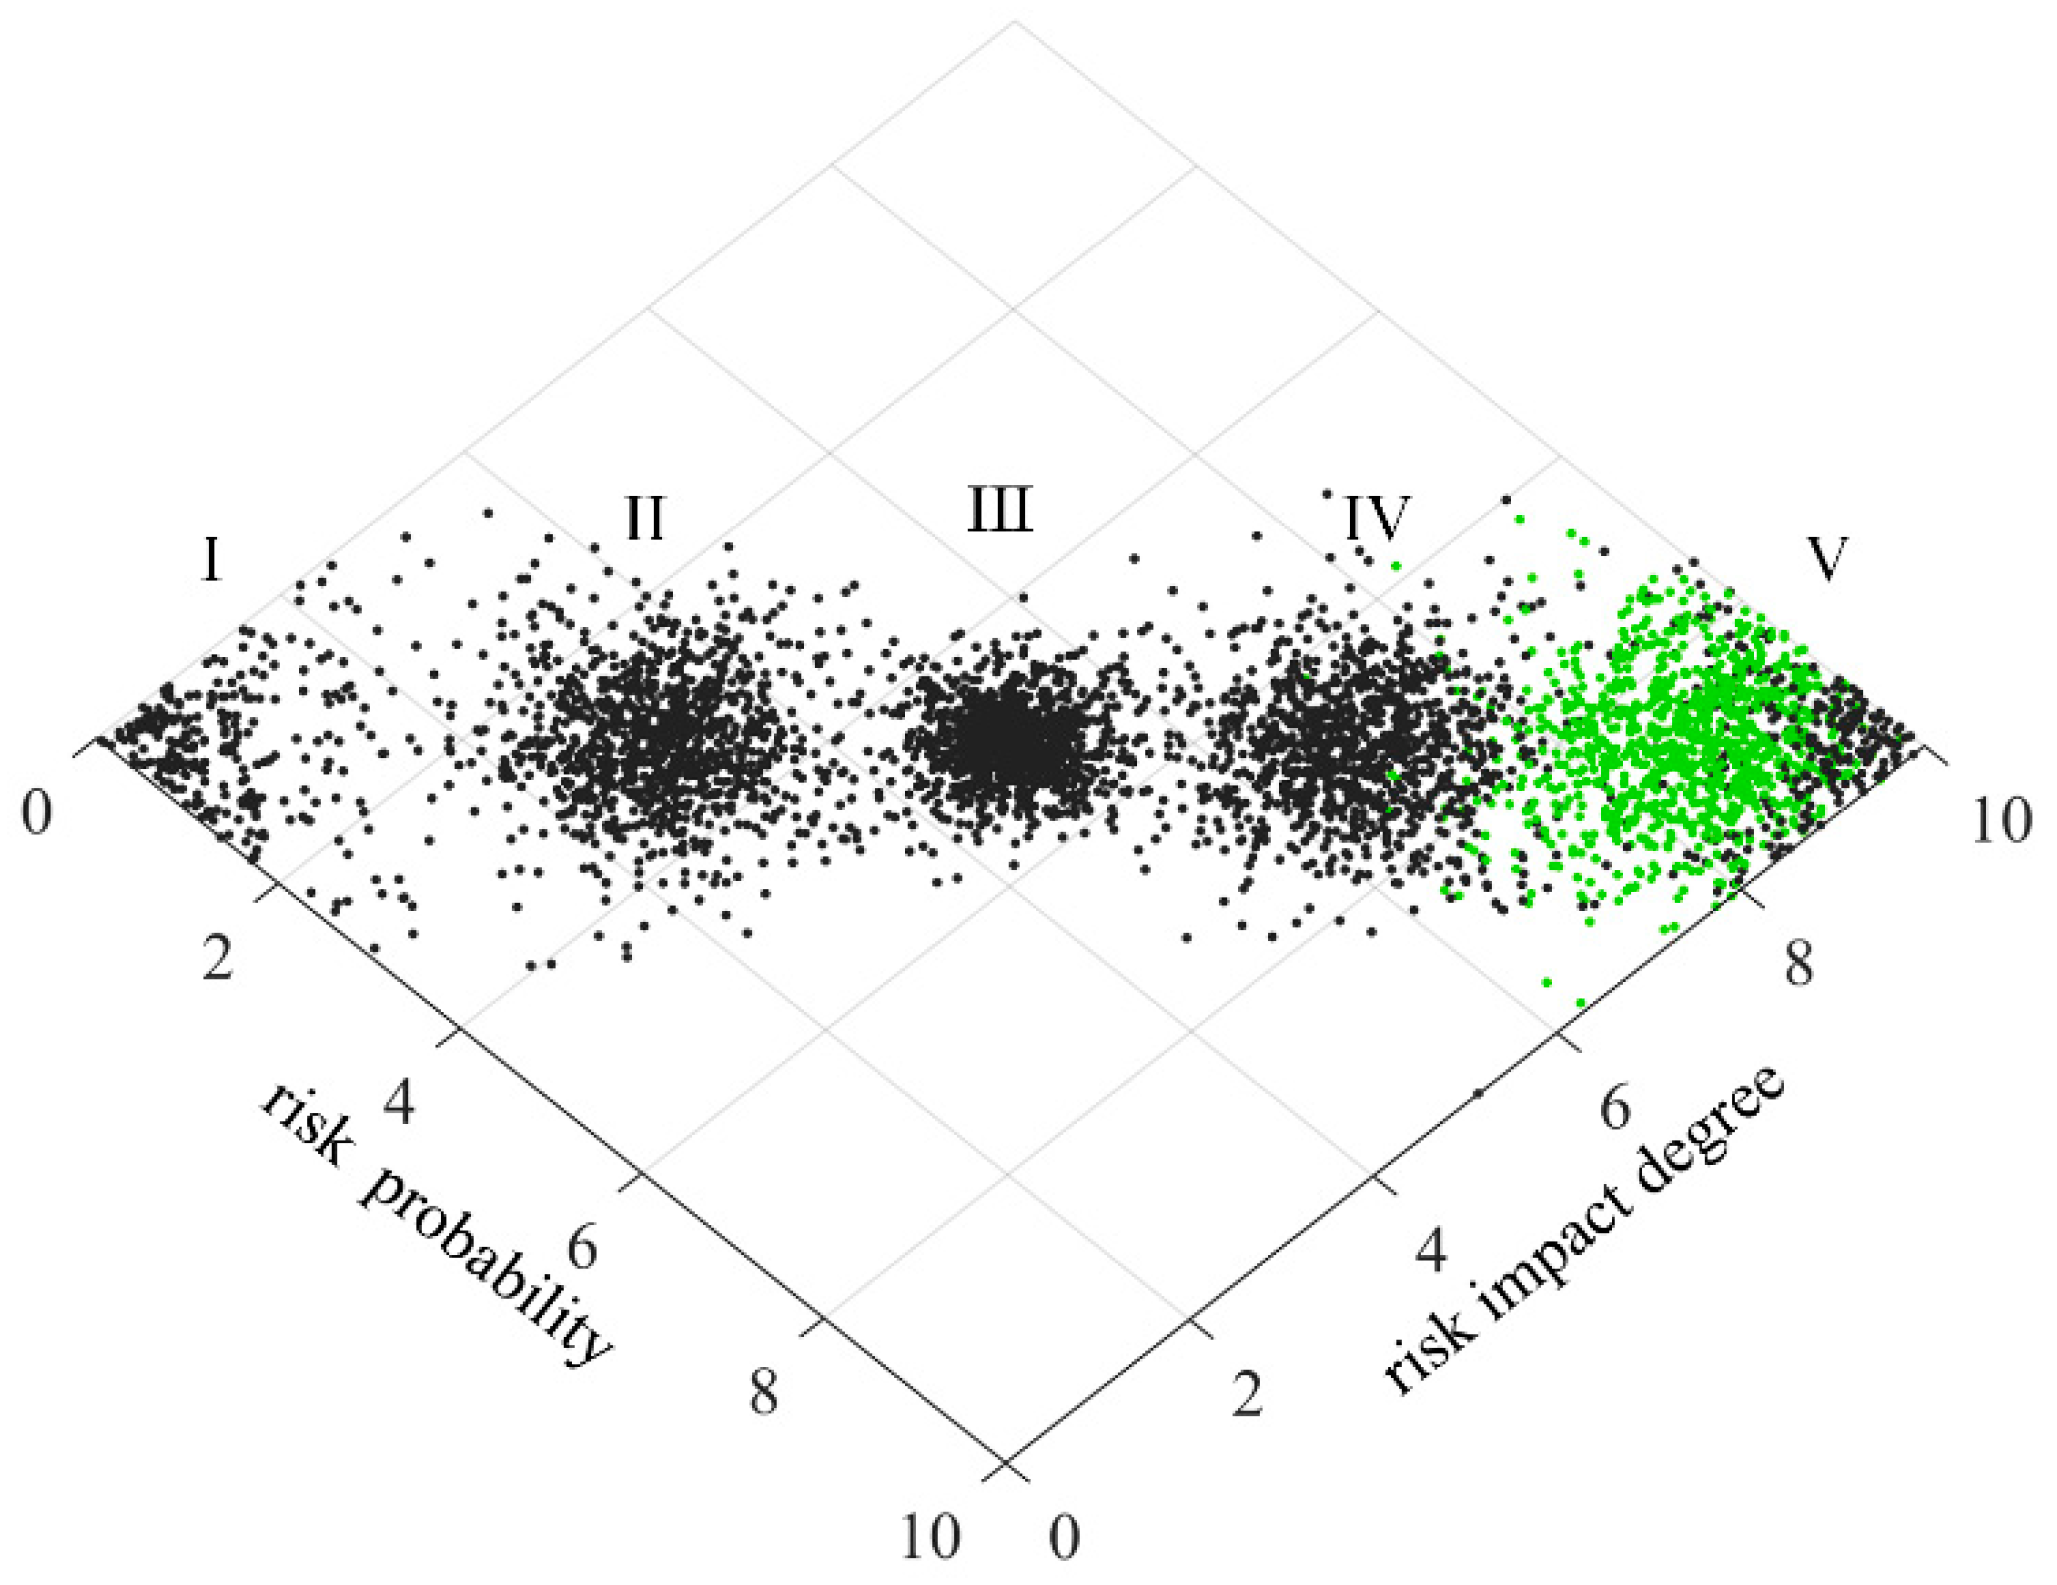
Figure 14.
Risk assessment cloud image of tackling the key technical problems.
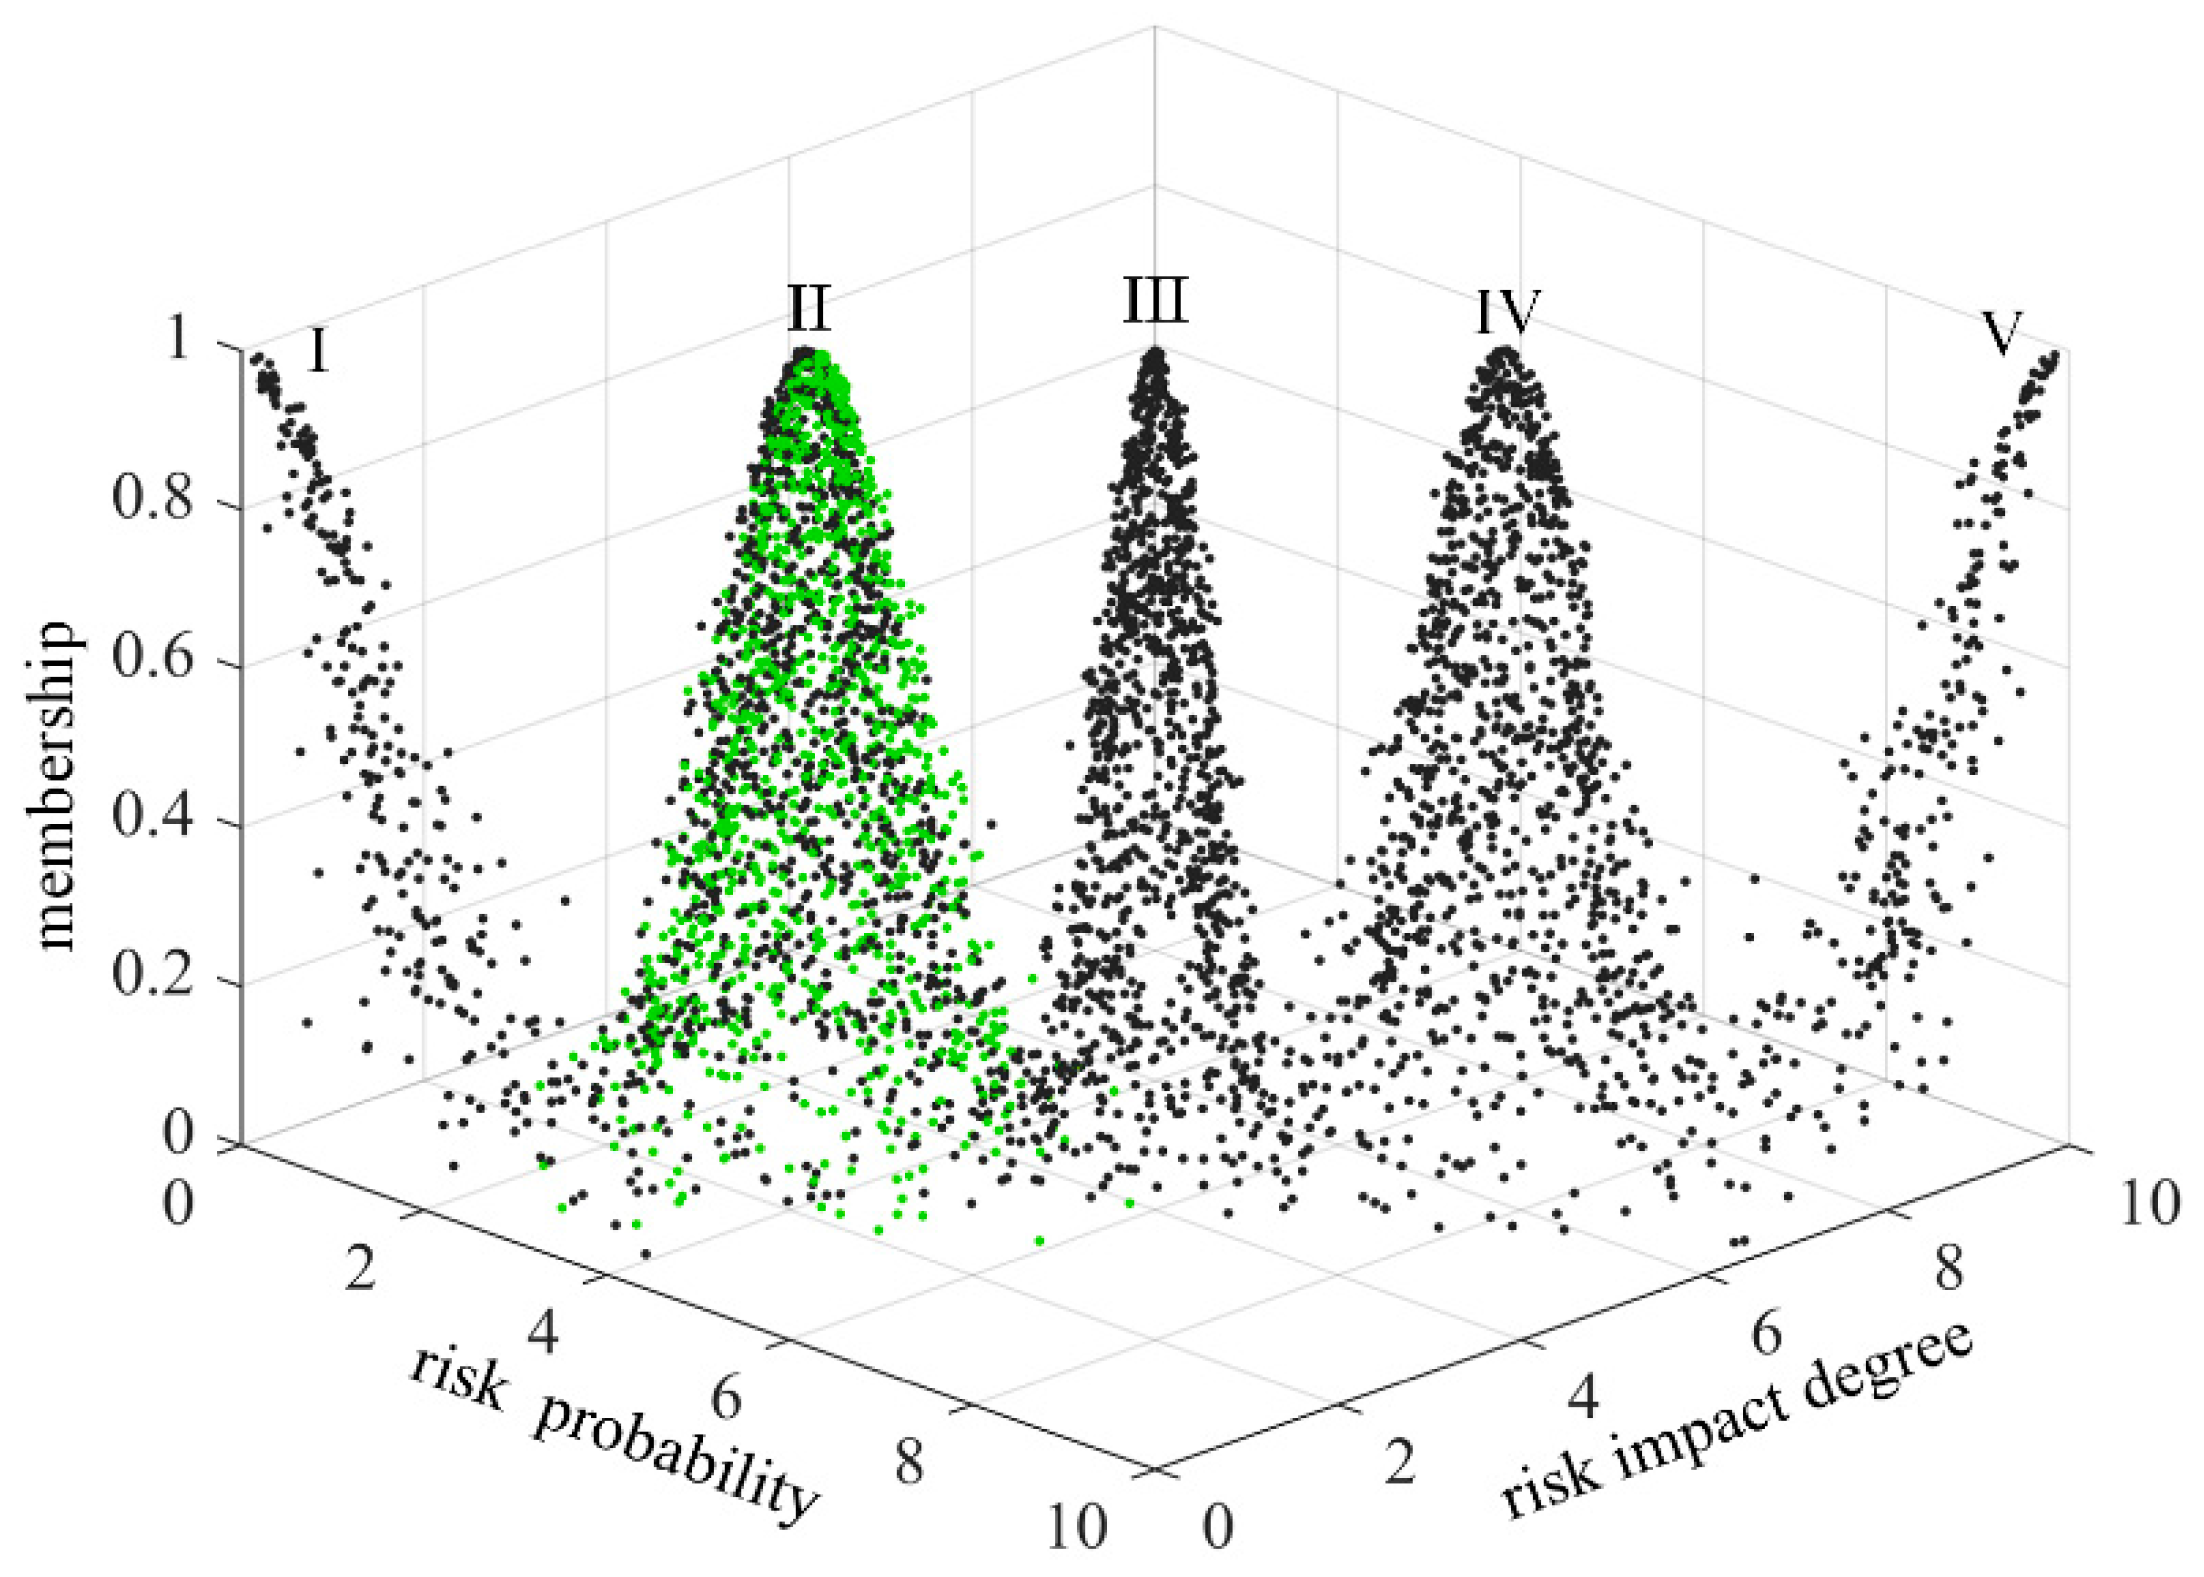
Figure 15.
Top view of risk assessment cloud image of tackling the key technical problems.
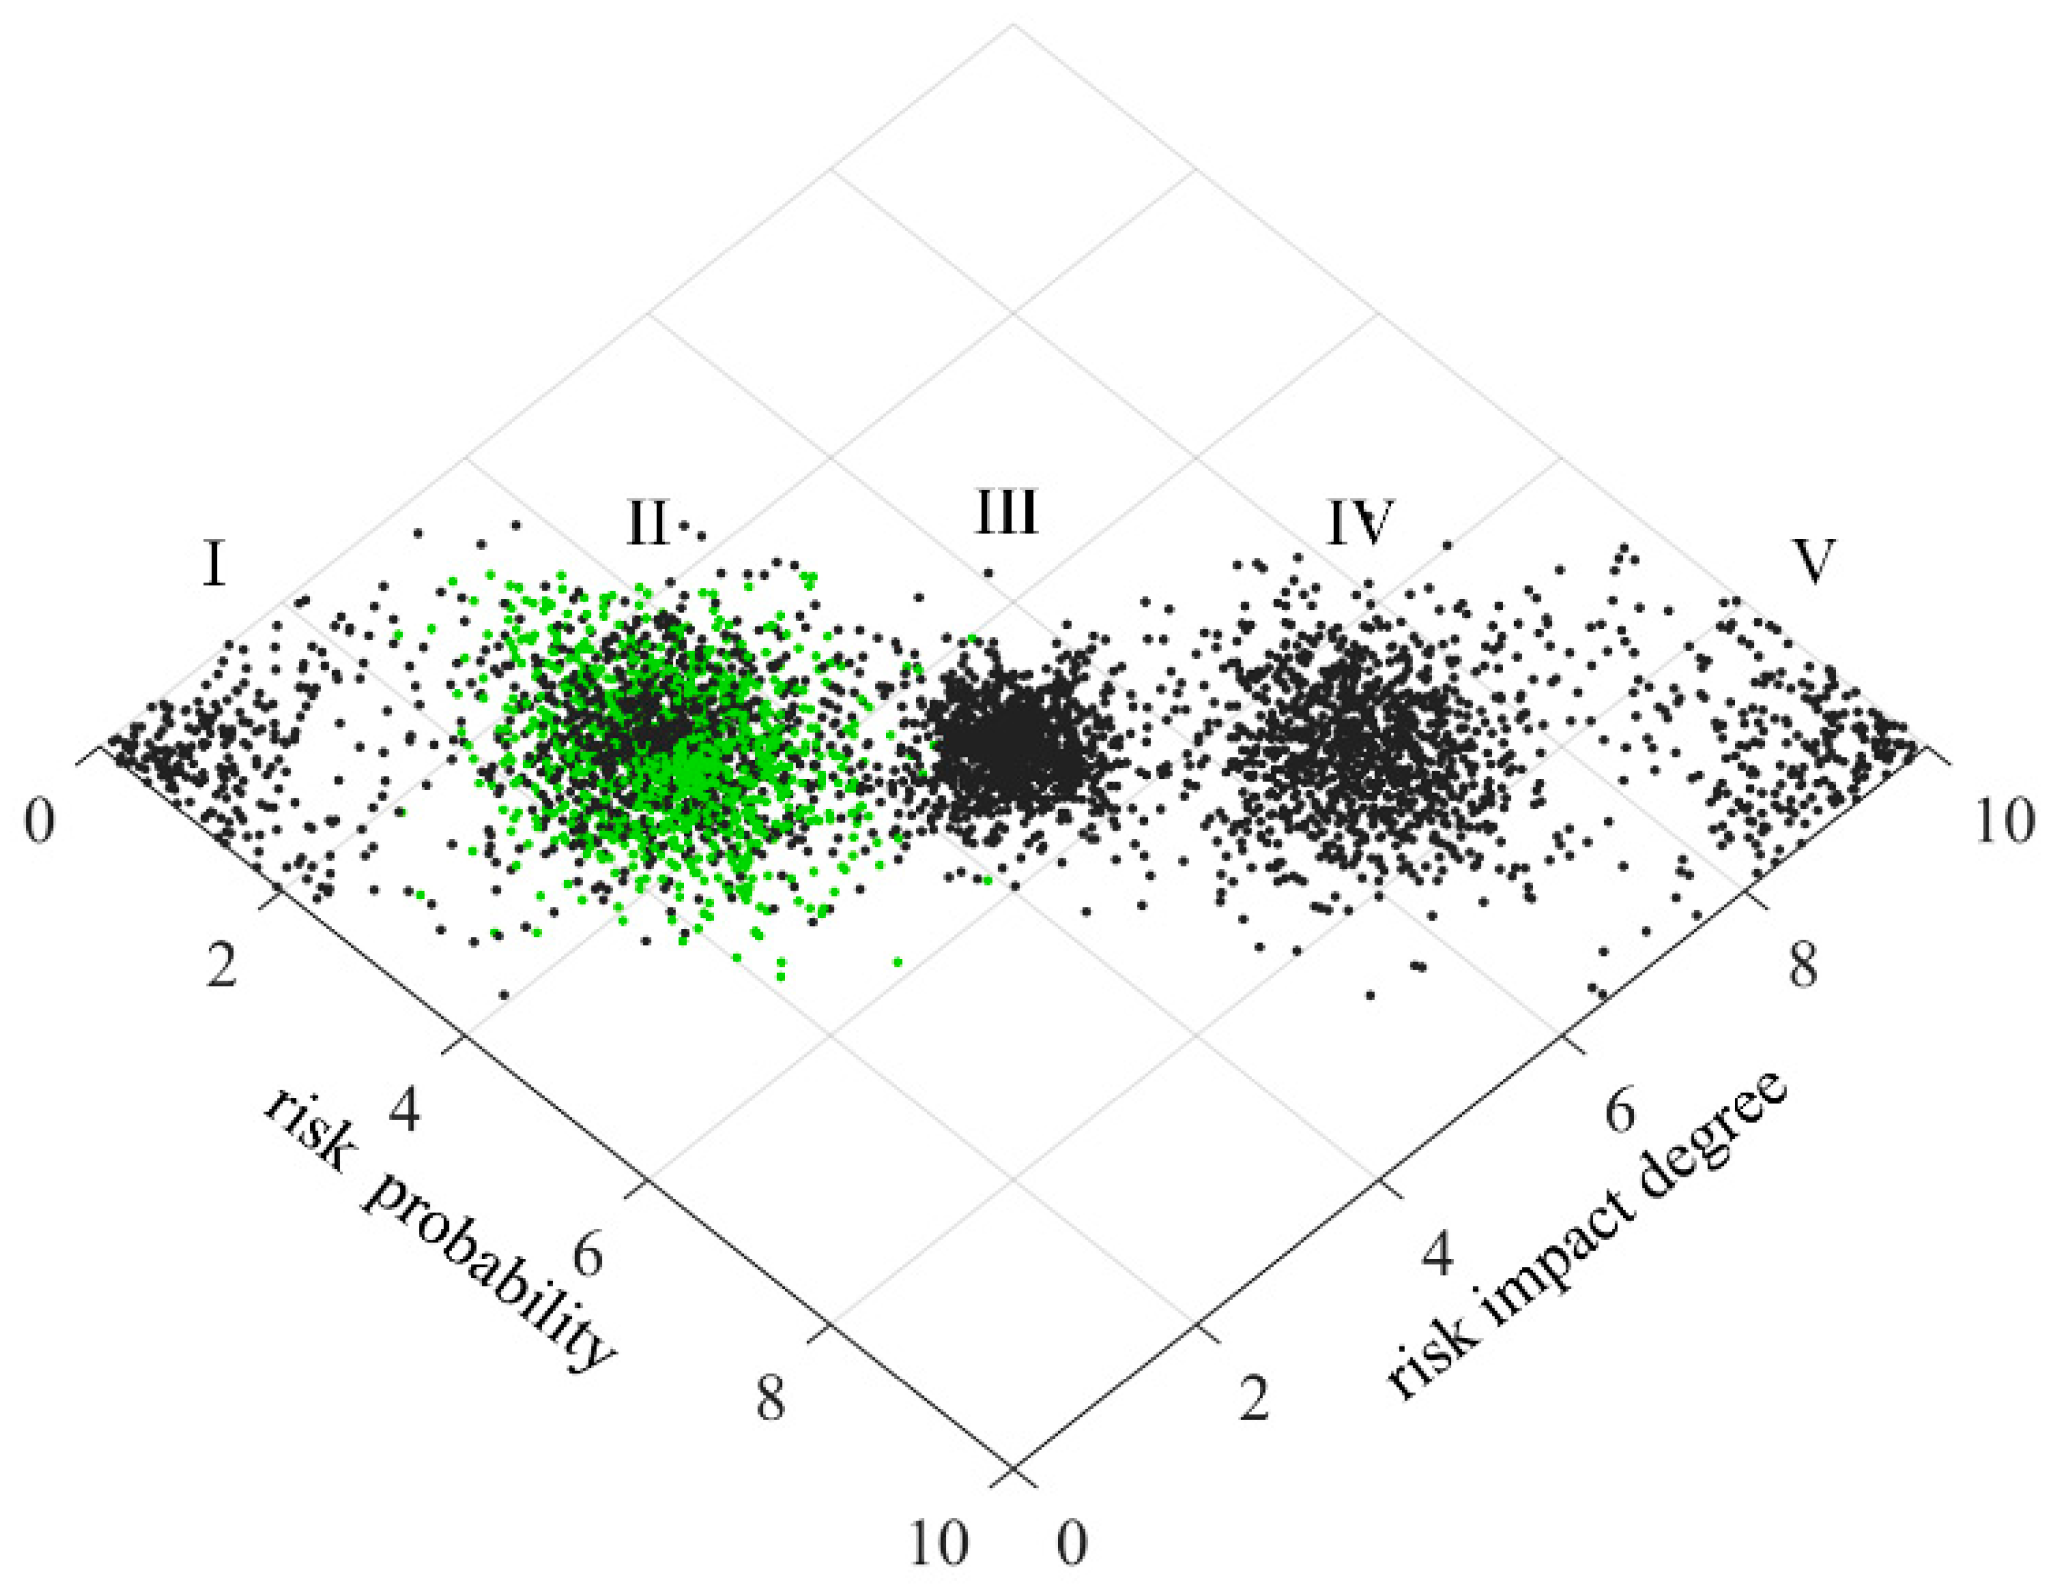
Figure 16.
Risk assessment cloud image of awarding the list.
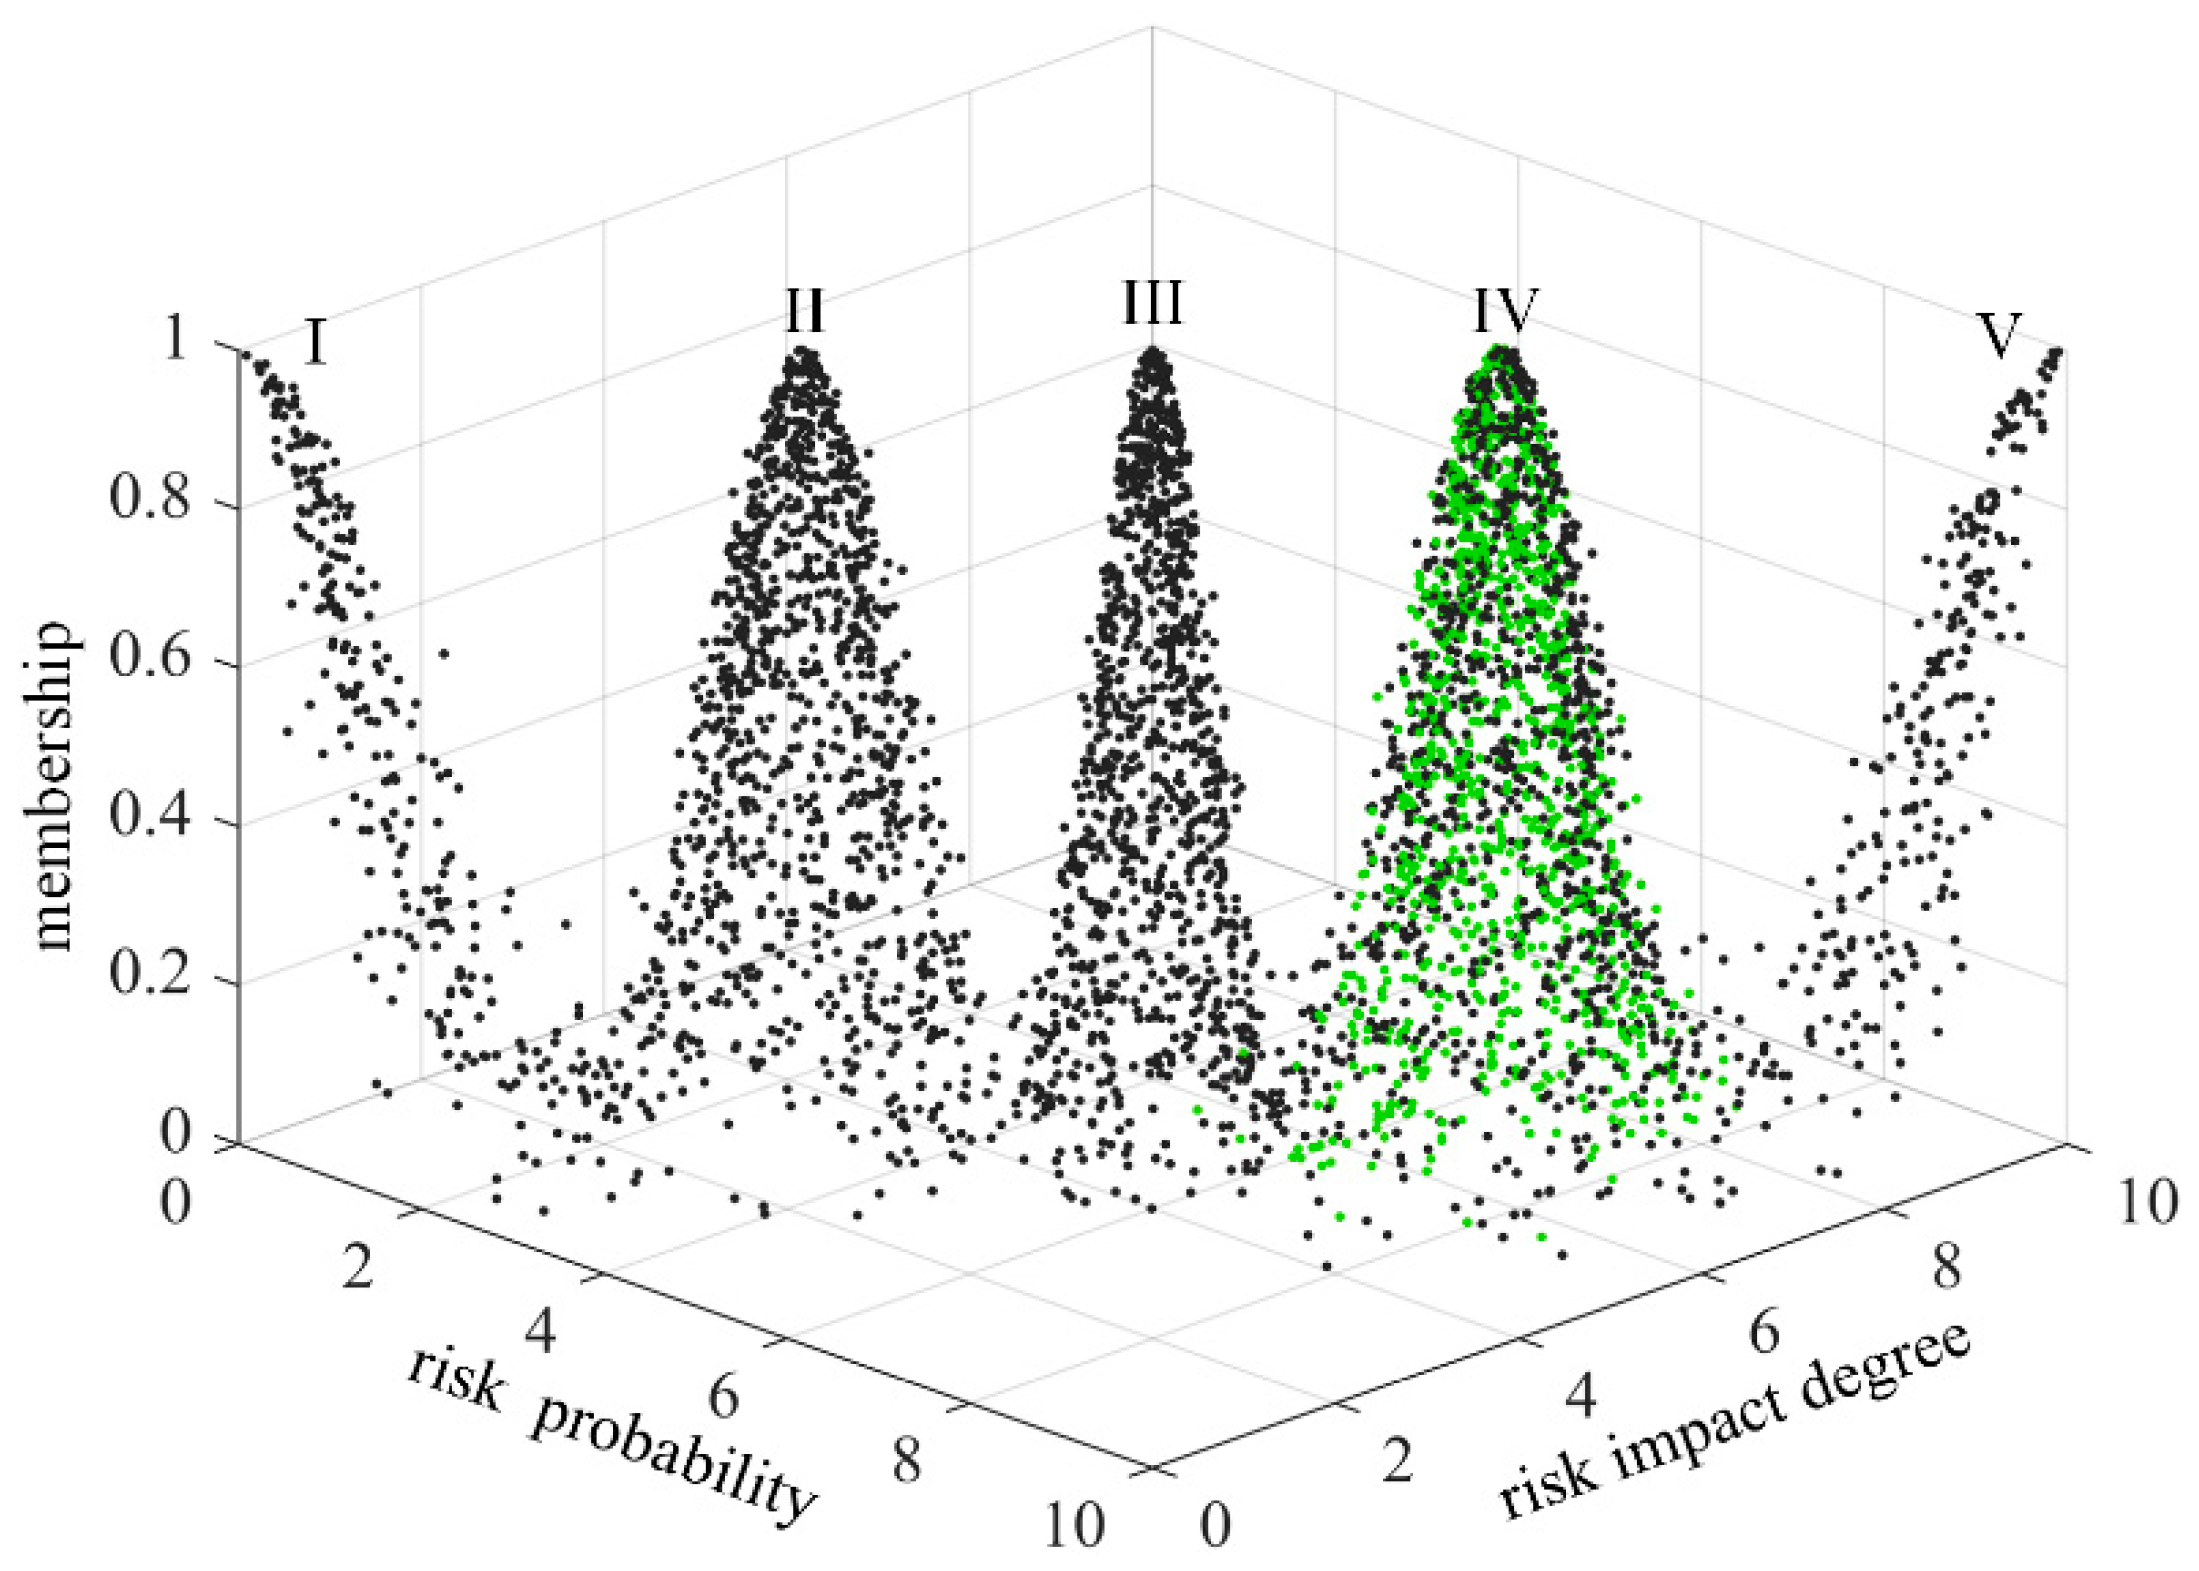
Figure 17.
Top view of risk assessment cloud image of awarding the list.
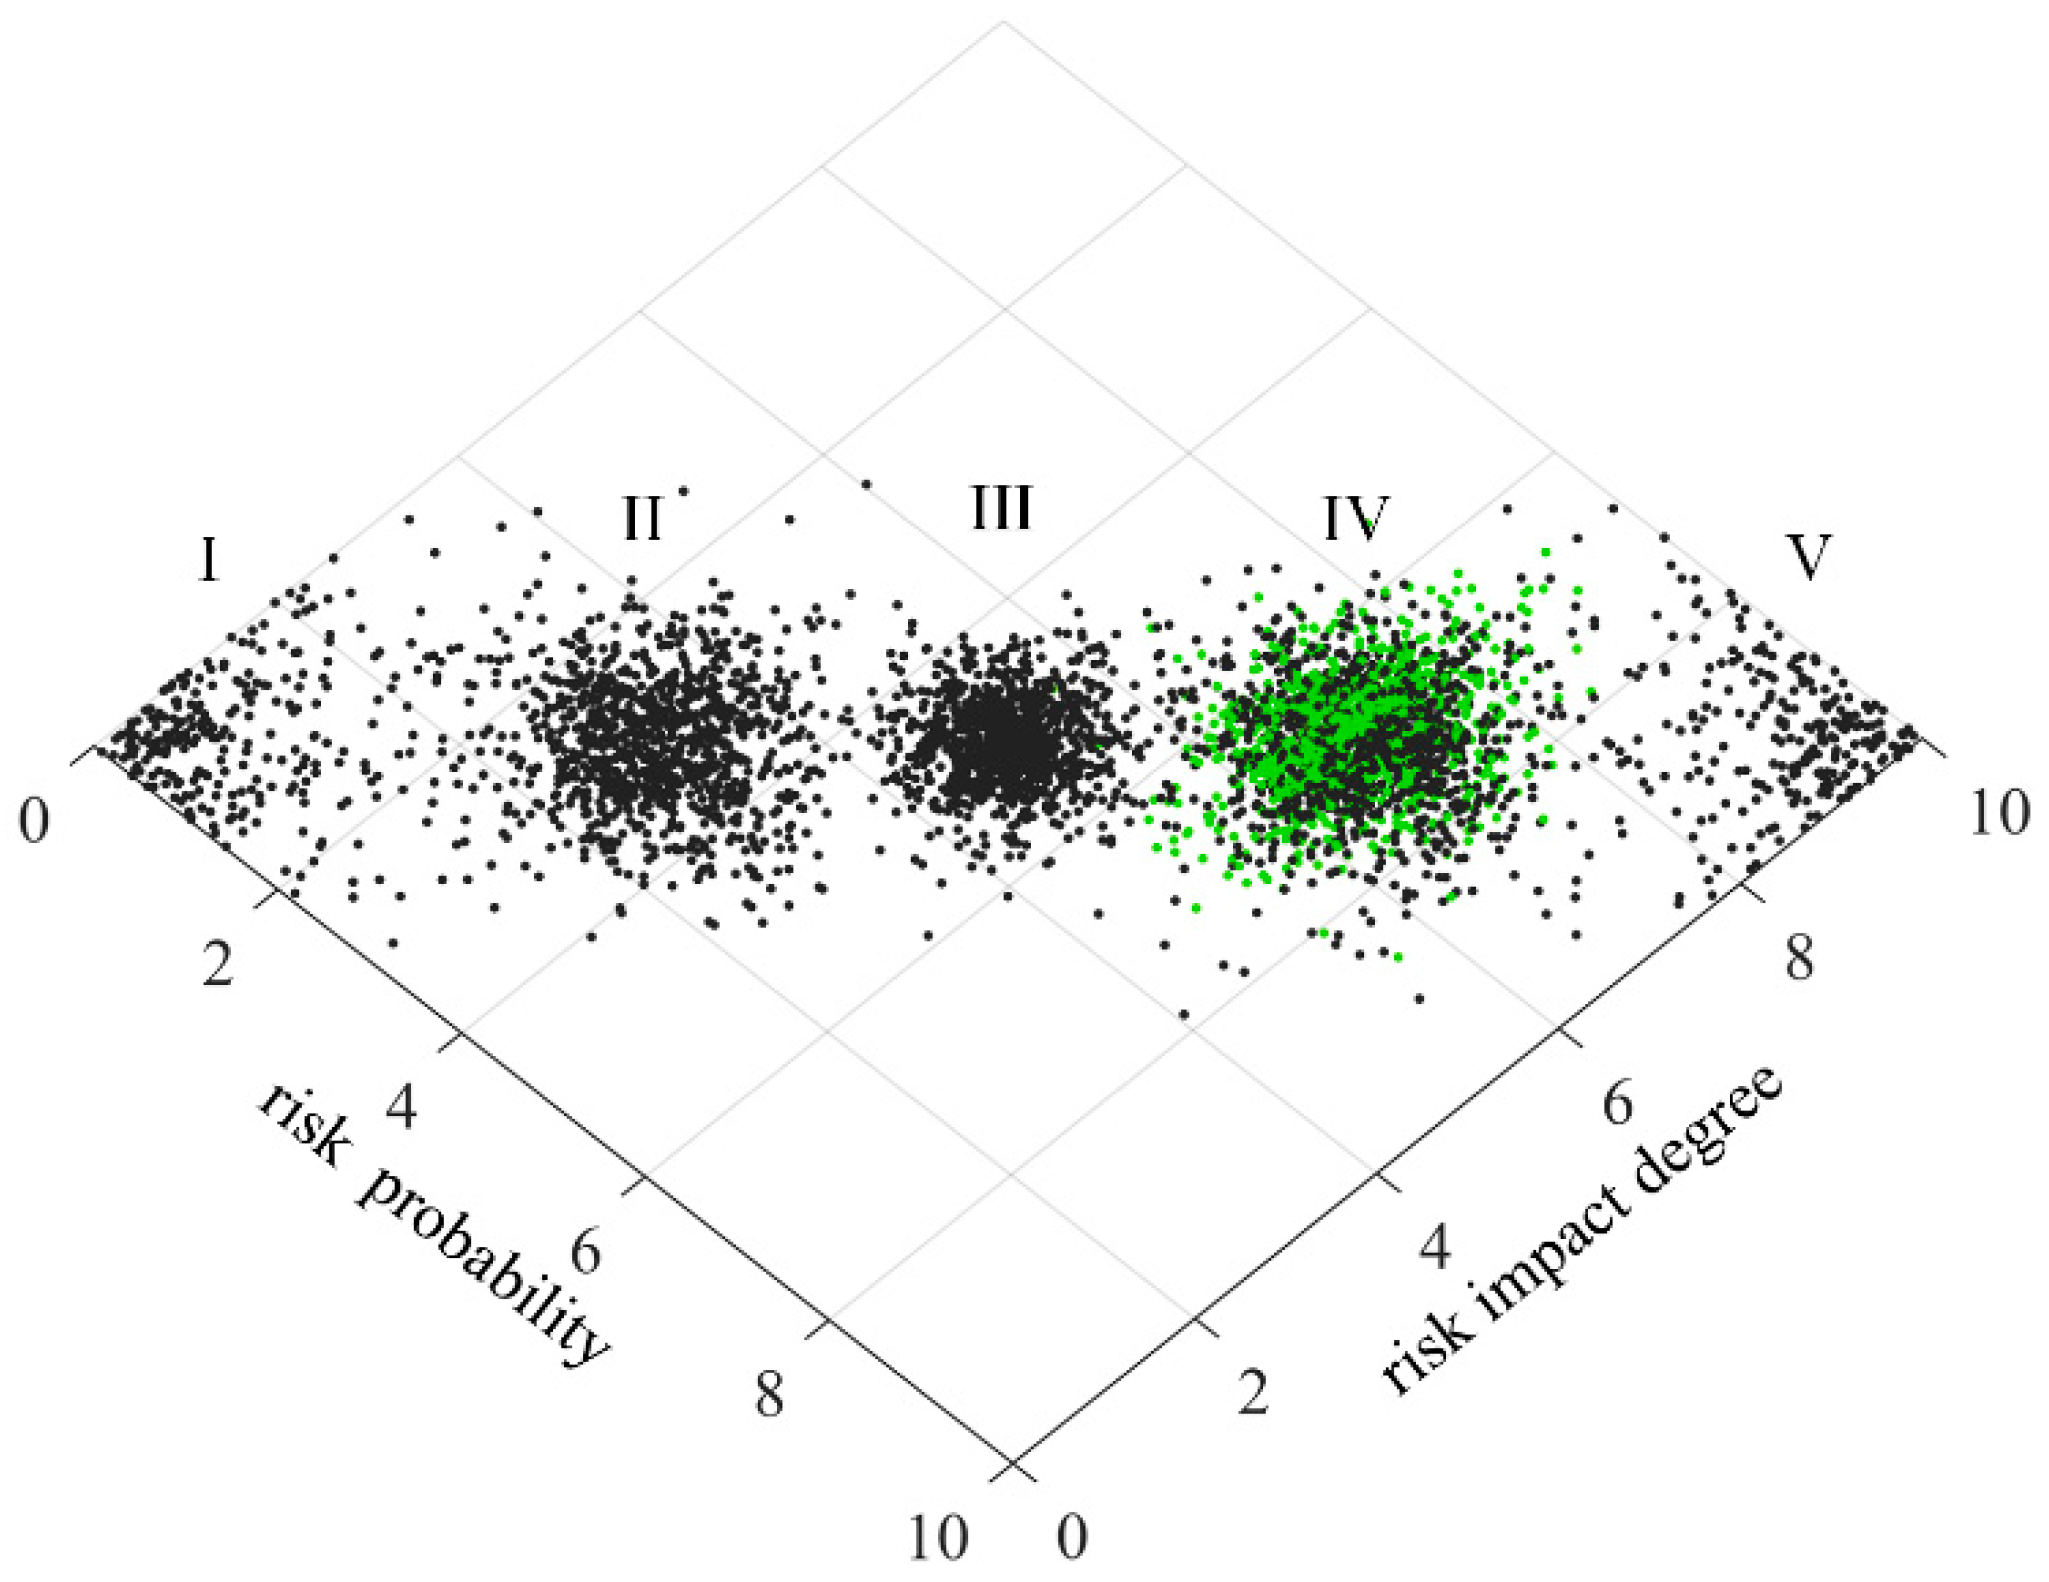
Figure 18.
Risk assessment cloud image of technology projects “Unveiling and Commanding” sys-tem.
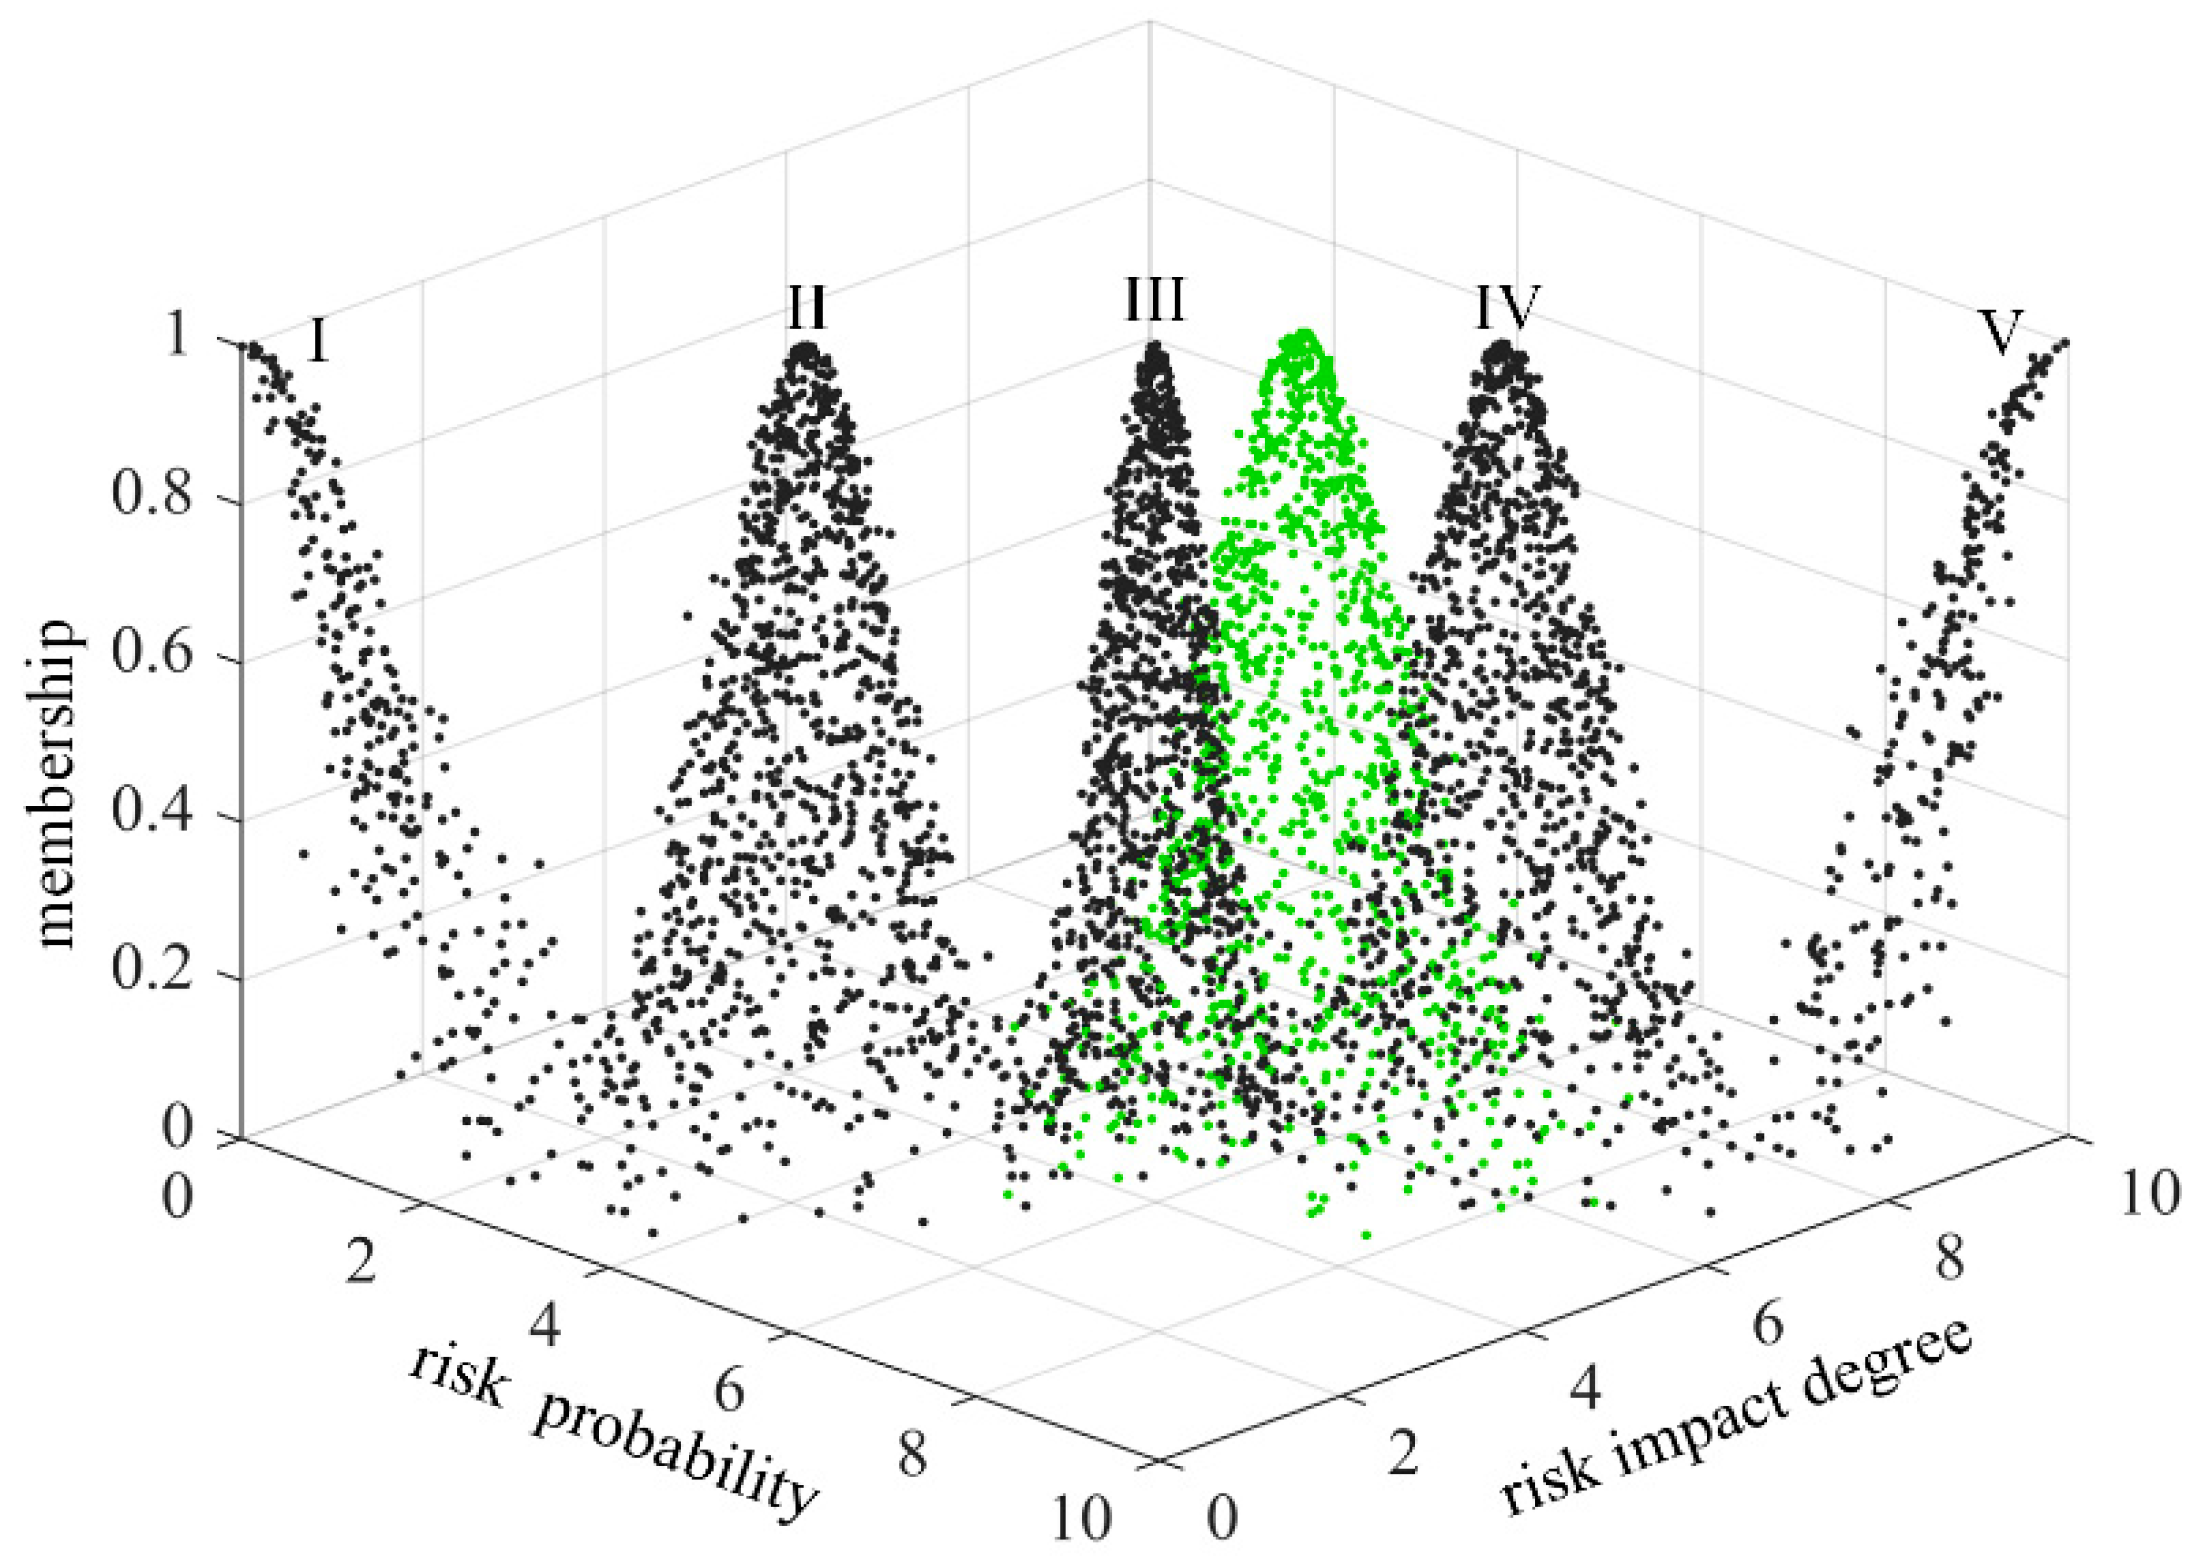
Figure 19.
Top view of risk assessment cloud image of technology projects “Unveiling and Com-manding” system.
Figure 19.
Top view of risk assessment cloud image of technology projects “Unveiling and Com-manding” system.
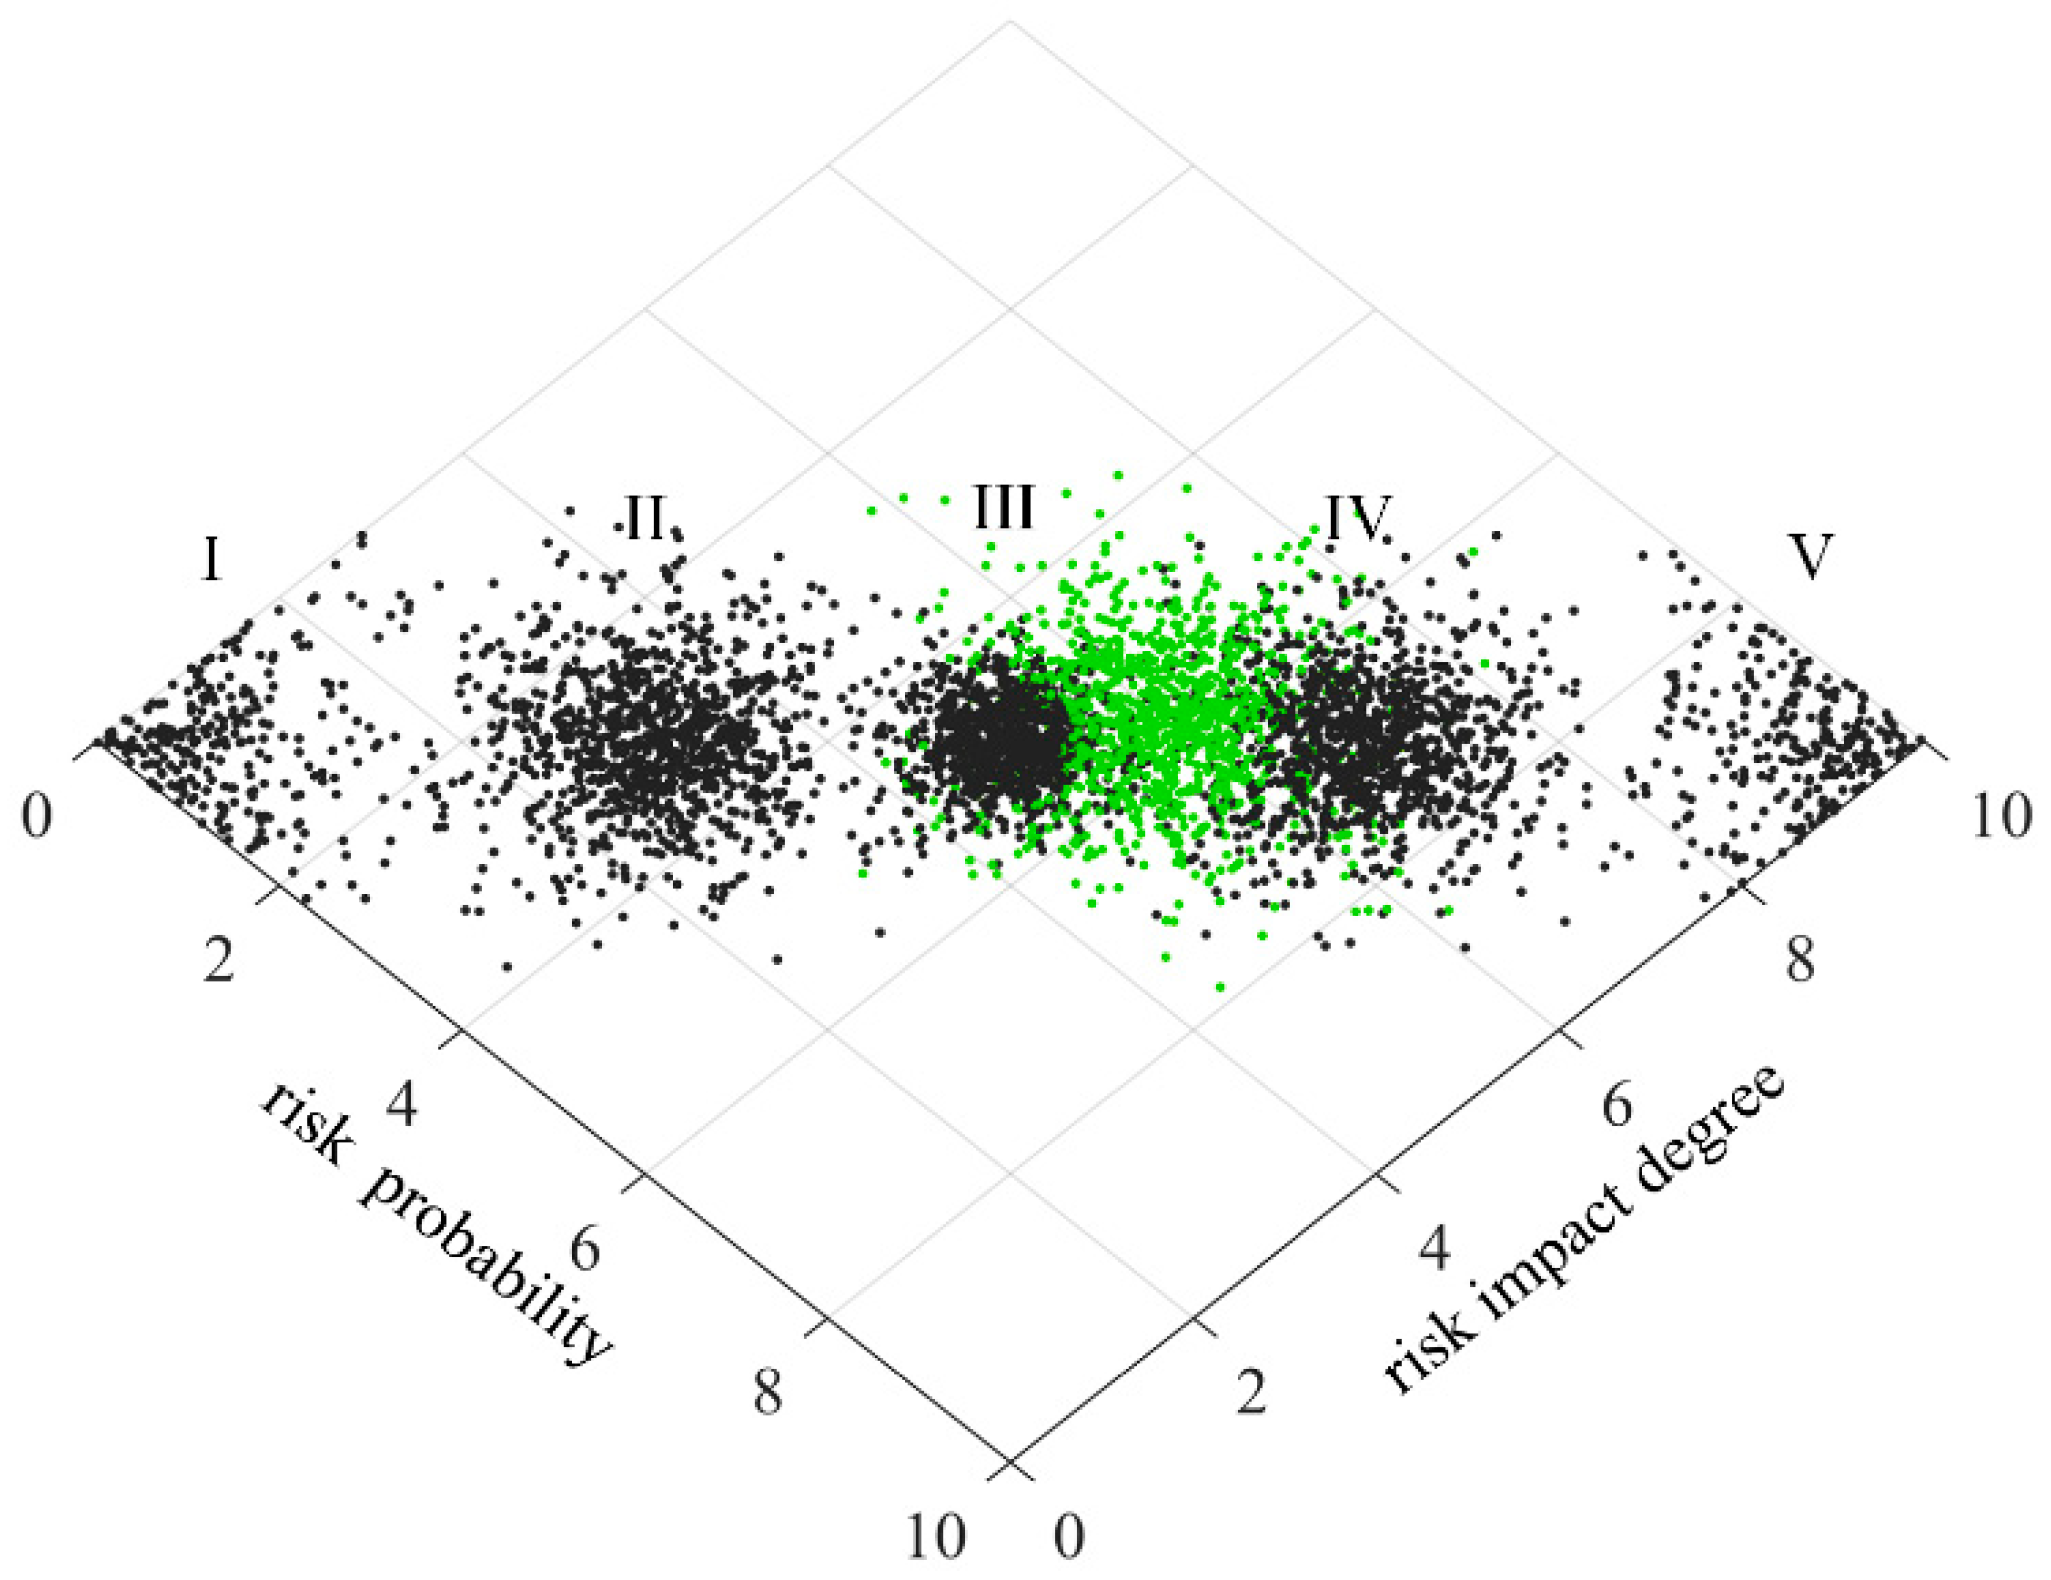

Table 1.
Indicators weights of risk probability of technology projects “Unveiling and Commanding” system.
Table 1.
Indicators weights of risk probability of technology projects “Unveiling and Commanding” system.
| Indicators weights | ||||||
| Hierarchical variable weight theory | Improved EW method | Grey correlation analysis | Improved CRITIC weight method | Improved game theory multiple combination weighting method | ||
| Level 2 indicators | D11 | 0.082673 | 0.065644 | 0.042711 | 0.065772 | 0.066192 |
| D12 | 0.063305 | 0.072181 | 0.045975 | 0.058942 | 0.061629 | |
| D13 | 0.081533 | 0.052265 | 0.03968 | 0.056894 | 0.059454 | |
| D14 | 0.056164 | 0.022022 | 0.031734 | 0.046904 | 0.039183 | |
| D15 | 0.085082 | 0.047609 | 0.052953 | 0.050933 | 0.060585 | |
| D21 | 0.02107 | 0.04535 | 0.082191 | 0.059169 | 0.048198 | |
| D22 | 0.053012 | 0.048566 | 0.033617 | 0.036986 | 0.044594 | |
| D23 | 0.066207 | 0.050691 | 0.068571 | 0.056833 | 0.06015 | |
| D31 | 0.048508 | 0.070914 | 0.08234 | 0.057538 | 0.063802 | |
| D32 | 0.07288 | 0.056284 | 0.033625 | 0.066475 | 0.05877 | |
| D33 | 0.052044 | 0.027382 | 0.061276 | 0.04163 | 0.044409 | |
| D41 | 0.043563 | 0.070101 | 0.038545 | 0.056033 | 0.053015 | |
| D42 | 0.020879 | 0.068974 | 0.051903 | 0.06938 | 0.051212 | |
| D43 | 0.052477 | 0.059396 | 0.046487 | 0.041737 | 0.051207 | |
| D44 | 0.020774 | 0.040185 | 0.066107 | 0.063858 | 0.044281 | |
| D45 | 0.036325 | 0.0491 | 0.055553 | 0.025486 | 0.041835 | |
| D51 | 0.02825 | 0.046151 | 0.036261 | 0.06993 | 0.043559 | |
| D52 | 0.045174 | 0.041925 | 0.065475 | 0.022331 | 0.043691 | |
| D53 | 0.07008 | 0.065259 | 0.064995 | 0.053169 | 0.064234 | |
| Level 1 indicators | D1 | 0.368757 | 0.259721 | 0.213053 | 0.279445 | 0.287043 |
| D2 | 0.140289 | 0.144607 | 0.184379 | 0.152988 | 0.152942 | |
| D3 | 0.173432 | 0.154581 | 0.177242 | 0.165643 | 0.166981 | |
| D4 | 0.174019 | 0.287756 | 0.258595 | 0.256493 | 0.24155 | |
| D5 | 0.143504 | 0.153335 | 0.166731 | 0.145431 | 0.151484 | |
Table 2.
Indicators weights of risk impact degree of technology projects “Unveiling and Commanding” system.
Table 2.
Indicators weights of risk impact degree of technology projects “Unveiling and Commanding” system.
| Indicators weights | ||||||
| Hierarchical variable weight theory | Improved EW method | Grey correlation analysis | Improved CRITIC weight method | Improved game theory multiple combination weighting method | ||
| Level 2 indicators | D11 | 0.050013 | 0.052936 | 0.048529 | 0.0602 | 0.052631 |
| D12 | 0.062904 | 0.04746 | 0.066163 | 0.079884 | 0.062318 | |
| D13 | 0.04793 | 0.041001 | 0.062069 | 0.050205 | 0.049134 | |
| D14 | 0.053133 | 0.076029 | 0.054463 | 0.071758 | 0.063993 | |
| D15 | 0.043729 | 0.020783 | 0.05003 | 0.032218 | 0.035803 | |
| D21 | 0.051841 | 0.060068 | 0.037766 | 0.066673 | 0.054461 | |
| D22 | 0.061684 | 0.052807 | 0.052644 | 0.048453 | 0.054566 | |
| D23 | 0.061146 | 0.082014 | 0.072434 | 0.072508 | 0.071936 | |
| D31 | 0.03926 | 0.079598 | 0.041356 | 0.061238 | 0.056176 | |
| D32 | 0.058953 | 0.024566 | 0.065013 | 0.036759 | 0.04541 | |
| D33 | 0.033604 | 0.024267 | 0.071557 | 0.038906 | 0.039454 | |
| D41 | 0.057268 | 0.025993 | 0.038627 | 0.036374 | 0.039978 | |
| D42 | 0.038976 | 0.04471 | 0.058365 | 0.047794 | 0.046338 | |
| D43 | 0.063016 | 0.055908 | 0.034878 | 0.075344 | 0.057722 | |
| D44 | 0.049016 | 0.070795 | 0.048542 | 0.048335 | 0.055319 | |
| D45 | 0.065148 | 0.05994 | 0.063965 | 0.030607 | 0.056441 | |
| D51 | 0.071641 | 0.05955 | 0.056413 | 0.055372 | 0.061714 | |
| D52 | 0.040402 | 0.087547 | 0.021615 | 0.022587 | 0.047225 | |
| D53 | 0.050337 | 0.034029 | 0.055571 | 0.064788 | 0.049381 | |
| Level 1 indicators | D1 | 0.257708 | 0.238208 | 0.281254 | 0.294264 | 0.263879 |
| D2 | 0.174671 | 0.194889 | 0.162844 | 0.187634 | 0.180963 | |
| D3 | 0.131817 | 0.128432 | 0.177927 | 0.136902 | 0.14104 | |
| D4 | 0.273424 | 0.257346 | 0.244377 | 0.238453 | 0.255797 | |
| D5 | 0.16238 | 0.181125 | 0.133598 | 0.142747 | 0.158321 | |
Table 3.
Standard cloud eigenvalues of risk assessment of technology projects “Unveiling and Commanding” system.
Table 3.
Standard cloud eigenvalues of risk assessment of technology projects “Unveiling and Commanding” system.
| Scale | Risk level description | Risk possibility | Risk impact degree | |
| Ⅰ | minimal risk | minimal possibility | minimal degree | (0,1.030,0.2618) |
| Ⅱ | low risk | low possibility | low degree | (3.09,0.6367,0.1618) |
| Ⅲ | medium risk | medium possibility | medium degree | (5,0.3935,0.1) |
| Ⅳ | high risk | high possibility | high degree | (6.91,0.6367,0.1618) |
| Ⅴ | great risk | great possibility | great degree | (10,1.030,0.2618) |
Table 4.
Cloud eigenvalues of risk assessment of technology projects “Unveiling and Commanding” system.
Table 4.
Cloud eigenvalues of risk assessment of technology projects “Unveiling and Commanding” system.
| Comprehensive risk cloud eigenvalues | First-level cloud eigenvalues | Second-level cloud eigenvalues | ||||||
| Item | Risk possibility | Risk impact degree | Indicators | Risk possibility | Risk impact degree | Indicators | Risk possibility | Risk impact degree |
| D | (5.613, 0.703, 0.165) |
(5.988, 0.711, 0.163) |
D1 | (3.859, 0.742, 0.161) |
(4.155, 0.726, 0.153) |
D11 | (3.146, 0.612, 0.110) |
(3.378, 0.728, 0.137) |
| D12 | (4.157, 0.685, 0.176) |
(4.514, 0.821, 0.155) |
||||||
| D13 | (3.428, 0.983, 0.132) |
(4.106, 0.715, 0.123) |
||||||
| D14 | (5.553, 0.827, 0.197) |
(5.222, 0.663, 0.154) |
||||||
| D15 | (3.028, 0.583, 0.182) |
(3.445, 0.676, 0.188) |
||||||
| D2 | (5.919, 0.827, 0.163) |
(6.053, 0.788, 0.168) |
D21 | (5.432, 0.824, 0.191) |
(6.177, 0.733, 0.183) |
|||
| D22 | (6.246, 0.705, 0.153) |
(6.521, 0.744, 0.170) |
||||||
| D23 | (6.288, 0.942, 0.136) |
(5.501, 0.881, 0.152) |
||||||
| D3 | (8.729, 0.715, 0.171) |
(8.816, 0.768, 0.157) |
D31 | (8.317, 0.844, 0.176) |
(8.701, 0.748, 0.153) |
|||
| D32 | (9.147, 0.763, 0.184) |
(8.911 0.902, 0.159) |
||||||
| D33 | (8.682, 0.557, 0.147) |
(8.813, 0.667, 0.161) |
||||||
| D4 | (3.216 0.711, 0.156) |
(3.102 0.641, 0.168) |
D41 | (3.212, 0.588, 0.134) |
(2.885, 0.524, 0.149) |
|||
| D42 | (3.188, 0.718, 0.158) |
(3.007, 0.592, 0.165) |
||||||
| D43 | (2.715, 0.844, 0.168) |
(3.111, 0.795, 0.177) |
||||||
| D44 | (3.413, 0.555, 0.145) |
(3.225, 0.644, 0.163) |
||||||
| D45 | (3.554, 0.787, 0.175) |
(3.276, 0.621, 0.181) |
||||||
| D5 | (6.842 0.479, 0.170) |
(6.936 0.617, 0.172) |
D51 | (6.634, 0.427, 0.177) |
(7.144, 0.601, 0.188) |
|||
| D52 | (7.334, 0.521, 0.154) |
(6.944, 0.666, 0.161) |
||||||
| D54 | (6.615 0.516, 0.178) |
(6.889, 0.585, 0.165) |
||||||
Disclaimer/Publisher’s Note: The statements, opinions and data contained in all publications are solely those of the individual author(s) and contributor(s) and not of MDPI and/or the editor(s). MDPI and/or the editor(s) disclaim responsibility for any injury to people or property resulting from any ideas, methods, instructions or products referred to in the content. |
© 2025 by the authors. Licensee MDPI, Basel, Switzerland. This article is an open access article distributed under the terms and conditions of the Creative Commons Attribution (CC BY) license (http://creativecommons.org/licenses/by/4.0/).
Copyright: This open access article is published under a Creative Commons CC BY 4.0 license, which permit the free download, distribution, and reuse, provided that the author and preprint are cited in any reuse.


