Submitted:
12 April 2025
Posted:
14 April 2025
You are already at the latest version
Abstract
Bone Morphogenetic Protein-2 (BMP-2) is a growth factor that maintains bone homeostasis through BMP receptor type-I (BMPRIa) and type II (BMPRII). BMP-2 promotes osteogenesis by inducing bone marrow mesenchymal stem cell (BMSC) differentiation into osteoblasts, but it can also trigger BMSC differentiation into adipocytes. BMP-2's osteo-inductive ability has made it a potential treatment for osteoporosis, yet its dual role in BMSC differentiation complicates its efficacy. The mechanisms governing BMP-2-induced adipogenesis remain unclear. High BMP-2 levels cause BMPRIa cleavage, but the downstream effects and determinants of osteogenesis or adipogenesis activation are unresolved. Here, we identify Caspase-1 as a key mediator of BMPRIa cleavage and its downstream effects on adipogenesis. We used primary BMSCs from C57BL/6 mice, stimulated with varying BMP-2 concentrations, to explore BMP-2-induced BMPRIa cleavage and its impact on PPARγ – a key regulator of adipogenesis. Western blotting and immunostaining using antibodies against BMPRIa and PPARγ uncovered BMPRIa cleavage and revealed the nuclear translocation of the cleaved segment, colocalizing with PPARγ. Caspase-1 inhibition significantly reduced BMPRIa cleavage and PPARγ expression, highlighting its pivotal role in adipogenic differentiation. Understanding the molecular mechanisms of BMP-2-induced adipogenesis and Caspase-1 inhibition could improve BMP-2 therapeutic efficacy for osteoporosis by promoting osteogenesis over adipogenesis.
Keywords:
Stem cell differentiation
; Osteoporosis
; BMP2
; BMPRIa
; Adipocytes
; Osteoblasts
; PPARγ
; Caspase-1
1. Introduction
Bone marrow mesenchymal stem cells (BMSCs) are a heterogeneous population of multipotent cells residing in the bone marrow[1,2]. These cells play a crucial role in the maintenance and repair of musculoskeletal tissues due to their ability to differentiate into multiple cell types, including osteoblasts, chondrocytes, and adipocytes. BMSCs are integral to skeletal health, influencing bone formation, remodeling, and supporting hematopoiesis[3,4,5]. Osteoblasts, which are derived from BMSCs, are responsible for synthesizing and mineralizing the bone matrix[6,7]. The differentiation of BMSCs into osteoblasts is a tightly regulated process involving various signaling pathways, with bone morphogenetic proteins (BMPs), particularly BMP-2, playing a central role[8,9].
In addition to osteoblast differentiation, BMSCs can also differentiate into adipocytes, the fat-storing cells found in marrow adipose tissue (MAT)[10]. This process of adipogenic differentiation is influenced by several factors, including the transcription factor Peroxisome Proliferator-Activated Receptor Gamma (PPARγ), which is critical in regulating adipogenesis[11,12], as well as adipokines such as Adiponectin (Adipoq), which further promote adipocyte function and differentiation. Conversely, osteogenesis is favored by increased activity of osteogenic transcription factors such as Runt-related transcription factor 2 (Runx2) and Osterix (Osx), which promote commitment toward the osteoblastic lineage[13]. The balance between osteogenesis and adipogenesis in BMSCs is primarily regulated by PPARγ activity, with increased PPARγ favoring adipocyte formation. Thus, modulating PPARγ activity is crucial in determining whether BMSCs will contribute to bone formation or fat accumulation within the bone marrow[12,14,15]. An imbalance favoring adipogenesis can negatively impact bone density and strength, leading to conditions such as osteoporosis (OP)[16,17,18,19].
Osteoporosis is a severe bone disorder that affects over 10 million Americans, with 80% of those diagnosed being women[20,21,22]. OP is characterized by decreased bone mineral density (BMD) and results from an imbalance between bone formation and resorption[23,24]. This disorder is costly, diminishes the quality of life, increases mortality, and remains incurable. It is also age-related, as there is a preferential increase in the differentiation of BMSCs into adipocytes rather than osteoblasts during aging[25,26,27].
Current treatment options, primarily focus on stimulating bone formation (anabolic therapies) or slowing down bone degradation (anti-resorptive therapies)[28,29]. Anti-resorptive agents, such as bisphosphonates (e.g., alendronate and risedronate), inhibit osteoclast-mediated bone resorption, thereby increasing bone mineral density. Another commonly used anti-resorptive treatment is denosumab, a monoclonal antibody that targets RANKL (Receptor Activator of Nuclear factor Kappa-Β Ligand), preventing osteoclast formation and function. On the anabolic side, romosozumab is a recently approved monoclonal antibody that inhibits sclerostin, a negative regulator of bone formation. Romosozumab not only promotes osteoblast activity and new bone formation but also reduces bone resorption, offering a dual mechanism of action. Despite their efficacy, these therapies are often associated with adverse effects, including osteonecrosis of the jaw (ONJ), atypical femoral fractures, osteolysis, and hematoma formation[29,30,31,32,33]. Thus, there is an urgent need for safer treatment strategies that effectively enhance bone formation while minimizing the risk of adverse side effects.
One potential therapeutic target for OP is BMP signaling, particularly BMP-2, which plays a critical role in regulating BMSC differentiation[34,35]. BMPs are members of the transforming growth factor-β (TGF-β) superfamily and regulate various cellular processes including osteogenic differentiation, chondrogenesis, cell proliferation, and apoptosis[34,36,37,38]. Specifically, BMP-2, first identified by Dr. Marshall Urist in 1965, is a crucial growth factor for BMSC differentiation. [37,39,40]. BMP-2 has gained attention for its osteo-inductive abilities, making it a candidate for osteoporosis therapy[20,41]. In 2002, the FDA approved recombinant human BMP-2 (rhBMP2) for specific surgical procedures, such as anterior lumbar interbody fusion (ALIF) in OP patients, cranioplasties, and bone regeneration after maxillofacial injuries[42,43]. BMP-2 exerts its effects by binding to specific receptors on the cell surface, including Bone Morphogenetic Protein Receptor Type IA (BMPRIa)[44,45,46]. Upon BMP-2 binding, BMPRIa undergoes phosphorylation and forms complexes with other receptors, activating downstream signaling pathways that regulate gene expression and cellular differentiation[47,48]. This highlights the importance of BMP receptors in the BMP-2 signaling process[49,50,51].
BMP receptors are primarily localized on the plasma membrane of cells and can signal through both canonical Smad-dependent and Smad-independent pathways[52]. In the Smad-independent pathway, BMPRIa activates mitogen-activated protein kinase (MAPK) and phosphatidylinositol 3-kinase (PI3K) pathways, promoting cellular survival and proliferation[53,54,55]. In Smad-dependent signaling, BMP-2 binds to BMPRIa, which is typically localized in caveolae enriched with caveolin-1 alpha isoforms or within clathrin-coated pits (CCPs)[52,56]. BMPRII is then recruited to the membrane or is already localized to the membrane domains with BMPRIa as pre-formed complexes[57]. This dynamic shuttling of receptors between different caveolar isoforms within the plasma membrane is crucial for enhancing Smad signaling, emphasizing the importance of receptor localization in the signaling process[58,59,60]. BMPRII then phosphorylates BMPRIa, releasing protein kinase CK2, which then phosphorylates downstream proteins, including SMAD1, 5, and 8 [6,61]. The phosphorylated SMADs recruit SMAD4, forming a complex that translocates to the nucleus to act as transcription factors that activates target genes[62,63,64].
Despite the initial promise of BMP-2 as a therapeutic agent for osteoporosis, subsequent studies have raised concerns about its safety and efficacy[65,66]. Complications associated with rhBMP2 therapy include increased bone resorption, nerve injuries, and altered bone quality resulting from increased adipocyte formation and decreased trabecular spacing[65,67,68]. These issues prompted the FDA to issue a black box warning in 2008, emphasizing the need for caution with rhBMP2 administration[68].
To address these complexities, aging mouse models devoid of confounding variables may offer clearer insights into BMP2′s therapeutic potential in osteoporosis. This study aims to unravel the pathophysiology of BMP2-induced differentiation of BMSCs into adipocytes which poses a challenge to the efficacy of BMP2 and optimize therapeutic strategies for conditions like osteoporosis. Previous studies using immortalized murine myoblast cell line (C2C12) have shown that high BMP2 concentrations lead to the proteolytic cleavage of BMPRIa[63,69], possibly mediated by Caspase-1. Caspase-1 is a key component of the inflammasome, mediating the maturation and secretion of pro-inflammatory cytokines such as interleukin-1β (IL-1β) and interleukin-18 (IL-18), which are essential in various physiological and pathological processes[70,71]. Caspase-1′s role in BMP2-mediated processes like bone formation and adipocyte differentiation suggests its involvement in modulating the balance between osteogenesis and adipogenesis[71,72]. Furthermore, it has also been shown that at a high BMP2 concentration (specifically 200 nM), C2C12 cells differentiate into adipocytes, while at 40 nM BMP2, they form more osteoblasts[69].
One question that remains unclear is what protease mediates BMPRIa cleavage and how this event influences the decision between osteogenic and adipogenic differentiation. Although the downstream effects of this proteolytic cleavage and the involvement of Caspase-1, along with the effects of these BMP2 concentrations on PPARγ which is the key regulator of BMSC differentiation into adipocytes have not confirmed, this study seeks to elucidate these aspects further. This study aims to elucidate the roles of BMPRIa and PPARγ in regulating the osteogenesis-adipogenesis balance in BMSCs, with a particular focus on identifying the protease responsible for BMPRIa cleavage and the downstream effects of this cleavage.
Understanding the mechanisms by which BMP2 induces BMSC differentiation into adipocytes is crucial for developing therapies to prevent or treat osteoporosis, where excessive bone marrow adipogenesis contributes to bone weakening. This study aims to elucidate the roles of BMPRIa, PPARγ, and other molecular players in regulating the balance between osteogenesis and adipogenesis in BMSCs.
2. Materials and Methods
2.1. Immortalized Murine Myoblast Cell Line (C2C12)
C2C12 cells were acquired from The American Type Culture Collection (ATCC; Manassas, VA, USA). This cell line originates from murine myoblast progenitors and have undergone immortalization. While C2C12 cells primarily differentiate into myocytes under basal conditions, they can be directed towards osteoblastogenesis in the presence of BMP2, making them a valuable model for investigating osteoblast differentiation and bone matrix production.
2.2. C2C12 BMPRIa Knockout Cell Line
A C2C12 BMPRIa knockout cell line was generated using ribonucleoprotein (RNP, spCas9 + gRNA) delivery via 4D nucleofection by the ChristianaCare Gene Editing Institute in Newark, DE, USA. This process resulted in the creation of a bulk population of C2C12 cells harboring targeted mutations in exon 2 of the BMPRIa gene. Specifically, two clones (clones 4 and 6) were derived from this population using the same gRNAs (gRNA 3: CACUGGUAUGAAAUCAGACU and gRNA 5: UGUUAUUAAUAGCAUCAUCU). A 94-base pair deletion spanning the cut sites was induced, resulting in a frameshift mutation and premature stop codon. Analysis conducted 48 hours post-transfection confirmed the presence of the frameshift mutation across the entire cell population through Sanger sequencing. The cell population was subsequently single-cell sorted into 96-well plates using the Namocell instrument (Namocell, Mountain View, CA, USA). Upon confluency in the 96-well plates, each clone was expanded, and Sanger sequencing was performed to identify clones with frameshift knockouts (KO). Clones exhibiting the desired frameshift KO were further expanded and frozen. Confirmation of the knockout was obtained through additional Sanger sequencing and the use of Deconvolution of Complex DNA Repair (DECODR) by Dr. Byung-Chun Yoo and London McGill of the Gene Editing Institute.
2.3. Mice Subjects
Following approval from the University of Delaware Institutional Animal Care and Use Committee (IACUC, AUP #1194), female C57BL/6 (B6) mice were sourced from Charles River Laboratories (Horsham, PA, USA) via the National Institute of Aging (NIA). The mice were aged 6-months upon arrival. Subsequently, they were housed five mice per cage in the Life Science Research Facility at the University of Delaware (Newark, DE, USA) for one week to acclimate.
2.4. Euthanasia and Isolation of Bone Marrow Stem Cells from B6 Mice
The mice were euthanized using CO2 followed by cervical dislocation. To isolate the BMSCs, the femurs were initially dissected at the distal and proximal femoral heads. Subsequently, the bones were flushed with alpha minimum essential media (αMEM; Caisson Labs, Smithfield, UT, USA) and filtered using a 70 μm cell strainer (Stellar Scientific, Baltimore, MD, USA) into 50 mL conical tubes (Cole-Palmer, Vernon Hills, IL, USA). The cells were then centrifuged at 1,500 rotations per minute (RPM) for 5 minutes at 4 °C and resuspended in 5 mL of αMEM. A representative diagram of the cell isolation process is displayed in Figure 1.4.
2.5. C2C12 Cell Culture
C2C12 cells, both the wildtype and BMPRIa knockout (KO) cells, were cultured to approximately 70-80% confluency in T75 flasks using Dulbecco’s Modified Eagle’s Medium (DMEM; HyClone, Pittsburgh, PA, USA) supplemented with 10% Fetal Bovine Serum (FBS; Gemini Bioproducts, West Sacramento, CA, USA), 1% antibiotic/antimycotic (anti/anti; Gemini Bioproducts, West Sacramento, CA, USA), and 1% penicillin/streptomycin (pen/strep; Fisher Scientific, Pittsburg, PA, USA). Upon reaching confluency, cells were then seeded into either 12- or 24-well plate (Nest Scientific, Woodbridge Township, NJ, USA) at a density of 1x10⁶ cells/mL for 12-well plates or 1x10⁵ cells/mL for 24-well plates.
2.6. Primary Cell Culture
After isolating BMSCs from the femurs of B6 mice, the cells were cultured in 12 plates at a density of 1x10⁶ cells/mL in αMEM supplemented with 10% FBS, 1% penicillin/streptomycin (pen/strep), and 1% antibiotic/antimycotic solution for one week. For the immunostaining experiments, cells were plated at 1x10⁶ cells/mL in 12-well plates on 18 mm diameter cover slips (Catalog #CS-R18-100, Amscope, Irvine, CA, USA) and grown for a total of 10-14 days before staining. Similarly, for western blot analysis, BMSCs were seeded in 12-well plates at a density of 1x10⁶ cells/mL and cultured in αMEM containing 10% FBS, 1% pen/strep, and 1% antibiotic/antimycotic for 10-14 days before lysate collection.
2.7. Immunostaining of primary cells
BMSCs were isolated from 10 6-month-old B6 mice. The cells were plated at a density of 1x10^6 cells/mL and allowed to attach for two days. Subsequently, media changes were performed on day 3 and day 6 of culture. On day 6, the cells were treated with or without 12 μM of Caspase-1 inhibitor I (Ac-YVAD-CHO; Catalog# sc-358878A, Santa Cruz Biotechnology, Inc., Dallas, Texas, USA) for 24 hours. Ac-YVAD-CHO was dissolved in sterile water; therefore, a vehicle-only control was not required. Following this treatment, the cells were stimulated with either 40 nM BMP2, 200 nM BMP2, or left unstimulated (control group) for an additional 24 hours. BMP2 was reconstituted in sterile water; thus, no vehicle control was necessary for BMP2 treatments. The media in the well-plates was then aspirated, and cells were washed with ice-cold 1X PBS. Subsequently, the cells were fixed with 4.4% paraformaldehyde (PFA; pH 7.2; Sigma Aldrich, St. Louis, MO, USA) for 15 minutes at room temperature. After fixation, the cells were washed three times with ice-cold 1X PBS and permeabilized for 10 minutes with 0.1% Saponin (Sigma Aldrich, St. Louis, MO, USA) dissolved in sterile water. Following permeabilization, cells were blocked with 3% bovine serum albumin (BSA; Fisher Scientific, Pittsburgh, PA, USA) containing 0.1% Saponin in 1X PBS for one hour on ice. Subsequently, all cells except for the secondary control were incubated with primary mouse monoclonal BMPRIa antibody (Catalog # sc-293175; Santa Cruz Biotechnology, Inc., Dallas, Texas, USA) and rabbit polyclonal PPARγ antibody (Catalog # 16643-1-AP; Proteintech Group, Inc., Rosemont, Illinois, USA) at a 1:100 dilution in 1X PBS containing 0.1% Saponin and 3% BSA for one hour on ice. Following primary antibody incubation, cells were washed three times with 1X PBS and incubated with secondary antibodies (donkey-anti-mouse Alexa Fluor™594 and chicken-anti-rabbit Alexa Fluor™488, both from Invitrogen, Eugene, OR, USA) at a 1:500 dilution in 1X PBS containing 0.1% Saponin and 3% BSA. After additional washing with 1X PBS, cells were treated with Hoechst 33342 (Catalog #AR0039, Bolster Bio, Pleasanton, CA, USA) for 7.5 minutes. Finally, coverslips were mounted onto glass slides using Airvol and allowed to dry before imaging with the Zeiss LSM880 confocal microscope with Airy scan (Wolf Hall, University of Delaware, Newark, DE, USA) using a 63x objective. This experiment was performed in triplicate, acquiring 10 images for each experimental condition, and all data were normalized to the secondary control.
2.8. Immunofluorescence Quantification
For semi-quantitative analysis of immunostaining fluorescence, ImageJ (Bethesda, MD, USA) was employed. Background measurements from the micrographs were initially obtained and subtracted from the fluorescent intensity values. The resulting corrected intensities were then averaged for each experimental group. Subsequently, the data were normalized to the secondary control of the respective experiments to account for any variations in staining or imaging conditions.
2.9. Lysate Collection for Western Blotting
Cells were cultured to confluency in T25 flasks at a density of 2.5 x 10^6 cells. The cells were then treated with or without 12 μM of Caspase-1 inhibitor I (Ac-YVAD-CHO; Catalog# sc-358878A, Santa Cruz Biotechnology, Inc., Dallas, Texas, USA) for 24 hours. Following this treatment, the cells were stimulated with either 40 nM BMP2, 200 nM BMP2, or left unstimulated (control group) for an additional 24 hours. After stimulation, the media was removed, and the cells were washed three times with 1X PBS. Subsequently, the cells were lysed for 10 minutes with RIPA lysis buffer (0.44 g NaCl, 500 μL Triton X-100, 0.05 g sodium deoxycholate, 12.5 mL Tris 0.5M, 0.05 g SDS, 37 mL sterile water) supplemented with Halt™ Protease Inhibitor Cocktail (100X; Catalog #78425; Thermo Fisher Scientific Inc., Waltham, MA, USA). The lysates were sonicated at 40% amplitude using a digital sonifier (Digital Sonifier Model 250; BRANSON Ultrasonics Corporation, Danbury, Connecticut, USA). The lysates were then centrifuged at 12,700 RPM for 10 minutes using an Eppendorf Refrigerated Centrifuge (Eppendorf 5702R; Marshall Scientific Inc., Hampton, New Hampshire, USA).
2.10. Western Blotting
Protein concentrations of the lysates were determined by BCA assay and normalized prior to boiling for 10 minutes at 95 °C. Equal volumes (20 µL) corresponding to equal amounts of protein were then loaded into a 10% SDS-PAGE gel. Gel electrophoresis was carried out at 120 V for 1 hr and 30 min and the proteins were transferred to a PVDF (Immobilon, Darmstadt, Germany) membrane for 1 hr and 10 min at 15 V using the semi-dry transfer machine (BioRad, Hercules, CA, USA). The membrane was blocked with 5% BSA diluted in 1X Tris-Buffered Saline-Tween (TBST) for 1-hour on ice. The blot was incubated overnight at 40C with a 1:1000 dilution of BMPRIa primary antibody (same as above). On the following day, the blot was washed three times with 1X TBST and incubated with a 1:5000 dilution of secondary antibody (same as the above) for 1 hr at room temperature. The blots were washed three more times with 1X TBST and treated with SuperSignalTM West Pico Plus Chemiluminescent Substrate (Thermo Scientific, Rockford, IL, USA) for five-minutes. All protein bands were detected with the Invitrogen iBright1500 machine (Thermo Fisher Scientific, Waltham, MA, USA).
2.11. Oil Red O Staining Protocol
Six-month-old BMSCs were grown to 90% confluence in 24-well plates and serum-starved overnight before treatment. Caspase-1 inhibitor I (Ac-YVAD-CHO) was used to inhibit Caspase-1 activity in the designated groups prior to BMP2 stimulation. The following day, cells were washed with cold PBS (pH 7.4), fixed using 4% (w/v) paraformaldehyde for 10 minutes, and washed again with cold PBS (pH 7.4) to remove excess fixative. Oil Red O stain was prepared by creating a stock solution consisting of 0.35 g of Oil Red O powder dissolved in 100 ml isopropanol. On the day of staining, 6 ml of the stock solution was mixed with 4 ml dH2O to make the working solution, which was set aside for 20 minutes and then filtered through a 0.22 µm filter. The working solution was applied to each well for 15 minutes, followed by a 1-minute wash with dH2O to avoid washing off lipid droplets. Plates were allowed to dry. The area covered by lipid droplets (identified by the red/dark stain) was analyzed by taking random high magnification images of each well using a light microscope. Data was quantified using ImageJ software, where images were converted to 8-bit, and the threshold was set to the positive control. The same threshold was used for all treatments in an individual experiment.
2.12. Statistical Analysis
All data were subjected to single-factor analysis of variance (ANOVA). Subsequently, Tukey-Kramer HSD, student’s t-test, and/or Fisher’s exact statistical tests were applied where appropriate. Error bars on bar graphs represent the standard deviation (SD). Statistical significance was defined as p < 0.05, denoted by an asterisk (*) indicating significant differences between groups. Experiments were repeated three or more times, and all data were normalized to the respective control within each experiment.
3. Results
3.1. Confirmation of Antibody Specificity and BMP2-Induced BMPRIa Cleavage in C2C12 Cells
To investigate the BMP2-induced cleavage of the BMPRIa receptor, we conducted SDS-PAGE and western blotting analysis using an anti-BMPRIa antibody. The specificity of the antibody was first confirmed using BMPRIa knockout and wildtype C2C12 cells. As shown in Figure 1A, while a BMPRIa band was detected in the wildtype cells at 55 kDa, no band was observed in the BMPRIa knockout cells. This result validates the specificity of the antibody being used in this analysis for the BMPRIa protein.
We then proceeded with wildtype C2C12 cells, stimulating them with 0, 40, and 200 nM BMP2 to ascertain the BMP2-induced cleavage of BMPRIa. The BMP2 concentrations were chosen based on previous studies demonstrating that low BMP2 concentrations (40 nM) support osteogenesis, while higher concentrations (200 nM) have been linked to alternative signaling outcomes, including adipogenesis. In line with the discoveries by Bragdon et al. [2010], an extra band indicative of cleavage was spotted along with the BMPRIa molecular weight band at 55 kDa in the 200 nM BMP2-stimulated group. The molecular weight of this extra band is approximately between 30 to 35 kDa, which interestingly corresponds to the molecular weight of the Caspase-1 cleavage fragment previously obtained via the prediction tool. Conversely, no extra bands were spotted in the unstimulated control group and the 40 nM BMP2-stimulated group. Only the BMPRIa band at 55 kDa was present in both groups (Figure 1B).
β-actin was used as a loading control to validate protein quantification. This result shows that the BMPRIa receptor protein is indeed cleaved at high BMP2 (200 nM) concentration. This observation led to further analysis in primary BMSCs isolated from B6 mice, as the primary cells more closely mimic the human system.
3.2. BMP2 Stimulation at 200 nM Leads to an Increase in PPARγ Expression in Primary BMSCs
To investigate the effects of BMP2 stimulation on PPARγ expression in BMSCs, primary BMSCs were isolated from the femurs of 6-month-old C57BL/6 mice, cultured, and stained with antibodies specific for the PPARγ protein. We show that high BMP2 concentration at 200 nM leads to an increase in the number of cells expressing PPARγ. Using confocal microscopy, we obtained high-resolution images of the cells and counted individual nuclei expressing PPARγ. The percentage of mononucleated cells expressing PPARγ (PPARγ-positive cells) which are likely preadipocytes as PPARγ is the positive maker for adipocyte differentiation, as well as those not expressing PPARγ (PPARγ-negative cells), were analyzed across experimental groups. Random images were acquired using the confocal microscope, and an average of 140 cells per treatment group were analyzed in three different experiments, with a total of 420 cells analyzed.
As shown in Figure 2A, approximately 82% of the cells stained positive for PPARγ in the 200 nM BMP2 stimulated group. In contrast, in both the control (0 nM BMP2) and the 40 nM BMP2 stimulated groups, less than 25% of the cells stained positive for PPARγ. Conversely, the percentage of cells that were negative for PPARγ was higher in the 40 nM BMP2 stimulated group, with about 81% of the cells not expressing PPARγ, compared to the control and the 200 nM BMP2 groups as shown in Figure 2B. Furthermore, PPARγ expression was observed to be more nuclear in the 200 nM BMP2 stimulated group as shown in Figure 2C and D when compared to a more cytoplasmic expression observed in the 0 and 40 nM BMP2 treatment groups. This nuclear expression indicates activations as PPARγ is a transcription factor that activates target genes in the nucleus leading to adipocyte formation.
These findings indicate that high BMP2 concentration (200 nM) significantly increased the expression and activity of PPARγ in primary BMSCs, suggesting a shift towards adipogenesis. Lower concentrations of BMP2 (40 nM) do not have the same effect, maintaining a higher proportion of PPARγ-negative cells, likely osteoblasts. This consolidates the findings by Moseychuk et al., 2013 that 200 nM BMP2 upregulates adipogenesis. This differential response to BMP2 concentration highlights the complex role BMP2 plays in the differentiation pathways of BMSCs.
3.3. BMP2 Stimulation at 200 nM Concentration Leads to the Nuclear Accumulation of BMPRIa in BMSCs
As stated previously, BMP2 exerts its effects through the BMPRIa receptor which is typically localized on the membrane and cytoplasm of cells. Previous research by Bragdon et al. found that BMP2 stimulation leads to the cleavage of the BMPRIa receptor in the C2C12 cells. Here, we investigated the effects of BMP2 stimulation on BMPRIa and its localization in primary BMSCs. We isolated BMSCs from C57BL/6 mice and treated them with BMP-2 at concentrations of 0 nM, 40 nM, and 200 nM. The cells were stained with antibodies specific for BMPRIa and PPARγ. High-resolution images of the cells were obtained for analysis using a confocal microscope.
Immunofluorescence analysis and quantification of the cells revealed distinct differences in BMPRIa localization depending on the concentration of BMP2. At 0 nM BMP2 (control), BMPRIa was predominantly localized at the membrane/ cytoplasmic region of the cells (Figure 3A, B). Similarly, cells treated with 40 nM BMP-2 also showed BMPRIa expression at the membrane/ cytoplasmic region. In contrast, treatment with 200 nM BMP2 resulted in a significant redistribution of BMPRIa, with a noticeable accumulation in the nuclear region of the cells (Figure 3A, B). Furthermore, in the 200 nM BMP2 stimulated group, a nuclear co-localization of BMPRIa and PPARγ was observed with about 56% co-localization as shown in Figure 3C while in the control and 40 nM BMP2 groups, the two proteins only co-localize in the cytoplasm with no nuclear colocalization observed (Figure 3D).
This data demonstrates that BMP2 concentration influences the localization of BMPRIa in primary BMSCs. At lower concentrations (0 and 40 nM), BMPRIa remains primarily at the cell membrane and cytoplasmic region. However, at a higher concentration (200 nM), BMPRIa accumulates in the nuclear region, suggesting a potential cleavage of the receptor and a role for nuclear translocation in BMP2-induced signaling pathways.
3.4. Identification of Caspase-1 as a BMPRIa Protease
To further investigate the potential cleavage of BMPRIa and verify the identification of Caspase-1 as a BMPRIa protease, we performed a peptide cutter search utilizing the NCBI ExPASy PeptideCutter tool. The results indicated that Caspase-1 and Proline endopeptidase are likely to cleave the BMPRIa receptor at the C-terminus. While Caspase-1 only cleaves the receptor into two fragments, Proline endopeptidase is likely to cleave it into three fragments[73].
However, previous studies by Fulop et al. (1998) reported that Proline endopeptidase cleaves only substrates with sequences not exceeding 30 amino acids, as an unusual beta-propeller domain regulates its proteolysis. Given that BMPRIa has a 532 amino acid sequence (Figure 4A), it is unlikely to be cleaved by Proline endopeptidase. Furthermore, the results from our western blot analysis reported above, indicates that the receptor is cleaved into two fragments. This leaves Caspase-1 as the possible protease responsible for the cleavage of the receptor. Interestingly, Caspase-1 cleaves the BMPRIa at the 310 amino acid position (Figure 4B), which corresponds to the C-terminus region of the protein. This finding aligns with our previous observation in C2C12 cells with the molecular weight of the Caspase-1 cleavage corresponds to the molecular weight of the fragment we obtained via western blotting. This suggests that Caspase-1 is involved in BMPRIa cleavage, leading to the observed nuclear translocation of the protein.
The identification of Caspase-1 as a BMPRIa protease provides a mechanistic insight into the cleavage and nuclear localization of BMPRIa fragments, leading to further experimental validation that contributes to our understanding of BMP2 signaling in BMSCs.
3.5. BMP2 induces BMPRIa Cleavage, and Inhibition of Caspase-1 Abolished the Cleavage in Primary BMSCs
To ascertain the cleavage of BMPRIa in primary cells, and the involvement of Caspase-1, we isolated BMSCs from the femurs of 6-month-old C57BL/6 mice. The cells were divided into two major groups: Caspase-1 inhibited and non-inhibited groups. Each group was subsequently split into 0, 40, and 200 nM BMP2 treatment groups as in previous experiments. The Caspase-1 inhibitor was used to inhibit the activity of Caspase-1 prior to BMP2 stimulation in the Caspase-1 inhibited group.
The cell lysates were collected and subjected to SDS-PAGE and western blotting analysis. Interestingly, the results revealed an additional BMPRIa fragment band with a molecular weight of about 35 kDa in the Caspase-1 uninhibited group, indicating cleavage (Figure 5). However, in the caspase-1 inhibited group, while the normal BMPRIa band was spotted at 55KDa, the cleavage bands were not observed and had a diminished intensity. These results show that Caspase-1 is indeed involved in the cleavage of the BMPRIa receptor with the inhibition of Caspase-1 abolishing the previously observed cleavage. Next, we tested the effects of Caspase-1 inhibition on BMPRIa localization to see if the previously observed nuclear translocation in the Caspase1 uninhibited group will be present in the inhibited group.
3.6. Caspase-1 Inhibition Prevents the Nuclear Accumulation of BMPRIa in 6-Months-Old Primary BMSCs
Following the identification of Caspase-1 as the potential cleavage protein responsible for BMPRIa nuclear accumulation, we proceeded to test the effects of Caspase-1 inhibition and ascertain Caspase-1 involvement using a Caspase-1 inhibitor. Prior to BMP2 stimulation, the cells were treated with 12 μM of Caspase-1 inhibitor I (Ac-YVAD-CHO) for 24 hours and then stimulated with BMP2 at 0 nM, 40 nM, and 200 nM as in previous experiments. Confocal microscopy was employed to obtain high-resolution images of the cells, which were subsequently analyzed using ImageJ software. The results revealed that inhibition of Caspase-1 prevented the nuclear accumulation of BMPRIa that was observed in the previous experiments without Caspase-1 inhibition. Here, in the presence of the Caspase-1 inhibitor, BMPRIa remained localized at the membrane and cytoplasmic region across all BMP2 treatment groups (Figure 6A, and B).
These findings suggest that Caspase-1 is indeed involved in the cleavage of BMPRIa, leading to its nuclear translocation. The prevention of nuclear accumulation by Caspase-1 inhibition further implicates it in the regulation of BMP2 signaling pathways in primary BMSCs. This highlights the potential of targeting Caspase-1 to modulate BMPRIa localization and, consequently, the differentiation processes of BMSCs. Further, we investigated the effects of Caspase-1 inhibition on PPARγ expression.
3.7. Caspase-1 Inhibition Leads to a Reduction in PPARγ Expression in BMSC
Following the previous observation that higher concentrations of BMP2 (200 nM) led to an increase in the number of cells expressing PPARγ and the identification of Caspase-1 involvement in BMP2 signaling in BMSC, we investigated the effects of Caspase-1 inhibition on PPARγ expression in these cells. The cells were pre-treated with 12 μM of Caspase-1 inhibitor I (Ac-YVAD-CHO) for 24 hours before BMP2 stimulation as in previous experiments. An average of 140 cells per treatment group were analyzed in three different experiments (n=3), with a total of 420 cells analyzed.
The results revealed that approximately 36% of the cells in the 200 nM BMP2-stimulated group stained positive for PPARγ, while about 64% were negative, as shown in Figure 7A and B. Furthermore, as shown in Figure 7C and D, Caspase-1 inhibition led to a significant reduction in the number of cells expressing PPARγ and an increase in the number of PPARγ-negative cells when compared to the uninhibited group. Here, the percentage of PPARγ-positive cells decreased significantly especially in the 200 nM BMP2 treatment group, which in the absence of Caspase-1 inhibition showed the highest PPARγ expression, there was a marked reduction of approximately 56% in PPARγ-positive cells upon Caspase-1 inhibition (Figure 7C). The reduction in PPARγ expression in the Caspase-1 inhibited group compared to the uninhibited group suggests that Caspase-1 activity is crucial for BMP2-induced PPARγ expression in BMSCs. The inhibition of Caspase-1 likely disrupts the signaling cascade initiated by BMP2, preventing the cleavage and subsequent nuclear translocation of BMPRIa, which appears necessary for the upregulation of PPARγ. Consequently, the differentiation of BMSCs into adipocytes, which is dependent on PPARγ expression, is also reduced. Additionally, PPARγ exhibited more cytoplasmic expression in the Caspase-1 inhibited group compared to nuclear expression in the uninhibited group, as shown in Figure 7E and F.
These findings indicate that Caspase-1 plays a pivotal role in BMP2-induced PPARγ expression in primary BMSCs, and inhibiting Caspase-1 disrupts this pathway, leading to a decrease in PPARγ-positive cells and potentially affecting adipocyte differentiation.
3.8. High BMP2 Concentration Induces Adipogenesis and Caspase-1 Inhibition Leads to the Reduction
To ascertain the overall effects of BMP2 stimulation together with Caspase-1 inhibition on adipogenic differentiation of BMSC, we conducted the Oil Red O staining experiment. Oil Red O stains mature lipid droplets in cells, indicative of adipogenesis. Primary BMSCs were isolated and treated as described in the Materials and Methods section. Cells treated with high concentrations of BMP2 exhibited a marked increase in adipogenesis, evidenced by the upregulation of mature lipid droplets stained with Oil Red O. Quantitative analysis revealed a significant increase of over ~60% in the area covered by lipid droplets in the 200 nM BMP2-treated group compared to the control and 40 nM BMP2 groups, confirming BMP2′s role in inducing adipogenesis at high concentrations.
In contrast, in the Caspase-1 inhibited group, there was a notable reduction in adipogenesis. Specifically, the area covered by lipid droplets in the 200 nM BMP2 group decreased from about 65% to 13%, indicating a significant decrease in the formation of lipid droplets compared to the uninhibited group. These findings are in line with the modulation of PPARγ observed in the immunostaining experiment and indicates that Caspase-1 activity is crucial for BMP2-induced adipogenesis, as its inhibition significantly impairs the adipogenic differentiation process. The results are graphically represented in Figure 8, demonstrating the differences in adipogenesis between the BMP2-treated and Caspase-1 inhibited groups.
4. Discussion
As the global population continues to age, the prevalence of bone disorders like osteoporosis is on the rise[74,75,76], creating an urgent need for effective therapeutic options. The imbalance in bone formation and resorption that characterizes these conditions is exacerbated by the natural decline in bone marrow mesenchymal stem cell (BMSC) function[77,78]. Bone Morphogenetic Protein 2 (BMP2) has emerged as a promising candidate for addressing these challenges due to its ability to influence osteogenic differentiation[6]. While BMP2 has the potential to promote bone formation, its effect is highly concentration-dependent. High BMP2 (200 nM) induces adipogenesis, whereas a lower concentration (40 nM) supports osteogenesis—a duality that complicates its application as a targeted therapy [69]. It was also shown that high BMP2 induces the cleavage of the BMPRIa receptor, but the downstream effects of this cleavage remained unclear.
To further ascertain the cleavage of BMPRIa receptor, we performed SDS-PAGE and western blot analysis using C2C12 cells and primary BMSC. The absence of a BMPRIa band in the BMPRIa knockout C2C12 cells (Figure 1A) while the band was present in the wild type validates the specificity of the antibody used in this analysis for BMPRIa. Additionally, the presence of an additional BMPRIa band in the 200 nM BMP2 stimulated group (Figure 1B) confirms the cleavage of the receptor, validating the findings from Bragdon et al., 2010. However, the absence of a cleavage band in the 40 nM group suggests that the cleavage may not be necessary for osteogenesis but may play a role in adipogenesis at high BMP2 concentration.
Using these same concentrations (40 nM, and 200 nM) we examined the effects of BMP2 on PPARγ the transcription factor that regulates adipocyte differentiation in primary BMSCs. Data from immunofluorescence staining showed that high concentrations of BMP2 (200 nM) significantly increased the number of cells expressing PPARγ (Figure 2). This increased number of PPARγ positive cells in the 200 nM stimulated group compared to the unstimulated control and the 40 nM group suggests that higher BMP2 concentration promotes adipogenic differentiation as PPARγ is a positive marker for adipocytes. Conversely, the higher number of mononucleated PPARγ-negative cells, which are likely preosteoblasts in the 40 nM BMP2 stimulated group, is indicative of osteogenic differentiation, which is supported by the findings of Moseychuk et al., 2013.
Furthermore, we investigated the effects of BMP2 at 40 nM, and 200 nM on BMPRIa and its localization in primary BMSCs as receptor localization is a crucial part of the BMP2 signaling. We showed that at 200 nM BMP2, there is a nuclear accumulation of BMPRIa (Figure 3). BMPRIa is predominantly localized in the membrane and cytoplasmic region of the cell, a nuclear accumulation indicates a possible cleavage of the BMPRIa receptor and corroborates the previous findings that BMP2 stimulation induces BMPRIa cleavage. This suggests that the cleavage of the BMPRIa receptor might be a crucial step in channeling the differentiation of mesenchymal stem cells into the adipogenic lineage. We had previously observed the nuclear accumulation of BMPRIa at 200 nM in C2C12 cells, although it was undocumented at the time, here our data shows the same in primary BMSCs suggesting a role for nuclear translocation of BMPRIa in the activation of adipogenesis.
The involvement of Caspase-1 in BMPRIa cleavage provides mechanistic insight into how BMP2 signaling might be regulated through proteolytic processing. Caspase-1, known for its role in inflammation and apoptosis, may also influence osteogenic and adipogenic differentiation by modulating BMP2 signaling pathways. The cleavage of BMPRIa by Caspase-1 could lead to the generation of receptor fragments that translocate to the nucleus, potentially affecting the transcription of target genes involved in adipogenesis. These findings highlight the critical role of Caspase-1-mediated BMPRIa cleavage in BMP2 signaling in BMSCs.
Further western blot analysis in primary BMSCs reveals the cleavage of BMPRIa in these cells. However, the cleavage band was present in both 40 and 200 nM BMP2 stimulations. This could be due to some adipocytes already differentiated within the BMSC population prior to isolation from the bone marrow. These pre-differentiated adipocytes might be present in the 40 nM BMP2 stimulated group, forming a baseline that exhibits some adipogenic features, including signs of the receptor cleavage. The disappearance of the cleavage bands upon Caspase-1 inhibition further validates Caspase-1 as the cleavage protein (Figure 5).
Investigation into the effects of Caspase-1 inhibition on PPARγ expression revealed critical insights into the regulation of adipogenesis in BMSCs. The results (Figure 7) demonstrated that Caspase-1 plays a pivotal role in the BMP2-induced cleavage of BMPRIa, which in turn influences PPARγ expression. The prevention of BMPRIa cleavage and nuclear translocation due to Caspase-1 inhibition (Figure 6) corresponded with a decrease in PPARγ expression (Figure 7). This result suggests that the nuclear fragment of BMPRIa might directly or indirectly regulate PPARγ expression.
In the absence of Caspase-1 activity, BMPRIa remains uncleaved and predominantly localized at the cell membrane and cytoplasmic region (Figure 6). This finding aligns with the observation that nuclear accumulation of BMPRIa is significantly reduced when Caspase-1 is inhibited. Consequently, the downstream signaling pathways that are typically activated by the nuclear fragments of BMPRIa are likely impaired, affecting the expression of PPARγ and thus adipogenic differentiation (Figure 8).
Furthermore, the inability of BMPRIa to translocate to the nucleus in the presence of Caspase-1 inhibition suggests that the cleavage fragment generated by Caspase-1 may play a direct role in regulating gene transcription within the nucleus. This provides a novel insight into how BMP2 signaling might be modulated through proteolytic processing and highlights the potential for targeting Caspase-1 to modulate BMP2 signaling outcomes.
Understanding the molecular mechanisms underlying BMPRIa cleavage and its regulation by Caspase-1 could inform the development of novel therapeutic strategies aimed at enhancing BMP2 signaling in osteoporotic patients. By specifically targeting the proteolytic processing pathways, it may be possible to restore the osteogenic potential of BMSCs and mitigate the progression of age-related osteoporosis. However, while Caspase-1 has been identified as the primary BMPRIa protease, other proteases may also contribute to this cleavage. Further studies are needed to confirm whether additional factors modulate this process
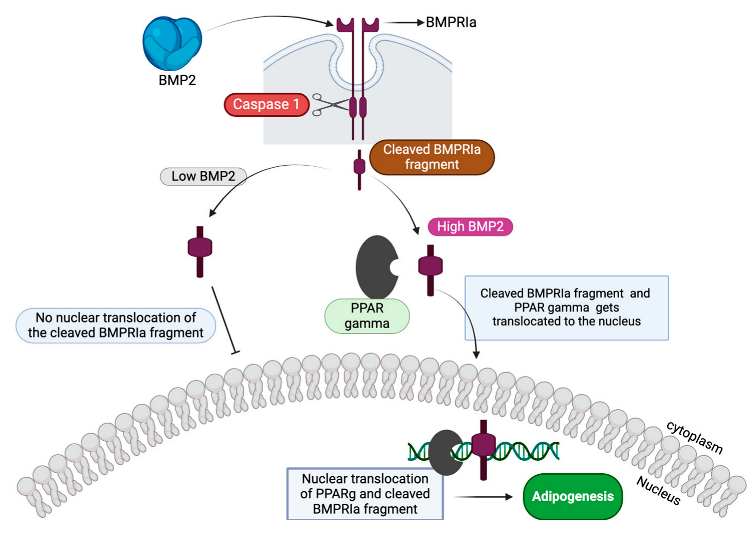
In summary, high concentrations of BMP2 (200 nM) induce the cleavage of BMPRIa, followed by its translocation to the nucleus. BMPRIa interacts and co-localizes with PPARγ in the nucleus, promoting the expression of PPARγ. This nuclear interaction drives the differentiation of BMSCs into adipocytes, as evidenced by the significant increase in PPARγ-positive cells (Figure 7) and the upregulation of adipogenesis (Figure 8). At lower BMP2 concentrations (40 nM), BMPRIa is cleaved but does not translocate to the nucleus as illustrated in the figure below. Without nuclear translocation, PPARγ expression is not upregulated, suggesting a shift towards osteogenic rather than adipogenic differentiation.
- Limitations and Future Directions.
While this study provides valuable insights into BMP2-induced signaling in BMSCs, several limitations must be acknowledged. The use of primary BMSCs from mice may not fully recapitulate the human disease context, and thus, further validation in human cells and clinical samples is warranted. Additionally, the specific molecular mechanisms by which BMPRIa nuclear fragments regulate gene transcription remain to be elucidated, necessitating further investigation into the potential transcriptional targets and binding partners of these fragments especially in human cells.
Future research should explore the therapeutic potential of modulating Caspase-1 activity in the context of osteoporosis treatment. Given that Caspase-1 inhibition prevented BMPRIa cleavage and nuclear translocation, targeting Caspase-1 could potentially enhance osteogenic differentiation while reducing adipogenesis in the bone marrow. This approach might offer a novel strategy for treating age-related osteoporosis by restoring the balance between osteoblast and adipocyte differentiation in the bone marrow niche.
In conclusion, this study highlights the complex interplay between BMP2 signaling, BMPRIa processing, and cellular differentiation in BMSCs, emphasizing the role of Caspase-1 in modulating these processes. The findings provide a foundation for future research aimed at developing novel therapeutic strategies for osteoporosis and other age-related bone disorders.
Author Contributions
Conceptualization, K.C. and A.N.; methodology, K.C.; software, K.C. and A.N.; validation, K.C., V.P., D.H. and A.N.; formal analysis, K.C. and A.N.; investigation, A.N.; resources, A.N.; data curation, K.C., V.P., D.H. and A.N.; writing—original draft preparation, K.C.; writing—review and editing, K.C., V.P., D.H. and A.N.; visualization, K.C. and A.N.; supervision, A.N.; project administration, A.N.; funding acquisition, A.N. All authors have read and agreed to the published version of the manuscript.
Funding
This research was funded by the National Institute of Arthritis and Musculoskeletal and Skin Diseases, grant number 1R21AR076689-01A1; the Nathan Shock Center Pilot Award; and the Institutional Development Award (IDeA) from the National Institute of Health’s General Medical Sciences under grant number P20GM103446.
Institutional Review Board Statement
The animal study protocol was approved by the Institutional Review Board of University of Delaware (AUP #1194; date of approval: 01 November 2023).
Data Availability Statement
Any data or material that support the findings of this study can be made available by the corresponding author upon request.
Acknowledgments
We wish to acknowledge University of Delaware Biological Sciences department
Conflicts of Interest
The authors declare no conflict of interest.
References
- Ding D-C, Shyu W-C, Lin S-Z, Dah-Ching Ding W-CS, Shinn-Zong Lin. Mesenchymal Stem Cells. Cell Transplantation. 2011-02-01;20(1). [CrossRef]
- Fu X, Liu G, Halim A, Ju Y, Luo Q, Song G, et al. Mesenchymal Stem Cell Migration and Tissue Repair. Cells 2019, Vol 8, Page 784. 2019-07-28;8(8). [CrossRef]
- Naji A, Eitoku M, Favier B, Deschaseaux F, Rouas-Freiss N, Suganuma N, et al. Biological functions of mesenchymal stem cells and clinical implications. Cellular and Molecular Life Sciences 2019 76:17. 2019-05-04;76(17). [CrossRef]
- Arthur A, Gronthos S, Arthur A, Gronthos S. Clinical Application of Bone Marrow Mesenchymal Stem/Stromal Cells to Repair Skeletal Tissue. International Journal of Molecular Sciences 2020, Vol 21, Page 9759. 2020-12-21;21(24). [CrossRef]
- Shi Y, Wang Y, Li Q, Liu K, Hou J, Shao C, et al. Immunoregulatory mechanisms of mesenchymal stem and stromal cells in inflammatory diseases. Nature Reviews Nephrology 2018 14:8. 2018-06-12;14(8). [CrossRef]
- Cai Z, Wu B, Ye G, Liu W, Chen K, Wang P, et al. Enhanced Osteogenic Differentiation of Human Bone Marrow Mesenchymal Stem Cells in Ossification of the Posterior Longitudinal Ligament Through Activation of the BMP2-Smad1/5/8 Pathway. Stem Cells and Development. 2020-12-09;29(24). [CrossRef]
- Komori T, Komori T. Regulation of Proliferation, Differentiation and Functions of Osteoblasts by Runx2. International Journal of Molecular Sciences 2019, Vol 20, Page 1694. 2019-04-04;20(7). [CrossRef]
- Tanaka Y, Nakayamada S, Okada Y. Osteoblasts and Osteoclasts in Bone Remodeling and Inflammation. Current Drug Target -Inflammation & Allergy. 2005;4(3). [CrossRef]
- Okamoto M, Murai J, Yoshikawa H, Tsumaki N. Bone Morphogenetic Proteins in Bone Stimulate Osteoclasts and Osteoblasts During Bone Development*. Journal of Bone and Mineral Research. 2006/07/01;21(7). [CrossRef]
- Adipocyte differentiation of bone marrow-derived mesenchymal stem cells: cross talk with the osteoblastogenic program—PubMed. Cellular and molecular life sciences : CMLS. 2009 Jan;66(2). [CrossRef]
- Li Y, Jin D, Xie W, Wen L, Chen W, Xu J, et al. PPAR-γ and Wnt Regulate the Differentiation of MSCs into Adipocytes and Osteoblasts Respectively. Current Stem Cell Research & Therapy. 2018;13(3). [CrossRef]
- Zhuang H, Zhang X, Zhu C, Tang X, Yu F, Shang Gw, et al. Molecular Mechanisms of PPAR-g Governing MSC Osteogenic and Adipogenic Differentiation. Current Stem Cell Research & Therapy. 2016;11(3). [CrossRef]
- Pokrovskaya LA, Nadezhdin SV, Zubareva EV, Burda YE, Gnezdyukova ES, Pokrovskaya LA, et al. Expression of RUNX2 and Osterix in Rat Mesenchymal Stem Cells during Culturing in Osteogenic-Conditioned Medium. Bulletin of Experimental Biology and Medicine 2020 169:4. 2020-09-10;169(4). [CrossRef]
- Suppression of PPAR transactivation switches cell fate of bone marrow stem cells from adipocytes into osteoblasts—PubMed. Annals of the New York Academy of Sciences. 2007 Nov;1116(1). [CrossRef]
- Cristancho AG, Lazar MA. Forming functional fat: a growing understanding of adipocyte differentiation. Nature reviews Molecular cell biology. 2011/09/09;12(11). [CrossRef]
- Cornish J, Wang T, Lin J-m, Cornish J, Wang T, Lin J-m. Role of Marrow Adipocytes in Regulation of Energy Metabolism and Bone Homeostasis. Current Osteoporosis Reports 2018 16:2. 2018-03-16;16(2). [CrossRef]
- The relationship between bone marrow adipose tissue and bone metabolism in postmenopausal osteoporosis—PubMed. Cytokine & growth factor reviews. 2020 Apr;52. [CrossRef]
- Donoso O, Pino AM, Seitz G, Osses N, Rodríguez JP. Osteoporosis-associated alteration in the signalling status of BMP-2 in human MSCs under adipogenic conditions. Journal of Cellular Biochemistry. 2015/07/01;116(7). [CrossRef]
- Jiao Li XC, Lingyun Lu , Xijie Yu. The relationship between bone marrow adipose tissue and bone metabolism in postmenopausal osteoporosis. Cytokine & Growth Factor Reviews. 2020/04/01;52. [CrossRef]
- Durbano HW, Halloran D, Nguyen J, Stone V, Mctague S, Eskander M, et al. Aberrant BMP2 Signaling in Patients Diagnosed with Osteoporosis. International Journal of Molecular Sciences. 2020;21(18):6909. [CrossRef]
- Wright NC, Looker AC, Saag KG, Curtis JR, Delzell ES, Randall S, et al. The Recent Prevalence of Osteoporosis and Low Bone Mass in the United States Based on Bone Mineral Density at the Femoral Neck or Lumbar Spine. Journal of bone and mineral research : the official journal of the American Society for Bone and Mineral Research. 2014/11;29(11). [CrossRef]
- Ji M-X, Yu Q. Primary osteoporosis in postmenopausal women. Chronic Diseases and Translational Medicine. 2015/03;1(1). [CrossRef]
- Westhovens R, Dequeker J, Westhovens R, Dequeker J. Rheumatoid arthritis and osteoporosis. Zeitschrift für Rheumatologie 2000 59:1. 2014-04-10;59(1). [CrossRef]
- Li J, Hu Y, You H, Li R, Ran Q, Ouyang T, et al. Trabecular Bone Microarchitecture Evaluation in an Osteoporosis Mouse Model. Journal of Visualized Experiments. 2023(199). [CrossRef]
- Moerman EJ, Teng K, Lipschitz DA, Lecka-Czernik B. Aging activates adipogenic and suppresses osteogenic programs in mesenchymal marrow stroma/stem cells: the role of PPAR-γ2 transcription factor and TGF-β/BMP signaling pathways. Aging cell. 2004/12;3(6). [CrossRef]
- Camacho PM, Petak SM, Binkley N, Diab DL, Eldeiry LS, Farooki A, et al. American Association of Clinical Endocrinologists/American College of Endocrinology Clinical Practice Guidelines for the Diagnosis and Treatment of Postmenopausal Osteoporosis—2020 Update. Endocrine Practice. 2020/05/01;26. [CrossRef]
- Halloran D, Pandit V, Macmurray C, Stone V, Degeorge K, Eskander M, et al. Age-Related Low Bone Mineral Density in C57BL/6 Mice Is Reflective of Aberrant Bone Morphogenetic Protein-2 Signaling Observed in Human Patients Diagnosed with Osteoporosis. International Journal of Molecular Sciences. 2022;23(19):11205. [CrossRef]
- Reeve J, Meunier PJ, Parsons JA, Bernat M, Bijvoet OL, Courpron P, et al. Anabolic effect of human parathyroid hormone fragment on trabecular bone in involutional osteoporosis: a multicentre trial. British Medical Journal. 1980/06/06;280(6228). [CrossRef]
- A review of anabolic therapies for osteoporosis—PubMed. Arthritis research & therapy. 2003;5(5). [CrossRef]
- MUÑOZ M, ROBINSON K, SHIBLI-RAHHAL A. Bone Health and Osteoporosis Prevention and Treatment. Clinical Obstetrics and Gynecology. December 2020;63(4). [CrossRef]
- Blahoš J, Blahoš J. Treatment and prevention of osteoporosis. Wiener Medizinische Wochenschrift 2007 157:23. 2007-12-01;157(23). [CrossRef]
- Delaney MF. Strategies for the prevention and treatment of osteoporosis during early postmenopause. American Journal of Obstetrics & Gynecology. 2006/02/01;194(2). [CrossRef]
- Kemmak AR, Rezapour A, Jahangiri R, Nikjoo S, Farabi H, Soleimanpour S. Economic burden of osteoporosis in the world: A systematic review. Medical Journal of the Islamic Republic of Iran. 2020;34. [CrossRef]
- Wang RN, Green J, Wang Z, Deng Y, Qiao M, Peabody M, et al. Bone Morphogenetic Protein (BMP) signaling in development and human diseases. Genes & Diseases. 2014/09;1(1). [CrossRef]
- Amitabha Bandyopadhyay PSY, Paritosh Prashar. BMP signaling in development and diseases: A pharmacological perspective. Biochemical Pharmacology. 2013/04/01;85(7). [CrossRef]
- Weiss A, Attisano L. The TGFbeta Superfamily Signaling Pathway. Wiley Interdisciplinary Reviews: Developmental Biology. 2013/01/01;2(1). [CrossRef]
- Chen G, Deng C, Li Y-P. TGF-β and BMP Signaling in Osteoblast Differentiation and Bone Formation. International Journal of Biological Sciences. 2012;8(2). [CrossRef]
- Poniatowski ŁA, Wojdasiewicz P, Gasik R, Szukiewicz D. Transforming Growth Factor Beta Family: Insight into the Role of Growth Factors in Regulation of Fracture Healing Biology and Potential Clinical Applications. Mediators of Inflammation. 2015;2015. [CrossRef]
- Carlisle E, Fischgrund JS. Bone morphogenetic proteins for spinal fusion. The Spine Journal. 2005/11/01;5(6). [CrossRef]
- Urist MR. Bone: Formation by Autoinduction. Science. 1965-11-12;150(3698). [CrossRef]
- Halloran D, Durbano HW, Nohe A. Bone Morphogenetic Protein-2 in Development and Bone Homeostasis. Journal of Developmental Biology. 2020/09;8(3). [CrossRef]
- Haid RW, Branch CL, Alexander JT, Burkus JK. Posterior lumbar interbody fusion using recombinant human bone morphogenetic protein type 2 with cylindrical interbody cages. The Spine Journal. 2004/09/01;4(5). [CrossRef]
- J Kenneth Burkus MFG, Curtis A Dickman , Thomas A Zdeblick. Anterior lumbar interbody fusion using rhBMP-2 with tapered interbody cages—PubMed. Journal of spinal disorders & techniques. 2002 Oct;15(5). [CrossRef]
- Biswas S, Li P, Wu H, Shafiquzzaman M, Murakami S, Schneider MD, et al. BMPRIA is required for osteogenic differentiation and RANKL expression in adult bone marrow mesenchymal stromal cells. Scientific Reports. 2018;8(1). [CrossRef]
- Gu S, Wu W, Liu C, Yang L, Sun C, Ye W, et al. BMPRIA Mediated Signaling Is Essential for Temporomandibular Joint Development in Mice. PLoS ONE. 2014;9(8):e101000. [CrossRef]
- Rogers MB, Shah TA, Shaikh NN. Turning Bone Morphogenetic Protein 2 (BMP2) On and Off in Mesenchymal Cells. Journal of cellular biochemistry. 2015/10;116(10). [CrossRef]
- Agnew C, Ayaz P, Kashima R, Loving HS, Ghatpande P, Kung JE, et al. Structural basis for ALK2/BMPR2 receptor complex signaling through kinase domain oligomerization. Nature Communications. 2021;12(1). [CrossRef]
- Marcelo Ehrlich DH, Barak Marom , Petra Knaus , Yoav I Henis. Homomeric and heteromeric complexes among TGF-β and BMP receptors and their roles in signaling. Cellular Signalling. 2011/09/01;23(9). [CrossRef]
- Gilboa L, Nohe A, Geissendörfer T, Sebald W, Henis YI, Knaus P. Bone Morphogenetic Protein Receptor Complexes on the Surface of Live Cells: A New Oligomerization Mode for Serine/Threonine Kinase Receptors. Molecular Biology of the Cell. 2000/03;11(3). [CrossRef]
- Hartung A, Bitton-Worms K, Rechtman MM, Wenzel V, Boergermann JH, Hassel S, et al. Different Routes of Bone Morphogenic Protein (BMP) Receptor Endocytosis Influence BMP Signaling. Molecular and Cellular Biology. 2006/10;26(20). [CrossRef]
- Chu K-Y, Malik A, Thamilselvan V, Martinez-Hackert E. Type II BMP and activin receptors BMPR2 and ACVR2A share a conserved mode of growth factor recognition. The Journal of Biological Chemistry. 2022/07;298(7). [CrossRef]
- Derynck R, Zhang YE, Derynck R, Zhang YE. Smad-dependent and Smad-independent pathways in TGF-β family signalling. Nature 2003 425:6958. 2003/10;425(6958). [CrossRef]
- Pervan CL. Smad-independent TGF-β2 signaling pathways in human trabecular meshwork cells. Experimental Eye Research. 2017/05/01;158. [CrossRef]
- Graham TR, Odero-Marah VA, Chung LW, Agrawal KC, Davis R, Abdel-Mageed AB. PI3K/Akt-Dependent Transcriptional Regulation and Activation of BMP-2-Smad Signaling by NF-κB in Metastatic Prostate Cancer Cells. The Prostate. 2009/02/02;69(2). [CrossRef]
- Mu Y, Gudey SK, Landström M, Mu Y, Gudey SK, Landström M. Non-Smad signaling pathways. Cell and Tissue Research 2011 347:1. 2011-06-24;347(1). [CrossRef]
- U P, H I, S S, S I, S G, U E, et al. The L45 loop in type I receptors for TGF-beta family members is a critical determinant in specifying Smad isoform activation. FEBS Letters. 1998;434(1-2). [CrossRef]
- Jeffrey W. Wertz PMB. Caveolin-1 regulates BMPRII localization and signaling in vascular smooth muscle cells. Biochemical and Biophysical Research Communications. 2008/10/31;375(4). [CrossRef]
- Bragdon B, Bonor J, Schultz KL, Beamer WG, Rosen CJ, Nohe A. Bone Morphogenetic Protein Receptor Type Ia Localization Causes Increased BMP2 Signaling in Mice Exhibiting Increased Peak Bone Mass Phenotype. Journal of Cellular Physiology. 2012/07;227(7). [CrossRef]
- Bonor J, Adams EL, Bragdon B, Moseychuk O, Czymmek KJ, Nohe A. Initiation of BMP2 Signaling in Domains on the Plasma Membrane. Journal of Cellular Physiology. 2012/07;227(7). [CrossRef]
- Saldanha S, Bragdon B, Moseychuk O, Bonor J, Dhurjati P, Nohe A. Caveolae regulate smad signaling as verified by novel imaging and system biology approaches. Journal of Cellular Physiology. 2013/05/01;228(5). [CrossRef]
- Wang S, Hu S, Wang J, Liu Y, Zhao R, Tong M, et al. Conditioned medium from bone marrow-derived mesenchymal stem cells inhibits vascular calcification through blockade of the BMP2–Smad1/5/8 signaling pathway. Stem Cell Research & Therapy. 2018;9(1). [CrossRef]
- Beth Bragdon ST, Oleksandra Moseychuk , Lauren Gurski , Jeremy Bonor , Christopher Price , Liyun Wang , Wesley G Beamer , Anja Nohe. Casein kinase 2 regulates in vivo bone formation through its interaction with bone morphogenetic protein receptor type Ia. Bone. 2011/11/01;49(5). [CrossRef]
- Bragdon B, Thinakaran S, Moseychuk O, King D, Young K, Litchfield W, David, et al. Casein Kinase 2 β-Subunit Is a Regulator of Bone Morphogenetic Protein 2 Signaling. Biophysical Journal. 2010;99(3):897-904. [CrossRef]
- Beth Bragdon OM, Sven Saldanha , Daniel King , Joanne Julian , Anja Nohe. Bone Morphogenetic Proteins: A critical review. Cellular Signalling. 2011/04/01;23(4). [CrossRef]
- Villavicencio AT, Burneikiene S. RhBMP-2-induced radiculitis in patients undergoing transforaminal lumbar interbody fusion: relationship to dose. The Spine Journal. 2016/10/01;16(10). [CrossRef]
- Alkhathami AG, Abdullah MR, Ahmed M, Hassan Ahmed H, Alwash SW, Muhammed Mahdi Z, et al. Bone morphogenetic protein (BMP)9 in cancer development: mechanistic, diagnostic, and therapeutic approaches? Journal of Drug Targeting. 2023;31(7):714-24. [CrossRef]
- Lewandrowski K-U, Nanson C, Calderon R. Vertebral osteolysis after posterior interbody lumbar fusion with recombinant human bone morphogenetic protein 2: A report of five cases. The Spine Journal. 2007/09/01;7(5). [CrossRef]
- James AW, LaChaud G, Shen J, Asatrian G, Nguyen V, Zhang X, et al. A Review of the Clinical Side Effects of Bone Morphogenetic Protein-2. Tissue Engineering Part B, Reviews. 2016/08/08;22(4). [CrossRef]
- Moseychuk O, Akkiraju H, Dutta J, D’Angelo A, Bragdon B, Duncan RL, et al. Inhibition of CK2 binding to BMPRIa induces C2C12 differentiation into osteoblasts and adipocytes. Journal of Cell Communication and Signaling. 2013/12;7(4). [CrossRef]
- Stienstra R, Joosten LAB, Koenen T, Tits Bv, Diepen JAv, Berg SAAvd, et al. The Inflammasome-Mediated Caspase-1 Activation Controls Adipocyte Differentiation and Insulin Sensitivity. Cell metabolism. 2010/12/12;12(6). [CrossRef]
- Molla MD, Ayelign B, Dessie G, Geto Z, Admasu TD, Molla MD, et al. Caspase-1 as a regulatory molecule of lipid metabolism. Lipids in Health and Disease 2020 19:1. 2020-03-06;19(1). [CrossRef]
- Wang Y, Chen G, Xu M, Cui Y, He W, Zeng H, et al. Caspase-1 Deficiency Modulates Adipogenesis through Atg7-Mediated Autophagy: An Inflammatory-Independent Mechanism. Biomolecules 2024, Vol 14, Page 501. 2024-04-20;14(4). [CrossRef]
- Gasteiger E, Hoogland C, Gattiker A, Duvaud Se, Wilkins MR, Appel RD, et al. Protein Identification and Analysis Tools on the ExPASy Server. The Proteomics Protocols Handbook. 2005. [CrossRef]
- Srivastava M, Deal C. Osteoporosis in elderly: prevention and treatment. Clinics in Geriatric Medicine. 2002/08/01;18(3). [CrossRef]
- AL B, R. C. Aging and bone. Journal of Dental Research. 2010;89(12). [CrossRef]
- Shoji H, Miyakawa T. Age-related behavioral changes from young to old age in male mice of a C57BL/6J strain maintained under a genetic stability program. Neuropsychopharmacology Reports. 2019/06;39(2). [CrossRef]
- Ambrosi TH, Scialdone A, Graja A, Gohlke S, Jank A-M, Bocian C, et al. Adipocyte Accumulation in the Bone Marrow during Obesity and Aging Impairs Stem Cell-Based Hematopoietic and Bone Regeneration. Cell Stem Cell. 2017/06/06;20(6). [CrossRef]
- Chen Q, Shou P, Zheng C, Jiang M, Cao G, Yang Q, et al. Fate decision of mesenchymal stem cells: adipocytes or osteoblasts? Cell Death & Differentiation 2016 23:7. 2016-02-12;23(7). [CrossRef]
Figure 1.
Figure 1. Confirmation of antibody specificity and BMP2-induced BMPRIa cleavage in immortalized C2C12 cells. (A) Validation of anti-BMPRIa antibody specificity. Western blot analysis of lysates from unstimulated wildtype and BMPRIa knockout C2C12 cells. The BMPRIa band is present in wildtype cells at 55kDa but absent in knockout cells, confirming the antibody’s specificity and no cleavage of the protein. (B) Figure B shows BMPRIa cleavage in C2C12 cells under varying BMP2 concentrations. C2C12 cells were treated with BMP2 at concentrations of 0 nM, 40 nM, and 200 nM. Lysates were analyzed by SDS-PAGE and western blotting using an anti-BMPRIa antibody. A BMPRIa band at 55 kDa was observed in all groups, while an additional cleavage band was detected only in the 200 nM BMP2-treated group, indicating BMP2-induced cleavage.
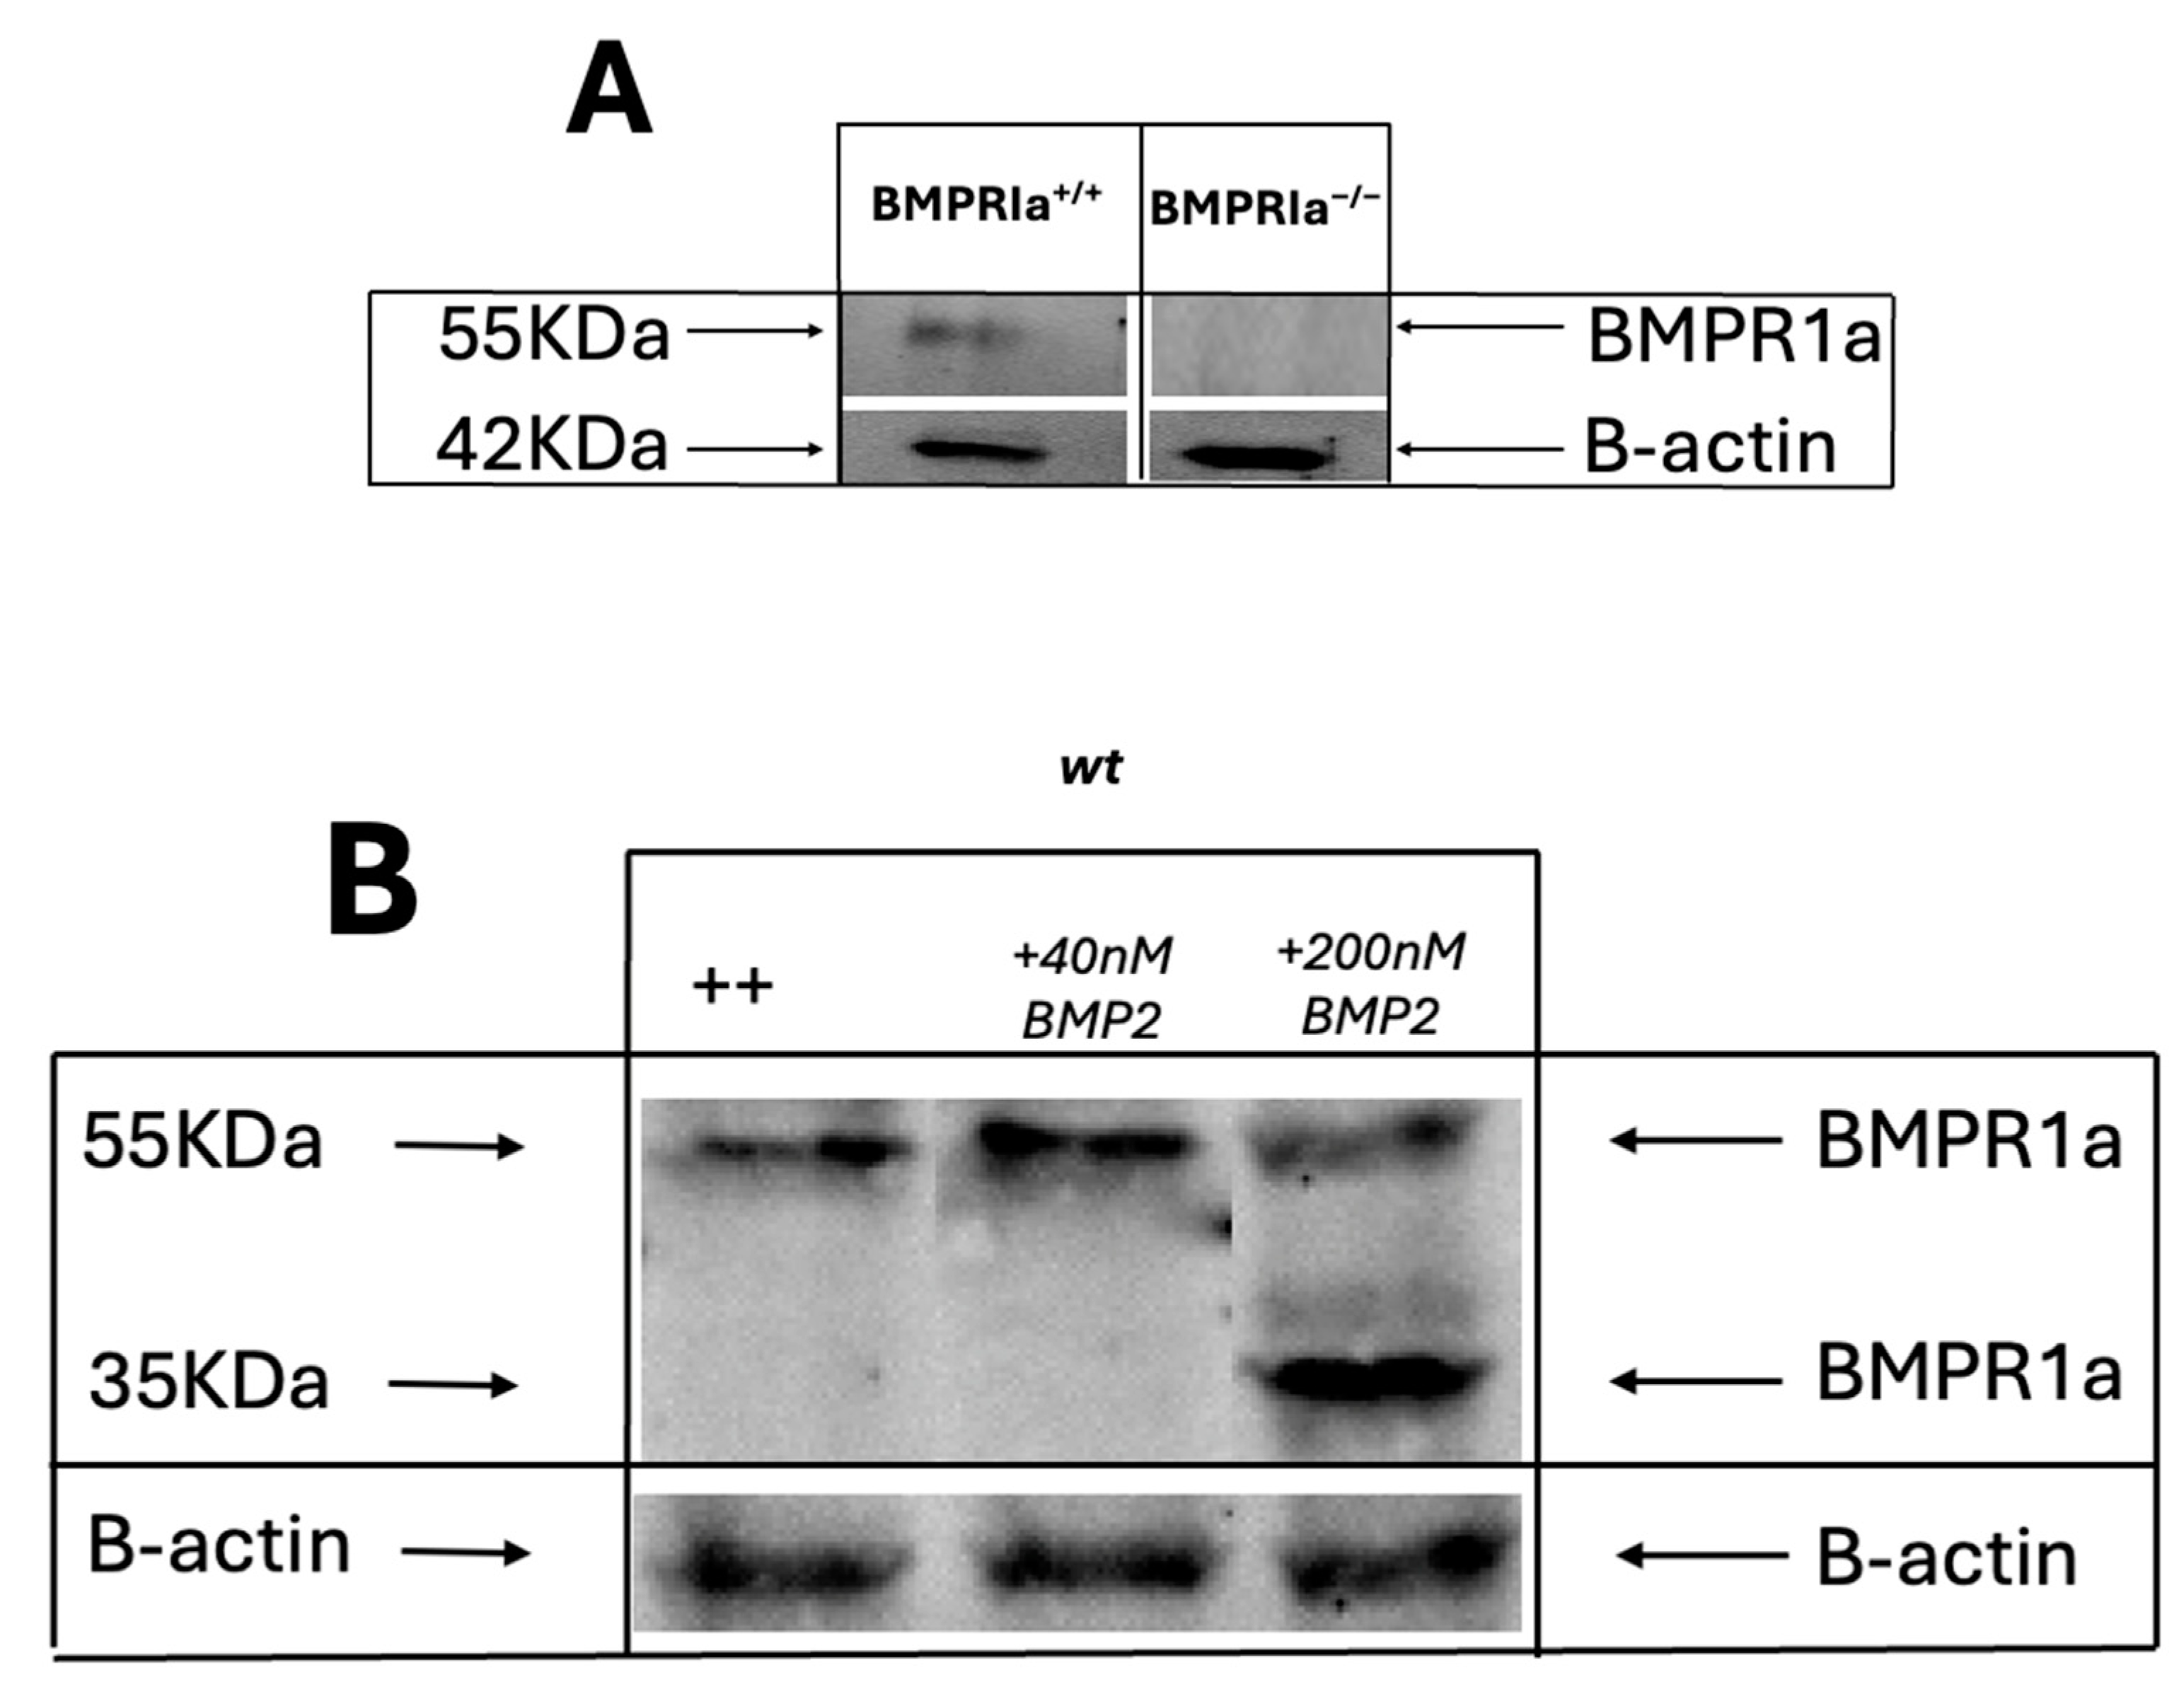
Figure 2.
High BMP2 concentration leads to an increase in the number of cells expressing PPARγin primary BMSCs. (A) Plot showing the percentage of cells expressing PPARγ across the treatment groups (0 nM, 40 nM, 200 nM BMP2). Each bar represents the percentage of cells expressing PPARγ in five random images taken with a confocal microscope and analyzed using ImageJ software. Data were collected from three independent experiments (n=3). There was a significant increase in the number of cells expressing PPARγ in the group treated with the higher BMP2 concentration, with approximately 82% of the cells in the 200 nM group positive for PPARγ, compared to around 20% in the control group. Error bars represent standard deviation (SD), with significance indicated by *p<0.05. (B) Plot of the percentage of cells not expressing PPARγ in the treatment groups (0 nM, 40 nM, 200 nM BMP2). Each bar represents the percentage of cells not expressing PPARγ in five random images taken with a confocal microscope and analyzed using ImageJ software. Data were collected from three independent experiments (n=3). Error bars represent standard deviation (SD), with significance indicated by *p<0.05. (C) Primary BMSC’s isolated from the femurs of 6-months-old C57BL/6 mice were subjected to immunofluorescence staining using anti PPARγ antibody and stimulated with BMP2 at 0 nM (control), 40 nM, and 200 nM. Representative images are shown. PPARγ is colored green; nuclei were stained with Hoechst dye and are colored blue. Magnification is 63x; scale bars = 50 μm. (D) Higher resolution z-stack images in the orthogonal view from the control, 40 and 200 nM groups, respectively. The orthogonal view creates slices of different regions of the cell for proper display of the localization of each stain. PPARγ expression was more nuclear in the 200 nM BMP2 stimulated group when compared to the 0 and 40 nM BMP2 stimulated group. Scale bar = 10μm.
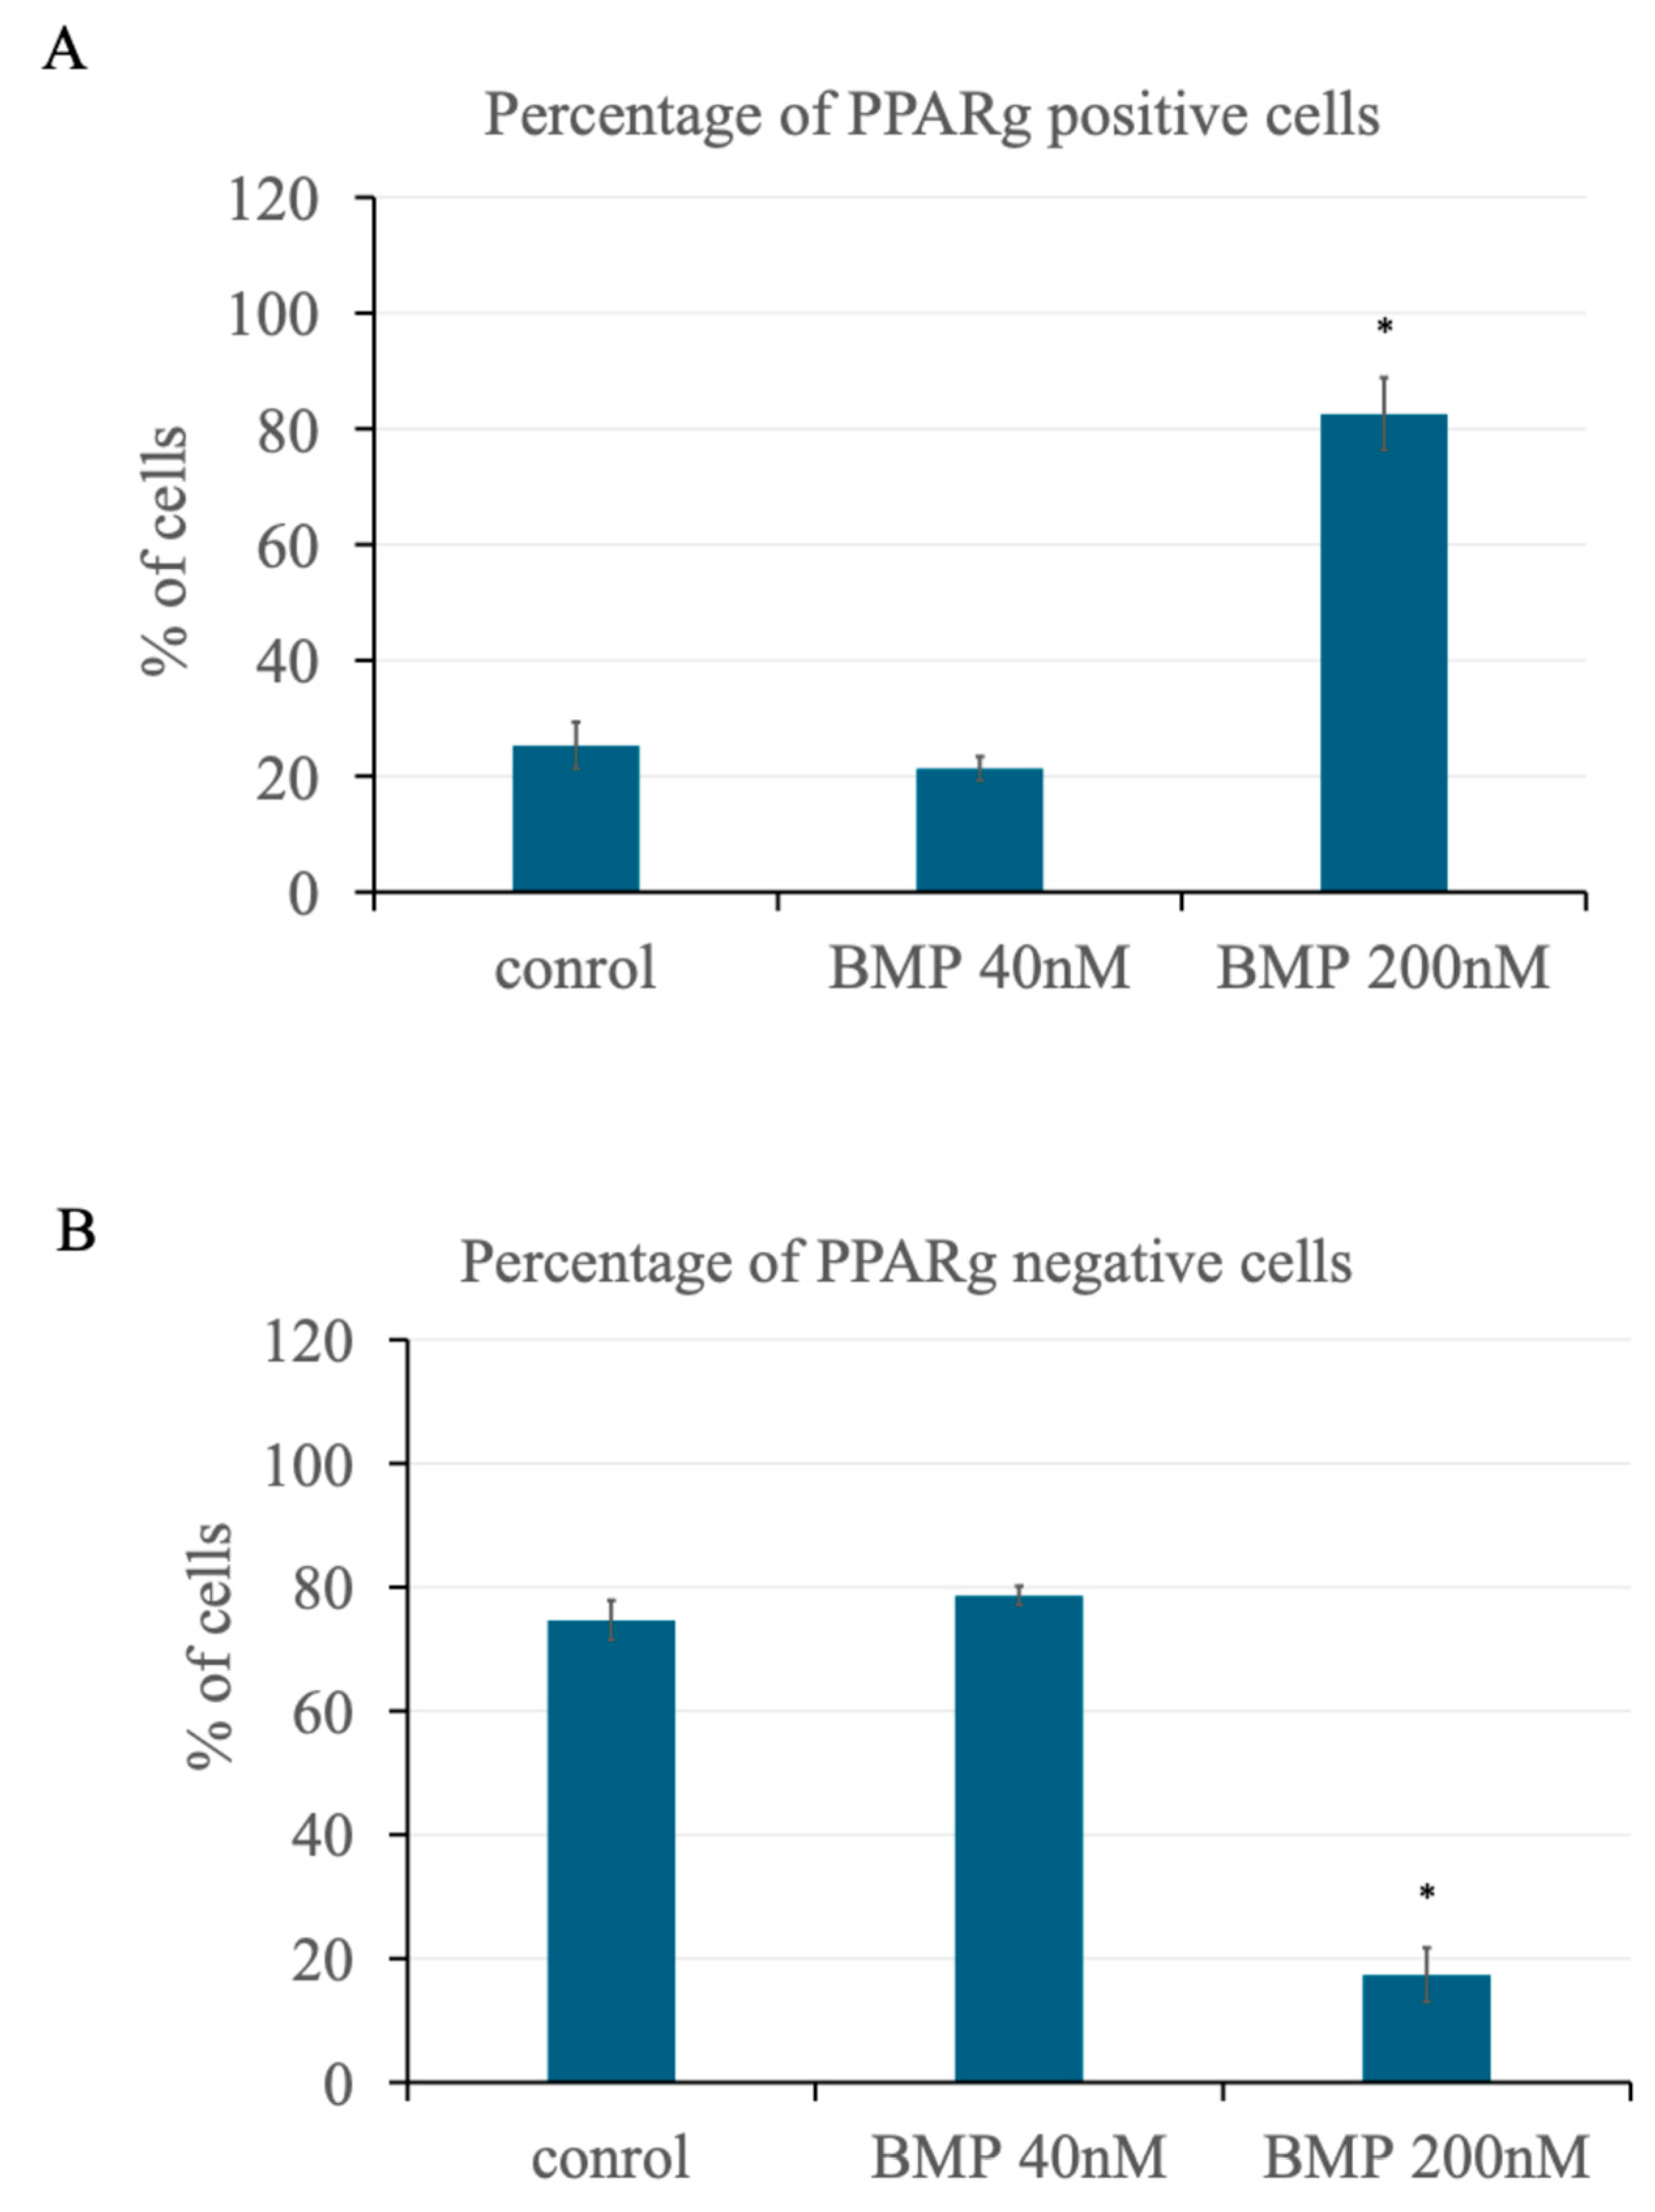
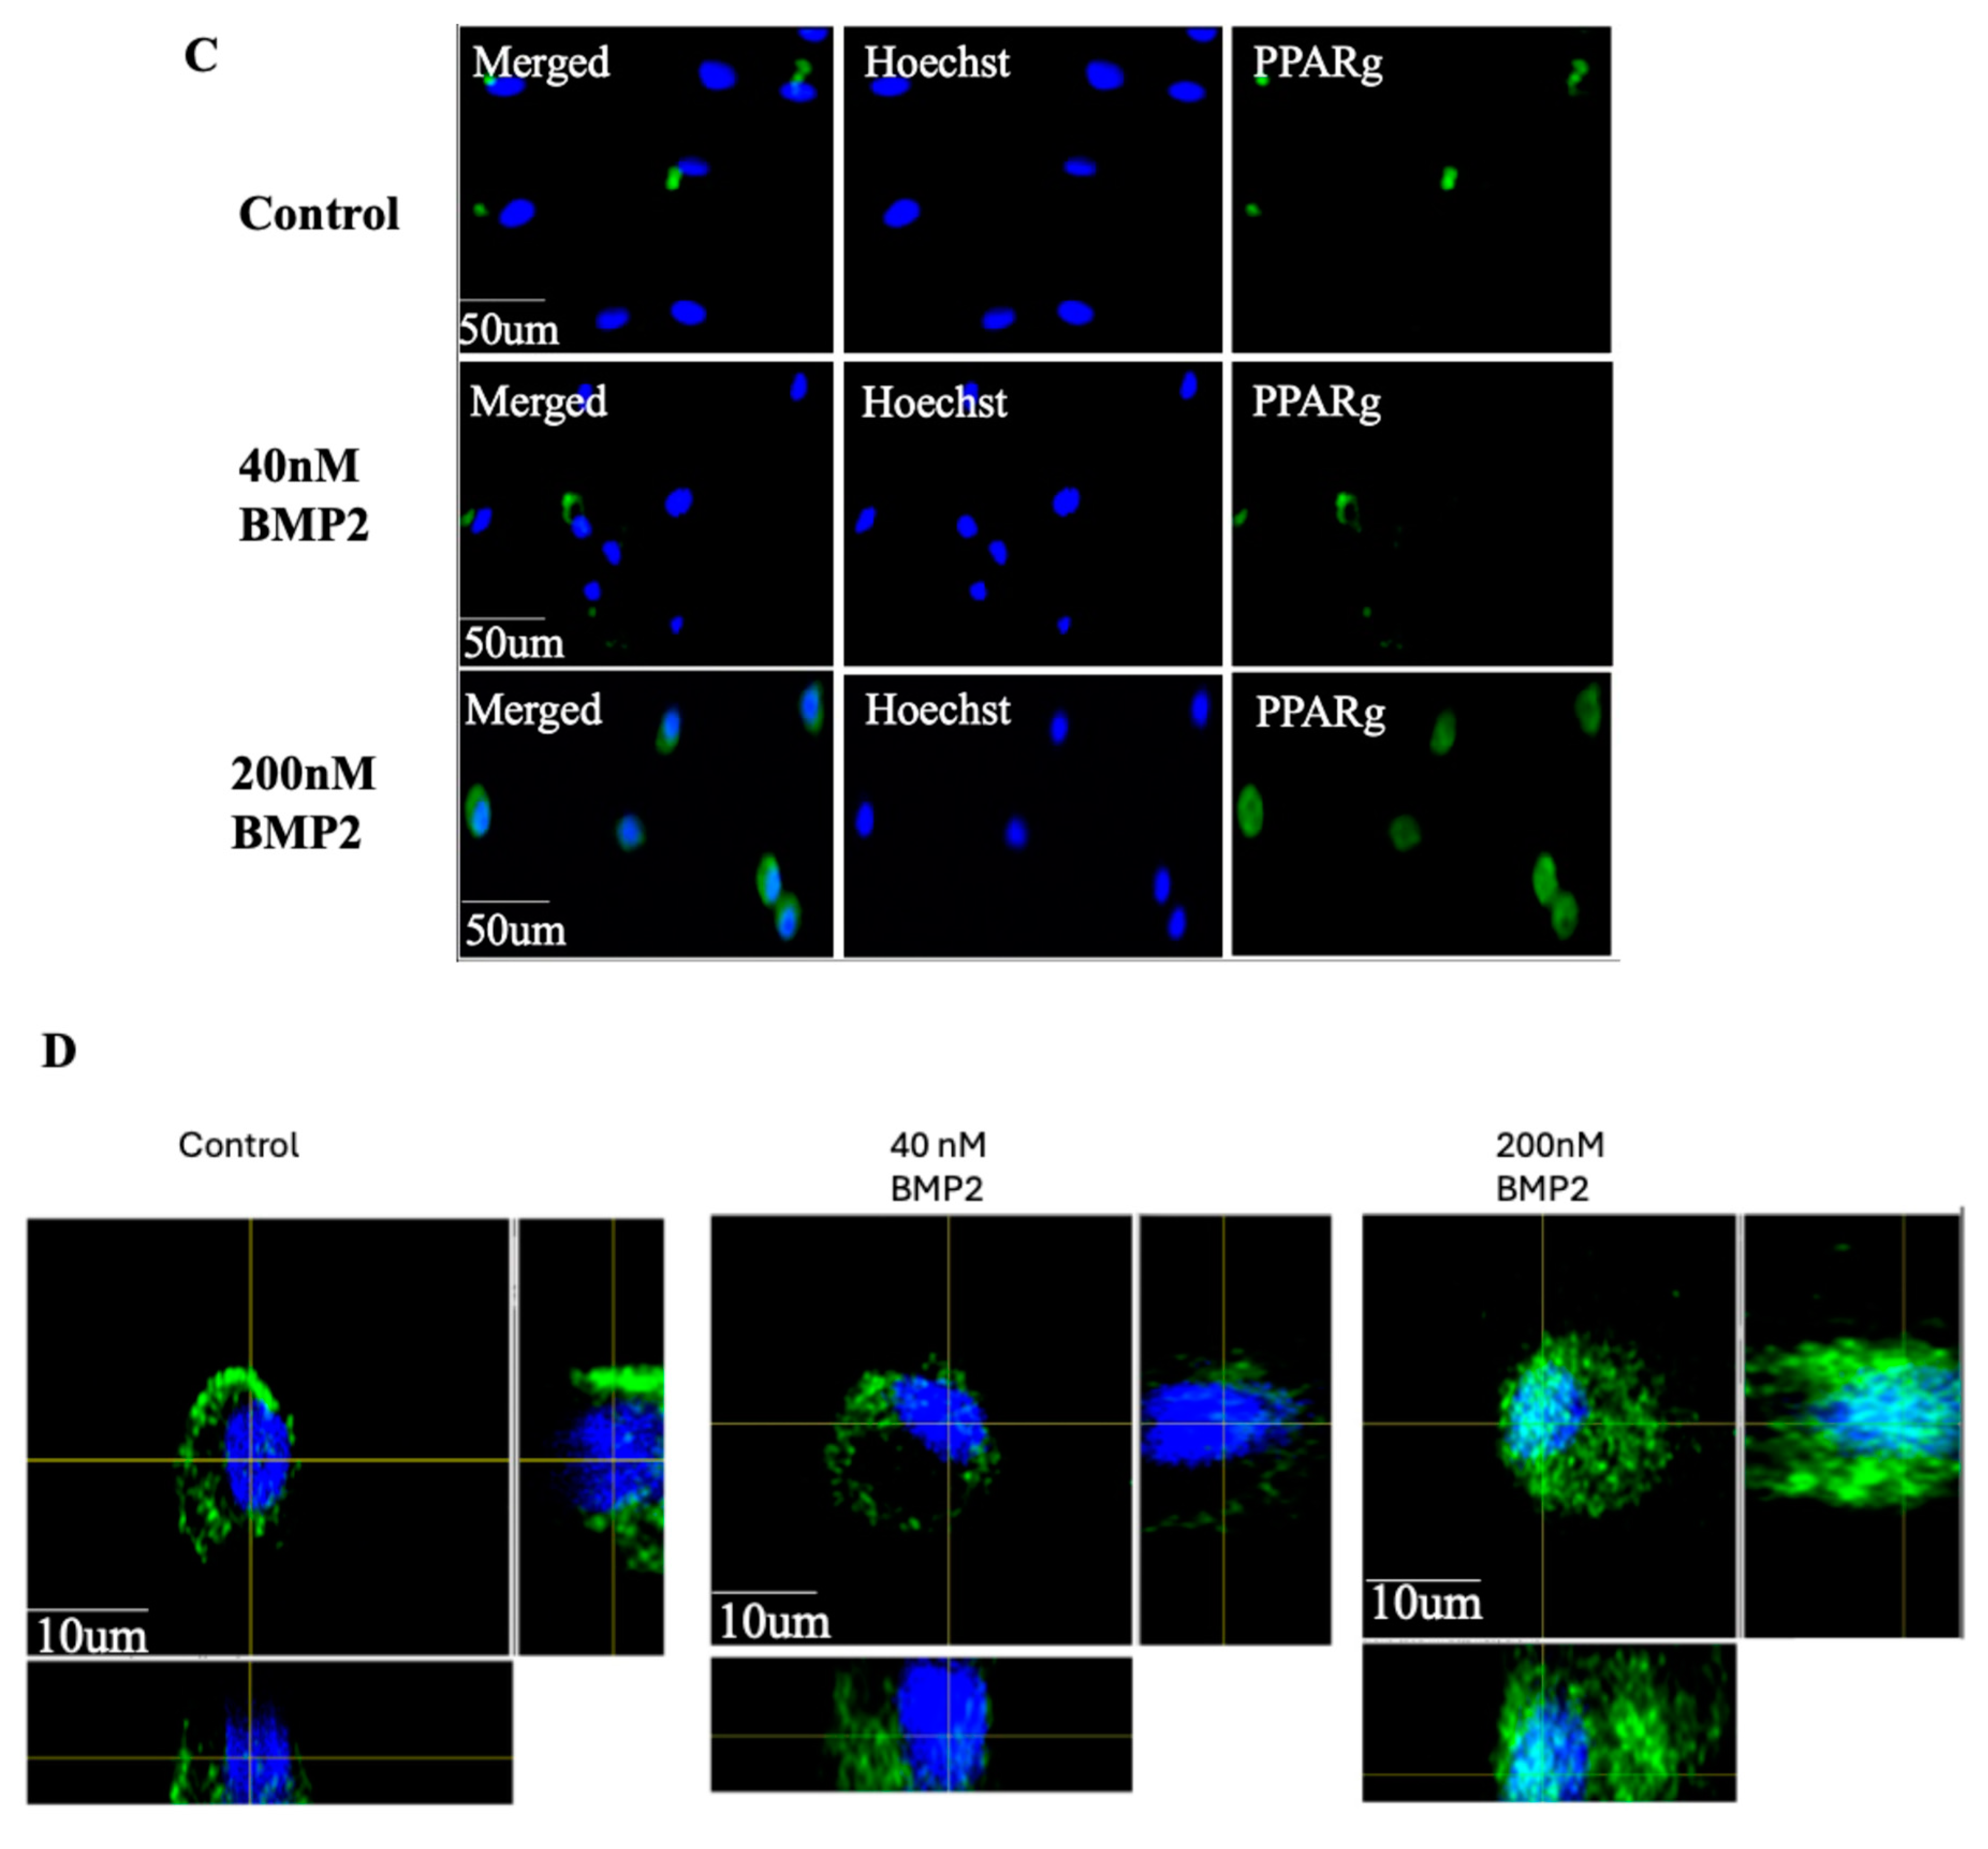
Figure 3.
Higher BMP2 concentration leads to the nuclear accumulation of BMPRIa in BMSCs isolated from 6-months-old B6 mice. (A) Representative images showing primary BMSCs isolated from the femurs of 6-months-old C57BL/6 mice and subjected to immunofluorescence staining using an anti-BMPRIa antibody (C-terminus specific) after stimulation with 0, 40, 200 nM BMP2. BMPRIa is colored red; nuclei were stained with Hoechst dye and are colored blue. Magnification is 63x; scale bar = 50μm. (B, C, D) Higher resolution z-stack images in the orthogonal view from the control, 40 nM, and 200 nM BMP2-stimulated groups. The orthogonal view displays slices of different regions of the cell to illustrate the localization of each stain. BMPRIa is stained in red, and PPARγ is stained in green. In the 200 nM BMP2-stimulated group, both BMPRIa and PPARγ are clearly localized within the nuclear and cytoplasmic region, whereas in the control and 40 nM groups, they are predominantly localized around the cytoplasm. Scale bar = 10 μm. BMPRIa and PPARγ had 56% nuclear colocalization in the 200 nM BMP2 stimulated group when compared to zero in the control group, suggesting that higher BMP2 concentrations may promote nuclear translocation of both proteins, potentially influencing transcriptional regulation and adipogenesis. Error bars represent SD (*p<0.05).
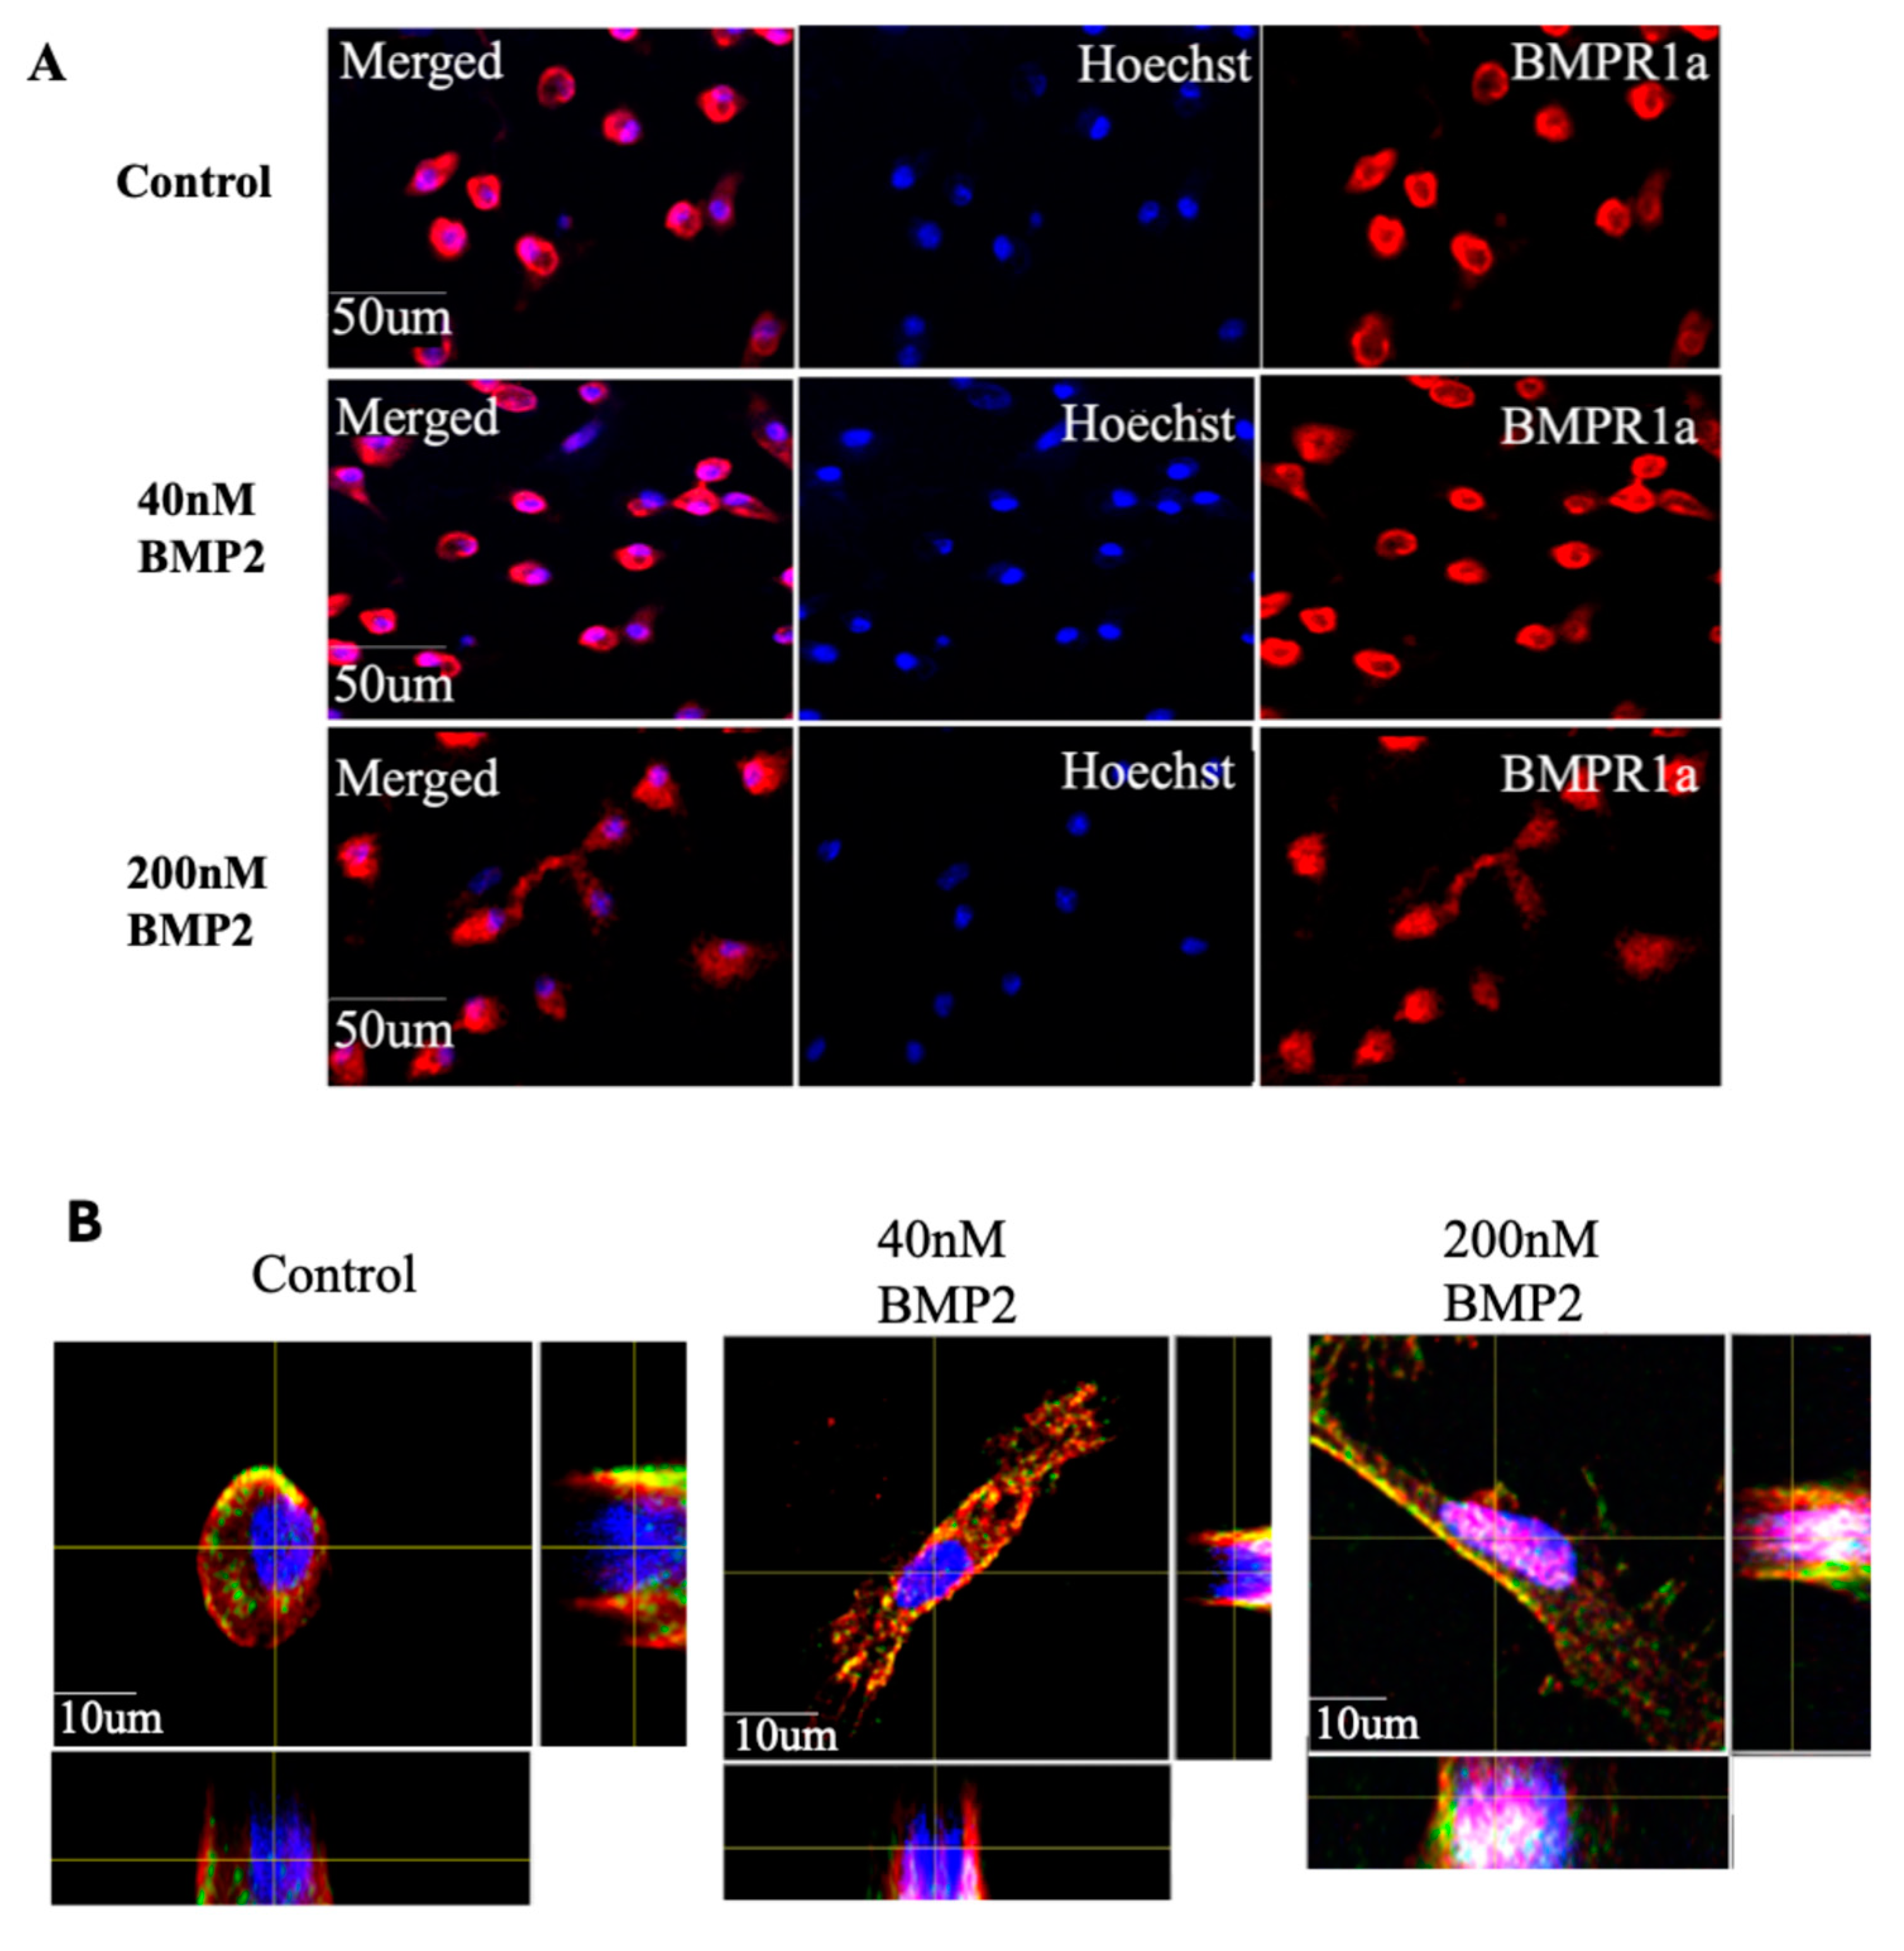
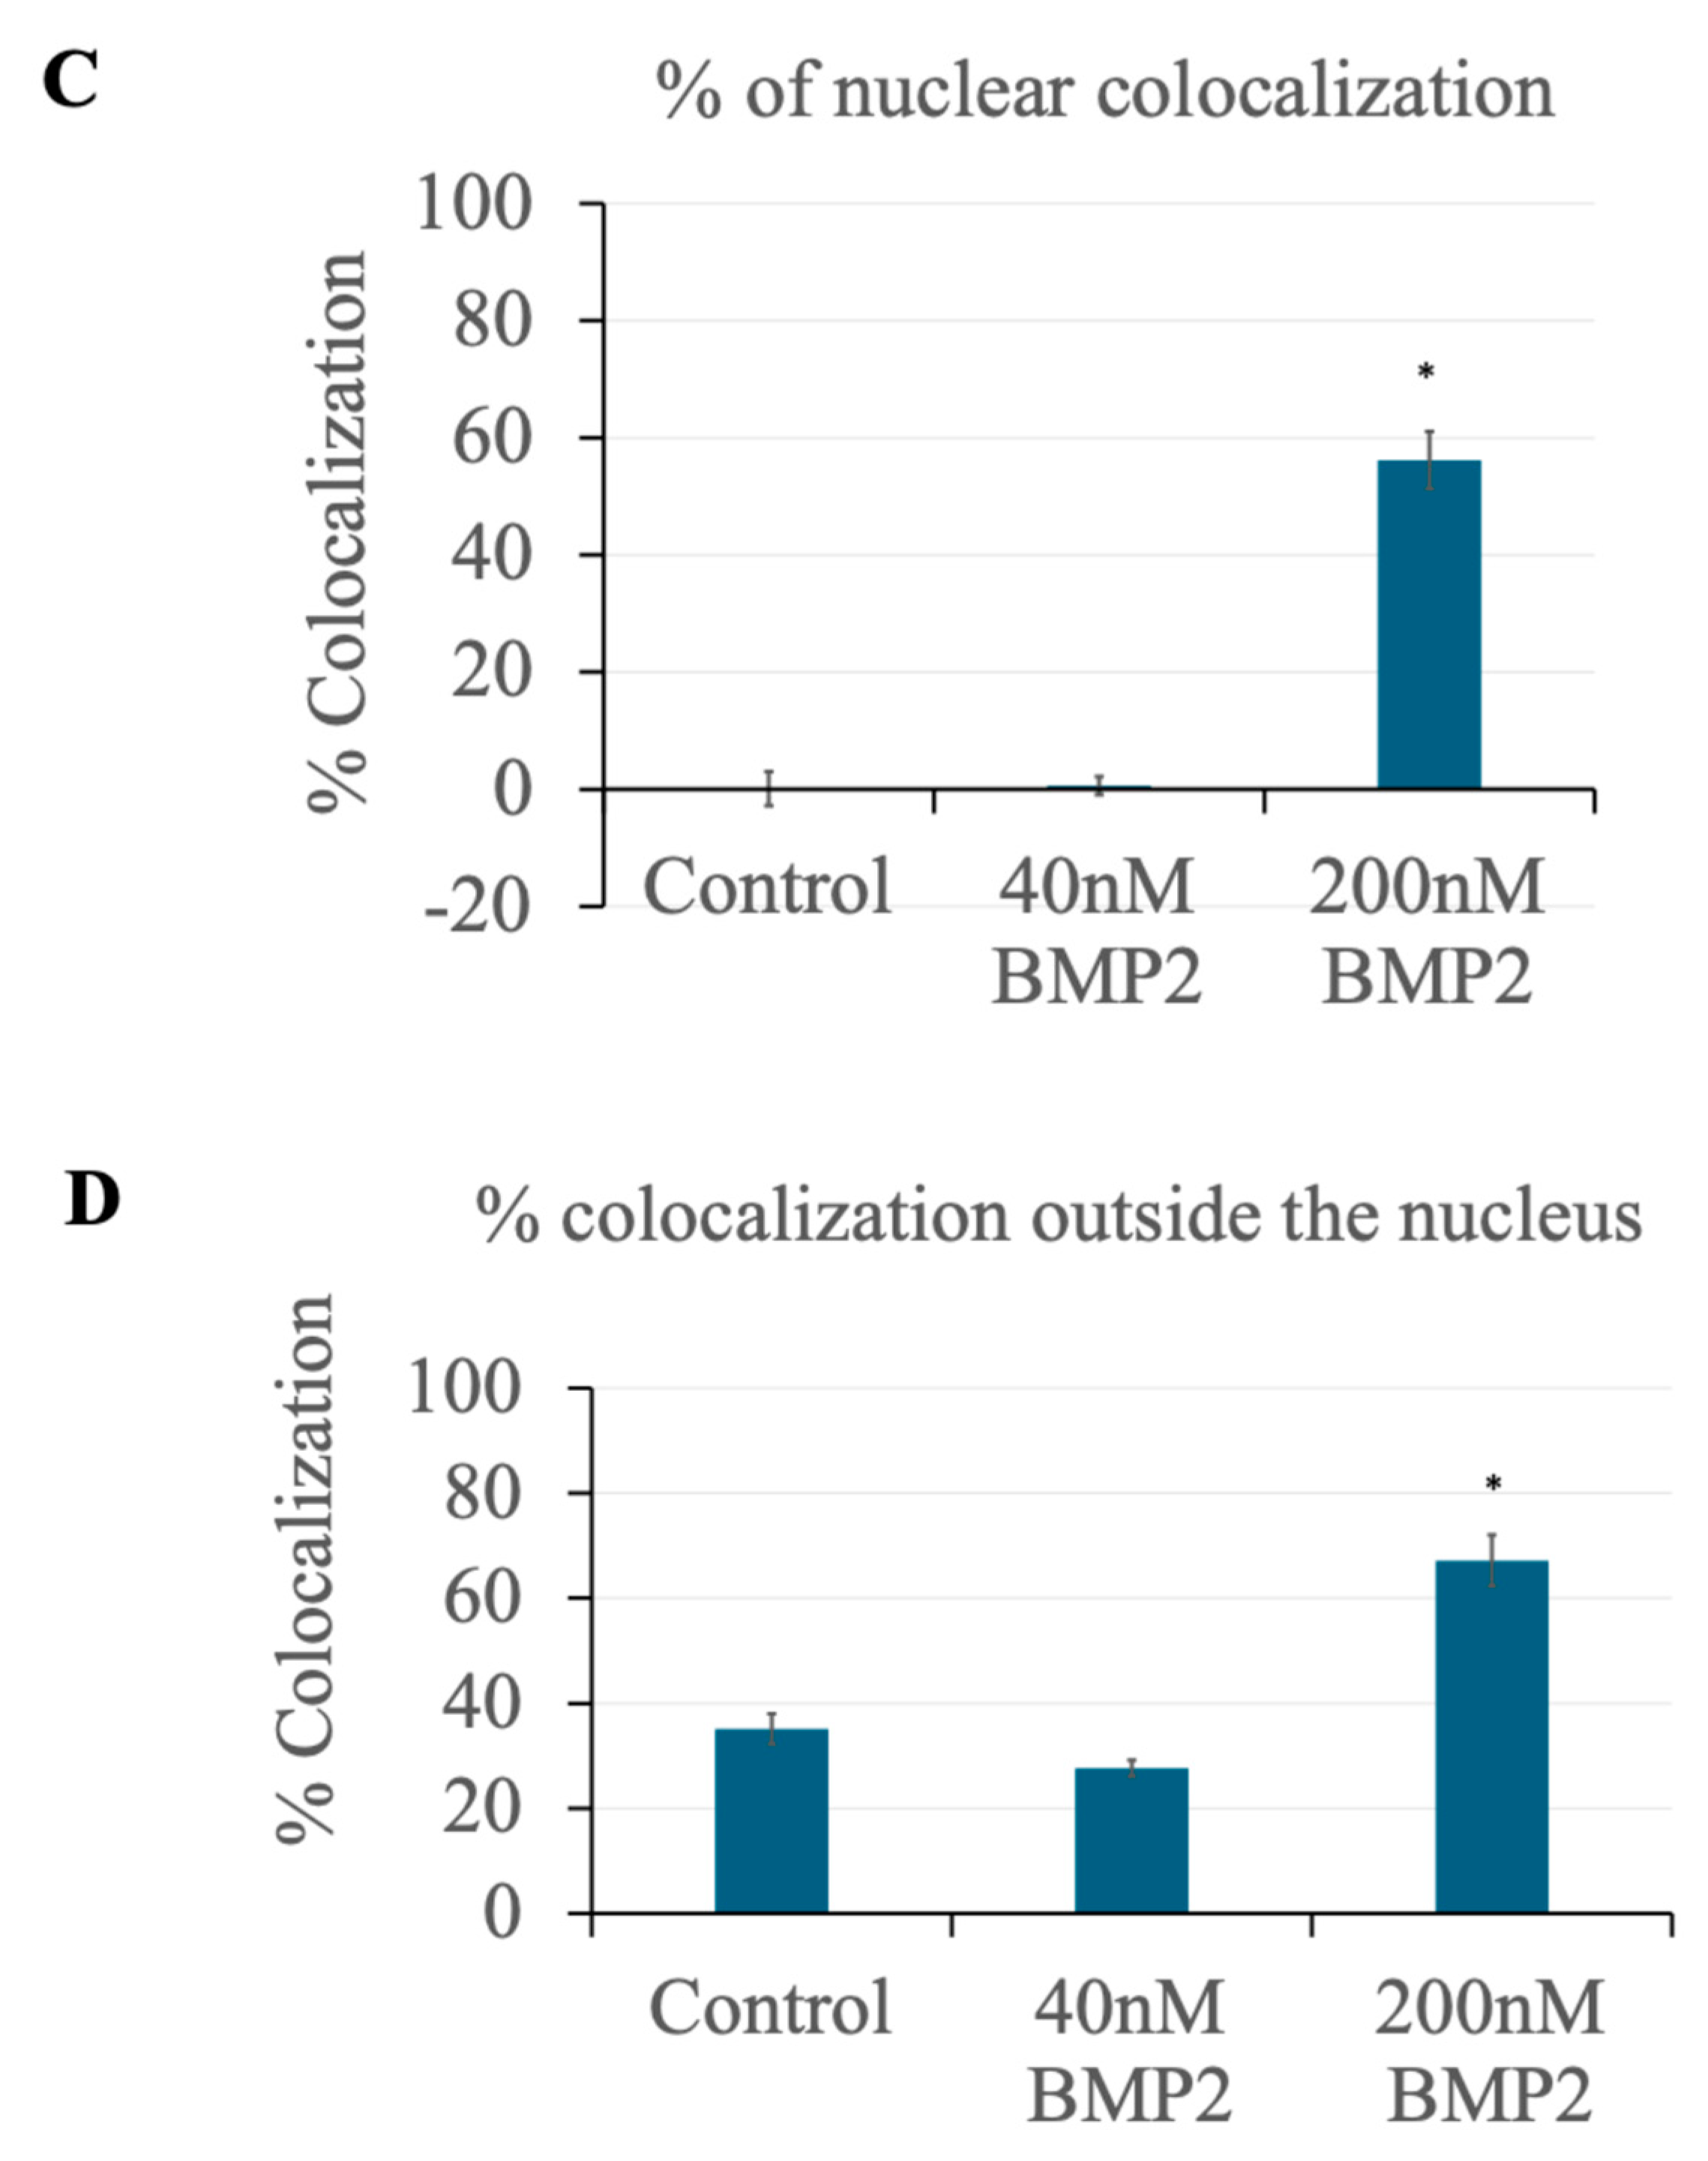
Figure 4.
Identification of Caspase-1 as a BMPRIa Protease. (A) The full amino acid sequence of the BMPRIa receptor protein. BMPRIa is 532 amino acid long. (B) The cleavage site of Caspase-1 on BMPRIa peptide sequence identified using the Expasy PeptideCutter tool. Caspase-1 cleaves the BMPRIa receptor at the 310 amino acid position corresponding to the C-terminus of the protein.
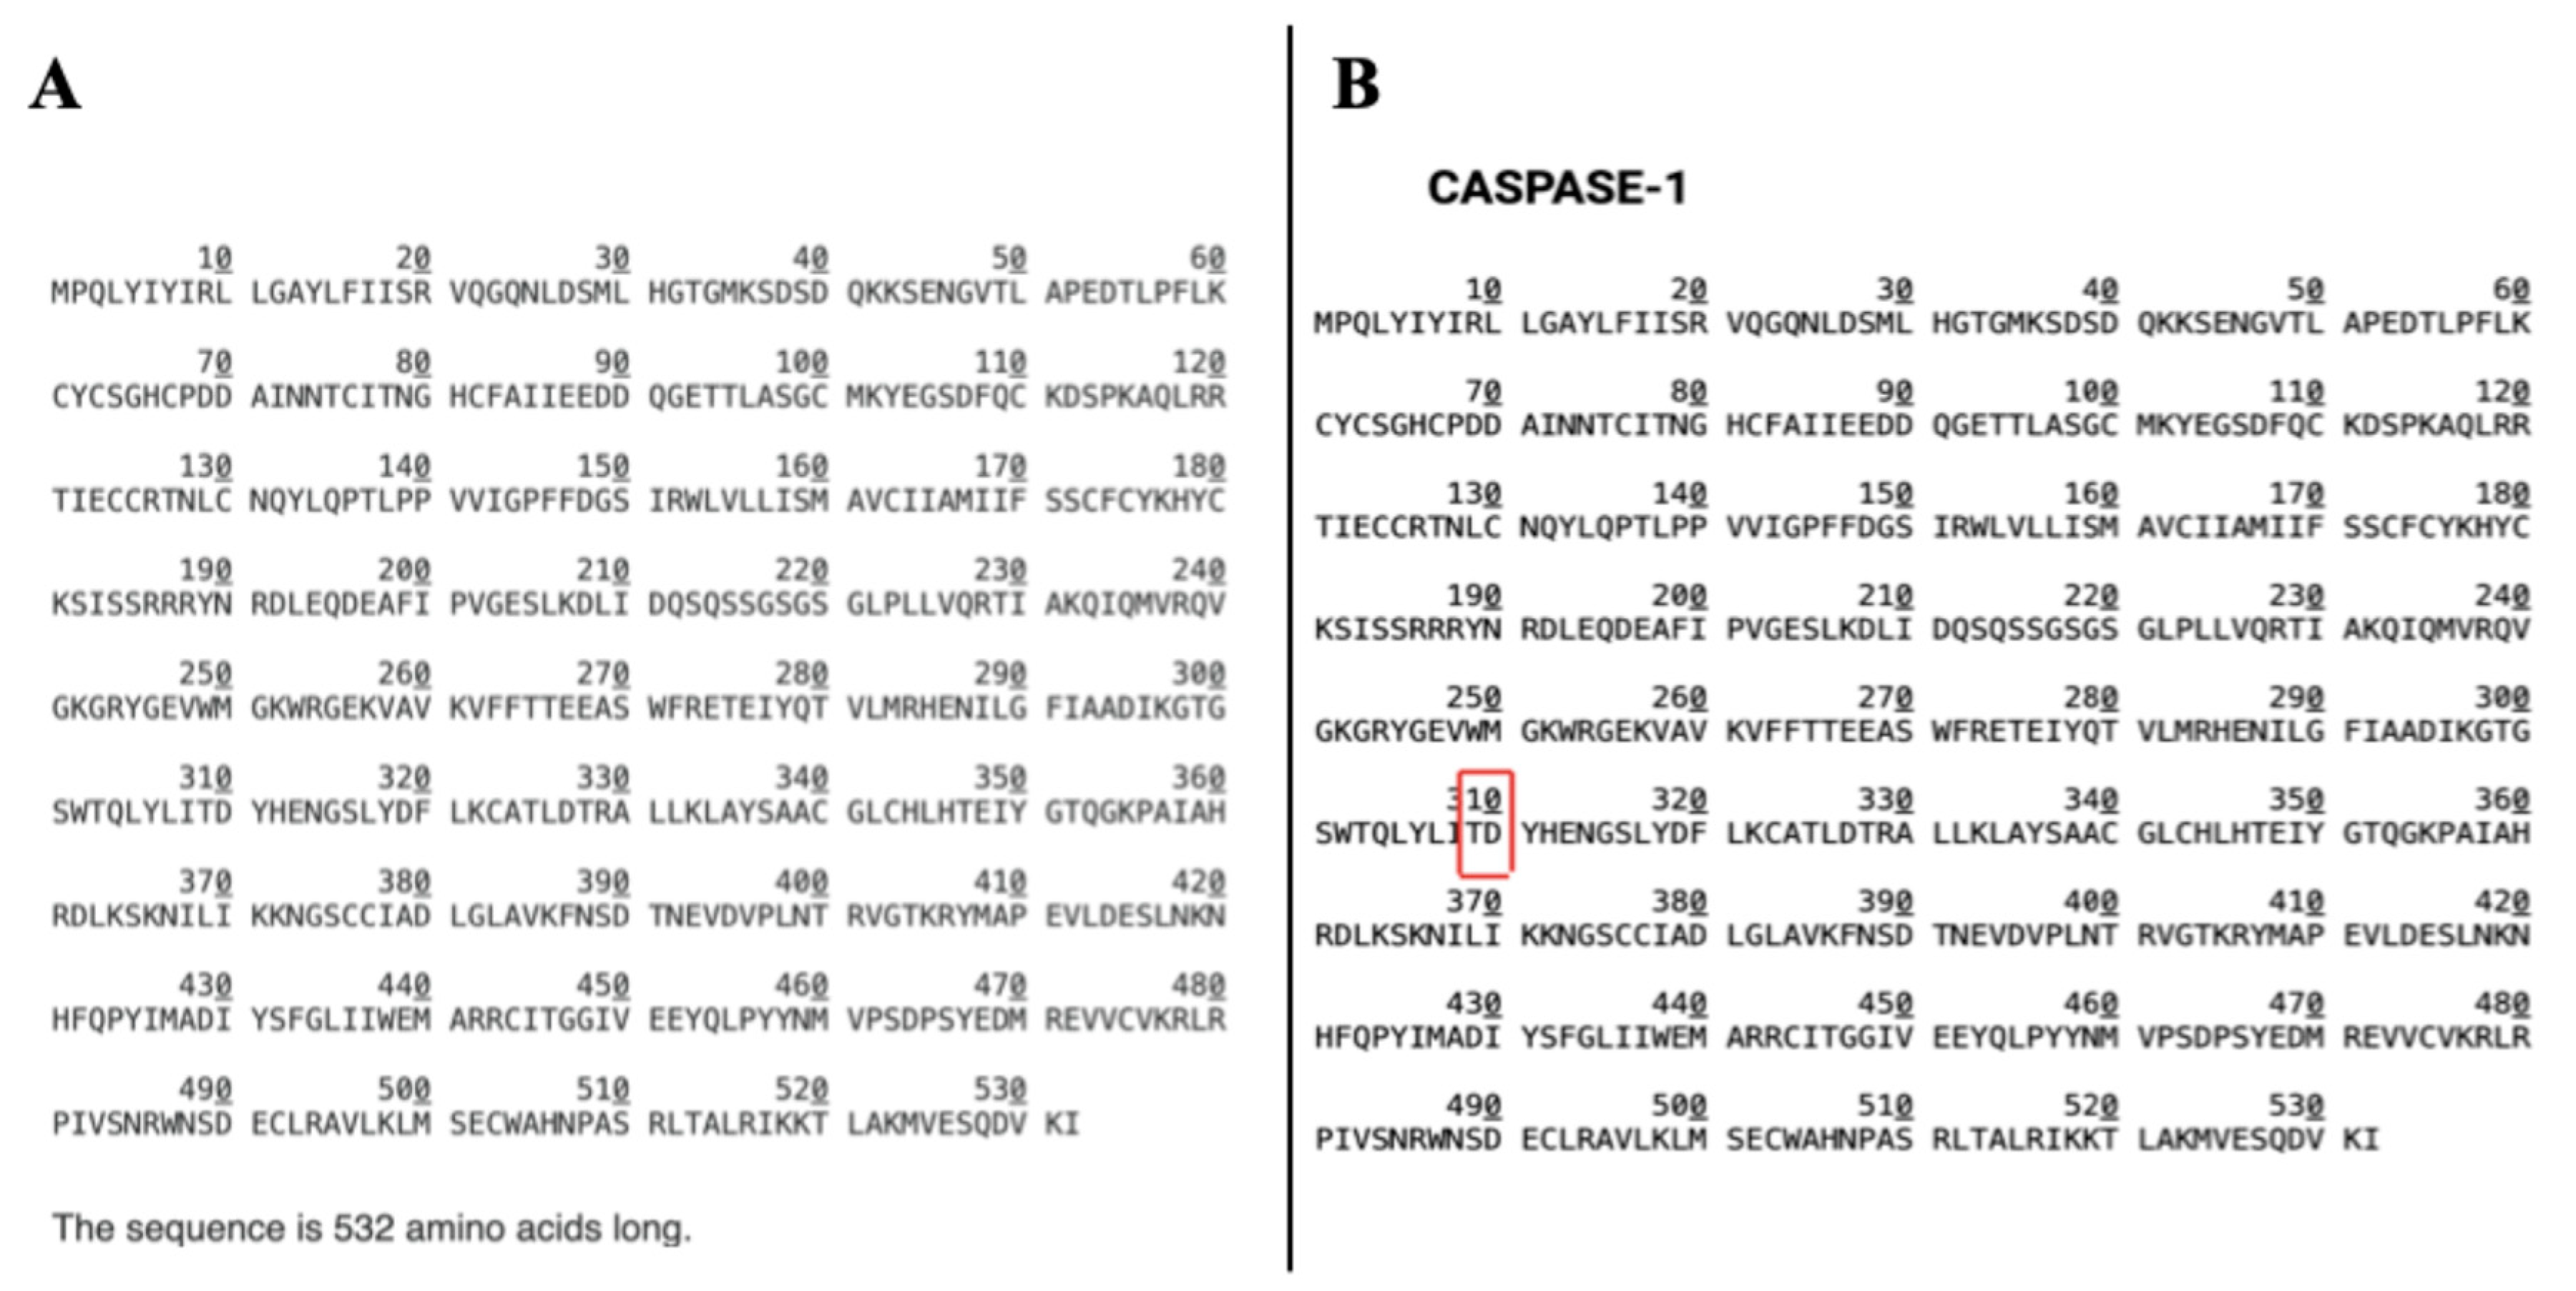
Figure 5.
BMP2 induced BMPRIa cleavage and inhibition of Caspase-1 abolished the cleavage in primary BMSC. Caspase-1 inhibition and BMPRIa cleavage in primary BMSCs from 6-month-old mice. Primary BMSCs were divided into two groups: one treated with a Caspase-1 inhibitor and the other untreated as described in the materials and methods section. Each group was further split and treated with BMP2 at concentrations of 0 nM, 40 nM, and 200 nM. Lysates were analyzed by SDS-PAGE and western blotting using an anti-BMPRIa antibody. In the absence of Caspase-1 inhibition, a BMPRIa band at 55 kDa and a cleavage band at 35 kDa were observed in the 40 and 200 nM BMP2 treatment groups. In the Caspase-1-inhibited group, the cleavage band had diminished intensity.
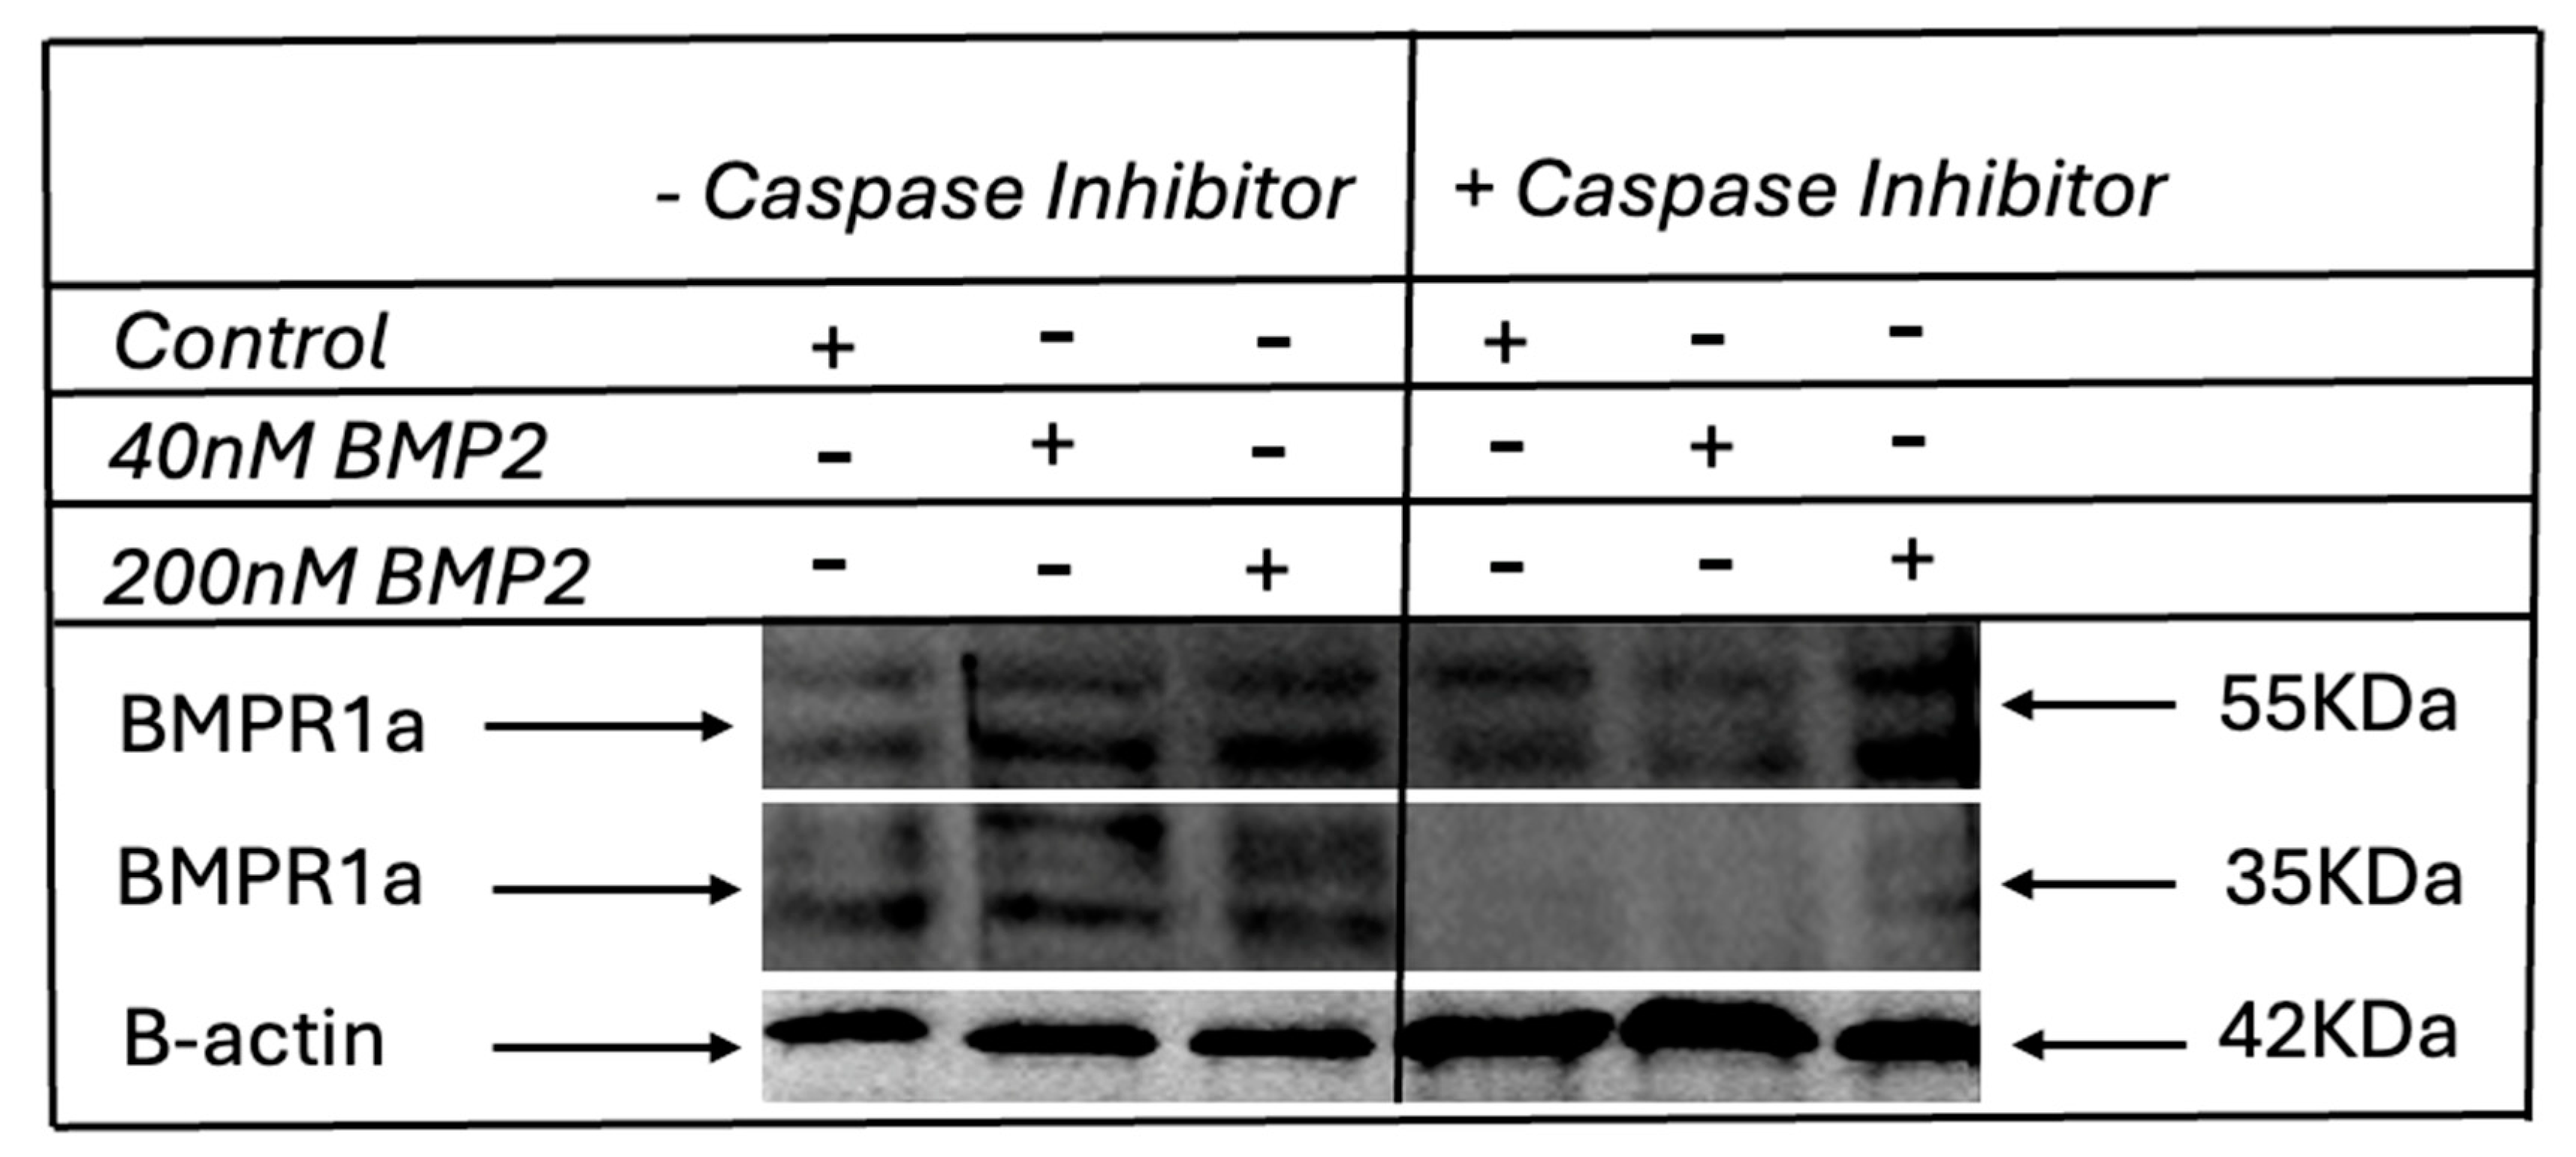
Figure 6.
Caspase-1 inhibition prevents the nuclear accumulation of BMPRIa in primary BMSCs. (A) Representative images showing primary BMSCs isolated from the femurs of 6-month-old C57BL/6 mice. Cells were treated with 12 μM of Caspase-1 inhibitor I (Ac-YVAD-CHO) for 24 hours prior to BMP2 stimulation at concentrations of 0, 40, and 200 nM. Immunofluorescence staining was performed using an anti-BMPRIa antibody. BMPRIa is colored red, and nuclei are stained with Hoechst dye (blue). Magnification is 63x; scale bars = 50 μm. (B) Higher resolution z-stack images in the orthogonal view from the control (0 nM BMP2), 40 nM BMP2, and 200 nM BMP2 groups, respectively. The orthogonal view provides slices of different regions of the cell to accurately display the localization of each stain. BMPRIa is observed predominantly around the cell membrane in all groups, indicating the absence of nuclear accumulation upon Caspase-1 inhibition. Scale bars = 10 μm.
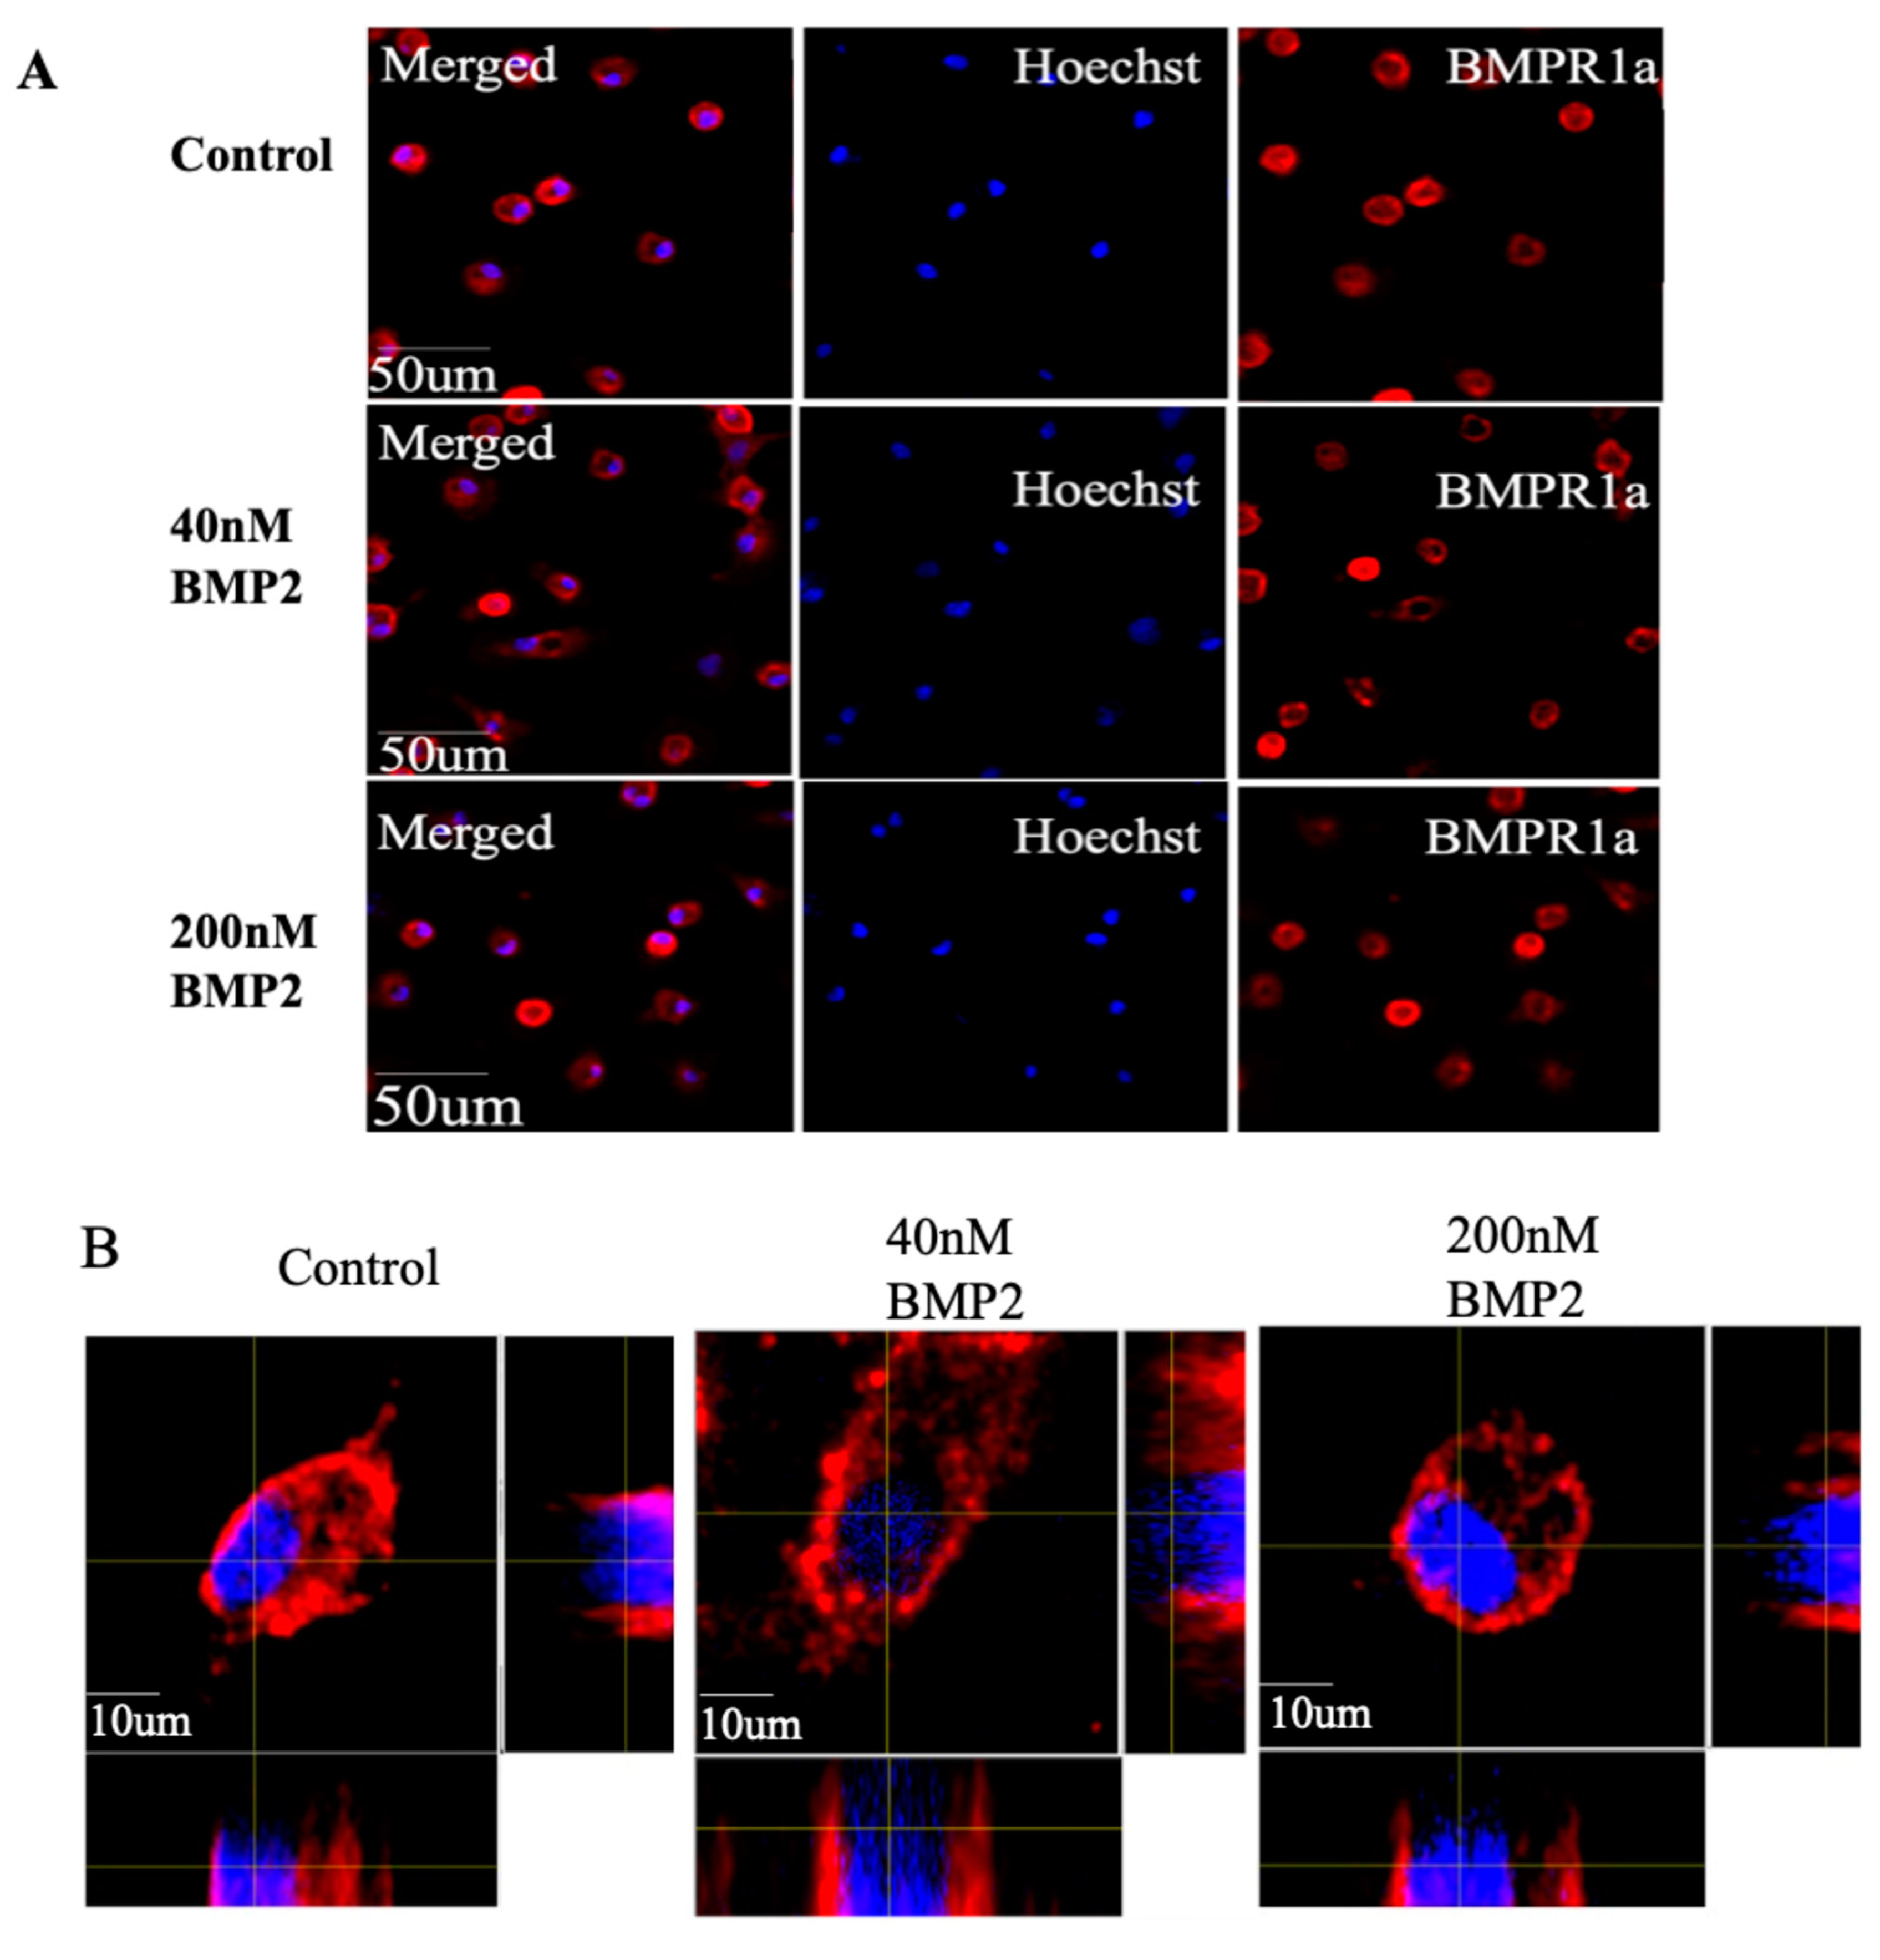
Figure 7.
Caspase-1 inhibition leads to a reduction in PPARγexpression in BMSCs. (A) Primary BMSCs isolated from the femurs of 6-month-old C57BL/6 mice. Cells were treated with 12 μM of Caspase-1 inhibitor I (Ac-YVAD-CHO) for 24 hours before BMP2 stimulation at concentrations of 0, 40, and 200 nM. Plot showing the percentage of cells expressing PPARγ across the treatment groups (0, 40, 200 nM BMP2). Each bar represents the percentage of PPARγ-expressing cells from five random images taken with a confocal microscope and analyzed using ImageJ software. An average of 140 cells per treatment group were analyzed in three different experiments (n=3), with a total of 420 cells analyzed. The results indicate a significant reduction in PPARγ expression in the Caspase-1-inhibited group compared to the uninhibited group, with over ~50% reduction in the 200 nM BMP2 group and ~38% reduction in the 40 nM BMP2 group. Error bars represent SD (*p<0.05). (B) Plot showing the percentage of cells not expressing PPARγ in the treatment groups (0, 40, 200 nM BMP2). Each bar represents the percentage of non-PPARγ-expressing cells from five random images analyzed using ImageJ software. An average of 140 cells per treatment group were analyzed in three different experiments, with a total of 420 cells analyzed. The results further support the finding that Caspase-1 inhibition reduces PPARγ expression. Error bars represent SD (*p<0.05). (C) Bar graph comparing the percentages of PPARγ-positive cells across the treatment groups (0, 40, 200 nM BMP2) in Caspase-1 inhibited (orange bars) and uninhibited (blue bars) groups. Each bar represents the percentage of PPARγ-expressing cells from five random images taken with a confocal microscope and analyzed using ImageJ software. An average of 140 cells per treatment group were analyzed in three different experiments (n=3), with a total of 420 cells analyzed. The results indicate a significant reduction of over 50% in PPARγ expression upon Caspase-1 inhibition in the 200 nM BMP2 treatment group. Error bars represent SD (*p<0.05). (D) Bar graph comparing the percentages of PPARγ-negative cells across the treatment groups (0, 40, 200 nM BMP2) in both Caspase-1 inhibited (orange bars) and uninhibited (blue bars) groups. Each bar represents the percentage of non-PPARγ-expressing cells from five random images analyzed using ImageJ software. An average of 140 cells per treatment group were analyzed in three different experiments, with a total of 420 cells analyzed. The results further support the finding that Caspase-1 inhibition significantly reduces PPARγ expression with an increase in the number of PPARγ negative cells. Error bars represent SD (*p<0.05). (E) Immunofluorescence staining using an anti-PPARγ antibody. Representative images are shown, PPARγ is colored green, and nuclei are stained with Hoechst dye (blue). Magnification is 63x; scale bars = 50 μm. (F) Higher resolution z-stack images in the orthogonal view from the control, 40 and 200 nM groups, respectively. The orthogonal view creates slices of different regions of the cell for proper display of the localization of each stain. PPARγ expression was observed to be more cytoplasmic than the nuclear localization observed in the uninhibited group. Scale bars = 10 μm.
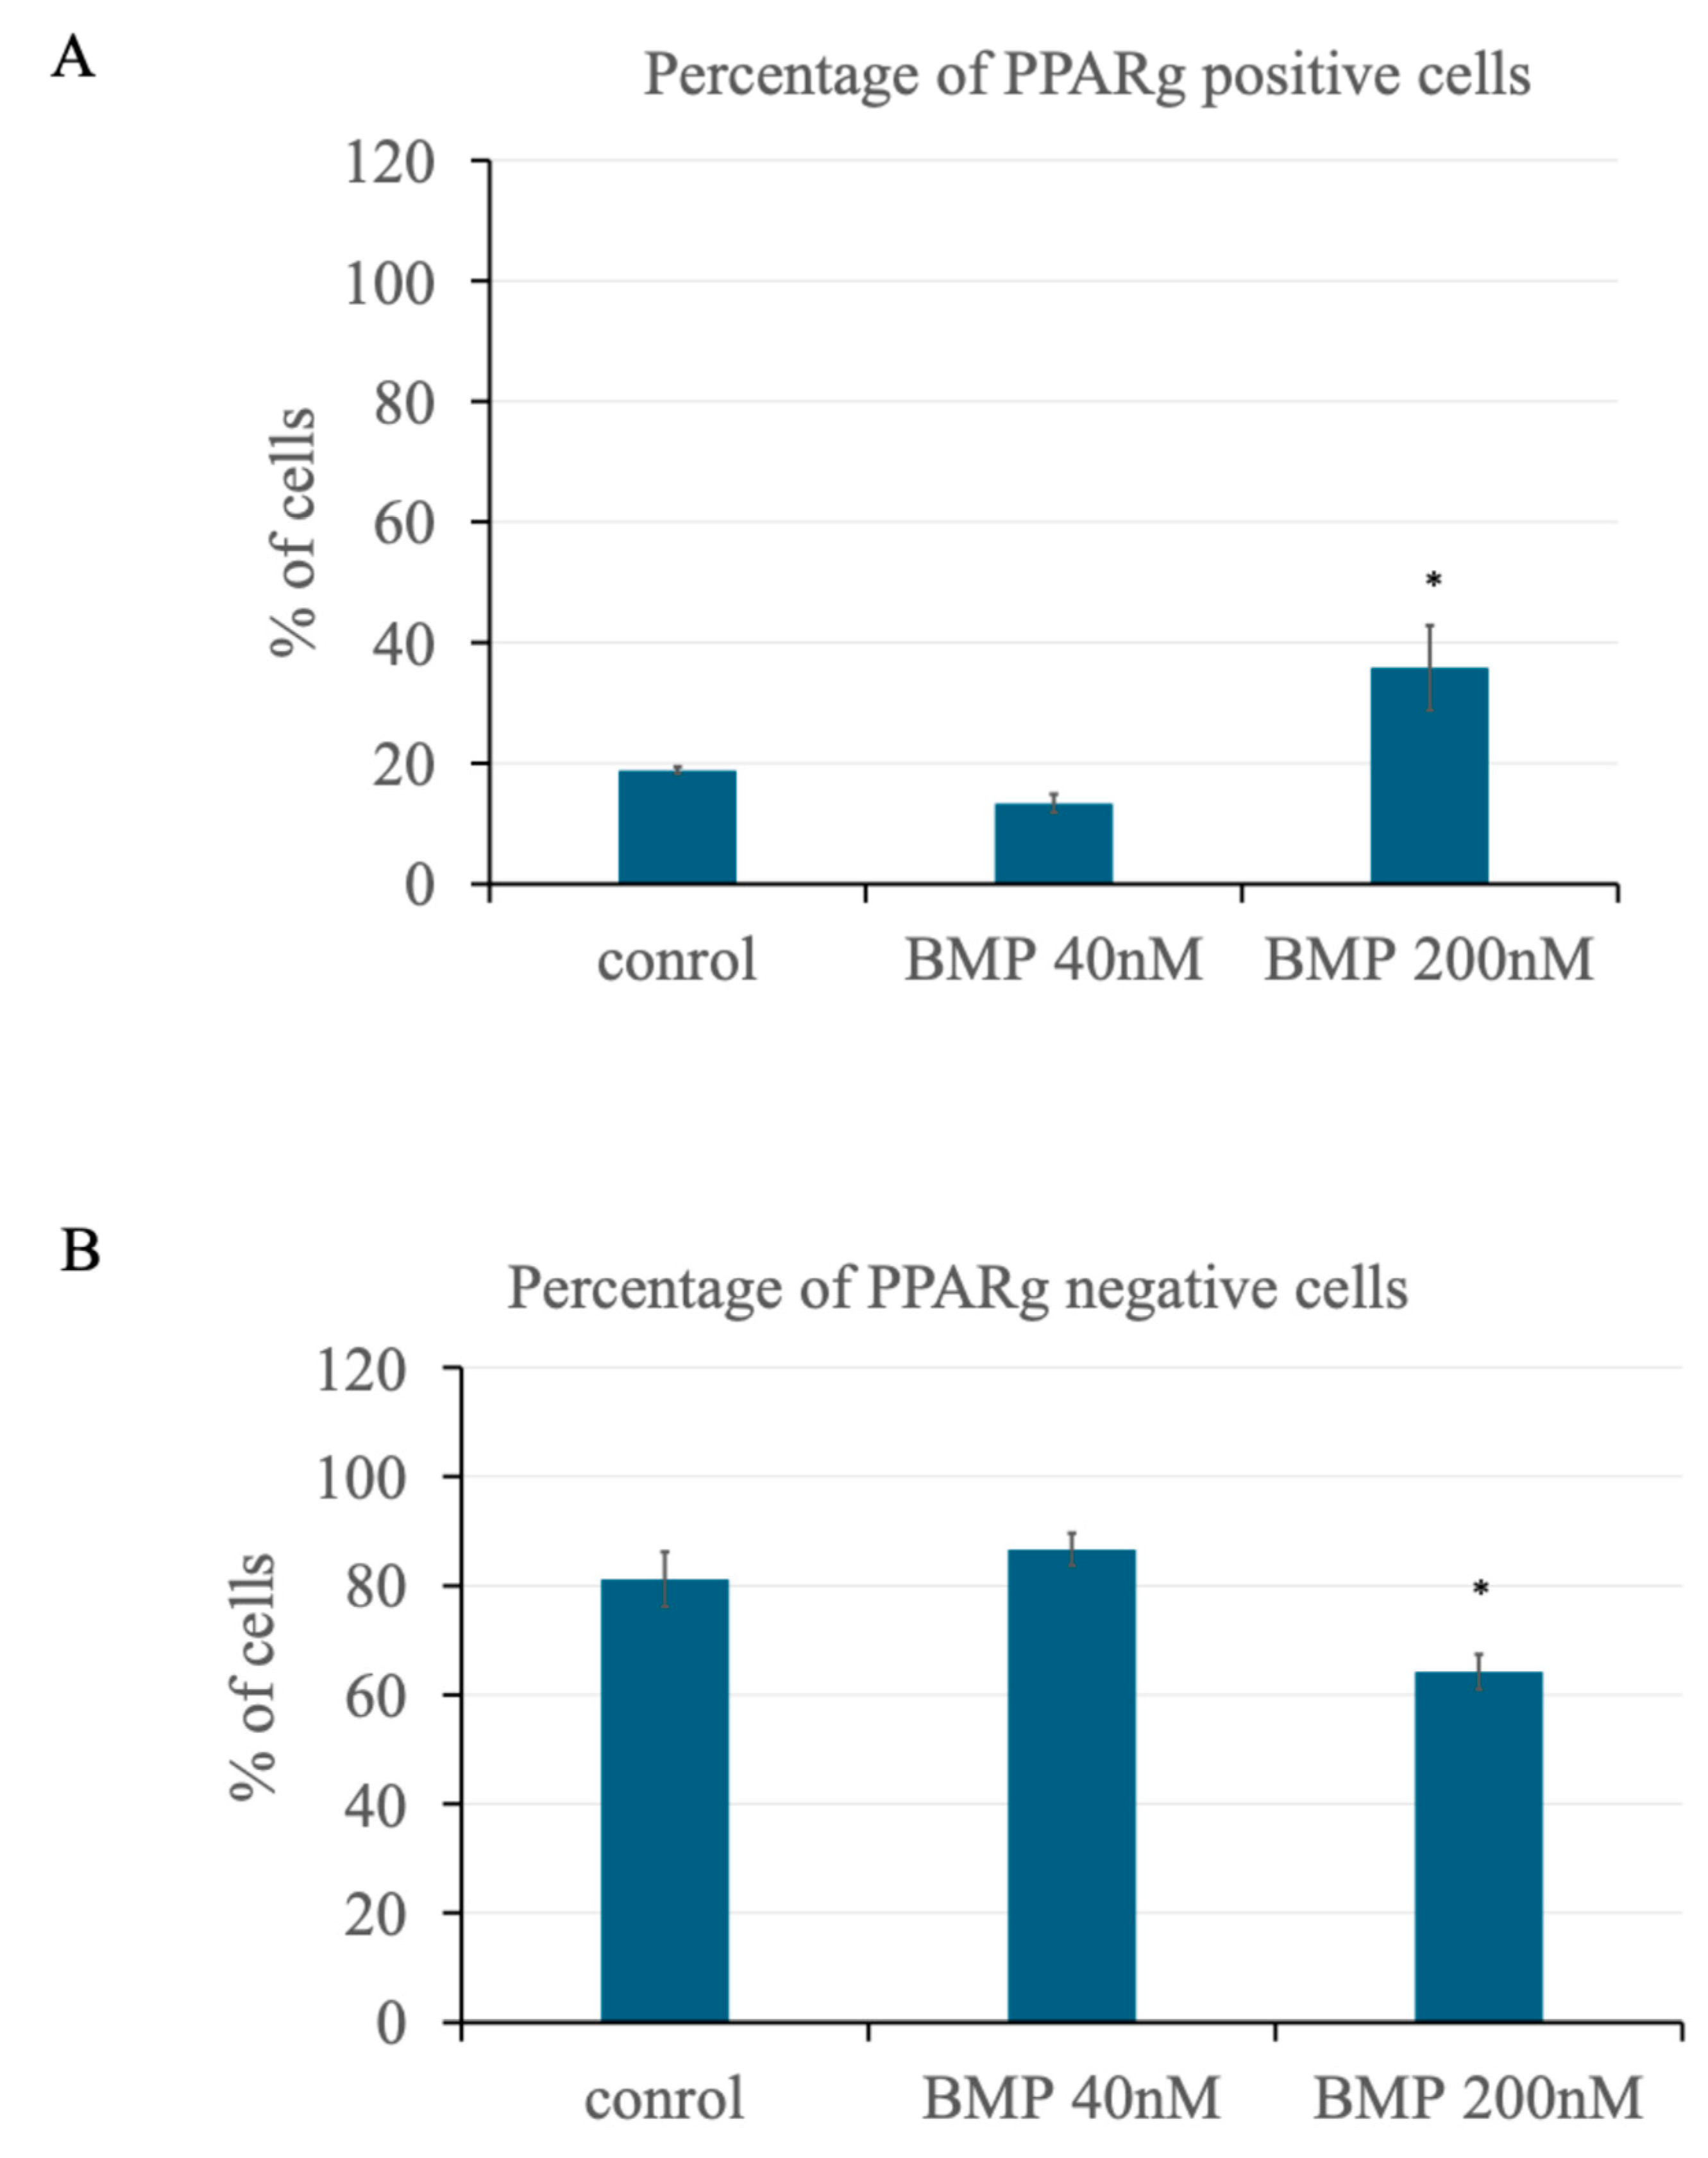
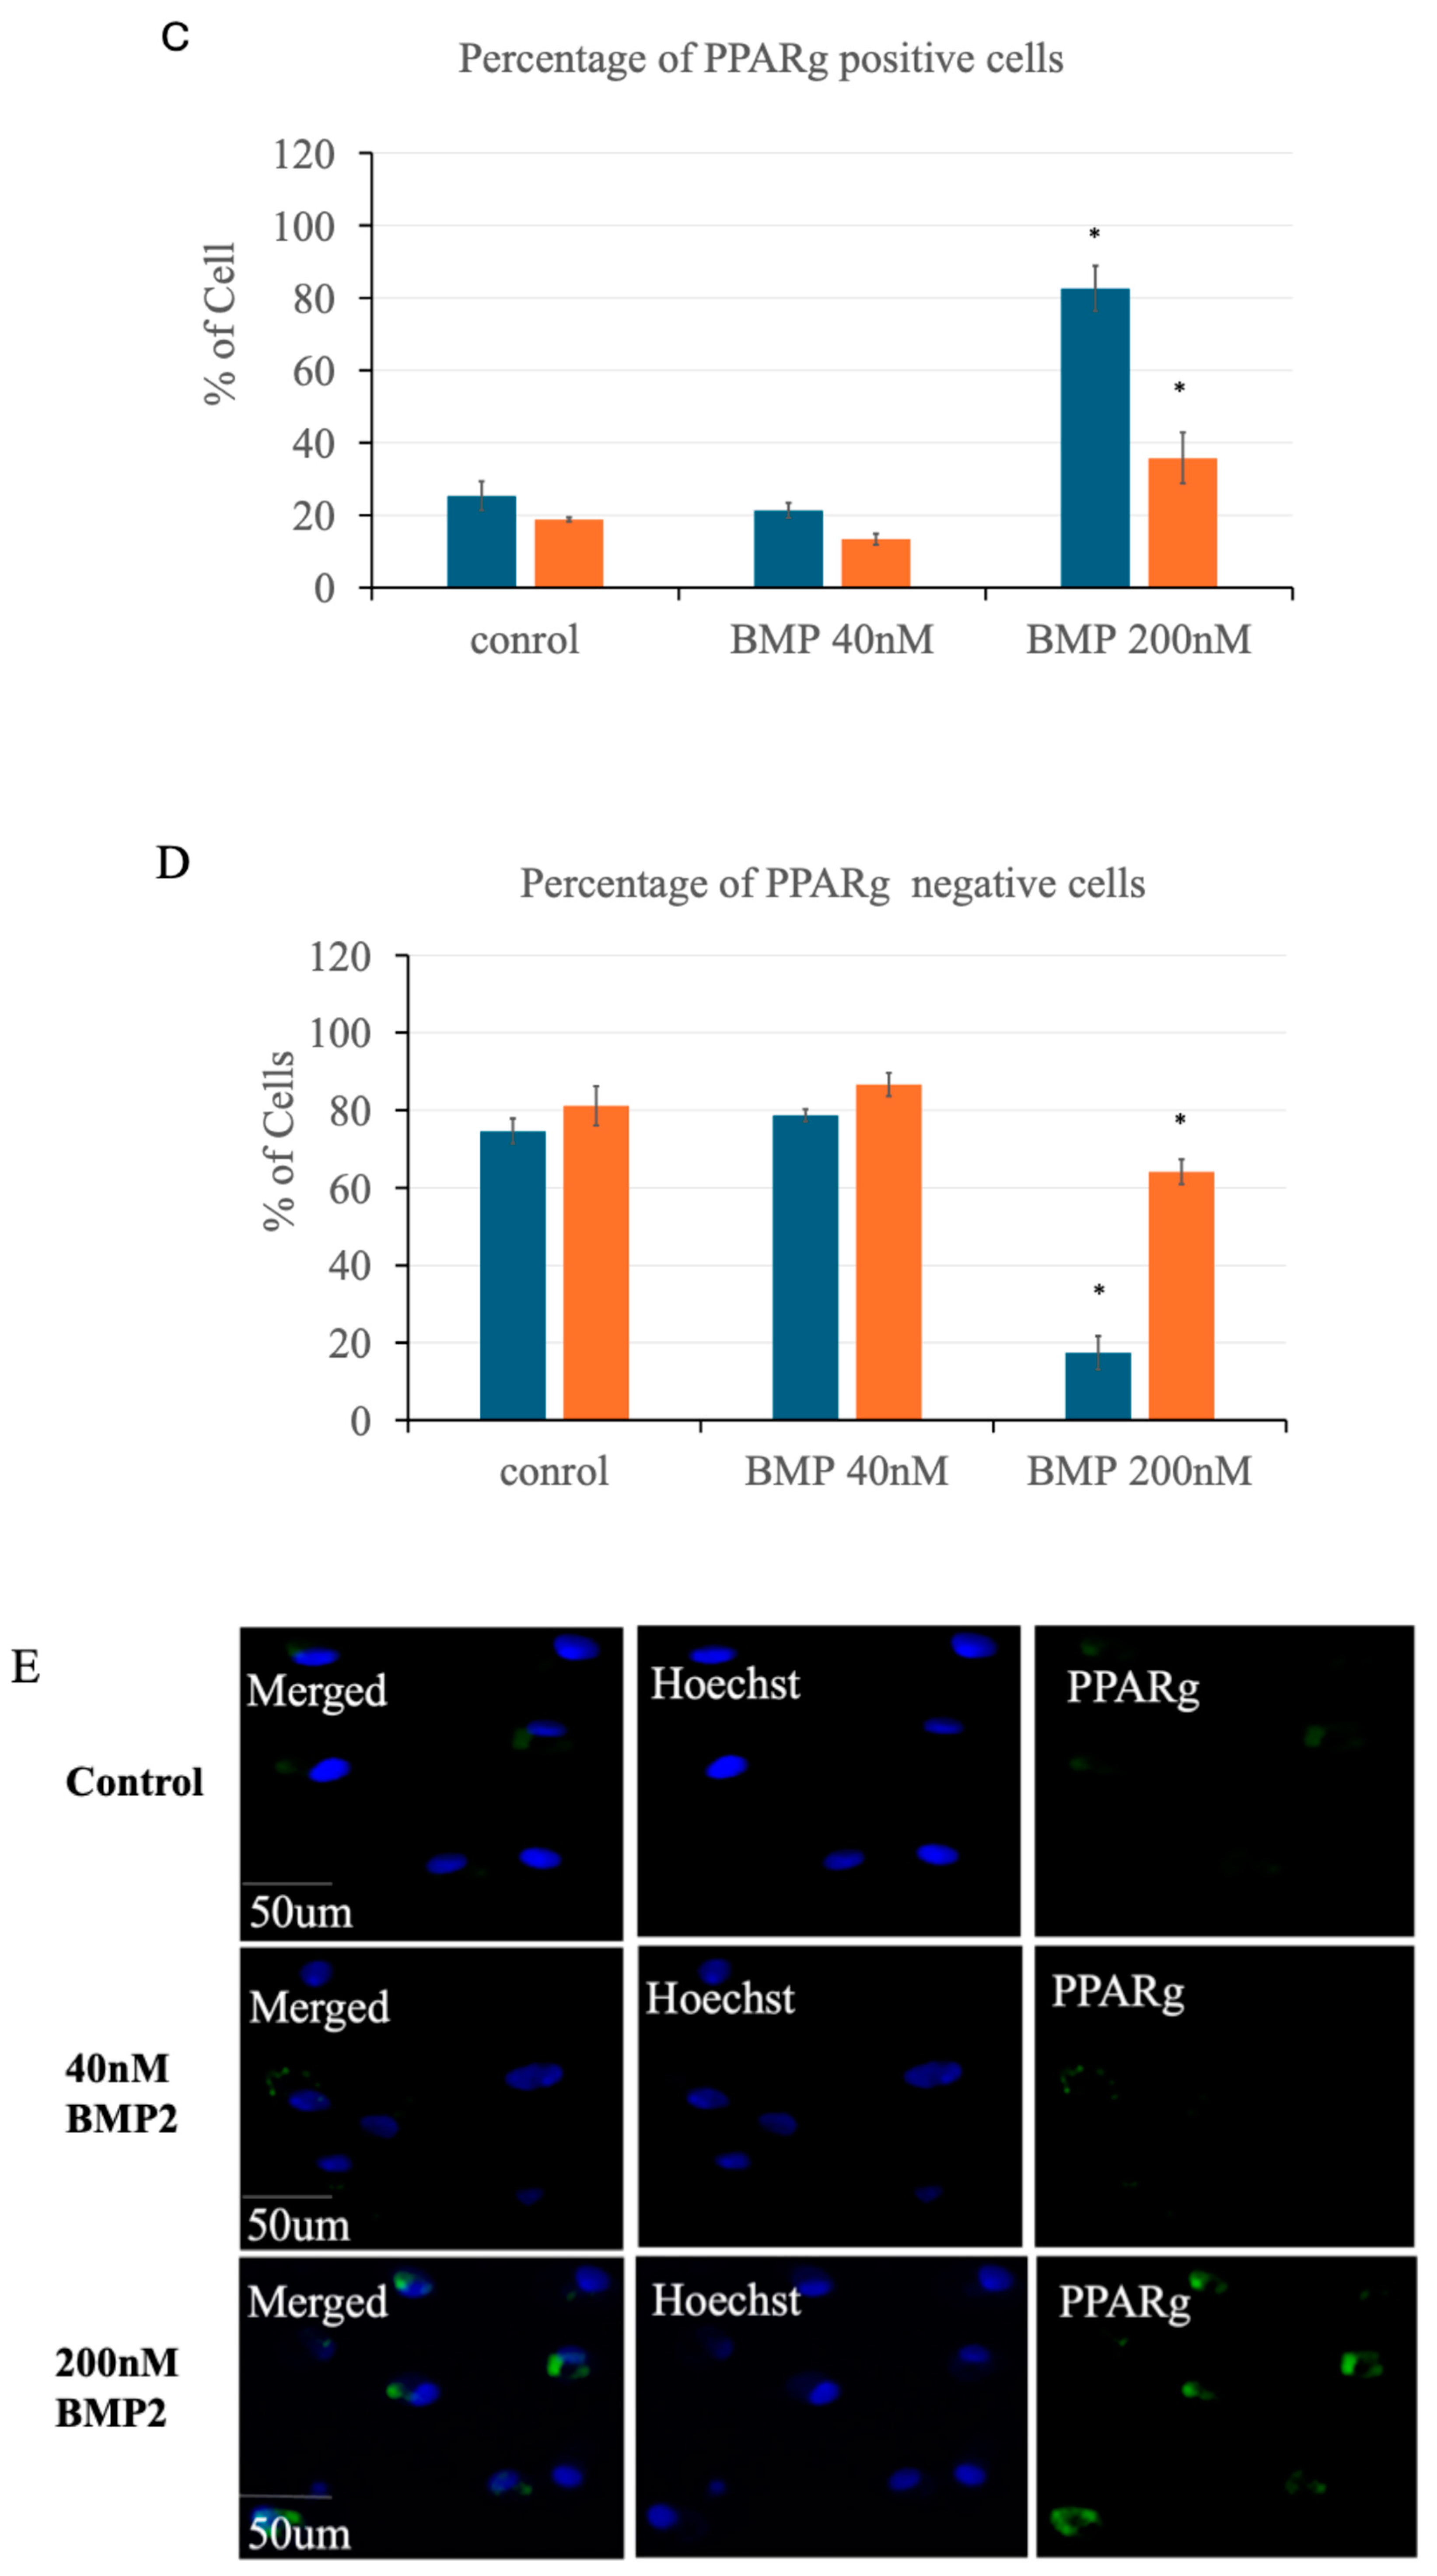
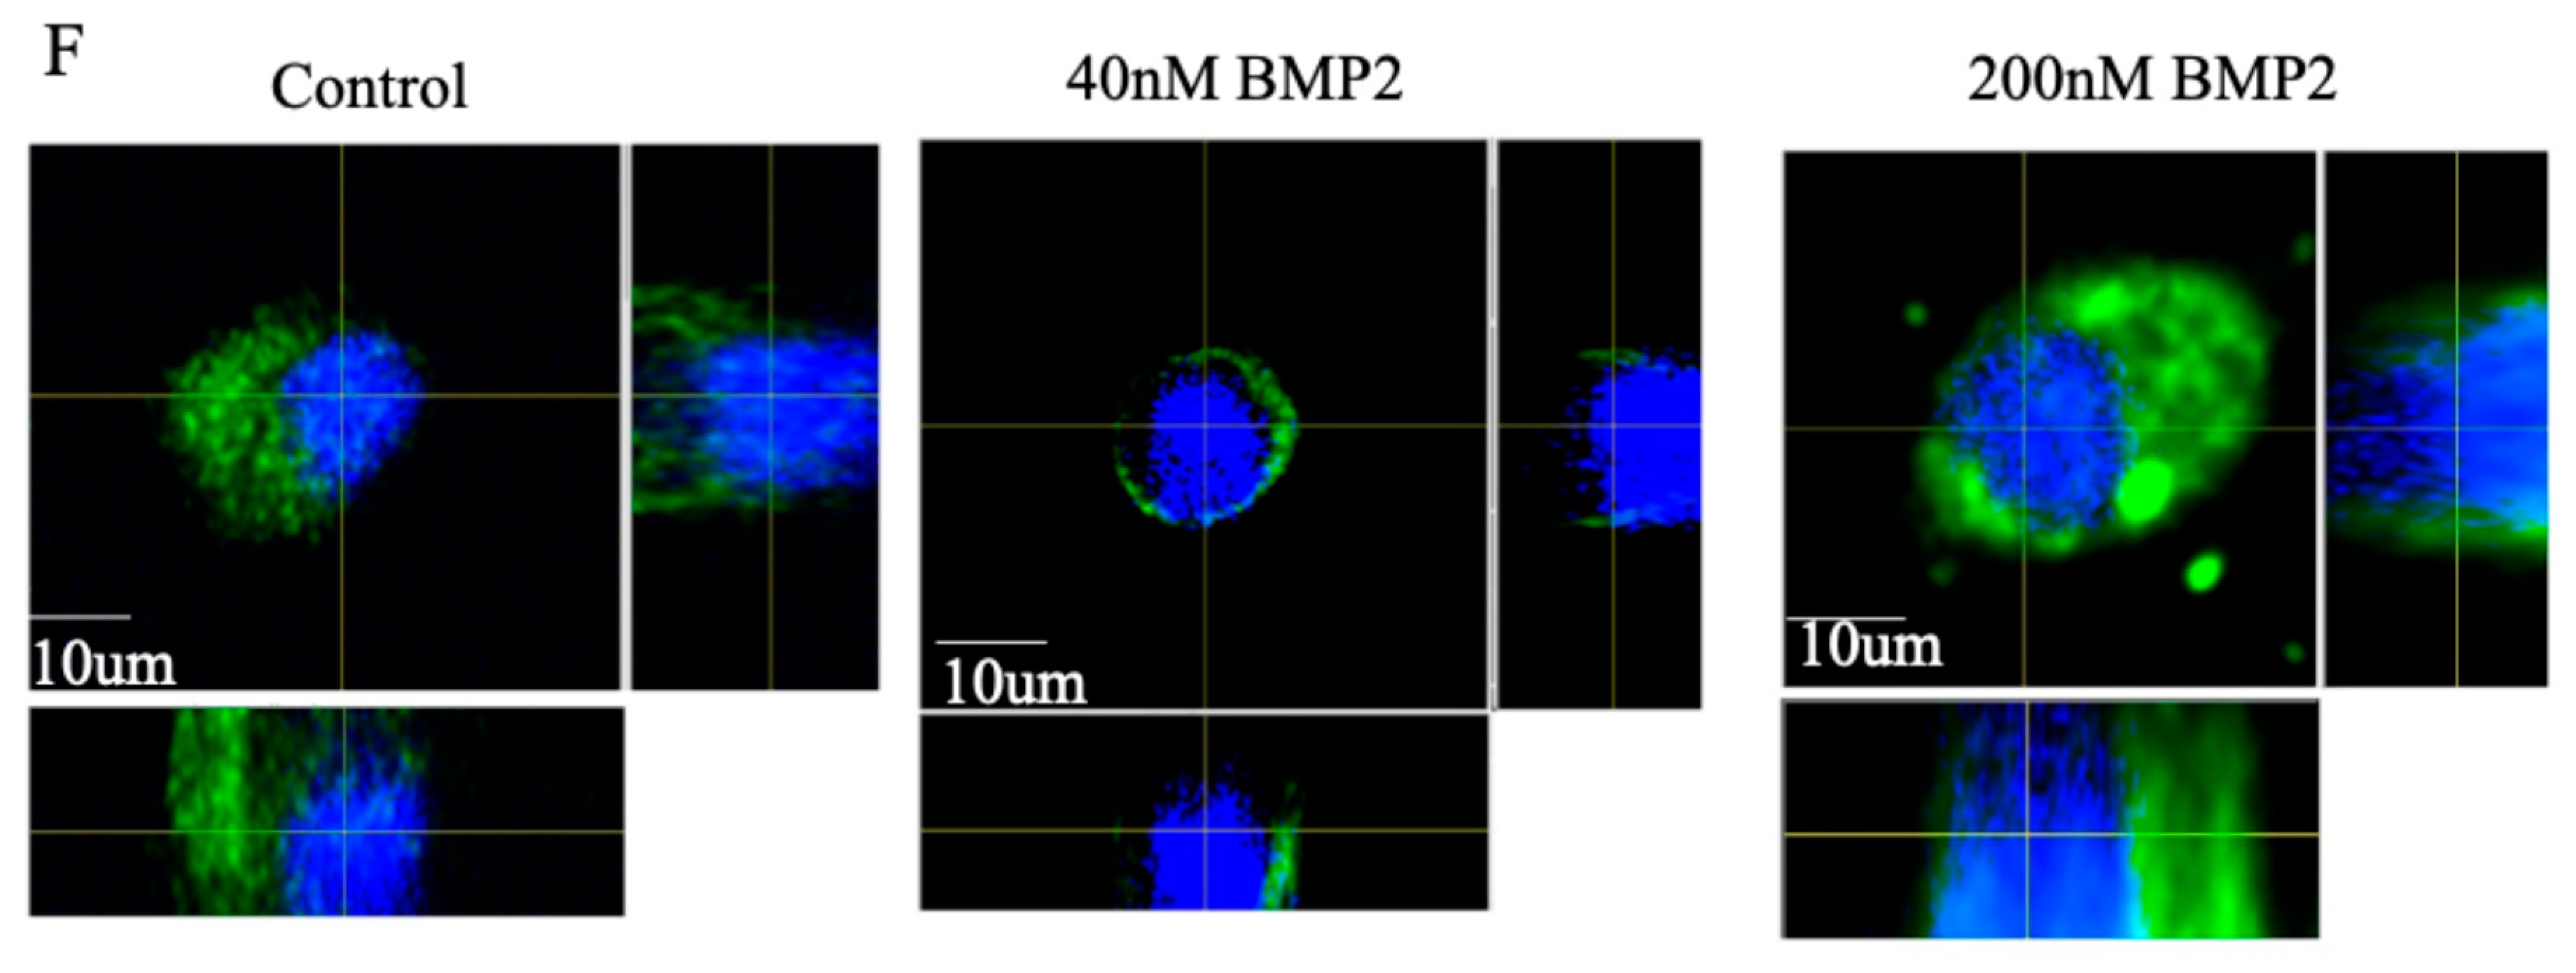
Figure 8.
High BMP2 concentration induces adipogenesis and Caspase-1 inhibition leads to the reduction. Quantitative analysis of Oil Red O staining demonstrating the effect of BMP2 on adipogenesis in BMSCs. Representative images are shown, cells treated with 200 nM BMP2 exhibited a significant increase of over ~60% in the area covered by mature lipid droplets compared to the control and 40 nM BMP2 groups, indicating enhanced adipogenesis. In the Caspase-1 inhibited group, the area covered by lipid droplets in the 200 nM BMP2-treated group decreased from about 65% to 13%, indicating a significant reduction in adipogenesis. These results highlight the crucial role of Caspase-1 in BMP2-induced adipogenic differentiation. Error bars represent SD (*p<0.05).
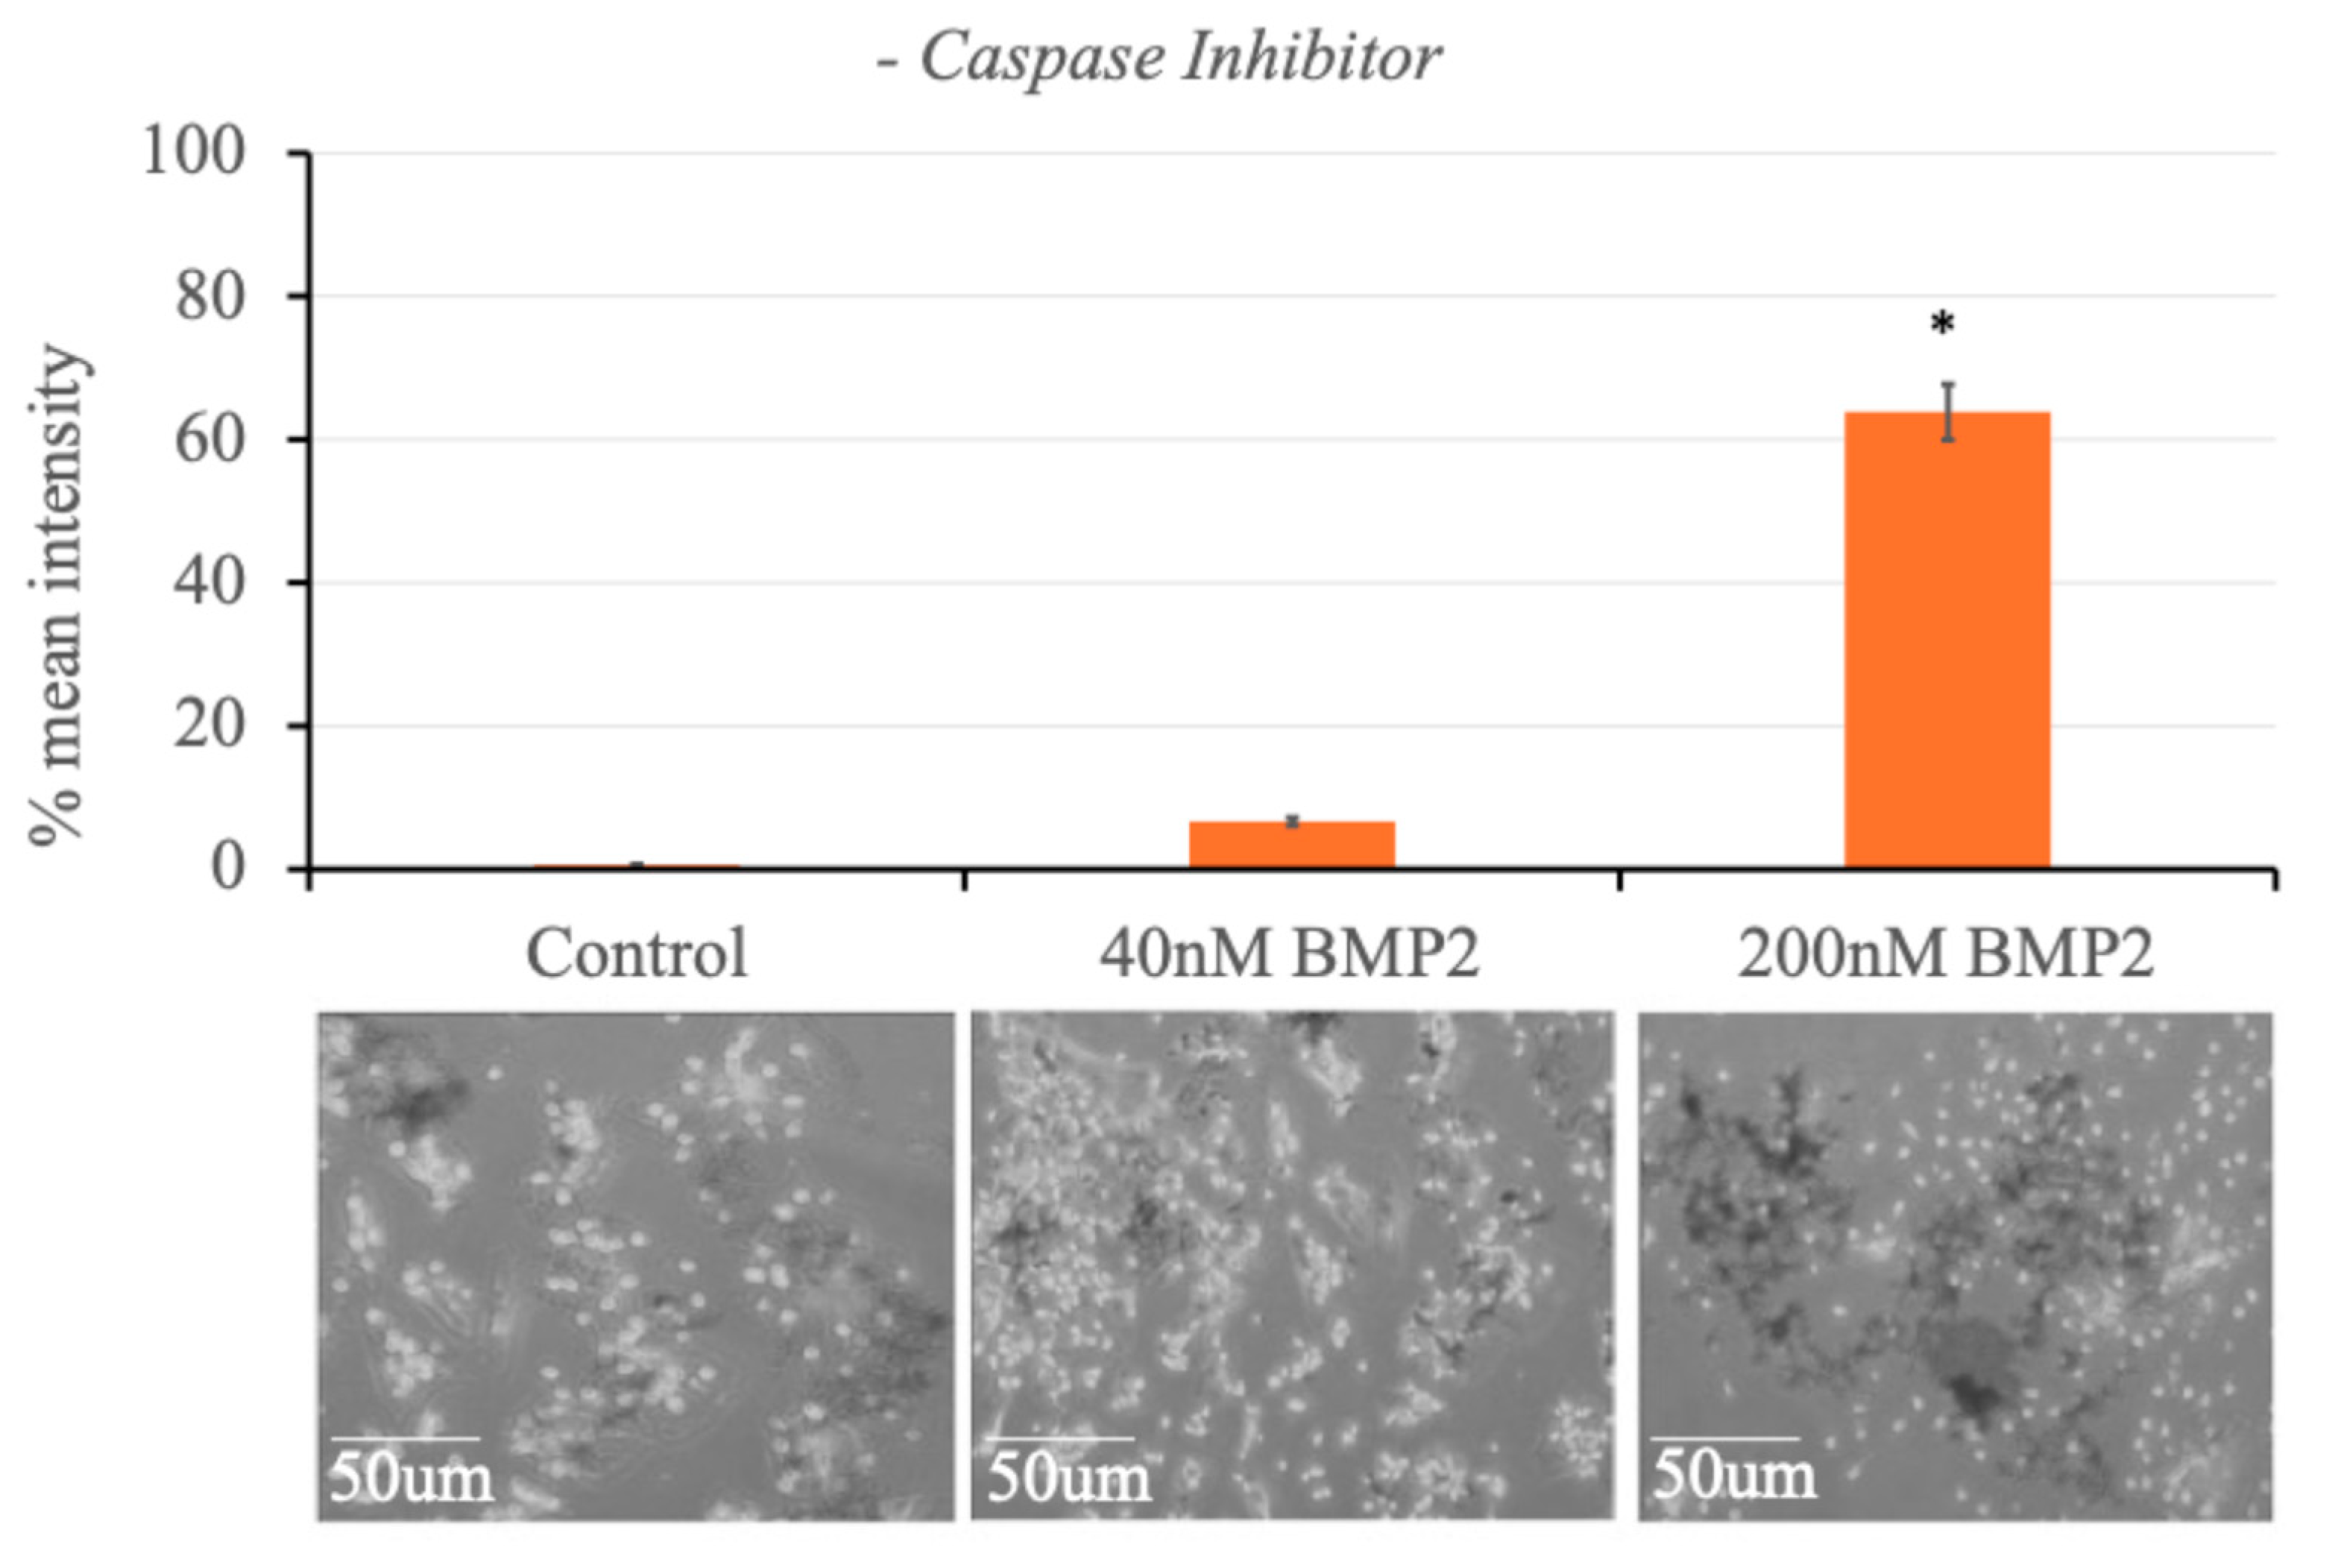
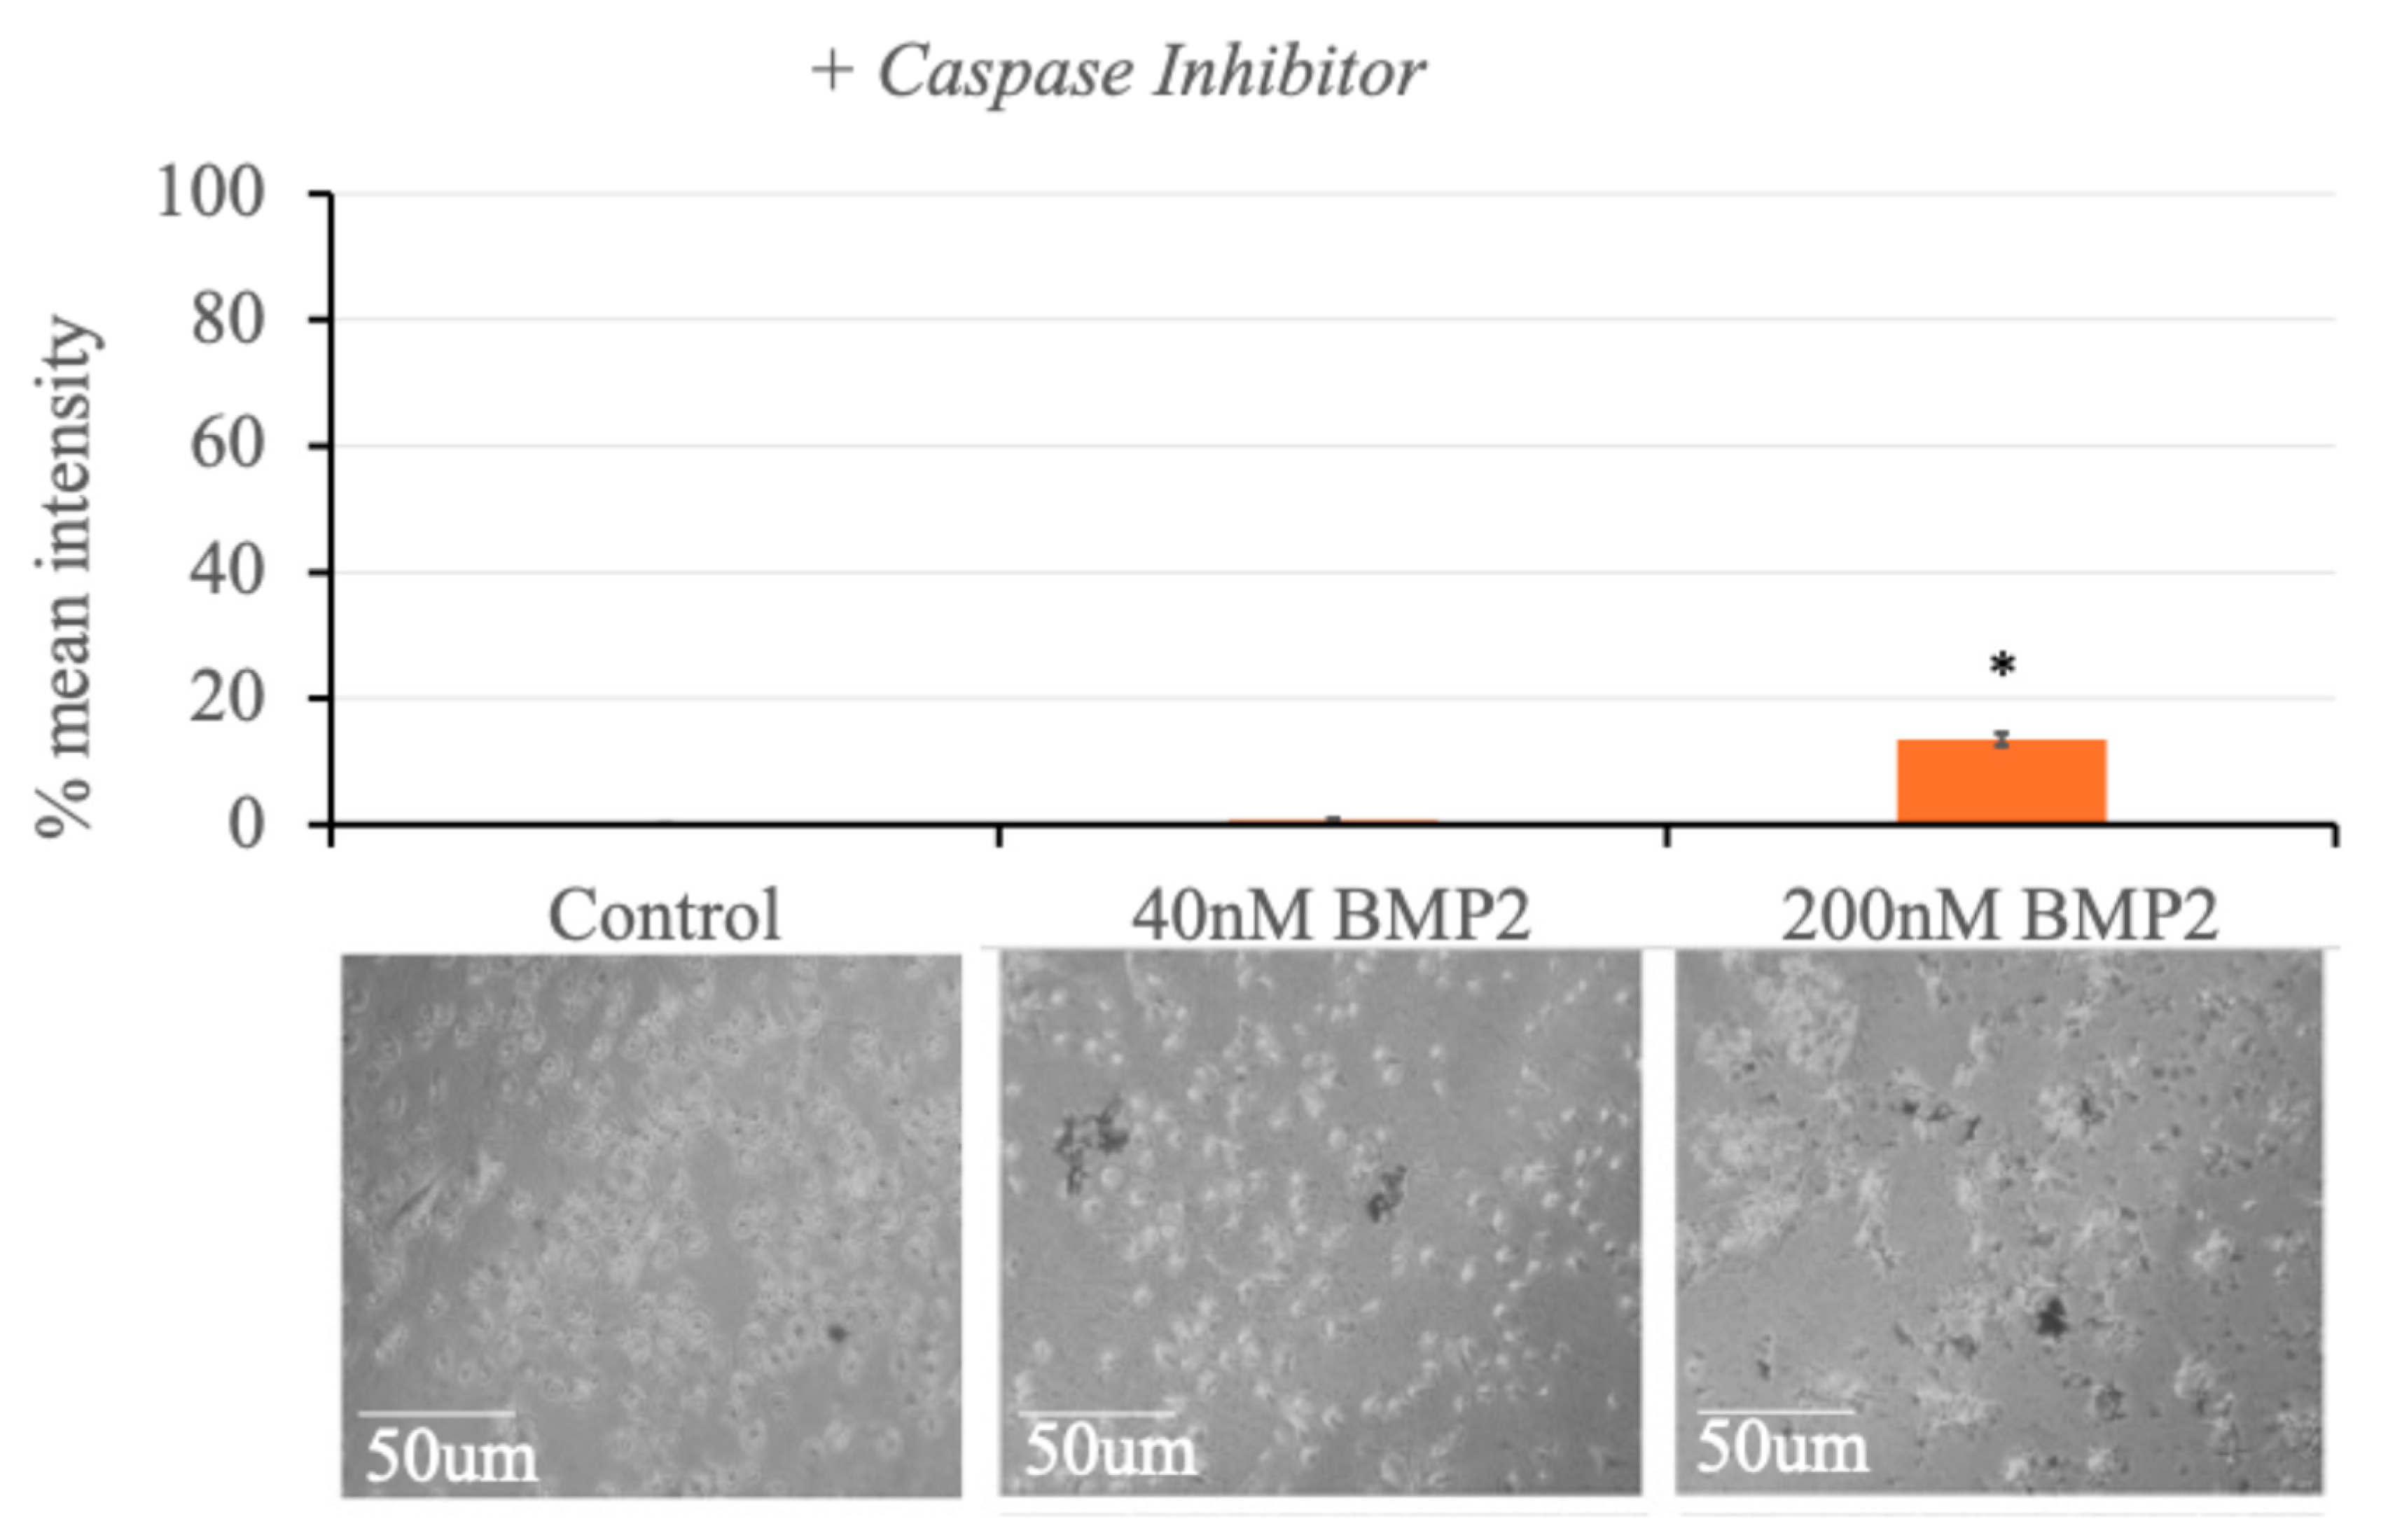
Disclaimer/Publisher’s Note: The statements, opinions and data contained in all publications are solely those of the individual author(s) and contributor(s) and not of MDPI and/or the editor(s). MDPI and/or the editor(s) disclaim responsibility for any injury to people or property resulting from any ideas, methods, instructions or products referred to in the content. |
© 2025 by the authors. Licensee MDPI, Basel, Switzerland. This article is an open access article distributed under the terms and conditions of the Creative Commons Attribution (CC BY) license (http://creativecommons.org/licenses/by/4.0/).
Copyright: This open access article is published under a Creative Commons CC BY 4.0 license, which permit the free download, distribution, and reuse, provided that the author and preprint are cited in any reuse.


