Submitted:
12 April 2025
Posted:
14 April 2025
Read the latest preprint version here
Abstract
Background: Carpal Tunnel Syndrome (CTS) is a prevalent neuropathy often requiring invasive diagnostic methods. This study explores the use of the New Energy Vision (NEV) camera, a non-invasive imaging tool, to detect CTS by analyzing visible light images of the hand. Objectives: To evaluate the diagnostic accuracy of the NEV camera in distinguishing CTS patients from controls and to identify image features associated with nerve damage. Methods: In a two-part study, Part 1 involved 103 participants (50 controls, 53 CTS patients) imaged with the NEV camera. Features extracted from these images were used to train a Support Vector Machine (SVM) classifier. Part 2 included 32 CTS patients with images from median nerve-damaged (MED) and ulnar nerve-normal (ULN) palm areas compared. Clinical validations included nerve conduction tests and questionnaires. Results: The SVM classifier achieved 93.33% accuracy with a confusion matrix of [[14, 1], [1, 14]] at a decision threshold of 0.7. Cross-validation showed a mean accuracy of 81.79%. In Part 2, significant differences (p < 0.05) were found in color proportions and Haralick texture features between MED and ULN areas. Conclusions: The NEV camera, combined with machine learning, demonstrates high accuracy in diagnosing CTS and reveals distinct image features linked to nerve damage, suggesting its potential as a non-invasive diagnostic tool.
Keywords:
Carpal Tunnel Syndrome
; NEV camera
; machine learning
; non-invasive diagn
; image analysis
; Boston carpal tunnel questionnaire
; ultra-weak photon emission
Introduction
Carpal Tunnel Syndrome (CTS) is a prevalent entrapment neuropathy, affecting 3–6% of adults, with higher rates among women and those in repetitive hand-intensive jobs. It involves median nerve compression, leading to symptoms like pain, numbness, and weakness, which can impair function if untreated. Traditional diagnostics, such as nerve conduction studies (NCS) and ultrasonography, have limitations including invasiveness and variable sensitivity, prompting the need for innovative, non-invasive methods.
Recent imaging advancements, like infrared thermography and AI-enhanced ultrasound[1], have shown promise, but a gap remains for point-of-care tools combining structural and functional assessments[2]. The human body generates weak magneto-electric fields from ionic currents during nerve signaling, measurable by sensitive technologies like superconducting quantum interference devices (SQUIDs)[3]. Research suggests these biofields may correlate with neuropathies, offering a novel diagnostic avenue[4].
This study investigates the NEV camera[5], a specialized device capturing visible light images with enhanced sensitivity to tissue properties, for CTS diagnosis. It hypothesizes that magneto-electric field alterations can serve as a biomarker, complementing existing tools, and presents preliminary findings on its diagnostic performance.
Materials and Methods
The observational study, approved by the institutional review board with informed consent, was conducted in two parts. Part 1 involved 103 subjects (Table 1): 50 controls with non-traumatic, non-septic hand pathologies (e.g., tendinopathy, trigger fingers, osteoarthritis etc.) and 53 CTS patients, diagnosed by clinical findings, positive Semmes-Weinstein monofilament testing (SWMT)[6], Phalen’s test, and NCT (distal motor latency, DMLMN > 4 ms, sensory median nerve velocity greater than 50m/s)[6,7]. Controls had normal NCT and negative Phalen’s test, with no CTS complaints per BCTQ[8]. Inclusion criteria required participants over 18, capable of consenting; exclusions included recent trauma, septic hands, ulnar/radial nerve damage, generalized neuropathy, or central nervous system diseases.

Table 1.
Demographic Data of Training Cohort-Part 1
Part 2 included 32 CTS patients with normal ulnar nerve function (confirmed clinically with SWMT, and by NCT at Guyon’s canal) and abnormal median nerve function (positive SWMT, Phalen’s test, DMLMN > 4 ms), comparing median-innervated (MED, abnormal) and ulnar-innervated (ULN, normal) palm areas to assess nerve damage effects (Table 2). This part represents same palm assessment to attempt to distinguish normally innervated skin from abnormally innervated skin.
Table 2.
Demographic Characteristics of Participants in the Median Nerve Region Vs Ulnar Nerve Imaging Study-Part 2
Table 2.
Demographic Characteristics of Participants in the Median Nerve Region Vs Ulnar Nerve Imaging Study-Part 2
Clinical evaluation included SWMT (thresholds: ≤2.83 normal, ≥3.84 diminished light touch, indicative of CTS) and Phalen’s test (positive if symptoms reproduced in 60 seconds). NCT measured DMLMN (>4 ms for CTS) and sensory conduction speed (<50 m/s for CTS). Ultrasound used the Clarius system[9]. There is wide variation in what individual laboratories consider to be the upper limit of normal for a CSA measurement, ranging from 6.5 to 14 mmsq. This variation probably reflects the many different transducers and measuring methods and for the present at least every laboratory has to establish its own normal range for the method and equipment it is using. In the Clarius system we chose a CSA cut-off of 10.5 mm² for CTS diagnosis, guided by prior experience and having a a sensitivity of 81% and specificity of 95% for this method of imaging[10]. The NEV camera, operating in visible light, captured hand images 5 cm above the palm in a controlled environment (steel-reinforced room to prevent electrical interference, temperature controlled at 19°C, 20% humidity, constant lighting 824 Lux, 6350 Kelvin color temperature (Figure 1)), focusing on the central 50% ROI. The palm position was in neutral position and flat against a matte colored non-reflective hard surface, as palm position affects carpal tunnel pressure[11] (Figure 2). The
Each image yielded a 738-dimensional feature vector, including color histograms (hue, saturation, value), local binary patterns (LBP), Haralick texture features, color proportions, and border features like edge density. The SVM classifier (linear kernel, balanced weighting) was evaluated on 70% training, 30% test sets, optimizing thresholds (0.5–1.0), with cross-validation (5-fold). Part 2 compared MED vs. ULN (Figure 3) using paired t-tests on 20 features, with Mann-Whitney U tests for statistical significance (p < 0.05). Haralick features[12], derived from the Gray-Level Co-occurrence Matrix (GLCM), have emerged as a powerful tool in medical image analysis[13] as well as industrial applictions[14,15], offering significant advancements in the early detection, classification, and monitoring of various diseases. These features quantify textural patterns within an image by analyzing pixel intensity relationships, enabling the extraction of statistical measures such as contrast, correlation, energy, entropy, and homogeneity. Their ability to capture subtle variations in texture has made them particularly valuable in distinguishing between healthy and pathological tissues, thus aiding in diagnostic decision-making.
Results
NEV camera images differed in the CTS group compared with the CNTL group (Figure 4).
The SVM classifier achieved 93.33% accuracy at threshold 0.7, with confusion matrix [[True positive 14/15] [True negative 14/15]], precision/recall/F1-score 0.93 for both classes. Cross-validation mean accuracy was 81.79% (75.00%–95.00%). Decision scores ranged -2.3850 to 3.0413, with most normals negative, abnormals positive (Table 3).
Table 3.
Decision Model of CTS versus Control Subjects
Clinical correlations showed one false negative case had negative NCT but a positive Phalen, and borderline SWMT 3.84 (diminished light touch). The other misclassified case had normal CSA, negative NCT, SWMT 4.56 (diminished protective sensation) and positive phalen test. It is possible that even the "gold standard" NCT measurements are not absolutely true.
BCTQ analysis revealed clear group differences (Table 3): Normal: Symptom Severity Scale 0.6647 ± 0.0781 (0.5455–0.8182), Functional Status Scale 15.92 ± 7.29 (8–32). Abnormal: BEV 0.8792 ± 0.0735 (0.7273–1.0000), BEW 31.28 ± 6.47 (16–40). SWMT analysis (Table 4) showed: 29 (29.6%) normal sensation (≤2.83), 35 (35.7%) diminished light touch (3.22–3.84), 24 (24.5%) diminished protective sensation (4.08–4.56), 10 (10.2%) loss of protective sensation (≥4.74). 62.2% normals ≤3.84, 68.0% abnormals ≥4.08.
Table 4.
BCTQ Scores for Normal and Abnormal Groups
Feature analysis showed hue peaks at hist_h_100 for normals, hist_h_49 for abnormals, higher edge density in normals (0.2794 vs. 0.2009)(Table 5).
Table 5.
Distribution of SWMT Values and CTS Grades
Table 6.
Features Assessed to Determine Skin Innervation
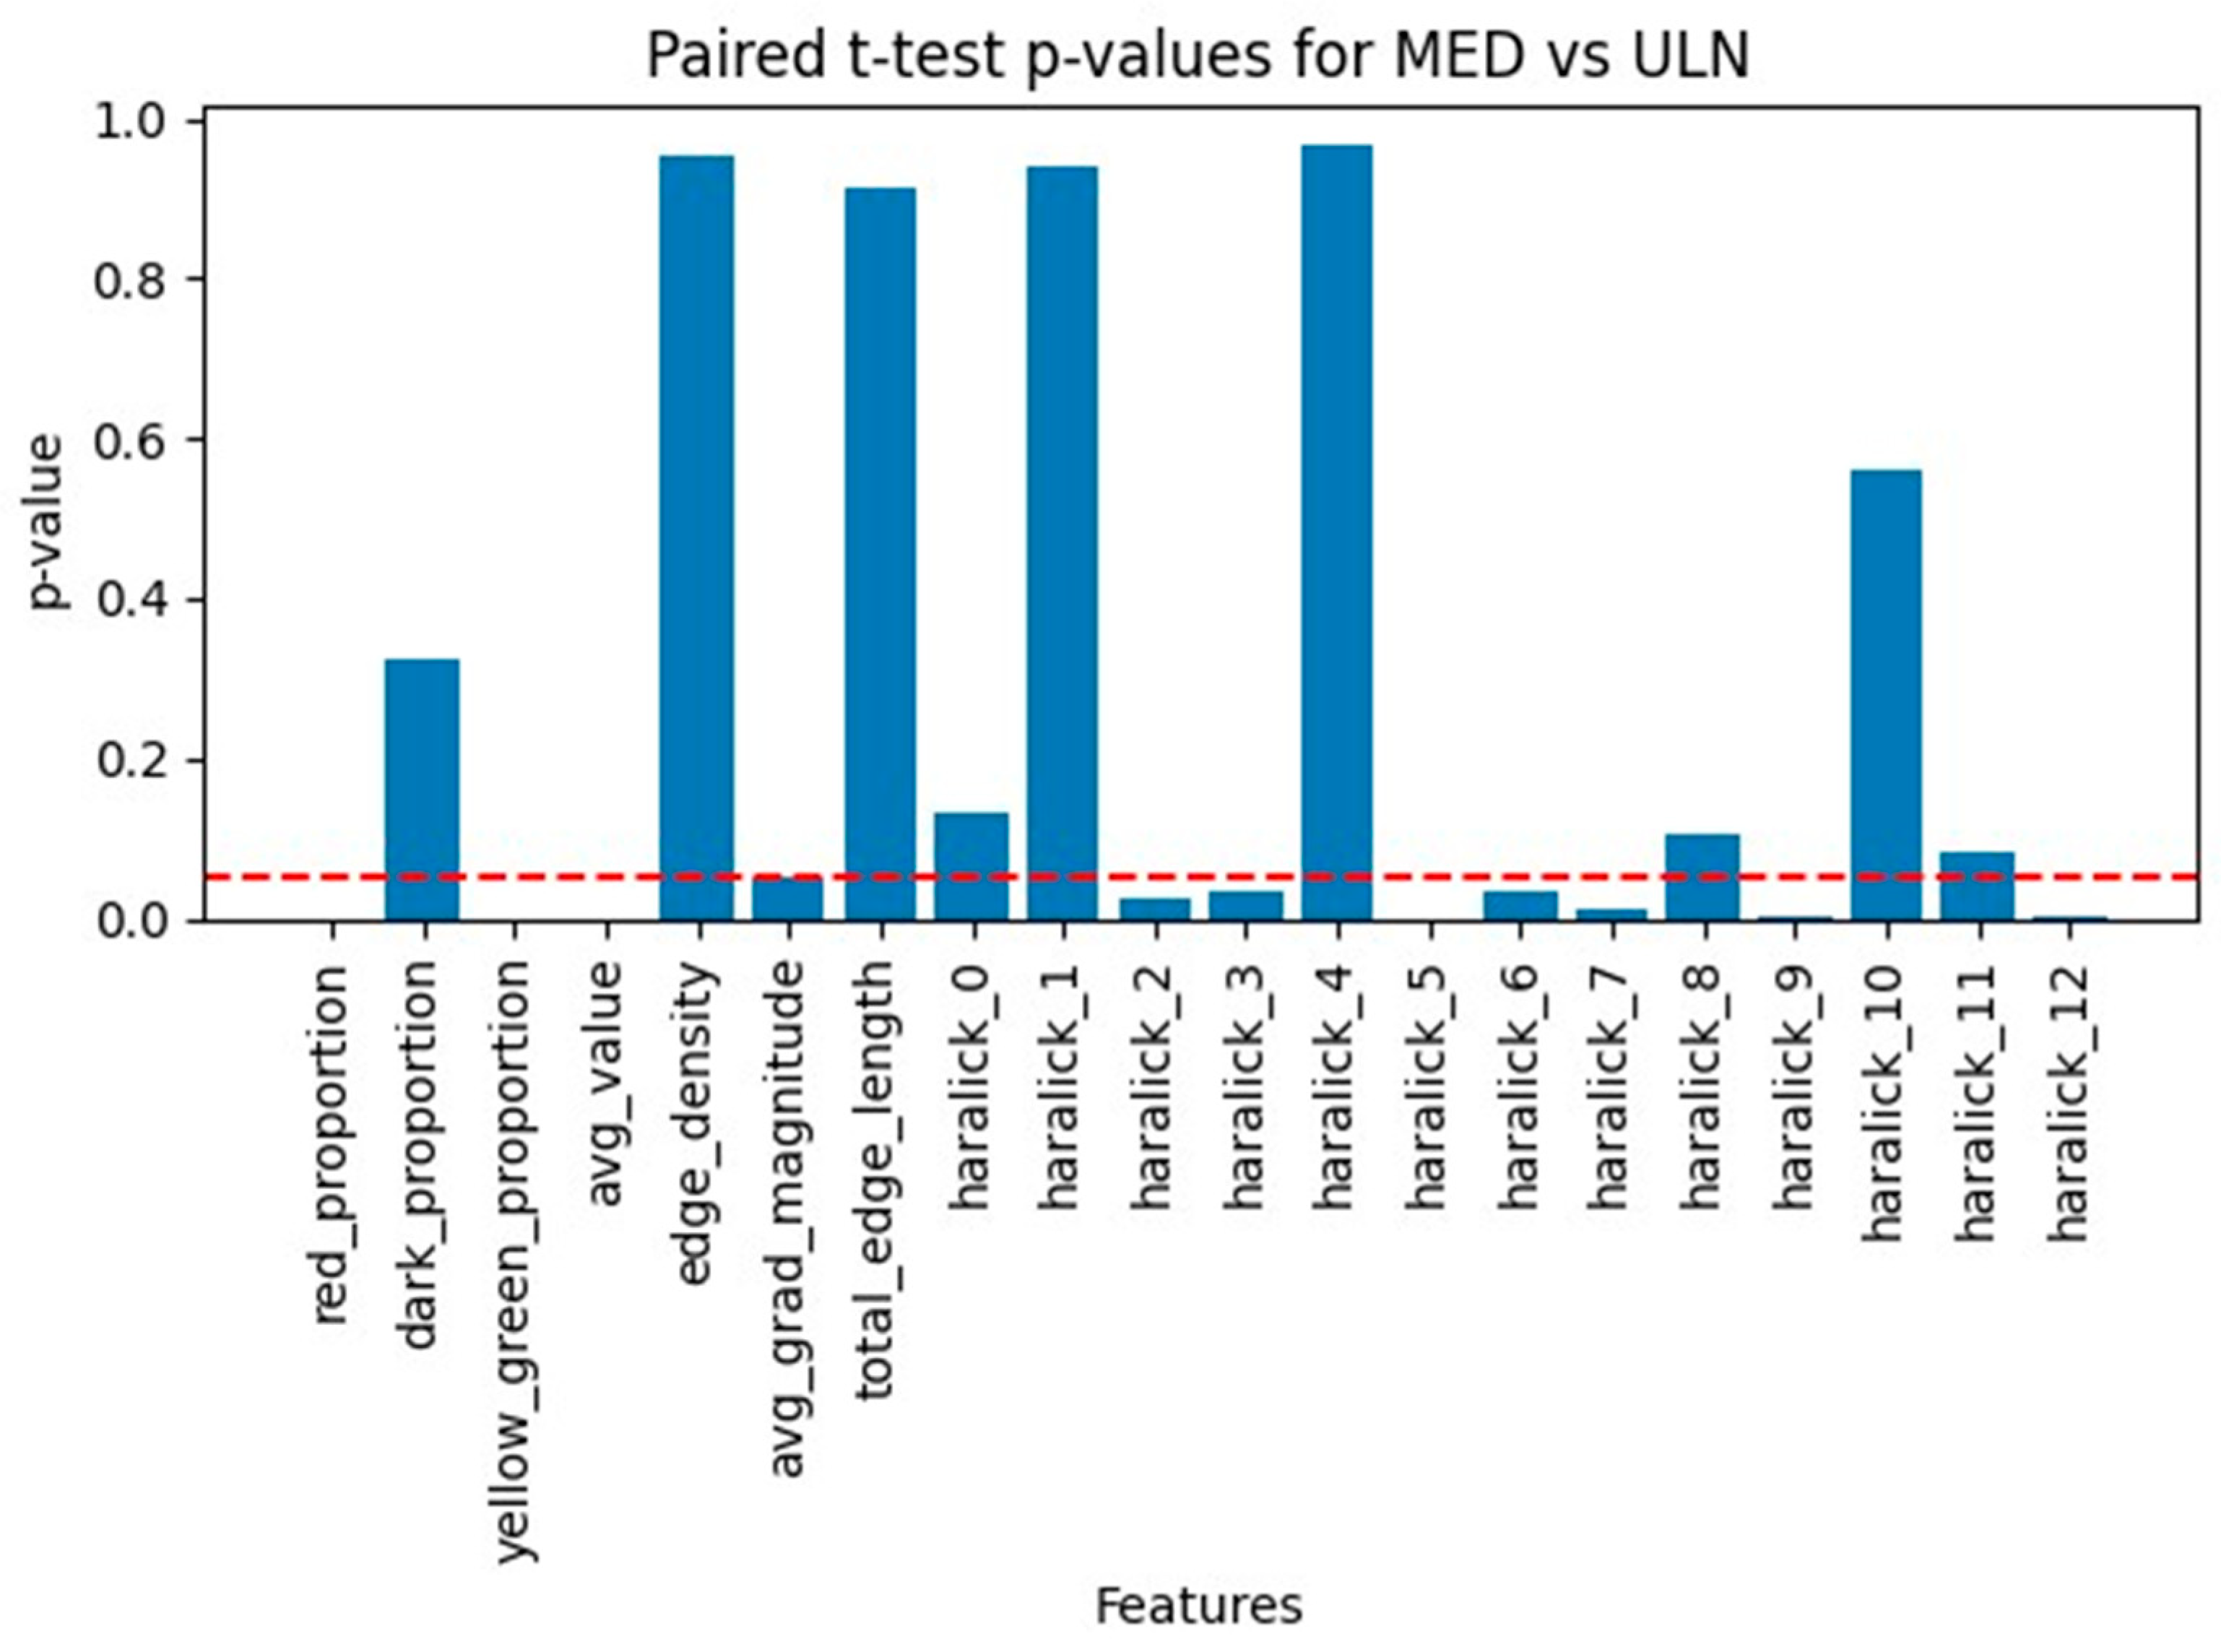
Paired t-tests on 32 MED-ULN pairs showed significant differences in color proportions (red_proportion, yellow_green_proportion, avg_value) and Haralick features (haralick_2, -3, -5, -6, -7, -9, -12), with Bonferroni correction confirming robustness for key features (Figure 5). Several parameters were significantly different between ULN and MED skin areas (Figure 6). Histograms were analyzed as non-scalar variables and several features were significantly different between both groups (Figure 7).
Limitations and Recommendations
Multiple testing risks false positives; Bonferroni correction (0.0025) confirmed strongest findings but may be conservative. Sample size (32 pairs) limits power; larger studies are needed. Haralick features require mapping to physical properties, and clinical correlation with NCT/BCTQ is essential for any future studies. The successful results in distinguishing between normally innervated skin and abnormally innervated skin, cannot be generalized to all body regions an further studies are needed examining different nerve damaged skin areas.
Discussion
The present study demonstrates that the NEV camera, when combined with machine learning techniques[16], can effectively distinguish between patients with CTS and healthy controls with high accuracy. The SVM classifier achieved an accuracy of 93.33%, indicating that the features extracted from the NEV camera images contain significant information related to the presence of CTS. It is known that nerve damage can lead to changes in skin texture and temperature[17,18]. The NEV camera-produced images appear to be affected by ultraweak photon emission(UWPE) [19,20] and magneto-electric fields of the body. It has been shown that oxidative processes in skin can be detected by UWPE[21,22]. This requires high sensitivity that apparently is achieved by the NEV camera. I would specifically stress that some of the online-publications regarding NEV camera describe subtle energy fields that are not accepted in main-stream science. Currently a plausible explanation of the mechanism of action of the NEV camera are the UWPE changes and its subtle effect on the image characteristics, this has been used in plant science to identify plant stress and seed potential[19,23]. Changes in UWPE are known to occur in anesthesia and allow non-invasive detection of brain function[24].
In Part 1, the classifier's performance was robust, as evidenced by the confusion matrix and cross-validation scores. The misclassification of a single CTS case suggests that while the model is highly accurate, there may be instances where the image features do not clearly indicate the disease, possibly due to variations in disease severity or individual differences, or of course the possibility of misdiagnosis despite the multiple robust diagnostic modalities used to clearly define the ground-truth training groups.
Part 2 provided further insights by comparing images from median nerve-damaged (MED) and ulnar nerve-normal (ULN) areas within the same hand of CTS patients. The significant differences observed in color proportions and Haralick texture features between these areas support the hypothesis that nerve damage affects the skin's appearance in a detectable manner. Specifically, features such as red_proportion, yellow_green_proportion, and average value (brightness) showed statistically significant differences, which may reflect changes in blood flow, tissue oxygenation, or other physiological alterations associated with nerve compression [18,19].
These findings are particularly noteworthy because they suggest that the NEV camera can capture subtle changes in the skin that are not readily apparent to the naked eye or through standard imaging techniques. While traditional diagnostic methods like NCS and ultrasound focus on direct measures of nerve function and anatomy, the NEV camera offers a non-invasive alternative that could potentially be used for screening or as an adjunct to existing diagnostic tools [3,12]. The advantage of the NEV camera is its being point-of-care, cheap, readily available diagnostic tool. Further studies should attempt to confirm its utility in diagnosing subtle nerve damage. This is particularly important in diagnosis of sensory nerve damage that is commonly diagnosed based on subjective tests requiring subject co-operation and have typical inter-observer reliability with inter-class correlation of about 80 percent[25].
Comparing our approach to existing imaging techniques, ultrasound is commonly used to measure the cross-sectional area of the median nerve, with a cutoff often used for CTS diagnosis[7]. However, ultrasound requires skilled operators and may not always correlate perfectly with clinical symptoms [26]. MRI can provide detailed images with inter-observer intra-class reliability of 95% but is expensive and not widely available for routine diagnosis[27]. The NEV camera, in contrast, is a portable device that can be used in various settings, potentially making it more accessible[28].
Moreover, the use of machine learning to analyze image features allows for the extraction of complex patterns that may not be discernible through manual inspection. This data-driven approach can enhance diagnostic accuracy and reduce subjectivity[16]. It should be noted that machine-learning is not infallible and at every step, potential biases can creep in[16].
Several limitations must be acknowledged. First, the sample size, particularly in Part 2 with only 32 patients, is relatively small, which may limit the generalizability of the findings. Larger studies are needed to confirm these results and to explore the variability across different populations and disease severities [24].
Second, the study relied on specific features extracted from the images, such as color histograms and texture features. While these features were effective in this context, it is possible that other features or different machine learning models could further improve performance. Future research could investigate deep learning approaches, which have shown promise in medical image analysis, to automatically learn relevant features from the data [29].
Third, clinical correlations revealed some discrepancies. For example, some control subjects had positive Phalen tests or elevated BCTQ scores, which might indicate that they had mild or subclinical CTS, potentially affecting the classification accuracy. Ensuring strict inclusion criteria and comprehensive clinical assessments are crucial for accurate labeling of training data. This goal might be un-attenable as clinical diagnosis itself is not absolutely accurate for carpal tunnel compression syndrome with symptom to electrodiagnostic parameters correlation in the mid-eighties percent[30]. There is evidence that multimodal deep learning can lead to improved clinical accuracy[31]. However, some occasional patients might have a neuropathy that is not related to compression at the carpal tunnel[32].
Additionally, the NEV camera's mechanism of action and how it relates to the pathophysiology of CTS need further elucidation. While the study demonstrates empirical success, understanding the biological basis for the observed differences in image features would strengthen the scientific foundation of this diagnostic method. This would require quantification of ultraweak photon emission of the patients and evaluation of the correlation with NEV camera images.
In conclusion, the NEV camera, coupled with machine learning analysis, shows promise as a non-invasive tool for diagnosing CTS. Its ability to detect subtle changes in skin appearance associated with nerve damage offers a novel approach that complements existing diagnostic methods. Further validation in larger, diverse cohorts and integration with clinical workflows are necessary steps toward its adoption in medical practice. If validated, this method could reduce the need for invasive procedures and provide a quicker, more accessible diagnostic option for CTS [27].
References
- Kim, J.; Kim, M.W.; Kim, J.M. Enhanced diagnosis and severity assessment of carpal tunnel syndrome using combined shear wave elastography and cross-sectional area analysis: A prospective case-control study. PLoS One 2025, 20, e0320011. [Google Scholar] [CrossRef]
- Klauser, A.S.; Halpern, E.J.; De Zordo, T.; Feuchtner, G.M.; Arora, R.; Gruber, J.; Martinoli, C.; Loscher, W.N. Carpal tunnel syndrome assessment with US: value of additional cross-sectional area measurements of the median nerve in patients versus healthy volunteers. Radiology 2009, 250, 171–177. [Google Scholar] [CrossRef] [PubMed]
- Yamada, S.; Yamaguchi, I. Magnetocardiograms in clinical medicine: unique information on cardiac ischemia, arrhythmias, and fetal diagnosis. Intern Med 2005, 44, 1–19. [Google Scholar] [CrossRef] [PubMed]
- Bu, Y.; Prince, J.; Mojtahed, H.; Kimball, D.; Shah, V.; Coleman, T.; Sarkar, M.; Rao, R.; Huang, M.; Schwindt, P.; et al. Peripheral Nerve Magnetoneurography With Optically Pumped Magnetometers. Front Physiol 2022, 13, 798376. [Google Scholar] [CrossRef]
- Oldfield, H. New Energy Vision (NEV) for Windows PC. (accessed on. Available online: https://www.electrocrystal.com/nev_pc.html.
- Yang, A.; Cavanaugh, P.; Beredjiklian, P.K.; Matzon, J.L.; Seigerman, D.; Jones, C.M. Correlation of Carpal Tunnel Syndrome 6 Score and Physical Exam Maneuvers With Electrodiagnostic Test Severity in Carpal Tunnel Syndrome: A Blinded Prospective Cohort Study. J Hand Surg Am 2023, 48, 335–339. [Google Scholar] [CrossRef] [PubMed]
- Zaki, H.A.; Shaban, E.; Salem, W.; Bilal, F.; Fayed, M.; Hendy, M.; Abdelrahim, M.G.; Masood, M.; Mohamed Khair, Y.; Shallik, N.A. A Comparative Analysis Between Ultrasound and Electromyographic and Nerve Conduction Studies in Diagnosing Carpal Tunnel Syndrome (CTS): A Systematic Review and Meta-Analysis. Cureus 2022, 14, e30476. [Google Scholar] [CrossRef]
- Dinescu, V.C.; Bica, M.; Vasile, R.C.; Gresita, A.; Catalin, B.; Rotaru-Zavaleanu, A.D.; Vreju, F.A.; Sas, L.; Bunescu, M. Limitations of the Boston Carpal Tunnel Questionnaire in Assessing Severity in a Homogeneous Occupational Cohort. Life (Basel) 2025, 15. [Google Scholar] [CrossRef]
- Merkel, D.; Lueders, C.; Schneider, C.; Yousefzada, M.; Ruppert, J.; Weimer, A.; Herzog, M.; Lorenz, L.A.; Vieth, T.; Buggenhagen, H.; et al. Prospective Comparison of Nine Different Handheld Ultrasound (HHUS) Devices by Ultrasound Experts with Regard to B-Scan Quality, Device Handling and Software in Abdominal Sonography. Diagnostics (Basel) 2024, 14. [Google Scholar] [CrossRef]
- Diagnosing and assessing CTS. (accessed on. Available online: https://www.carpal-tunnel.net/diagnosing.
- Wilson, K.E.; Tat, J.; Keir, P.J. Effects of Wrist Posture and Fingertip Force on Median Nerve Blood Flow Velocity. Biomed Res Int 2017, 2017, 7156489. [Google Scholar] [CrossRef]
- Shapiro, L.G.; Haralick, R.M. Relational matching. Appl Opt 1987, 26, 1845–1851. [Google Scholar] [CrossRef]
- Albuquerque, A.; Almeida, E.; Queiroz, F. A Comparative Study of Texture Analysis Methods on the Classification Problem of DPLDs in HRCT scans. Annu Int Conf IEEE Eng Med Biol Soc 2024, 2024, 1–4. [Google Scholar] [CrossRef]
- Ojala, T.; Punkki, J. Estimating the Workability of Concrete with a Stereovision Camera during Mixing. Sensors (Basel) 2024, 24. [Google Scholar] [CrossRef] [PubMed]
- Loke, K.S. A novel approach to texture recognition combining deep learning orthogonal convolution with regional input features. PeerJ Comput Sci 2024, 10, e1927. [Google Scholar] [CrossRef] [PubMed]
- Varoquaux, G.; Cheplygina, V. Machine learning for medical imaging: methodological failures and recommendations for the future. NPJ Digit Med 2022, 5, 48. [Google Scholar] [CrossRef]
- Mooshage, C.M.; Tsilingiris, D.; Schimpfle, L.; Fleming, T.; Herzig, S.; Szendroedi, J.; Heiland, S.; Bendszus, M.; Kopf, S.; Kurz, F.; et al. Intradermal Advanced Glycation End-products Relate to Reduced Sciatic Nerve Structural Integrity in Type 2 Diabetes. Clin Neuroradiol 2025. [Google Scholar] [CrossRef] [PubMed]
- Chikubu, H.; Inage, K.; Orita, S.; Shiga, Y.; Inoue, M.; Okuyama, K.; Tokeshi, S.; Shimizu, K.; Suzuki-Narita, M.; Ohtori, S. A Study on Subjective Symptoms and Plantar Temperature Imbalance in Lumbar Spinal Stenosis: A Preliminary Study. Cureus 2025, 17, e79388. [Google Scholar] [CrossRef]
- Prasad, A.; Mihacova, E.; Manoharan, R.R.; Pospisil, P. Application of ultra-weak photon emission imaging in plant stress assessment. J Plant Res 2025, 138, 389–400. [Google Scholar] [CrossRef]
- Casey, H.; DiBerardino, I.; Bonzanni, M.; Rouleau, N.; Murugan, N.J. Exploring ultraweak photon emissions as optical markers of brain activity. iScience 2025, 28, 112019. [Google Scholar] [CrossRef]
- Prasad, A.; Duchova, H.; Manoharan, R.R.; Rathi, D.; Pospisil, P. Imaging and Characterization of Oxidative Protein Modifications in Skin. Int J Mol Sci 2023, 24. [Google Scholar] [CrossRef]
- Poplova, M.; Prasad, A.; Van Wijk, E.; Pospisil, P.; Cifra, M. Biological Auto(chemi)luminescence Imaging of Oxidative Processes in Human Skin. Anal Chem 2023, 95, 14853–14860. [Google Scholar] [CrossRef]
- Shi, W.; Chen, L. An effective method for detecting the wheat freshness by integrating biophotonics and machine learning algorithm. Sci Rep 2024, 14, 32145. [Google Scholar] [CrossRef] [PubMed]
- Ghaffari, M.K.; Sefati, N.; Esmaeilpour, T.; Salari, V.; Oblak, D.; Simon, C. The impact of ketamine and thiopental anesthesia on ultraweak photon emission and oxidative-nitrosative stress in rat brains. Front Syst Neurosci 2025, 19, 1502589. [Google Scholar] [CrossRef] [PubMed]
- Herron, M.L.; Kar, S.; Beard, D.; Binfield, P. Sensory dysfunction in the great toe in hallux valgus. J Bone Joint Surg Br 2004, 86, 54–57. [Google Scholar] [CrossRef] [PubMed]
- Pimentel, B.F.R.; Faloppa, F.; Tamaoki, M.J.S.; Belloti, J.C. Effectiveness of ultrasonography and nerve conduction studies in the diagnosing of carpal tunnel syndrome: clinical trial on accuracy. BMC Musculoskelet Disord 2018, 19, 115. [Google Scholar] [CrossRef]
- Wang, Y.; Chen, W.; Wang, T.; Qin, K.; Teng, J.; Qi, H. Comparison of ultrasound and magnetic resonance imaging of the median nerve's recurrent motor branch and the value of its diameter in diagnosing carpal tunnel syndrome. Quant Imaging Med Surg 2025, 15, 383–394. [Google Scholar] [CrossRef]
- Kefah, K.R., D. Multispectral Imaging for CTS Diagnosis. In Proceedings of the Israeli Orthopedic Association Tel Aviv; 2025. [Google Scholar]
- Geetha Devi, A.; Borra, S.P.R.; Rajesh Kumar, P. A new multimodal medical image fusion framework using Convolution Neural Networks. J Med Eng Technol 2025, 1–8. [Google Scholar] [CrossRef]
- Mazaheri, S.; Poorolajal, J.; Mazaheri, A. Sensitivity and specificity of electrodiagnostic parameters in diagnosing carpal tunnel syndrome. Bone Jt Open 2024, 5, 898–903. [Google Scholar] [CrossRef]
- Shi, X.; Yu, T.; Yuan, Y.; Wang, D.; Cui, J.; Bai, L.; Zheng, F.; Dai, X.; Zhou, Z. Multimodal Deep Learning for Grading Carpal Tunnel Syndrome: A Multicenter Study in China. Acad Radiol 2025. [Google Scholar] [CrossRef]
- Mercan, M.; Yayla, V. Utility of Median Nerve Electrophysiological Parameters in Differentiating Immune-Mediated Demyelination From Compressive Median Neuropathy at the Wrist. Muscle Nerve 2025. [Google Scholar] [CrossRef]
Figure 1.
Lighting measurements in order to calibrate the lighting prior to photographing palms. The color saturation is low to prevent white-out obscuring subtle color changes.
Figure 1.
Lighting measurements in order to calibrate the lighting prior to photographing palms. The color saturation is low to prevent white-out obscuring subtle color changes.
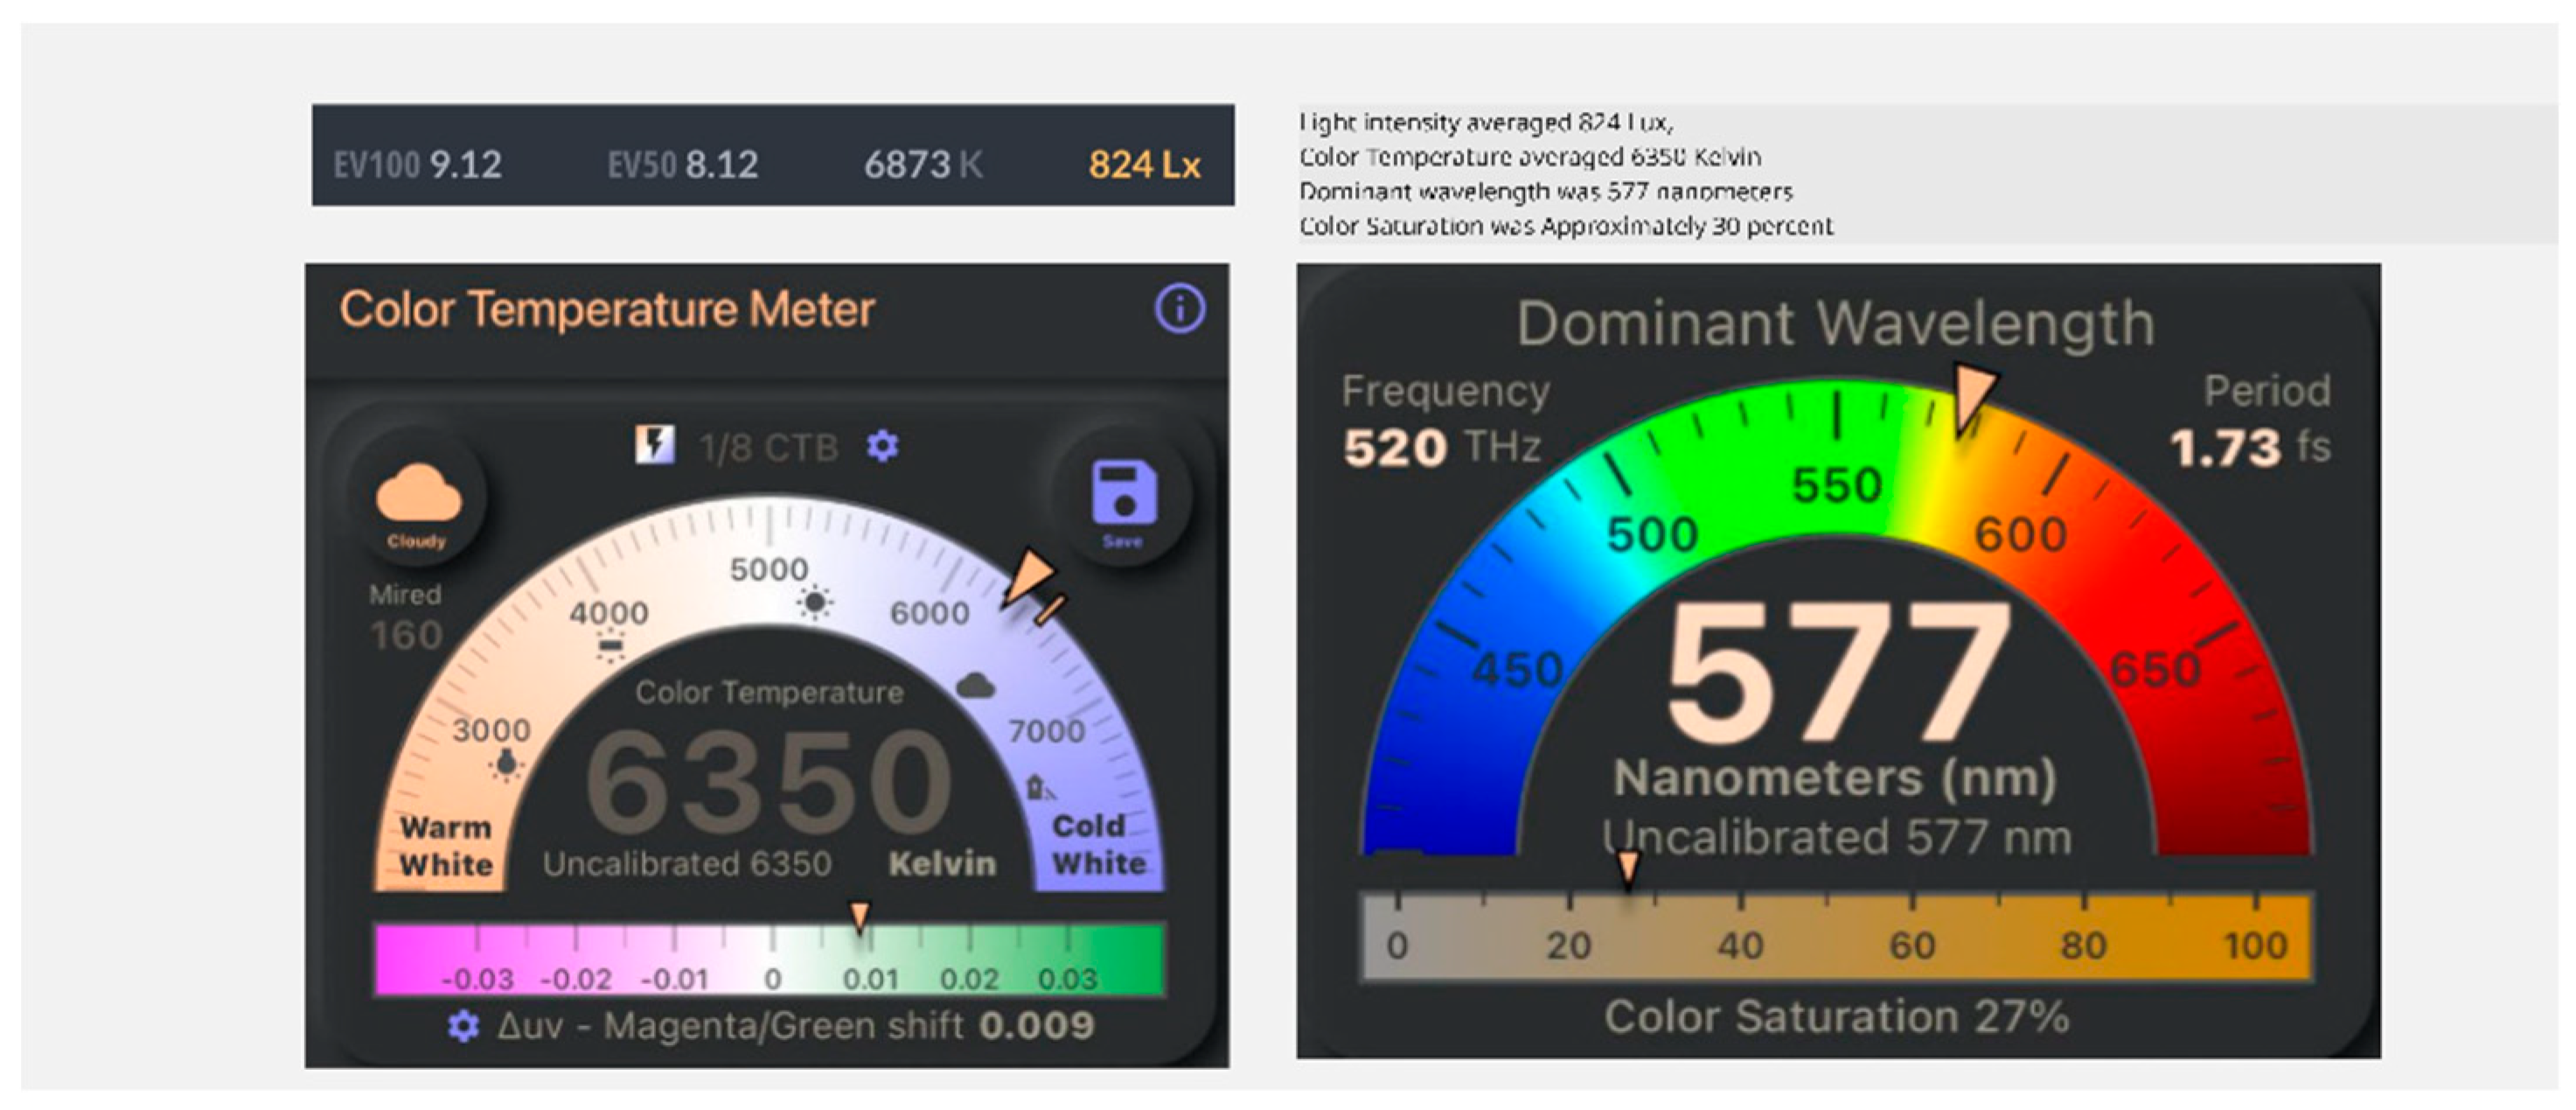
Figure 2.
Typical image of the NEV camera. The carpal tunnel area was analyzed in the study.
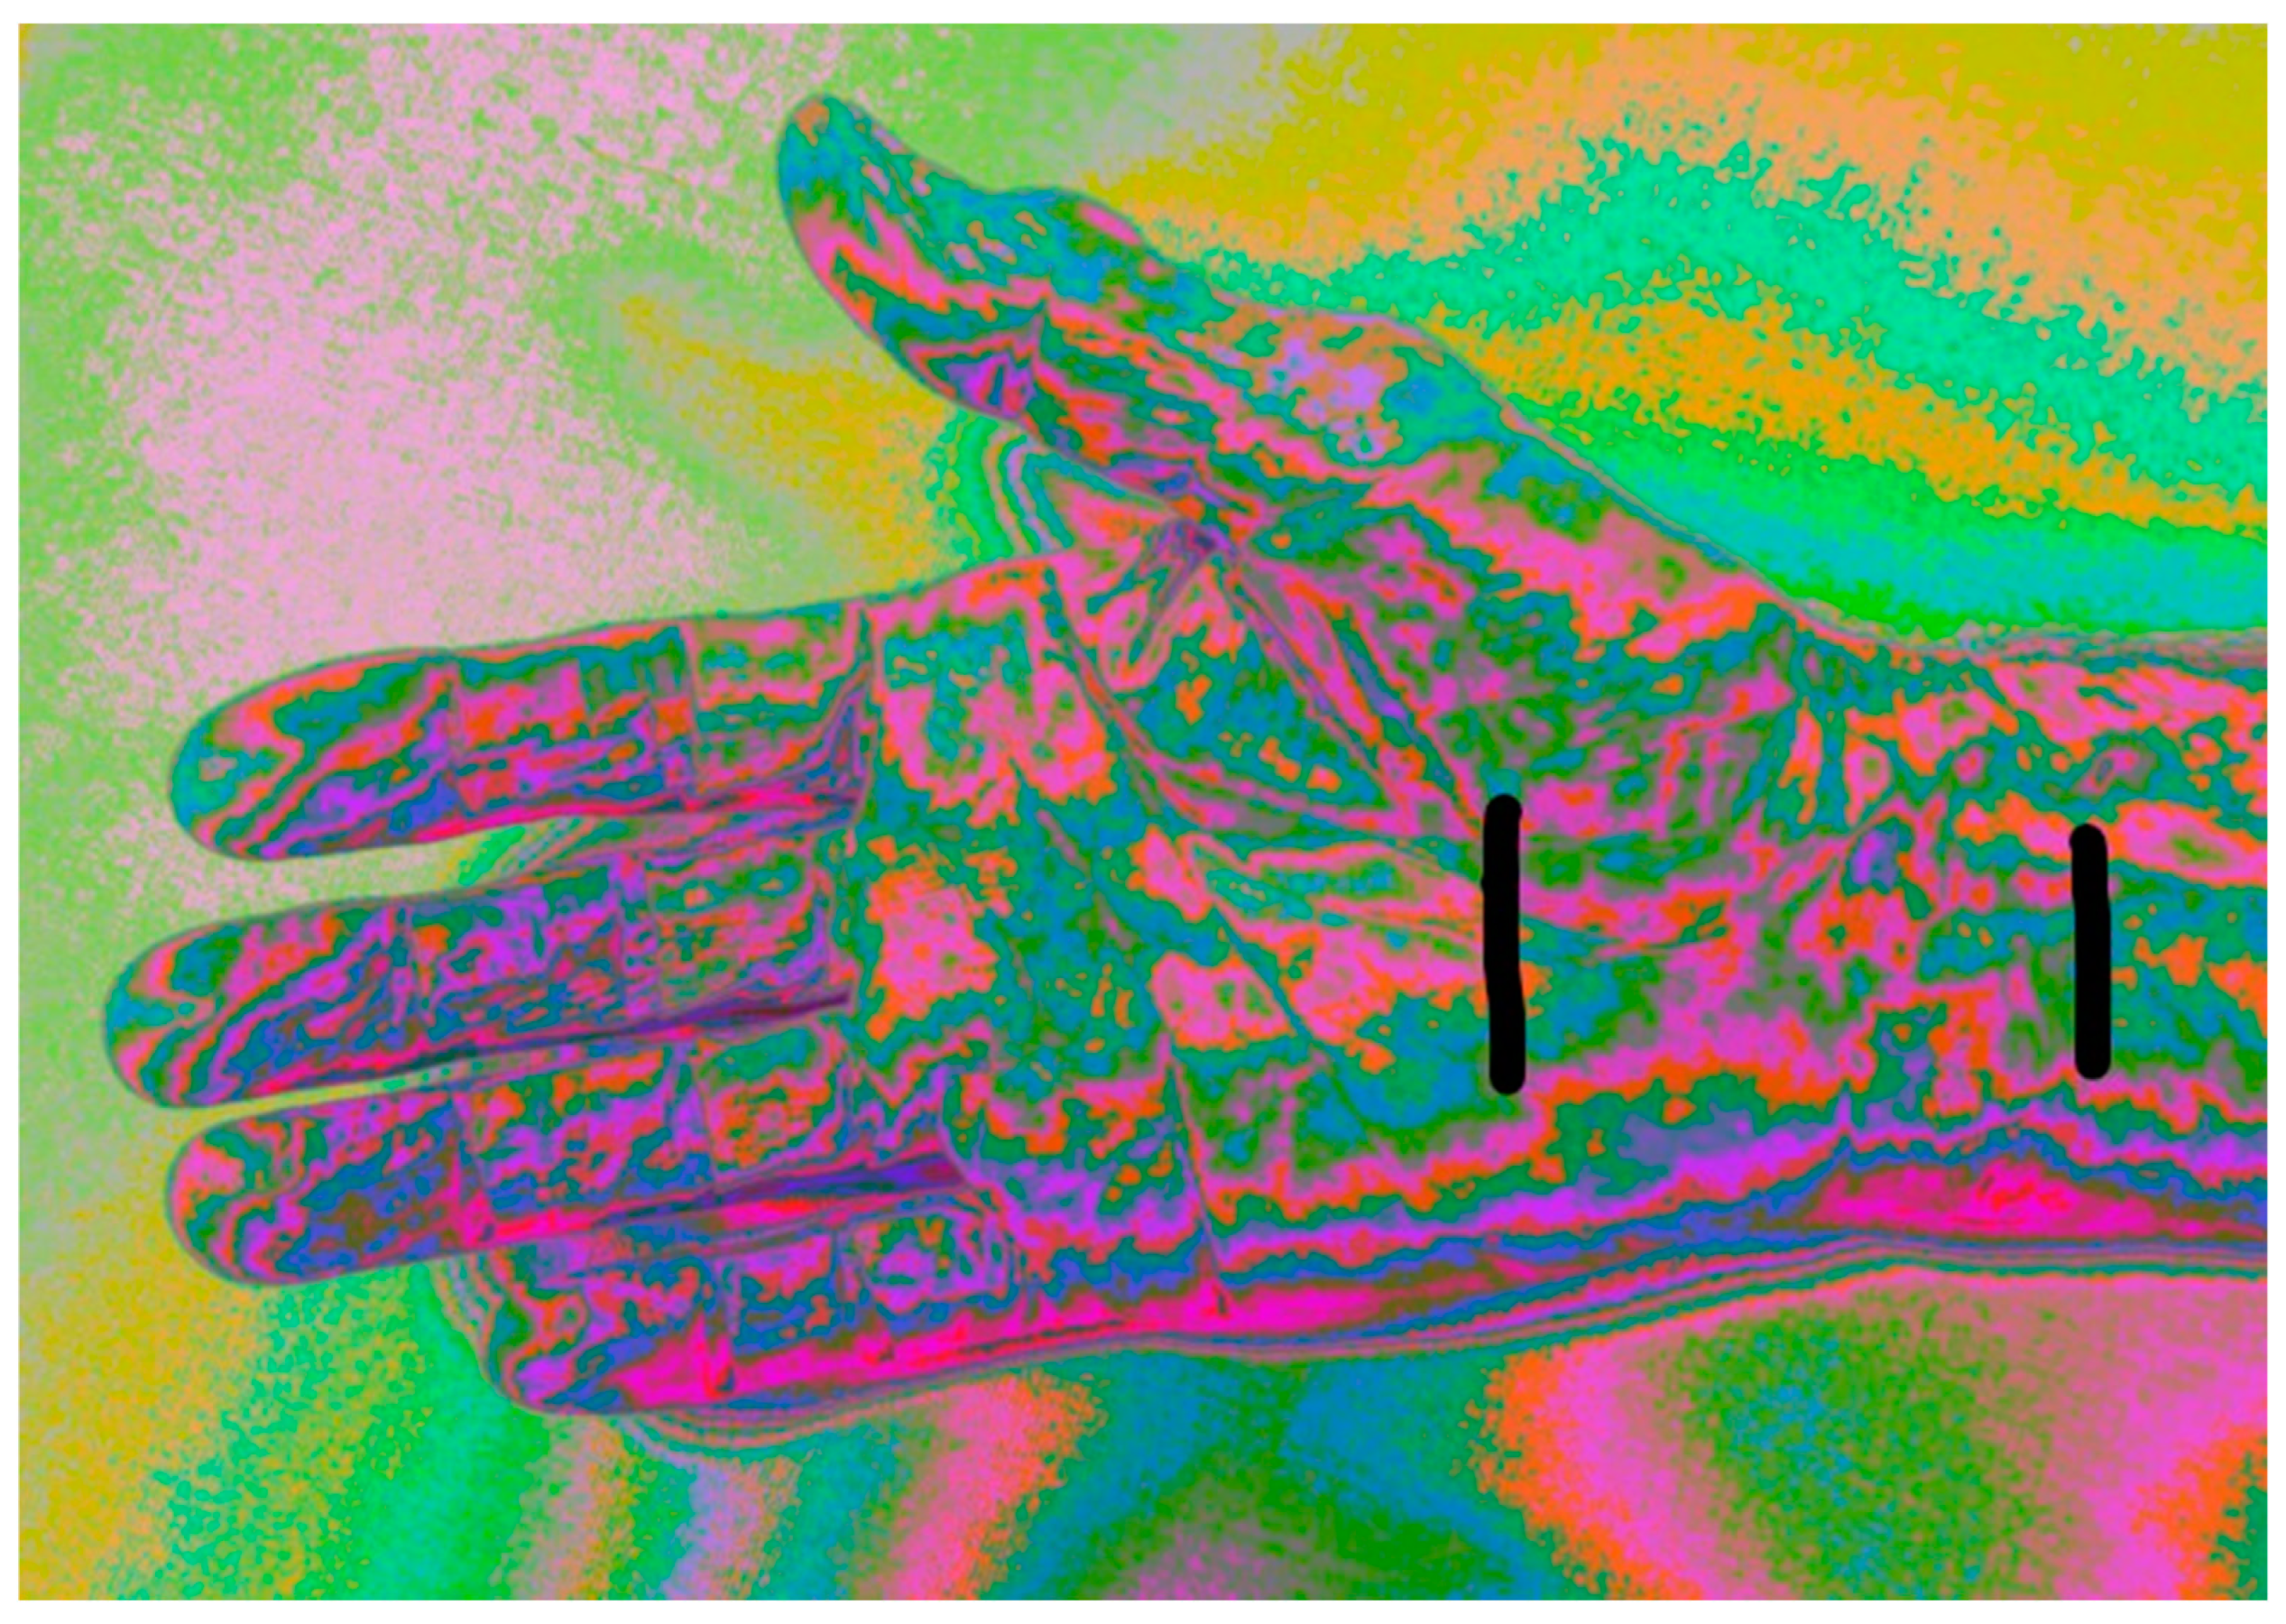
Figure 3.
Comparison of a picture of two fingers. One has known digital nerve damage (higher 4th finger) and the other has normal innervation (lower 3rd finger). The change in hue is obvious as well as the outline of the phalanges.
Figure 3.
Comparison of a picture of two fingers. One has known digital nerve damage (higher 4th finger) and the other has normal innervation (lower 3rd finger). The change in hue is obvious as well as the outline of the phalanges.
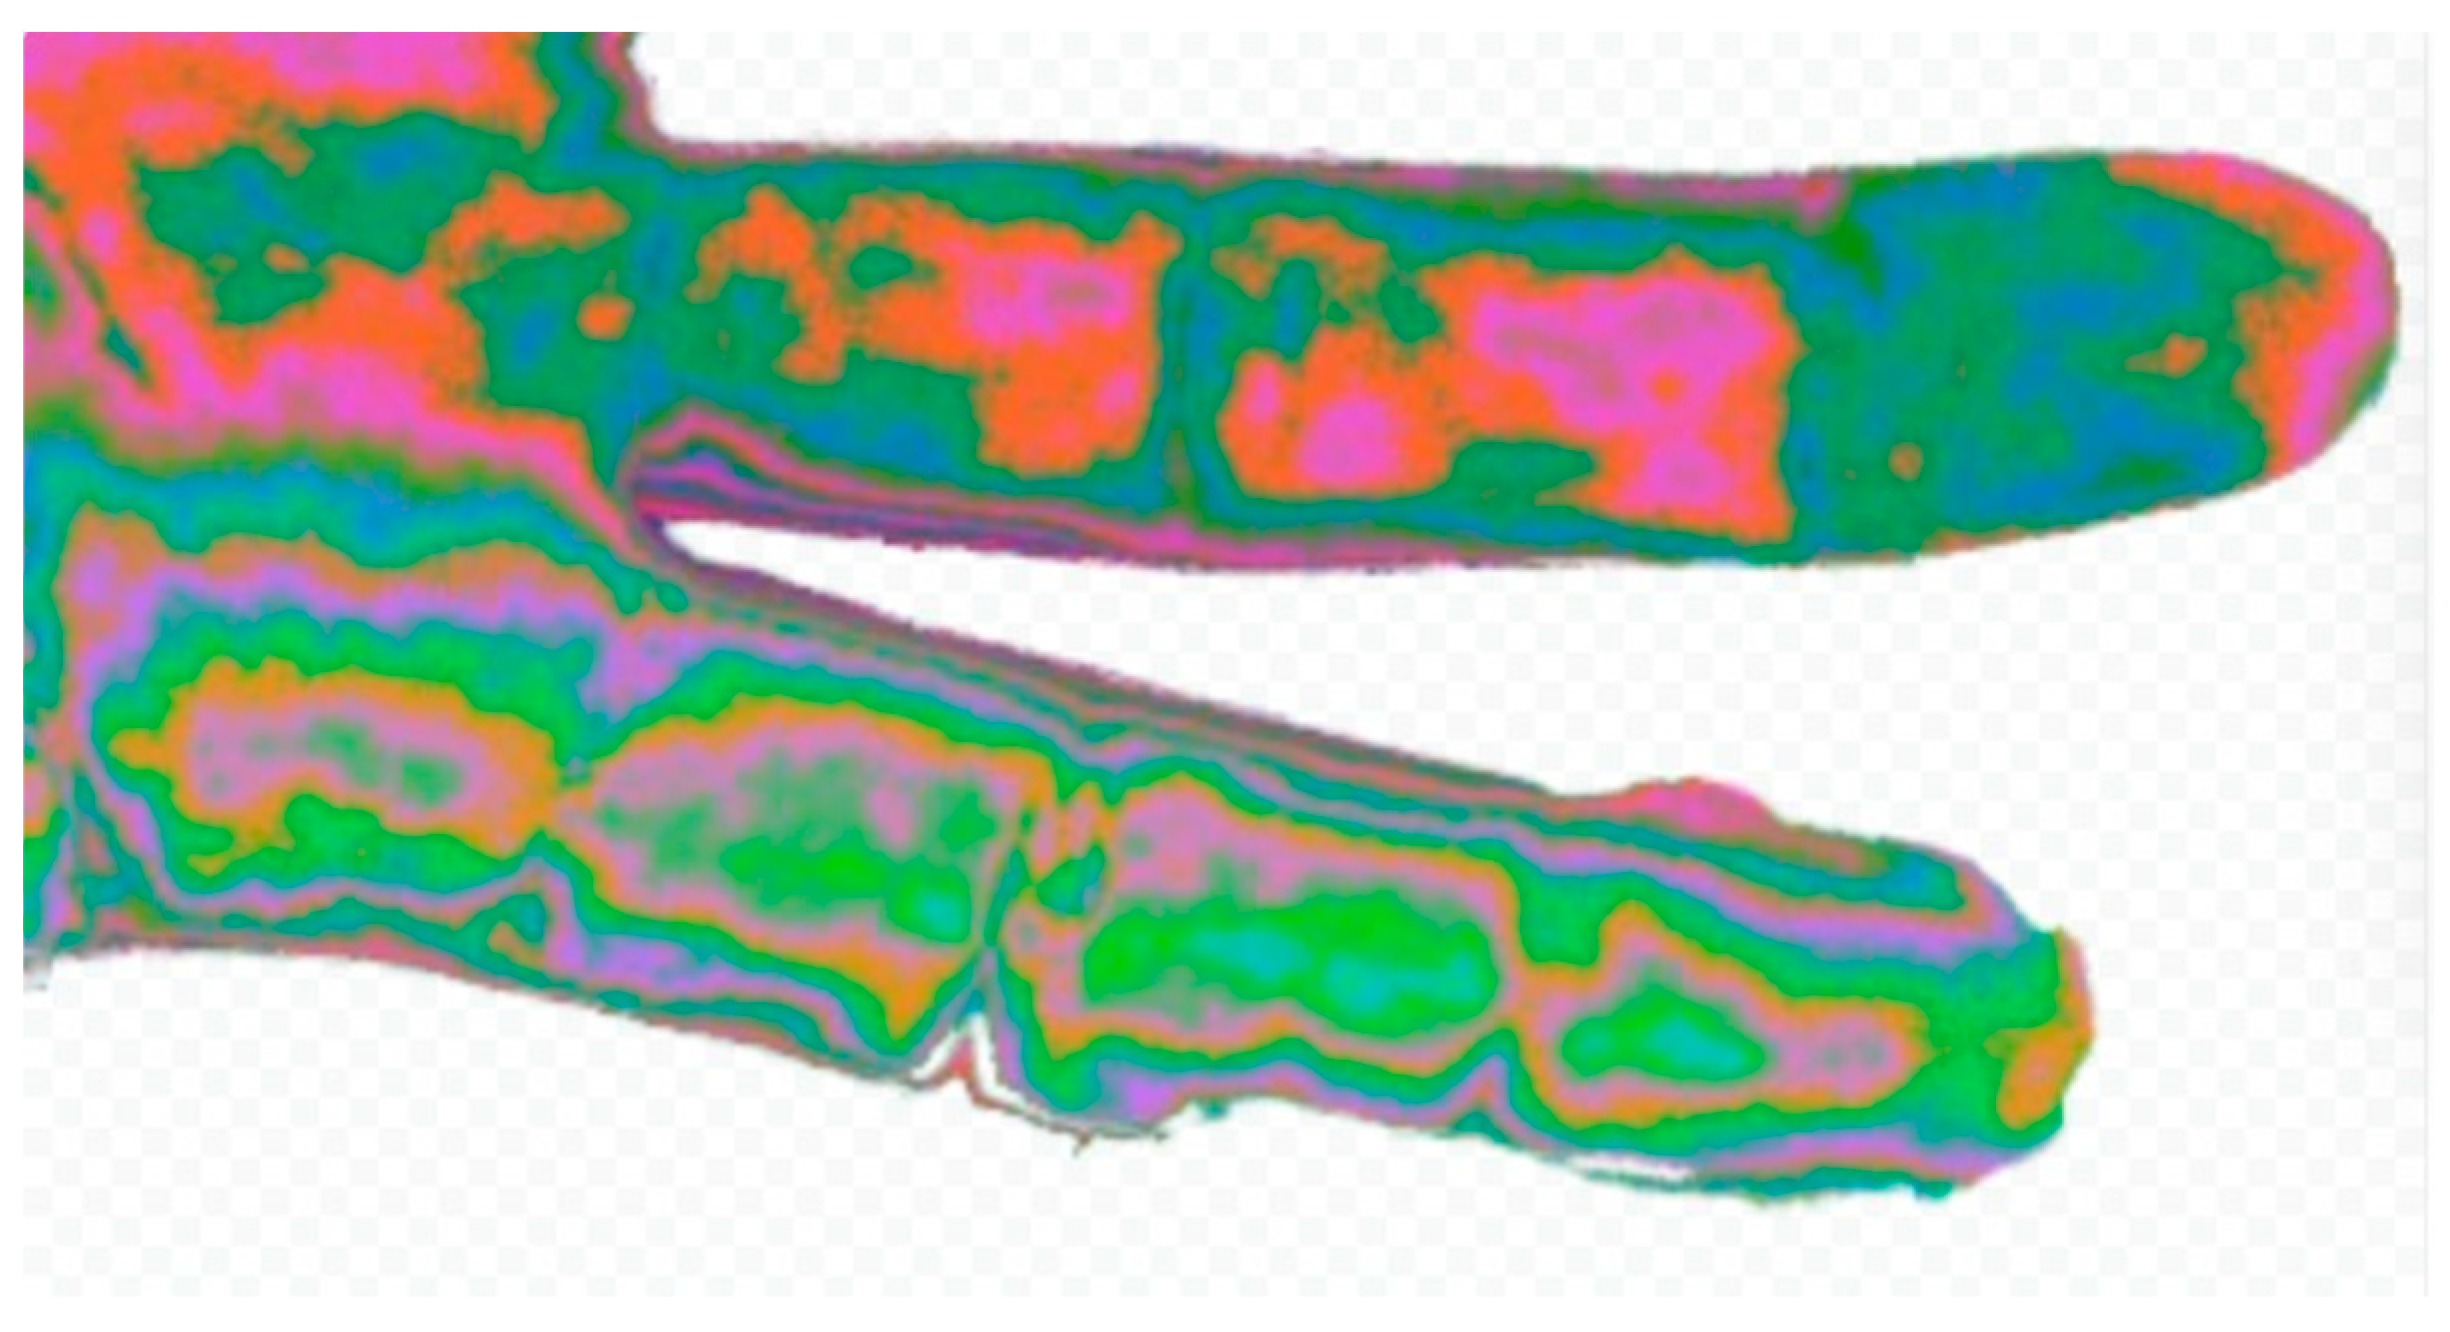
Figure 4.
Difference between average measurement of CTS group and CNTL group (n=103).
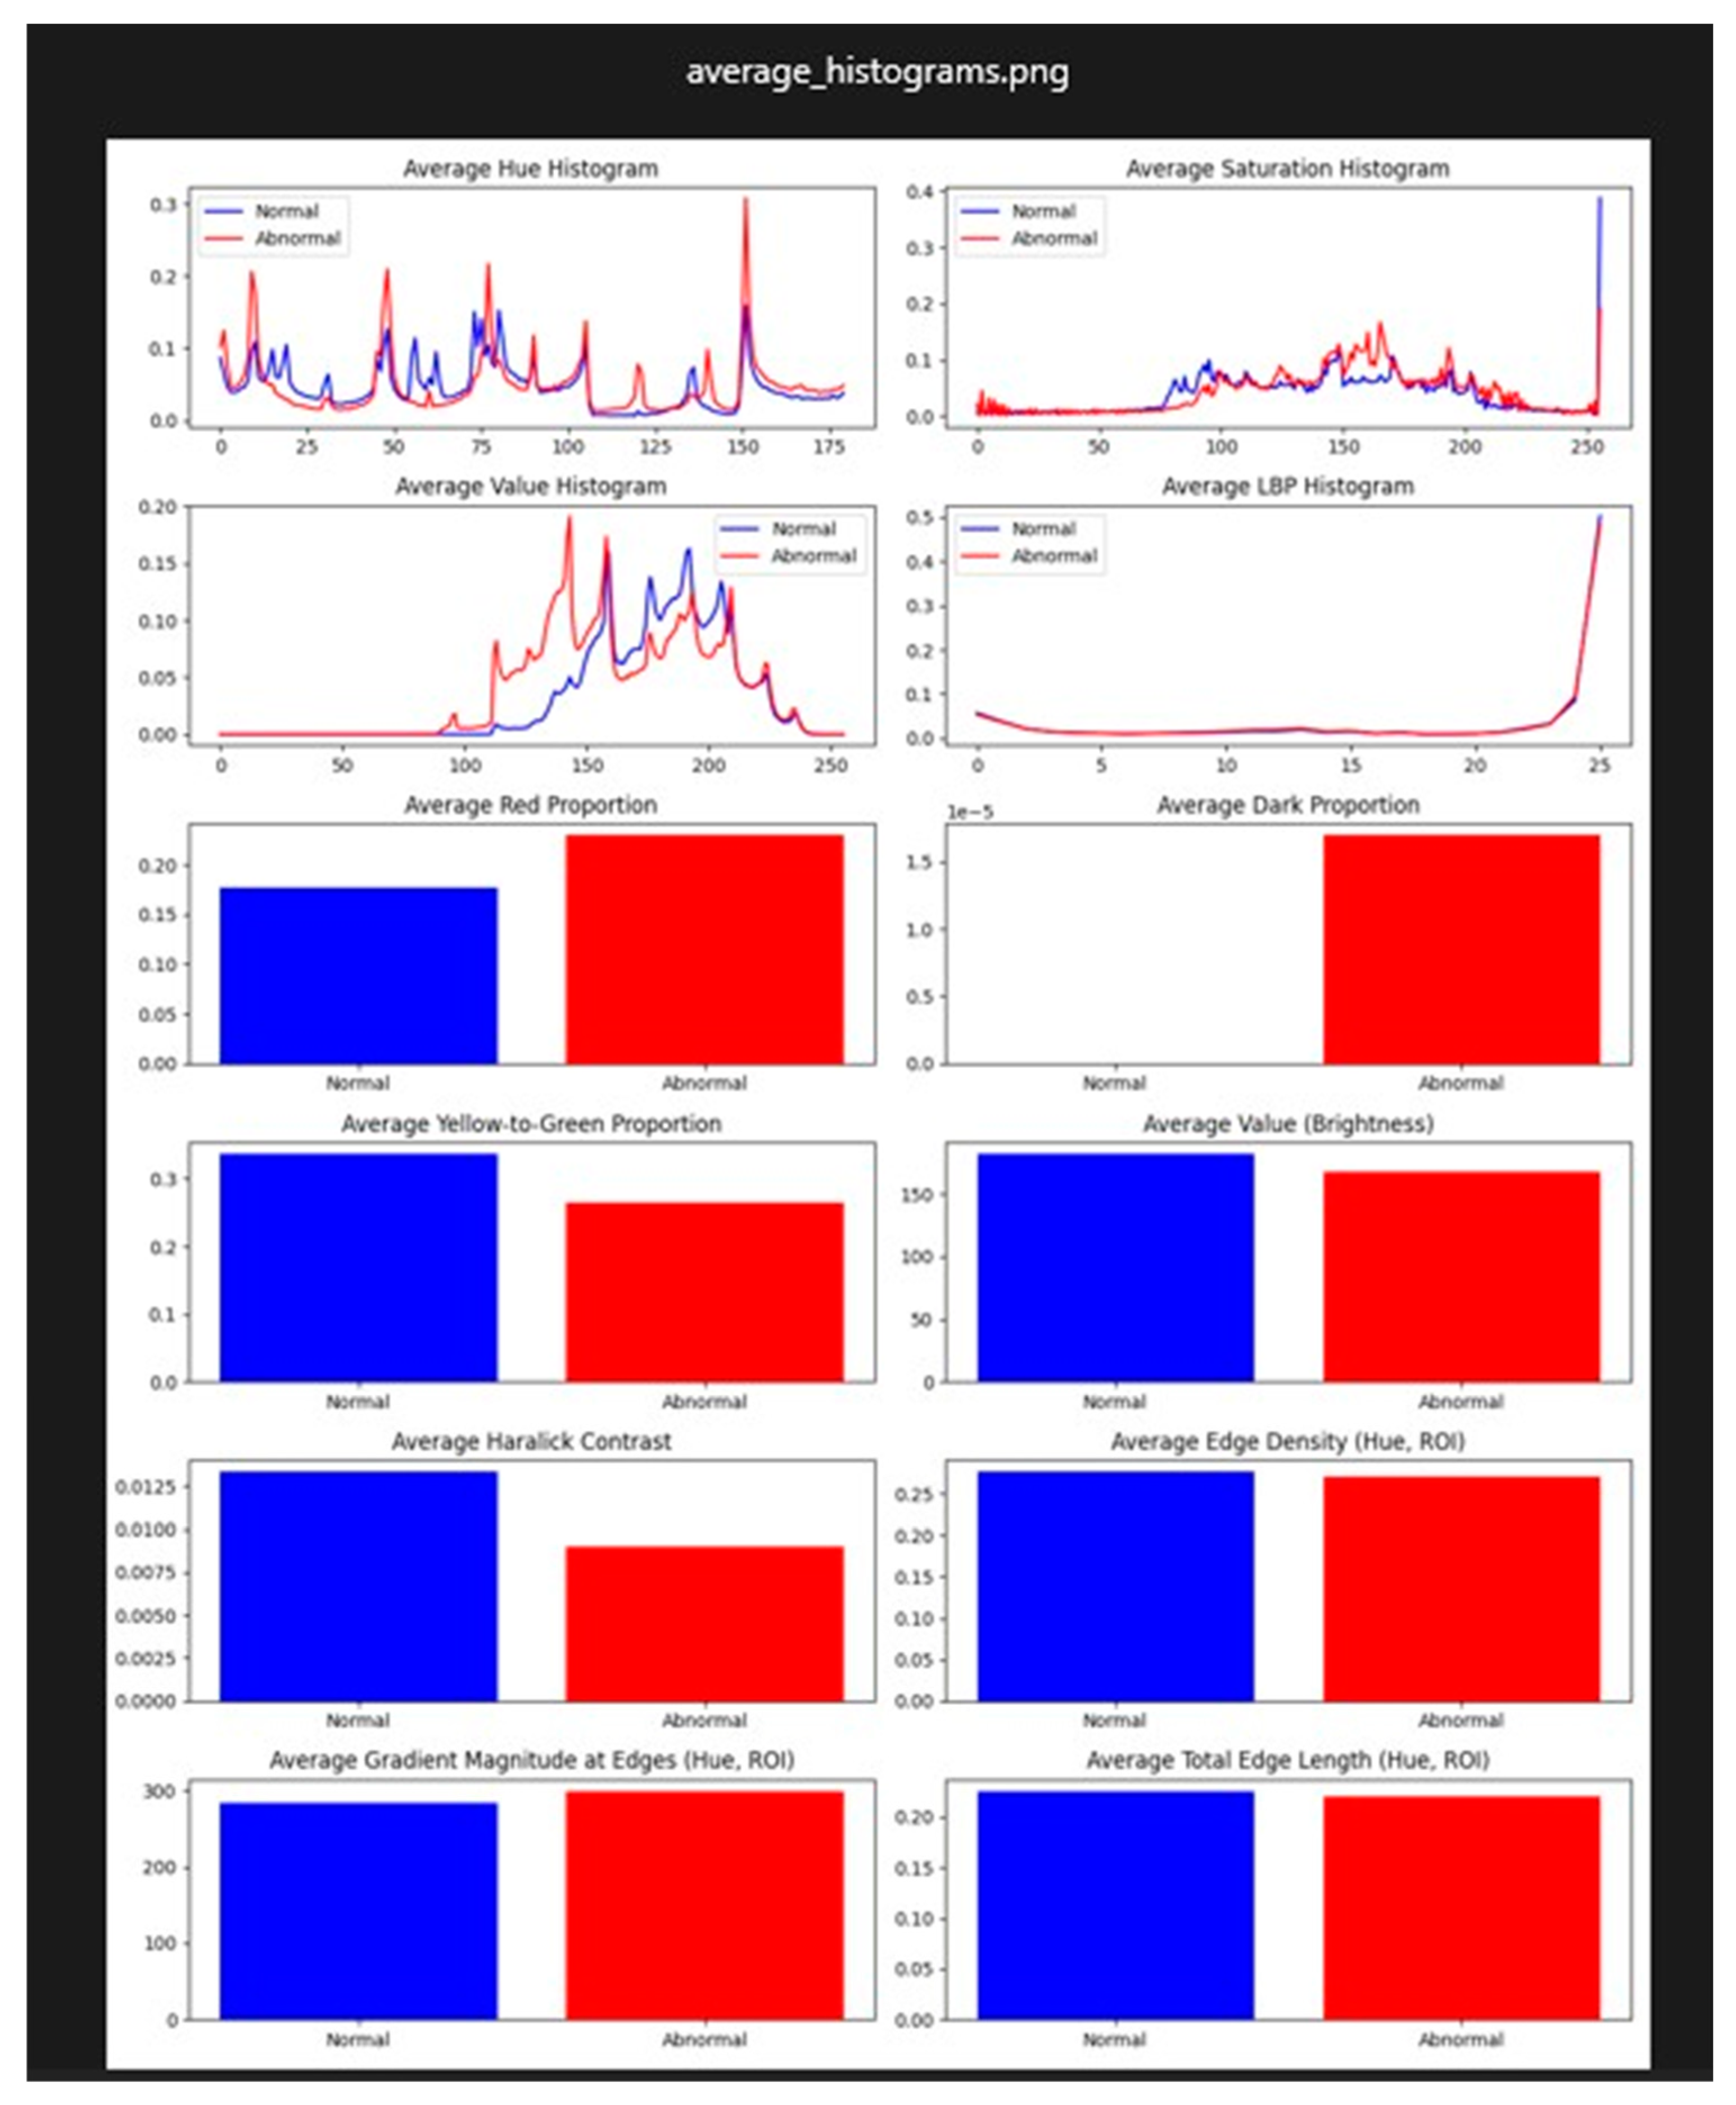
Figure 5.
Difference between average measurement of ULN group and MED group (n=32).
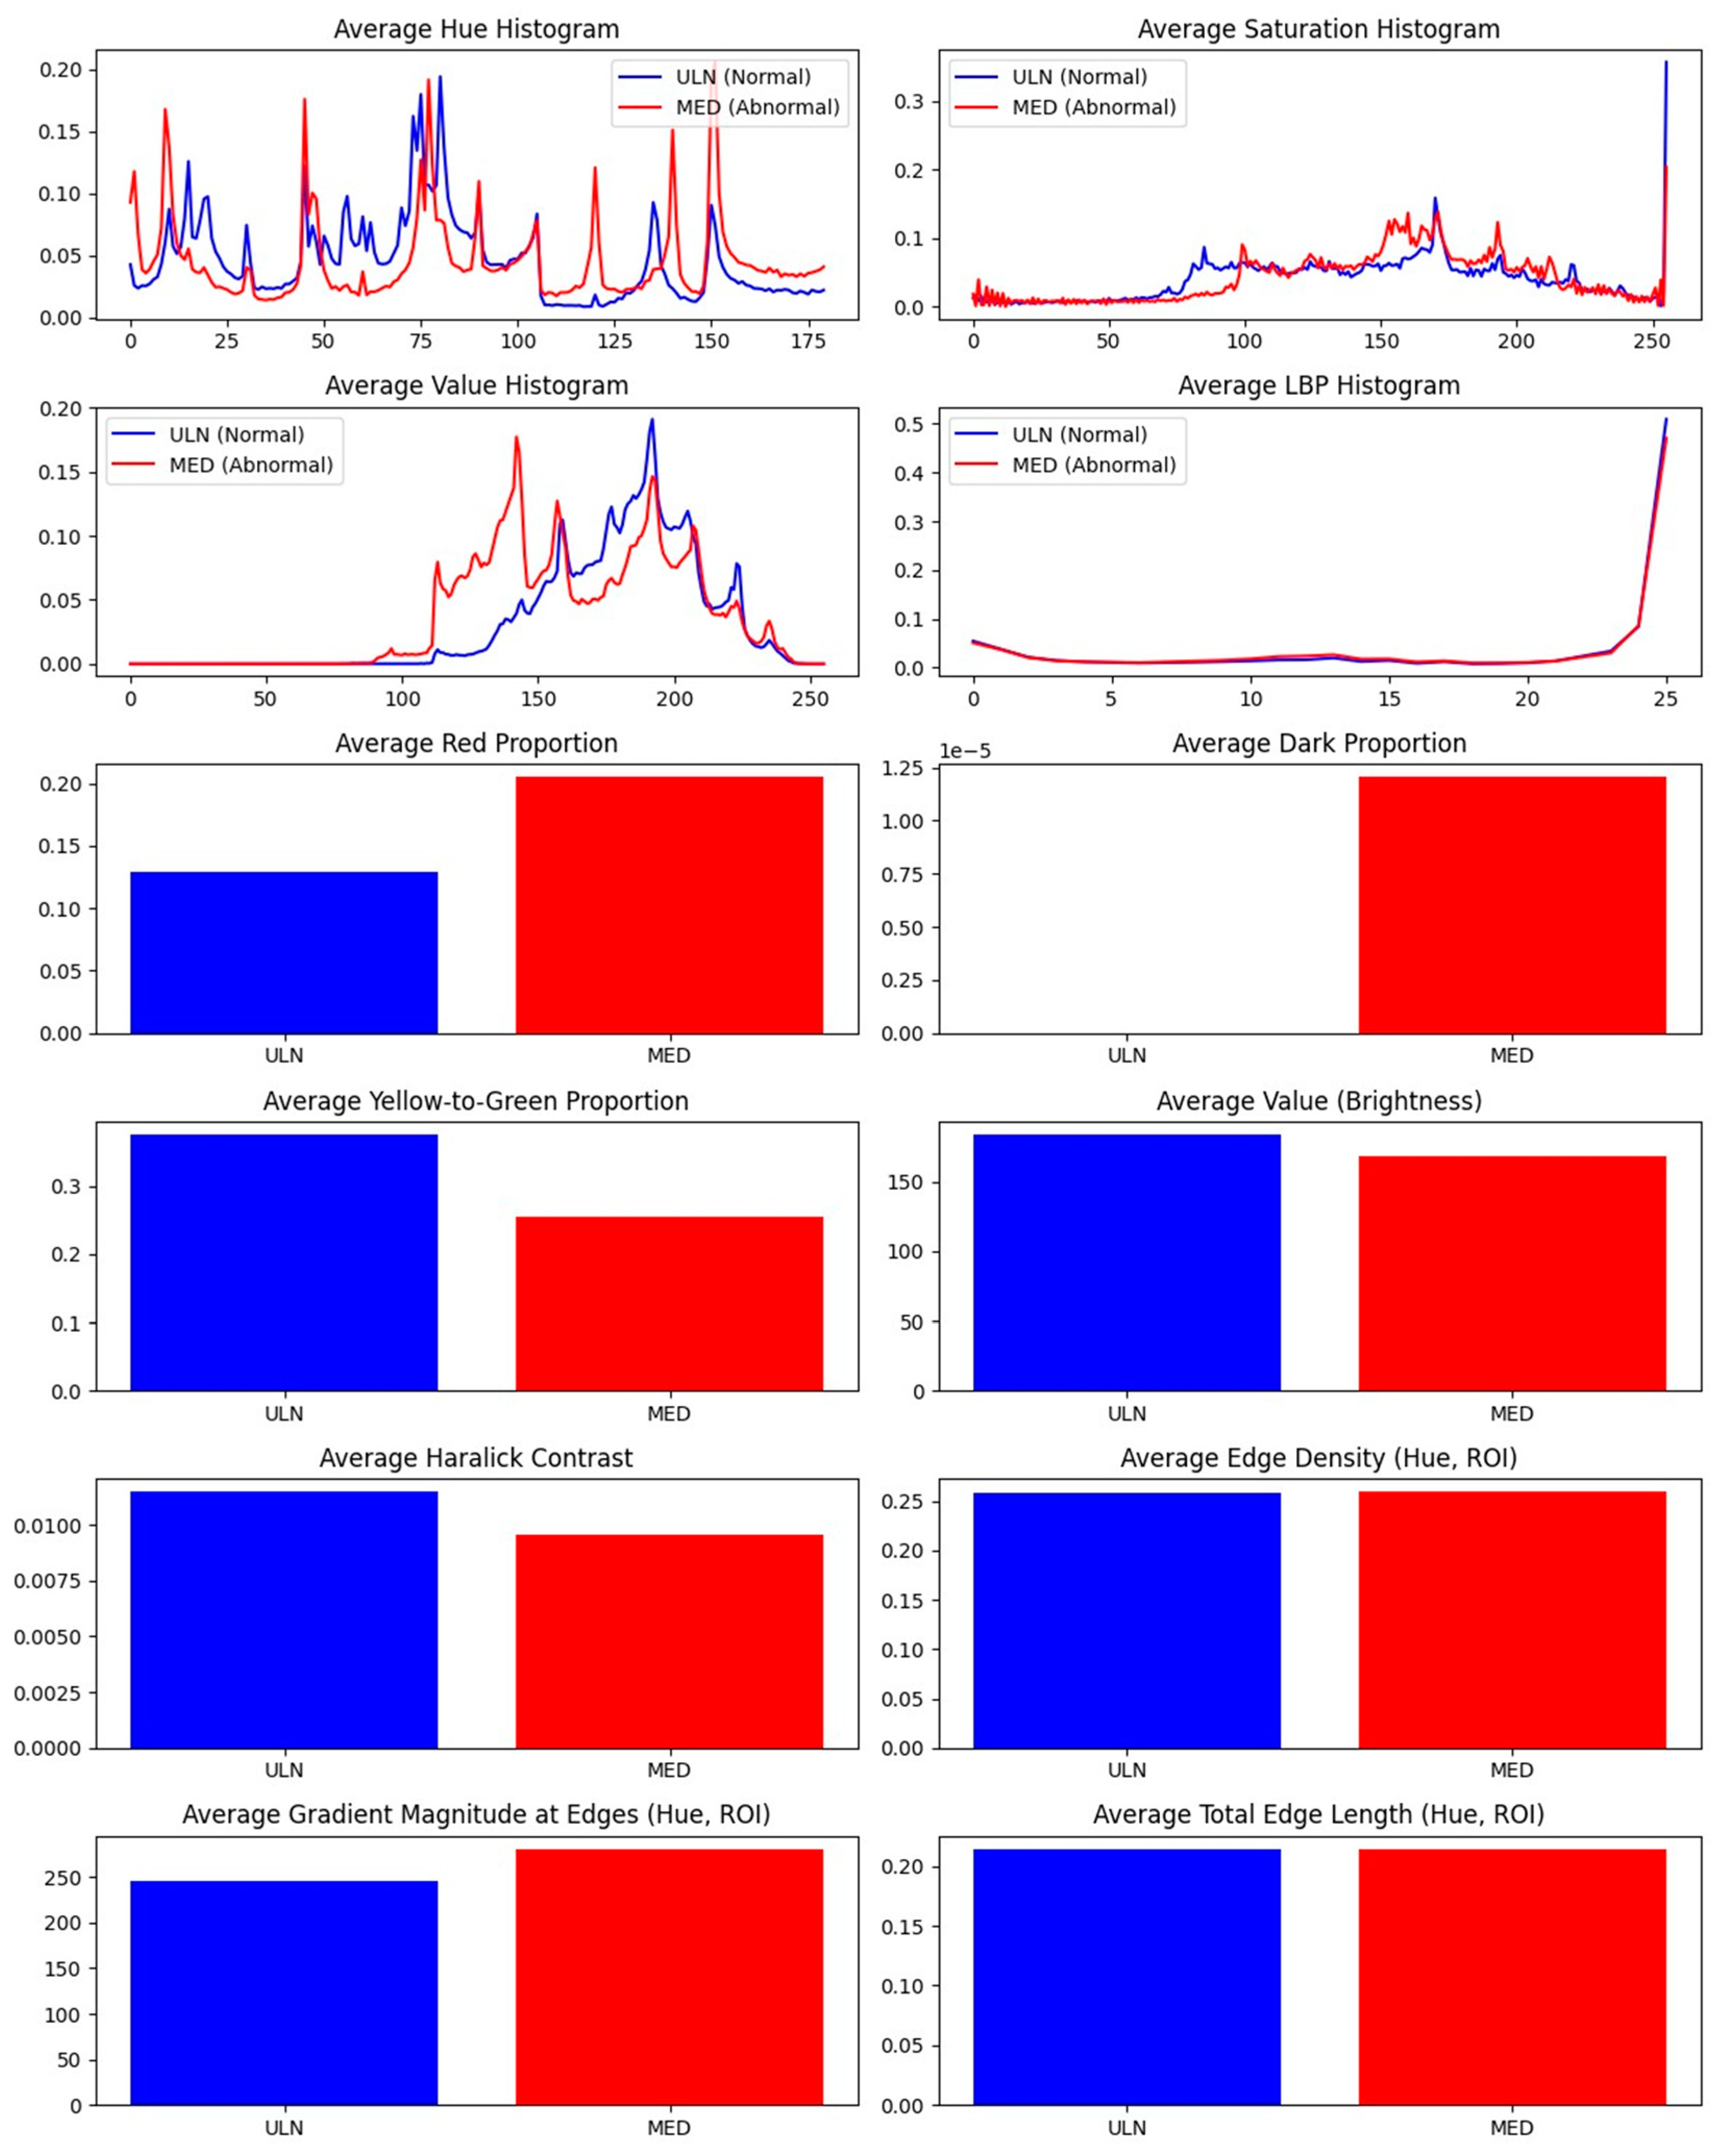
Figure 6.
Comparison of ULN and MED (n=32) scalar p values chart. .

Figure 7.
Histograms (non-scalar parameters) comparison of ULN and MED (n=32).
Disclaimer/Publisher’s Note: The statements, opinions and data contained in all publications are solely those of the individual author(s) and contributor(s) and not of MDPI and/or the editor(s). MDPI and/or the editor(s) disclaim responsibility for any injury to people or property resulting from any ideas, methods, instructions or products referred to in the content. |
© 2025 by the authors. Licensee MDPI, Basel, Switzerland. This article is an open access article distributed under the terms and conditions of the Creative Commons Attribution (CC BY) license (http://creativecommons.org/licenses/by/4.0/).
Copyright: This open access article is published under a Creative Commons CC BY 4.0 license, which permit the free download, distribution, and reuse, provided that the author and preprint are cited in any reuse.


