
Submitted:
11 April 2025
Posted:
14 April 2025
You are already at the latest version
Abstract
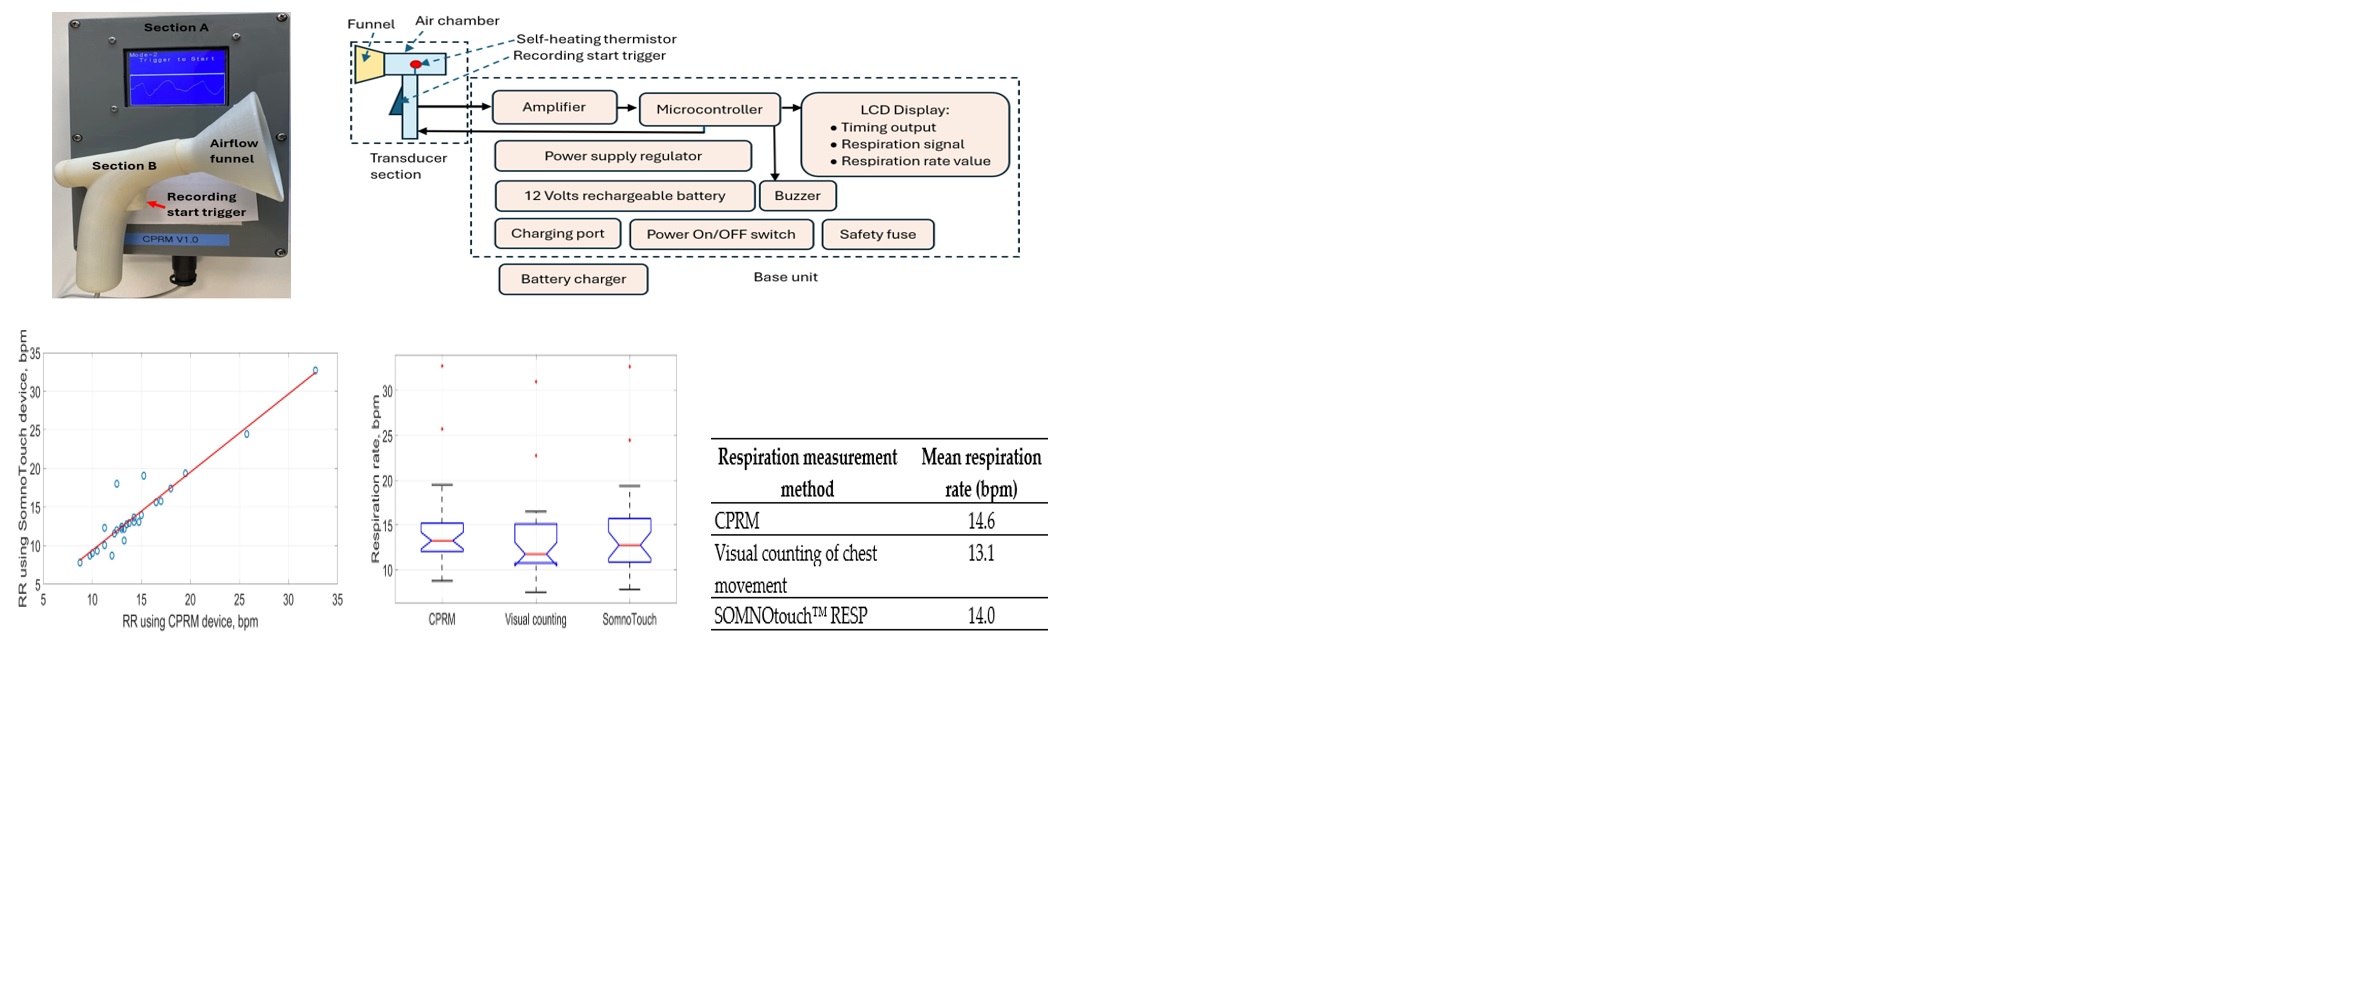
Respiration rate (RR) is an important vital sign for early detection of health deterioration in critically unwell patients. Its measurement is currently subjective, relying on visual counting of chest movements. The design of a new RR measurement device utilising a self-heating thermistor as its sensing element is described. The thermistor is situated in a hand-held air chamber with a funnel attachment that detects respiratory airflow up to 30 cm from the face. The exhaled respiratory airflow reduces the temperature of the thermistor, and its temperature recovers during inhalation. A microcontroller provides signal processing while its display screen shows the respiratory signal and RR. The device has been evaluated on 27 healthy adult volunteers, mean age 32.8 years (standard deviation 8.6 years). The RR readings from the device were compared with the visual counting of chest movements and the contact method of inductance plethysmography implemented using a commercial device (SOMNOtouch™ RESP). The RR readings from the new device and SOMNOtouch™ RESP, averaged across the 27 participants, were 14.6 breaths per minute (bpm) and 14.0 bpm respectively. The device has a robust operation, is easy to use and gives an objective measure of RR in a non-contact manner.
Keywords:
noncontact respiration rate measurement
; digital healthcare device
; medical electronics
; medical devices
1. Introduction
Breathing and respiration involve a sequence of events that include air entering the lungs, oxygen from the inhaled air diffusing from the alveoli into pulmonary capillaries surrounding them and binding to the haemoglobin molecules in red blood cells. The oxygen is transferred to the tissues by the red blood cells where it is converted to energy and the resulting carbon dioxide is exhaled [1]. Respiration rate (RR) is the average number of breaths (inhalation, exhalation cycles) per minute, unit breaths per minute (bpm). RR in healthy adults is typically 12-20 bpm [2]. A study reported the median RR in children from birth to the age of 18 years [3]. According to the study, the median RR in children reduces from around 44 bpm from birth to around 37 bpm when aged one year. Thereafter there is a sharper reduction in RR to about 22 bpm by the age of 6 years and a more gradual reduction to around 15 bpm when aged 18 years.
RR, body temperature, heart rate, systolic blood pressure, level of consciousness and oxygen saturation are the main vital signs for monitoring patients. RR is an early indicator of deterioration and can be used to predict patients at risk of conditions such as cardiac arrest [4]. Measuring RR in acute hospital wards at least daily is encouraged [5]. Despite the importance of measuring RR, it is often missed because of difficulties in its measurement [6,7,8,9,10,11].
RR is typically measured by observing the patient’s chest and manual counting of its movements for 15 seconds [12]. The value is then multiplied by four to convert its value to bpm. This manual counting is subjective and multiplication by four magnifies the measurement error. Manual RR measurement in young children can be more challenging than adults due to their higher RR rate and in some cases, their lack of co-operation.
To overcome the limitations of manual counting of chest movements, several objective RR measurements methods have been reported that can broadly be grouped as contact and non-contact. In the contact methods, the sensing element is attached to the subject’s body while in the non-contact methods, the measurement is performed without any body attachment. A comparison of contact and non-contact RR measurement methods in children was carried out highlighting their strengths and limitations [8]. The study indicated that non-contact RR methods are preferable, especially for children, as they are less disruptive as compared to contact RR methods.
This article describes the design, development and evaluation of a new non-contact respiration rate measurement device. The device was designed primarily for paediatrics because of the greater need for non-contact measurement of RR in that age group however the device is also applicable for adults. The device is referred to in this article as Contact-less Paediatric Respiration Monitor (CPRM).
CPRM uses a self-heating thermistor to detect respiratory airflow and applies signal processing to determine RR as discussed in the methodology section. The utilised technique of anemometery is a flow measurement technology with multiple industrial applications. Its advantages include high sensitivity at low flow rates, durable and robust sensing construction [13]. The use of a self-heating thermistor for anemometry provides high sensitivity to flow rate and requires low power consumption [13]. Some related design considerations were reported in a previous study, in which a thermistor was used as part of a thermal anemometer [14].
The contributions of this study include:
- An overview of technological developments in RR measurement.
- Design and development of a new, easy to use, robust, non-contact RR monitor.
- A thorough simulation and associated design calculations to establish operating parameters of the self-heating thermistor for non-contact RR measurement.
- Evaluation of the performance of the new RR monitor against RR measures obtained by chest movement visual counting and by using a commercial respiratory device called SOMNOtouch™ RESP [15].
In the following sections, an overview of the related literature is provided, the design details of CPRM are explained and its evaluation results are presented.
2. Related Literature Outlining Developments in Respiration Rate Measurement
There are several reviews in the literature exploring various developments in measuring RR, e.g., [8,16,17,18,19,20,21]. An overview of RR measurement methods is provided in this section.
Main contact-based RR measurement methods:
- Pulse oximetry based. Pulse oximeters use the principle that oxyhemoglobin and deoxyhemoglobin absorb red and near-infrared (IR) light distinctly [22]. The approach measures oxygen saturation in peripheral arterial blood (SpO2) [23] and converts it to an electrical signal from which respiration rate is determined. The method however has limitations, e.g., SpO2 may be normal during an increased RR due to hypercapnia [23].
- Electrocardiogram (ECG) derived RR (EDR). In this approach, RR is determined from the ECG signal. The method is non-invasive and can be performed in both time and frequency domains. The movement of chest due to respiration causes the distance between the electrodes used to measure the ECG to vary. This results in dynamic variations in the Q, R and S features of the ECG signal [24] from which RR is derived. A number of approaches were reported to determine RR using EDR [25]. In the frequency domain, the ECG signal is bandpass filtered, and its magnitude frequency spectrum is determined by using the discrete Fourier transform (DFT). The frequency associated with the highest peak in the magnitude frequency spectrum is used to determine RR [24] .
- Chest movement tracking. A variety of approaches were reported for tracking chest movement and converting the information to a respiratory signal. A piezoelectric sensor embedded into a soft elastic band wrapped around the chest produced a signal that once conditioned and digitized indicated RR [26]. Accelerometers placed on the chest converted the respiration related chest movement to an electrical signal [27,28,29,30,31]. In an optical approach, a Mach-Zehnder interferometer (an instrument that measures the relative phase shift variations between two collimated beams produced by splitting light from a single source) has been integrated in a belt worn on the abdomen to provide a means of measuring RR [32]. In inductive plethysmography, chest movement is tracked by typically two separate bands embedded with conducting wires wrapped around the chest and abdomen. The signals from the bands indicate RR [33].
- Thermistor based. The thermistor/thermocouple taped under the nose detects an increase in temperature during exhalation and a decrease in temperature during inhalation. The resulting temperature variations produce a respiratory signal by the sensor. The approach provides a semiquantitative estimation of respiratory airflow (i.e., an indirect measure). Its operation is nonlinear and has a slow response time [34].
- Nasal prongs based. The method provides an indirect measurement of respiratory airflow, relying on the differential pressure of the flow and atmospheric pressure [34]. The relationship between the measured pressure and the respiratory airflow is non-linear [34]. The prongs are plastic tubes placed inside the nostrils and a tube connects them to the device measuring the airflow. Some young children do not tolerate the method due to its nasal proximity.
- Thoracic impedance pneumography. Movements of the chest during breathing cause variations in the thoracic impedance resulting in an RR related electrical signal [35].
- Main non-contact (contactless) RR measurement methods:
- Infrared thermal imaging. The principle associated with this approach is that during exhalation, warmer respiratory air from the lungs increases the skin temperature of the nose, mainly around the nostrils. During inhalation, the environmental air passing through the nose reduces the skin temperature of the region. These temperature fluctuations result in variations in the amount of infrared (IR) radiated from the region. The IR radiation can be measured over time by an IR thermal imaging camera and converted to a respiratory signal. Several studies have developed and evaluated this approach, e.g., [36,37]. The cost of the thermal camera is a consideration in adapting this approach. Furthermore, large head movements cause respiratory region of interest to move out of the field of view of the camera interrupting the measurement.
- Carbon dioxide sensing. The exhaled respiratory air has a higher concentration of carbon dioxide (CO2) in comparison with its concentration in the environment. A non-contact CO2 sensor detects the variations of the CO2 concentration in the air near the subject and converts it to a respiratory signal. Recent technological developments have significantly improved the capability of miniature CO2 sensors [41,42] making this method more practical [20]. The approach, however, is susceptible to distortions such as the presence of another person in the vicinity of the patient being monitored. Sensitive CO2 sensors are costly and often require a pump to direct the respiratory airflow into the sensor, adding an extra cost.
- Humidity measurement. The exhaled air carries moisture from the lungs that can be detected and converted to a signal using a humidity sensor. There are multiple sensor types for this purpose, e.g., nanomaterials coated on a substrate can absorb water molecules changing one or more of their properties [43].
- Ultrasound based. The operation of ultrasound (US) is based on acoustic energy with frequencies higher than 20 kHz. A US transceiver (transmitter and receiver) detects the reflected acoustic signal from the chest converting the variations in its distance to the chest as the chest moves. This approach has been developed and evaluated [52,53,54].
To facilitate an easy and rapid comparison of RR measurement techniques, the methods are represented in Table 1, comparing the technologies, approaches to perform tests and main findings of the studies.
3. Methodology
In this section the design details of CPRM and its evaluation approaches are described. Initially an overview is provided and then each part is described in detail in the related sections.
3.1. Description of the Device’s Overall Hardware
The block diagram of CPRM is shown in Figure 1.
CPRM consists of two main sections:
- Section A: This is its respiratory airflow transducer. It detects the respiratory airflow through its self-heating thermistor located in an air chamber. The air chamber has a funnel attachment for improved respiratory airflow guidance. The thermistor generates an electrical signal in response to respiratory airflow. This section also contains the start RR measurement trigger mechanism.
- Section B: This is the device’s base unit that is connected by a wire to the transducer section (section A). It receives the electrical signal from section A and processes it by its microcontroller. The microcontroller communicates with the RR measurement-start trigger mechanism, sends information to an LCD to indicate the recording time (this is count down of time in seconds from the time the trigger is pressed to finish measurement), displays respiratory signal and shows the value of the RR when measurement is completed. The microcontroller also activates a buzzer to indicate RR value is ready to read from the LCD. The base unit contains power supply regulators and a 12 V rechargeable battery. It has ports to connect it to its battery charger. The unit has a power switch ON/OFF button.
The sections of CPRM are shown in Figure 2a and the base unit is opened to show its electronic circuitry in Figure 2b.
The transducer section of CPRM was 3D printed to ensure it is structurally strong and lightweight. It could withstand the heat generated by the thermistor. It is shown in Figure 3.
Figure 4 shows the transducer section with its funnel removed and the related dimensions in millimeters.
To measure RR, the operator positions the funnel of the transducer section toward the participant’s face, up to 30 cm from the nose. The respiratory signal becomes visible on the LCD of the base unit. By pressing the start RR measurement trigger mechanism, the measurement starts (further details are included in the relevant sections).
3.2. Calculations for the Design Thermistor Circuit and its Operating Temperature
A self-heating thermistor acted as the sensor to convert respiratory airflow to an electrical signal from which RR was determined. Therefore, its type and design parameters were crucial in the successful operation of the device. In this section the calculations and simulations undertaken to determine the type and operating parameters of the self-heating thermistor for the CPRM are described. The mathematical symbols used in this section and their meanings are provided in Table 2.
3.2.1. Thermistor Design Assumptions
Some assumptions were required to make the design practical. However, literature searches and discussions with relevant experienced clinicians were carried out to ensure validity of these assumptions. Wherever possible, the related references are included. The respiratory airflow tidal volume is estimated to be 20-500 ml (infants to adults) with respiration rates varying from: 6-60 bpm, i.e., a period of 1-10 seconds (corresponding frequency 1-0.1 Hz). The longest time to exhale air is assumed to be half the longest period, i.e., 5 seconds. Assuming the velocity of the respiratory air during exhalation is constant, the lowest exhale velocity u is
The point of exhalation could be nasal or oral. Oral exhalation is assumed since it is the largest area and results in the lowest respiratory air velocity. The area is estimated to be about 4 cm2 maximum (equivalent to a 1.77 cm orifice diameter). So, the lowest velocity will be at 6 bpm (i.e., one exhalation cycle every 5 seconds), a 20 ml per breath through an area of 4 cm2 results in a minimum estimated exhaled air exit velocity of:
This velocity value is significantly toward the lower limit since the lower respiration rates are typically observed in adults who have much larger tidal volumes than children. Although not particularly critical, the maximum respiratory airflow is estimated from maximum adult tidal flow at about 15 bpm (one inhale and one exhale, each lasting 2 seconds). Using an orifice of about 2 cm2, respiratory airflow velocity is
The exhaled airflow is captured with a funnel, the outlet of which is directed into the device’s air chamber containing the self-heating thermistor. The incorporation of the funnel was essential to increase the respiratory airflow catchment area and to allow for any misalignment between the sensing air chamber axis and direction of the respiratory airflow. Various experiments and designs were explored in terms of aesthetic appearance, ease of use and functionality of the air chamber. The final design had a funnel having an outer diameter of 83 mm feeding into the sensing air chamber, 89 mm in length and 18 mm in diameter. The length of the air chamber was sufficient to ensure laminar flow for all conditions of use (Reynolds number much less than 2000) and its diameter was sufficiently large to maintain airflow drag to minimum whilst ensuring it was maximized in the region of the thermistor sensor. The latter was mounted on the axis of the air chamber, approximately halfway along its length. The diffusion between the exit orifice of the exhalation and the funnel and misalignment with the respiratory airflow direction was estimated to reduce the air flow through the air chamber to a conservative 25% of the initial exhaled air velocity, i.e., 2.5 mm/sec. In practice, it was found that the actual minimum air flow levels were greater than this at about 50% of the calculated velocity (5 mm/sec.) which was also determined by a 2D computational fluid dynamics (CFD) analysis. The requirements for the thermistor sensor could now be specified as follows:
- Respiratory signal frequency range: 0.1–1 Hz
- Minimum respiratory airflow velocity: 0.005 m/s
- Maximum respiratory airflow velocity: 0.312 m/s
3.3. Design of Self-Heating Thermistor Sensor Circuit
The thermistor used in the device’s design was a self-heating type where the cooling of the thermistor was a function of the respiratory airflow velocity. The resulting temperature changes subsequently altered the thermistor’s resistance and thus the electrical signal produced by it. As compared with typical anemometry applications, the current application requires much higher sensitivity and higher response time. The absolute values of the respiratory airflow velocity were not needed for this design since the device only needed the variations (i.e., rate of change) in the respiratory airflow velocity to determine the value of RR. A potential divider circuit (shown in Figure 5) was used to generate an output voltage signal for the thermistor. The series resistor (Rs) limited the current (It) to the thermistor, represented by its variable resistance as Rt. The signal from the thermistor (Vt) was subsequently bandpass filtered and amplified (explained in following sections). The processes of determining the values Rs and Rt are explained in the next sections.
3.3.1. Selection of Thermistor Resistance and its Series Resistor
The resistance of a thermistor (Rt) at a specific temperature (T) is expressed as
where Ro is the thermistor resistance at temperature To and β is the thermistor constant (Steinhart and Hart, 1968) and Rs is the series resistance shown in Figure 5. From this equation, the temperature coefficient () of resistance at temperature T for a thermistor is
In this design, to maximise the sensitivity of the thermistor as an air velocity sensor and to ensure detection of the highest respiratory airflow variation frequency, the following parameters required consideration in the design:
- Selection of a thermistor with a high value of β.
- Operation of the self-heating thermistor at a temperature significantly higher than the ambient (room) temperature to maximise the cooling effect due to the respiratory airflow with due regard to the reduction in α as temperature increases.
- Selection of a thermistor with a low thermal time constant.
- Electrical characteristics compatible with the proposed circuit function.
The design consideration (i) was realized by selecting an appropriate thermistor type. Consideration (ii) is governed by the choice of the thermistor supply volts and potential divider resistance (Figure 5) as explained later. Consideration (iii) required a suitably low impedance output signal but with a low power consumption and, as such, thermistors with Ro values of 2–10 kΩ were considered suitable. Consideration (iv) is critical since if the thermal lag is too long, the higher respiratory frequencies will be heavily attenuated. The thermal lag is linked to thermal capacity and dissipation rate, so it is generally dependent on the shape and size of the thermistor and the lead wire material and gauge. So, a small device with thin leads was best for this application. Ideally, a relatively high dissipation factor is also beneficial since this would imply a high sensitivity to the cooling by the airflow. Many types of thermistors were commercially available, matching the electrical characteristics, but most of them had relatively long thermal lags. Due to the critical nature of this parameter, some preliminary tests were performed on two most suitable thermistor types having similar electrical characteristics but different thermal lag times and dissipation: (a) the Betatherm Betacurve 3K3A1W2 series and (b) the Measurement Specialists Micro-Beta CHIP type 10K3MCD1. Using the circuit shown in Figure 5, the associated tests are described in the next section.
3.3.2. Thermistor Time Constant (Thermal Lag)
The thermistor time constant defines the speed at which the thermistor resistance changes when experiencing a change in the surrounding temperature. This is analogous to the time constant of an electrical resistor (R)- capacitor (C) filter. For liquids, this is quoted in data sheets as less than 1 second for the Betacurve device and for the Micro-Beta device is 0.2 second. However, we did not find the required data for air, so tests were carried out to determine its approximate value. To carry out these tests, the supply voltage was applied to the circuit shown in Figure 5 and when stable conditions were reached, a flow of 60 mm/s was switched on (via an electromagnetic valve) for 1 minute and then off again with continuous monitoring of thermistor voltage and current. The thermistor voltage variation with time was exponential as shown in Figure 6. This was as expected since the system is analogous to the RC network shown in Figure 7.
For the circuit shown in Figure 7, the thermistor power is related to its circuit current, its temperature to the supply voltage, its thermal capacity to the electrical capacitance and its resistance to the thermal resistance between the thermistor and the surroundings. In the thermal circuit, input power reduces slightly due to the thermistor resistance varying with temperature, but this is minimal over the range of the test and the heating or cooling curves remain substantially exponential in the form. Since the airflow effectively reduces the thermal resistance, the time constant of the self-heating thermistor during its cooling period is slightly less than that during its recovery period. Fitting the curves to exponential equations allowed the approximate time constants to be obtained. The results produced are shown in Table 3 together with the corresponding the cutoff frequency. Table 3 also shows the delay after power on before the thermistor output stabilizes. This is effectively the ‘warm up’ time of the thermistor and is dependent on its thermal capacity. The relatively long time taken for the Betacurve device would require an inconvenient waiting period before the hand-held transducer could be used after triggering. This is plotted in Figure 8 which demonstrates that the slower device would also heavily attenuate at the higher end of the required frequency range (0.1-1 Hz, see Section 3.2.1). The attenuation factor in terms of the thermistor outpt voltage swing under steady state conditions (Vto) versus the thermistor output voltage (Vtf) for a flow variation frequency (f), and time constant (τ) used to obtain results in Table 3 is given by
where (i.e., the product of thermal capacitance and thermal resistance). The slow warm up time and the attenuation of the Betacurve device made it unsuitable for this application so no further tests were carried out on this device.
3.3.3. Dissipation Factor (Dt) Calculations for the Selected Thermistors
The steady state measurements of thermistor voltage and current obtained from the thermal lag test also enabled the dissipation factor Dt, to be determined for the selected thermistor mounted in the air chamber (the tube containing the thermistor) as follows:
Steady state values:
From the thermistor data sheet, its temperature (t) at the resistance value (Rt) can be read allowing the actual dissipation factor, Dt to be determined as follows:
This test was repeated for the thermistor in free still air and found to also be approximately 0.43 mW/˚C. In the data sheet, the still air value for Dt is quoted to be 0.3 mW/oC. Since the precise conditions used for obtaining this value were not described, the difference may be due to conduction through the connecting leads.
3.3.4. Thermistor Operating Temperature Calculations
The thermistor operating temperature needs to be at high enough to give a large change in resistance (ΔRt) with the respiratory airflow velocity (), i.e., needs to be a maximum. The cooling effect of the air stream and thus the temperature of the thermistor is directly proportional to the difference between T and ambient (room) temperature:
where C is a cooling constant and Ta is ambient temperature. As
we can write
Differentiating this with respect to T provides maximum conditions for to be
i.e., the running temperature T = 2 ambient temperature, Ta. This is well above a desirable operating temperature and exceeds the limiting conditions for the thermistor, but it does confirm that the sensitivity increases with usable ranges of T. Thermistors are semiconductor-like devices and are easily damaged when operated above their manufactures stated maximum temperature rating. For this application, the maximum ambient temperature was estimated to be 35 oC. The minimum working temperature range for a typical thermistor is about -20 oC to 105 oC. The lower temperature limit will not be a limitation, but it is important not to exceed the upper temperature limit. Allowing a safety margin of 25%, the upper temperature limit is about 75 oC. Ambient temperature is specified to be 10 oC to 35 oC. So, the self-heating of the thermistor must not increase its temperature by more than about 40 oC maximum. A rise of 35 oC was eventually chosen such that the ‘at rest’ temperature of the thermistor would not exceed 70 oC to avoid possible damage to the heat chamber (sensing tube) and the thermistor supporting components.
3.3.5. Selection of Supply Voltage and Potential Divider Series Resistance Values
In this section the supply voltage (Vs) and the potential divider series resistance (Rs) values are determined.
Supply Voltage (Vs): A conventional low cost 12 Volts rechargeable lead acid battery (as described in the following sections) was selected for Vs since this suited the power requirements for any LED, etc., embellishments that might be added to the device in the future. Depending upon state of charge, the actual battery can vary from around 11.5 to 14.7 volts so a value of 13 was used in the calculations to determine the value of Rs.
Series Resistor (Rs): In a potential divider shown in Figure 5, the output thermistor voltage is given by
For greatest sensitivity the variation of Vt with Rt, needs to be maximised, i.e.,
The parameter is at a maximum when Rt = Rs. This equivalence cannot be maintained under all conditions due to the variation of Rt with temperature so the aim should be for an Rs value that is in the region of the range of Rt values expected through the working temperature range.
Optimum value for (Rs): Although, as shown above, Rs=Rt for maximum sensitivity, the chosen Rs value must also ensure that the thermistor runs within the selected operating temperature range. The temperature rise, ΔT (in oC), of the thermistor due to self-heating is given by
where Pt is the power dissipation in the thermistor in Watts (W) and Dt is the thermistor dissipation coefficient in W/oC. For a potential divider circuit shown in Figure 5, the current, , flowing through it is:
where Vs is the potential divider supply voltage and Rs is the series resistor. The power dissipated by the thermistor, Pt is
From Equations 15-17,
Solving for positive values of Rs from Equation 18,
where
In Equation 20, for a given thermistor, the variables are Ta and Vs so the equation provides a valuable guide as to suitable Rs values required to achieve the designed temperature rise (T-Ta) over the possible range of battery voltages. The values indicated below correspond to the Micro-BetaCHIP type 10K3MCD1 thermistor.
- Thermistor parameters, β = 3976,
- Dt = 0.413 mW/oC (see Section 3.3.3)
- To = 298 K
- Vs = 12 – 14 V
- T = Ta + Designed temperature rise = Ta + 35
The plots for Ta = 10 oC to 35 oC are shown in Figure 9.
Figure 9 indicates the values of Rs range between 2.3 kΩ to 3.4 kΩ depending upon ambient temperature and battery voltage. A value of 3.3 kΩ was selected for Rs. Although this value of Rs is higher than the ideal for the lower battery voltages nevertheless it ensures that the temperature will not rise to an unacceptable level when the battery is fully charged. The suitability of this value was checked by a test of the thermistor mounted in the air chamber with the chosen values of Rs and the voltage across it., i.e., Vs. As described previously (section 3.3.3) by measuring the thermistor voltage (Vt) and current (It) (Figure 5), both its temperature and dissipation rate could be determined for various values of flow rate. The results obtained are shown in Table 4 and Figure 10 which show the measured dissipation rate variations with airflow velocity. These indicate a reduction in sensitivity as the cooling airflow velocity increases. This is as expected since as the airflow velocity increases, the thermistor temperature falls thus reducing its temperature differential with ambient.
The plot of Figure 10 was fitted to a second order polynomial which could be used to predict the thermistor dissipation factor (D, mW/oC) ) at various airflow velocities (v, mm/s), i.e.,
D = -10 -5 v2 + 0.0027v +0.4314
3.3.6. Calculation of Estimated Sensitivity with the Selected Thermistor and Rs Value
It was considered valuable to develop a method of predicting the results of Table 4 since it would allow the performance of different thermistors and associated components to be assessed without the need for practical measurements. It would also allow checking at different ambient temperatures. Solving Equation 20 for Dt,
where
Substituting for Rt from Equation 24 into Equation 14 allows output voltage, Vt, versus temperature rise (ΔT) to be determined and Equation 21 defines power dissipation, Dt, versus temperature rise (ΔT). Using data from these equations, it was possible to plot estimated the thermistor output voltage, Vt, as a function of power dissipation, Dt (Figure 11). The results corresponded well with the measured values. The results are valuable because power dissipation is directly related to cooling the effect of the respiratory airflow and thus Figure 11 indicates predicted overall sensitivity.
3.3.7. Thermistor Output Voltage Measurements at Different Respiration Rates and Flow Velocities
Tests were carried out to ensure that the attenuation due to the thermistor time constant did not reduce the thermistor output signal amplitude to unacceptable levels. To enable the signal to be magnified the steady state (zero flow) d.c. thermistor voltage was balanced out so the figures show the voltage change when the air flow was swithed on. Figure 12 shows two such traces with the remaining results summarised in Figure 13. The actual minimum and maximum values were 0.02 Volts and 0.71 Volts respectively.
3.3.8. Theoretical Relationship Between Respiratory Airflow Velocity and Power Dissipation Rate
The relationship between thermistor power dissipation rate, Dt, and the respiratory airflow velocity is complex and dependens on the Prendtl, Nusselt and Reynolds numbers [60] which are in turn related to the physical parameters and the velocity distribution of the air stream and the shape and size of the thermistor. There were investigations on the cooling effects such as this and have developed empirical formulae to enable theoretical predictions of cooling rates but the tend is specific to the particular characteristics of the test arrangement. Since for this device the thermistor output response versus air flow rate fitted well to a second order polynomial over the range of interest, it was not considered useful to go through the process of adapting published formulae.
3.4. Description of Device’s Electronic Circuitry
In this section the design of the device’s electronic circuitary is described.
3.4.1. Signal Conditioning Circuit
The thermistor signal was fed via a cable to a pre-amplifier circuit in the base unit section of the device (shown in Figure 1). The circuit useda dual low offset, low power, operational amplifier, type OP200 [61]. It consisted of a highpass filter that ensured the “at rest” direct current (DC) voltage component from the potential divider was blocked from the amplifier input. The thermistor amplification circuit is shown in Figure 14.
The inherent thermal lag of the thermistor provided an adequate lowpass filtering to remove any spurious pulse signals arising from sudden changes in airflow velocity, e.g., airflow changes from the recording room air conditioning, etc. However an additional electronic lowpass filter circuit was included to remove any higher electromagnetic frequencies that might be picked up by the circuit. Two amplifier stages were adapted, the first being a simple voltage follower that provided a consistent high impedance load for the thermistor circuit. The second stage had an adjustable gain (through R3 variable resistor) to allow the circuit gain to be trimmed during its testing. The second stage also provided the additional filtering for spurious high frequency noise. The operational amplifiers were supplied with a 3.3 V power source via a voltage stabiliser (discussed in following sections). This voltage level ensured compatibility with the microcontroller input. The amplified thermistor signal was digitised by the microcontroller’s analogue to digital convertor (ADC, 10 bits resolution).
3.4.2. Microcontroller
STM32F407 Discovery Board device [61] shown in Figure 15a was used for the device to control the respiration rate measurement, perform required operations and display the relevant information on the device’s display unit.
This microcontroller is designed for industrial and consumer applications, utilizing 32-bit Arm® Cortex®-M4 with floating point unit (FPU) core, 1 Mbyte Flash memory and 192-Kbyte random access memory (RAM) (STM Microelectronics). It provides low power consumption, high performance and ease of developing applications. With its 32-bit microprocessor, it supports digital signal processing instructions and a wide range of standard communication protocols. It is compatible with multiple Integrated Development Environments (IDEs), such as Keil MDK-ARM. The microcontroller was collected to STM32F4DIS-LCD [63] (shown in Figure 15b) to allow the respiratory signal and RR rate to be displayed.
3.4.3. Recording Start Trigger Mechanism Circuit
The start RR measurement trigger mechanism was integrated into the transducer part (section A) of CPRM. Its circuit, shown in Figure 16. It incorporates a 4N25 optocoupler (manufacturer: Vishay Semiconductors) [64] with a 1 kΩ resistor at its input and 10 kΩ pull up resistor connected to regulated 3.3 Volts (Vcc).
This optocoupler is an industry standard dual-in-line 6-pin package. Its incorporation ensured isolation of the operator of the device from the electrical circuitry. By pressing the trigger mechanism, the device’s output pin (i.e., pin 5) goes high (i.e., to the supply voltage, Vcc). As the device’s output is connected to an input port of the microcontroller, a change in voltage level would indicate the start of RR measurement.
3.4.4. Buzzer Mechanism Circuit
The buzzer mechanism was incorporated into the device’s base unit section to indicate completion of RR measurement allowing the operator of the device to read the measurement. Its circuit (shown in Figure 17) consisted of an IRF530 (N-channel) MOSFET [65] that is designed for fast switching and requires a simple drive circuit. Its resistance is 0.16 Ω and can operate from -55˚C to +175˚C. The gate input pin of IRF530 was connected to an output pin of the microcontroller. Its input pin was raised ‘high’ for a second to activate the buzzer.
3.4.5. Regulated Power Supply Circuit
The power supply elements of the device consisted of a 12 V, rechargeable, sealed lead acid, 0.8Ah, YUCEL battery [66] (Figure 18a). The battery was housed in CPRM base unit with an external port to connect its charger. Its charger was Ansmann ALCS 2-24A [67] (Figure 18b). There were two voltage regulators, one providing 5 V (Figure 18c) and the other proving 3.3 V (Figure 18d). The 5 V regulator circuit incorporated a 7805T [68] device that is commonly used in electronic circuits to provide a constant + 5 Volts output for a variable (unregulated) input supply voltage. Its minimum and maximum input voltages are 7 V and 25 V respectively. Its operating current is 5 mA. The 3.3 V regulator circuit incorporated [69] device.
3.5. Description of the Device’s Software
In this section the method of determining RR from the recorded respiratory signal and other aspects CPRM’s software are explained. CPRM uses a signal sample rate of 20 samples per second to record the respiratory signal. The signal was stored on the STM32F407 VGT6 - Discovery microcontroller [62] memory storage. Given that the respiratory signal is unlikely to exceed 60 bpm or 1 Hz, 20 sample per second was adequate. The software was set up to capture 1024 samples (data points). This corresponded to a recording duration of 1024/20=51.2 seconds. To determine RR, the fast Fourier transform (FFT) operation was prepared in C-language and integrated into the software. Using the FFT function, the magnitude frequency spectrum of the recorded respiratory signal was obtained by determining absolute (magnitude) values of the resulting discrete Fourier transform complex numbers. A requirement for FFT operation is that the number of data points (N) needs to conform to 2k, where k is an integer number. Currently k=10, resulting in 1024 samples. The frequency resolution provided by 1024 data points is sample rate divided by N, i.e., 20/1024=0.0195 Hz. This frequency resolution corresponds to RR resolution of 0.0195×60, i.e., about 1 bpm. Reducing the number of samples recorded negatively affects the RR resolution (accuracy of measuring RR) and increasing the number of samples results in a longer measurement time (this issue is discussed further in the discussion section). CPRM used the highest peak in the magnitude frequency spectrum to determine RR value (i.e., RR= frequency associated with the highest peak×60).
As part of evaluating CPRM (details included in the next section), its measurements were compared with a commercially available respiration monitor, SOMNOtouch™ RESP [15]. This device does not indicate RR but it can record the respiratory signal from two bands, one wrapped around the chest and the other around the abdomen. These signals were averaged to determine an overall respiratory effort. A typical respiratory signal recorded using SOMNOtouch™ RESP is provided in Figure 19. Its magnitude frequency spectrum, with highest peak = 0.269 is also shown in the figure. The peak corresponds to RR of 0.26960= 16.1 bpm.
The microcontroller code was based around a state machine approach for the user interface and display updates. A hardware-based timer interrupt, in combination with the microcontrollers onboard 12 bits Analogue to Digital Converter in Direct Memory Access mode, were used to ensure timing and data acquisition were accurate as required for the subsequent software based FFT operation. The start of start the measurement cycle was controlled by the device trigger button connected to an external interrupt pin on the microcontroller.
3.6. CPRM Evaluation Procedure
The evaluation of the current version was on 27 healthy adult volunteers however the device has been previously evaluated on children (details of the children evaluation are provided in the discussion section). The ethical approval for the study was granted by the UK’s National Health Service (NHS reference number SCH/13/018, correspondence reference 149145). The participants were provided with the study’s information sheet that provided the details of the study, their rights and means of data handling. The participants signed a consent form agreeing to take part in the study. The mean and standard deviation of their ages were 32.8 years and 8.6 years respectively (minimum and maximum: 20 years and 52 years respectively). The participants were 9 males and 18 females.
The participants sat in a comfortable chair and were asked to relax and breathe normally. For comparison to CPRM, the inductance plethysmography was performed using SOMNOtouch™ RESP device. Two experienced clinicians were simultaneously involved with each experiment. A clinician operated the CPRM device, and another clinician visually determined the RR by counting chest movement of the participant while the participant wore the SOMNOtouch™ RESP device. The two clinicians performed their measurements independently to ensure RR values were not biased by the reading of another method. The RR measurements from the three methods (visual counting of the chest movement, SOMNOtouch™ RESP and CPRM) were simultaneous. The monitoring duration for all three methods was the same allowing consistency in the measurements. For each participant the experiment was repeated four times, and the results were averaged.
4. Results
The means and the standard deviations of the measured RRs by CPRM, visual counting of chest movement and SOMNOtouch™ RESP are shown in Table 5. The mean RR values ranged from 13.1 bpm for the visual counting (lowest value) to 14.6 bpm (highest value) for CPRM. The highest RR variability (5.5 bpm) across the participants as measured by the standard deviation was associated with the SOMNOtouch™ RESP device.
The percentage differences (shown in Table 6) between the RRs measured using the three methods were lowest for CPRM and SOMNOtouch™ RESP, i.e., 3.8%. The difference was highest between CRRM and visual counting, i.e., 11.0%.
The correlation coefficients between the RRs measured by the three methods are provided by the correlation matrix shown in Table 7. The values range between 0.949 (for CPRM and SOMNOtouch™ RESP) and 0.994 (for SOMNOtouch™ RESP and visual).
The scatter plots of RRs measurements using the three methods are shown in Figure 20, Figure 21 and Figure 22. The best straight-line fit is shown in red. The methods provided a close relationship however two outliers are visible in the plots.
The boxplots comparing the RR measurements using the three approaches are provided in Figure 23. The red line inside each boxplot is the measurement median that is close for all three approaches.
A means to explore the extent a new method compares against a more well-established method is by the Bland-Altman plot [70]. The Bland-Altman plot shows the difference between the two pairs of measurements (on the vertical axis) against the means of the measurements (on the horizontal axis). Bland and Altman recommended that 95% of the measurements should lie within ±1.96 standard deviation of the mean difference [70]. The Bland-Altman plot comparing CPRM against visual counting RR measurement is shown in Figure 24. A measurement is on the 1.96 standard deviation boundary line, and another is outside this limit. Therefore, for CPRM, RR measurements conform to the recommendation by Bland-Altman.
The Bland-Altman plot for RR measures obtained using SOMNOtouch™ RESP is provided in Figure 25. As was the case for CPRM, two measurements are either on or outside the ±1.96 boundary however overall, the measurements conform to the recommended Bland-Altman.
5. Discussions
The design and evaluation of CPRM device as a new non-contact and easy to use RR measurement device were described. The device operates by detecting respiratory airflow using a self-heating thermistor. This provided a sensitive and sufficiently fast response to variations in respiratory airflow and coped well with a broad range of RR values. The device’s hardware provided the required signal conditioning to ensure accurate noise removal and digitisation. The optimal operational parameters of the self-heating thermistor for RR measurement were determined through careful design and simulations. The features of the microcontroller provided an effective means of determining RR. The device’s display unit shows the respiratory signal, RR rate and the timing information (i.e., count down of time, in seconds, from when the measurement started to the end of measurement) in real-time. Once the measurement is complete, the RR value is displayed of the device’s screen, and the operator is altered by a buzzer to read the value from the display.
CPRM was evaluated on 27 healthy adult volunteers by its simultaneous RR measurements of chest movement visual counting and SOMNOtouch™ RESP device. To determine RR using the SOMNOtouch™ RESP device, its recorded respiratory signal needed was fast Fourier transformed off-line, and the frequency associated with the highest peak in its magnitude frequency spectrum was identified and multiplied by 60 (providing RR in bpm). To provide an accurate comparison of the three methods, the measurements were repeated four times, and their average values were used in the analysis.
The RR values obtained simultaneously using the three methods were close, however the mean RR for chest movement visual counting method was 11% lower than the RR from CPRM, i.e., 13.1 bpm for visual counting against 14.6 bpm for CPRM (i.e., difference of 1.5 bpm). The chest movement visual counting method of RR measurement is subjective and relies on the experience and attention of the clinician performing the operation. For infants and very young children, visual counting of chest movement is a greater challenge as compared to adults. This is because their respiration rate is significantly higher, their chest movements may not be as pronounced, and they may not cooperate as effectively. The mean percentage difference between the RR measured by CPRM and that determined from SOMNOtouch™ RESP was 3.8% or 0.6 bpm. The difference was lower than the difference between the RR measurements by CPRM and visual counting of chest movement.
The SOMNOtouch™ RESP was considered as the gold standard method in this study however it is not used routinely in clinical practice due lack of availability of the device in routine clinical care. The visual counting method was the “usual care” method that is used routinely in clinical practice but is known to have low inter-observer reliability [10]. The fact that the correlation of RR measure between CPRM and the gold standard method was good indicates CPRM it is an accurate alternative to the current “usual care” of measuring RR by visual counting of chest movement.
The correlation coefficients comparing the three methods ranged from 0.948 (for CPRM versus SOMNOtouch™ RESP) to 0.994 (for SOMNOtouch™ RESP versus Visual). The closeness of the measurements was further illustrated by the Bland-Altman plots.
The evaluation of CPRM reported in this study focused on healthy adult volunteers. In our earlier study, we also evaluated CPRM on 30 children (aged 8 months to 15 years) undergoing polysomnography sleep studies at Sheffield Children’s Hospital (Sheffield, UK) [9]. The study highlighted the robustness of CPRM operation however we are currently further developing the device by considering the following:
- Miniaturization of the device: Currently CPRM uses a base unit with dimension length= 24 cm, width= 16 cm and height = 9 cm. However, it is possible to replace the current microcontroller board with a more dedicated microprocessor integrated circuit and use surface mount electronic components thus reducing the device’s size. Its rechargeable battery can also be replaced with a smaller type.
- RR recording time: Currently 1024 sample (data points) are recorded at 20 samples per second. This corresponds to a recording duration of 1024/20=51.2 seconds. In the follow-on model of the device, the recording duration will become adaptive, allowing a lower recording duration for babies and young children (a higher respiration rate compared to adults) that may not cooperate, and a higher recording duration for adults that have a much lower respiration rate and are more cooperative. This would require an alternative means of determining RR from the respiratory signal, e.g., breath-by-breath RR calculation whereby the time between successive respiratory cycles is measured [26].
- CPRM will be further evaluated in clinical settings on a larger population of varied age groups.
- We will ensure full conformance with the medical devices directives (MHRA) [71] to allow its routine clinical use.
6. Conclusions
The hardware and software designs and development of a new non-contact respiration rate (RR) monitor utilising a self-heating thermistor was described. It can detect respiratory airflow up to 30 cm from the face to provide RR reading. The device (CPRM) facilitates RR measurement objective as compared to the subjective visual chest movement counting method that relies on the experience and level of attention of the clinician. The RR measured by CPRM was evaluated against RR measurement obtained by visual counting and a commercial device called SOMNOtouch™ RESP. The measurements from CPRM and SOMNOtouch™ RESP were close. CPRM is easy to operate and robust in its functioning.
Author Contributions
Conceptualization, X R.S., A.H., J.T., H.E., W.D., R.N.K., B.H., D.B., A.J. and R.L.E.; methodology, R.S., A.H., J.T., H.E., W.D., R.N.K., B.H., D.B., A.J. and R.L.E.; software, R.S., A.H., J.T., H.E., W.D., R.N.K., B.H., D.B., A.J. and R.L.E.; validation, R.S., A.H., J.T., H.E., W.D., R.N.K., B.H., D.B., A.J. and R.L.E.; formal analysis, R.S., A.H., J.T., H.E., W.D., R.N.K., B.H., D.B., A.J. and R.L.E.; investigation, R.S., A.H., J.T., H.E., W.D., R.N.K., B.H., D.B., A.J. and R.L.E.; resources, R.S., A.H., J.T., H.E., W.D., R.N.K., B.H., D.B., A.J. and R.L.E.; data curation, R.S., A.H., J.T., H.E., W.D., R.N.K., B.H., D.B., A.J. and R.L.E.; writing—original draft preparation, R.S., A.H., J.T., H.E., W.D., R.N.K., B.H., D.B., A.J. and R.L.E.; writing—review and editing, R.S., A.H., J.T., H.E., W.D., R.N.K., B.H., D.B., A.J. and R.L.E.; visualization, R.S., A.H., J.T., H.E., W.D., R.N.K., B.H., D.B., A.J. and R.L.E.; supervision, R.S., A.H., J.T., H.E., W.D., R.N.K., B.H., D.B., A.J. and R.L.E.; project administration, R.S., A.H., J.T., H.E., W.D., R.N.K., B.H., D.B., A.J. and R.L.E.; funding acquisition, R.S., A.H., J.T., H.E., W.D., R.N.K., B.H., D.B., A.J. and R.L.E. All authors have read and agreed to the published version of the manuscript.
Funding
This research was funded by the National Institute of Health Research (NIHR), United Kingdom.
Institutional Review Board Statement
The study was conducted in accordance with the Declaration of Helsinki and approved by the UK’s National Health Service (NHS reference number SCH/13/018, correspondence reference 149145).
Informed Consent Statement
Informed consent was obtained from all subjects involved in the study.
Acknowledgments
This work was made possible by the kind participation of the individuals taking part in evaluating the device. The authors are very grateful for their assistance.
Conflicts of Interest
The authors declare no conflicts of interest.
References
- Webster, L.R.; Karan, S. The physiology and maintenances of respiration: A narrative review. Pain Ther 2020, 9, 467–486. [Google Scholar] [CrossRef] [PubMed]
- Hill, B.; Annesley, S.H. Monitoring respiratory rate in adults. British Journal of Nursing, 2020, 29, 12–16. [Google Scholar] [CrossRef] [PubMed]
- Fleming, S.; Thompson, M.; Stevens, R.; Heneghan, C.; Plüddemann, A.; Maconochie, I.; Tarassenko, L.; Mant, D. Normal ranges of heart rate and respiratory rate in children from birth to 18 years: a systematic review of observational studies. Lancet 2011, 377, 1011–1018. [Google Scholar] [CrossRef] [PubMed]
- Kelly, C. Respiratory rate 1: why measurement and recording are crucial. Nursing Times [online] 2018, 114, 24–24. [Google Scholar]
- Cretikos, M.A.; Bellomo, R.; Hillman, K.; Chen, J.; Finfer, S.; Flabouris, A. Respiratory rate: the neglected vital sign. The Medical Journal Of Australia 2008, 188, 657–659. [Google Scholar] [CrossRef]
- Palmer, J.H.; James, S.; Wadsworth, D.; Gordon, C.J.; Craft, J. How registered nurses are measuring respiratory rates in adult acute care health settings: An integrative review. Wiley Journal of Clinical Nursing, 2023, 32, 4515–4527. [Google Scholar] [CrossRef]
- Kayser, S.A.; Williamson, R.; Siefert, G.; Roberts, D.; Murray, A. Respiratory rate monitoring and early detection of deterioration practices. British Journal of Nursing 2023, 32, 620–627. [Google Scholar] [CrossRef]
- Daw, W.; Kingshott, R.; Saatchi, R.; Burke, D.; Holloway, A.; Travis, J.; Evans, R.; Jones, A.; Hughes, B.; Elphick, H. Medical devices for measuring respiratory rate in children: a review. Journal of Advances in Biomedical Engineering and Technology 2016, 3, 21–27. [Google Scholar] [CrossRef]
- Daw, W.; Kingshott, R.; Saatchi, R.; Elphick, H. Contactless portable respiratory rate monitor (CPRM) accurately measures respiratory rate in sleeping children. Archives of Diseases in Childhood 2016, 101, A290–A291. [Google Scholar] [CrossRef]
- Daw, W.J.; Kingshott, R.N.; Elphick, H.E. Poor inter-observer agreement in the measurement of respiratory rate in children: a prospective observational study. BMJ Paediatr Open. 2017, 1, e000173. [Google Scholar] [CrossRef] [PubMed] [PubMed Central]
- Daw, W.; Kaur, R.; Delaney, M.; Elphick, H. Respiratory rate is an early predictor of clinical deterioration in children. Pediatr Pulmonol. 2020, 55, 2041–2049. [Google Scholar] [CrossRef] [PubMed]
- Nakitende, I.; Namujwiga, T.; Dunsmuir, D.; Ansermino, J.M.; Wasingya-Kasereka, L.; Kellett, J. Respiratory rates observed over 15 seconds compared with rates measured using the RRate app. Practice-based evidence from an observational study of acutely ill adult medical patients during their hospital admission. Acute Medicine 2020, 19, 15–20. [Google Scholar] [CrossRef] [PubMed]
- Schellander, M.; Schweighofer, B.; Neumayer, M.; Wegleiter, H. Investigation of thermal anemometry with thermistor sensing elements for gas flow measurements in harsh environments. IEEE Sensors Letters 2023, 7, 1–4. [Google Scholar] [CrossRef]
- Martin, D.P.; Grant, J.J.; Ringwood, J.V. Evaluation of a prototype thermal anemometer for use in low air speed drying measure calculations. Flow Measurement and Instrumentation 2002, 12, 385–396. [Google Scholar] [CrossRef]
- SOMNOmedics, SOMNOtouch™ RESP https://somnomedics.de/en/solutions/sleep_diagnostics/polygraphy-devices/somnotouch-resp/ Last accessed 12 September 2024.
- AL-Khalidi, F.Q.; Saatchi, R.; Burke, D.; Elphick, H.; Tan, S. Respiration rate monitoring methods: A review. Pediatr. Pulmonol. 2011, 46, 523–529. [Google Scholar] [CrossRef]
- Vitazkova, D.; Foltan, E.; Kosnacova, H.; Micjan, M.; Donoval, M.; Kuzma, A.; Kopani, M.; Vavrinsky, E. Advances in respiratory monitoring: A comprehensive review of wearable and remote technologies. Biosensors 2024, 14, 1–50. [Google Scholar] [CrossRef]
- Massaroni, C.; Nicolò, A.; Presti, D.L.; Sacchetti, M.; Silvestri, S.; Schena, E. Contact-based methods for measuring respiratory rate. MDPI Sensors 2019, 19, 1–47. [Google Scholar] [CrossRef]
- Yin, Z.; Yang, Y.; Hu, C.; Li, J.; Qin, B.; Yang, X. Wearable respiratory sensors for health monitoring. Asia Materials, 2024, 16, 1–29. [Google Scholar] [CrossRef]
- Kim, D.; Lee, J.; Park, M., K.; Ko, S.H. Recent developments in wearable breath sensors for healthcare monitoring. Communication Materials 2024, 5, 1–14. [Google Scholar] [CrossRef]
- Van der Linden, M.; Veldhoen, E.S.; Arasteh, E.; Long, X.; Alderliesten, T.; de Goederen, R.; Dudink, J. Noncontact respiration monitoring techniques in young children: A scoping review. Pediatric Pulmonology 2024, 59, 1871–1884. [Google Scholar] [CrossRef]
- Chan, E.D.; Chan, M.M.; Chan, M.M. Pulse oximetry: Understanding its basic principles facilitates appreciation of its limitations. Respiratory Medicine 2013, 107, 789–799. [Google Scholar] [CrossRef] [PubMed]
- Elliott, M.; Baird, J. Pulse oximetry and the enduring neglect of respiratory rate assessment: a commentary on patient surveillance. British Journal of Nursing 2019, 28, 1256–1259. [Google Scholar] [CrossRef] [PubMed]
- Fan, J.; Yang, S.; Liu, J.; Zhu, Z.; Xiao, J.; Chang, L.; Lin, S.; Zhou, J. A high accuracy & ultra-low power ECG-derived respiration estimation processor for wearable respiration monitoring Sensor. Biosensors 2022, 12, 665–1. [Google Scholar] [CrossRef] [PubMed]
- Varon, C.; Morales, J.; Lázaro, J.; Orini, M.; Deviaene, M.; Kontaxis, S.; Testelmans, D.; Buyse, B.; Borzée, P.; Sörnmo, L.; Laguna, P.; Gil, E.; Bailón, R. A comparative study of ECG derived respiration in ambulatory monitoring using the single-lead ECG. Scientific Reports, 2020; 10, 5704, 1–14. [Google Scholar]
- Saatchi, R.; Elphick, H.; Rowson, J.; Wesseler, M.; Marris, J.; Shortland, S.; Thomas, L. Development of a new prototype paediatric central sleep apnoea monitor. Technologies 2024, 12, 1–17. [Google Scholar] [CrossRef]
- Jarchi, D.; Rodgers, S.J.; Tarassenko, L.; Clifton, D.A. Accelerometry-based estimation of respiratory rate for post-intensive care patient monitoring. IEEE Sensors Journal 2018, 18, 4981–4989. [Google Scholar] [CrossRef]
- Siqueira, A.; Spirandeli, A.F.; Moraes, R.; Zarzoso, V. Respiratory waveform estimation from multiple accelerometers: an optimal sensor number and placement analysis. IEEE Journal of Biomedical and Health Informatics 2019, 23, 1507–1515. [Google Scholar] [CrossRef]
- De Fazio, R.; Stabile, M.; De Vittorio, M.; Velázquez, R.; Visconti, P. An Overview of wearable piezoresistive and inertial sensors for respiration rate monitoring. Electronics 2021, 10, 1–35. [Google Scholar] [CrossRef]
- Ryser, F.; Hanassab, S.; Lambercy, O.; Werth, E.; Gassert, R. Respiratory analysis during sleep using a chest-worn accelerometer: A machine learning approach. Biomedical Signal Processing and Control 2022, 78, 1–10. [Google Scholar] [CrossRef]
- Schipper, F.; van Sloun, R.J.G.; Grassi, A.; Derkx, R.; Overeem, S.; Fonseca, P. Estimation of respiratory rate and effort from a chest-worn accelerometer using constrained and recursive principal component analysis. IOP Publishing Physiological Measurement 2021, 42, 1–16. [Google Scholar] [CrossRef]
- Cao, Z.; Shao, M.; Yuan, Y.; Ma, X.; Yu, Y.; Qiao, X. In-fiber Mach-Zehnder interferometer for wearable respiration measurement, Sensors & Actuators: A. Physical 2023, 364, 1–9. [Google Scholar]
- Carry, P.Y.; Baconnier, P.; Eberhard, A.; Cotte, P.; Benchetrit, G. Evaluation of respiratory inductive plethysmography: accuracy for analysis of respiratory waveforms. Chest 1997, 111, 910–915. [Google Scholar] [CrossRef] [PubMed]
- Hernández, L.; Ballester, E.; Farré, R.; Badia, J.R.; Lobelo, R.; Navajas, D.; Montserrat, J.M. Performance of nasal prongs in sleep studies. Chest 2001, 119, 442–450. [Google Scholar] [CrossRef] [PubMed]
- Aqueveque, P.; Gómez, B.; Monsalve, E.; Germany, E.; Ortega-Bastidas, P.; Dubo, S.; Pino, S.J. Simple wireless impedance pneumography system for unobtrusive sensing of respiration. MDPI Sensor 2020, 20, 1–16. [Google Scholar] [CrossRef] [PubMed]
- Alkali, A.H.; Saatchi, R.; Elphick, H.; Burke, D. Thermal image processing for real-time non-contact respiration rate monitoring. IET Circuits, Devices and Systems 2017, 11, 142–148. [Google Scholar] [CrossRef]
- Elphick, H.; Alkali, A.; Kingshott, R.; Burke, D.; Saatchi, R. Exploratory study to evaluate respiratory rate using a thermal imaging camera. Respiration 2019, 97, 205–212. [Google Scholar] [CrossRef]
- Hwang, H.; Lee, K.; Lee, E.C. A real-time remote respiration measurement method with improved robustness based on a CNN model. Applied Sciences 2022, 12, 1–26. [Google Scholar] [CrossRef]
- Wang, W.; den Brinker, A.C. Algorithmic insights of camera-based respiratory motion extraction. Physiological Measurement 2022, 43, 1–20. [Google Scholar] [CrossRef]
- Addison, P.S.; Antunes, A.; Montgomery, D.; Smit, P.; Borg, U.R. Robust non-contact monitoring of respiratory rate using a depth camera. Journal of Clinical Monitoring and Computing 2023, 37, 1003–1010. [Google Scholar] [CrossRef]
- Umeda, A.; Ishizaka, M.; Ikeda, A.; Miyagawa, K.; Mochida, A.; Takeda, H.; Takeda, K.; Fukushi, I.; Okada, Y.; Gozal, D. Recent insights into the measurement of carbon dioxide concentrations for clinical practice in respiratory medicine. Sensors 2021, 21, 5636. [Google Scholar] [CrossRef]
- Sankaran, D.; Zeinali, L.; Iqbal, S.; Chandrasekharan, P.; Lakshminrusimha, S. Non-invasive carbon dioxide monitoring in neonates: methods, benefits, and pitfalls. Journal of Perinatology 2021, 41, 2580–2589. [Google Scholar] [CrossRef]
- Kano, S.; Jarulertwathana, N.; Mohd-Noor, S.; Hyun, J.K.; Asahara, R.; Mekaru, H. Respiratory monitoring by ultrafast humidity sensors with nanomaterials: A review. Sensors 2022, 22, 1–30. [Google Scholar] [CrossRef] [PubMed]
- Doheny, E.P.; O’Callaghan, B.P.F.; Fahed, V.S.; Liegey, J.; Goulding, C.; Ryan, S.; Lowery, M.M. Estimation of respiratory rate and exhale duration using audio signals recorded by smartphone microphones. Biomedical Signal Processing and Control 2023, 80, 1–13. [Google Scholar] [CrossRef]
- Nam, Y.; Reyes, B.A.; Chon, K.H. Estimation of Respiratory Rates Using the Built-in Microphone of a Smartphone or headset. IEEE Journal OF Biomedical and Health Informatics 2016, 20, 1493–1501. [Google Scholar] [CrossRef] [PubMed]
- Yabuki, S.; Toyama, H.; Takei, Y.; Wagatsuma, T.; Yabuki, H.; Yamauchi, M. Influences of environmental noise level and respiration rate on the accuracy of acoustic respiration rate monitoring. Journal of Clinical Monitoring and Computing 2018, 32, 127–132. [Google Scholar] [CrossRef]
- Edanami, K.; Sun, G. Medical radar signal dataset for non-contact respiration and heart rate measurement. 2022, 40, 1–5.
- Lee, Y.S.; Pathirana, P.N.; Steinfort, C.L.; Caelli, T. Monitoring and analysis of respiratory patterns using microwave doppler radar. Medical Imaging and Diagnostic Radiology, 2014, 2, 1–12. [Google Scholar] [CrossRef]
- Yang, F.; He, Z.; Fu, Y.; Li, L.; Jiang, K.; Xie, F. Noncontact detection of respiration rate based on forward scatter radar. MDPI Sensors 2019, 19, 1–12. [Google Scholar] [CrossRef]
- van Loon, K.; Breteler, M.J.M.; van Wolfwinkel, L.; Leyssius, A.T.R.; Kossen, S.; Kalkman, C.J. van Zaane, B.; Peelen, L.M. Wireless non-invasive continuous respiratory monitoring with FMCW radar: A clinical validation study. J Clin Monit Comput. [CrossRef]
- Yoo, S.K.; Lee, J. Radar-based detection of respiration rate with adaptive harmonic quefrency selection. Sensors 2020, 20, 1–13. [Google Scholar] [CrossRef]
- Abdulqader, T.; Saatchi, R.; Elphick, H. Respiration measurement in a simulated setting incorporating the internet of things. Technologies 2021, 9, 1–12. [Google Scholar] [CrossRef]
- Ge, L.; Zhang, J.; Wei, J. Single-frequency ultrasound-based respiration rate estimation with smartphones. Computational and Mathematical Methods in Medicine 2018, 3675974, 1–8. [Google Scholar] [CrossRef]
- Arlotto, P.; Grimaldi, M.; Naeck, R.; Ginoux, J.-M. An ultrasonic contactless sensor for breathing monitoring. Sensors 2014, 14, 1–16. [Google Scholar] [CrossRef]
- Charlton, P.H.; Birrenkott, D.A.; Bonnici, T.; Pimentel, M.A.F.; Johnson, A.E.W.; Alastruey, J.; Tarassenko, L.; Watkinson, P.J.; Beale, R.; Clifton, D.A. Breathing rate estimation from the electrocardiogram and photoplethysmogram: a review, IEEE reviews in Biomedical Engineering 2018, 11, 2–20. 11.
- Chon, K.H.; Dash, S.; Ju, K. Estimation of respiratory rate from photoplethysmogram data using time–frequency spectral estimation. IEEE Transactions On Biomedical Engineering 2009, 56, 2054–2063. [Google Scholar] [CrossRef] [PubMed]
- Ginsburg, A.S.; Lenahan, J.L.; Izadnegahdar, R.; Ansermino, J.M. A systematic review of tools to measure respiratory rate in order to identify childhood pneumonia. American Journal of Respiratory and Critical Care Medicine 2018, 197, 1116–1127. [Google Scholar] [CrossRef] [PubMed]
- Henricson, J.; Glasin, J.; Rindebratt, S.; Wilhelms, D. Respiratory rate monitoring in healthy volunteers by central photoplethysmography compared to capnography. Journal of Biophotonics 2022, e202100270, 1–7. [Google Scholar] [CrossRef]
- Karlen, W.; Gan, H.; Chiu, M.; Michelle, C.; Dunsmuir, D.; Zhou, C.; Dumont, G.A.; Ansermino, M. Improving the accuracy and efficiency of respiratory rate measurements in children using mobile devices. PLOS ONE 2014, 9, 1–9. [Google Scholar] [CrossRef] [PubMed]
- Will, J.P.; Kruyt, N.P.; Venner, C.H. An experimental study of forced convective heat transfer from smooth, solid spheres. International Journal of Heat and Mass Transfer 2017, 109, 1059–1067. [Google Scholar] [CrossRef]
- Analogue Devices, OP200 Data Sheet, Dual low offset, low power, operational amplifier. https://www.analog.com/media/en/technical-documentation/data-sheets/op200.pdf, Last accessed. 15 August.
- STMiroelectronics, https://www.st.com/en/microcontrollers-microprocessors/stm32f407-417/products.html, Last accessed. 04 April.
- STM32F4DIS-LC, https://www.farnell.com/datasheets/1671831.pdf, Last accessed. 04 April.
- Vishay, Optocoupler, https://www.vishay.com/docs/83725/4n25.pdf, last accessed. 07 April.
- Vishay, IRF530 Power MOSFET, https://www.vishay.com/docs/91019/irf530.pdf, last accessed. 07 April.
- Yucel lead acid rechargeable battery, 12V, 0.8h, C20. https://www.yuasa.co. 16 August.
- Ansmann, battery charger for lead acid 12V 900mA, manufacturer part number 9564006-1. https://www.ansmann.de/en, last accessed. 16 August.
- 7805T datasheet, https://www.alldatasheet.com/view.jsp?Searchword=7805T&sField=1, last accessed. 07 April.
- LD1117V33 STMicroelectronics https://www.digikey.co.uk/en/products/detail/stmicroelectronics/LD1117V33/586012?srsltid=AfmBOooNdTX0upFJWFTn7CXDWi4E-lbXgrJYI-Sn6IpWBjYTrp_z16ND, last accessed. 07 April.
- Giavarina, D. Understanding Bland Altman analysis. Biochemia Medica 2015, 25, 141–151. [Google Scholar] [CrossRef]
- MHRA, The Medicines and Healthcare Products Regulatory Agency, https://www.gov.uk/government/news/welcome-to-our-new-mhra-website, Last accessed. 07 April.
Figure 1.
CPRM block diagram indicating its main elements.
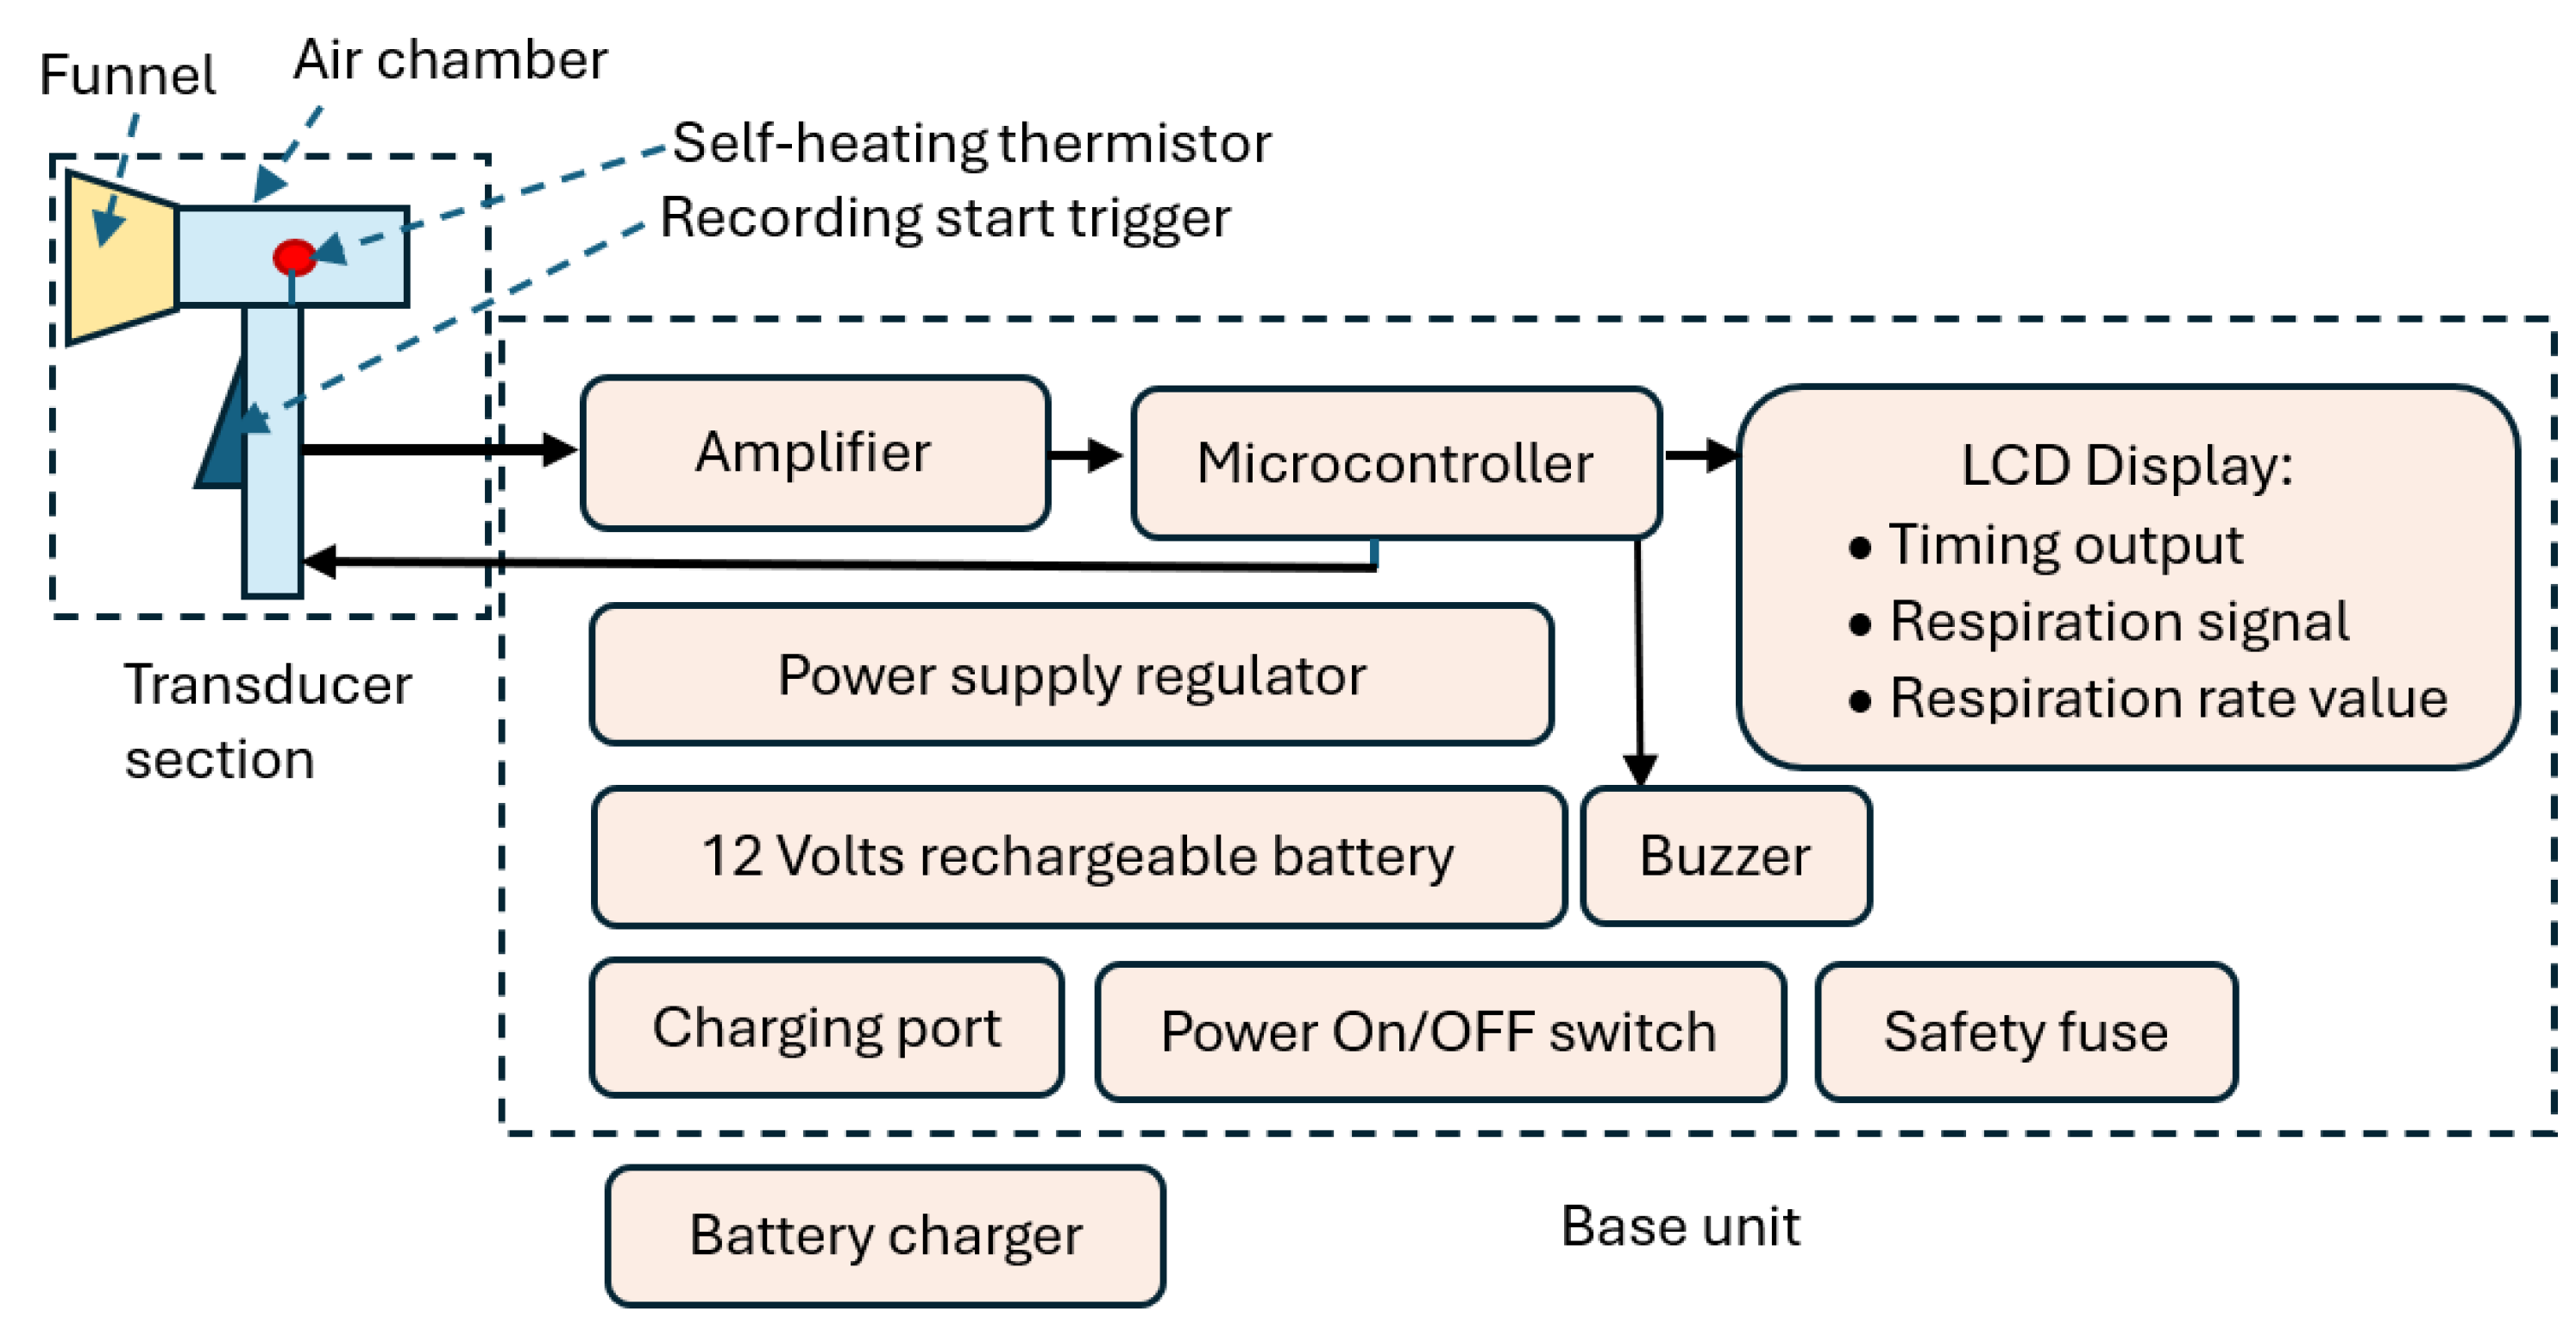
Figure 2.
(a) A photograph of CPRM displaying its transducer and base units, (b) CPRM base unit case opened to show its electronic circuitry.
Figure 2.
(a) A photograph of CPRM displaying its transducer and base units, (b) CPRM base unit case opened to show its electronic circuitry.
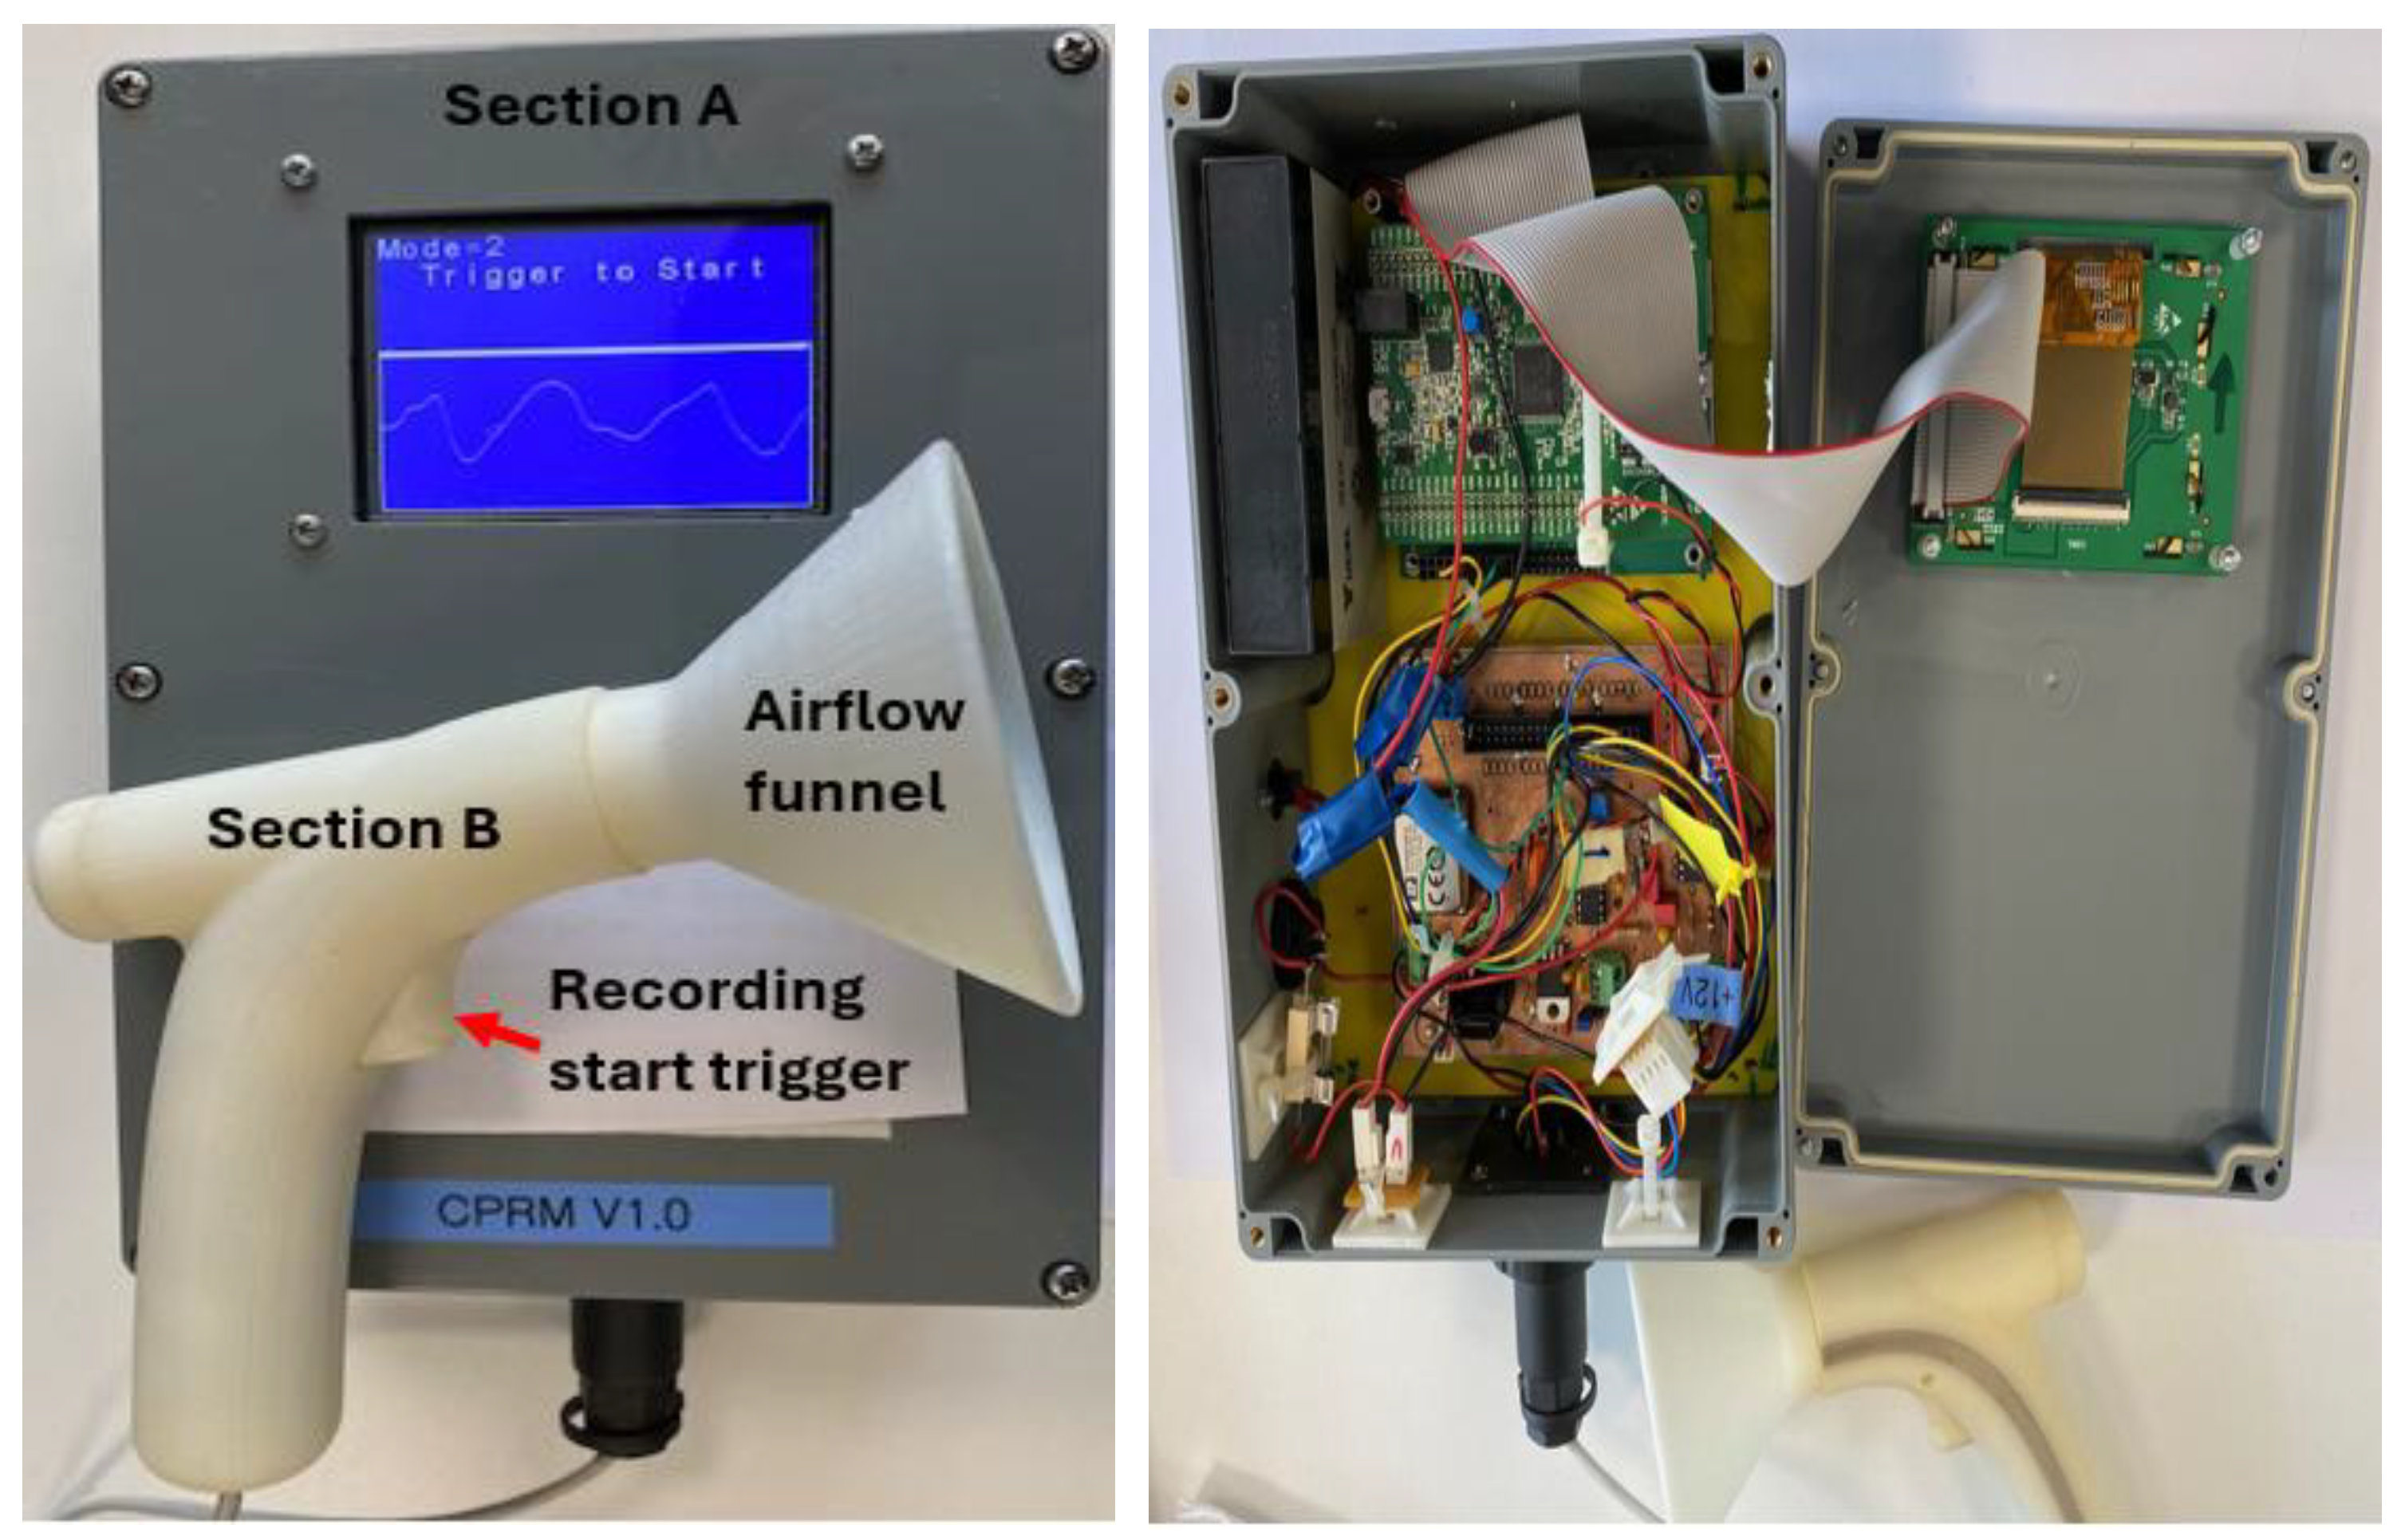
Figure 3.
The 3D printed transducer section (section A of the device).
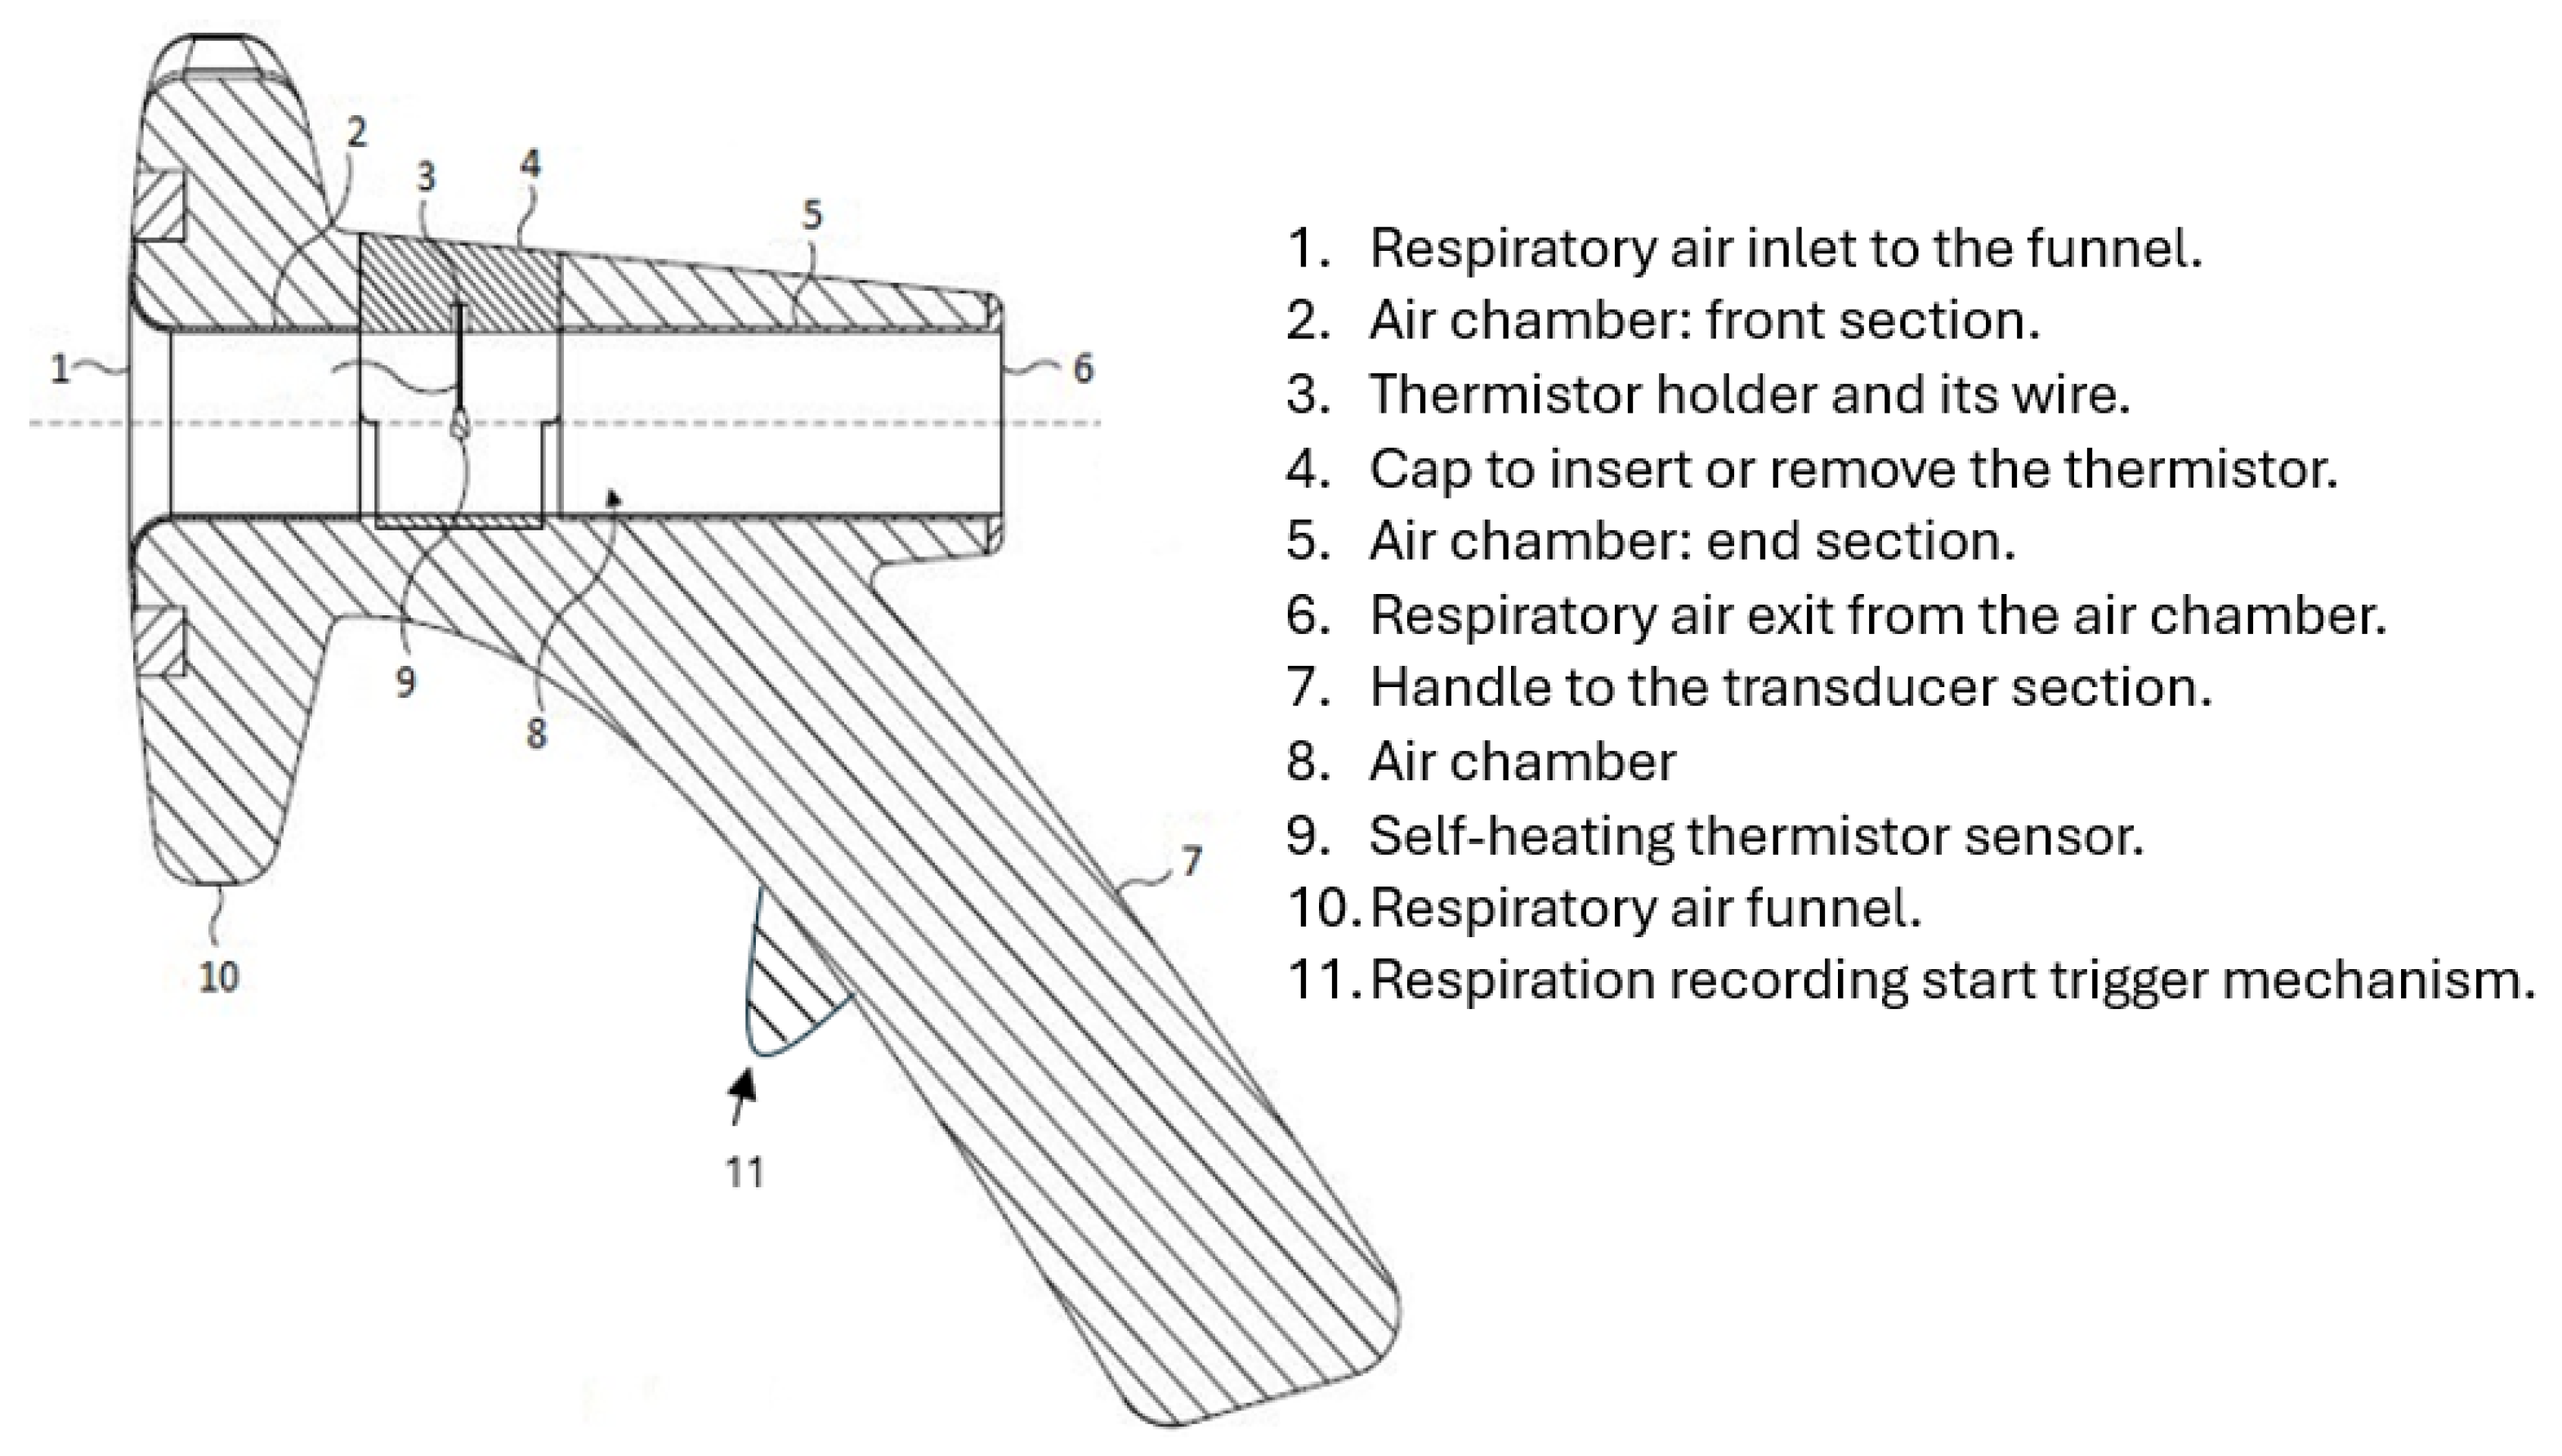
Figure 4.
The transducer section with its funnel removed and related dimensions shown in millimeters. (a) The funnel air inlet side, (b) The funnel reverse end, (c) The funnel side view, (d) Side view of the transducer section with the funnel removed, (e) Front view of the transducer section with the funnel removed, (f) reverse view of the transducer section with the funnel removed.
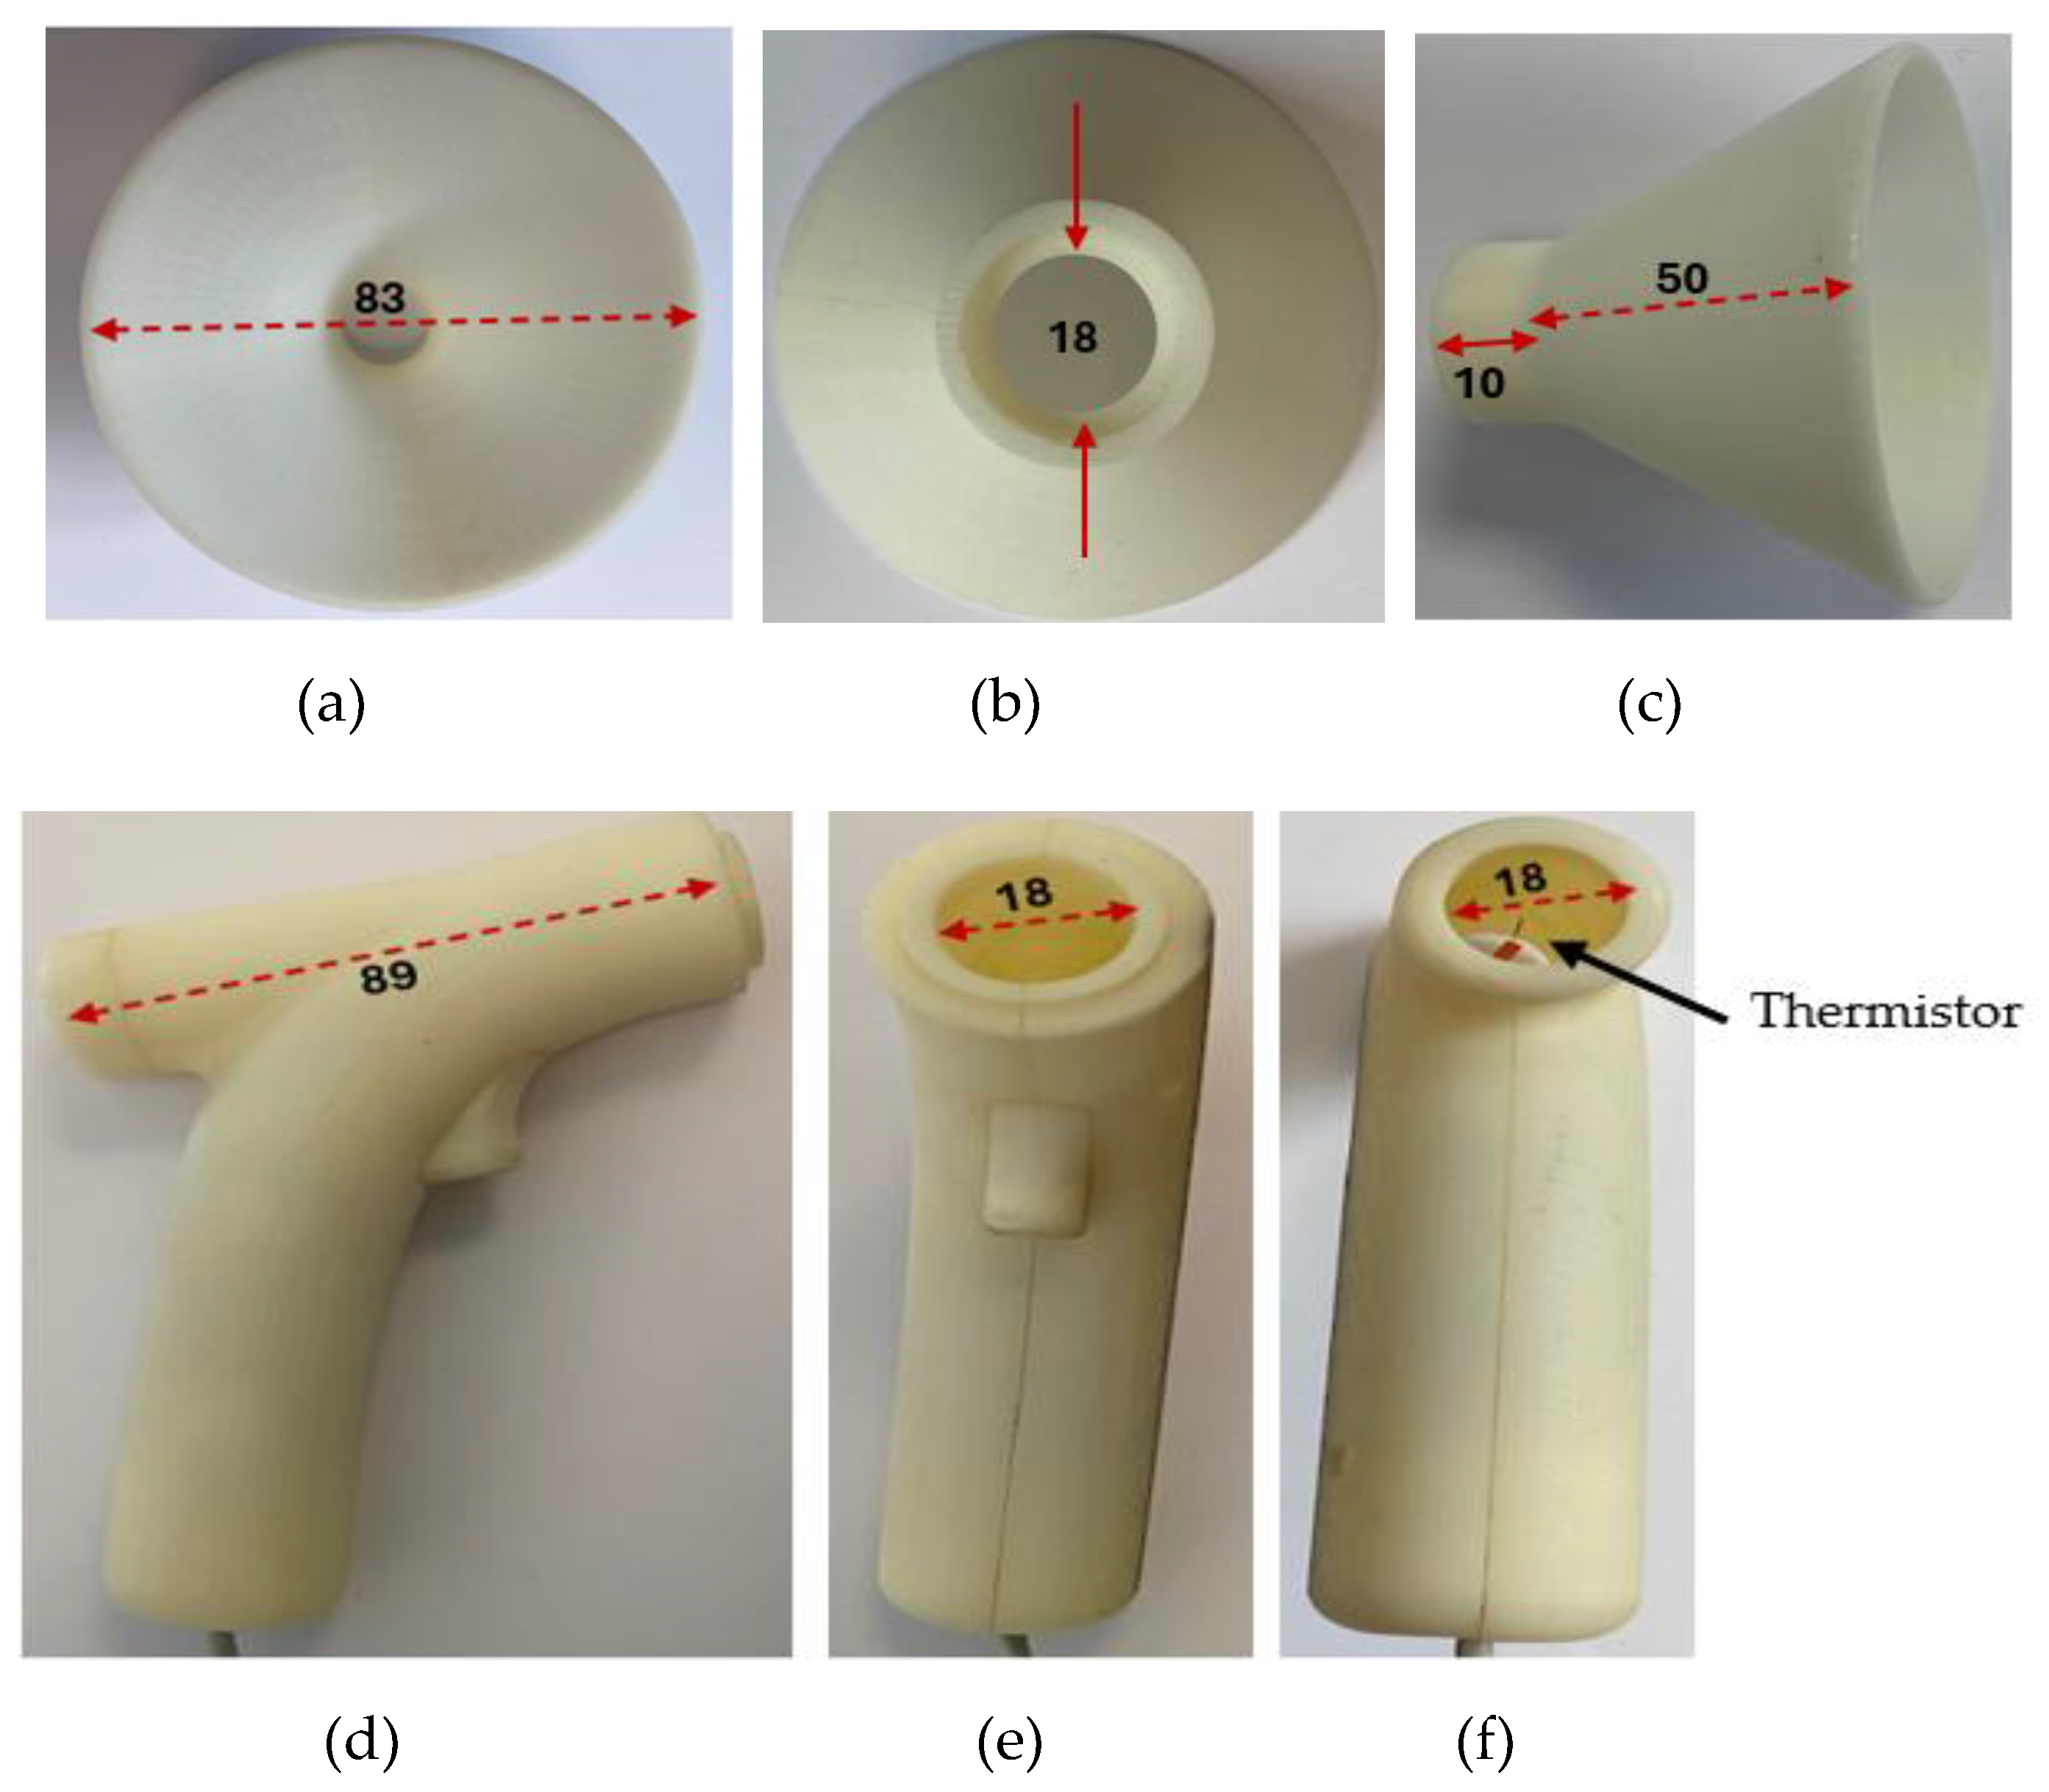
Figure 5.
The potential divider for the thermistor.
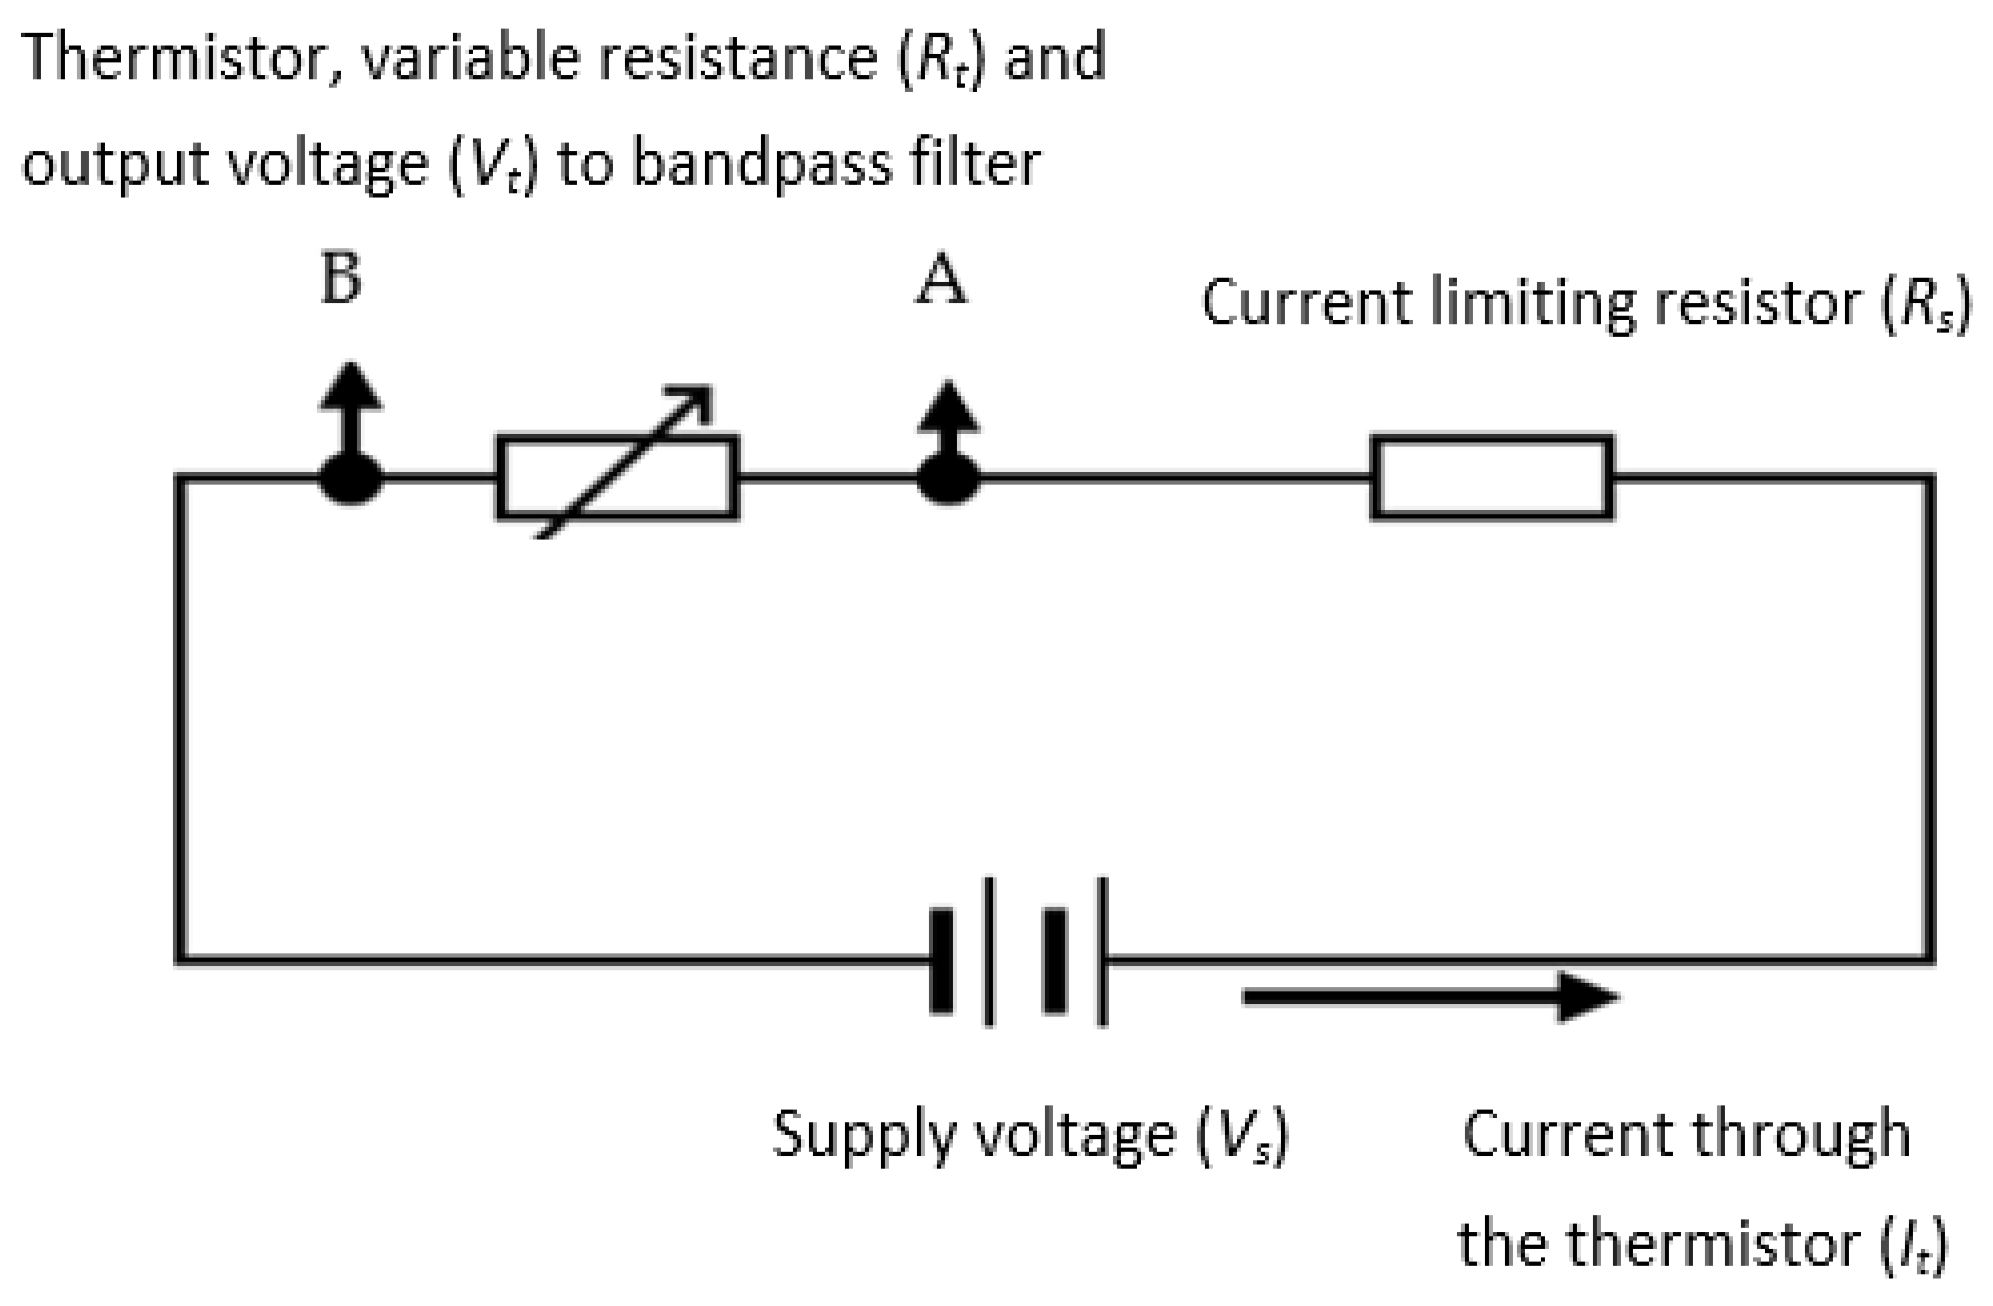
Figure 6.
Response times for 3K3A1W23k and the 10K3MCD1 10k thermistors (rising edge corresponds to 60 mm/s flow switched on – i.e., cooling phase). Blue plot is for 3 kΩ thermistor and orange is for 10 kΩ thermistor.
Figure 6.
Response times for 3K3A1W23k and the 10K3MCD1 10k thermistors (rising edge corresponds to 60 mm/s flow switched on – i.e., cooling phase). Blue plot is for 3 kΩ thermistor and orange is for 10 kΩ thermistor.
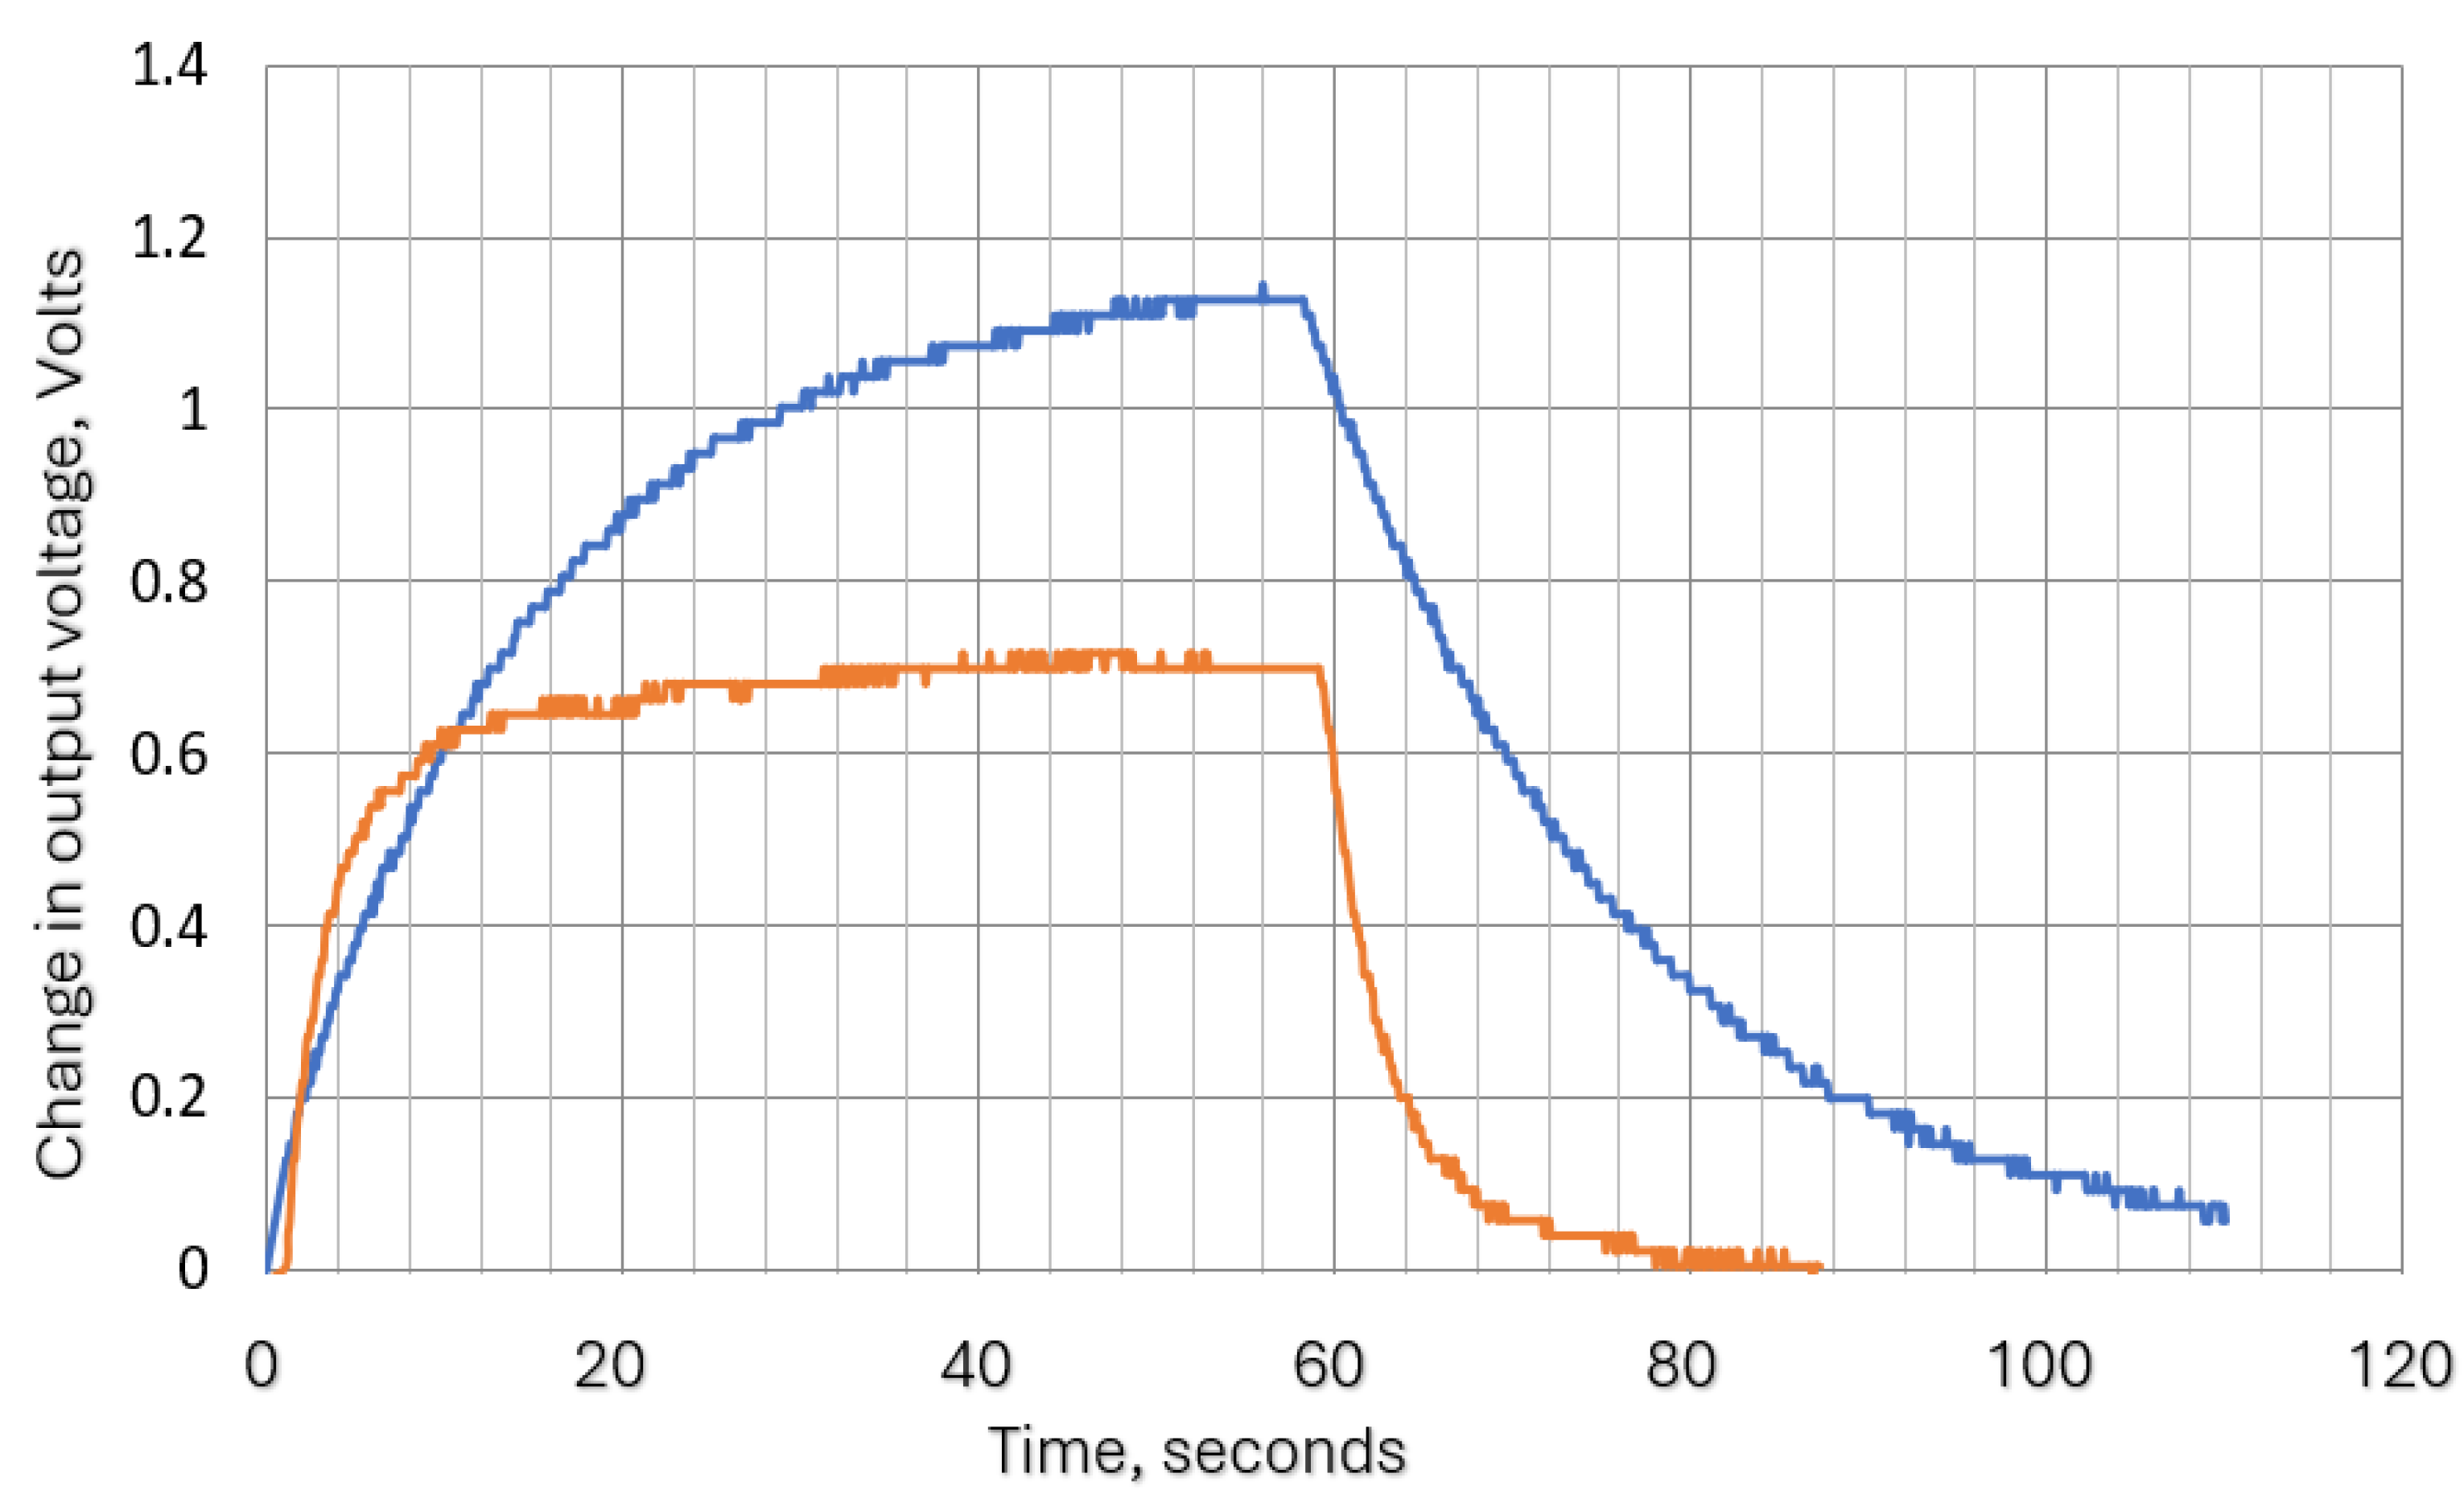
Figure 7.
Resistor-Capacitor network, analogous electrical circuit for heating /cooling process.
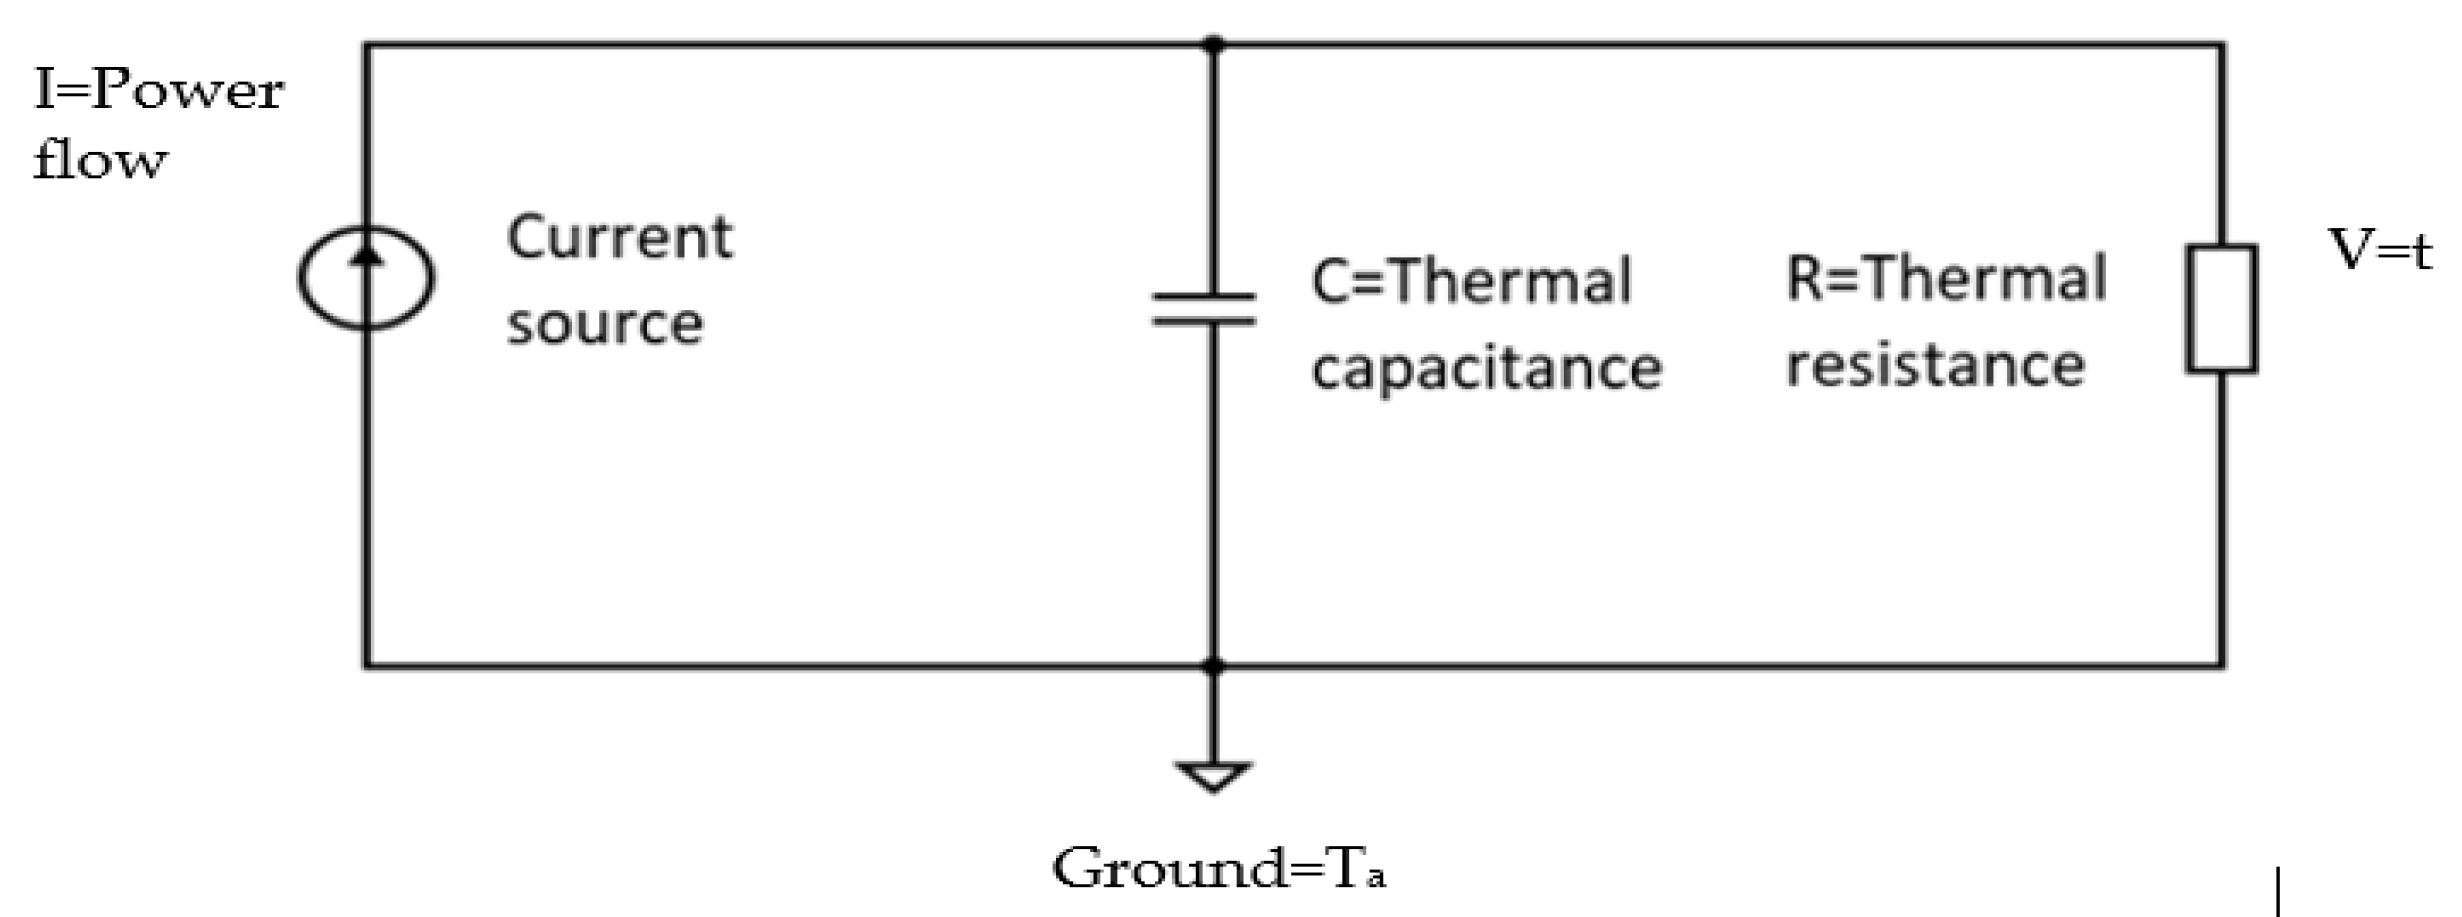
Figure 8.
Theoritical attenuation variation with frequency for time constants, 1, 3, 5, 10 and 20 seconds.
Figure 8.
Theoritical attenuation variation with frequency for time constants, 1, 3, 5, 10 and 20 seconds.
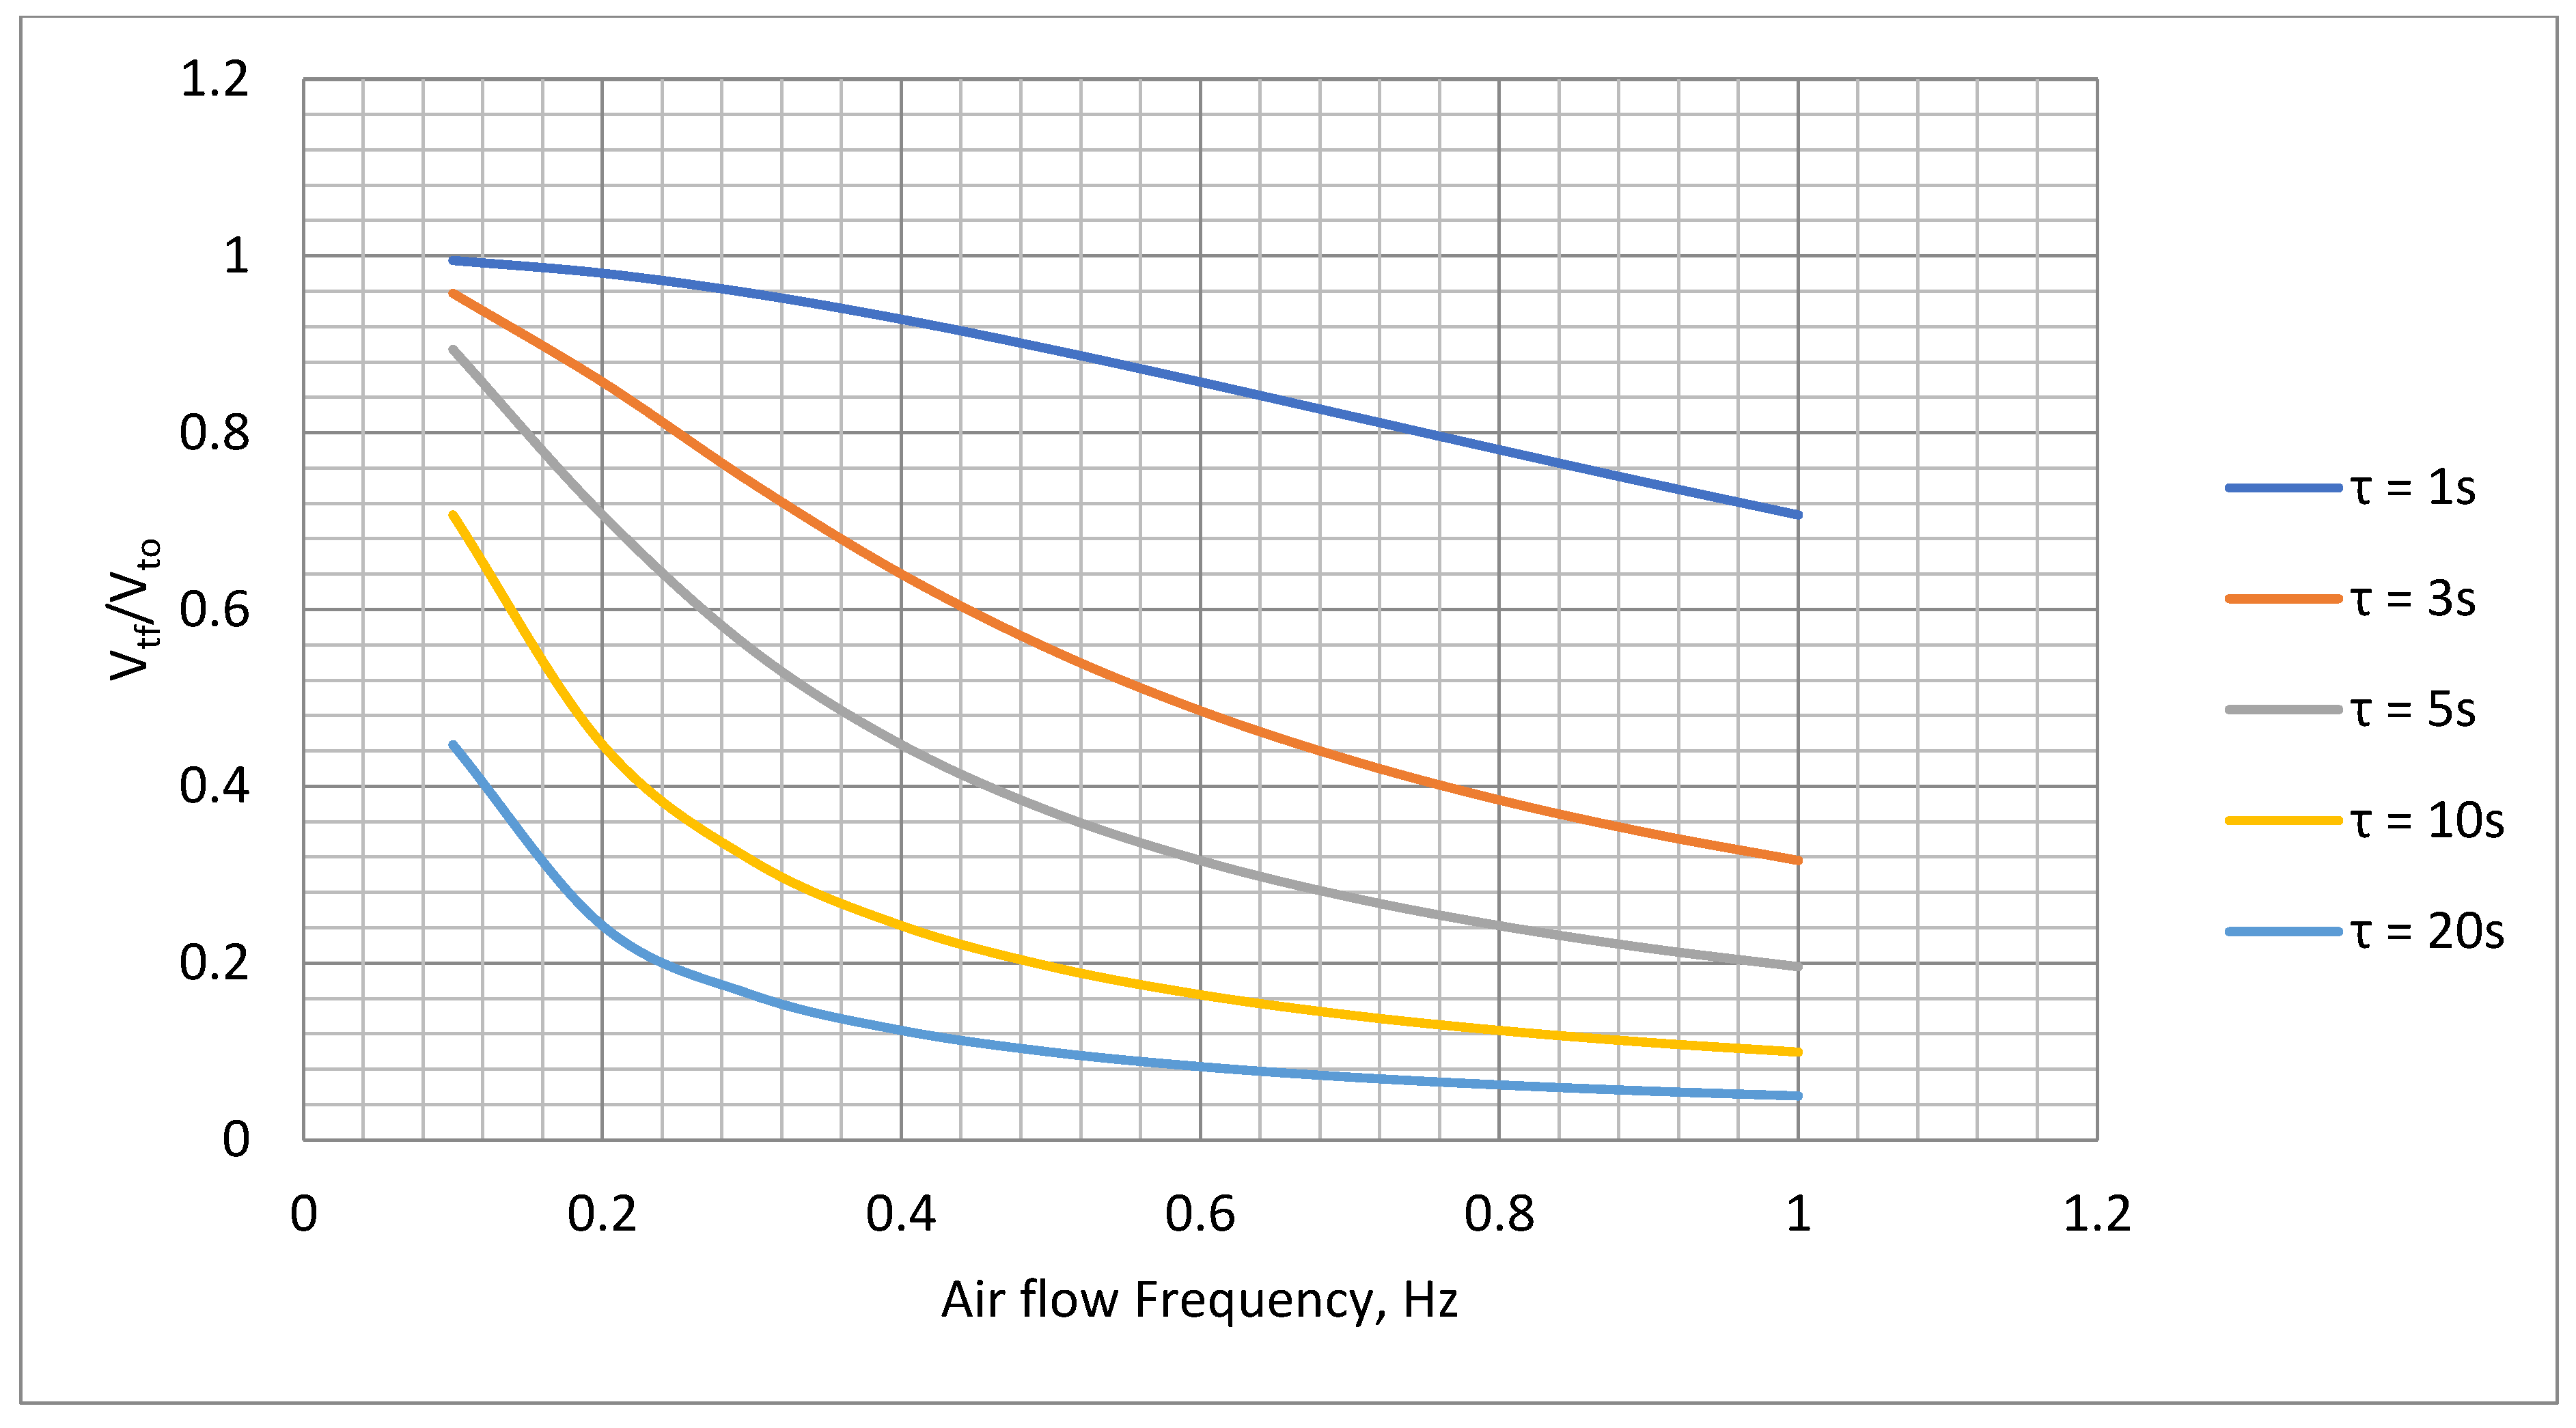
Figure 9.
Variations of Rs with Ta for supply voltages 12 V, 13 V and 14 V, Ro= 10 kΩ to determine optimum Rs value.
Figure 9.
Variations of Rs with Ta for supply voltages 12 V, 13 V and 14 V, Ro= 10 kΩ to determine optimum Rs value.
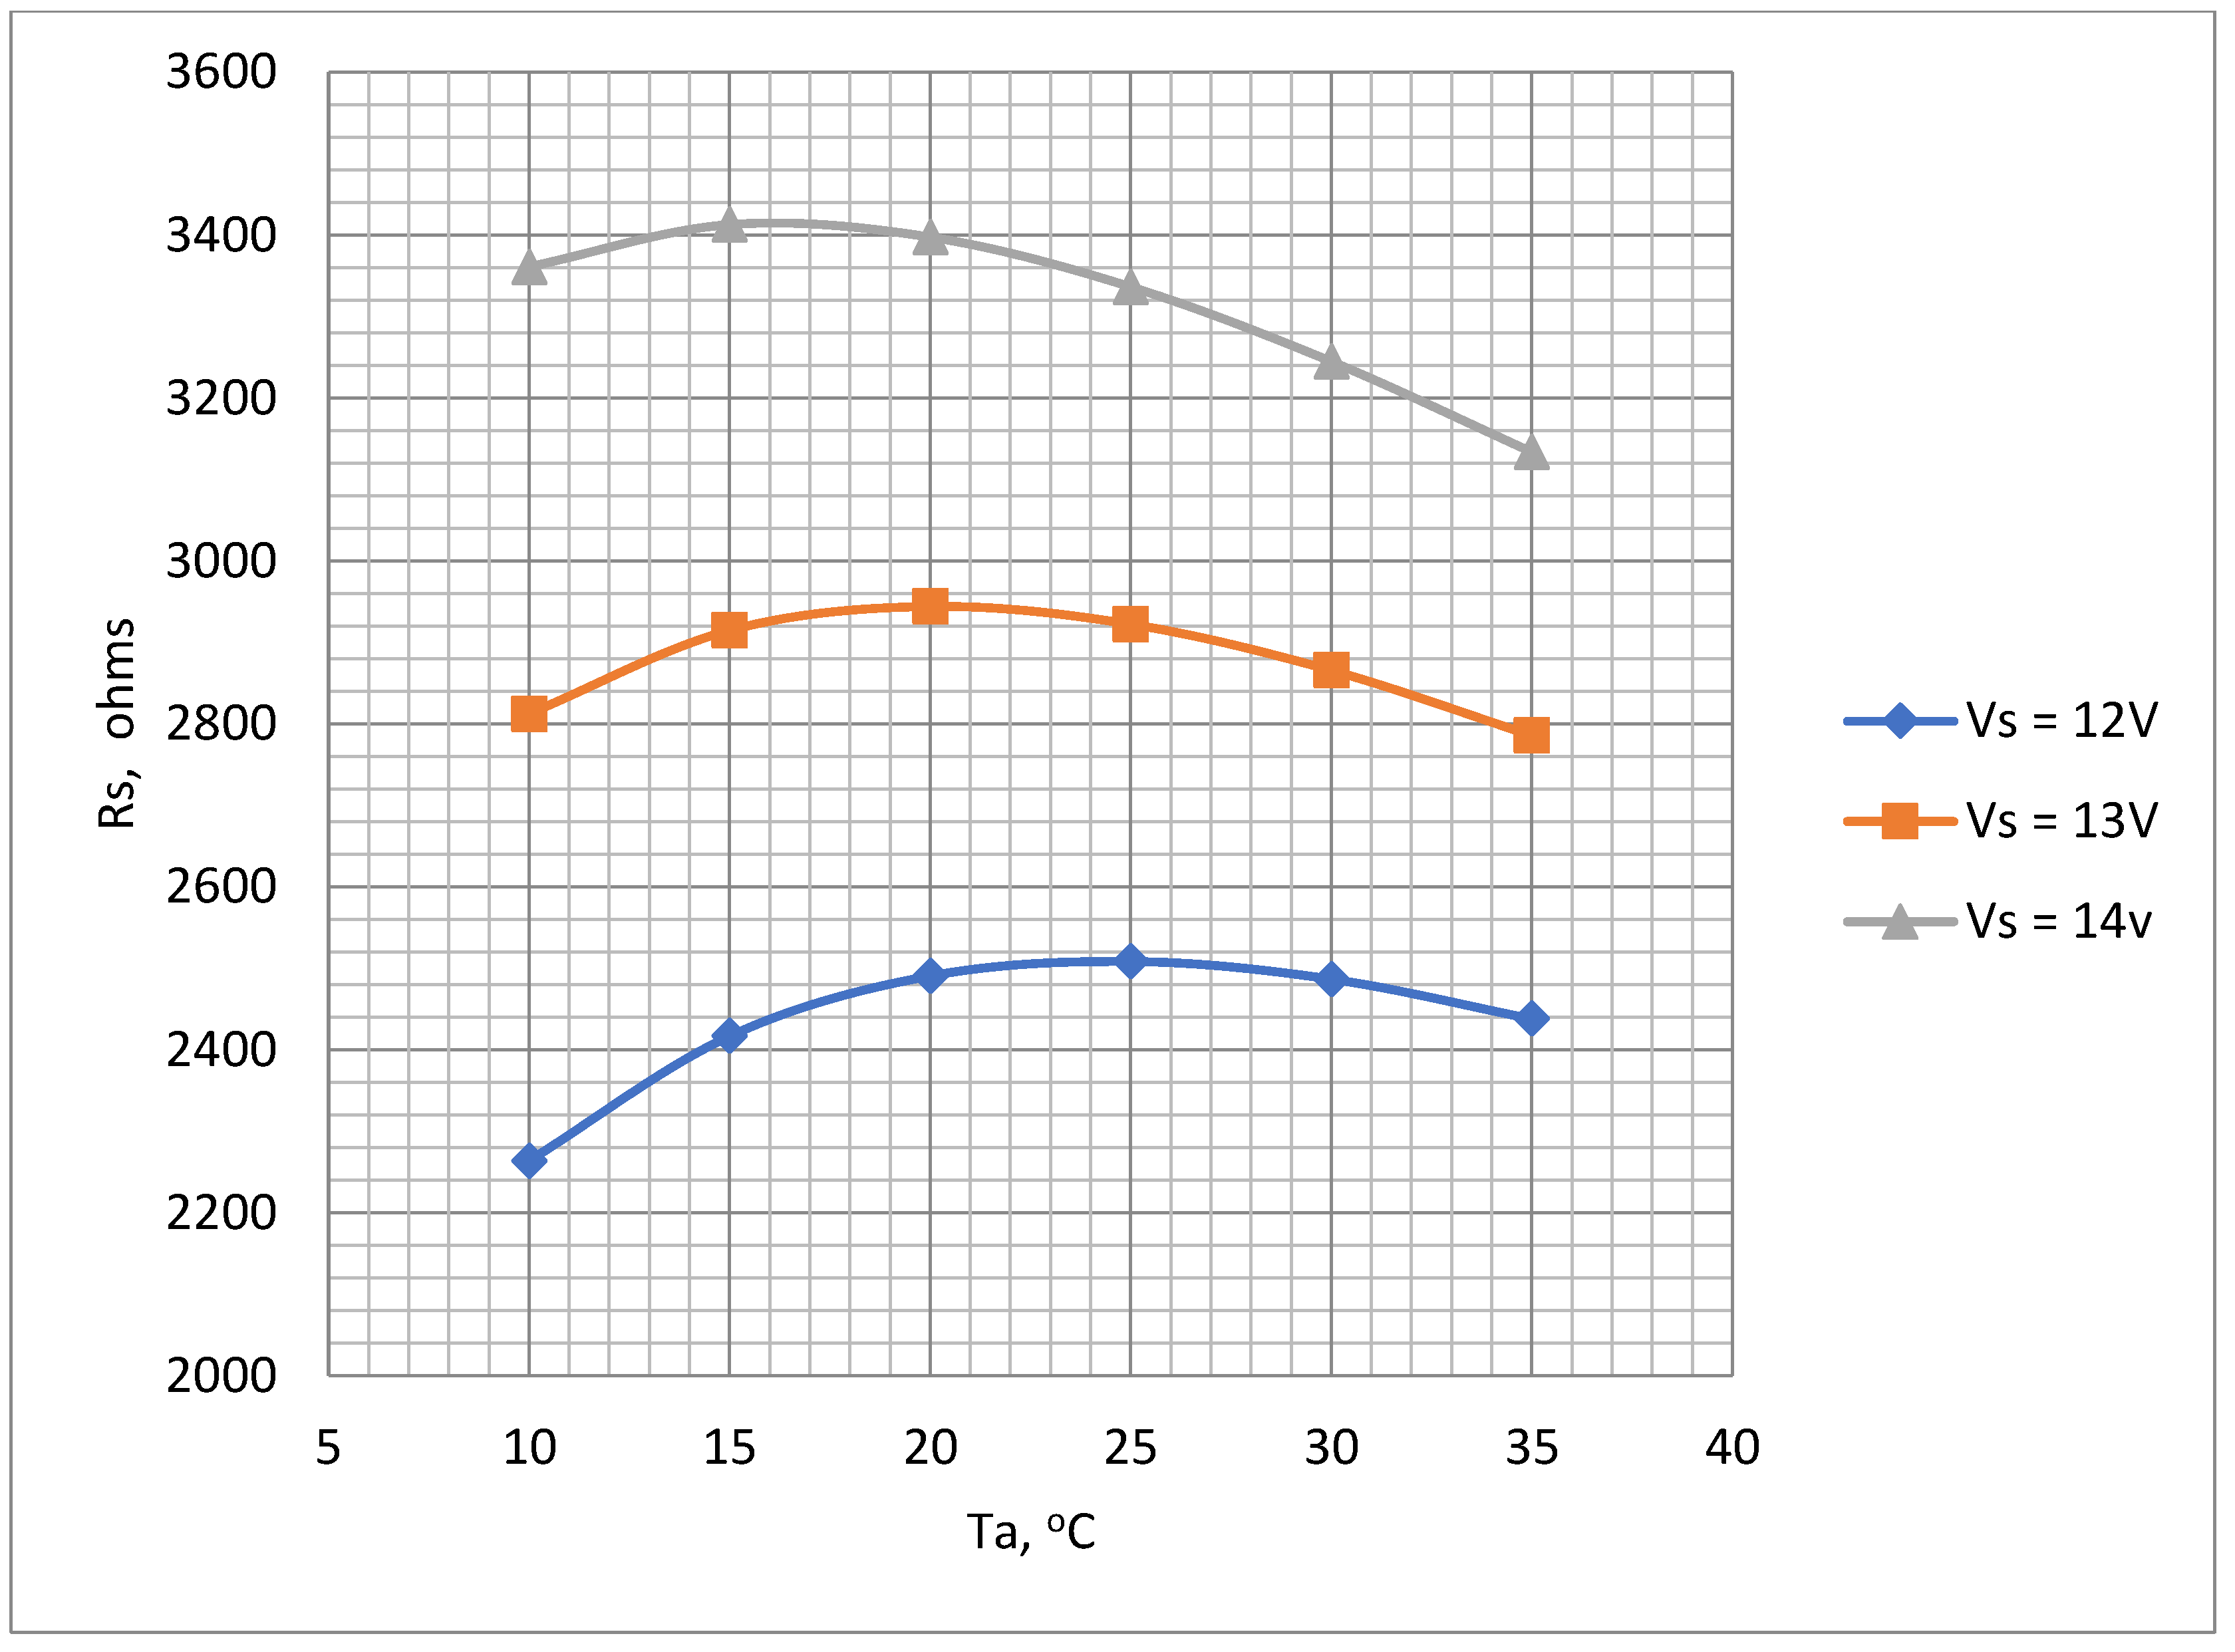
Figure 10.
Measured power dissipation variation with air flow velocity.
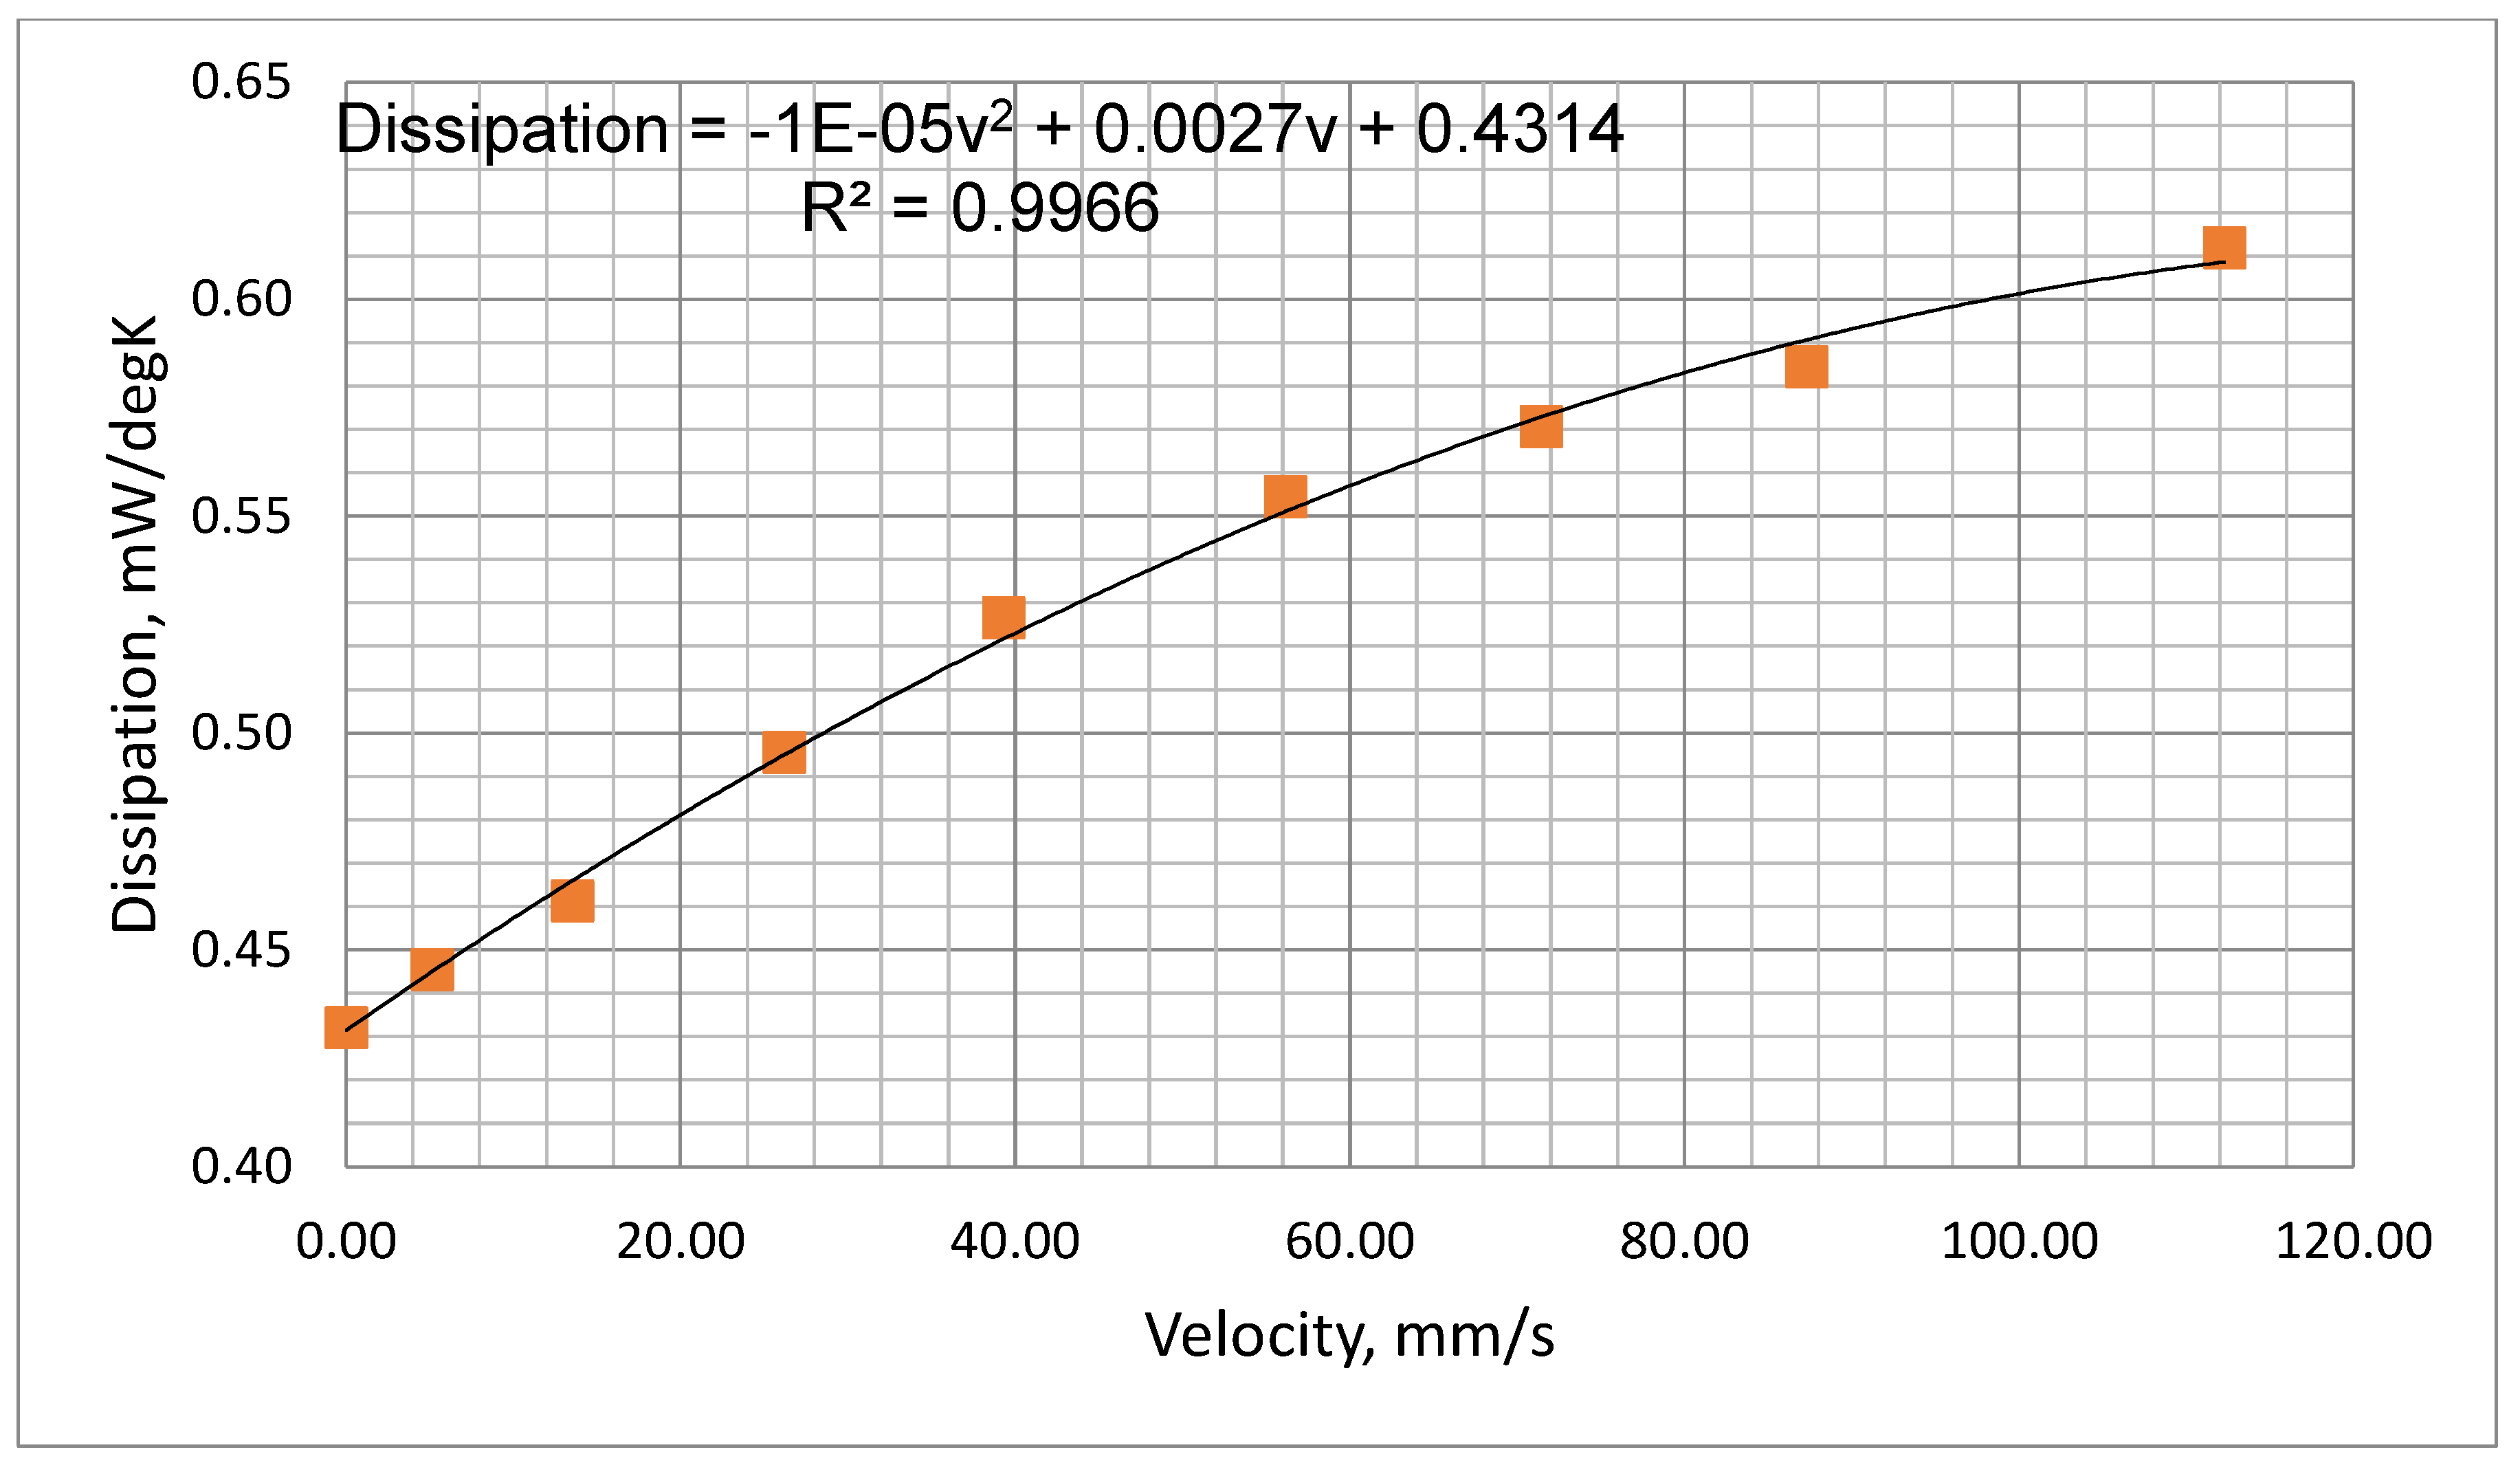
Figure 11.
Calculated and measured steady thermistor output voltage as a function of power dissipation at different ambient temperatures.
Figure 11.
Calculated and measured steady thermistor output voltage as a function of power dissipation at different ambient temperatures.
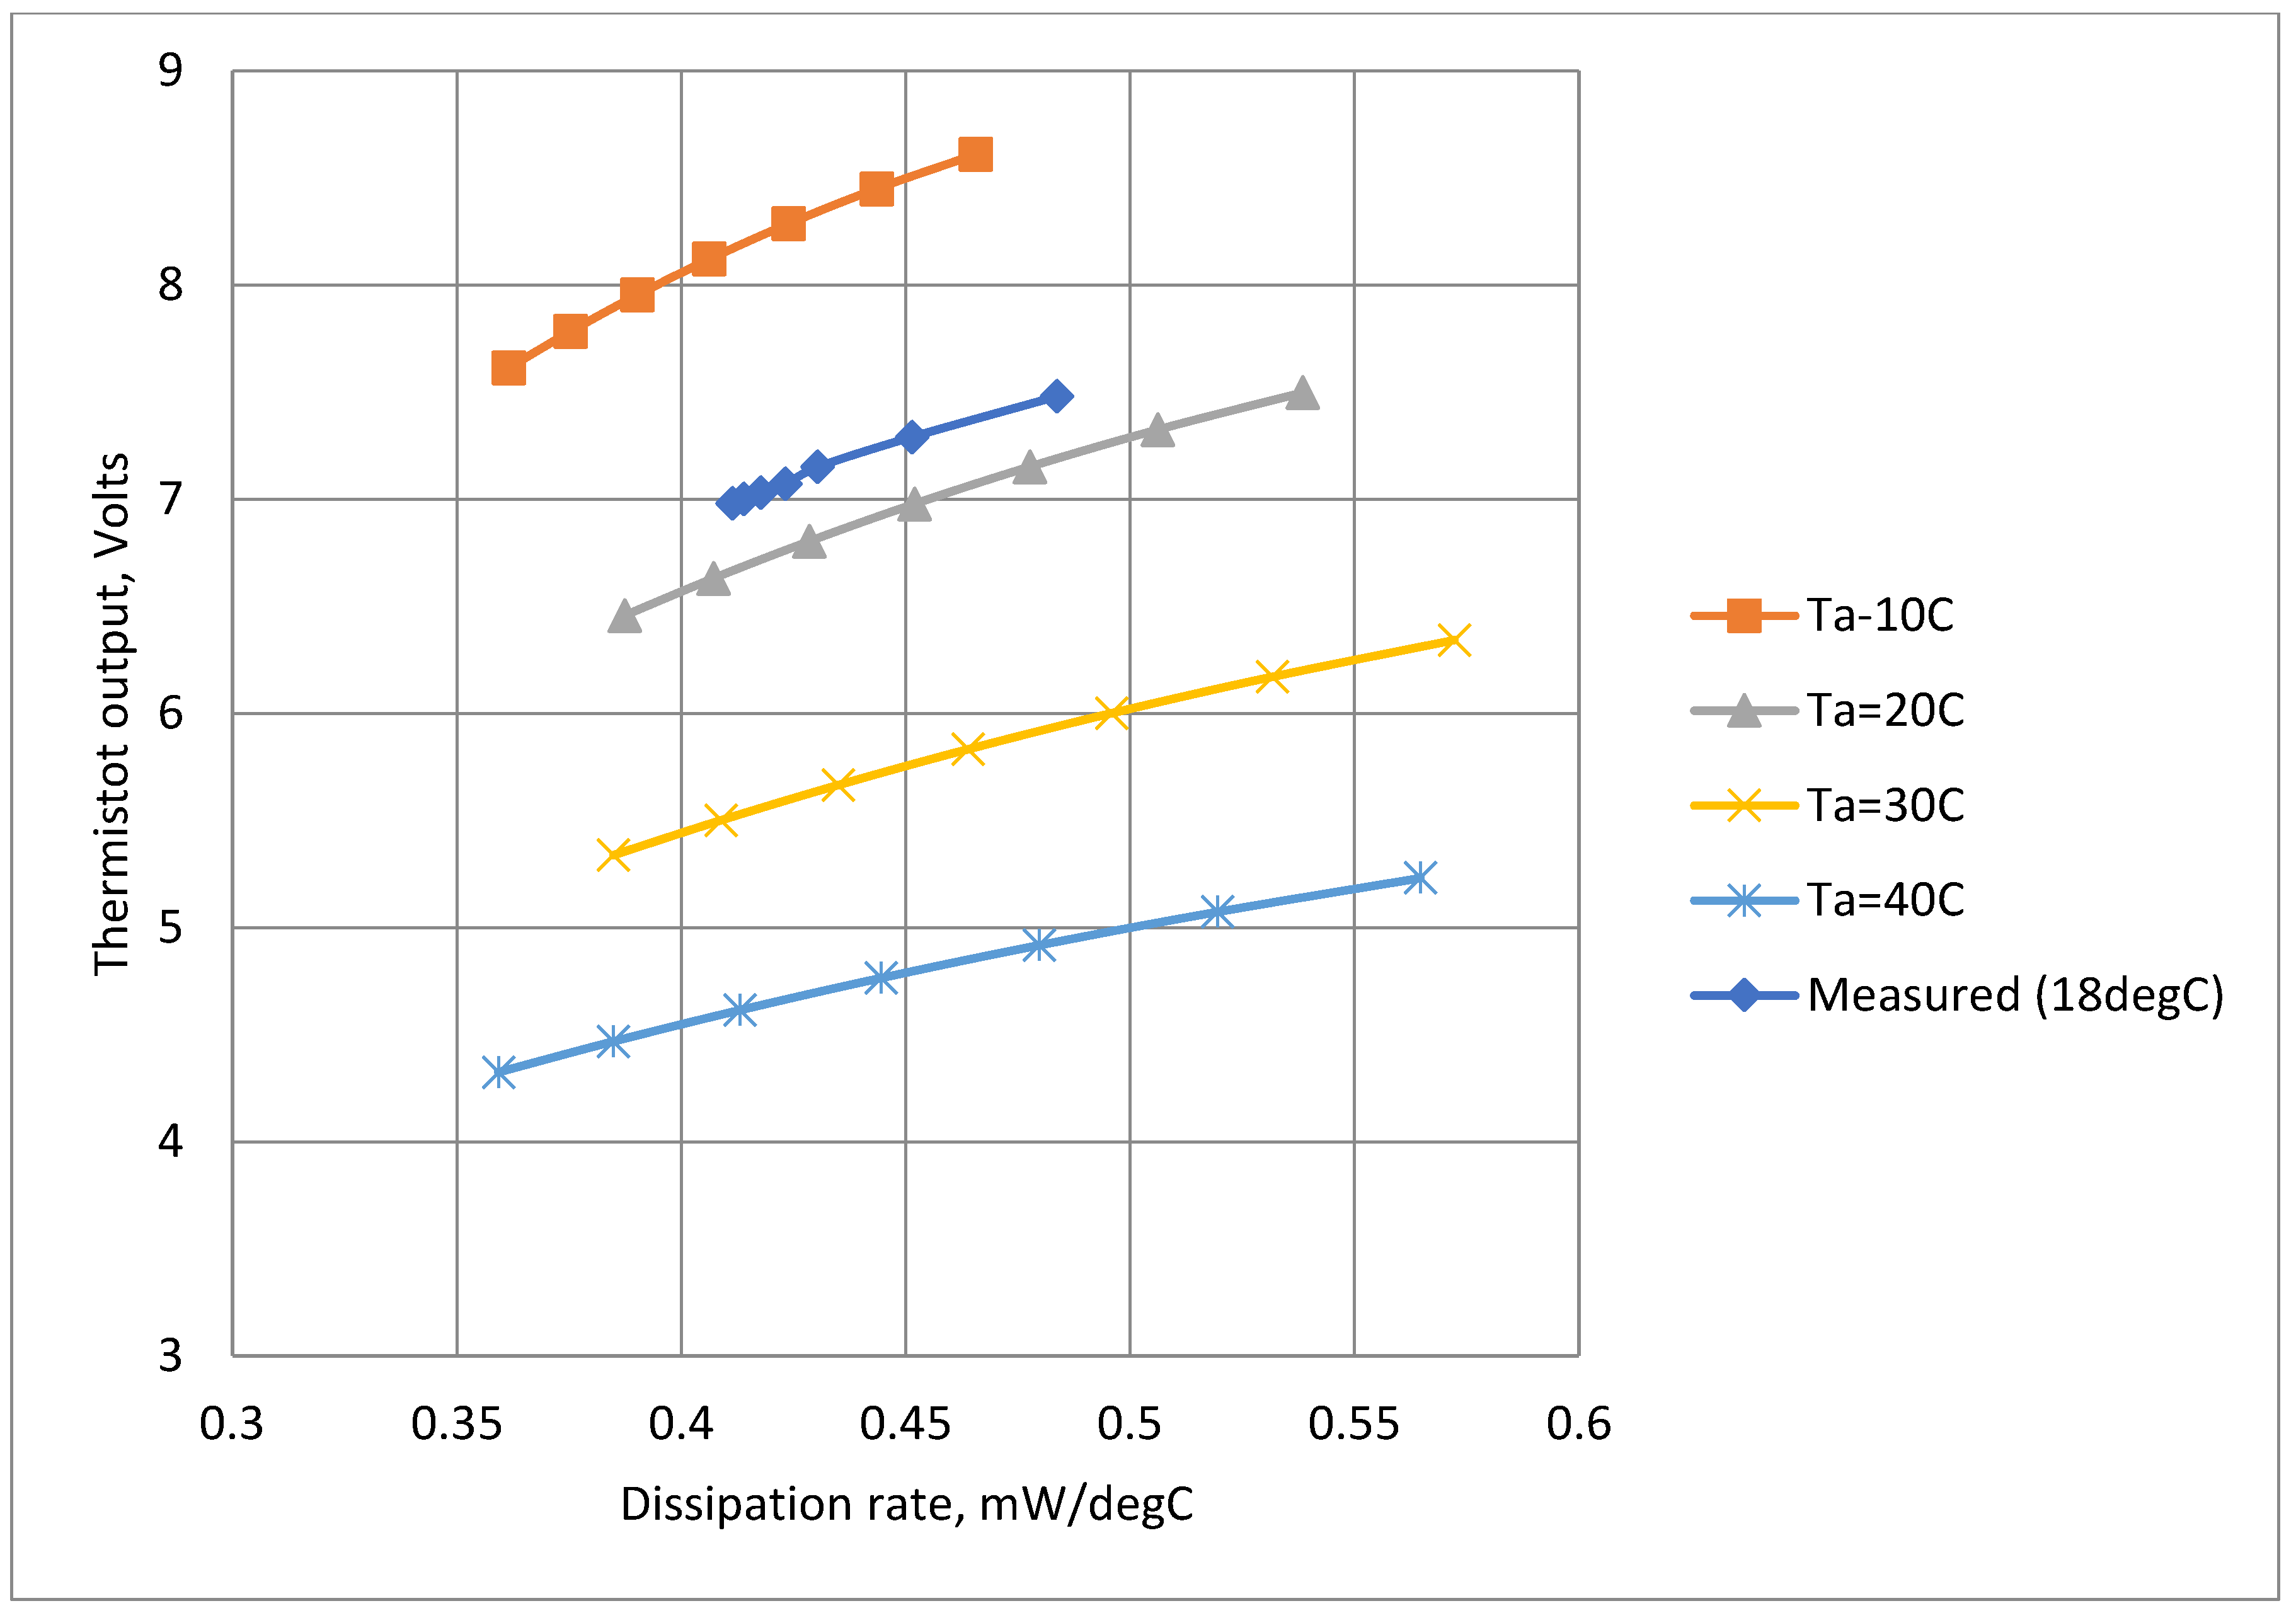
Figure 12.
Examples of the thermistor (Vt) output voltage traces: (a) airflow velocity=63 mm/s, 10 seconds cycle, (b) airflow velocity= 63 mm/s, 1 second cycle.
Figure 12.
Examples of the thermistor (Vt) output voltage traces: (a) airflow velocity=63 mm/s, 10 seconds cycle, (b) airflow velocity= 63 mm/s, 1 second cycle.
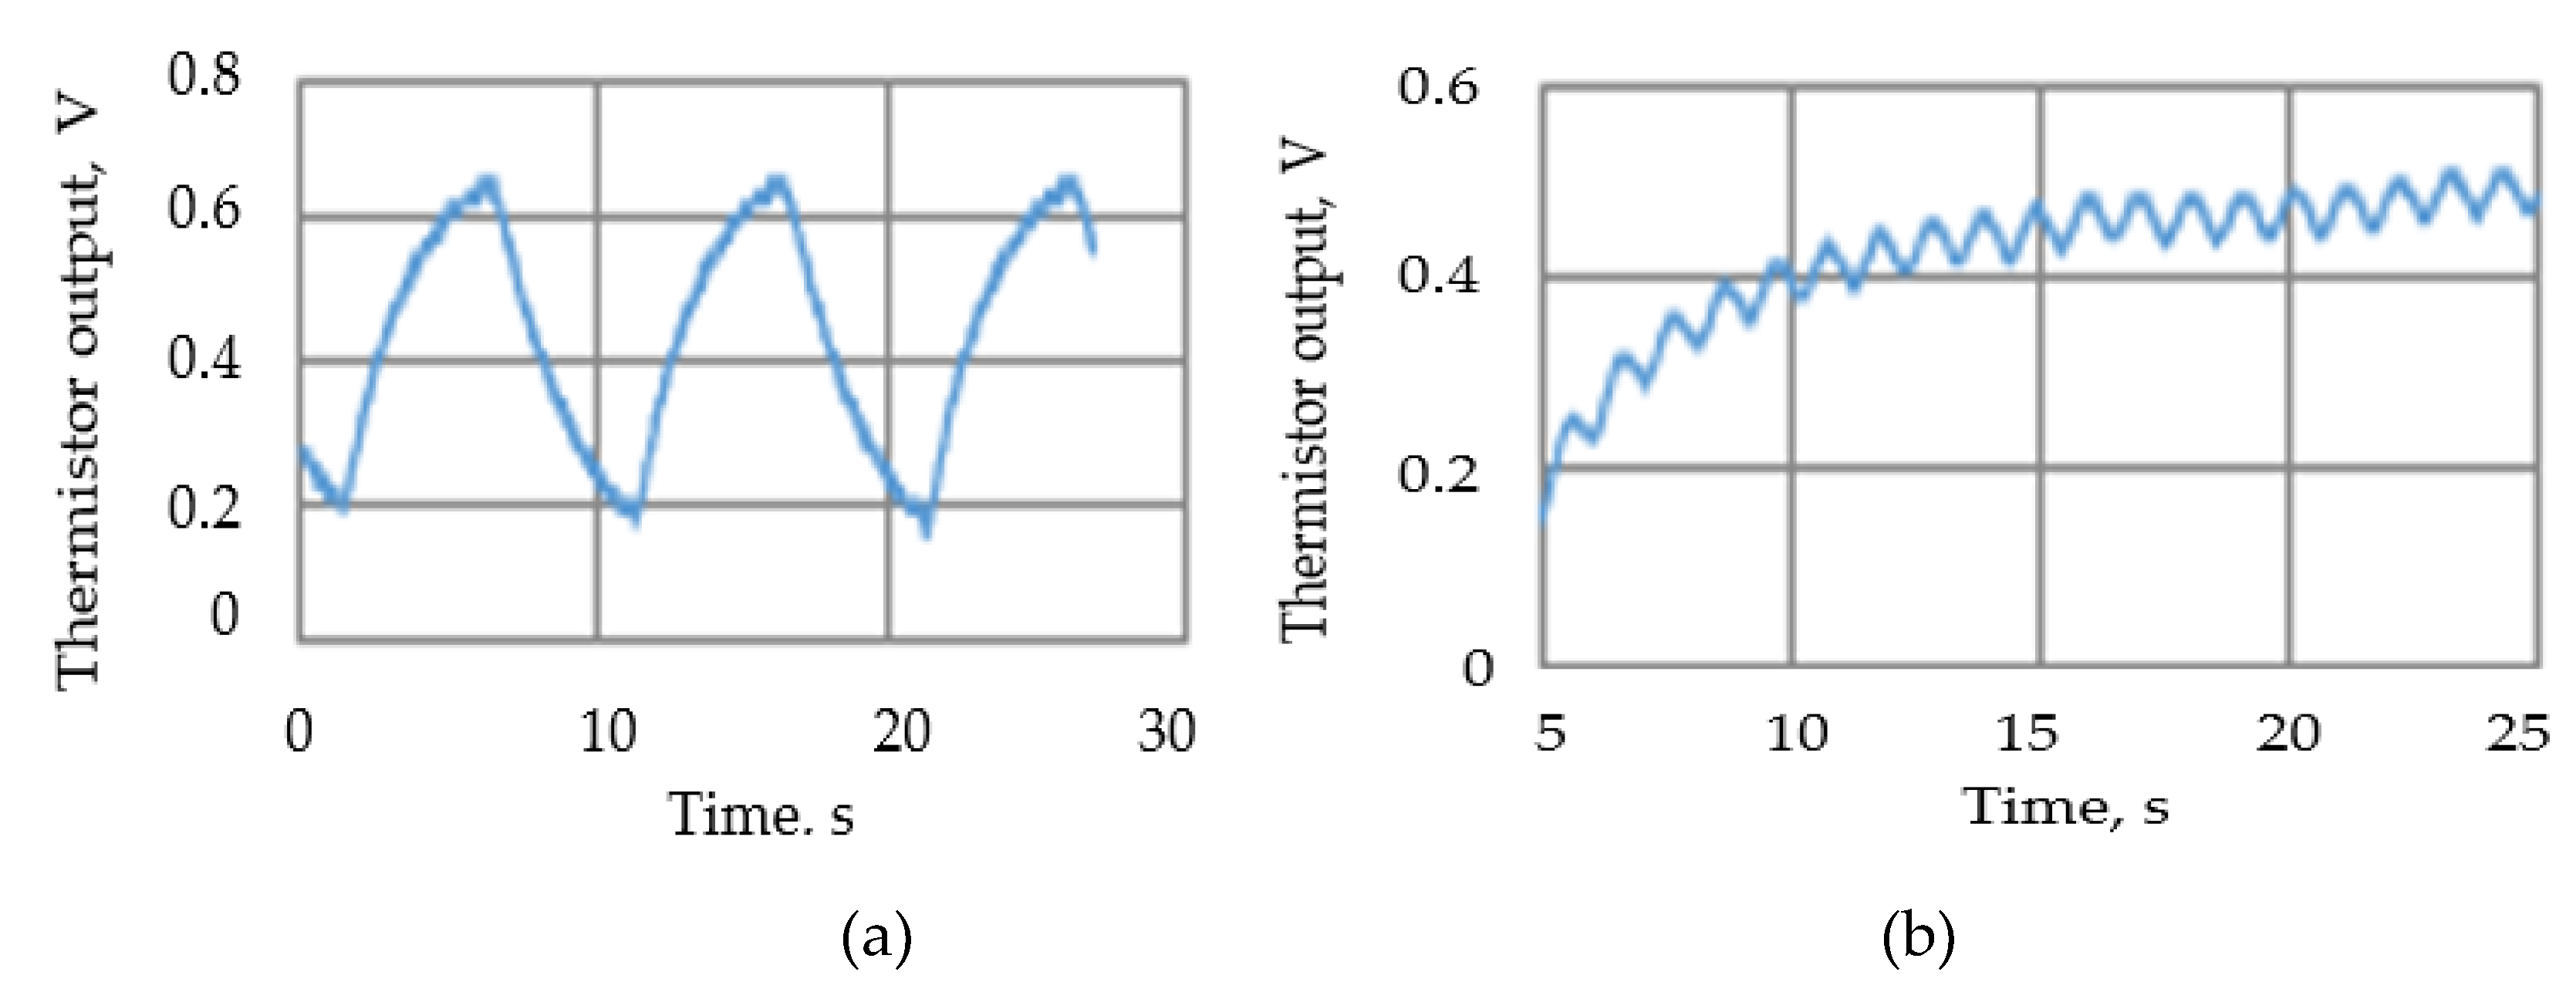
Figure 13.
Summary of thermistor output voltage amplitudes at different cycle times and flow rates.
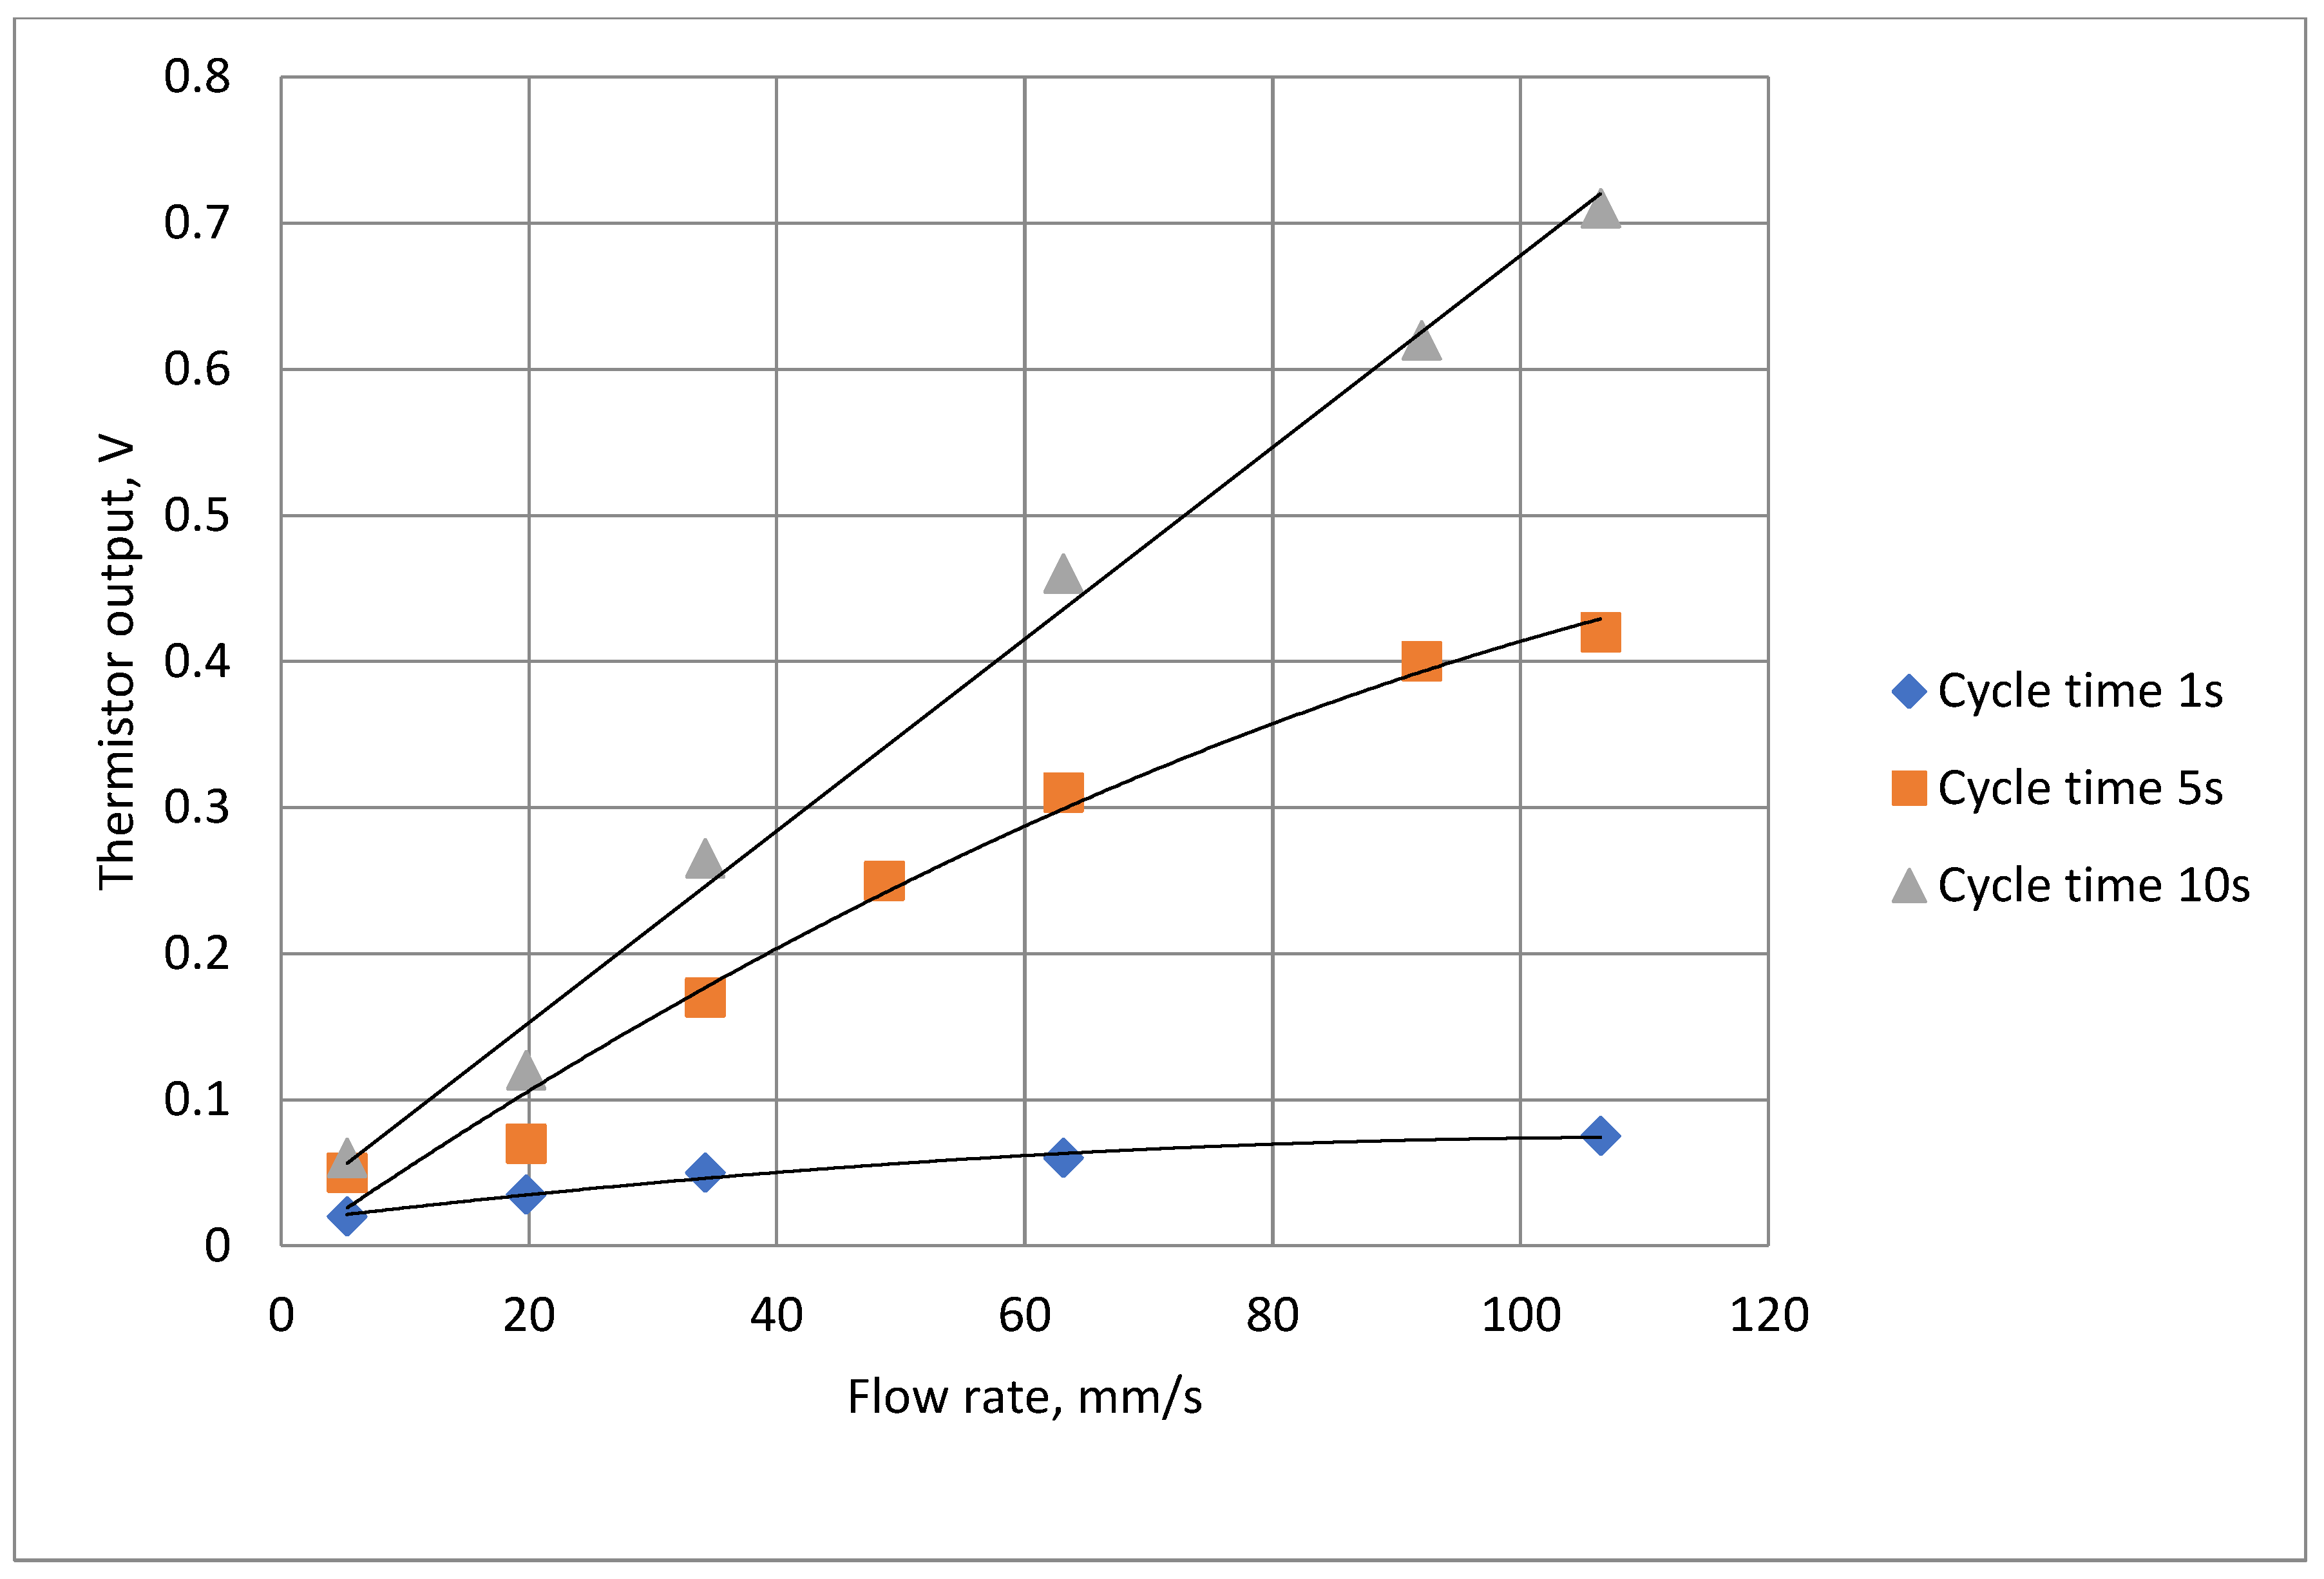
Figure 14.
The thermistor signal amplification circuit: R1=10 kΩ, C2=2200 nF, R4=220 kΩ, R1= 10 kΩ, R2= 50 kΩ, R3=200 kΩ variable, C1=220 nF.
Figure 14.
The thermistor signal amplification circuit: R1=10 kΩ, C2=2200 nF, R4=220 kΩ, R1= 10 kΩ, R2= 50 kΩ, R3=200 kΩ variable, C1=220 nF.
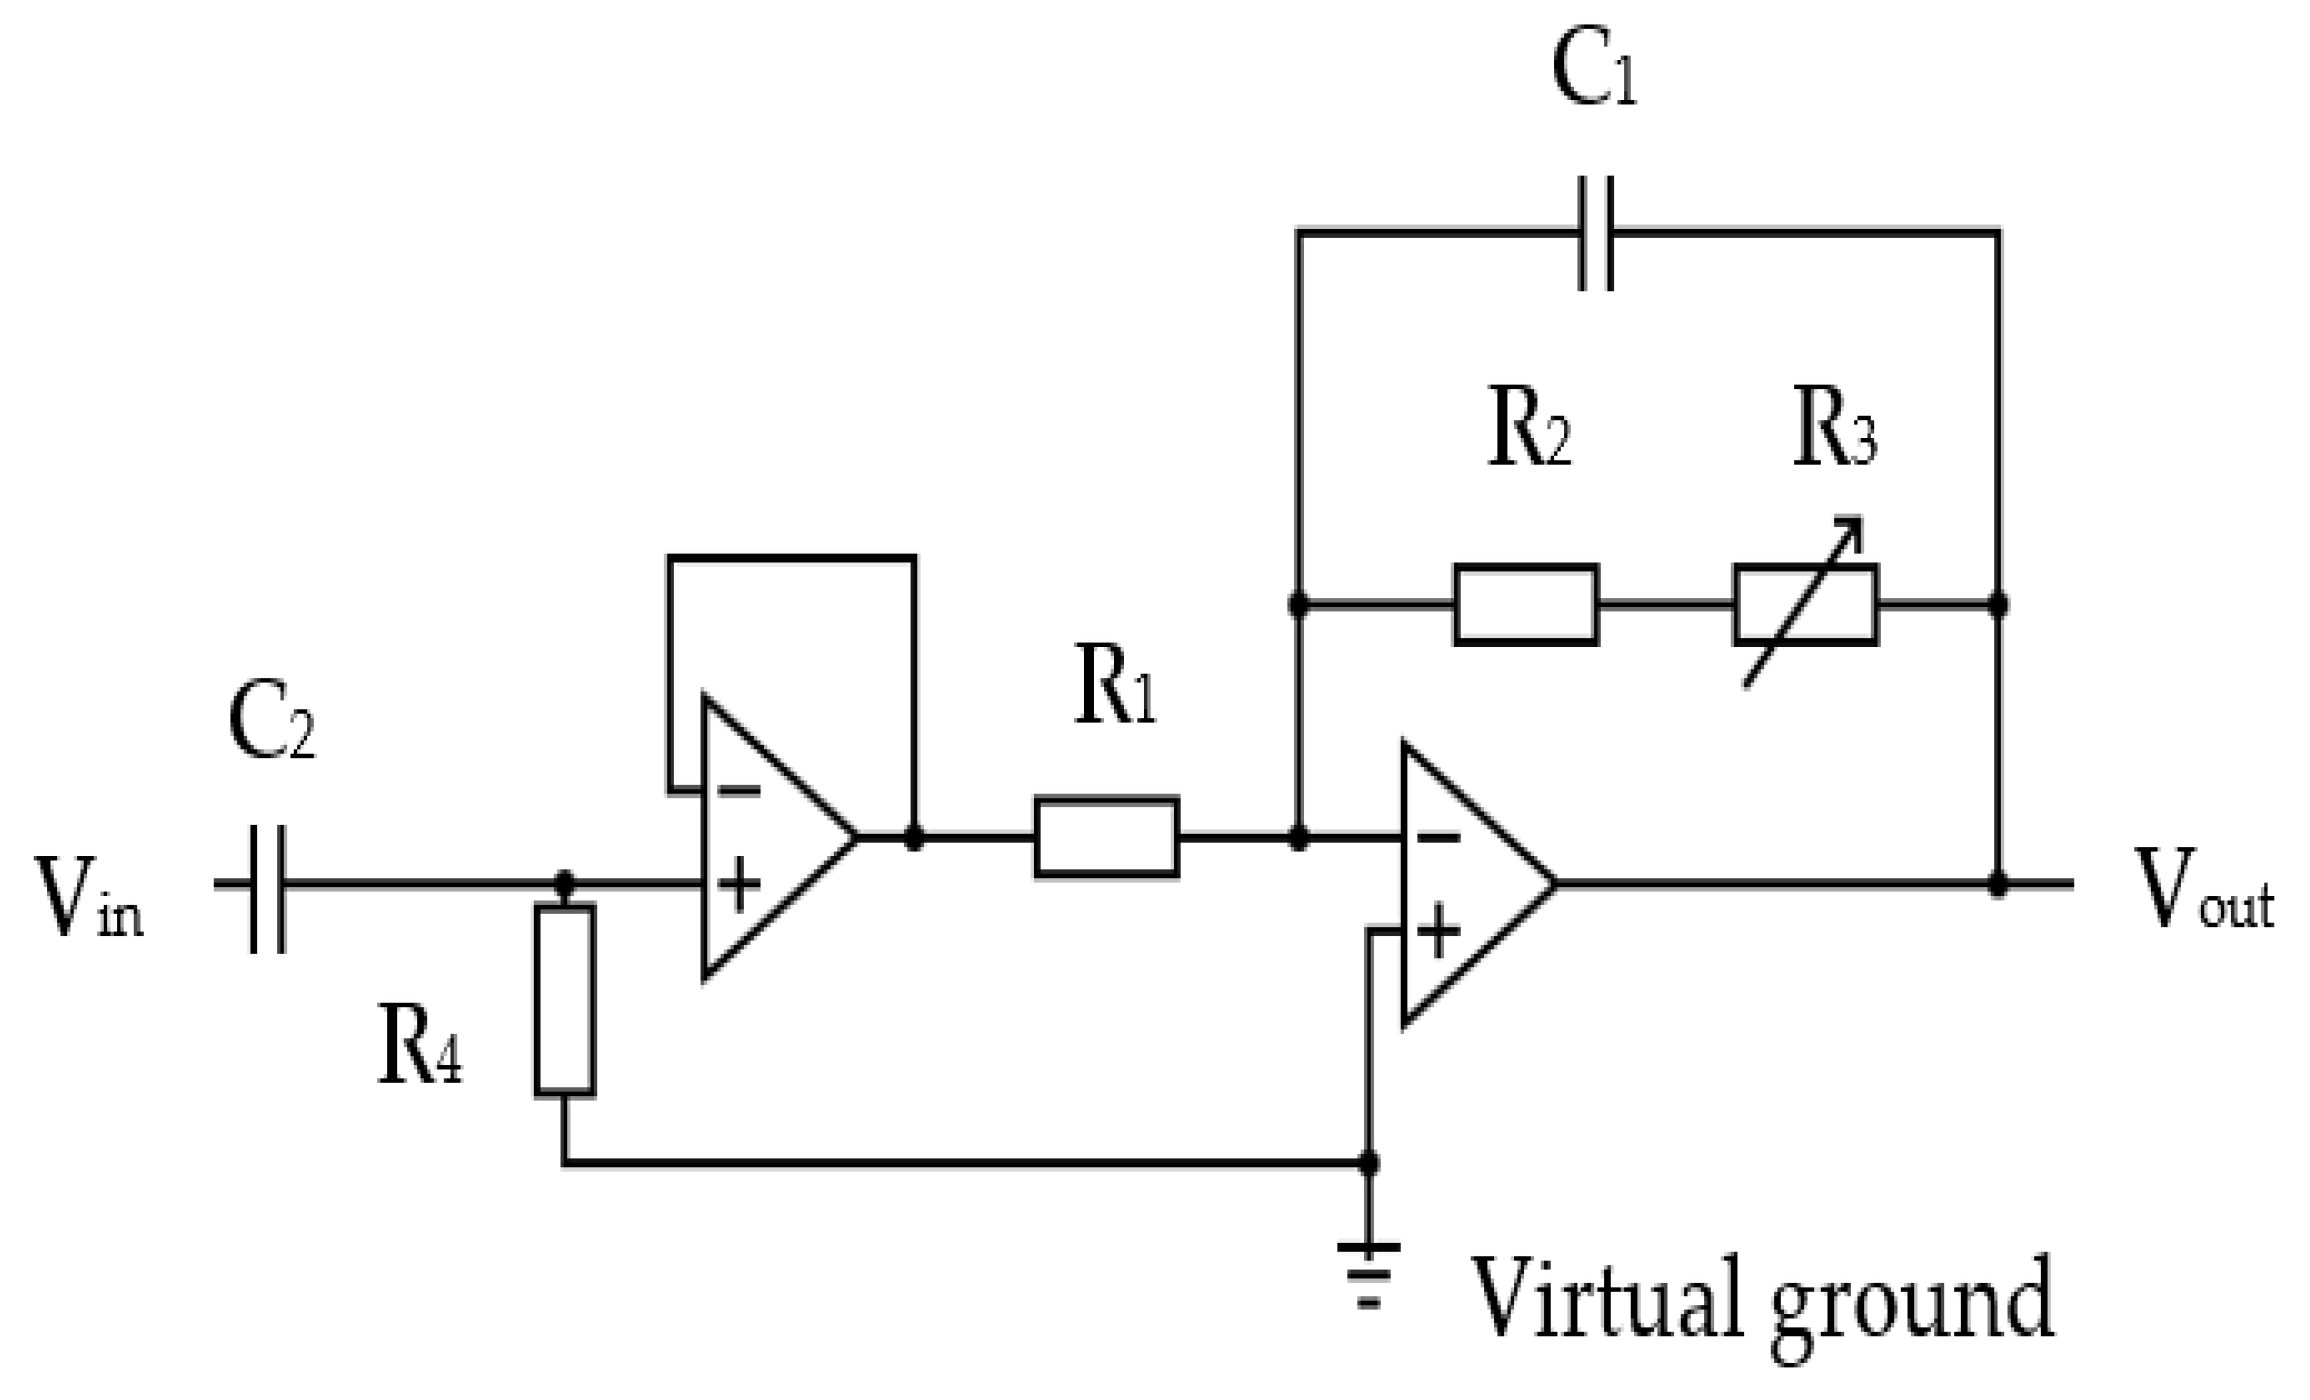
Figure 15.
(a) STM32F407 VGT6 - Discovery microcontroller used for the device [62), (b) STM32F4DIS-LCD [63].
Figure 15.
(a) STM32F407 VGT6 - Discovery microcontroller used for the device [62), (b) STM32F4DIS-LCD [63].
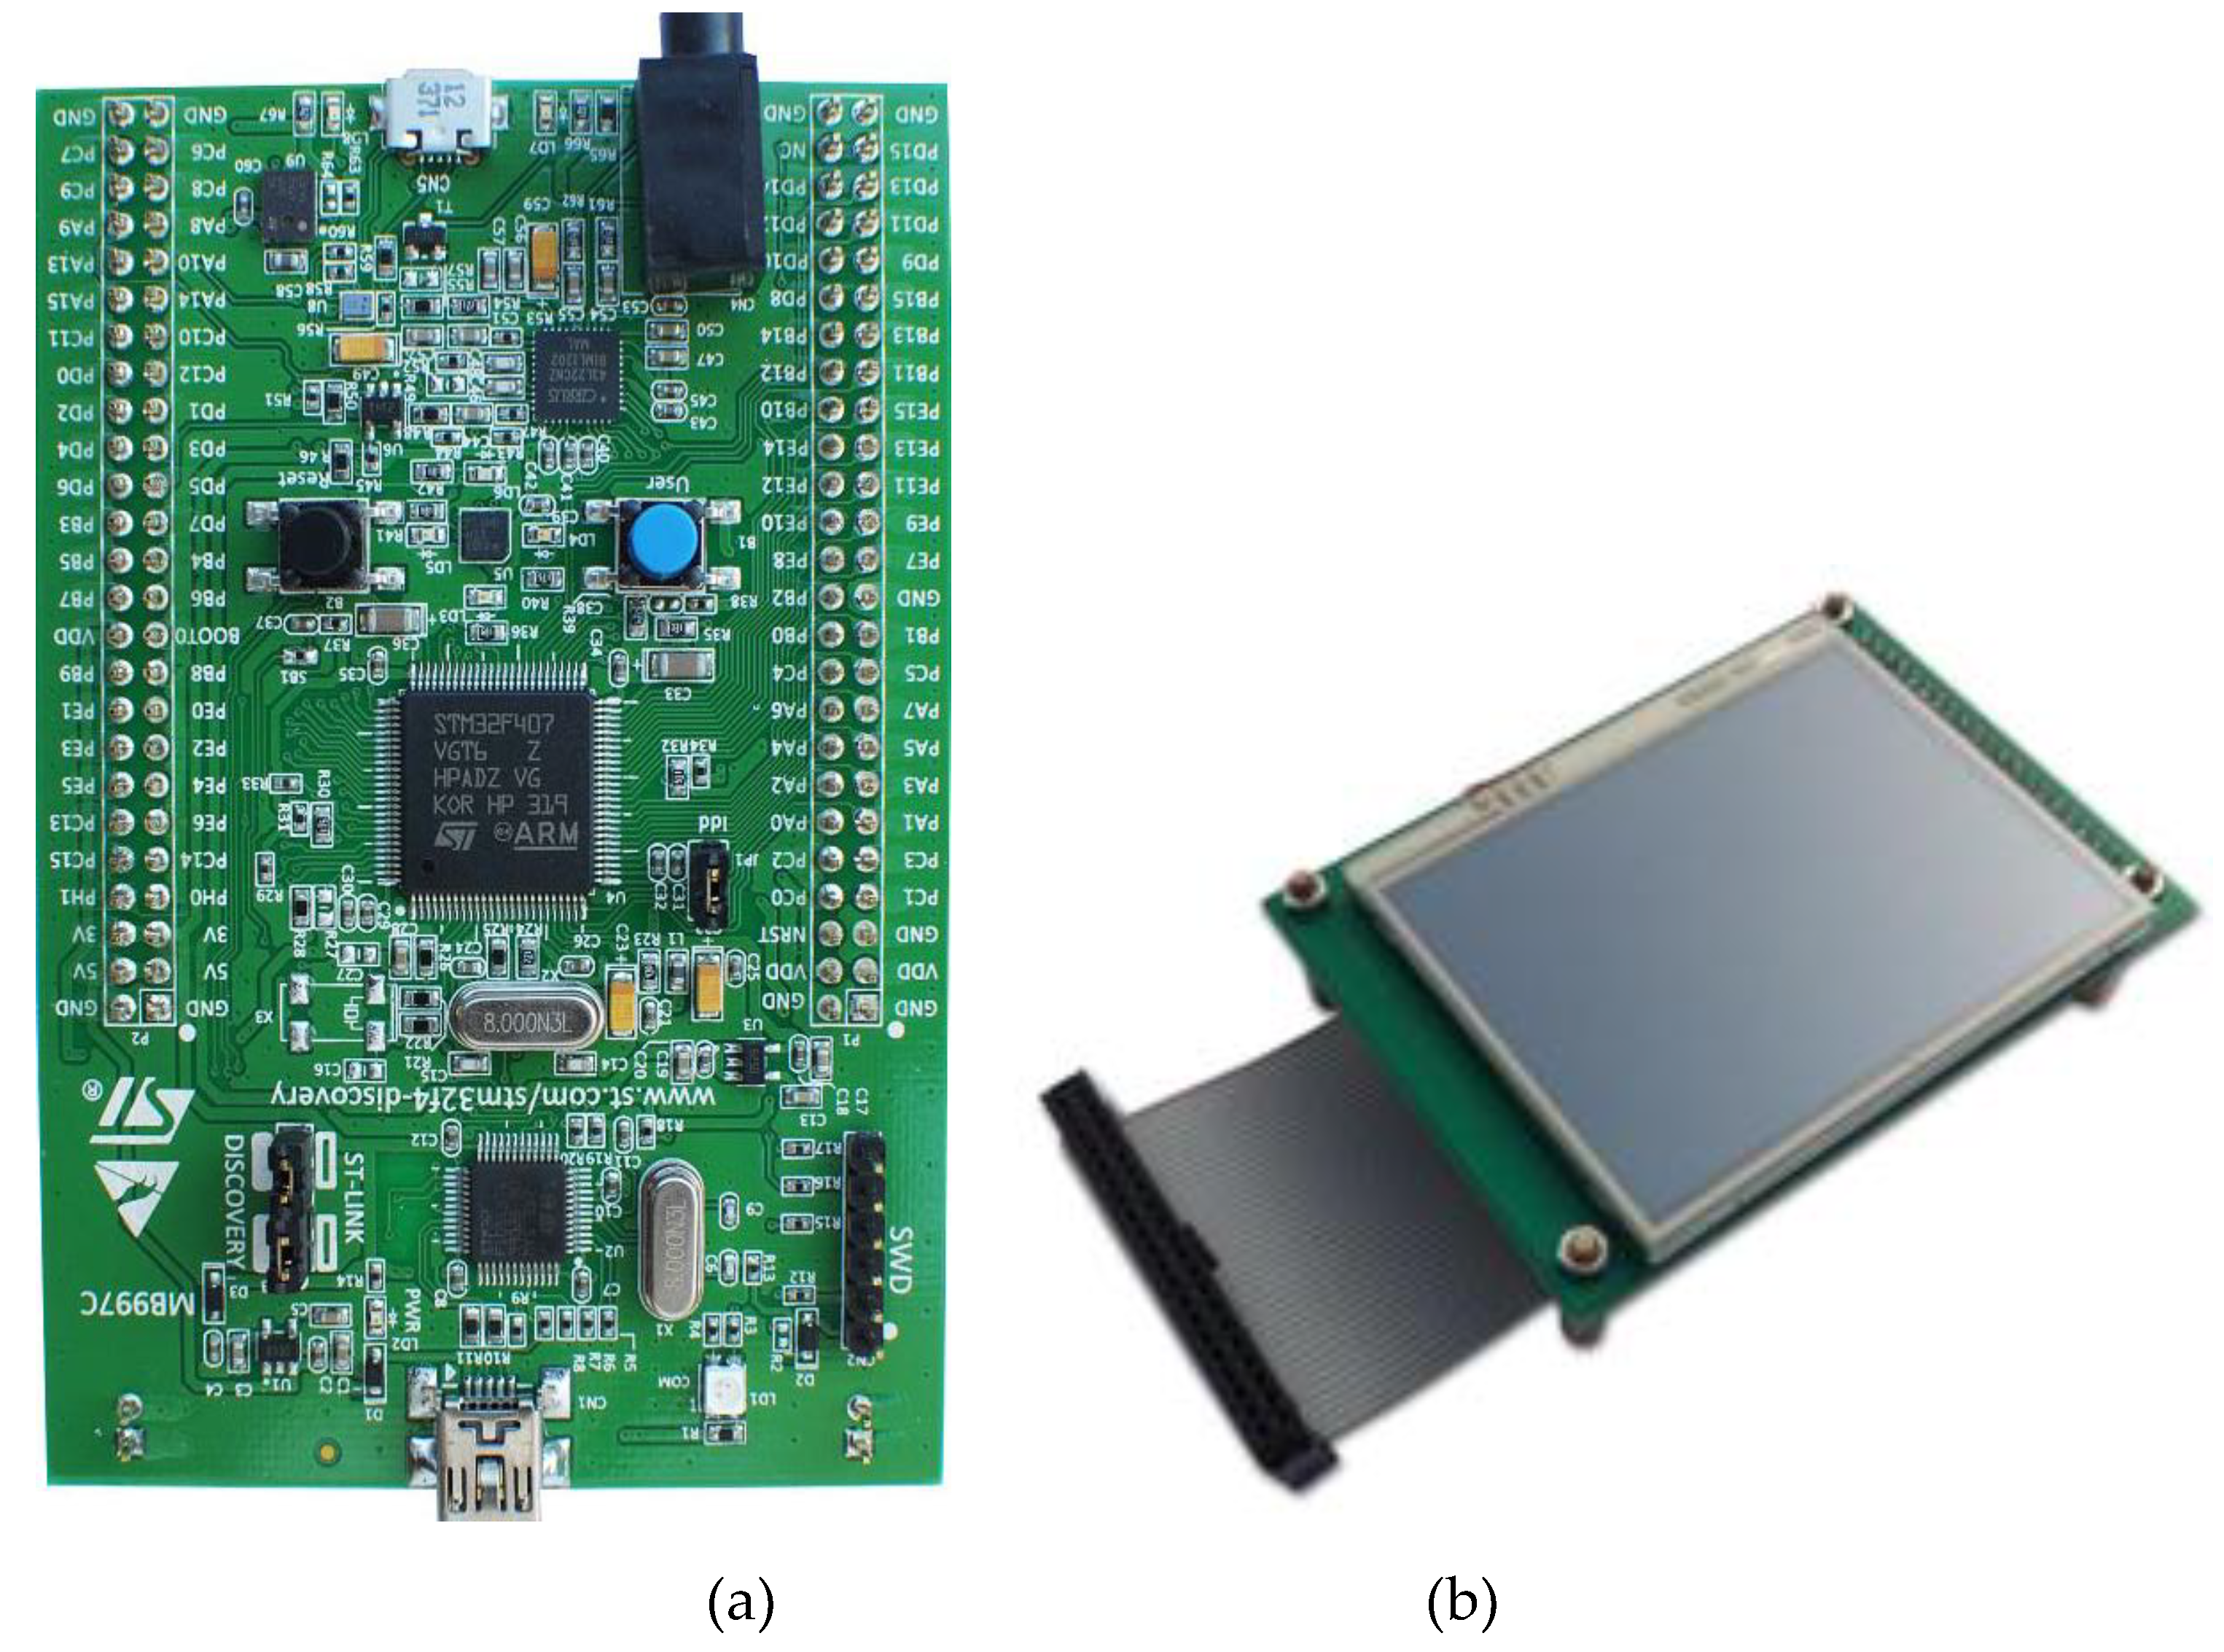
Figure 16.
Optocoupler (4N25) [64] circuit for start recording trigger mechanism.
Figure 16.
Optocoupler (4N25) [64] circuit for start recording trigger mechanism.
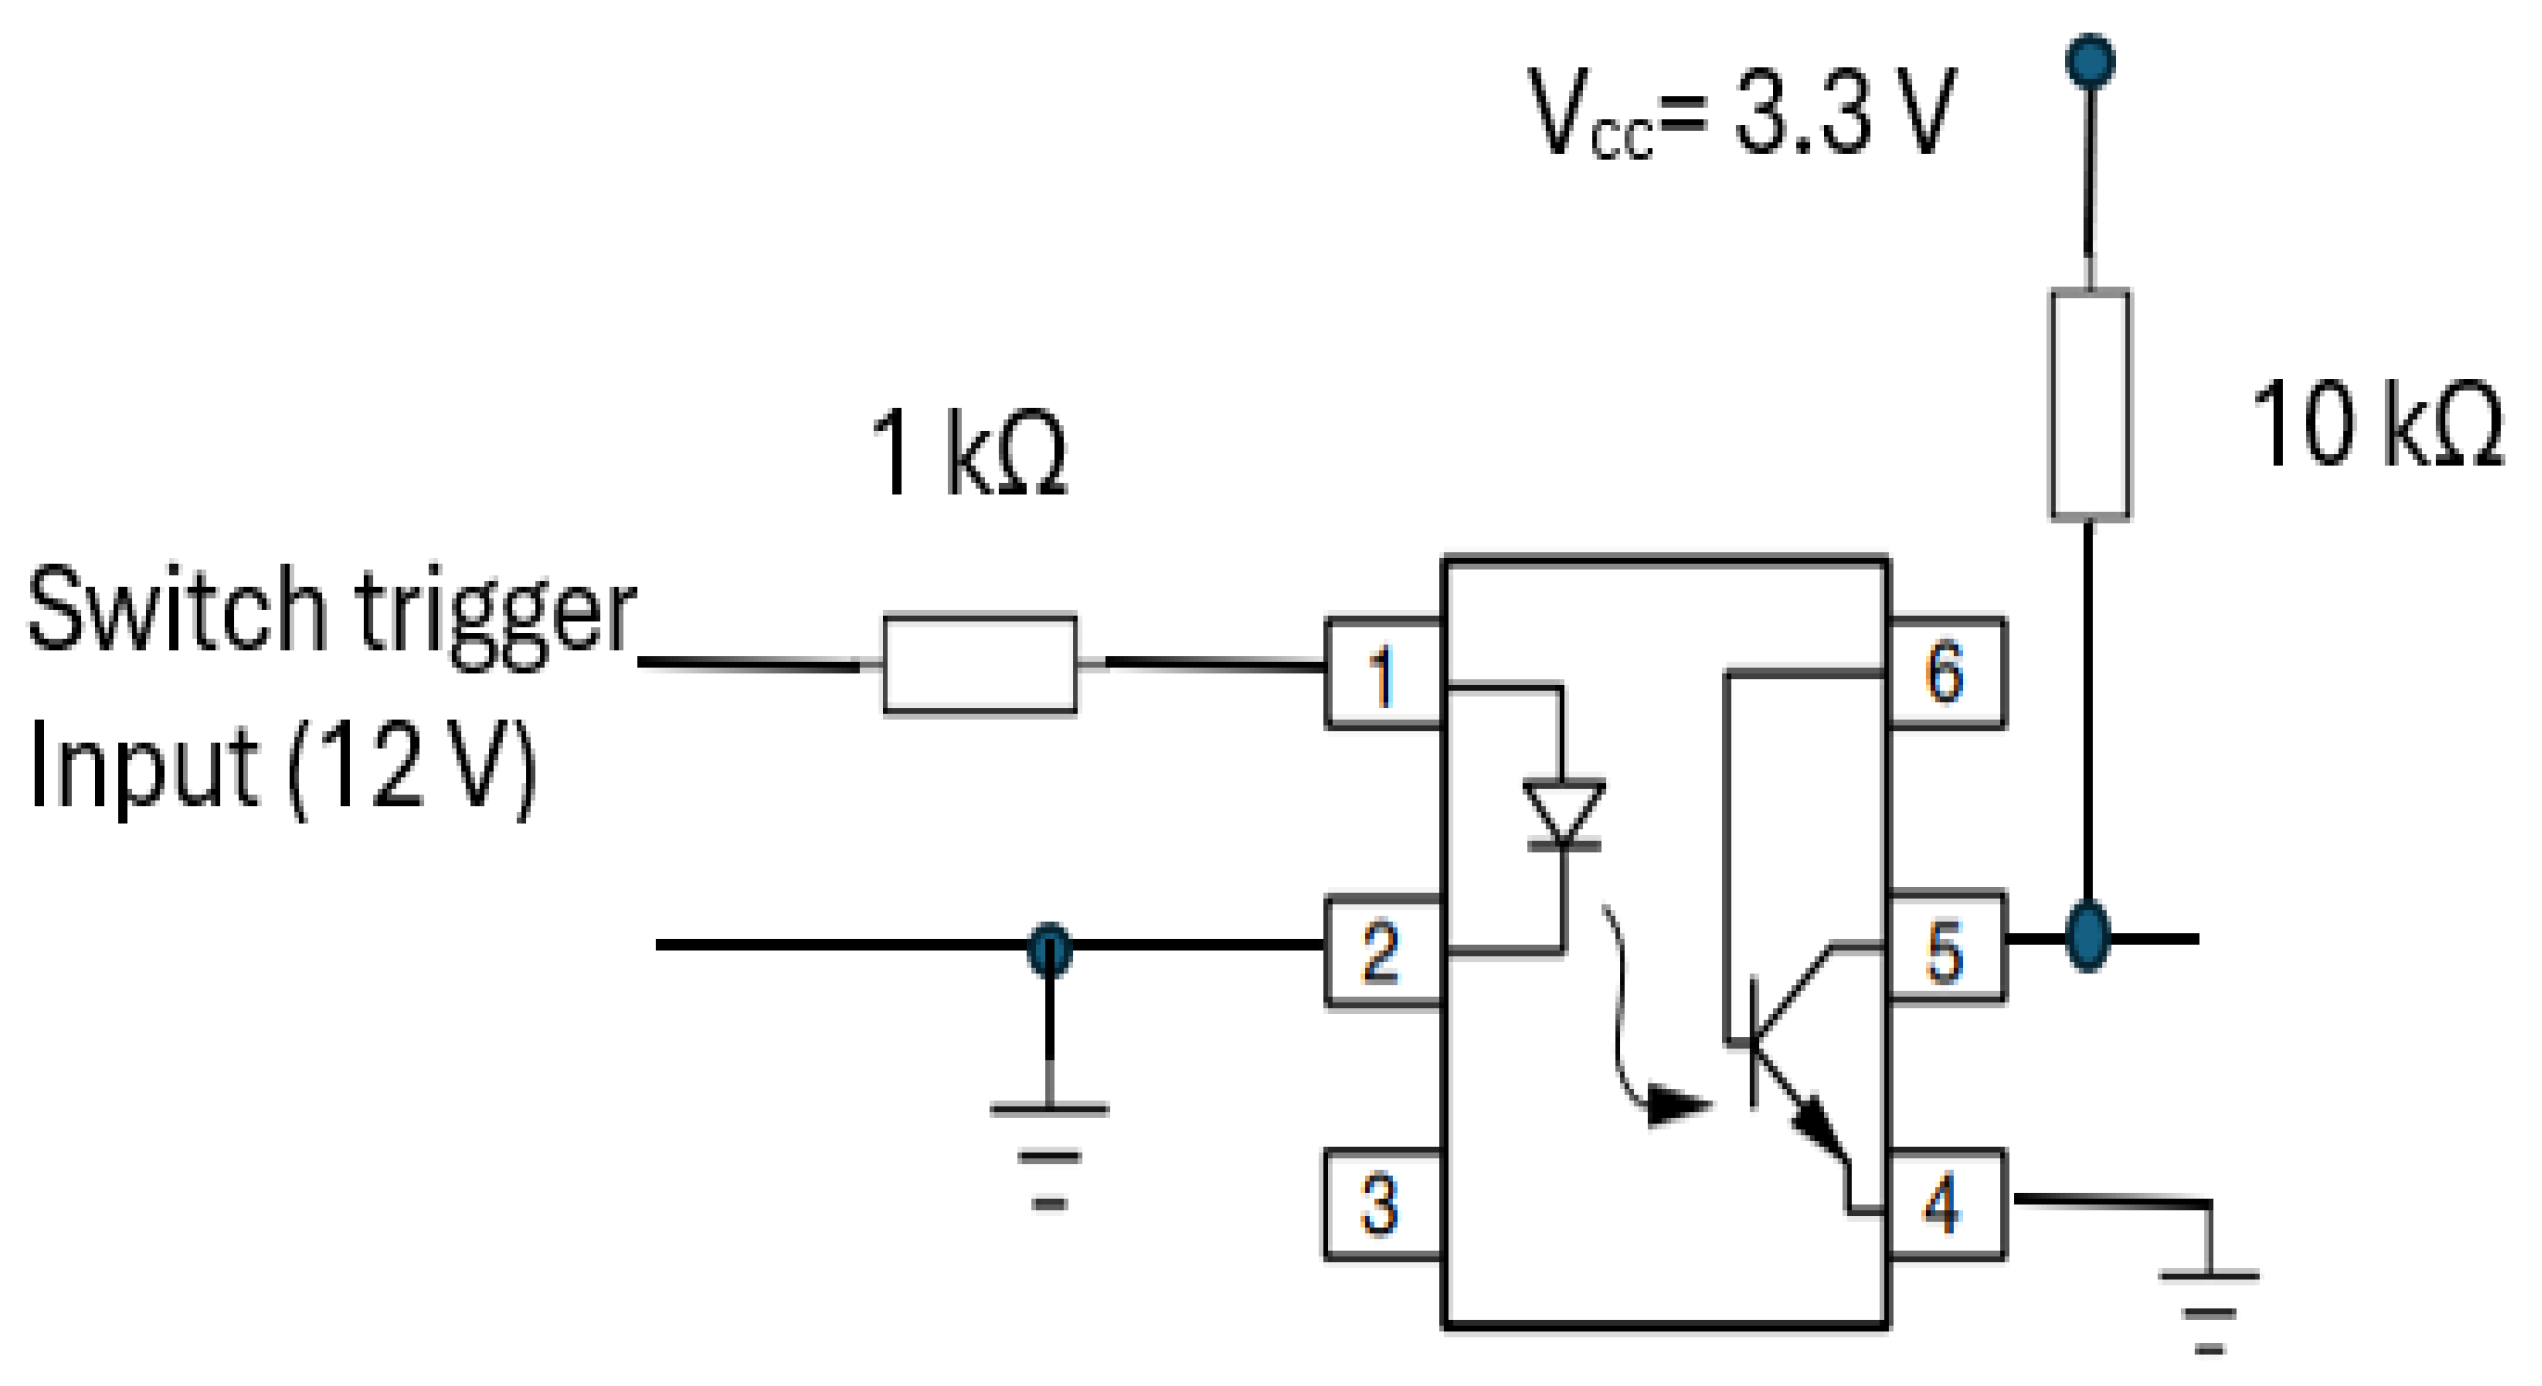
Figure 17.
The buzzer circuit alerts the operator to read the RR value from CPRM display.
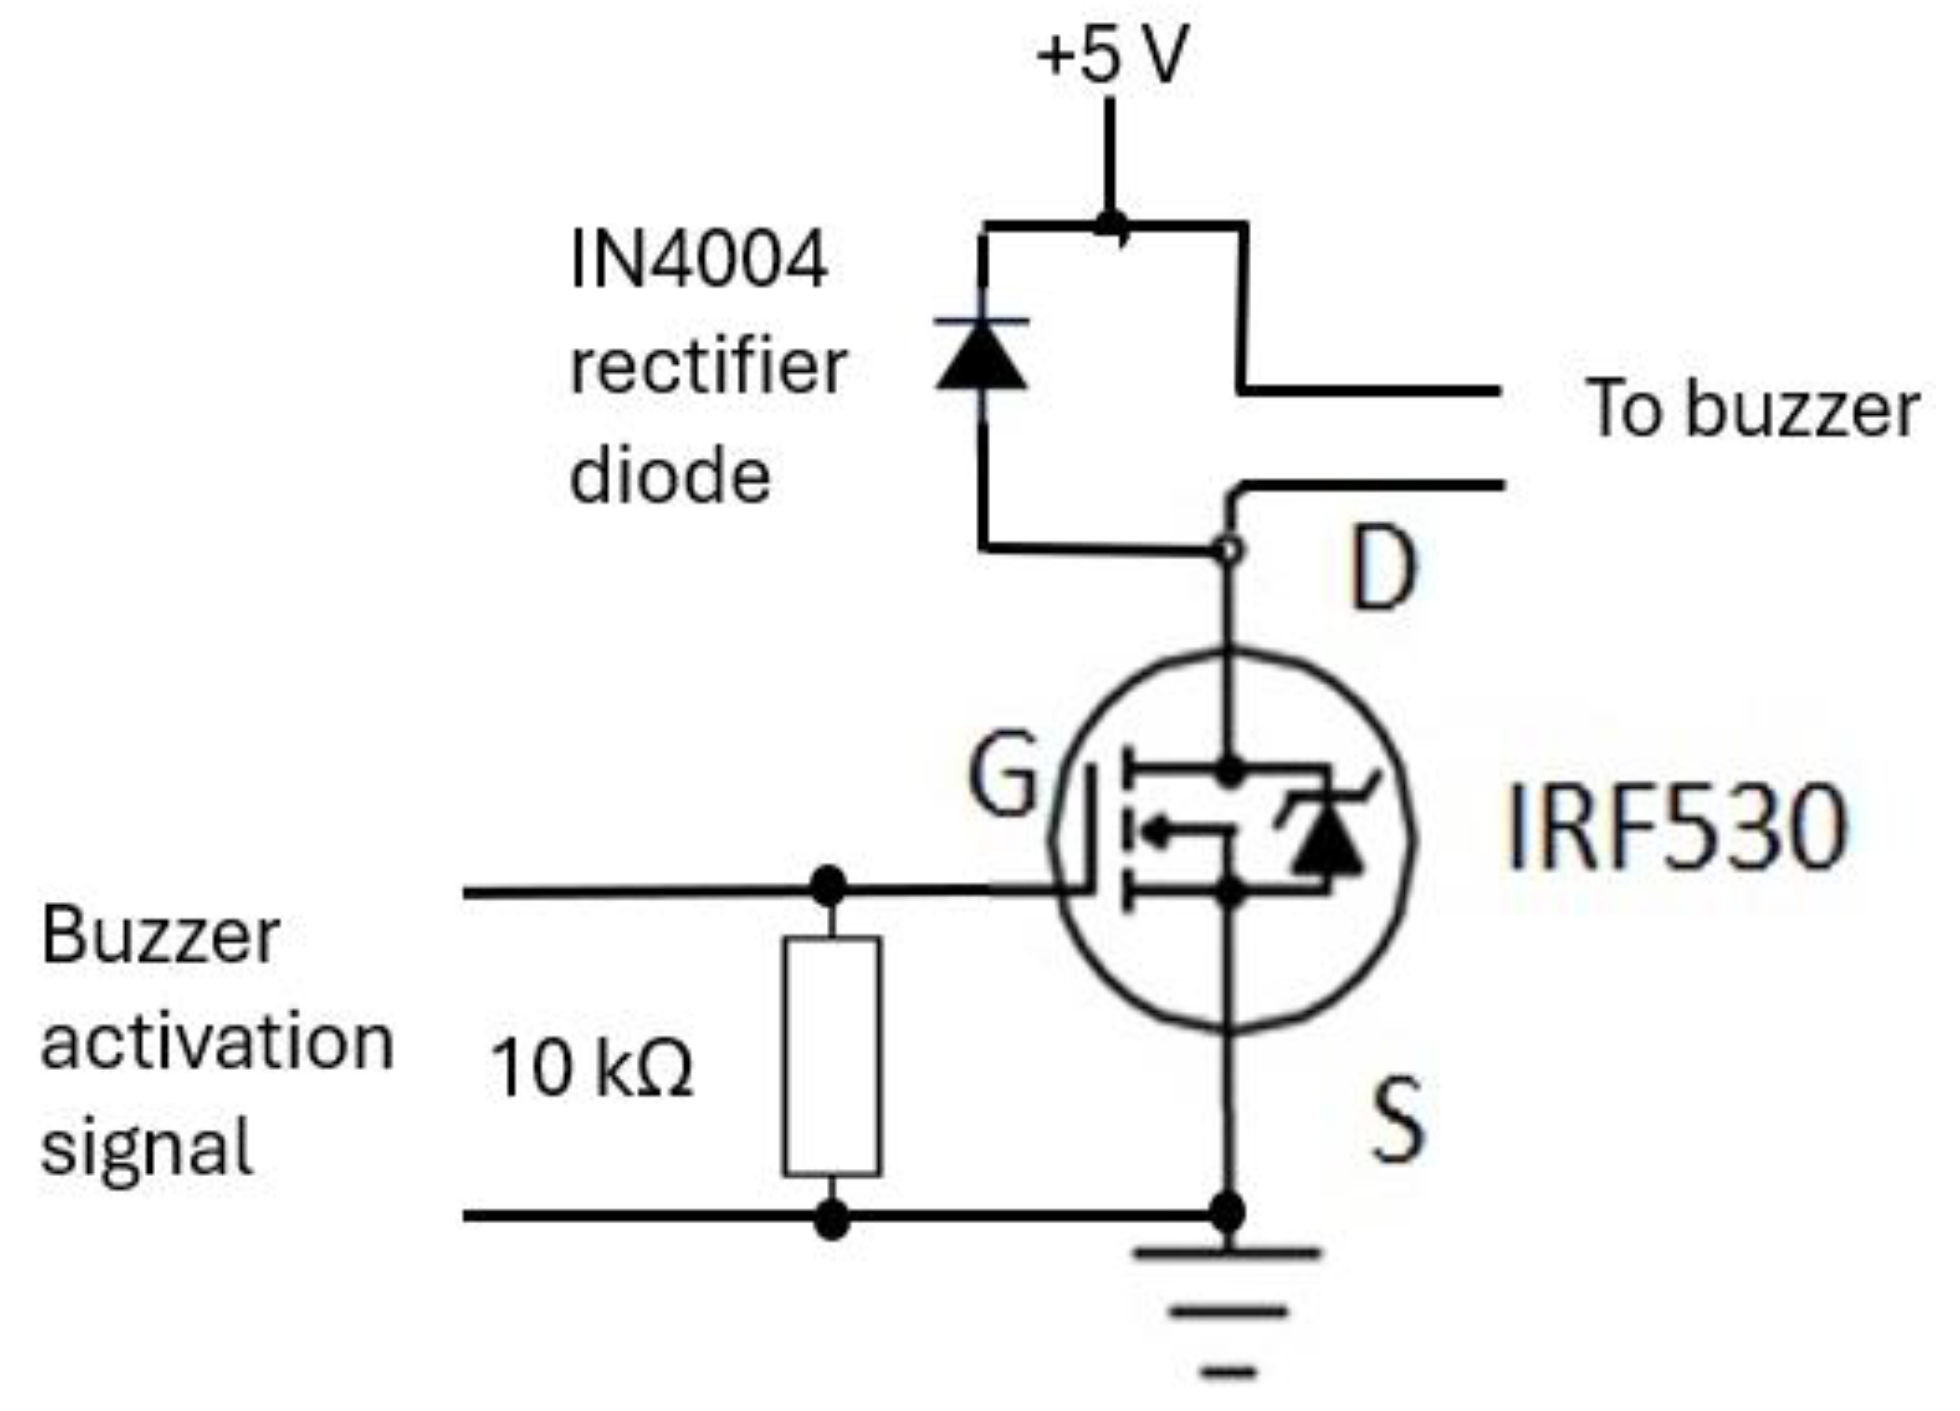
Figure 18.
The elements of the device’s power supply unit. (a) 12 V rechargeable battery [66], (b) battery charger unit [67], (c) 7805T [68] regulator for 5 V supply, (d) LD1117V33 [69] regulator for 3.3 V supply.
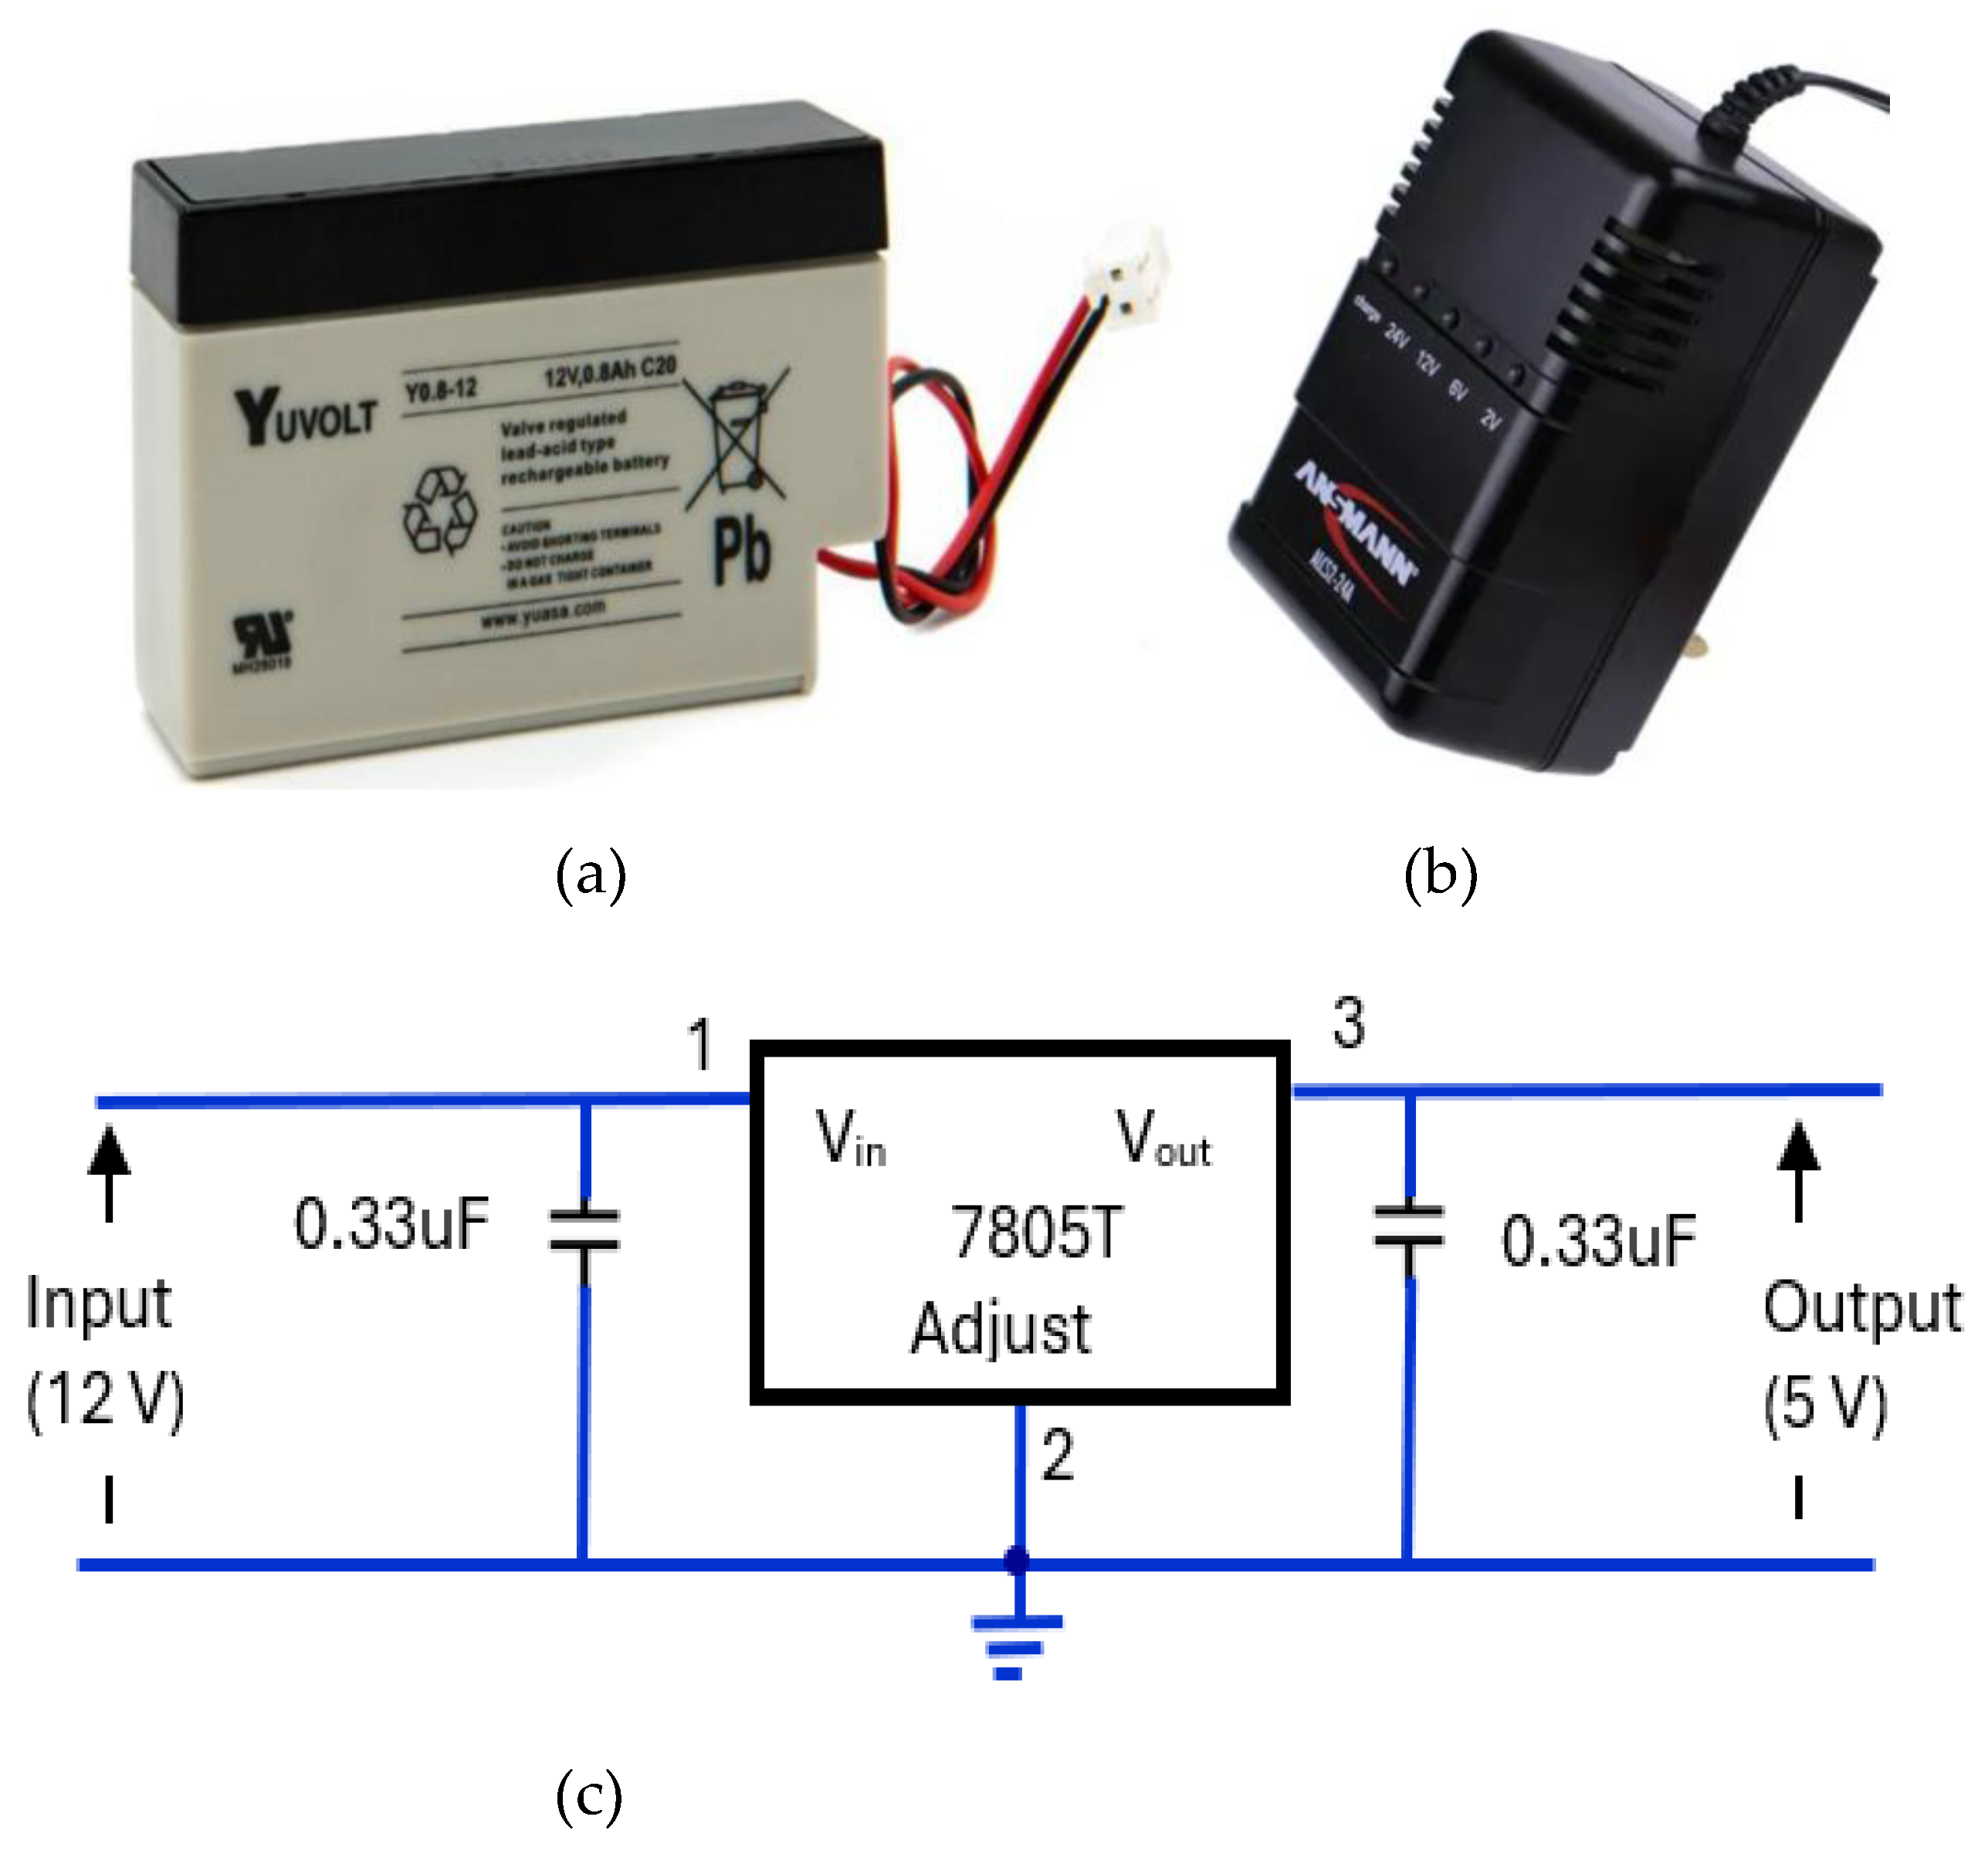
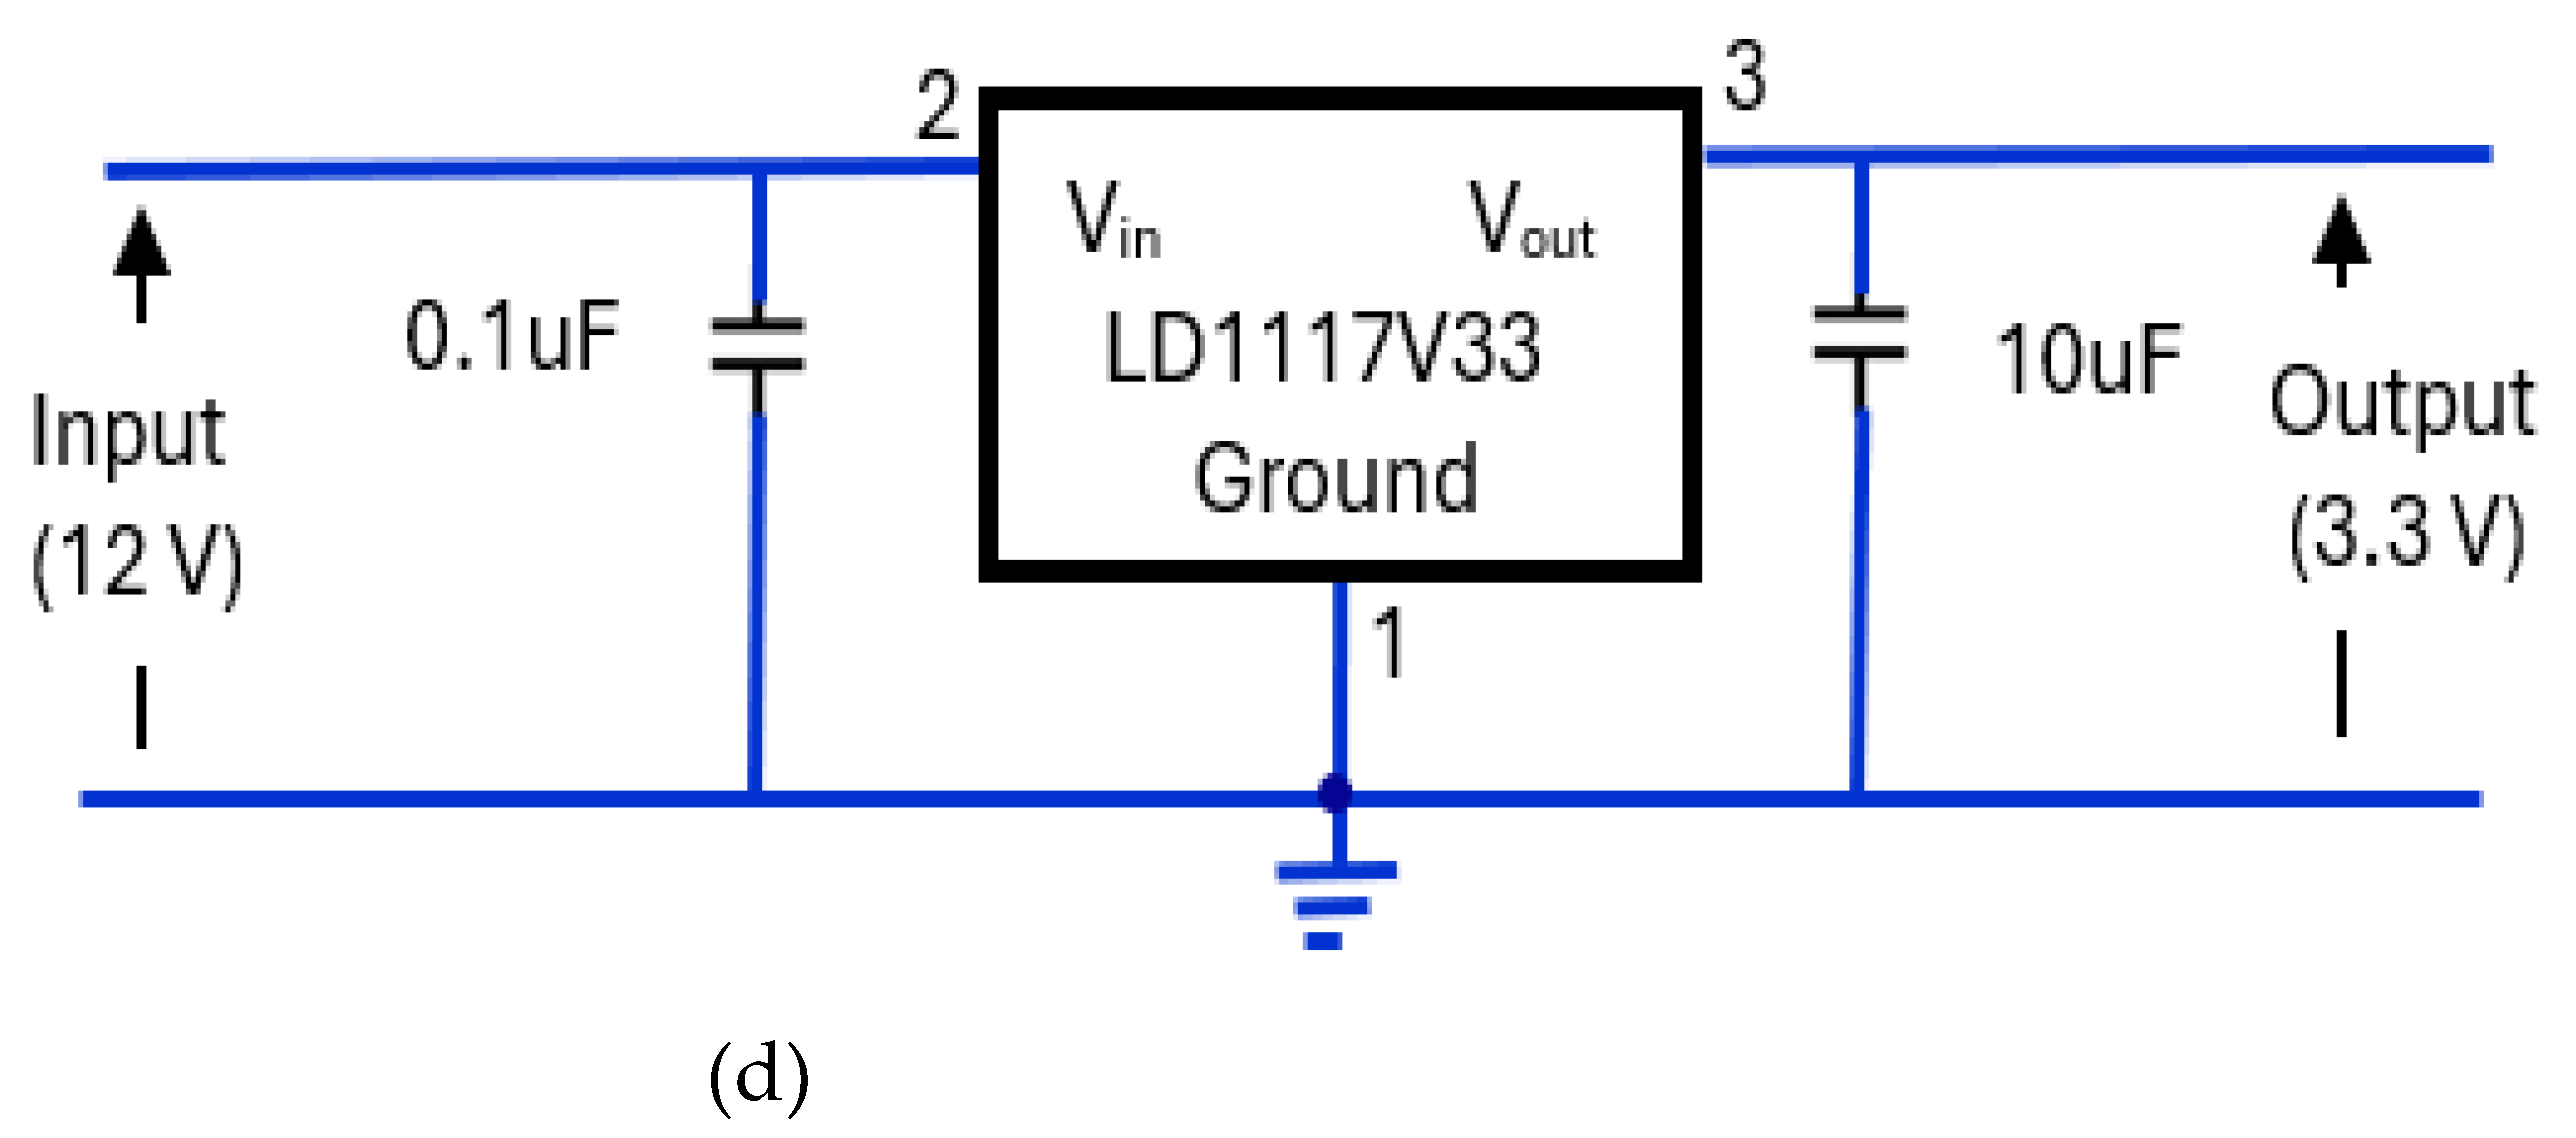
Figure 19.
Respiration signal recorded using SOMNOtouch™ RESP (top figure) and its magnitude frequency spectrum (bottom figure). The highest peak is 0.269 Hz, corresponding to the respiration rate of 16.1 bpm.
Figure 19.
Respiration signal recorded using SOMNOtouch™ RESP (top figure) and its magnitude frequency spectrum (bottom figure). The highest peak is 0.269 Hz, corresponding to the respiration rate of 16.1 bpm.
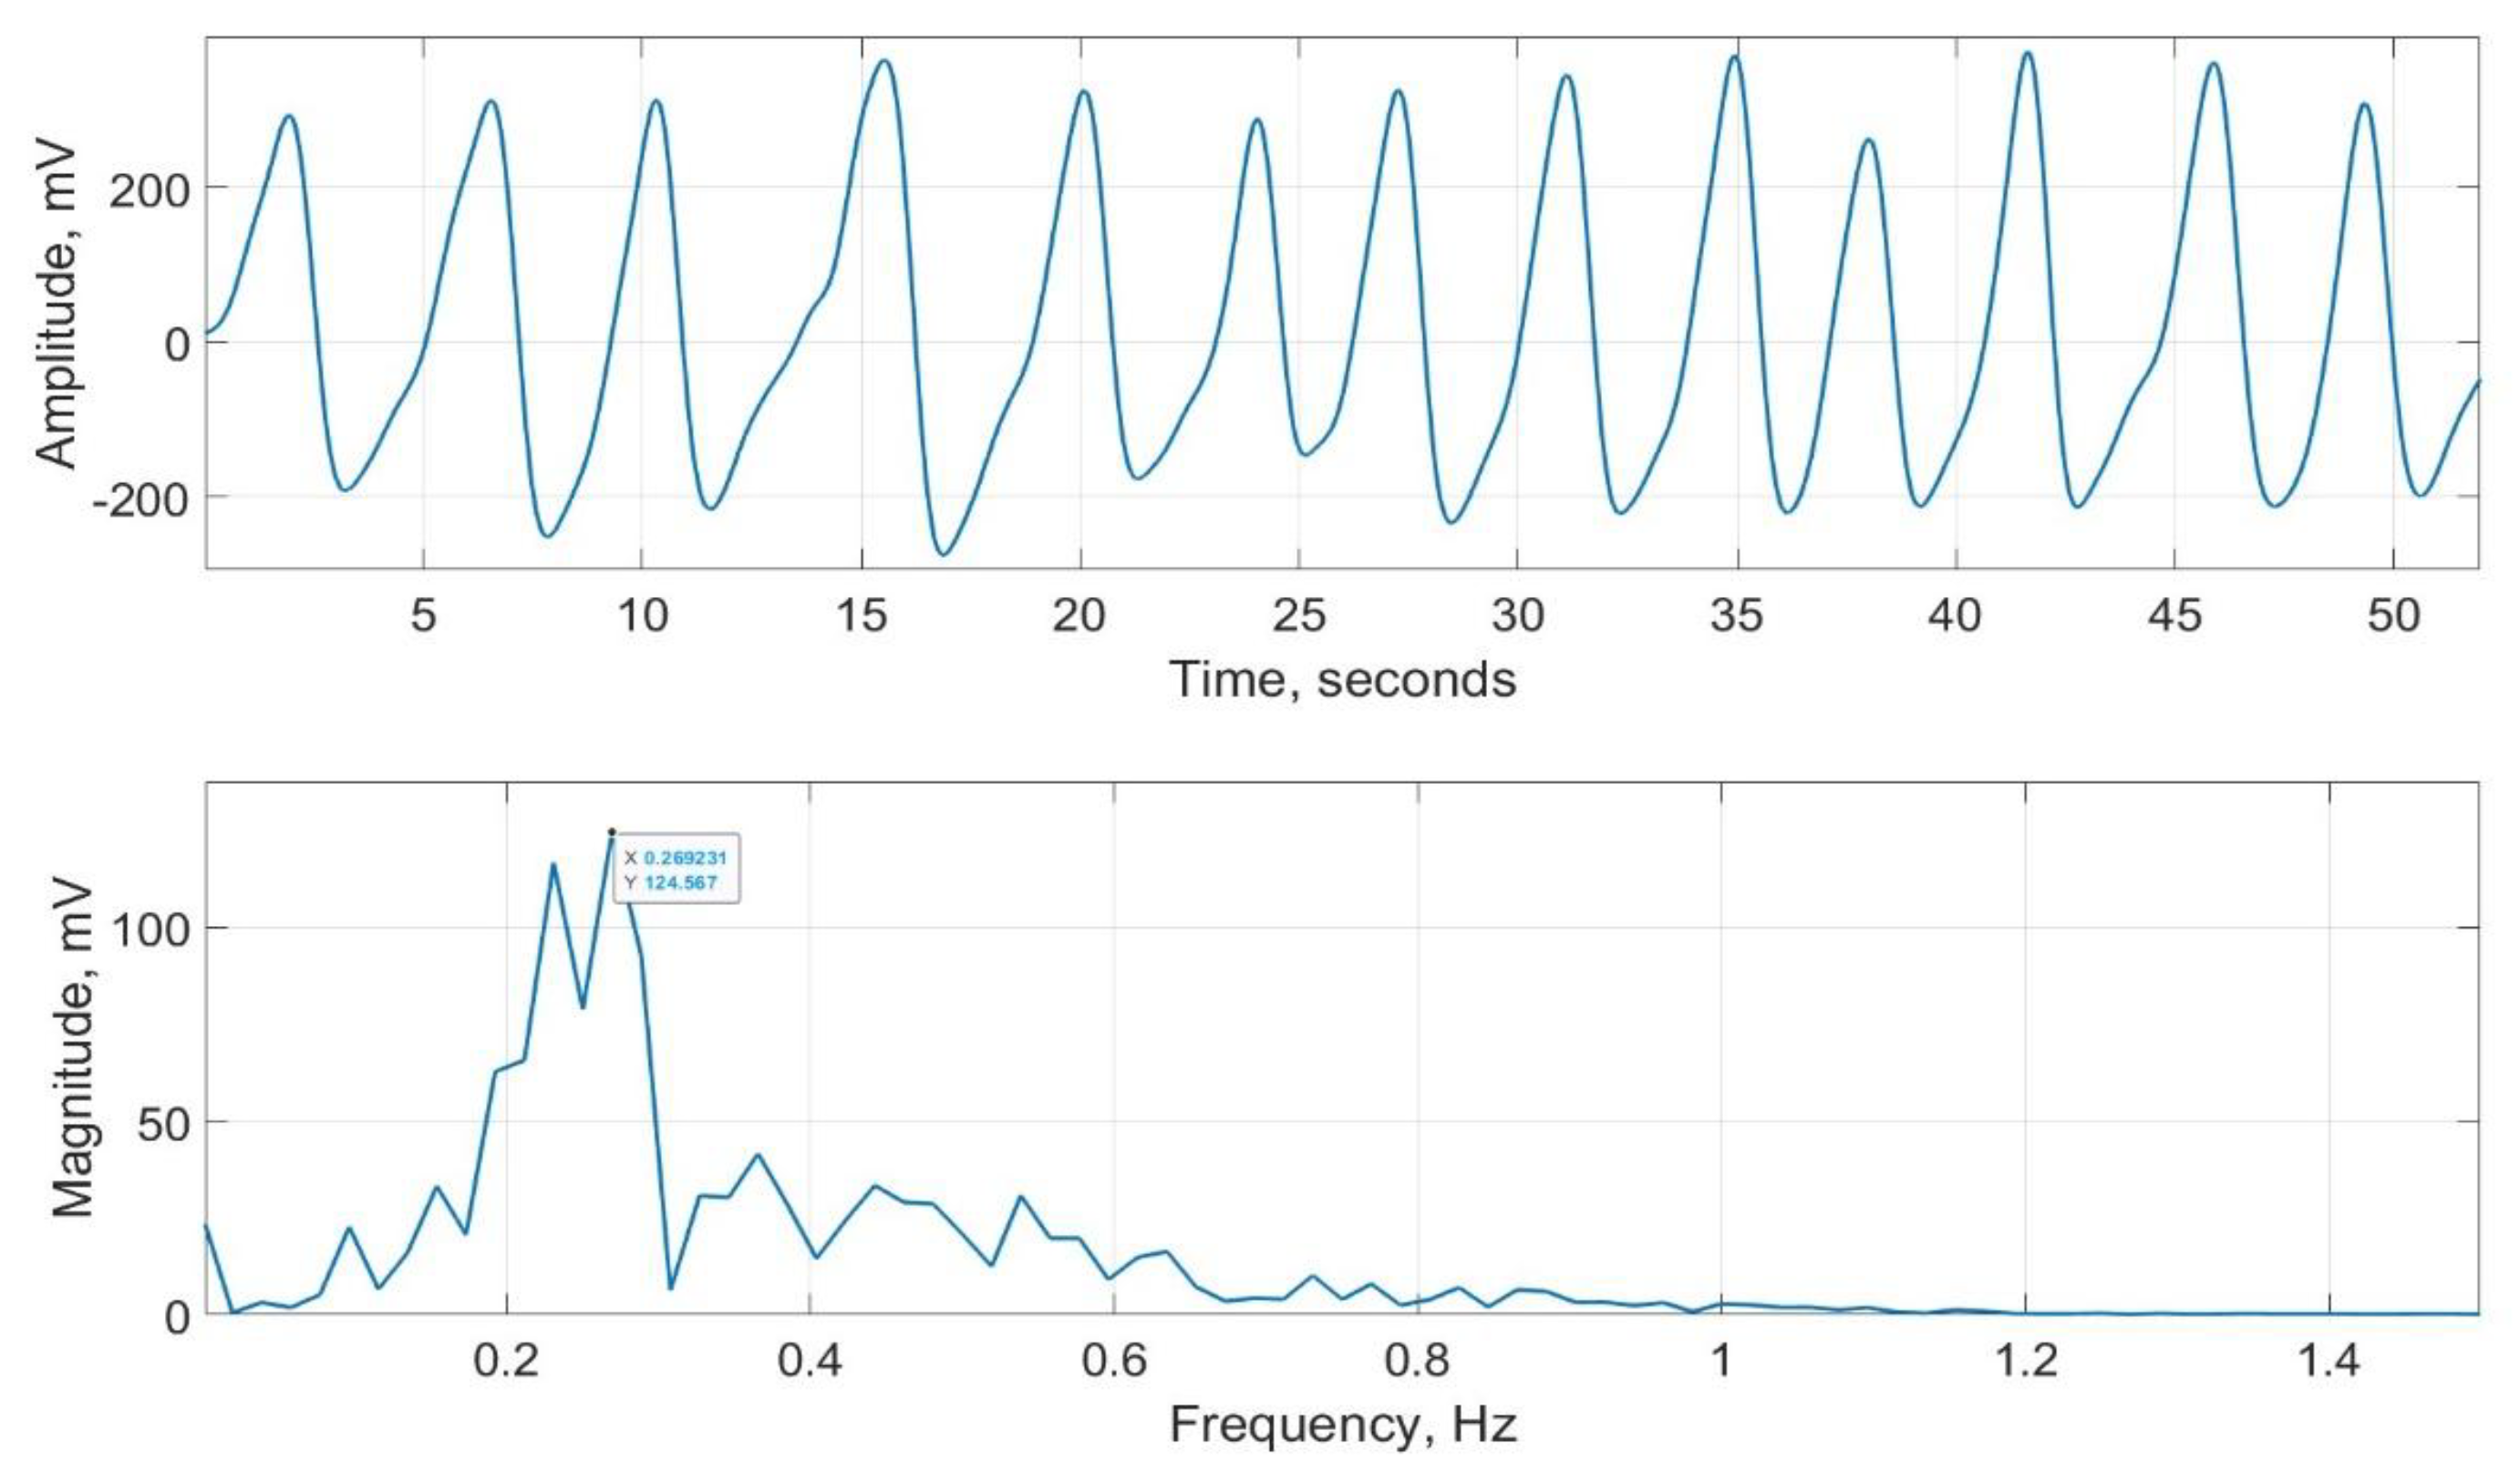
Figure 20.
Scatter plot of respiration rate measured by CPRM against the visual chest movement counting method.
Figure 20.
Scatter plot of respiration rate measured by CPRM against the visual chest movement counting method.
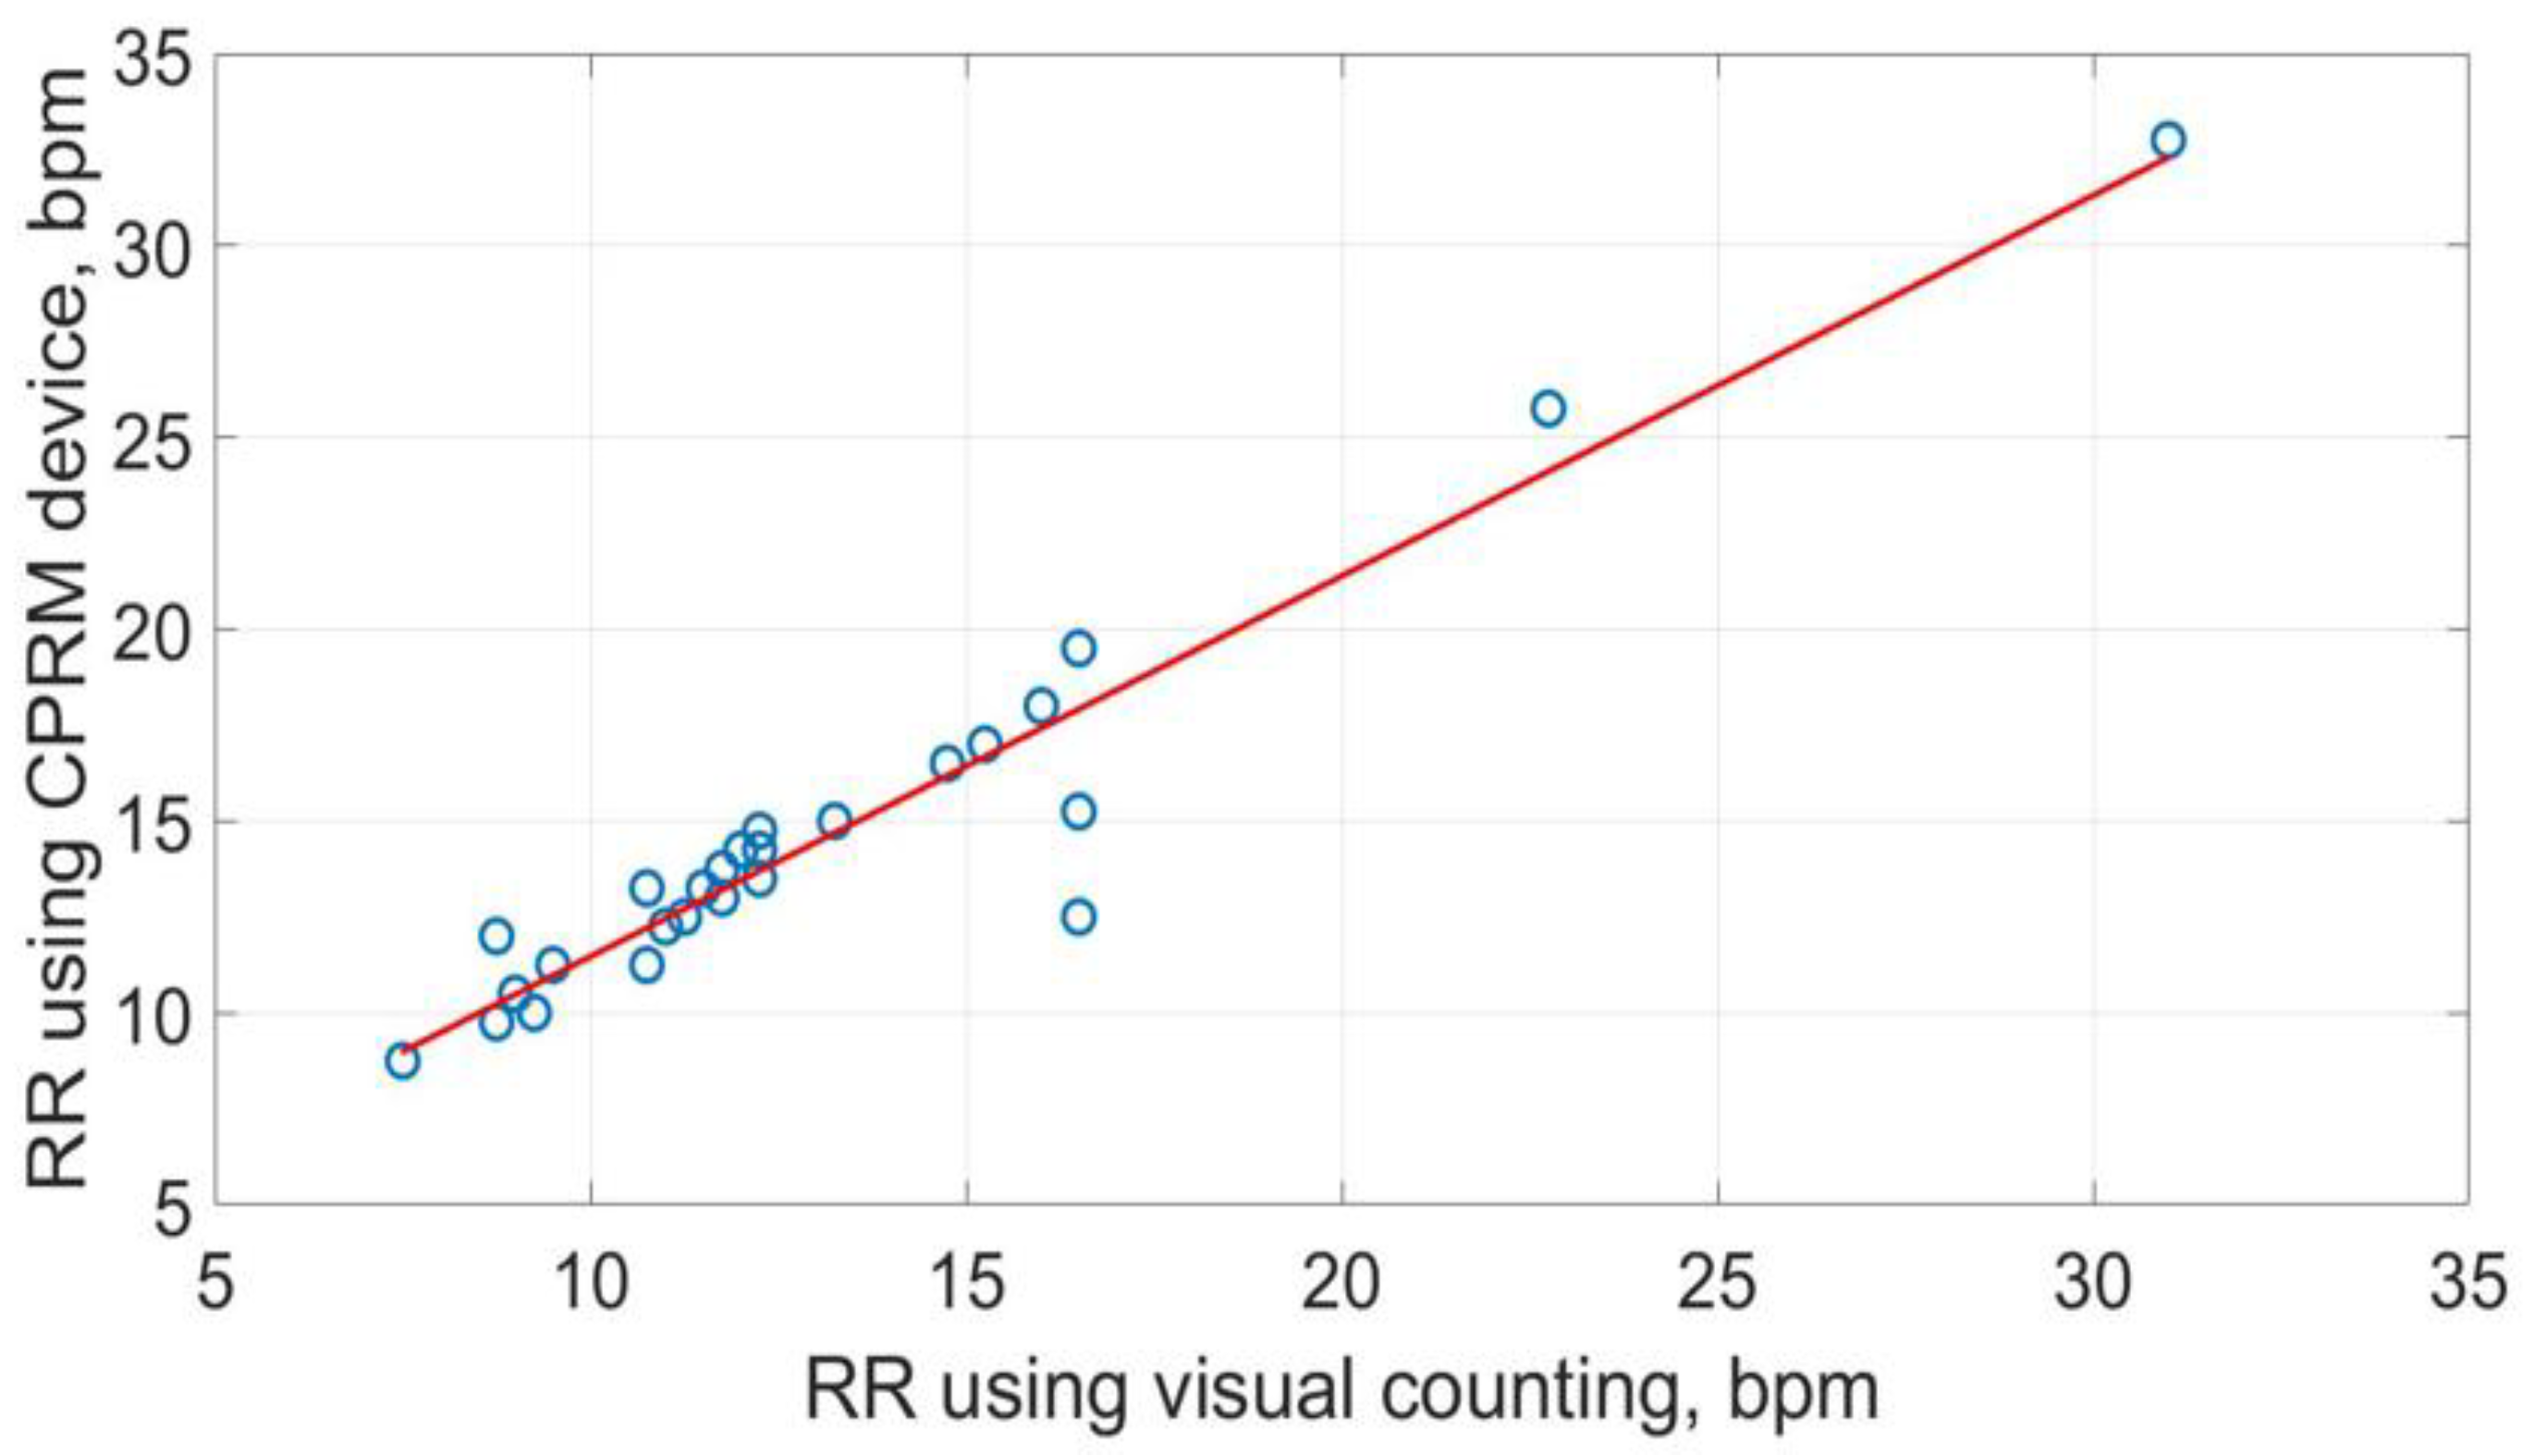
Figure 21.
Scatter plot of respiration rate measured by SOMNOtouch™ RESP against the visual counting of chest movement.
Figure 21.
Scatter plot of respiration rate measured by SOMNOtouch™ RESP against the visual counting of chest movement.
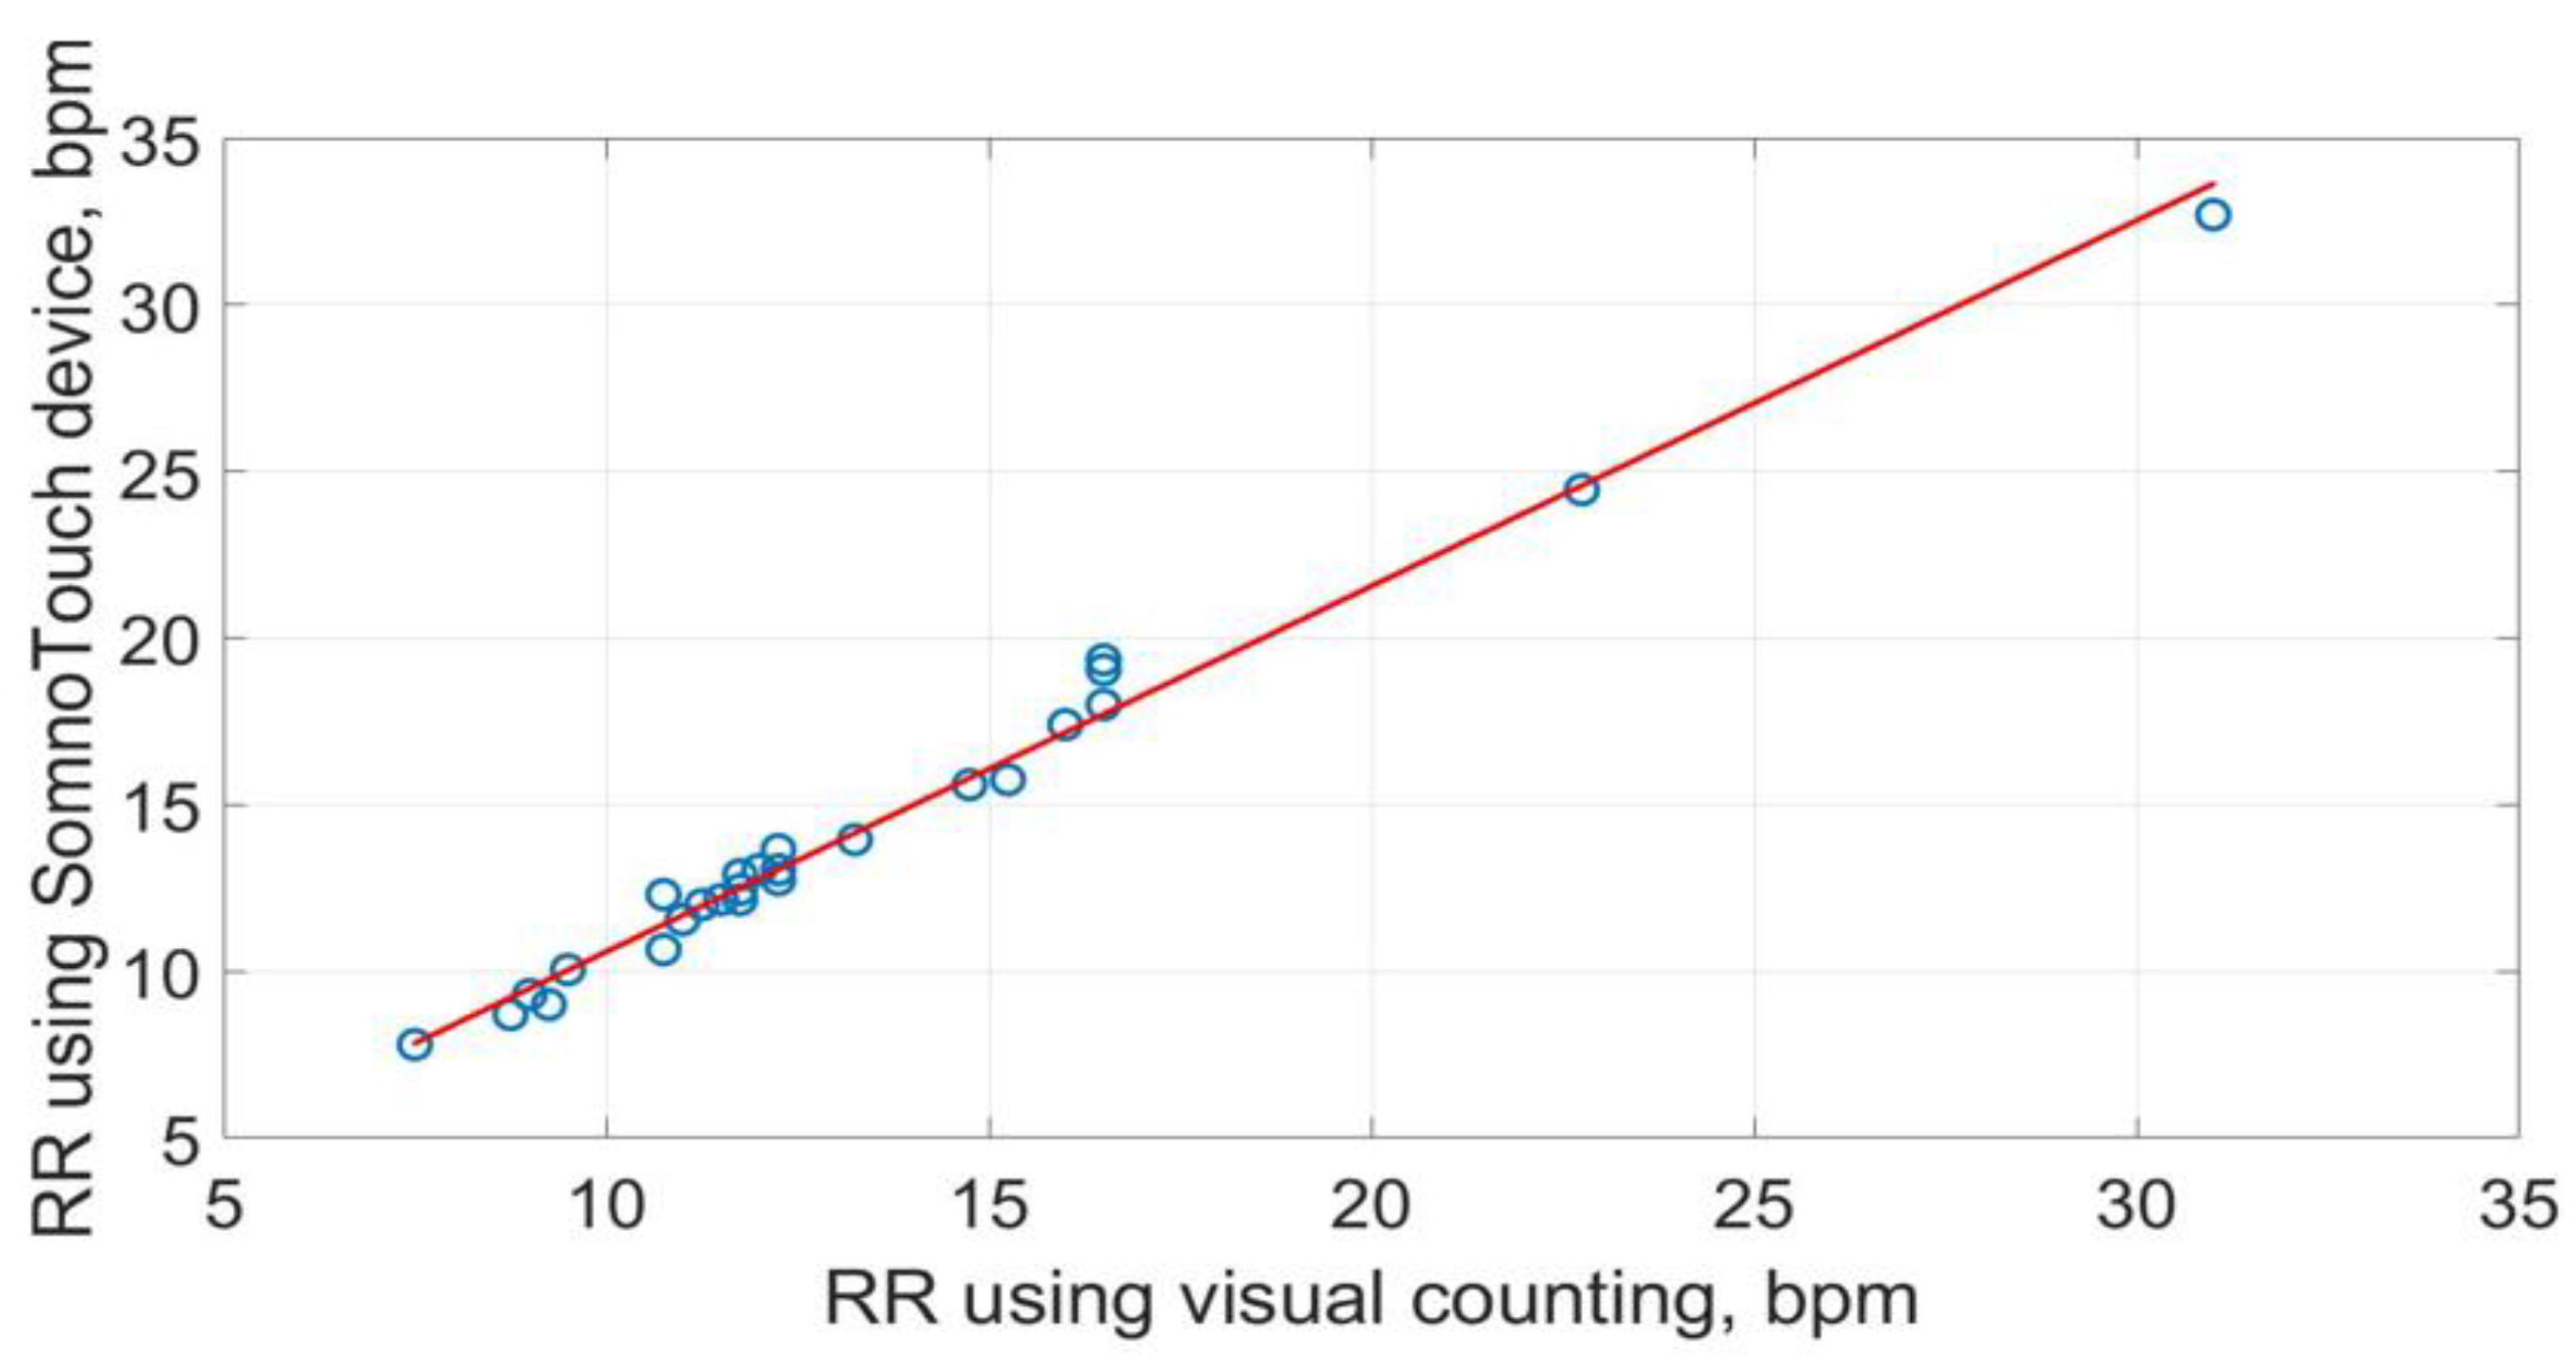
Figure 22.
Scatter plot of respiration rate measured by CPRM against SOMNOtouch™ RESP.
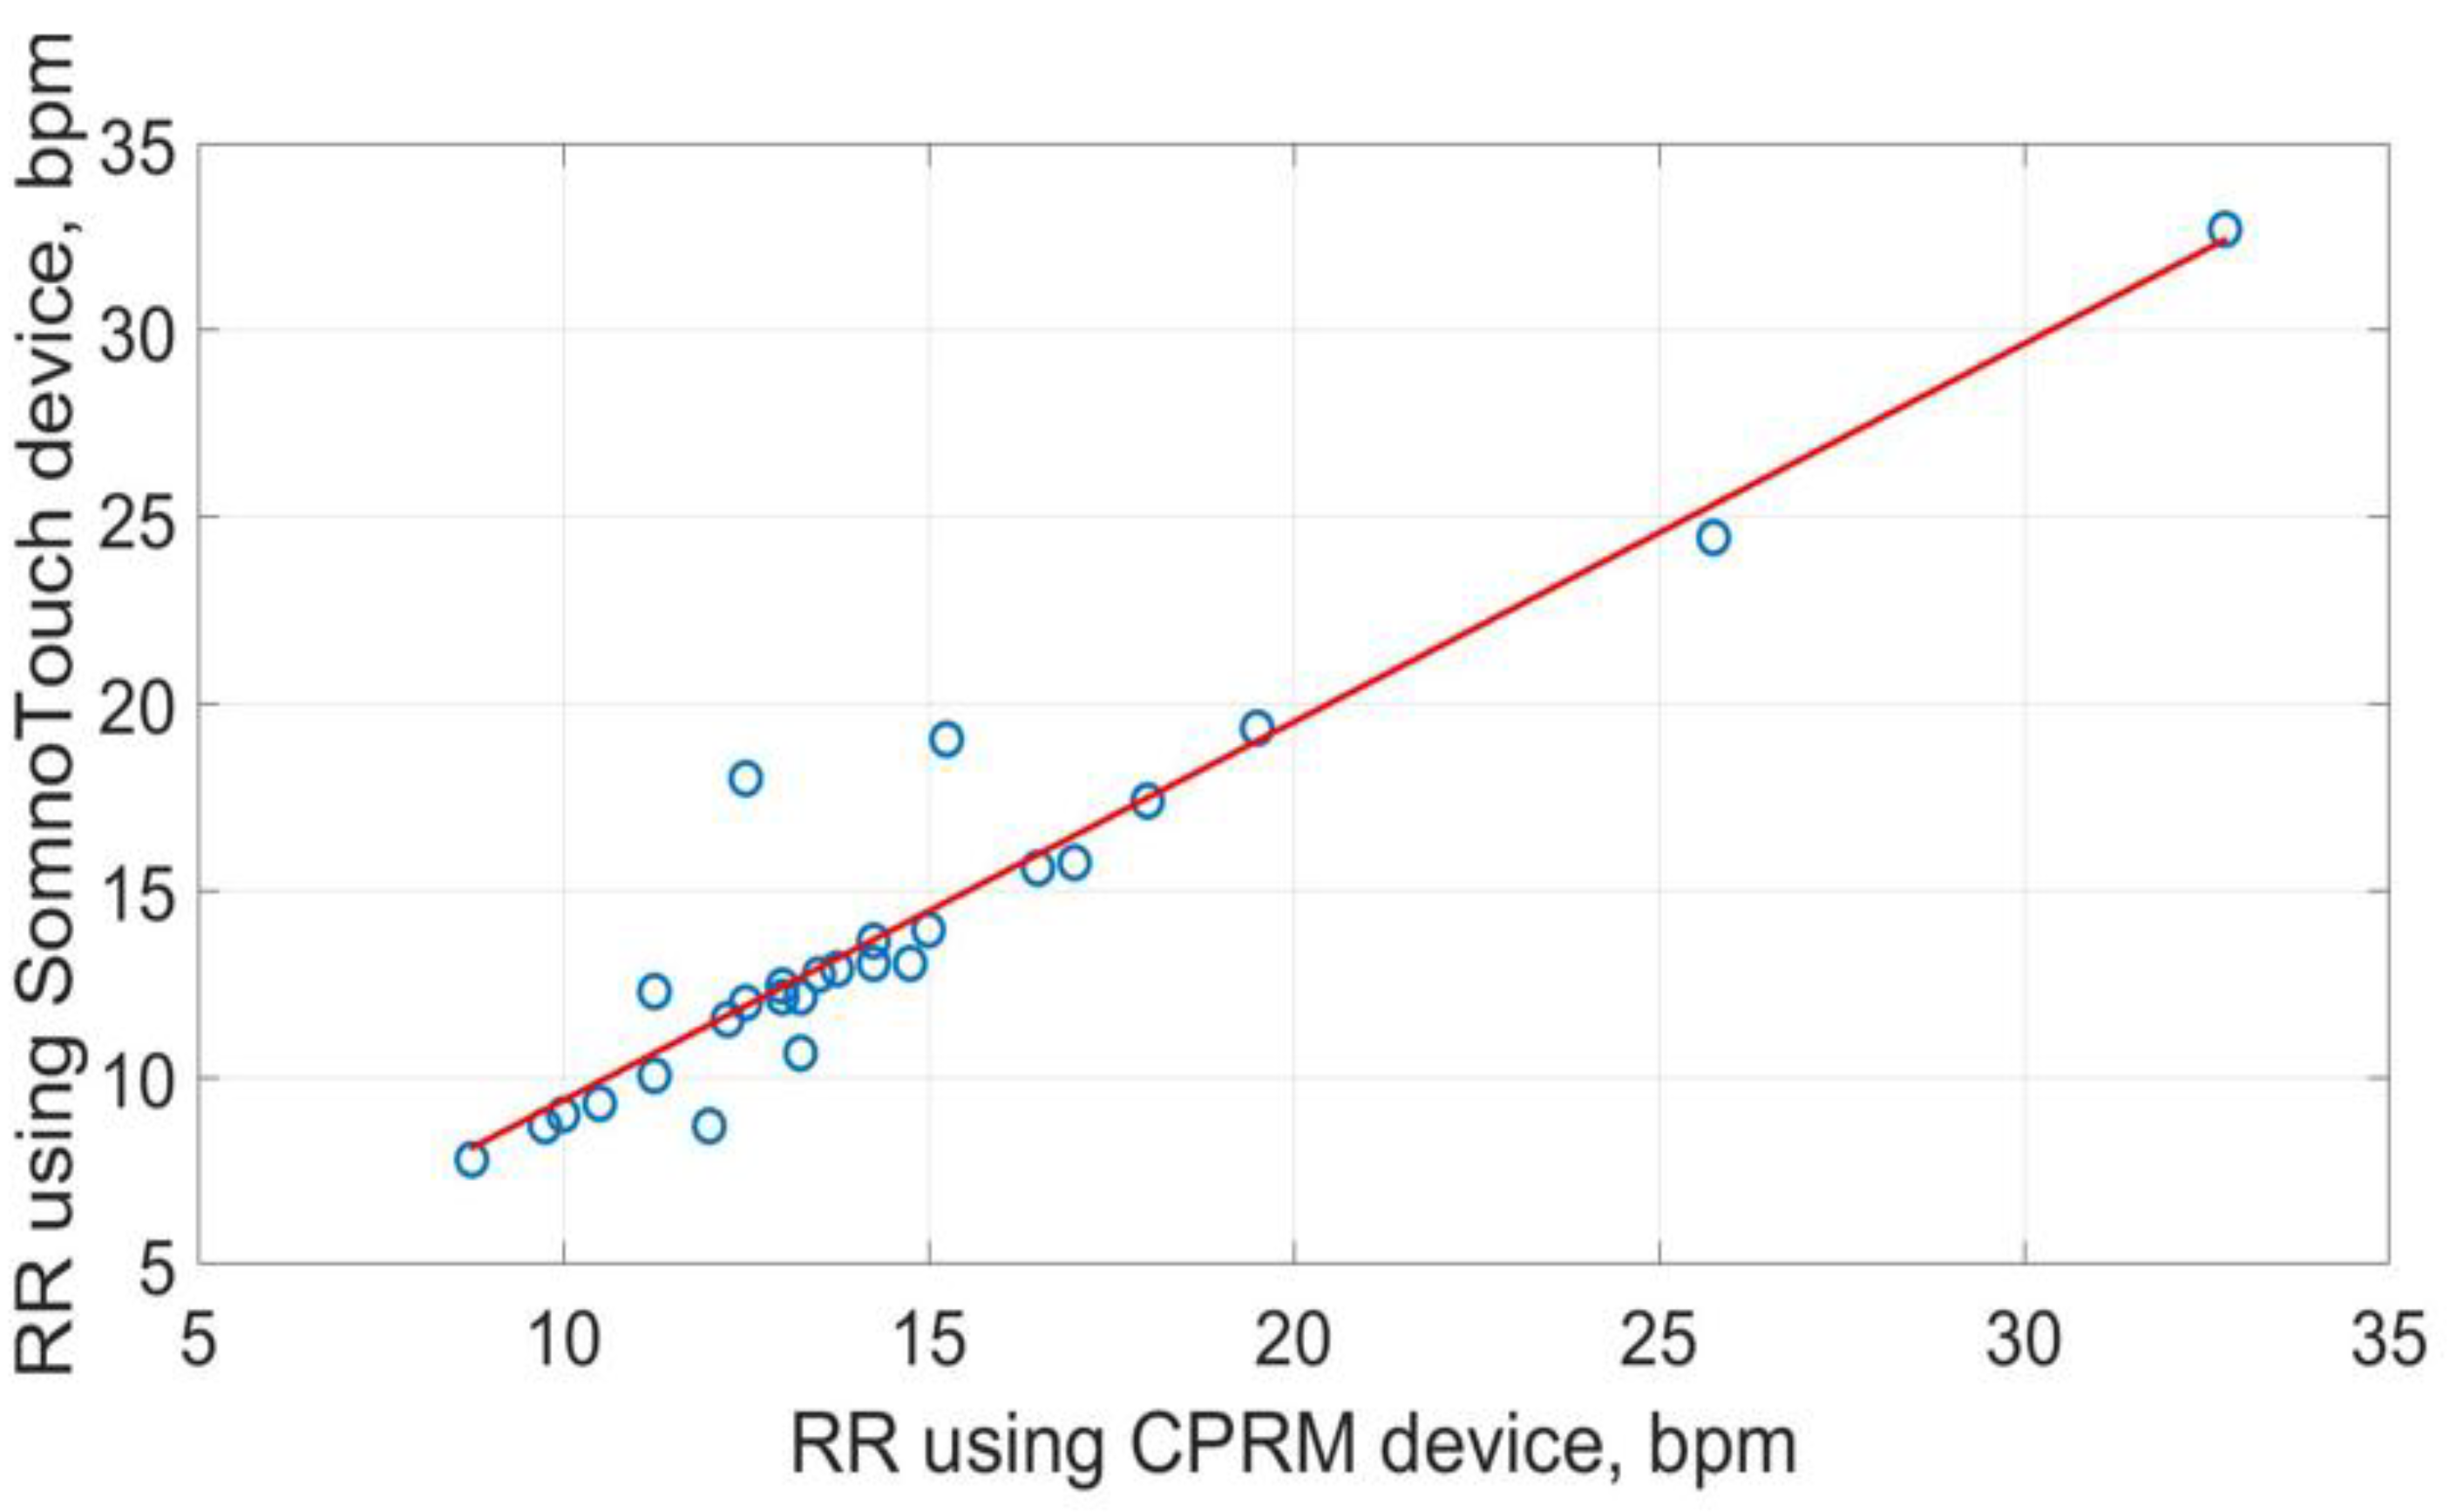
Figure 23.
Box plots of the three respiration rate methods.
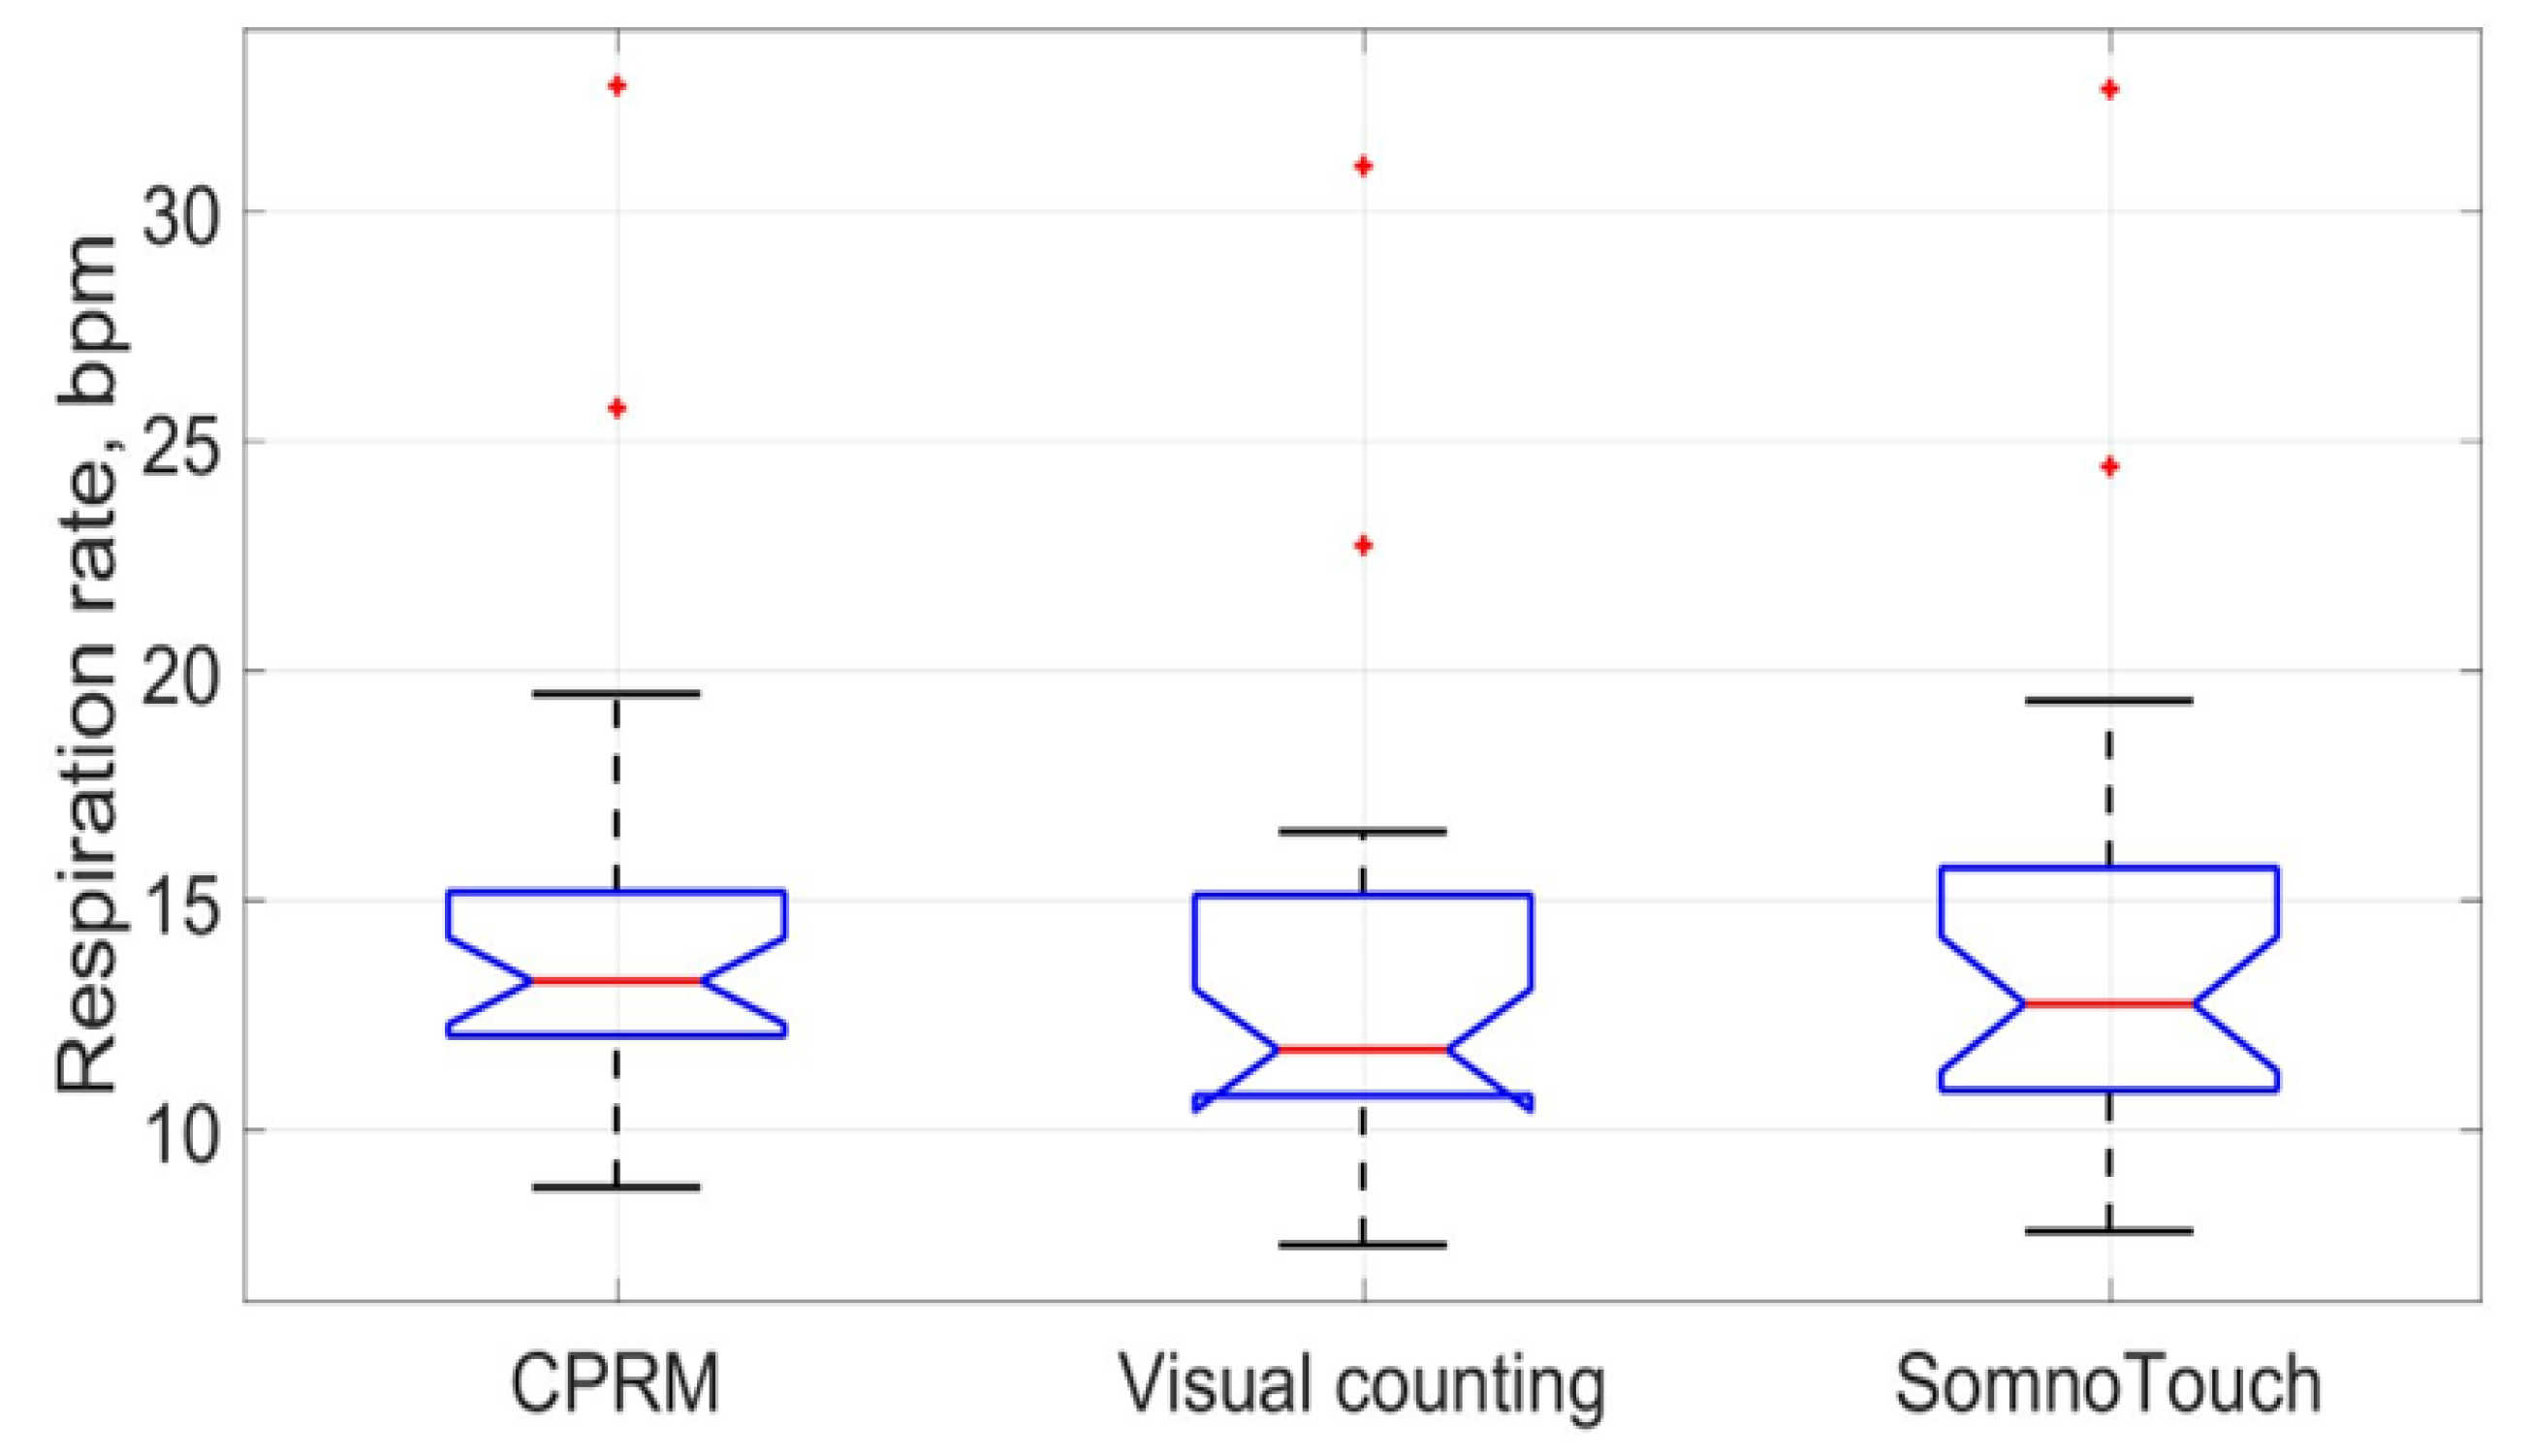
Figure 24.
Bland-Atman plot comparing CPRM and visual counting methods of RR measurement.
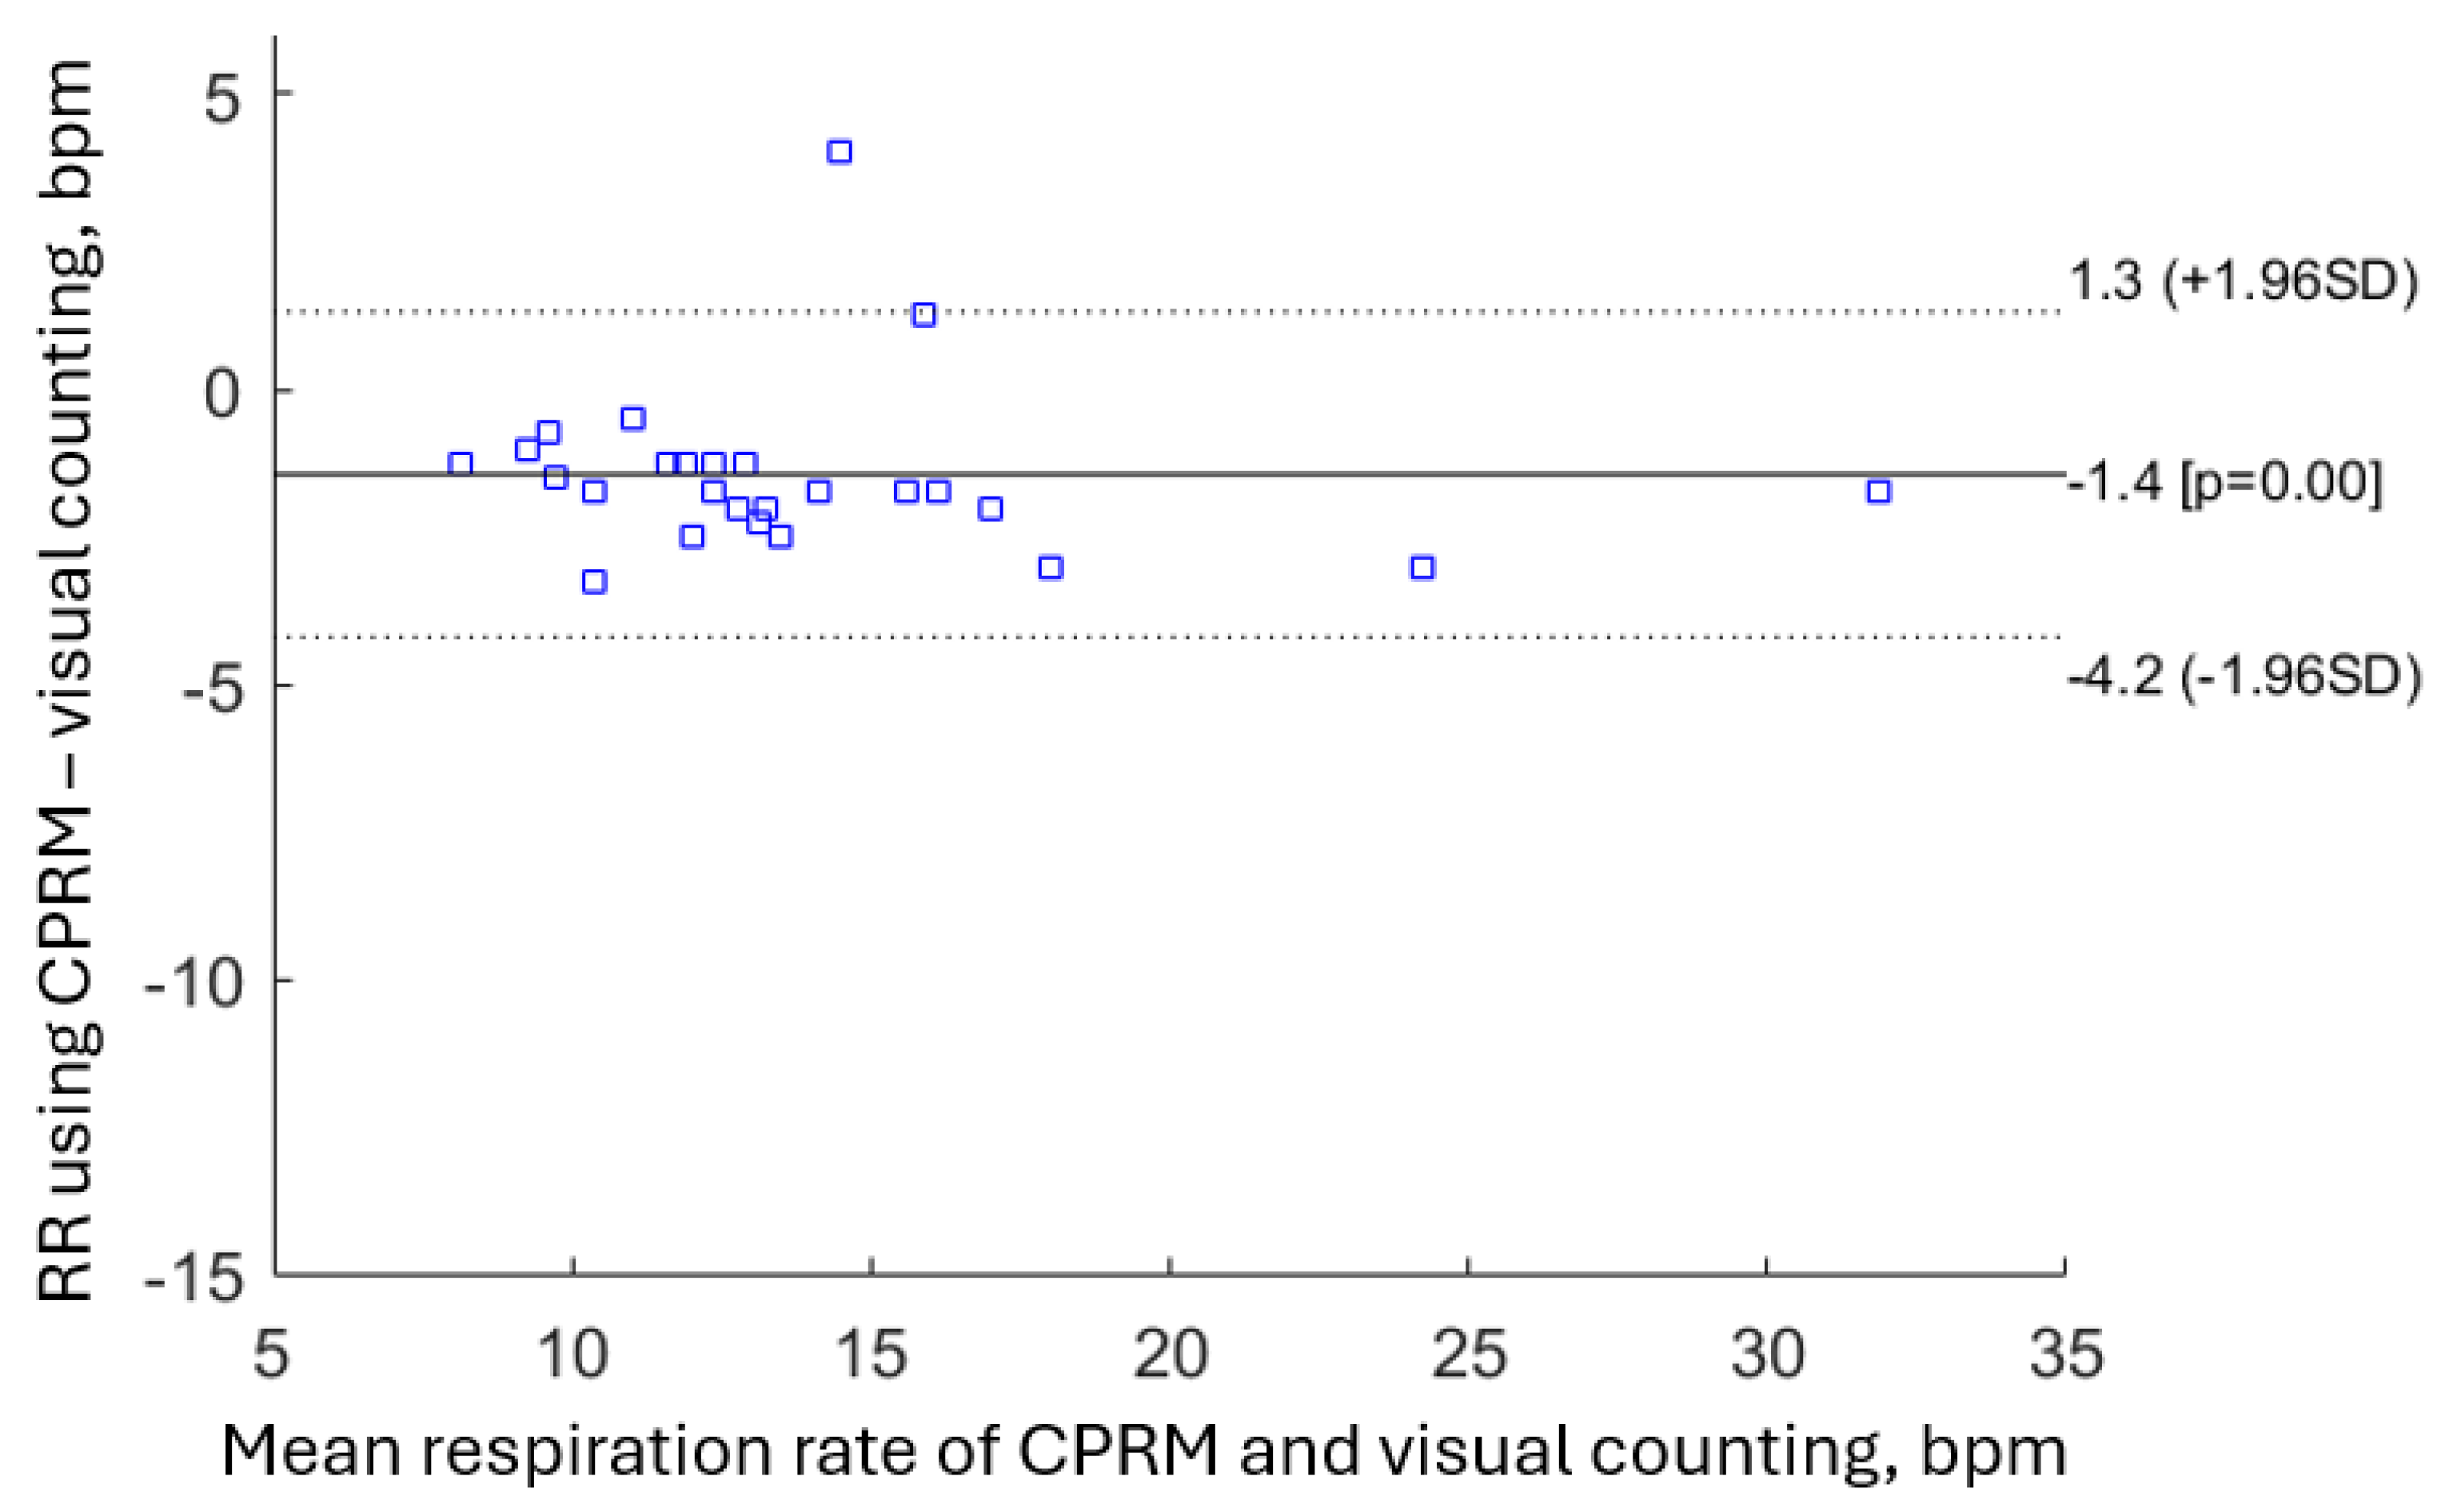
Figure 25.
Bland-Atman plot comparing CPRM and SOMNOtouch™ RESP for measuring RR.
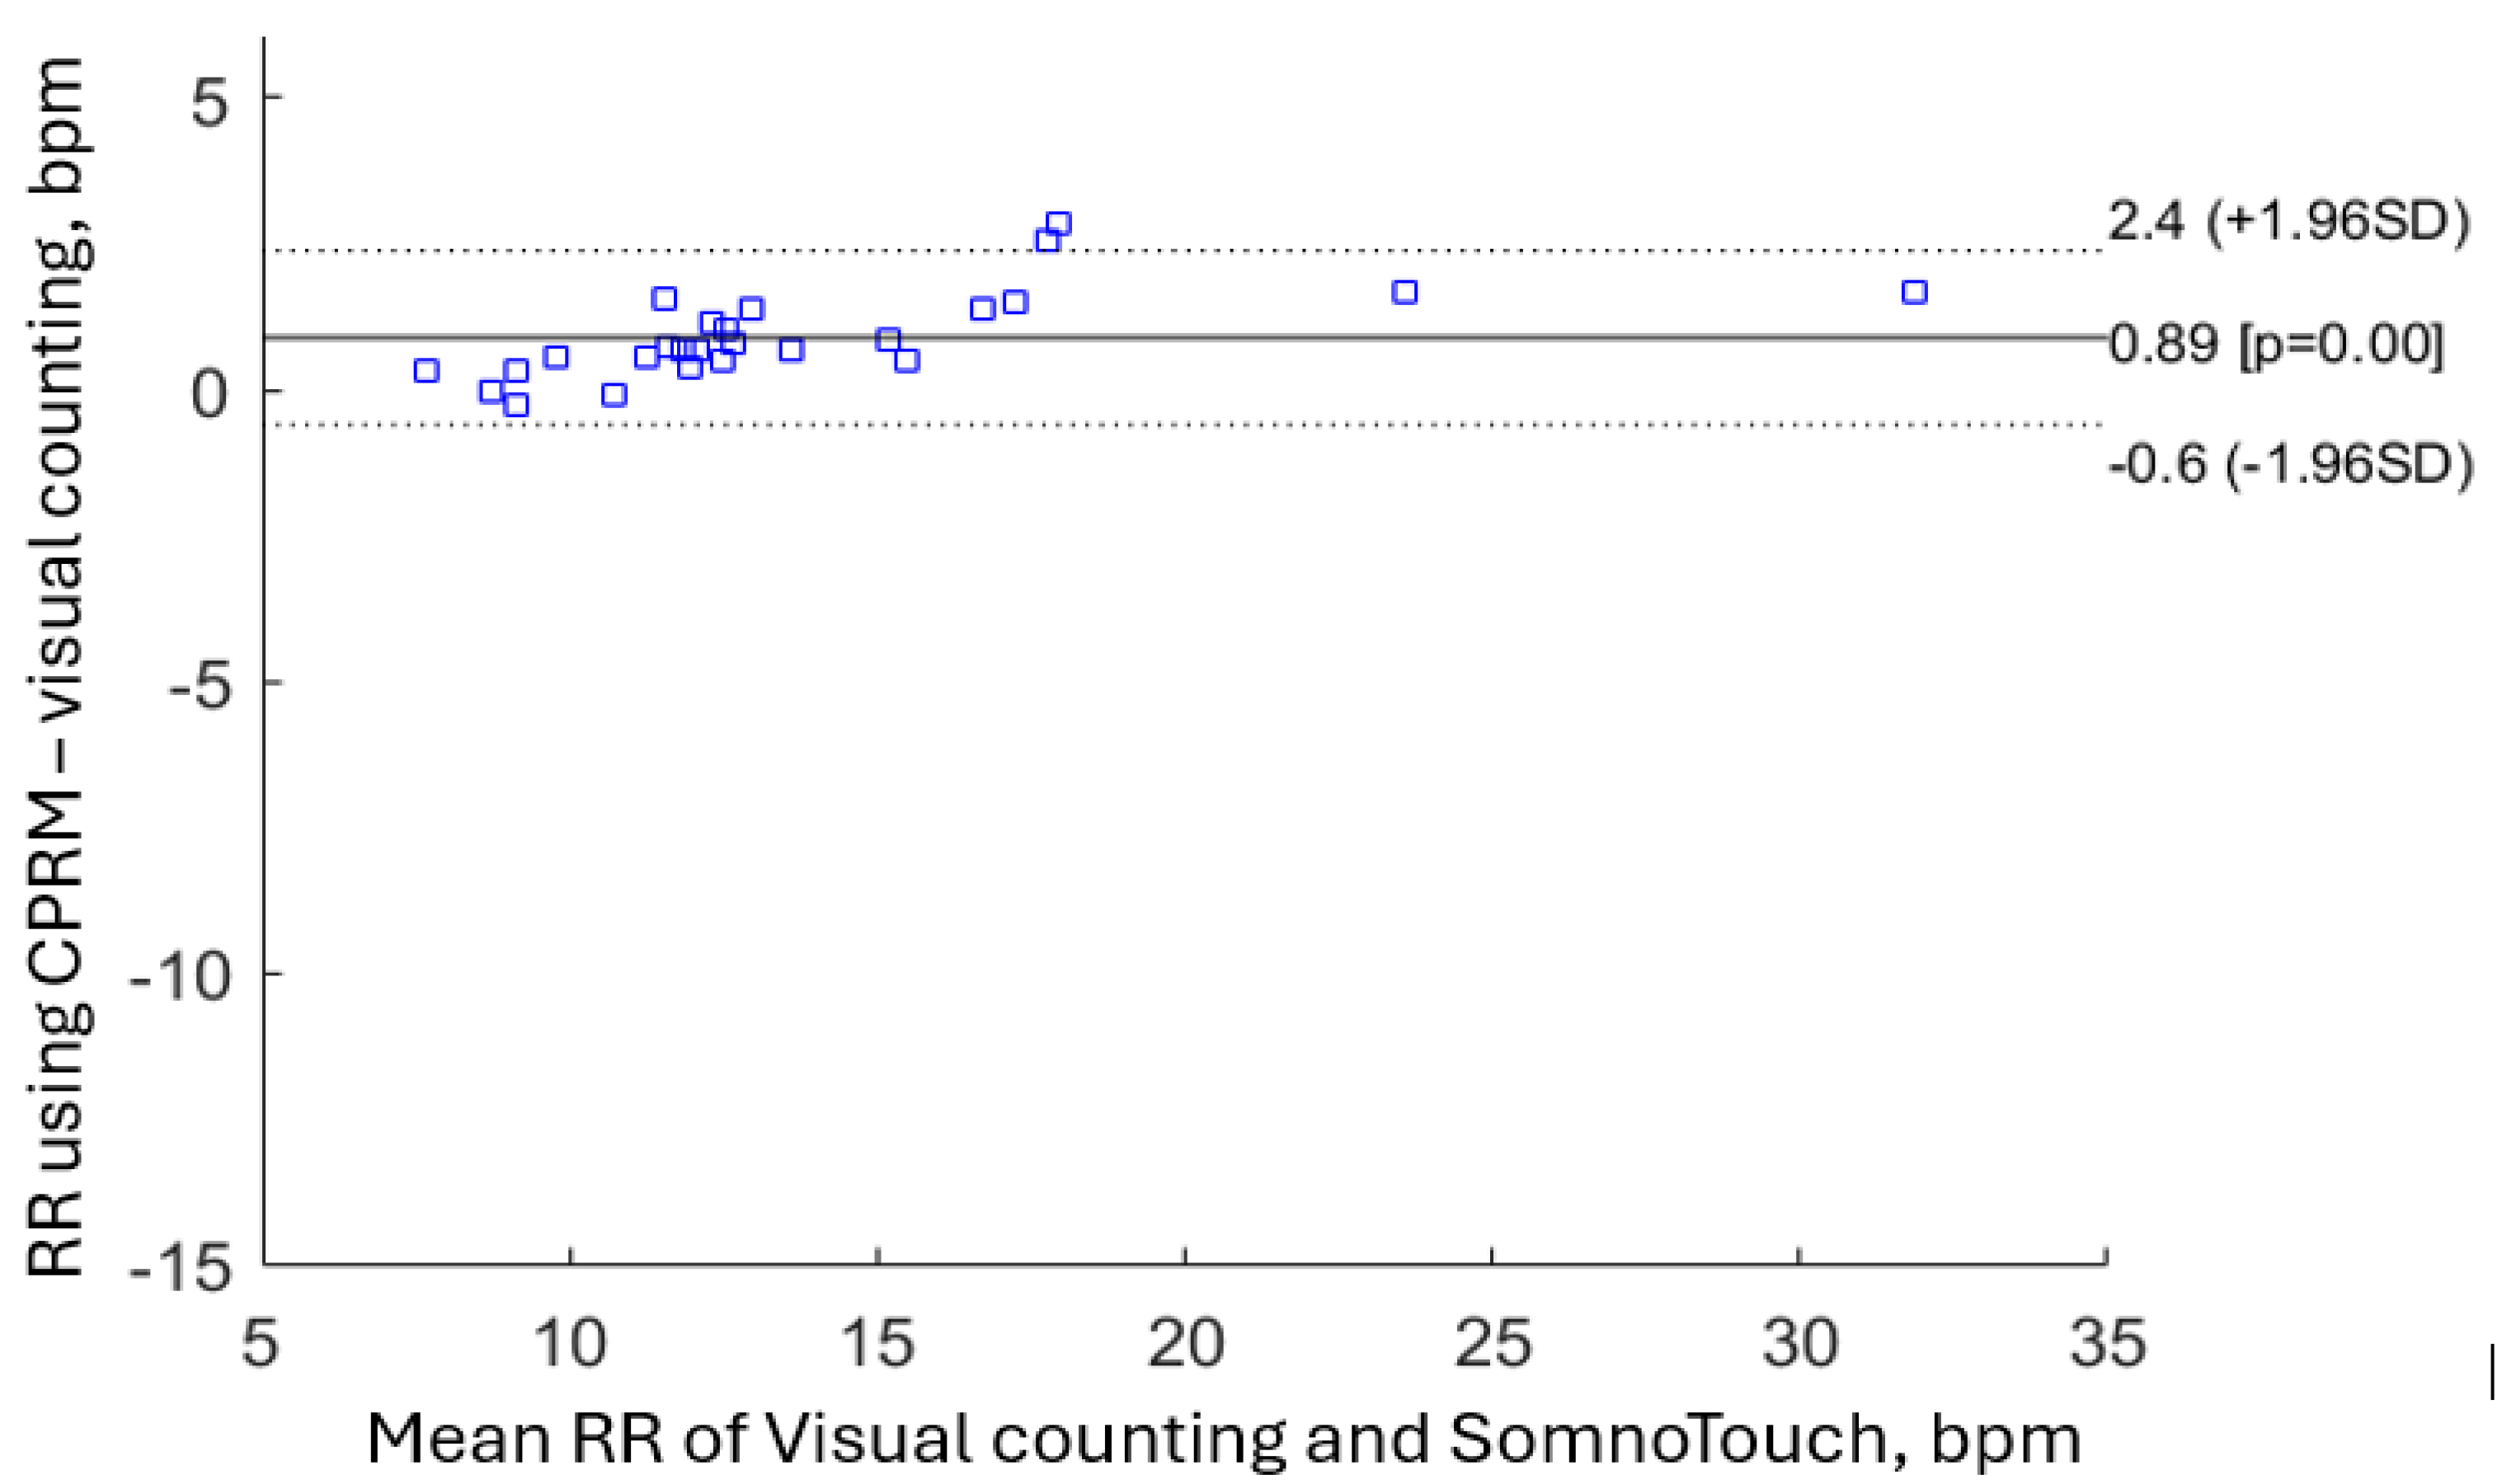

Table 1.
Comparison of RR measurement technologies, methods used for evaluations and findings.
| Study | RR measurement technology | Methodology | Main findings |
| [52] | Ultrasound transceiver | An ultrasound transceiver is adapted as part of internet of things and cloud to measure respiration rate in a simulated setting. | Tests in a simulated setting demonstrated respiration rate could be measured in a non-contact manner. |
| [35] | Thoracic electrical impedance pneumography | A simple wireless impedance pneumography system for sensing respiration is reported. It is evaluated on fifteen volunteers. | The device could measure the respiratory cycle variations. |
| [32] | in-fiber Mach-Zehnder interferometer (optical approach) | A Mach-Zehnder interferometer is incorporated in a textile belt and attached to the abdomen. The set up has been evaluated by measuring the respiration rates of six volunteers. | The set up successfully measured respiration rate in the individuals tested. |
| [55] | Review | A review of RR estimation from the electrocardiogram and pulse oximetry (photoplethysmogram, PPG) | Numerous algorithms have been proposed to estimate RR from the electrocardiogram (ECG) and pulse oximetry that provide an opportunity for automated RR measurement. |
| [56] | Pulse oximetry | Fifteen healthy adults (mean age 21±1.2 years) were recruited, and the sensor was attached to the left index or middle finger. |
RR can be determined from pulse Oximetry. |
| [8] | Review | Contact and non-contact respiration measurement methods were compared, focusing on children. | Non-contact respiration rate measurement methods are preferrable in children due to their higher tolerance, but more developments are needed. |
| [37]. | Infrared thermal imaging | Forty-one adults and 20 children were recruited, and their facial infrared thermal images were recorded. Image processing methods were used to determine respiration rate from the recorded images. | The correlation between respiratory rate measured using infrared thermal imaging and a contact method used for comparison was 0.94. |
| [24] | ECG-derived | Several methods were proposed to improve accuracy and reduce computational complexity, accuracy and power consumption for ECG-derived respiration rate estimation. | The proposed method achieved high QRS detection accuracy (99.18%) and low ECG-derived respiration rate estimation mean absolute error (0.73). |
| [53] | Mobile phone and ultrasound | The built-in speaker of a mobile phone was used to generate an ultrasound signal and the phone’s microphone was used to receive the signal reflected from the subject. | The method tracked chest movement and estimated RR under different test conditions. |
| [57] | Systematic review of RR measurement technologies | PubMed, Embase, and Compendex databases were searched for publications through September 2017 to assess RR measurement technologies. |
The focus of the paper was RR measurement to identify childhood pneumonia. There is an urgent need for affordable and effective RR measurement technologies. |
| [58] | Photoplethysmography and capnography | 30 healthy volunteers, mean age 43 ± 12 years) were recruited to monitor respiratory patterns at various respiratory rates. | Photoplethysmography on the sternum provided measurements of respiratory rate comparable to capnography. |
| [38] | Vision based | RGB cameras and convolutional neural network are used to automatically detect the region of interest and measure RR. | The method is reported to measure RR with an error of approximately 0.1 bpm. |
| [59] | Mobile phone application | 30 healthy adult subjects were recruited. RR was estimated by determining the median time between breaths obtained by tapping on a mobile phone’s screen. | The method resulted in improved efficiency compared manual counting. |
| [7] | Non-experimental survey | A double-blind survey of nurses in Asia Pacific, Middle East, and Western Europe to understand RR measurement practices by nurses. | The study highlighted the need to enhance international nursing education regarding the importance of measuring respiration rate. |
| [48] | Microwave Doppler radar | Microwave Doppler radar is used to obtain different dynamics of breathing patterns in addition to the respiration rate. | Doppler radar is found to be effective for respiration rate measurement, identifying breathing patterns. and tidal volumes. |
| [6] | Systematic literature review | Reviewed CINAHL, PubMed, Medline and Scopus to explore how registered nurses are measuring respiratory rate in adults acute care health settings. | Despite its importance, the review indicated that RR is not being assessed correctly by nursing staff in the acute care environment. |
| [30] | Accelerometry | An accelerometer worn on the chest was used to measure RR. | The method estimated RR with a mean difference of 1.9 bpm compared to respiratory inductance plethysmography. |
| [25] | Single-lead ECG derived respiration (EDR) | Ten methods of computing single-lead ECG-derived RR (EDR) were compared under different operating conditions. | QRS sloped based method outperformed other ECG derived RR measurement methods. |
| [39] | Vision (RGB camera) | A phantom study was carried out in a laboratory environment simulating sleep monitoring. | The findings from the study can improve the understanding and applications of camera based respiration measurement. |
| [19] | Review | A discussion of developments in Wearable respiratory sensors. | There is a growing interest in wearable respiratory sensors and opportunities for innovations. |
Table 2.
List of mathematical symbols for calculations in section 3.2 and their meanings.
| Symbol | Meaning |
| Dt | Power dissipation coefficient for thermistor, (Watts) |
| It | Current through the potential divider, (Amp) |
| Pt | Power dissipation in thermistor, (Watts) |
| Ro | Resistance of thermistor at temperature To, (Ω) |
| Rs | Potentiometer series resistance, (Ω) |
| Rt | Resistance of thermistor at temperature T, (Ω) |
| T | Thermistor temperature, (K) |
| Ta | Ambient temperature, (K) |
| To | Base temperature for thermistor (usually 298 K) |
| V | Velocity of air stream (m/s) |
| Vs | Potentiometer supply voltage, (volts) |
| A | Temperature coefficient of thermistor resistance at temperature T (Ω/oC) |
| Thermistor constant | |
| ΔT | Thermistor rise in temperature above ambient, (oC) |
Table 3.
The attenuation factor in terms of time constant ().
| Thermistor type | Action | Time constant, seconds) | Attenuation (Vtf/Vto) at 1 Hz (equivant to 60 bpm) |
|---|---|---|---|
| Betacurve 3K3A1W2 | Power on | 20 | - |
| Flow 0 – 60 mm/s | 12.3 | 0.0129 | |
| Flow 60 – 0 mm/s | 18.2 | 0.0087 | |
| Micro-BetaCHIP type 10K3MCD1 | Power on | 5 | - |
| Flow 0 – 60 mm/s | 4 | 0.0398 | |
| Flow 60 – 0 mm/s | 5 | 0.0318 |
Table 4.
Measured values of Dt at various airflow rates.
| Velocity mm/s |
Vs (Volts) |
Ta (°C) |
Vt (Volts) |
It (mA) | Pt, =Vt×It(mW) | Rt =Vt / It (kΩ) |
Temperature (°C) (Data sheet) |
Dt (mW/K) | ∆Dt (mW/K) |
| 0.0 | 13 | 11.8 | 8.02 | 1.53 | 12.27 | 5.24 | 40.20 | 0.43 | 0.00 |
| 5.2 | 13 | 12.6 | 8.03 | 1.52 | 12.21 | 5.28 | 40.00 | 0.45 | 0.01 |
| 13.6 | 13 | 12.6 | 8.19 | 1.47 | 12.04 | 5.57 | 38.70 | 0.46 | 0.03 |
| 26.2 | 13 | 12.6 | 8.51 | 1.38 | 11.74 | 6.17 | 36.30 | 0.50 | 0.06 |
| 39.3 | 13 | 12.6 | 8.75 | 1.3 | 11.38 | 6.73 | 34.20 | 0.53 | 0.09 |
| 56.1 | 13 | 12.4 | 8.97 | 1.23 | 11.03 | 7.29 | 32.30 | 0.55 | 0.12 |
| 71.5 | 13 | 12 | 9.14 | 1.18 | 10.79 | 7.75 | 30.90 | 0.57 | 0.14 |
| 87.3 | 13 | 12 | 9.22 | 1.16 | 10.70 | 7.95 | 30.30 | 0.58 | 0.15 |
| 112.3 | 13 | 11.9 | 9.37 | 1.11 | 10.40 | 8.44 | 28.90 | 0.61 | 0.18 |
Table 5.
Mean and standard deviation of respiration rates determined by the three methods.
|
Respiration measurement method |
Mean respiration rate (bpm) | Standard deviation of respiration rate (bpm) |
| CPRM | 14.6 | 5.0 |
| Visual counting of chest movement | 13.1 | 4.8 |
| SOMNOtouch™ RESP | 14.0 | 5.5 |
Table 6.
Percentage difference between respiration rates measured by the three methods.
| Respiration measurement method | Percentage difference in means (bpm) | Percentage difference in standard deviations (bpm) |
| CPRM versus Visual | 11.0% | 3.4% |
| SOMNOtouch™ RESP versus Visual | 6.7% | 10.4% |
| CPRM versus SOMNOtouch™ RESP | 3.8% | -6.9% |
Table 7.
Correlation coefficients matrix for respiration rates obtained using the three methods.
| Respiration measurement method | CPRM | Visual | SOMNOtouch™ RESP |
| CPRM | 1.000 | 0.960 | 0.948 |
| Visual counting of chest movement | 0.960 | 1.000 | 0.994 |
| SOMNOtouch™ RESP | 0.948 | 0.994 | 1.000 |
Disclaimer/Publisher’s Note: The statements, opinions and data contained in all publications are solely those of the individual author(s) and contributor(s) and not of MDPI and/or the editor(s). MDPI and/or the editor(s) disclaim responsibility for any injury to people or property resulting from any ideas, methods, instructions or products referred to in the content. |
© 2025 by the authors. Licensee MDPI, Basel, Switzerland. This article is an open access article distributed under the terms and conditions of the Creative Commons Attribution (CC BY) license (http://creativecommons.org/licenses/by/4.0/).
Copyright: This open access article is published under a Creative Commons CC BY 4.0 license, which permit the free download, distribution, and reuse, provided that the author and preprint are cited in any reuse.


