
Submitted:
09 April 2025
Posted:
10 April 2025
You are already at the latest version
Preprints on COVID-19 and SARS-CoV-2
Abstract
Background: Tuberculosis and COVID-19 co-infection poses significant clinical challenges, with pulmonary TB (PTB) and extrapulmonary TB (extraPTB) potentially influencing disease progression and outcomes differently. This study aims to compare the clinical manifestations, inflammatory markers, and outcomes between PTB and extraPTB patients with SARS-CoV-2 co-infection. Methods: A retrospective, cross-sectional study was conducted on 55 hospitalized adults with TB-COVID-19 co-infection from March 2020 to March 2022. Patients were divided into PTB (n=32) and extraPTB (n=23) groups. Demographic, clinical, laboratory, and imaging data were collected and analyzed using statistical models, including ANCOVA, LASSO regression, and Random Forest classification, to identify key predictors of hospitalization duration and mortality. Results: PTB patients had significantly lower BMI, worse oxygenation status, and greater lung involvement on CT compared to extraPTB patients. CRP was elevated in PTB, while IL-6 levels were higher in extraPTB. Hospitalization duration was primarily influenced by inflammatory and coagulation markers (IL-6, D-dimer, neutrophil count, systemic inflammatory index), while higher BMI was associated with shorter stays. Mortality risk was strongly correlated with oxygenation impairment (worst SpO₂, SpO₂ at diagnosis), inflammatory burden (CRP, LDH), and CT severity score, rather than TB localization. Conclusions: TB localization did not independently affect hospitalization duration or mortality risk. Instead, severe lung involvement, systemic inflammation, and hypoxemia were the strongest predictors of poor outcomes. These findings emphasize the importance of early risk stratification based on respiratory and inflammatory markers to optimize patient management. Further research is needed to clarify the long-term impact of TB-COVID-19 co-infection, particularly in extraPTB cases.
Keywords:
COVID-19
; extrapulmonary tuberculosis
; pulmonary tuberculosis
; SARS-CoV-2
1. Introduction
Tuberculosis (TB) remains a major global health concern, with approximately a quarter of the population harboring latent Mycobacterium tuberculosis (MTB) infection [1,2]. While most cases are pulmonary (PTB), around 25% present as extrapulmonary TB (extraPTB), affecting various organs and posing diagnostic challenges due to its diverse manifestations and the need for invasive or advanced imaging techniques [3,4,5,6,7].
The COVID-19 pandemic has significantly impacted TB control efforts, disrupting screening, diagnosis, and treatment programs [8]. Since 2019, SARS-CoV-2 has caused widespread morbidity and mortality, with over 774 million cases and 7 million deaths reported by early 2024 [9]. Beyond its respiratory effects, COVID-19 affects multiple organ systems and has strained healthcare resources, leading to increased TB-related mortality for the first time in over a decade, as reported by the WHO [8,10].
Beyond these structural challenges, the interaction between TB and COVID-19 presents a complex pathophysiological interplay. Both diseases have the potential to exacerbate each other’s progression, as TB is known to compromise immune function, rendering individuals more vulnerable to severe SARS-CoV-2 infection [11,12]. COVID-19 can induce profound immune dysregulation, which may either trigger the reactivation of latent TB or accelerate the progression of active TB disease [13]. The inflammatory response associated with SARS-CoV-2, particularly the cytokine storm characterized by elevated levels of interleukin-6 (IL-6), tumor necrosis factor-alpha, and C-reactive protein (CRP), may disrupt granuloma formation, a key immunological mechanism that controls MTB infection [14,15]. Furthermore, immunosuppressive treatments commonly used for severe COVID-19, such as corticosteroids and biologic agents, may inadvertently increase the risk of TB reactivation or progression, further complicating clinical management [16].
Both PTB and COVID-19 exhibit similarities in airborne transmission, primary respiratory involvement, overlapping symptoms, and shared social determinants, such as poverty and overcrowding, which contribute to their widespread prevalence. Despite these parallels, their underlying pathophysiological mechanisms are distinctly different. Unlike PTB, which primarily compromises lung function and shares similar respiratory symptoms with COVID-19, extraPTB involves diverse organ systems, resulting in variable clinical presentations. ExtraPTB cases often lack the hallmark features of PTB, such as cough, hemoptysis, and night sweats, instead presenting with symptoms related to the specific organ involved, such as lymphadenopathy, joint pain, abdominal discomfort, or neurological deficits. These differences raise critical questions regarding the susceptibility of extraPTB patients to severe COVID-19 outcomes, the potential impact of co-infection on organ-specific immune responses, and whether extraPTB alters the course of COVID-19 compared to PTB [4,6].
Given these uncertainties, there is a pressing need for targeted research to better understand the clinical and paraclinical dynamics of TB/COVID-19 co-infection, particularly in differentiating the impact of SARS-CoV-2 infection on PTB versus extraPTB. Our previous work has focused on analyzing differences between SARS-CoV-2 infection alone versus SARS-CoV-2-PTB and extraPTB co-infection, respectively [17,18]. Building on our prior work, this study aims to provide a comparative analysis of SARS-CoV-2 infection in patients with PTB versus those with extraPTB. By systematically assessing differences in clinical presentation, biomarkers, imagistic findings, and disease outcomes, we seek to elucidate whether one type of TB confers a different risk profile for severe COVID-19 or alters the inflammatory and immune response compared to the other. This comparative approach will enhance our understanding of the complex interplay between TB and COVID-19 and may contribute to refining diagnostic algorithms, optimizing treatment strategies, and improving clinical management for co-infected patients.
2. Materials and Methods
2.1. Study Design
This retrospective, cross-sectional, randomized study included 55 adult patients, aged 19-91 years, who were hospitalized and managed at the Victor Babeș Hospital of Infectious Diseases and Pneumoftiziology in Timișoara. Data collection was conducted between March 2020 and March 2022, during the COVID-19 pandemic.
The study compared two distinct groups of patients:
- Group 1: Patients diagnosed with pulmonary tuberculosis (PTB) and SARS-CoV-2 coinfection (n=32)
- Group 2: Patients diagnosed with extrapulmonary tuberculosis (extraPTB) and SARS-CoV-2 coinfection (n=23)
The primary objective of this study was to analyze and compare differences in COVID-19 manifestations between these two groups.
2.2. Inclusion Criteria
Patients who met the following criteria were included in the study:
- ✓
- Confirmed PTB or extraPTB diagnosis within one month prior to SARS-CoV-2 infection, verified through solid or liquid cultures or GeneXpert test at the TB ambulatory service in Timișoara [19].
- ✓
- SARS-CoV-2 infection confirmed by RT-PCR from nasopharyngeal swabs at an accredited laboratory [20]. Moderate or severe SARS-CoV-2 infection at hospital admission. A moderate case was defined by clinical signs of lower respiratory disease and SpO₂ ≥ 94% on room air, while severe cases presented SpO₂ < 94%, a respiratory rate > 30 breaths/min, or lung infiltrates > 50% [20].
- ✓
- Normal renal function (diureseis, eGFR, creatinine, and urea within normal limits) [21].
- ✓
- History of BCG vaccination [22].
2.3. Exclusion Criteria
Patients were excluded if they met any of the following criteria:
× Diagnosed with both pulmonary and extrapulmonary tuberculosis simultaneously.
× Presence of overweight (BMI 25–30 kg/m²) or obesity (BMI ≥ 30 kg/m²) [23].
× Pre-existing severe or uncontrolled arterial hypertension [24].
× Diagnosed with chronic heart failure, neoplasms, or other chronic pulmonary, hepatic, renal, or digestive diseases, HIV infection, primary or secondary immunodeficiency [25,26,27].
Exclusion criteria were applied to minimize confounding effects on inflammatory markers and COVID-19 severity, ensuring a clearer analysis of clinical differences between PTB and extraPTB patients.
2.4. Ethical Considerations
This study was approved by the Ethics Council for Scientific Research at the Victor Babeș University of Medicine and Pharmacy Timișoara, in accordance with the Helsinki Declaration (04/19 January 2021). Written informed consent was obtained from all participants before data collection.
2.5. Data Collection
Medical records were reviewed to extract anamnestic, clinical, laboratory, and imaging data.
Medical history included:
- BCG vaccination status.
- Comorbidities (COPD, T2DM).
- Smoking status (never smoked/smoker).
- History of previous TB treatment and cure status.
Clinical parameters recorded:
- Body Mass Index, calculated as weight (kg) / height² (m²) [28].
- SpO₂ (%) at SARS-CoV-2 diagnosis and lowest recorded value during hospitalization [29].
- Peripheral systolic and diastolic blood pressure (SBP, DBP, mmHg) at diagnosis
- COVID-19 symptoms, including fever, cough, dyspnea, fatigue, abdominal pain, chest pain, myalgia, vomiting, diarrhea, headache, and anosmia/ageusia. Symptoms were classified as severe if associated with tachypnea (respiratory rate ≥ 30 breaths/min) [30].
- C-reactive protein (CRP, mg/L)
- Procalcitonin (PCT, ng/mL)
- Aspartate aminotransferase (AST, U/L) and alanine aminotransferase (ALT, U/L)
- Lactate dehydrogenase (LDH, U/L)
- Interleukin-6 (IL-6, pg/mL)
- D-dimer levels (mg/L)
- Neutrophil, lymphocyte, and platelet counts (/µL)
- CT scan interpretation: an experienced radiologist (≥10 years of experience) analyzed chest CT scans at the time of SARS-CoV-2 infection confirmation. Lung involvement was assessed using a semi-quantitative CT severity score (0–25 points), based on the extent of ground-glass opacifications, consolidations, crazy paving patterns, and other abnormalities [34,35,36,37].
Outcome Measures
- Hospitalization duration (days)
- Symptoms severity
- Resolution (PCR-negative discharge) or mortality
2.6. Statistical Analysis
Data were collected using Microsoft Excel and analyzed with DATAtab: Online Statistics Calculator (DATAtab e.U., Graz, Austria). Normality was assessed with the Shapiro–Wilk test. A significance threshold of p=0.05 was set, and due to the small study groups, interpretation was based on the Exact p value. For group comparisons, Mann–Whitney tests were used for non-normally distributed variables, while t-tests were applied for normally distributed variables. Spearman correlation analysis was performed to examine relationships between parameters. AUC-ROC analysis assessed the ability of clinical and laboratory parameters to distinguish between PTB and extraPTB in COVID-19 patients. Logistic regression models were used to identify independent predictors of disease severity and outcomes. Fisher’s exact test evaluated associations between categorical variables. Multicollinearity was checked using Variance Inflation Factors (VIFs), with VIF <5 considered acceptable. When VIF ≥5, a one-way analysis of covariance (ANCOVA) and LASSO regression were applied to mitigate multicollinearity, allowing for the selection of the most relevant predictors of hospitalization duration. LASSO regression penalized less significant variables by reducing their coefficients to zero. A Random Forest classification analysis identified key predictors of fatality. Due to class imbalance, the model was trained with balanced class weights to account for the rarity of fatal cases. While it demonstrated high accuracy in identifying recovered patients, it misclassified one fatal case, highlighting the difficulty of predicting rare events.
2.7. Study Limitations
- The retrospective, cross-sectional design limits causal inference.
- The small sample size may impact the statistical power of subgroup analyses
- The exclusion of patients with obesity and chronic diseases may reduce generalizability but ensures a focused comparison of COVID-19 manifestations in PTB vs. extraPTB.
3. Results
This study included 55 patients with TB - SARS-CoV-2 co-infection, divided in two study groups according to the nature of TB infection: 32 patients with PTB and 23 patients with extraPTB.
Male patients showed a predominance, with 65% of the cases in the PTB group and 56.5% of cases in the extraPTB group. Regarding age, a higher proportion of young individuals (65% under 40 years old) was noted in the extraPTB group, while 93.8% were over 40 yeard old in the PTB group. Thus, the mean age was significantly higher in the PTB group (62.8 years, SD=12.820 versus the extraPTB group (40.1 years, SD=18.6), p<0.001 (t-Test). See Table 1.
The comparison revealed significant differences between the two groups in most of the analyzed parameters.
The PTB-SARS-CoV-2 group revealed worse parameters than the extraPTB group as follows:
- a significantly lower BMI;
- a significantly lower SpO2 both at diagnosis, and with regard the lowest value registered, and a significantly higher chest CT involvement median score than the extraPTB group, revealing a clear higher pulmonary involvement;
- significantly higher SBP and DBP median values.
With regard to inflammation markers, the data shows a higher CRP in the PTB group and a higher IL-6 in the extraPTB group. Procalcitonin did not show significant differences between groups, p=0.09 (Fisher’s Exact test). While both groups exhibited lymphopenia, the extraPTB group displayed significantly lower values. In addition, the PTB group also presented neutropenia. While NLR and PLR were significantly higher in the extraPTB group, SII was significantly higher in the PTB group. No differences were detected between transaminase, LDH and d-dimer levels. See Table 2.
No significant differences were detected between the two groups with regard to sex, smoking habits, comorbidities such as COPD and T2DM, the severity of symptoms and outcome (Table 3).
A Random Forest classification analysis was conducted to identify key predictors of symptom severity (mild or severe) among the two groups (Table 4). The model achieved perfect classification, correctly identifying all mild and severe cases, suggesting strong predictive capability (Table 5). The feature importance analysis revealed that oxygenation status was the strongest determinant of symptom severity. Lowest SpO₂ (importance=0.19) was the most influential predictor, followed by SpO₂ at diagnosis (importance=0.15), highlighting the critical role of hypoxemia in determining symptom severity. Additionally, age (importance=0.08) and CT involvement score (importance=0.07) were strong contributors, reinforcing that older patients with greater lung involvement were more likely to experience severe symptoms. Lymphocyte count (importance=0.06) also emerged as an important factor, potentially reflecting the immune response’s role in disease severity.
Spearman correlation analysis identified several significant associations among TB type, inflammatory markers, oxygenation parameters, and clinical outcomes. TB type was negatively correlated with mortality (ρ = -0.28, p=0.04), indicating that patients with extraPTB had a lower risk of death compared to those with PTB. Additionally, TB type showed a strong negative correlation with prior TB episodes (ρ = -0.90, p < 0.001), suggesting that PTB cases were more frequently associated with tuberculosis reactivation. PTB patients had significantly longer hospital stays compared to extraPTB patients (ρ = 0.73, p < 0.001) and exhibited lower oxygen saturation at diagnosis (ρ = 0.53, p < 0.001) as well as worse oxygenation throughout their illness (ρ = 0.48, p < 0.001), suggesting more severe respiratory impairment in PTB cases. CT involvement scores were also significantly higher in PTB patients (ρ = -0.77, p < 0.001), reflecting greater pulmonary damage. Additionally, inflammatory markers such as NLR (ρ = 0.66, p < 0.001) and SII (ρ= 0.66, p < 0.001) were strongly associated with PTB, suggesting a heightened inflammatory response. PCT positivity was correlated with increased mortality risk (ρ = 0.31, p = 0.02), while D-dimer levels showed a significant association with prolonged hospitalization (ρ = 0.28, p = 0.04). These findings underscore the distinct clinical trajectories of PTB and extraPTB in SARS-CoV-2 co-infection, with PTB patients exhibiting more severe disease manifestations, greater inflammation, and poorer respiratory function. See Table 6.
The AUC-ROC analysis evaluated the ability of multiple clinical and laboratory parameters to distinguish extraPTB from PTB cases (Table 7). Among the evaluated markers, neutrophil count emerged as the most effective discriminator, with an optimal cutoff of 3300 cells/µL, yielding 100% sensitivity and 96.88% specificity. Additionally, inflammatory markers such as NLR (AUC=0.89), SII (AUC=0.88), and PLR (AUC=0.71) showed strong predictive value, achieving high sensitivity while maintaining moderate specificity (Figure 1). SpO2 at diagnosis also demonstrated a high discriminatory power (AUC=0.81), while the lowest SpO2 registred showed strong predictive ability (AUC=0.78), achieving a high sensitivity, but a lower specificity. Hospitalization duration also demonstrated strong discriminatory ability (AUC=0.93), with an optimal cutoff of 20 days, yielding 95.65% sensitivity and 84.38% specificity (Figure 2). This suggests that longer hospital stays are strongly associated with extraPTB cases, distinguishing them from PTB cases with high accuracy. Several markers, including the status of associating COPD and type 2 DM, prior TB history, the presence of severe symptoms, CRP, procalcitonin, CT involvement score, and TB outcome, exhibited 0% sensitivity, meaning that no extraPTB cases were correctly identified based on the chosen cutoff. This suggests that either these markers lack discriminatory power for distinguishing extraPTB or that the selected cutoffs (determined by Youden’s Index) are too restrictive. In the case of CT involvement score, PTB cases consistently showed higher values, which may have biased the optimal threshold toward excluding extraPTB cases. Similarly, markers such as COPD and PCT levels may not have sufficient variation between the two groups to serve as reliable classifiers.
The ANCOVA was conducted to assess the effect of TB type (PTB vs. extraPTB) on hospitalization duration while adjusting for multiple clinical and laboratory parameters. The overall model was statistically significant (F=12.71, p<0.001), explaining approximately 85.4% of the variance in hospitalization duration (adjusted R²=0.787). However, TB type did not significantly influence hospitalization duration (F=1.17, p=0.287), suggesting that PTB and extraPTB patients exhibited similar hospitalization times when controlling for other factors. Among the covariates, a higher BMI was associated with shorter hospitalization (F=9.1, p=0.005), whereas inflammatory and coagulation markers were significant predictors of prolonged hospitalization. Increased levels of IL-6 (F=5.21, p=0.02), D-dimer (F=8.02, p=0.007), neutrophil count (F=15.22, p<0.001), and SII (F=4.83, p=0.034) were all strongly associated with extended hospital stays. Additionally, CT involvement score and CRP levels approached statistical significance, suggesting a potential role in hospitalization duration (Table 8).
After performing the ANCOVA, a LASSO regression analysis was performed to identify the most influential predictors of hospitalization duration while addressing multicollinearity. The final model retained five key predictors, while other variables were eliminated due to minimal contribution. The most influential predictor was neutrophil count (β=6.53), indicating that higher neutrophil levels were strongly associated with prolonged hospitalization. TB type remained in the model (β=4.71), suggesting a potential, though moderate, association with hospitalization length. IL-6 levels (β=4.04) were also retained, reinforcing the role of systemic inflammation in prolonged hospital stays. In contrast, platelet count (β=-3.69) and BMI (β =-2.60) were negatively associated with hospitalization duration, suggesting that higher platelet levels and increased BMI were linked to shorter hospital stays. All other variables, including SpO₂ levels, CRP, D-dimer, and CT involvement score, were removed from the model, indicating that they had little independent predictive value after adjusting for stronger correlates (Table 9).
Out of the 55 subjects, a number of 7 in the PTB group (all men) and 1 (a woman) in the extraPTB group had fatal outcomes (14.5% from all subjects). Five of these subjects were smokers, six also had T2DM, and 3, COPD. All subjects presented severe symptoms at presentation and positive procalcitonin. Table 10 shows the median values of the paraclinical parameters in these subjects.
Regarding the predictors of fatality, a penalized logistic regression was performed as an approximation of Firth’s logistic regression to identify predictors of fatal outcomes among the two groups. Given the small number of fatal cases (8 cases), a regularized approach was applied to stabilize coefficient estimates. The results indicate that a younger age (OR=0.58, 95% CI: 0.44–0.75) and a higher value of the lowest SpO₂ registered (OR=0.57, 95% CI: 0.44–0.74) are the strongest predictors of lower fatality risk. However, initial SpO₂ at diagnosis (OR=1.23, 95% CI: 0.95–1.60) showed a positive association with fatality, meaning that patients with relatively higher initial oxygen levels may have still experienced worsening conditions leading to mortality. This could indicate delayed deterioration in severe TB-COVID cases. TB Type was not a significant predictor of fatality (OR=0.99, 95% CI: 0.76–1.28). BMI (OR=0.94, 95% CI: 0.73–1.23) also did not show a significant effect. See Table 11.
In order to further explore predictors of fatal outcome, a Random Forest classification analysis was performed (Table 12). The classification model achieved high accuracy in identifying healed cases but misclassified one fatal case, reflecting the challenge of predicting rare events (Table 13). The feature importance analysis showed that CT involvement score was the most influential predictor of mortality (importance=0.22), suggesting that greater lung involvement significantly increases the risk of death. Oxygenation status was also a major determinant of fatal outcomes, with lowest SpO₂ (importance=0.13) ranking as the second most important predictor, followed by SpO₂ at diagnosis (importance=0.09). This highlights severe hypoxemia and respiratory failure as key contributors to mortality. In addition, systemic inflammation and tissue damage were strong predictors of fatality, as indicated by CRP (importance=0.08) and LDH (importance=0.06). Notably, TB type was not among the top-ranked predictors of fatality, further supporting the finding that mortality risk was driven more by disease severity and systemic inflammation rather than TB localization.
4. Discussion
SARS-CoV-2 and tuberculosis co-infection presents intricate clinical challenges, particularly when differentiating between pulmonary TB and extrapulmonary TB. Our study, involving 55 subjects, unveiled significant distinctions between these two groups, focusing on the differences in clinical presentation, biomarkers, imagistic findings, and disease outcomes. Despite the small samples, this analysis is pertinent in expanding knowledge on the subject. This study is built on our previous work [17,18] regarding the analysis of the manifestations of SARS-CoV-2 infection alone versus SARS-CoV2 - PTB and extraPTB co-infection respectively. To our knowledge, there are no other publications comparing the two categories of co-infection and especially with regard to extraPTB and COVID-19 co-infection, there is a significant research gap.
- Demographic characteristics
In our cohort, males predominated in both PTB (65%) and extraPTB (56.5%) groups. Globally, tuberculosis affects significantly more men than women. A meta-analysis of 29 surveys across 14 countries confirmed a consistent male bias in both notification and prevalence rates [38]. Higher TB rates and more severe disease in men result from a combination of healthcare access, biological, and behavioral factors. Some studies suggest gender-based disparities in healthcare access [39], but research from Mexico and South India indicates that women seek medical care more frequently than men [40,41]. Men often delay seeking care, as symptoms like coughing may be attributed to tobacco use, leading to longer symptomatic periods before diagnosis and more severe disease at presentation. Biologically, TB progression rates vary by sex and age, with women of reproductive age at higher risk of progression, while men experience increased susceptibility as they age [42,43]. Additionally, co-morbidities such as HIV, diabetes, and cirrhosis—more prevalent in men—can accelerate TB progression [44,45,46]. Men are also more exposed to high-risk environments, including prisons, shelters, and poorly ventilated workplaces [47,48,49], and outbreaks have been linked to clandestine bars with predominantly male customers [50]. Furthermore, alcohol and tobacco use, more common among men, contribute to faster TB progression and worse treatment outcomes, even after adjusting for alcohol consumption [51,52]. These factors highlight the need for targeted public health interventions focused on early detection and prevention strategies for high-risk male populations.
Epidemiological data on sex differences in extraPTB remain inconclusive. Epidemiological data on sex differences in extraPTB remain inconsistent. A study in Mali analyzing 1,012 confirmed cases reported a male-to-female ratio of 1.59:1, with men more likely to develop pleural TB and women having higher odds of lymph node and abdominal TB [53]. In contrast, studies from Korea and Madrid found a greater prevalence of extraPTB among women, particularly those aged 40–60 [54,55].
Age is another critical risk factor for TB [56] and severe COVID-19 [57]. In our study, differences were significant between the two groups, with PTB subjects presenting a higher mean age (62.8 years) compared to the extraPTB subjects (40.1 years). The Random Forest classification identified older age as an important predictor of severe symptoms. Moreover, Firth’s logistic regression showed that younger age is a predictor of lower fatality risk (OR=0.58). Several studies have highlighted that older individuals are at a significantly higher risk of severe disease and mortality. A study involving 89 co-infected adults found a mean age of 45.14 years, with 75.3% being male [58], while a Ugandan study described 11 cases with a mean age of 46.9 years [59]. However, increasing age has been consistently associated with worsening outcomes. In a U.S. cohort of 333 patients with COVID-19 and TB co-infection, mortality risk increased significantly with age; individuals aged 45–64 had an adjusted prevalence ratio (aPR) of 5.6, those aged 65–74 had an aPR of 8.6, while those over 85 exhibited a strikingly high aPR of 25 [60]. Another study of 153 hospitalized co-infected patients reported that individuals aged 65 and above had a significantly higher likelihood of severe disease, with an OR of 9.55 [61]. These findings suggest that older individuals not only experience more severe disease progression but also have increased mortality risks, emphasizing the need for enhanced monitoring, early intervention, and targeted therapeutic strategies in this demographic.
Younger individuals are more predisposed to developing extraTB due to their relatively stronger immune responses, whereas older adults are more susceptible to PTB [62]. Young adults with robust cell-mediated immunity are more likely to confine the infection to specific extrapulmonary sites, resulting in localized manifestations such as lymph node, pleural, or bone TB. In contrast, although elderly individuals may experience more disseminated forms of TB, their overall likelihood of developing extraPTB is lower compared to younger populations [63]. As a result, pulmonary TB is more frequently observed in older individuals, often due to the reactivation of latent infections, whereas extraPTB is more common among younger adults, particularly in regions with a high TB burden [64]. This pattern could also explain the observed age disparity between groups in our study.
- Key findings regarding clinical and inflammatory parameters
In our analysis, patients with PTB-COVID-19 co-infection exhibited a significantly lower BMI than those with extraPTB. A higher BMI (yet still a normal BMI) was linked to shorter hospital stays. A low BMI is a well-established risk factor for adverse TB outcomes, affecting both PTB and extraPTB subjects. Malnutrition and low BMI have been linked to impaired immune function, increasing susceptibility to MTB infection and disease progression in both forms of TB [65,66,67,68]. Studies have shown that underweight individuals with TB, regardless of disease localization, have higher bacterial loads, delayed sputum culture conversion (in PTB), and poorer treatment outcomes, including increased mortality rates [69]. The immunosuppressive effects of malnutrition may exacerbate systemic inflammation and hinder granuloma formation, weakening the body's ability to contain both pulmonary and extrapulmonary TB infections. Additionally, patients with low BMI frequently experience prolonged hospitalization and higher relapse rates after treatment completion [69]. In extraPTB, malnutrition can contribute to more extensive disseminated disease, lymphatic involvement, and increased risk of central nervous system TB, including tuberculous meningitis, which carries a high fatality rate [69,70]. Given these findings, nutritional interventions should be considered a critical component of TB management, particularly in underweight patients with PTB or extraPTB, to improve treatment efficacy and overall prognosis [69,70]. In contrast, COVID-19 severity is more frequently observed in individuals with overweight or obesity [71,72]. However, frailty, a condition commonly seen in TB patients, is also a significant risk factor for increased mortality and prolonged hospitalization among those with COVID-19 [73]. Frailty is linked to both ends of the BMI spectrum, affecting both underweight individuals [74] and those with severe obesity [75]. Maintaining a healthy BMI is linked to improved outcomes in both acute and chronic diseases [74].
PTB-COVID-19 co-infection manifested in reduced oxygen saturation, and higher chest CT involvement scores, indicating greater pulmonary compromise in comparison to extraPTB-COVID-19. The differences in pulmonary manifestations between the two groups were so significant that even the AUC-ROC analysis revealed that a high SpO2 levels at diagnosis and a higher value of the lowest value registered represent the strongest predictors of extraPTB, while traditional inflammatory and radiological markers showed limited ability to differentiate between TB subtypes in the context of SARS-CoV-2 co-infection. PTB and COVID-19 co-infection presents a significant challenge due to overlapping inflammatory pathways. PTB primarily relies on a Th1-mediated immune response, with IFN-γ and TNF-α playing essential roles in bacterial containment [76]. However, SARS-CoV-2 infection disrupts immune homeostasis, leading to lymphopenia and reduced CD4+ T-cell responses, which can impair MTB control and increase the risk of reactivation [77]. In severe COVID-19 cases, the cytokine storm, marked by increased IL-6, TNF-α, and IFN-γ expression, exacerbates lung inflammation and worsens TB disease, heightening the risk of acute respiratory distress syndrome and respiratory failure, often necessitating intensive care and mechanical ventilation [78]. In contrast, extraPTB is characterized by a stronger regulatory T-cell response, which may help limit pulmonary damage but allows persistent MTB infection. Unlike PTB, extraPTB-COVID-19 is less likely to cause severe pulmonary complications, though it may lead to increased systemic inflammation due to IL-10 and IL-4 upregulation [79,80]. While patients with extraPTB generally have preserved lung function, those with TB meningitis or disseminated TB face significantly higher mortality rates [70].
A Random Forest classification analysis was conducted to identify key predictors of symptom severity (moderate or severe) among the two groups. The feature importance analysis revealed that oxygenation status was the strongest determinant of symptom severity: the lowest SpO₂ registered was the most influential predictor, followed by SpO₂ at diagnosis, highlighting the critical role of hypoxemia in determining symptom severity. Additionally, older age, a higher CT involvement score and a low lymphocyte count were also strong contributors. These results reinforce the knowledge that older patients with greater lung involvement were more likely to experience severe symptoms.
Inflammatory markers differed between groups: CRP levels were higher in PTB-SARS-CoV-2 patients, while IL-6 levels were elevated in extraPTB patients. Both groups experienced lymphopenia, but it was more pronounced in the extraPTB group. These findings align with existing research highlighting the role of inflammatory markers in assessing TB severity and monitoring treatment response [61].
Our previous study [18] demonstrated that while individuals with extraPTB-SARS-CoV-2 co-infection may exhibit milder respiratory symptoms, they remain at risk for severe systemic inflammation, necessitating close monitoring. Notably, elevated levels of PCT and IL-6 have been recognized as key indicators of severe COVID-19 outcomes, highlighting the need for further investigation into their significance in co-infected patients. Several biomarkers associated with COVID-19 progression and the onset of acute respiratory distress syndrome include elevated LDH, CR, IL-6, D-dimer levels, lymphocyte and platelet counts, renal function markers, and high-sensitivity troponin. In addition, critically ill patients frequently exhibit marked lymphopenia and neutrophilia, contributing to an increased neutrophil-to-lymphocyte ratio [81].
These findings confirm that worsening oxygenation, greater lung involvement, and systemic immune response are the primary drivers of severe symptoms in TB-COVID-19 patients. These insights may aid in early risk stratification and targeted interventions for high-risk individuals.
- Hospitalizationand Mortality
Hospitalization duration in TB-COVID-19 co-infected patients was primarily influenced by inflammatory markers rather than the type of TB (PTB vs. extraPTB), which did not show a significant effect on hospital stay length. Higher levels of IL-6, D-dimer, neutrophil count, and systemic inflammatory index were significantly associated with prolonged hospitalization, while a higher BMI was linked to shorter hospital stays. These findings are in line with other research regarding disease severity and mortality risk [82]. The LASSO regression analysis further confirmed that neutrophil-driven inflammation and systemic IL-6 activation were dominant predictors of hospitalization outcomes, while the potential protective role of higher BMI warrants further investigation, possibly due to differences in metabolic reserves or immune responses.
Mortality risk in TB-COVID-19 patients was most strongly associated with lung involvement, oxygenation status, and systemic inflammation, rather than TB localization. A proportion of 14.5% of subjects had a fatal outcome (12.7% with PTB and 1.8% with extraPTB). CT involvement score emerged as the most critical predictor of fatality, highlighting the significant impact of lung damage on patient outcomes. Oxygenation parameters, including SpO₂ at diagnosis and lowest SpO₂, were the next most influential factors, reinforcing the role of hypoxemia and respiratory failure in driving mortality risk. Additionally, CRP and LDH were key markers of disease severity, emphasizing the role of inflammatory and tissue damage pathways in TB-COVID-19 co-infection.
A Random Forest classification analysis suggested that PTB cases were more likely to be fatal compared to extraPTB, potentially due to higher pulmonary involvement. However, Firth’s logistic regression found no statistically significant association between TB type and mortality risk, indicating that the increased fatality in PTB cases may reflect disease severity rather than TB localization alone. Despite methodological differences between these models, both consistently identified oxygenation impairment (lowest SpO₂), inflammation (CRP, LDH), and lung involvement (CT score) as the primary predictors of mortality. These findings underscore the need for early identification of high-risk patients based on respiratory parameters and systemic inflammation, rather than TB localization, to optimize treatment strategies and improve survival outcomes.
An important publication by the TB/COVID-19 Global Study Group places mortality of the studied patients with TB and COVID-19 at a prevalence of 11.1%. It is important to mention that the study cites different causes of death: 49.4% died from severe COVID-19, 36.5% from COVID-19 and TB co-infection, and 1.2% died from TB only. Among the patients who died for other reasons, 5.9% died with COVID-19 (multiple comorbidities, cancer, sarcoidosis, and HIV), and the remaining 7% died after the resolution of COVID-19 (sepsis, multiple comorbidities, pneumonia, pulmonary thromboembolism) [83]. A meta-analysis places mortality rates by PTB/COVID-19 co-infection between 7.6% and 23.6%, depending on severity [63]. In extraPTB-COVID-19, prognosis depends on organ involvement, with TB meningitis carrying the highest fatality risk [84].
- Implications for Clinical Practice
The distinct clinical trajectories observed between PTB and extraPTB patients co-infected with SARS-CoV-2 underscore the need for tailored clinical management strategies [85]. Enhanced monitoring and early intervention may be particularly crucial for PTB patients, given their higher risk of severe disease and mortality. The pronounced lymphopenia observed in extraPTB patients suggests a need for vigilant monitoring of immune status and potential adjustments in immunomodulatory therapies. Patients in need of long-term rehabilitation after disease resolution could benefit from pulmonary rehabilitation alone and in combination with progressive muscular relaxation for improving physical function, mental health, and sleep quality [86].
- Study Limitations and Future Directions
While our study provides valuable insights, it is limited by its small sample size and single-center design, which may affect the generalizability of the findings. Future multicenter studies with larger cohorts are warranted to validate these observations and further elucidate the complex interplay between PTB, extraPTB, and COVID-19.
5. Conclusions
Our study highlights the complex interplay between tuberculosis and COVID-19 co-infection, with distinct differences in clinical presentation, inflammatory responses, and disease outcomes between pulmonary TB and extrapulmonary TB cases. While extraPTB patients exhibited less severe respiratory involvement, they remained at risk for systemic inflammation.
Key predictors of hospitalization and mortality were identified, demonstrating that TB localization did not independently affect hospital stay length or fatality risk. Instead, oxygenation impairment (lowest SpO₂, SpO₂ at diagnosis), inflammatory markers (CRP, LDH, IL-6), and lung involvement (CT score) emerged as the dominant determinants of severe outcomes. The analysis consistently pointed to neutrophil-driven inflammation and systemic IL-6 activation as key contributors to hospitalization duration, while higher BMI was associated with shorter hospital stays, potentially due to metabolic reserves or immune response differences.
Mortality risk was most strongly correlated with hypoxemia and extensive pulmonary involvement, rather than TB type. Despite differences between machine learning models, both consistently identified severe lung involvement and inflammatory burden as the primary drivers of fatality.
These findings reinforce the need for early risk stratification based on oxygenation status, inflammatory markers, and CT involvement scores, rather than TB localization alone. Targeted interventions, including nutritional support for underweight patients, aggressive management of systemic inflammation, and enhanced monitoring of oxygenation parameters, are critical in improving outcomes for co-infected individuals. Future research should focus on the long-term implications of TB-COVID-19 co-infection, especially in extraPTB cases, where existing data remains scarce.
In conclusion, our study highlights significant differences between PTB and extraPTB patients co-infected with SARS-CoV-2. Recognizing these distinctions is vital for optimizing patient management and improving prognostic assessments in this unique patient population
Author Contributions
Conceptualization, C.O. and C.M.; methodology, C.O., C.M. and A.S.; software, M.S.M.; validation, C.O., A.S.; formal analysis, C.M., A.S., M.S.M.; investigation, C.M. and A.S.; resources, A.S. and C.O.; data curation, M.S.M., P.H., E.T.; writing—original draft preparation, C.M; writing—review and editing, A.S. and C.O.; visualization, P.H., E.T; supervision, C.O.; project administration, A.S. and C.O. All authors have read and agreed to the published version of the manuscript.
Funding
We would like to acknowledge VICTOR BABES UNIVERSITY OF MEDICINE AND PHARMACY TIMISOARA for their support in covering the costs of publication for this research paper.
Institutional Review Board Statement
The study was carried out in compliance with the Declaration of Helsinki and received approval from the Ethics Council for Scientific Research at Victor Babeș University of Medicine and Pharmacy, Timișoara (Approval No. 04/19.01.2021).
Informed Consent Statement
Informed consent was obtained from all participants in order to perform the study and written consent was obtained from all participants for the publication of this paper.
Data Availability Statement
The findings of this study are based on data that can be made available upon request from the corresponding author, though ethical restrictions prevent public disclosure.
Acknowledgments
We sincerely thank all the patients who participated in this study. Additionally, we acknowledge the valuable contributions of each author and the support from our affiliated institutions, which played a crucial role in conducting this research and facilitating its publication.
Conflicts of Interest
The authors declare no conflicts of interest.
Abbreviations
| ALT | Alanine aminotransferase |
| ANCOVA | one-way analysis of covariance |
| Apr | adjusted prevalence ratio |
| AST | Aspartate aminotransferase |
| AUC | Area under the receiver operating characteristic curve |
| BMI | Body mass index |
| COPD | Chronic Obstructive Pulmonary Disease |
| COVID-19 | Coronavirus Disease 2019 |
| CRP | C-reactive protein |
| CT | Computer tomography |
| DM | Diabetes Mellitus |
| extraPTB | Extrapulmonary tuberculosis |
| HIV | Human Deficiency Virus |
| IL-6 | Interleukin 6 |
| LASSO regression | Least Absolute Shrinkage and Selection Operator regression |
| LDH | Lactate Dehydrogenase |
| n | number of subjects |
| MTB | Mycobacterium tuberculosis |
| OR | odds ratio |
| p | p-value |
| PCT | Procalcitonin |
| PTB | pulmonary tuberculosis |
| ROC | Receiver operating characteristic |
| RT-PCR | Reverse Transcription Polymerase Chain Reaction |
| SpO2 | Saturation of peripheral oxygen |
| SARS-CoV-2 | Severe Acute Respiratory Syndrome Coronavirus 2 |
| TB | Tuberculosis |
| WHO | World Health Organization |
References
- World Health Organization. Global Tuberculosis Report 2024; World Health Organization: Geneva, Switzerland. Available online: https://www.who.int/teams/global-tuberculosis-programme/tb-reports/global-tuberculosis-report-2024 (accessed on 29 October 2024).
- Houben, R.M.G.J.; Dodd, P.J. The Global Burden of Latent Tuberculosis Infection: A Re-estimation Using Mathematical Modelling. Eur. Respir. J. 2016, 48, 889–900. [Google Scholar] [CrossRef]
- Ramírez-Lapausa, M.; Menéndez-Saldaña, A.; Noguerado-Asensio, A. Extrapulmonary Tuberculosis: An Overview. Rev. Esp. Sanid. Penit. 2015, 17, 3–11. [Google Scholar] [CrossRef] [PubMed]
- Ruiz-Bastián, M.; Díaz-Pollán, B.; Falces-Romero, I.; Toro-Rueda, C.; García-Rodríguez, J.; SARS-CoV-2 Working Group. Impact on Tuberculosis Diagnosis during the COVID-19 Pandemic in a Tertiary Care Hospital. Enferm. Infecc. Microbiol. Clin. 2024, 42, 135–139.
- Lee, J.Y. Diagnosis and Treatment of Extrapulmonary Tuberculosis. Tuberc. Respir. Dis. 2015, 78, 47–55. [Google Scholar] [CrossRef]
- Rodriguez-Takeuchi, S.Y.; Renjifo, M.E.; Medina, F.J. Extrapulmonary Tuberculosis: Pathophysiology and Imaging Findings. Radiographics 2019, 39, 2023–2037. [Google Scholar] [CrossRef]
- Jeong-Han, K.; Eu-Suk, K.; Kang-Il, J. Delayed Diagnosis of Extrapulmonary Tuberculosis Presenting as Fever of Unknown Origin in an Intermediate-Burden Country. BMC Infect. Dis. 2018, 18, 426. [Google Scholar] [CrossRef]
- World Health Organization. Global Tuberculosis Report 2023; World Health Organization: Geneva, Switzerland. Available online: https://www.who.int/teams/global-tuberculosis-programme/tb-reports/global-tuberculosis-report-2023 (accessed on 29 October 2024).
- World Health Organization. COVID-19 Epidemiological Update—15 March 2024; World Health Organization: Geneva, Switzerland, 2024. Available online: https://www.who.int/publications/m/item/covid-19-epidemiological-update-15-march-2024 (accessed on 29 October 2024).
- Lopes-Pacheco, M.; Leme Silva, P.; Ferreira Cruz, F. Pathogenesis of Multiple Organ Injury in COVID-19 and Potential Therapeutic Strategies. Front. Physiol. 2021, 12, 593223. [Google Scholar] [CrossRef]
- Petro, B.; Katalin, A.W.; Dylan, S. Immune Interaction between SARS-CoV-2 and Mycobacterium tuberculosis. Front. Immunol. 2023, 14, 1254206. [Google Scholar]
- Lerner, T.R.; Borel, S.; Gutierrez, M.G. The Innate Immune Response in Human Tuberculosis. Cell Microbiol. 2015, 17, 1277–1285. [Google Scholar] [CrossRef]
- Pozdnyakov, A.; Jin, A.; Bader, M. Reactivation of Pulmonary Tuberculosis in a Patient with COVID-19. Case Report and Review of Literature. Infect. Dis. Clin. (Baltim MD) 2021, 29, e468–e470. [Google Scholar] [CrossRef]
- Kaftan, A.N.; Hussain, M.K.; Algenabi, A.A.; Naser, F.H.; Enaya, M.A. Predictive Value of C-Reactive Protein, Lactate Dehydrogenase, Ferritin and D-Dimer Levels in Diagnosing COVID-19 Patients: A Retrospective Study. Acta Inform. Med. 2021, 29, 45–50. [Google Scholar] [CrossRef] [PubMed]
- Dheda, K.; Booth, H.; Huggett, J.F.; Johnson, M.A.; Zumla, A.; Rook, G.A.W. Lung Remodeling in Pulmonary Tuberculosis. J. Infect. Dis. 2005, 192, 1201–1209. [Google Scholar] [CrossRef] [PubMed]
- Colby, S.; Shah, R. TB Reactivation Following COVID-19 Infection. Chest 2022, 162, A329. [Google Scholar] [CrossRef]
- Mihuta, C.; Socaci, A.; Hogea, P.; Tudorache, E.; Mihuta, M.S.; Oancea, C. Colliding Challenges: An Analysis of SARS-CoV-2 Infection in Patients with Pulmonary Tuberculosis versus SARS-CoV-2 Infection Alone. Medicina 2024, 60, 823. [Google Scholar] [CrossRef]
- Mihuta, C.; Socaci, A.; Oancea, C. Colliding Challenges Part 2: An Analysis of SARS-CoV-2 Infection in Patients with Extrapulmonary Tuberculosis Versus SARS-CoV-2 Infection Alone. Medicina 2024, 60, 2071. [Google Scholar] [CrossRef]
- Prakash, A.K.; Datta, B.; Goyal, P.; Chatterjee, P.; Gupta, G. GENE-XPERT gives early diagnosis in early tuberculosis. Eur. Respir. J. 2016, 48 (Suppl. S60), PA2775. [Google Scholar]
- COVID-19 Treatment Guidelines Panel. Coronavirus Disease 2019 (COVID-19) Treatment Guidelines. National Institutes of Health. Available online: https://www.covid19treatmentguidelines.nih.gov/ (accessed on 1 June 2024).
- Gounden, V.; Bhatt, H.; Jialal, I. Renal Function Tests. [Updated 2023 Jul 17]. In StatPearls; StatPearls Publishing: Treasure Island, FL, USA, 2024; Available online: https://www.ncbi.nlm.nih.gov/books/NBK507821/ (accessed on 13 June 2024).
- World Health Organization. BCG vaccines: WHO position paper—February 2018. Wkly. Epidemiol. Rec. 2018, 93, 73–96 (accessed on 13 June 2024).
- Purnell, J.Q. Purnell, J.Q. Definitions, Classification, and Epidemiology of Obesity. [Updated 4 May 2023]. In Endotext; Feingold, K.R., Anawalt, B., Blackman, M.R., Boyce, A., Chrousos, G., Corpas, E., de Herder, W.W., Dhatariya, K., Dungan, K., Hofland, J., et al., Eds.; MDText.com, Inc.: South Dartmouth, MA, USA, 2000. Available online: https://www.ncbi.nlm.nih.gov/books/NBK279167/ (accessed on 13 June 2024).
- Akpek, M. Does COVID-19 Cause Hypertension? Angiology 2022, 73, 682–687. [Google Scholar] [CrossRef]
- Metra, M.; Dinatolo, E.; Dasseni, N. The New Heart Failure Association Definition of Advanced Heart Failure. Card. Fail. Rev. 2019, 5, 5–8. [Google Scholar] [CrossRef]
- Parker, C.S.; Siracuse, C.G.; Litle, V.R. Identifying lung cancer in patients with active pulmonary tuberculosis. JTD 2018, 10 (Suppl. S28), S3392–S3397. [Google Scholar] [CrossRef]
- Ramamoorthy, S.; Srinivas, B.H.; Badhe, B.A.; Jinkala, S.; Ganesh, R.N. Coexistence of malignancy and tuberculosis: Is it double disease or double hit related to COVID-19?—Experience from a tertiary care center. Int. J. Clin. Exp. Pathol. 2023, 16, 1–7. [Google Scholar] [PubMed]
- NHLBI Obesity Education Initiative Expert Panel on the Identification E and T of O in A (US). Clinical Guidelines on the Identification, Evaluation, and Treatment of Overweight and Obesity in Adults: The Evidence Report. In Obesity Prevention and Management; National Heart, Lung, and Blood Institute, Ed.; NHLBI Obesity Education Initiative Expert Panel on the Identification, Evaluation, and Treatment of Obesity in Adults (US): Bethesda, MD, USA, 1998.
- Seifi, S.; Khatony, A.; Moradi, G.; Abdi, A.; Najafi, F. Accuracy of pulse oximetry in detection of oxygen saturation in patients admitted to the intensive care unit of heart surgery: Comparison of finger, toe, forehead, and earlobe probes. BMC Nurs. 2018, 17, 15. [Google Scholar] [CrossRef] [PubMed]
- Fukui, S.; Ikeda, K.; Kobayashi, M.; Nishida, K.; Yamada, K.; Horie, S.; Shimada, Y.; Miki, H.; Goto, H.; Hayashi, K.; et al. Predictive prognostic biomarkers in patients with COVID 19 infection. Mol. Med. Rep. 2023, 27, 15. [Google Scholar] [CrossRef] [PubMed]
- Ali, E.T.; Jabbar, A.S.; Al Ali, H.S.; Hamadi, S.S.; Jabir, M.S.; Albukhaty, S. Extensive Study on Hematological, Immunological, Inflammatory Markers, and Biochemical Profile to Identify the Risk Factors in COVID-19 Patients. Int. J. Inflam 2022, 2022, 5735546. [Google Scholar] [CrossRef]
- Ravindra, R.; Ramamurthy, P.; Aslam, S.S.M.; Kulkarni, A.; Suhail, K.; Ramamurthy, P.S. Platelet Indices and Platelet to Lymphocyte Ratio (PLR) as Markers for Predicting COVID-19 Infection Severity. Cureus 2022, 14, e28206. [Google Scholar] [CrossRef]
- Mangoni, A.A.; Zinellu, A. Systemic inflammation index, disease severity, and mortality in patients with COVID-19: A systematic review and meta-analysis. Front. Immunol. 2023, 14, 1212998. [Google Scholar] [CrossRef]
- Hansell, D.M.; Bankier, A.A.; MacMahon, H.; McLoud, T.C.; Müller, N.L.; Remy, J. Fleischner society: Glossary of terms for thoracic imaging. Radiology 2008, 246, 697–722. [Google Scholar] [CrossRef]
- Hernandez-Romieu, A.C.; Little, B.P.; Bernheim, A.; Schechter, M.C.; Ray, S.M.; Bizune, D.; Kempker, R. Increasing Number and Volume of Cavitary Lesions on Chest Computed Tomography Are Associated With Prolonged Time to Culture Conversion in Pulmonary Tuberculosis. Open Forum Infect Dis. 2019, 6, ofz232. [Google Scholar] [CrossRef]
- Chang, Y.-C.; Yu, C.-J.; Chang, S.-C.; Galvin, J.R.; Liu, H.-M.; Hsiao, C.-H.; Kuo, P.-H.; Chen, K.-Y.; Franks, T.J.; Huang, K.-M.; et al. Pulmonary sequelae in convalescent patients after severe acute respiratory syndrome: Evaluation with thin-section CT. Radiology 2005, 236, 1067–1075. [Google Scholar] [CrossRef]
- Yazdi, N.A.; Ghadery, A.H.; SeyedAlinaghi, S.; Jafari, F.; Jafari, S.; Hasannezad, M.; Koochak, H.E.; Salehi, M.; Manshadi, S.A.D.; Meidani, M.; et al. Predictors of the chest CT score in COVID-19 patients: A cross-sectional study. Virol. J. 2021, 18, 225. [Google Scholar] [CrossRef]
- Borgdorff, M.W.; Nagelkerke, N.J.; Dye, C.; Nunn, P. Gender and tuberculosis: a comparison of prevalence surveys with notification data to explore sex differences in case detection. Int. J. Tuberc. Lung Dis. 2000, 4, 123–132. [Google Scholar] [PubMed]
- Uplekar, M.W.; Rangan, S.; Weiss, M.G.; et al. Attention to gender issues in tuberculosis control. Int. J. Tuberc. Lung Dis. 2001, 5, 220–224. [Google Scholar] [PubMed]
- Secretaría de Salud, Subsecretaría de Prevención y Control de Enfermedades, Instituto Nacional de Salud Pública. Encuesta Nacional de Salud 2000; 1st ed.; Secretaría de Salud: Mexico City, Mexico, 2000; pp. 41–50.
- Balasubramanian, R.; Garg, R.; Santha, T.; et al. Gender disparities in tuberculosis: Report from a rural DOTS programme in South India. Int. J. Tuberc. Lung Dis. 2004, 8, 323–332. [Google Scholar] [PubMed]
- Fine, P.E.M. Immunities in and to tuberculosis: Implications for pathogenesis and vaccination. In Tuberculosis Back to the Future; Porter, J.D.H., McAdam, K.P.W.J., Eds.; Wiley and Sons: Chichester, UK, 1993; pp. 53–78. [Google Scholar]
- Murray, C.J.L. Social, economic and operational research on tuberculosis: Recent studies and some priority questions. Bull. Int. Union Tuberc. Lung Dis. 1991, 66, 149–156. [Google Scholar]
- Bates, I.; Fenton, C.; Gruber, J.; et al. Vulnerability to malaria, tuberculosis, and HIV/AIDS infection and disease. Part 1: Determinants operating at individual and household level. Lancet Infect. Dis. 2004, 4, 267–277. [Google Scholar] [CrossRef]
- Ponce-de-Leon, A.; Garcia-Garcia, M.L.; Garcia-Sancho, M.C.; et al. Tuberculosis and diabetes in southern Mexico. Diabetes Care 2004, 27, 1584–1590. [Google Scholar] [CrossRef]
- Thulstrup, A.M.; Molle, I.; Svendsen, N.; et al. Incidence and prognosis of tuberculosis in patients with cirrhosis of the liver: A Danish nationwide population-based study. Epidemiol. Infect. 2000, 124, 221–225. [Google Scholar] [CrossRef]
- Caracta, C.F. Gender differences in pulmonary disease. Mt Sinai J. Med. 2003, 70, 215–224. [Google Scholar]
- Tekkel, M.; Rahu, M.; Loit, H.M.; et al. Risk factors for pulmonary tuberculosis in Estonia. Int. J. Tuberc. Lung Dis. 2002, 6, 887–894. [Google Scholar]
- Curtis, A.B.; Ridzon, R.; Novick, L.F.; et al. Analysis of Mycobacterium tuberculosis transmission patterns in a homeless shelter outbreak. Int. J. Tuberc. Lung Dis. 2000, 4, 308–313. [Google Scholar]
- García-García, M.; Palacios-Martinez, M.; Ponce-de-León, A.; et al. The role of core groups in transmitting Mycobacterium tuberculosis in a high prevalence community in Southern Mexico. Int. J. Tuberc. Lung Dis. 2000, 4, 12–17. [Google Scholar] [PubMed]
- Godoy, P.; Nogues, A.; Alseda, M.; et al. Risk factors associated with tuberculosis patients with positive sputum microscopy. Gac Sanit 2001, 15, 506–512. [Google Scholar] [CrossRef] [PubMed]
- Kolappan, C.; Gopi, P.G. Tobacco smoking and pulmonary tuberculosis. Thorax 2002, 57, 964–966. [Google Scholar] [CrossRef] [PubMed]
- Baya, B.; Sanogo, I.; Kone, M.; Soumare, D.; Ouattara, K.; Somboro, A.; Wague, M.; Coulibaly, N.; Koloma, I.; Coulibaly, M.; Nantoume, M.; Perou, M.; Kone, K.; Coulibaly, D.; Boukary Diarra, H.; Kone, B.; Diarra, A.; Coulibaly, M.D.; Sanogo, M.; Diarra, B.; Diakite, M.; Achenbach, C.J.; Doumbia, S.; Bishai, W.R.; Klein, S.L.; Holl, J.L.; Diallo, S.; Murphy, R.L.; Toloba, Y.; Dabitao, D. Relationship between patient sex and anatomical sites of extrapulmonary tuberculosis in Mali. J. Clin. Tuberc. Other Mycobact. Dis. 2023, 33, 100389. J. Clin. Tuberc. Other Mycobact. Dis. 2023, 33, 100389. [Google Scholar] [CrossRef]
- Min, J.; Lee, J.H.; Kim, S.Y.; Park, J.S.; Cho, Y.J.; Yoon, H.I.; Lee, C.T.; Lee, J.H. Differential effects of sex on tuberculosis location and severity across the lifespan. Sci. Rep. 2023, 13, 33245. [Google Scholar] [CrossRef]
- Ramírez-Lapausa, M.; Menéndez-Saldaña, A.; Noguerado-Asensio, A. Extrapulmonary Tuberculosis: An Overview. Rev. Esp. Sanid. Penit. 2015, 17, 3–11. [Google Scholar] [CrossRef]
- Caraux-Paz, P.; Diamantis, S.; de Wazières, B.; Gallien, S. Tuberculosis in the Elderly. J. Clin. Med. 2021, 10, 5888. [Google Scholar] [CrossRef]
- Bartleson, J.M.; Radenkovic, D.; Covarrubias, A.J.; Furman, D.; Winer, D.A.; Verdin, E. SARS-CoV-2, COVID-19 and the Ageing Immune System. Nat. Aging. 2021, 1, 769–782. [Google Scholar] [CrossRef]
- Daneshvar, P.; Hajikhani, B.; Sameni, F.; Noorisepehr, N.; Zare, F.; Bostanshirin, N.; Yazdani, S.; Goudarzi, M.; Sayyari, S.; Dadashi, M. COVID-19 and Tuberculosis Coinfection: An Overview of Case Reports/Case Series and Meta-Analysis of Prevalence Studies. Heliyon 2023, 9, e13637. [Google Scholar] [CrossRef]
- Nuwagira, E.; Mpagama, S.G.; Katusiime, A.; Natamba, B.; Baluku, J.B.; Lai, P.S. Coinfection of COVID-19 and Tuberculosis in Uganda. Am. J. Trop. Med. Hyg. 2023, 108, 1240–1243. [Google Scholar] [CrossRef]
- Nabity, S.A.; Marks, S.M.; Goswami, N.D.; et al. Characteristics of and Deaths among 333 Persons with Tuberculosis and COVID-19 in Cross-Sectional Sample from 25 Jurisdictions, United States. Emerg. Infect. Dis. 2023, 29, 2016–2023. [Google Scholar] [CrossRef] [PubMed]
- Wang, Y.; Chen, Y.; Gu, L.; Lou, L.; Zhang, J.; Zhang, K. The Clinical Characteristics and Risk Factors for Severe COVID-19 in Patients with COVID-19 and Tuberculosis Coinfection. Front. Microbiol. 2022, 13, 1061879. [Google Scholar] [CrossRef] [PubMed]
- Ayed, H.B.; Koubaa, M.; Marrakchi, C.; Rekik, K.; Hammami, F.; Smaoui, F.; Ben Hmida, M.; Yaich, S.; Maaloul, I.; Damak, J.; Ben Jemaa, M. Extrapulmonary Tuberculosis: Update on the Epidemiology, Risk Factors and Prevention Strategies. Int. J. Trop. Dis. 2018, 1, 006. [Google Scholar] [CrossRef]
- Wang, Q.; Cao, Y.; Liu, X.; Fu, Y.; Zhang, J.; Zhang, Y.; Zhang, L.; Wei, X.; Yang, L. Systematic Review and Meta-Analysis of Tuberculosis and COVID-19 Co-Infection: Prevalence, Fatality, and Treatment Considerations. PLoS Negl. Trop. Dis. 2024, 18, e0012136. [Google Scholar] [CrossRef]
- Booysen, P.; Wilkinson, K.A.; Sheerin, D.; Waters, R.; Coussens, A.K.; Wilkinson, R.J. Immune Interaction between SARS-CoV-2 and Mycobacterium tuberculosis. Front. Immunol. 2023, 14, 1254206. [Google Scholar] [CrossRef]
- Nathella Pavan, K.; Arul, P.N.; Kadar, M.; Pradeep, A.M.; Vaithilingam, V.B.; Nair, D.; Sujatha, N.; Babu, S. Low Body Mass Index Is Associated with Diminished Plasma Cytokines and Chemokines in Both Active and Latent Tuberculosis. Front. Nutr. 2023, 10, 1194682. [Google Scholar] [CrossRef]
- Edwards, L.B.; Livesay, V.T.; Acquaviva, F.A. , et al. Height, Weight, Tuberculous Infection, and Tuberculous Disease. Arch. Environ. Health. 1971, 22, 106–112. [Google Scholar] [CrossRef]
- Tverdal, A. Body Mass Index and Incidence of Tuberculosis. Eur. J. Respir. Dis. 1986, 69, 355–362. [Google Scholar]
- Oda, G.; Lucero-Obusan, C.; Schirmer, P.; Chung, J.; Holodniy, M. Risk Factors for Extrapulmonary Tuberculosis Among US Veterans, 1990–2022. Open Forum Infect. Dis. 2024, 11, ofae698. [Google Scholar] [CrossRef]
- Kornfeld, H.; Sahukar, S.B.; Procter-Gray, E.; Kumar, N.P.; West, K.; Kane, K.; Natarajan, M.; Li, W.; Babu, S.; Viswanathan, V. Impact of Diabetes and Low Body Mass Index on Tuberculosis Treatment Outcomes. Clin. Infect. Dis. 2020, 71, e392–e398. [Google Scholar] [CrossRef]
- Slane, V.H.; Unakal, C.G. Tuberculous Meningitis. In StatPearls; StatPearls Publishing: Treasure Island, FL, USA, 2025; Available online: https://www.ncbi.nlm.nih.gov/books/NBK541015/ (accessed on February 2, 2025).
- Gao, M.; Piernas, C.; Astbury, N.M.; et al. Associations between Body-Mass Index and COVID-19 Severity in 6.9 Million People in England: A Prospective, Community-Based, Cohort Study. Lancet Diabetes Endocrinol. 2021, 9, 350–359. [CrossRef]
- Lockhart, S.M.; O'Rahilly, S. When Two Pandemics Meet: Why Is Obesity Associated with Increased COVID-19 Mortality? Med (N. Y.) 2020, 1, 33–42. [Google Scholar] [CrossRef]
- Hewitt, J.; Carter, B.; Vilches-Moraga, A.; et al. The Effect of Frailty on Survival in Patients with COVID-19 (COPE): A Multicentre, European, Observational Cohort Study. Lancet Public Health 2020, 5, e444–e451. [Google Scholar] [CrossRef] [PubMed]
- Jayanama, K.; Theou, O.; Godin, J.; et al. Relationship of Body Mass Index with Frailty and All-Cause Mortality Among Middle-Aged and Older Adults. BMC Med. 2022, 20, 404. [Google Scholar] [CrossRef] [PubMed]
- Watanabe, D.; Yoshida, T.; Watanabe, Y.; Yamada, Y.; Kimura, M. A U-Shaped Relationship between the Prevalence of Frailty and Body Mass Index in Community-Dwelling Japanese Older Adults: The Kyoto–Kameoka Study. J. Clin. Med. 2020, 9, 1367. [Google Scholar] [CrossRef] [PubMed]
- de Martino, M.; Lodi, L.; Galli, L.; Chiappini, E. Immune Response to Mycobacterium Tuberculosis: A Narrative Review. Front. Pediatr. 2019, 7, 350. [Google Scholar] [CrossRef]
- Flores-Lovon, K.; Ortiz-Saavedra, B.; Cueva-Chicaña, L.A.; Aperrigue-Lira, S.; Montes-Madariaga, E.S.; Soriano-Moreno, D.R.; Bell, B.; Macedo, R. Immune Responses in COVID-19 and Tuberculosis Coinfection: A Scoping Review. Front. Immunol. 2022, 13, 992743. [Google Scholar] [CrossRef]
- Hiti, L.; Markovič, T.; Lainscak, M.; Farkaš Lainščak, J.; Pal, E.; Mlinarič-Raščan, I. The Immunopathogenesis of a Cytokine Storm: The Key Mechanisms Underlying Severe COVID-19. Cytokine Growth Factor Rev. 2025, 82, 1–17. [Google Scholar] [CrossRef]
- Wang, H.; Wang, Z.; Cao, W.; Wu, Q.; Yuan, Y.; Zhang, X. Regulatory T Cells in COVID-19. Aging Dis. 2021, 12, 1545. [Google Scholar] [CrossRef]
- Galván-Peña, S.; Leon, J.; Chowdhary, K.; Michelson, D.A.; Vijaykumar, B.; Yang, L.; Magnuson, A.M.; Chen, F.; Manickas-Hill, Z.; Piechocka-Trocha, A.; et al. Profound Treg Perturbations Correlate with COVID-19 Severity. Proc. Natl. Acad. Sci. USA. 2021, 118, e2111315118. [Google Scholar] [CrossRef]
- Tan, L.; Wang, Q.; Zhang, D.; et al. Lymphopenia Predicts Disease Severity of COVID-19: A Descriptive and Predictive Study. Signal Transduct. Target Ther. 2020, 5, 33. [Google Scholar] [CrossRef]
- Cioboata, R.; Vasile, C.M.; Bălteanu, M.A.; Georgescu, D.E.; Toma, C.; Dracea, A.S.; Nicolosu, D. Evaluating Serum Calcium and Magnesium Levels as Predictive Biomarkers for Tuberculosis and COVID-19 Severity: A Romanian Prospective Study. Int. J. Mol. Sci. 2024, 25, 418. [Google Scholar] [CrossRef] [PubMed]
- TB/COVID-19 Global Study Group. Tuberculosis and COVID-19 Co-Infection: Description of the Global Cohort. Eur. Respir. J, 2102; 59. [CrossRef]
- Bostanghadiri, N.; Jazi, F.M.; Razavi, S.; Fattorini, L.; Darban-Sarokhalil, D. Mycobacterium tuberculosis and SARS-CoV-2 Coinfections: A Review. Front. Microbiol. 2022, 12, 747827. [Google Scholar] [CrossRef] [PubMed]
- Cioboata, R.; Biciusca, V.; Olteanu, M.; Vasile, C.M. COVID-19 and Tuberculosis: Unveiling the Dual Threat and Shared Solutions Perspective. J. Clin. Med. 2023, 12, 4784. [Google Scholar] [CrossRef] [PubMed]
- Maritescu, A.; Crisan, A.F.; Pescaru, C.C.; Stoicescu, E.R.; Oancea, C.; Iacob, D. Effectiveness of Combined Pulmonary Rehabilitation and Progressive Muscle Relaxation in Treating Long-Term COVID-19 Symptoms: A Randomized Controlled Trial. J. Clin. Med. 2024, 13, 6237. [Google Scholar] [CrossRef]
Figure 1.
AUC-ROC curves of neutrophil count, NLR, PLR, and SII.
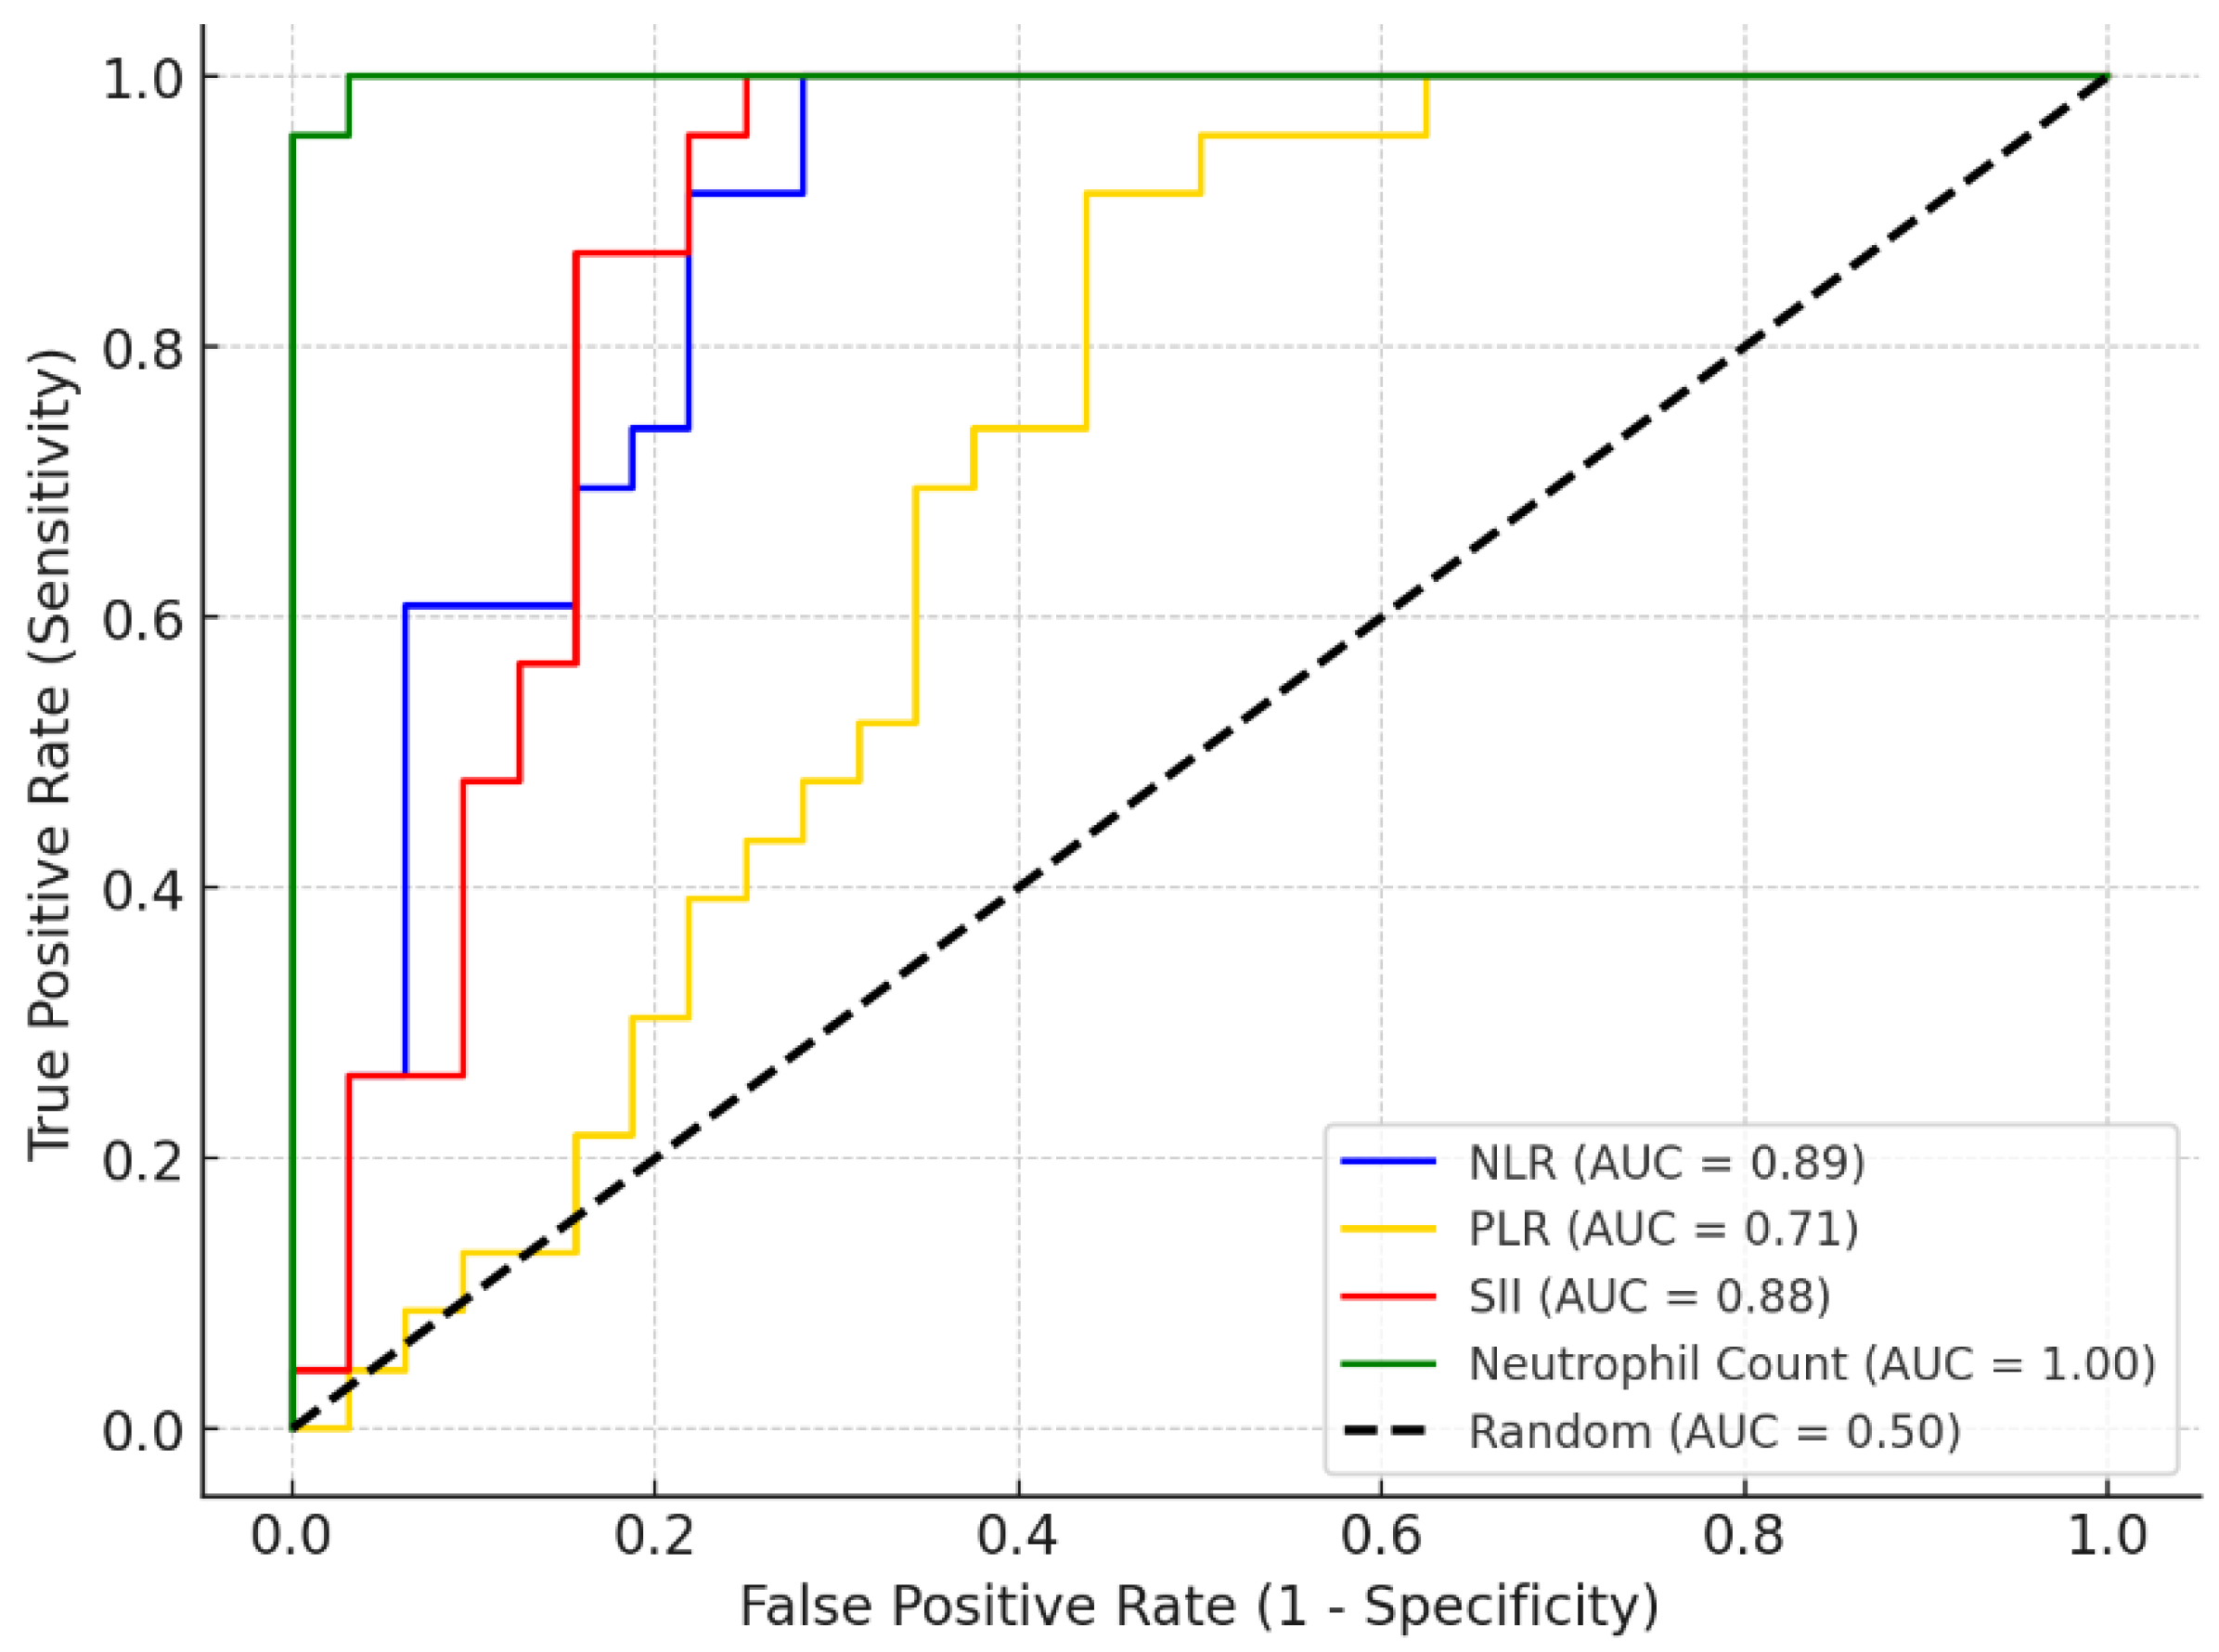
Figure 2.
AUC-ROC curves of hospitalization and O2 saturation levels.
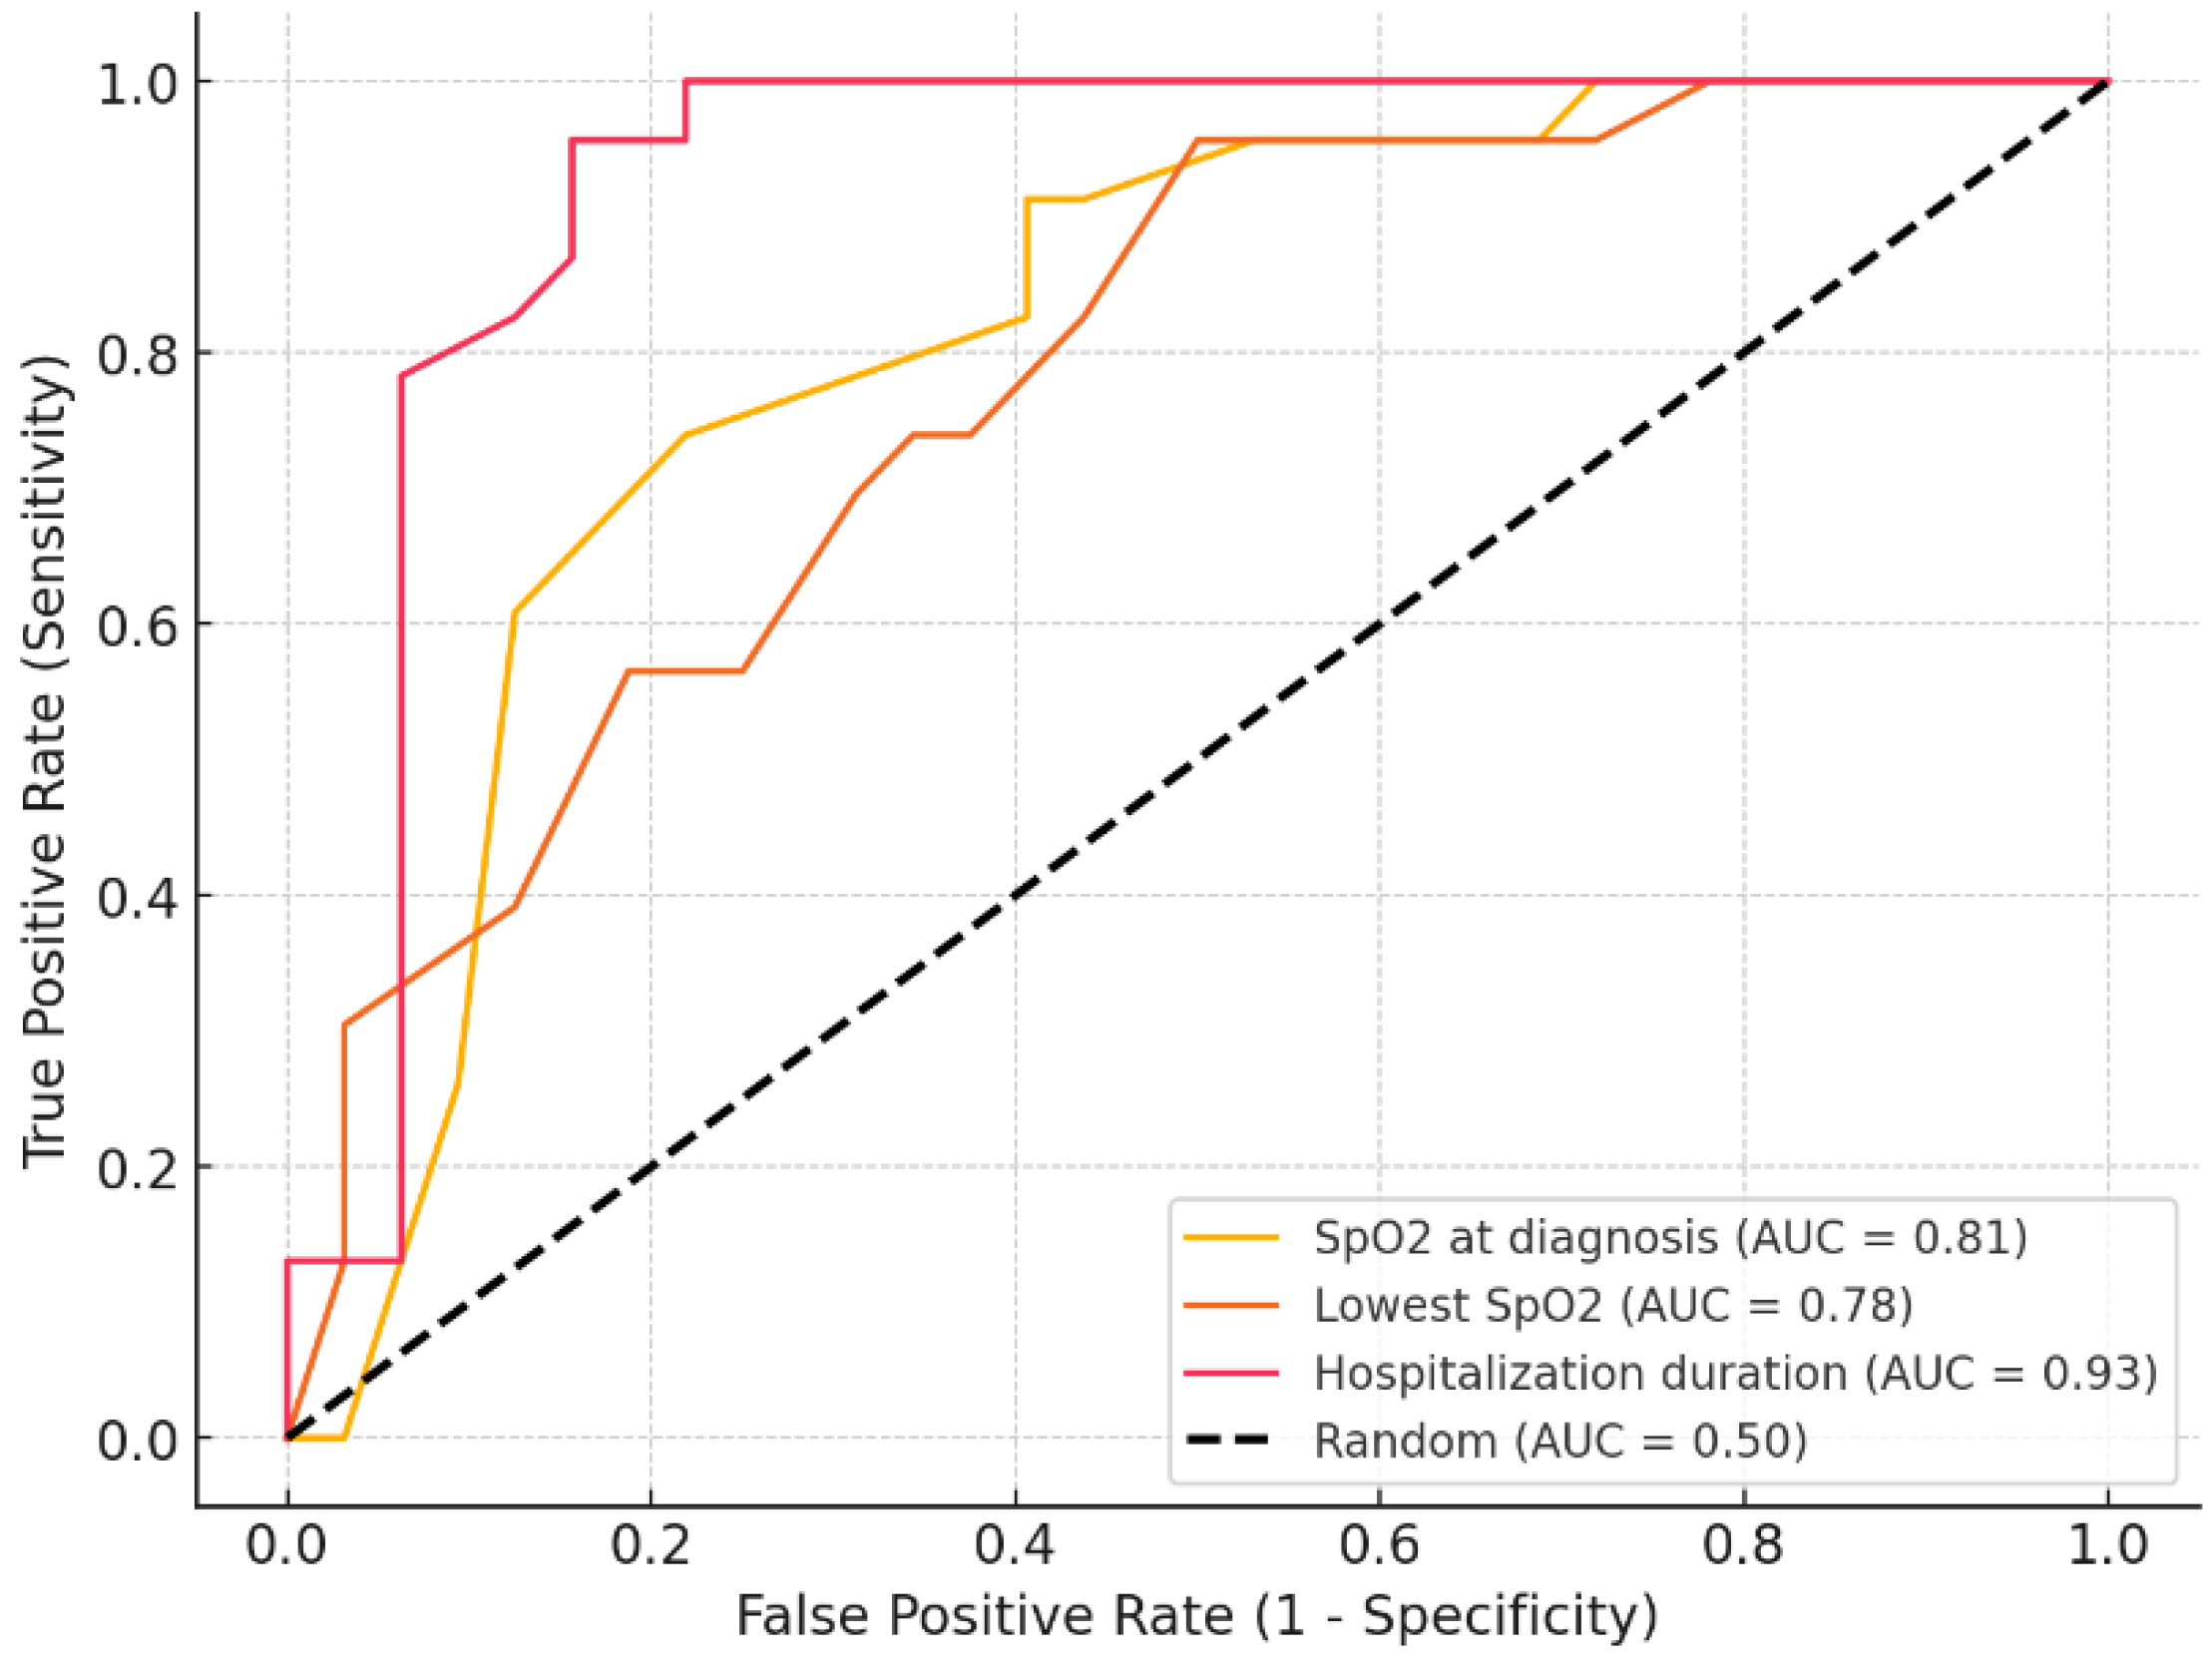

Table 1.
The number of subjects by sex and age.
| PTB-SARS-CoV-2 n=32 |
extraPTB-SARS-CoV-2 n=23 |
||
| Sex | F | 11 (34%) | 10 (43.5%) |
| M | 21 (65%) | 13 (56.5%) | |
| Age | 19-40 y | 2 (6.2%) | 15 (65.2%) |
| 41-65 y | 16 (50%) | 6 (26.1%) | |
| >66 y | 14 (43.8%) | 2 (8.7%) |
Table 2.
A Mann-Whitney comparison of the analyzed parameters between PTB-SARS-CoV-2 and extraPTB-SARS-CoV2 groups.
Table 2.
A Mann-Whitney comparison of the analyzed parameters between PTB-SARS-CoV-2 and extraPTB-SARS-CoV2 groups.
| Parameter | PTB-SARS-CoV-2 median value |
extraPTB-SARS-CoV-2 median value |
p |
| BMI (kg/m2) | 21.88 | 24.45 | 0.01 |
| SpO2 at diagnosis (%) | 90 | 96 | <0.001 |
| Lowest SpO2 (%) | 83.5 | 92 | 0.001 |
| Peripheral SBP at diagnosis (mmHg) | 138 | 129 | 0.03 |
| Peripheral DBP at diagnosis (mmHg) | 92 | 85 | 0.04 |
| CRP (mg/dL) | 89.5 | 66.1 | 0.01 |
| LDH (UI/L) | 288 | 203 | 0.14 |
| IL-6 (pg/mL) | 4.2 | 8.8 | 0.009 |
| AST (UI/L) | 36 | 38 | 0.28 |
| ALT (UI/L) | 38.5 | 42 | 0.74 |
| D-dimer (mg/L) | 1.91 | 1.65 | 0.55 |
| Neutrophils/uL* | 1539.69 (SD=933.29) | 6194.8 (SD=1837.6) | <0.001 |
| Lymphocytes/uL | 2210 | 1460 | 0.04 |
| Thrombocytes/uL | 242500 | 351000 | 0.02 |
| NLR | 2 | 3.73 | <0.001 |
| PLR | 128.85 | 235.54 | 0.01 |
| SII | 134549.68 | 1255888.88 | <0.001 |
| Chest CT Involvement score | 16 | 6 | <0.001 |
* The T-student test was employed for neutrophil count. The bolded data in this table represents statistically significant results.
Table 3.
Fisher’s Exact comparison of the nominal parameters between PTB-SARS-CoV-2 and extraPTB-SARS-CoV2 groups.
Table 3.
Fisher’s Exact comparison of the nominal parameters between PTB-SARS-CoV-2 and extraPTB-SARS-CoV2 groups.
| Parameter | p |
|---|---|
| Sex | 0.7 |
| Smoking | 0.4 |
| Associating COPD | 0.86 |
| Associatiang T2MD | 0.82 |
| Severity of symptoms | 0.7 |
| Outcome | 0.54 |
Table 4.
Random Forest classification analysis: predictors of severe symptoms.
| Feature | Importance |
| Lowest SpO2 | 0.20 |
| SpO2 at diagnosis | 0.15 |
| Age | 0.08 |
| CT involvement score | 0.07 |
| Lymphocyte count | 0.07 |
| LDH | 0.06 |
| CRP | 0.06 |
| D-dimer | 0.05 |
| IL6 | 0.05 |
| Neutrophil count | 0.04 |
| AST | 0.03 |
| Thrombocyte count | 0.03 |
| ALT | 0.03 |
| BMI | 0.02 |
| PLR | 0.02 |
| SII | 0.02 |
| NLR | 0.02 |
| Type of TB | 0.01 |
Table 5.
Random Forest classification report for predictors of severe symptoms analysis.
| Precision | Recall | F1-score | Support | |
| Mild symptoms | 1 | 1 | 1 | 38 |
| Severe symptoms | 1 | 1 | 1 | 17 |
| Accuracy | 1 | 1 | 1 | 1 |
| Macro Average | 1 | 1 | 1 | 55 |
| Weighted Average | 1 | 1 | 1 | 55 |
Table 6.
Spearman correlations between parameters.
| Type of TB | Outcome | Smo-king | COPD | T2DM | Prior TB | PCT | NLR | PLR | SII |
D -dimer |
Hospitalization | SpO2 at dg | Lowest SpO2 | CT score | |
| Type of TB | 1 | -0.28 | 0.1 | -0.02 | -0.27 | -0.90 | -0.07 | 0.66 | 0.35 | 0.66 | 0.08 | 0.73 | 0.53 | 0.48 | -0.77 |
| p | 0 | 0.04 | 0.45 | 0.9 | 0.05 | <0.001 | 0.6 | <0.001 | 0.008 | <0.001 | 0.56 | <0.001 | <0.001 | 0.0002 | <0.001 |
| Outcome | -0.28 | 1 | 0.12 | 0.17 | 0.39 | 0.32 | 0.31 | 0.17 | 0.34 | 0.13 | 0.28 | 0.001 | -0.45 | -0.50 | 0.61 |
| p | 0.04 | 0 | 0.37 | 0.2 | 0.003 | 0.02 | 0.02 | 0.22 | 0.01 | 0.34 | 0.04 | 0.99 | <0.001 | <0.001 | <0.001 |
| Smoking | 0.10 | 0.12 | 1 | 0.36 | -0.11 | -0.16 | -0.07 | 0.13 | 0.08 | 0.08 | 0.14 | 0.21 | -0.12 | -0.03 | -0.04 |
| p | 0.45 | 0.37 | 0 | 0.006 | 0.44 | 0.25 | 0.6 | 0.33 | 0.57 | 0.57 | 0.32 | 0.12 | 0.39 | 0.8 | 0.79 |
| COPD | -0.02 | 0.17 | 0.36 | 1 | 0.13 | 0.07 | -0.06 | 0.10 | 0.02 | 0.04 | 0.22 | 0.14 | -0.17 | -0.22 | 0.04 |
| p | 0.9 | 0.2 | 0.006 | 0 | 0.33 | 0.62 | 0.67 | 0.48 | 0.88 | 0.76 | 0.11 | 0.31 | 0.21 | 0.1 | 0.78 |
| T2DM | -0.27 | 0.39 | -0.11 | 0.13 | 1 | 0.33 | 0.39 | -0.01 | 0.11 | -0.04 | 0.23 | -0.06 | -0.47 | -0.46 | 0.36 |
| p | 0.05 | 0.003 | 0.44 | 0.33 | 0 | 0.01 | 0.003 | 0.94 | 0.42 | 0.79 | 0.09 | 0.65 | <0.001 | <0.001 | 0.007 |
| Prior TB | -0.90 | 0.32 | -0.16 | 0.07 | 0.33 | 1 | 0.14 | -0.52 | -0.22 | -0.53 | -0.006 | -0.66 | -0.54 | -0.51 | 0.75 |
| p | <0.001 | 0.02 | 0.25 | 0.62 | 0.01 | 0 | 0.32 | <0.001 | 0.11 | <0.001 | 0.96 | <0.001 | <0.001 | <0.001 | <0.001 |
| PCT | -0.07 | 0.31 | -0.07 | -0.06 | 0.39 | 0.14 | 1 | 0.33 | 0.48 | 0.37 | 0.44 | 0.04 | -0.47 | -0.53 | 0.19 |
| p | 0.60 | 0.02 | 0.60 | 0.67 | 0.003 | 0.32 | 0 | 0.01 | <0.001 | 0.005 | <0.001 | 0.79 | <0.001 | <0.001 | 0.16 |
| NLR | 0.66 | 0.17 | 0.13 | 0.10 | -0.01 | -0.52 | 0.33 | 1 | 0.77 | 0.95 | 0.45 | 0.62 | -0.0016 | -0.05 | -0.29 |
| p | <0.001 | 0.22 | 0.33 | 0.48 | 0.94 | <0.001 | 0.01 | 0 | <0.001 | <0.001 | <0.001 | <0.001 | 0.99 | 0.72 | 0.03 |
| PLR | 0.35 | 0.34 | 0.08 | 0.02 | 0.11 | -0.22 | 0.48 | 0.77 | 1 | 0.86 | 0.66 | 0.26 | -0.38 | -0.42 | -0.05 |
| p | 0.008 | 0.01 | 0.57 | 0.88 | 0.42 | 0.11 | <0.001 | <0.001 | 0 | <0.001 | <0.001 | 0.06 | 0.004 | 0.001 | 0.73 |
| SII | 0.66 | 0.13 | 0.08 | 0.04 | -0.04 | -0.53 | 0.37 | 0.95 | 0.86 | 1 | 0.54 | 0.54 | -0.05 | -0.11 | -0.32 |
| p | <0.001 | 0.34 | 0.57 | 0.76 | 0.79 | <0.001 | 0.005 | <0.001 | <0.001 | 0 | <0.001 | <0.001 | 0.70 | 0.41 | 0.02 |
| D-dimer | 0.08 | 0.28 | 0.14 | 0.22 | 0.23 | -0.006 | 0.44 | 0.45 | 0.66 | 0.54 | 1 | 0.14 | -0.42 | -0.48 | 0.07 |
| p | 0.56 | 0.04 | 0.32 | 0.11 | 0.09 | 0.96 | <0.001 | <0.001 | <0.001 | <0.001 | 0 | 0.31 | 0.001 | <0.001 | 0.62 |
| Hospitalization | 0.73 | 0.001 | 0.21 | 0.14 | -0.06 | -0.66 | 0.04 | 0.62 | 0.26 | 0.54 | 0.14 | 1 | 0.35 | 0.29 | -0.36 |
| p | <0.001 | 0.99 | 0.12 | 0.31 | 0.65 | <0.001 | 0.79 | <0.001 | 0.06 | <0.001 | 0.31 | 0 | 0.009 | 0.03 | 0.007 |
|
SpO2 at dg |
0.53 | -0.45 | -0.12 | -0.17 | -0.47 | -0.54 | -0.47 | -0.0016 | -0.38 | -0.05 | -0.42 | 0.35 | 1 | 0.95 | -0.57 |
| p | <0.001 | <0.001 | 0.39 | 0.21 | <0.001 | <0.001 | <0.001 | 0.99 | 0.004 | 0.70 | 0.001 | 0.009 | 0 | <0.001 | <0.001 |
| Lowest SpO2 | 0.48 | -0.50 | -0.03 | -0.22 | -0.46 | -0.51 | -0.53 | -0.05 | -0.42 | -0.11 | -0.48 | 0.29 | 0.95 | 1 | -0.52 |
| p | <0.001 | <0.001 | 0.8 | 0.1 | <0.001 | <0.001 | <0.001 | 0.72 | 0.001 | 0.41 | <0.001 | 0.03 | <0.001 | 0 | <0.001 |
| CT score | -0.77 | 0.61 | -0.04 | 0.04 | 0.36 | 0.75 | 0.19 | -0.29 | -0.05 | -0.32 | 0.07 | -0.36 | -0.57 | -0.52 | 1 |
| p | <0.001 | <0.001 | 0.79 | 0.78 | 0.007 | <0.001 | 0.16 | 0.03 | 0.73 | 0.02 | 0.62 | 0.007 | <0.001 | <0.001 | 0 |
Table 7.
AUC-ROC analysis: the ability of clinical and paraclinical markers to detect extraPTB cases.
Table 7.
AUC-ROC analysis: the ability of clinical and paraclinical markers to detect extraPTB cases.
| Parameter | AUC | Criterion (cut-off) | p-value | Sensitivity % | Specificity % | PPV | NPV |
| BMI | 0.7 | 23.45 | 0.06 | 65.22 | 84.38 | 0.75 | 0.77 |
| SpO2 at diagnosis | 0.81 | 95 | 0.01 | 73.91 | 78.12 | 0.71 | 0.81 |
| Lowest SpO2 | 0.78 | 84 | 0.03 | 95.65 | 50 | 0.58 | 0.94 |
| AST | 0.59 | 74 | 0.62 | 34.78 | 100 | 1 | 0.68 |
| ALT | 0.53 | 95 | 0.38 | 21.74 | 100 | 1 | 0.64 |
| LDH | 0.38 | 166 | 0.09 | 86.96 | 25 | 0.45 | 0.73 |
| IL6 | 0.71 | 8.8 | 0.07 | 52.17 | 84.38 | 0.71 | 0.71 |
| D-dimer | 0.55 | 4.86 | 0.12 | 26.09 | 100 | 1 | 0.65 |
| Neutrophil count | 0.95 | 3300 | <0.001 | 100 | 96.88 | 0.96 | 1 |
| Lymphocyte count | 0.34 | 810 | 0.23 | 91.3 | 15.62 | 0.44 | 0.71 |
| Thrombocyte count | 0.68 | 242000 | 0.08 | 91.30 | 50.00 | 0.57 | 0.89 |
| NLR | 0.89 | 1.57 | 0.02 | 100 | 71.88 | 0.72 | 1 |
| PLR | 0.71 | 154.95 | 0.06 | 91.3 | 56.25 | 0.6 | 0.9 |
| SII | 0.88 | 437758.9 | 0.04 | 100 | 75 | 0.74 | 1 |
| Hospitalization | 0.93 | 20 | 0.02 | 95.65 | 84.38 | 0.81 | 0.96 |
Table 8.
ANCOVA of the predictors of hospitalization duration.
| Sum of squares | df | F | p | |
| Type of TB | 50.62 | 1 | 1.53 | 0.22 |
| Age | 105.41 | 1 | 3.18 | 0.08 |
| BMI | 305.41 | 1 | 9.21 | 0.004 |
| SpO2 at diagnosis | 2.05 | 1 | 0.06 | 0.81 |
| Lowest SpO2 | 19.89 | 1 | 0.60 | 0.44 |
| CRP | 79.45 | 1 | 2.39 | 0.13 |
| AST | 9.57 | 1 | 0.29 | 0.59 |
| ALT | 1.08 | 1 | 0.03 | 0.86 |
| LDH | 4.76 | 1 | 0.14 | 0.71 |
| IL6 | 151.40 | 1 | 4.56 | 0.04 |
| D-dimer | 287.69 | 1 | 8.67 | 0.005 |
| Neutrophil count | 524.87 | 1 | 15.82 | 0.0003 |
| Thrombocyte count | 24.06 | 1 | 0.73 | 0.4 |
| Lymphocyte count | 102.70 | 1 | 3.10 | 0.08 |
| CT_involvement_score | 100.32 | 1 | 3.02 | 0.09 |
| NLR | 79.10 | 1 | 2.38 | 0.13 |
| PLR | 108.50 | 1 | 3.27 | 0.08 |
| SII | 181.05 | 1 | 5.46 | 0.03 |
| Residual | 1194.30 | 36 |
The bolded data in this table represents statistically significant results.
Table 9.
LASSO regression of the most influential predictors of hospitalization duration while addressing multicollinearity.
Table 9.
LASSO regression of the most influential predictors of hospitalization duration while addressing multicollinearity.
| Variable | β Coefficient |
| Neutrophil count | 6.526728 |
| Type of TB | 4.713506 |
| IL6 | 4.039135 |
| Thrombocyte count | -3.68729 |
| BMI | -2.59693 |
| CT involvement score | 2.152821 |
| D-dimer levels | 1.903791 |
| SII | -1.77909 |
| CRP | -1.45796 |
| LDH | 1.201368 |
| AGE | -0.74844 |
| AST | 0.699141 |
| PLR | -0.14857 |
| SpO2 at diagnosis | 0 |
| Lowest SpO2 | 0 |
| ALT | 0 |
| Lymphocyte count | 0 |
| NLR | 0 |
Table 10.
Median values of paraclinical parameters in the subjects with fatal outcomes.
| Age | BMI | SpO2 at diagnosis | Lowest SpO2 |
| 61 | 21.22 | 89 | 79 |
| CRP | IL6 | LDH | D-dimer |
| 112 | 9.1 | 388 | 3.31 |
| Neutrophil count | Lymphocyte count | Thrombocyte count | CT involvement score |
| 2910 | 1000 | 380000 | 22 |
| NLR | PLR | SII | Hospitalization |
| 2.88 | 333.33 | 717250 | 18 |
Table 11.
Firth’s logistic regression to identify predictors of fatal outcomes.
| Variable | Coefficient | Odds Ratio | 95% CI Lower | 95% CI Upper |
| Type of TB | -0.01 | 0.99 | 0.76 | 1.28 |
| Age | -0.55 | 0.58 | 0.44 | 0.75 |
| BMI | -0.06 | 0.94 | 0.73 | 1.23 |
| SpO2 at diagnosis | 0.21 | 1.23 | 0.95 | 1.6 |
| Lowest SpO2 | -0.56 | 0.57 | 0.44 | 0.74 |
| CRP | -0.10 | 0.90 | 0.69 | 1.17 |
| AST | -0.22 | 0.80 | 0.61 | 1.04 |
| ALT | -0.07 | 0.93 | 0.71 | 1.21 |
| LDH | 0.39 | 1.47 | 1.13 | 1.91 |
| IL6 | 0.51 | 1.67 | 1.29 | 2.17 |
| D-dimer | 0.002 | 1 | 0.77 | 1.3 |
| Neutrophil count | 0.26 | 1.3 | 1 | 1.68 |
| Lymphocyte count | -0.76 | 0.47 | 0.36 | 0.61 |
| Thrombocyte count | -0.20 | 0.82 | 0.63 | 1.06 |
| CT involvement score | 1.88 | 6.57 | 5.06 | 8.54 |
| NLR | -0.23 | 0.79 | 0.61 | 1.03 |
| PLR | 0.15 | 1.16 | 0.89 | 1.51 |
| SII | -0.11 | 0.9 | 0.69 | 1.17 |
Table 12.
Random Forest classification analysis: predictors of fatal outcome.
| Feature | Importance |
| CT involvement score | 0.22 |
| Lowest SpO2 | 0.13 |
| SpO2 at diagnosis | 0.09 |
| CRP | 0.08 |
| LDH | 0.06 |
| Lymphocyte count | 0.06 |
| IL6 | 0.06 |
| Age | 0.04 |
| BMI | 0.04 |
| PLR | 0.04 |
| Neutrophil count | 0.03 |
| NLR | 0.03 |
| D-dimer | 0.03 |
| SII | 0.03 |
| AST | 0.02 |
| Type of TB | 0.01 |
| Thrombocyte count | 0.01 |
| ALT | 0.01 |
Table 13.
Random Forest classification report for predictors of fatal outcome analysis.
| Precision | Recall | F1-score | Support | |
| Resolution | 0.9 | 1 | 0.94 | 9 |
| Fatality | 1 | 0.5 | 0.66 | 2 |
| Accuracy | 0.9 | 0.9 | 0.9 | 0.9 |
| Macro Average | 0.95 | 0.75 | 0.8 | 11 |
| Weighted Average | 0.91 | 0.9 | 0.89 | 11 |
Disclaimer/Publisher’s Note: The statements, opinions and data contained in all publications are solely those of the individual author(s) and contributor(s) and not of MDPI and/or the editor(s). MDPI and/or the editor(s) disclaim responsibility for any injury to people or property resulting from any ideas, methods, instructions or products referred to in the content. |
© 2025 by the authors. Licensee MDPI, Basel, Switzerland. This article is an open access article distributed under the terms and conditions of the Creative Commons Attribution (CC BY) license (http://creativecommons.org/licenses/by/4.0/).
Copyright: This open access article is published under a Creative Commons CC BY 4.0 license, which permit the free download, distribution, and reuse, provided that the author and preprint are cited in any reuse.


