
Submitted:
10 April 2025
Posted:
10 April 2025
You are already at the latest version
Abstract
Groundwater is the main source of water for both domestic and agricultural use in arid regions. This study assessed the hydrogeochemical characteristics and suitability of groundwater for drinking and irrigation in Kenya’s Ewaso Ng’iro–Lagh Dera Basin. A total of 129 borehole samples were collected and analyzed for pH, electrical conductivity (EC), total hardness, and major ions. The groundwater was found to be mostly neutral to slightly alkaline and ranged from marginal to brackish in salinity. The dominant water type is Na-HCO₃, with the ionic order Na⁺ > Ca²⁺ > Mg²⁺ > K⁺ and HCO₃⁻ > Cl⁻ > SO₄²⁻ > NO₃⁻. Mineral saturation indices indicate the water is undersaturated with gypsum and anhydrite, but saturated with calcite, dolomite, and aragonite. Groundwater chemistry is primarily influenced by ion exchange and rock weathering processes. The Water Quality Index (WQI) reveals that much of the groundwater is rated poor to unsuitable for drinking, largely due to high levels of sodium, EC, and bicarbonate. Similarly, the Irrigation Water Quality Index (IWQI) places most samples in the moderate to severe restriction category due to salinity and sodicity. These findings highlight the need for proper treatment before use.
Keywords:
hydrogeochemistry
; water quality index
; hydrogeochemical processes
; arid area
; merti aquifer
; ion exchange
1. Introduction
Ewaso Ng'iro-Lagh Dera basin is a water-stressed, arid region of Kenya where groundwater is the primary water source. The demand for groundwater is high due to the dry climatic conditions and limited surface water. This demand is expected to persist, especially in sub–Saharan Africa, where the projected population is anticipated to increase drastically [1]. The combined effects of climate change, pollution, population increase, and land use changes is causing an alarming decline in groundwater level and quality [2,3,4].
Agriculture plays a significant role in Kenya's economic growth [5]. The agricultural sector is largely carried out by small to medium-scale farmers who rely on the rainfall seasons [6] Unfortunately, the study area lies in an arid region with low and unpredictable rainfall [7]. This leads to farmers concentrating their activities along riverbanks [8]. It has been proposed that precision irrigated farming is needed to expand farming activities and food production sustainably [9]. Given that the rivers in the region are ephemeral, groundwater serves as a viable alternative to support agricultural activities.
The study area is one of the leading livestock production zones in Kenya, where pastoralism is the dominant practice [8]. Since the area experiences unreliable rainfall, livestock production heavily relies on groundwater resources. Therefore, groundwater is a critical resource in the region, necessitating sustainable utilization and management. One of the critical steps in the management and sustainable utilization involves understanding the hydrogeochemical and hydrogeological properties of the aquifer [10].
Numerous global studies highlight the critical role of understanding hydrogeochemistry in assessing groundwater quality [11,12,13,14,15]. The chemistry of groundwater is generally diverse [16]. However, groundwater quality has been observed to range from brackish to saline in most arid areas [11,17]. Therefore, assessing the hydrogeochemistry to understand the suitability of groundwater in arid regions is very important [18,19].
Generally, as groundwater flows from recharge to discharge areas, it chemically evolves as it interacts with aquifer materials or mixes with different groundwater bodies along the flow path [20]. The chemical evolution of the groundwater results from various processes such as dissolution, ion exchange, evaporation, and saline water intrusion [15,21]. The interaction of rocks with groundwater leads to the saturation of various mineral species at equilibrium conditions. Changes in the saturation states are helpful in the identification of the different geochemical reactions that control the groundwater and in deciphering the various stages of the hydrochemical evolution of the groundwater [12,14]. The calculation of the Saturation Index examines the chemical equilibrium of a specific mineral species.
Major ion chemistry determinations combined with the application of statistical methods have been used in groundwater studies to provide insight into the hydrogeochemical processes affecting the groundwater chemistry in an aquifer [16,22,23]. These statistical methods include bivariate regression analysis, correlation, and the calculation of ion ratio [21,22,24,25,26] and multivariate statistical methods such as Principal Component Analysis (PCA) [13,27,28]. PCA analysis is instrumental in helping to simplify diverse and complex relationships among various observed variables [29,30,31,32]. It is also helpful in identifying relationships and patterns in each dataset while highlighting similarities and differences [33,34,35]. Statistical methods complement the classical standard graphical methods, such as Piper and Scholler diagrams used to classify water facies and identify factors affecting groundwater quality in an aquifer [24].
The suitability of groundwater for drinking and agricultural purposes can be determined by applying the water quality indices (WQI). The WQI is a single, dimensionless numeric score that reports the water quality as a single score [36]. This numeric score was first used by Horton [37]. The calculation and the mode of deriving the WQI have been updated and applied by researchers such as Brown [38]; Ott [39]; Boah et al., [40]; Adimalla et al., [41]etc. The water quality data is often large and has many parameters to consider. The WQI is an important and effective tool that helps minimize the data into a single numeric value that is easy to understand, evaluate, and monitor [ 41].
The irrigation water quality index is applied to evaluate the suitability of groundwater for irrigation [42,43,44,45]. This tool combines various physical and chemical water quality variables into a single value representing the water quality level [43,46].
Several studies have been conducted on groundwater resources within the Ewaso Ngiro – Lagh Dera basin [47,48,49,50,51,52,53,54,55,56]. These studies have assessed the extent of the aquifers, established the spatial and temporal variation of various geochemical and geophysical parameters, modeled the groundwater flow, and investigated the groundwater recharge and discharge dynamics. Recharge in the study area has been noted to occur during the sporadic and episodic rainfall within inundation along the ephemeral rivers and the swamp [52,54]. The possibility of recent episodic recharge has been established using tritium and carbon isotope analysis carried out by [49,57,58,59]. However, the studies have not provided a detailed analysis of the ion chemistry necessary to interpret and identify the various hydrogeochemical processes affecting groundwater quality. Identifying these processes can substantially contribute to ensuring the sustainable management of groundwater resources. Therefore, this study's main objective was to identify and characterize hydrogeochemical processes that control groundwater chemistry and assess the groundwater's suitability for drinking and irrigation purposes.
2. Materials and Methods
2.1:. The Study Area
The Ewaso Ngiro-Lagh Dera basin is located in the Northeastern part of Kenya. It is bounded by longitudes 38° 10 ʺ E to 40° 60 ʺ E and latitudes 0° 05 ʺ S to 1° 45ʺ N (Figure 1). The study area is part of the large Ewaso Ng'iro basin (Figure 1) that covers part of Kenya, Ethiopia, and Somali. In Kenya, the Ewaso Ngiro River that drains the basin originates from the central parts of the country as a perennial river. It flows into the northeastern part of the country as an ephemeral river, extends into Somalia, and drains into the Indian Ocean. Climatically, the study area is an arid region with temperatures ranging between 22℃ and 33.4℃ and an average rainfall of about 250 mm per year. The rainy seasons occur biannually, one from April to June and another from October to December, with the latter being more significant [7]. Topographically, the area is mainly flat, with a few elevated grounds; the altitude ranges from 45m to 1543m above the mean sea level.
2.2:. Geology and Hydrogeology
Ewaso Ng'iro-Lagh Dera basin is located mainly within the Anza Basin, Kenya. Anza basin is an inactive continental rift system formed in the Mesozoic Era. The basin stretches inland from the coast of Kenya with a northwest-southeast trend [60,61,62]. Anza basin is filled with very deep (>3 Km) sediments. In the Mesozoic era, the basin experienced a period of marine incursion followed by a long period of uplift and erosion, which was later followed by the palaeo-Tethyan transgression of the Trans- Eritrean trough. Later in the Cenozoic era, extensive continental erosion led to bevelling in most parts of the study area, followed by periods of deposition in the Miocene and continued deposition and peneplanation in the Pliocene [63].
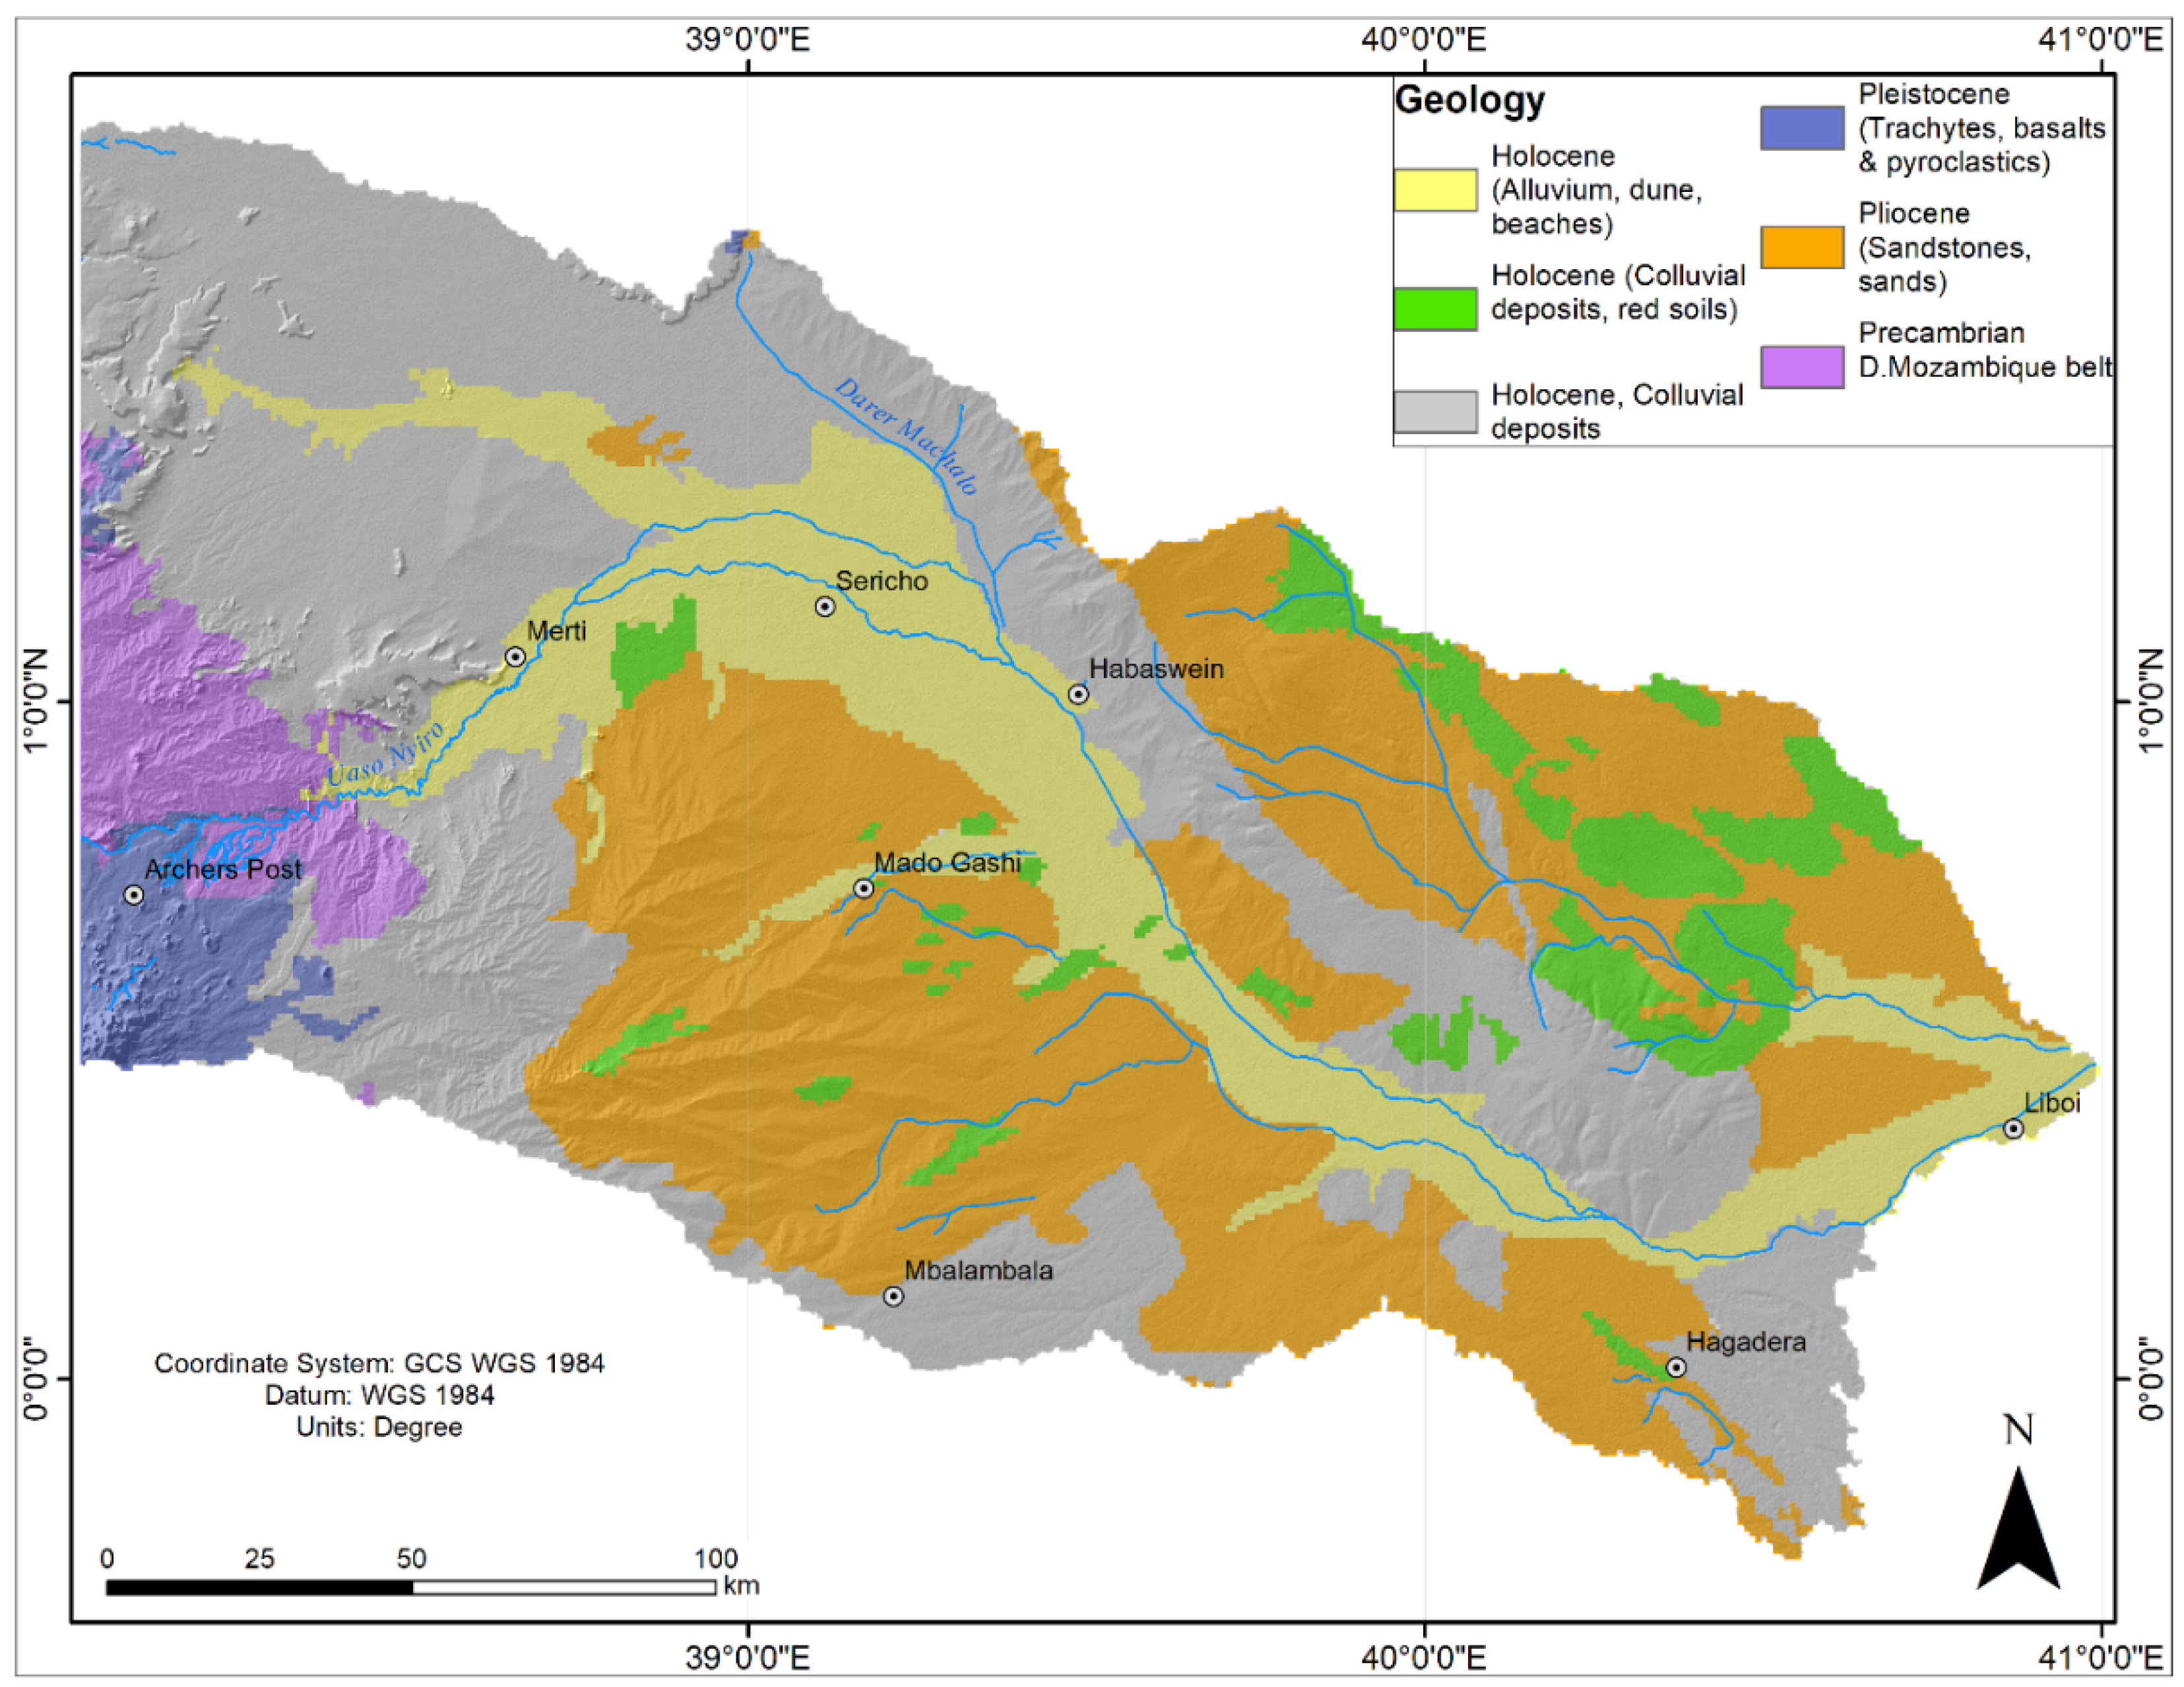
The exposed lithologies of the Anza basin are Pliocene sediments consisting of sandstone, conglomerates, siltstone, sand, grits, gravel, and clays. The Holocene colluvium consists of gravel, silts, and sands, whereas the Holocene alluvium consists of clays, sand, and silts. Lithologies that do not belong to the Anza basin are the Precambrian metamorphic and the Quaternary volcanic rocks occurring in the western and southwestern part of the study area, respectively. The metamorphic rocks consist of metamorphosed components of calcareous rocks, semi-pelitic sedimentary rocks, intrusive rocks, and psammitic sediments [64]. The Quaternary volcanic rock prevalent in the study area is the olivine basalt of the Pleistocene Epoch (Figure 2).
Since the study area occurs within the Anza basin trough, deep-seated faults are the main structural features [63]. Most of these faults are deep structures (> 0.8 Km below ground level) and are therefore concealed by various superficial unconsolidated sediments and volcanic rocks of Quaternary age [61,65]. However, the overlying formation mimics the deep structures, forming thick layers as the sediment accumulates in the depressions. It has, therefore, been hypothesized that they impact the occurrence and flow of groundwater in the area. In addition, there is a postulation that these structures influence the recharge and discharge of the freshwater lens of the aquifers in the study area [56].
Figure 2.
The geology of the study area adopted from the Geological Map, Geostructural, and Bouguer gravity map of Kenya (National Oil Corporation Kenya (NOCK) [66]).
Figure 2.
The geology of the study area adopted from the Geological Map, Geostructural, and Bouguer gravity map of Kenya (National Oil Corporation Kenya (NOCK) [66]).
Hydrogeologically, the principal aquifer in the study area is the Merti aquifer. The aquifer is comprised of fresh water along the Lagh Dera river axis. Salinity increases away from the river axis [49]. It stretches from Habaswein to Liboi (on the Kenya - Somalia border) with an aerial geographical extent of approximately 20,000 square Kilometers. Merti aquifer is a multilayered aquifer [48,54], with a shallow aquifer occurring at an average depth of 20 m, constituted mainly of alluvial and colluvial deposits. A deeper aquifer occurs at an average depth of 80 m below ground level, primarily comprising weathered sandstone, gravel, sand, clay, and limestones [50].
2.3. Sampling and Analysis
One hundred and twenty-nine water samples were collected from the aquifer in the study area to analyze major ion chemistry in December 2021. The samples were taken from the boreholes using already installed pumps. After pre-rinsing the bottles with the water sample, 500 ml polyethylene bottles were used to collect the final water samples. The water samples were collected in duplicates; one sample was used to analyze major anions, while the other was treated with nitric acid (HNO3) to a pH of less than 2 for analysis of major cations. Cations analyzed were Na+, K+, Ca2+, and Mg2+ while anions were HCO3-, SO42-, NO3-, and Cl-. The pH and Electrical Conductivity (EC) were measured in the field using a portable conductivity, salinity, and pH meter, and the location of the sample was recorded using Garmin GPS. The collected samples were then taken to the laboratory for analysis. The major cations were analyzed using Inductively Coupled Plasma Optical Emission Spectroscopy (ICP-OES) methods (ISO 2007)[67]. The major anions were analyzed using colorimetric methods apart from HCO3- which was determined using the titration method with hydrochloric acid.
The dataset used in this study had a charge balance error range of ±5%, the standard limit allowed [25,26]. The error was computed based on the analyzed ions expressed in milliequivalent per liter (Meq/L). The analyzed ions in the groundwater were plotted on a Piper diagram [68] to characterize the groundwater into the different water types. Interpretations were made for the various wall rock deductions, and data was displayed using geochemical plots. Saturation Index (SI) was calculated using PHREECQ geochemical modeling software. The saturation index (SI) indicates the status of a mineral phase reaction, whether it is dissolving or precipitating [16]. It is, therefore, used to determine the equilibrium state of the groundwater with respect to the mineral phase using Eq. 1.
SI = log (IAP/Ksp(T))
Where ion activity product (IAP) is the product of the ion activity coefficient with composition concentration, and Ksp(T) is the equilibrium constant at sample temperature T [69].
The saturation Index quantitatively indicates the sampled water's deviation from the equilibrium [70]. If the groundwater is at equilibrium SI = 0; if the groundwater is under saturated SI<0; and if SI>0, then the water is supersaturated with respect to the mineral facies and may represent the precipitation phase [71].
Statistical techniques such as bivariate analysis was used to understand the relationship between the parameters. Bivariate analysis reveals an association's existence, strength, or the presence of differences between the two variables [72,73]. This study used bivariate regression and correlation. The correlation (r) was used to determine the linear relationship between two physiochemical parameters. In addition, PCA, a multivariate statistical method [29], was applied.
The suitability of the groundwater for human drinking purposes was assessed by comparing the sample-measured parameter with the World Health Organization (WHO) 2017 guideline values [74] and Water Services Regulatory Board of Kenya (WASREB) [75] (Table 3) . The drinking suitability for livestock was compared with the Food and Agriculture Organization (FAO) 2016 guidelines [76].
Drinking water suitability was also anaysed using the water quality index (WQI) obtained using the parameters assessed in this study. The tool used in this analysis was a weighted arithmetic water quality index whose procedure involved four main steps.
- Selections of the parameters. In this study, the parameters were EC, TDS, pH TH, Na+, Ca2+, Mg2+, K+, HCO3-, Cl-, SO42-, and NO3-.
- Assigning of weights of the parameters (Wi). The assigning of the weight took into consideration the influence of the parameter on water quality and the weight rating of studies carried out in similar settings [77,78]. The weighting ranged from 2 – 5. The highest weight of 5 was awarded TDS, and NO3-. EC, pH, and SO42- were awarded a weight of 4, HCO3- and Cl- were awarded a weight of 3, whereas Na+, Ca2+, Mg2+, K+, and TH were awarded a weight of 2. Relative weights(wi) for the ith parameter and n number of parameters was then calculated using the formulae (Eq. 2).wi represents the relative weight of the parameter, and Wi is the assigned weight of each parameter.
-
Calculation of the quality rating (Qi) of each of the parameters using the formulae (Eq. 3).Where Ci is the measured concentration of each of the parameterSi is the permissible standard guideline value for the parameter; for this study, the WHO (2017) (Table 3) standards were considered.
- Calculation of the overall water quality index using the equation 4
Where SIi is given using the equation 5
The calculated WQI values ranges from 0 to values greater than 100. These values are then categorized into five rating classes with values close to zero having excellent water quality and values greater than 100 being the unsuitable water quality (Table 7).
The irrigation water quality index (IWQI) was used to determine the suitability of the groundwater for irrigation. The procedure for calculating the IWQI is similar to the one used in WQI. Here, the parameters influencing salinity, sodium hazard, and toxicity were considered: EC, Sodium Adsorption Ratio (SAR), and Na+, Cl-, and HCO3- concentration.
The EC helps evaluate the salinity, and The Cl- and HCO3- ion concentrations help evaluate the toxicity.
The concentration of Na+, and SAR measures the hazard of sodium. SAR can be determined using Eq. 2
Where Na+, Ca2+, and Mg2+ are expressed in Meq/L
After identifying the parameters to consider relative weights, wi was assigned to each parameter depending on the parameter's impact on irrigation. The weights assigned to the parameters were according to [79] (Table 1).
The next step was to calculate the quality rating (Qi) for each parameter according to [80]. (Table 2) by applying the equation 7.
Where is an upper limit of the last class of each parameter, is the observed value of chemical parameters, is the minimal limit of the class to which each parameter belongs, is the class amplitude, and is an upper limit of the last class of each parameter.
The irrigation water quality index is calculated using equation 8
Where represents the parameter’s quality measurement, ith is the number between 1 and 100 representing the concentration of the parameter, and wi is the normalized weight of the ith parameter. Results of IWQI are values ranging from 0- 100 and are categorized into five categories (Table 9)
3. Results
3.1. Evaluation of Geochemistry
The pH level of the water samples analyzed ranges between 7.1 and 8.9, indicating that the groundwater is neutral to slightly alkaline. The electrical conductivity (EC) of the groundwater ranges from 419.8 to 18000.0 μS/cm (Table 3). The average EC of the collected samples in the study area is 1937.0 μS/cm. Based on the EC values, the groundwater system can be classified into three groups: freshwater (<1500 μS/cm), brackish water (1500–3000 μS/cm), and saline water (> 3000) [82]. Of 129 samples analyzed, 62.0% are freshwater, 25.6% are brackish water, and 12.4% are saline water. Therefore, the groundwater in the study area is largely fresh and brackish. The Total Dissolved Solids (TDS) range from 313.8 to 8366.0 mg/L with an average of 1422.9 mg/L (Table 3).
Na+ is the most abundant cation in the groundwater, and the sequence of the relative abundance of the cations is Na+ > Ca2+ > Mg2+ > K+. The most abundant anion is HCO3-- and the sequence of the relative abundance of the anions in the basin is HCO3- > Cl- > SO42- > NO3-. Na+ concentration ranges between 10.4 – 3410.0 mg/L with a median of 221.0 mg/L. The concentration of Ca2+ in the groundwater varies from 2.8 to 233.0 mg/L, with a median of 20.0 mg/L. The Mg2+ concentrations ranged from 1.0 to 151.0 mg/L, and the median concentration of 11.1 mg/L. The K+ concentration in the groundwater ranges from 2.0 to 83.0 mg/L, with a median of 11.0 mg/L. The concentration of HCO3- ranges from 109.2 to 4779.2 mg/L, with a median of 560.5 mg/L. Cl-ion concentration ranges from 2.0 to 4300.0 mg/L, with a median of 60.0 mg/L. SO42-concentration varies from 3.0 to 1230.0 mg/L, and a median of 35.3 mg/L. NO3- concentration in the study area varies from 0.0 to 129.9 mg/L, with a median of 1.1 mg/L (Table 3).
The major ions were illustrated graphically using the Piper diagram [68] (Figure 3). The diagram shows that the alkaline earth elements dominate, i.e.; Na+ + K+ > Ca2+ + Mg2+, and weak acidic anions exceed strong acidic anions, i.e.; HCO3-> Cl- + SO42-. Most of the groundwater samples are Na+ + K+ and bicarbonate types. Therefore, the dominant water facies are Na-HCO3, which accounts for 45.74 % of the collected samples. Other facies present are Na-HCO3-Cl, Na-Mg-HCO3, Na-Ca-HCO3, Na-Cl-HCO3, Na-Cl, Na-HCO3-SO4, Na-Mg-Cl-HCO3, Na-Ca-Mg-HCO3-Cl, Na-Ca-HCO3-Cl, Na-Mg-HCO3-Cl, with percentage abundance of 17.83%, 11.63 %, 3.88%, 3.88%, 2.33%, 2.33%, 2.33%, 1.55%, 1.55%, and 1.55%, respectively. Ca-Na-HCO3-NO3, Na-Ca-Cl-HCO3, Ca-Na-HCO3, Ca-K-HCO3, Na-Ca-Mg-HCO3, Mg-Na-Ca-HCO3-Cl and Mg-Na-HCO3 were all represented by 0.78%

Table 3.
Summary statistics of the measured parameters in the study area.
| Units | Min | Max | Median | Average | Maximum allowable limit (WHO 2017) |
Maximum allowable limit (WASREB-KENYA 2016) |
Percentage Number of samples above (WHO) acceptable limit | |
|---|---|---|---|---|---|---|---|---|
| PH | - | 7.1 | 8.9 | 7.7 | 7.9 | 8.5 | 8.5 | 13.3 |
| EC | μS/cm | 419.8 | 18000.0 | 1232.2 | 1937.0 | 1500 | 1500 | 36.0 |
| TDS | Mg/l | 313.8 | 8366.0 | 912.0 | 1422.9 | 1000 | 1500 | 25.4 |
| HCO3- | Mg/l | 109.2 | 4979.2 | 560.5 | 767.7 | 300 | 500 | 85.3 |
| Cl- | Mg/l | 2.0 | 4300.0 | 60.0 | 217.1 | 600 | 250 | 5.3 |
| SO42- | Mg/l | 3.0 | 1230.0 | 35.3 | 89.5 | 400 | 400 | 5.3 |
| NO3- | Mg/l | 0 | 129.9 | 1.1 | 5.5 | 50 | 10 | 1.4 |
| Na+ | Mg/l | 10.4 | 3410.0 | 221.0 | 416.9 | 200 | 200 | 49.3 |
| K+ | Mg/l | 2.0 | 83.0 | 11.0 | 12.7 | 20 | 20 | 10.7 |
| Ca2+ | Mg/l | 2.8 | 233.0 | 20.0 | 26.5 | 200 | 250 | 2.7 |
| Mg2+ | Mg/l | 1.0 | 151.0 | 11.1 | 18.2 | 150 | 100 | 2.7 |
| TH | Mg/l | 11.6 | 1125.4 | 11.6 | 120.7 | 500 | 500 | 1.4 |
| SI Calcite | Mg/l | -0.4 | 1.6 | 0.4 | 0.4 | N/A | N/A | N/A |
| SI dolomite | Mg/l | -1.0 | 3.2 | 0.9 | 0.9 | N/A | N/A | N/A |
| SI aragonite | Mg/l | -0.5 | 1.4 | 0.3 | 0.3 | N/A | N/A | N/A |
| SI Anhydrite | Mg/l | -3.9 | -1.8 | -2.9 | -2.9 | N/A | N/A | N/A |
| SI gypsum | Mg/l | -3.7 | -1.6 | -2.7 | -2.7 | N/A | N/A | N/A |
| SI Halie | Mg/l | -8.8 | -4.4 | -6.9 | -6.9 | N/A | N/A | N/A |
| Na+/Cl-ratio | 1.0 | 306.6 | 5.6 | 22.7 | N/A | N/A | N/A | |
| CAI 1 | -306.7 | -0.01 | -4.9 | -22.2 | N/A | N/A | N/A | |
| CAI 2 | -1.1 | -0.01 | -0.7 | -0.7 | N/A | N/A | N/A |
3.2. Processes Controlling the Groundwater Chemistry
Chemical changes occur to groundwater as it moves within/through the aquifers. These changes occur because of various processes such as rock interactions, groundwater residence time in the aquifer, seawater intrusions, and ion exchange processes. The processes usually lead to solute acquisition by the groundwater, which generally reflects an increase in the TDS and EC. A p×p correlation matrix of the 11 analyzed parameters was carried out (Table 4) to decipher and identify the various processes. The good correlation between TDS with Sodium (r= 0.93), sulphate, (r = 0.83), bicarbonate (r= 0.77), and chloride (r= 0.66), indicates that these ions contribute to groundwater mineralization. The low correlation between TDS with potassium r = 0.14), calcium (r = -0.08), magnesium (r = -0.06), and nitrate (r = -0.06) indicates that the ions do not have a very high impact on groundwater mineralization.
3.2.1. Water-Rock Interaction and Origin of Groundwater Mineralization
The interaction of water in an aquifer with host rocks is one of the essential processes that cause groundwater solute acquisition. In most arid areas, the dissolution and deposition of
reactive minerals such as calcite, dolomite, and halite are prevalent [26].
Sodium (Na⁺) was identified as the dominant cation in the study area, primarily attributed to silicate weathering as its geogenic source. The higher abundance of sodium compared to chloride ions in the groundwater (Table 3) supports this hypothesis [26,83]. The Na⁺/Cl⁻ ion ratio is a useful indicator of the silicate weathering process. A ratio greater than one suggests that sodium in the groundwater originates from silicate minerals.
The analyzed groundwater samples exhibited Na⁺/Cl⁻ ratios ranging from 1.0 to 306.6, with an average of 22.7 (Table 3). Notably, all of the samples had a ratio exceeding one, strongly indicating silicate weathering as a significant process. Additionally, the reaction of feldspar minerals with carbonic acid in the presence of water releases bicarbonate (HCO₃⁻) [21], implying that HCO₃⁻ should be the dominant anion [84]. Consistent with this, the groundwater in the study area is indeed dominated by HCO₃⁻ anions.
Thus, silicate weathering plays a significant role in contributing sodium to the groundwater. While halite dissolution could also introduce Na⁺ and Cl⁻ ions, no halite deposits have been identified in the study area, making this an unlikely source.
Carbonate dissolution and precipitation play a significant role in influencing the groundwater chemistry of the study area. The dissolution of carbonate minerals such as calcite, dolomite, and aragonite occur when rainwater comes into contact with carbonate rocks. A few water samples align with the calcite and dolomite dissolution trend (Figure 4). Furthermore, the region contains abundant limestone and dolomite formations [47], making carbonate dissolution a likely source of Ca²⁺, Mg²⁺, and HCO₃⁻ ions in the groundwater. Several groundwater samples exhibited negative saturation indices (Figure 5(a)), indicating the potential for active dissolution processes. The chemical reactions shown in equations 9 and 10 can describe these processes.
Calcite dissolution. CaCO3 + H2O + CO2 → Ca2+ + 2HCO3 -
Dolomite dissolution --CaMg (CO3)2 + 2H2O + 2CO2 → Ca2+ + Mg2+ + 4HCO3−
Positive saturation indices in most samples (Figure 5(a)) indicate supersaturation, suggesting that excess carbonates are likely precipitating. This further indicates that the groundwater has significantly interacted with the carbonates and reached a mature geochemical state. The widespread occurrence of calcrete in the study area [47] supports the hypothesis that the groundwater system favors carbonate precipitation processes.
The gypsum dissolution could be interpreted as the source of SO42-, which has a high correlation with the TDS (0.83; Table 4). However, the low correlation between Ca²⁺ and SO₄²⁻ ions (r² = 0.11) (Table 4) suggests that there are minimal dissolution processes of anhydrite and gypsum in the groundwater system. Further, the bivariate plot of Ca²⁺ versus SO₄²⁻ (Figure 6) indicates that some samples align with the gypsum dissolution line (1:1 equiline). The negative saturation indices for gypsum and anhydrite (Figure 5 (b)) indicate that these minerals are under-saturated, making dissolution likely if gypsum is present. Substantial gypsum deposits have been documented near the study area [85]. It was, therefore, interpreted that even though there is the likelihood of the dissolution of gypsum and anhydrite, it may not be the primary contributing geochemical process to the enrichment of the SO4 ions. Other processes, such as the mixing of the groundwater with saline water, were therefore postulated.
Fresh-saline water mixing
The principal aquifer in the study area is the fresh-brackish Merti aquifer, bounded laterally and vertically by saline water aquifers [47]. At greater depths, the Paleo saline aquifer, characterized by Na-Cl water facies, may result from prolonged residence time within the aquifer [49,52]. Laterally, the increase in salinity is attributed to the low transmissivity of the geological materials and the gradual rise in anionic concentrations along the groundwater flow path, following the Chebotarev sequence (eq. 11). [16,86].
Travel along flow path----------+
HCO3- → HCO3- + SO42- → SO42- - + HCO3- → SO42- + C1- →C1- + SO42- → C1-
Increasing age---------+
Luedeling et al., [87] postulated that the groundwaters in the study area continually become saline through fresh-saline water mixing. This study evaluated the extent of salinization using the Cl-/ HCO3- ratio. The ratio classifies the water into five classes: good quality (< 0.5), slightly contaminated (0.5 – 1.3), moderately contaminated (1.3 – 2.8), highly contaminated (2.8 – 6.6), and extremely contaminated (6.6 – 15.5) [88,89]. This ratio was considered because the chloride ion is stable and a good proxy for TDS [90]. The results show that 81.4 % of the groundwater is of good quality, with a ratio of less than 0.5. 11.6 %, 5.4 %, 0.7 %, and 0.9% represent slightly, moderately, highly, and extremely contaminated groundwater, respectively (Table 5). The extremely contaminated reflects the Na-Cl facies located at the saline zones.
Ion exchange
Ion exchange is another important process that controls the relative concentration of ions in the groundwater [70]. If Na+ + K+ replaces Ca2+ + Mg2+, the ion exchange process is referred to as cation ion exchange, and if Ca2+ + Mg2+ replaces Na+ + K+, the process is referred to as reverse ion exchange [91].
A major indicator of ion exchange is the Chloralkaline indices, as described by Schoeller [92]. The Chloralkaline indices 1 and 2 (CAI 1 and 2) help to understand the ion exchange process between the groundwater and the host environment. These indices are calculated using Equations 12 and 13, and the results are as in Table 3:
(These indices are expressed or are calculated in Meq/L). The CAI1 and CAI2 are negative when cation ion exchange occurs. In such cases, the Ca2+ / Mg2+ in the water is exchanged with Na+/ K+ in the host environment, creating a chloro-alkaline disequilibrium [70]. Conversely, a positive index indicates a reverse ion exchange between Na+ or K+ with Mg2+ or Ca2+ in the groundwater [13,32,69,93]. All the samples have negative CAI 1 and CAI 2 indices (Figure 7 and Figure 8 respectively), implying that cation ion exchange is the dominant process.
The bivariate plot of (Ca2+ + Mg2+) – (HCO3- + SO42-) as a function of (Na+ + K+ – Cl-) provide evidence of the cation exchange. Data would be plotted at the origin if the ion exchange was not a significant process in the aquifer system. In cases where the cation exchange is a major controlling process, the two parameters plot linearly with a slope of -1 [32,69]. Figure 9 shows that the analyzed samples have a linear relationship with a slope of – 0.94. Therefore, an increase in Na+ + K+ is related to a decrease in Ca2+ + Mg2+ or an increase in HCO3- + SO42-. Hence, Ca2+, Mg2+, and Na+ participate in the cation exchange [94].
3.2.2. Principal Component Analysis (PCA)
In analyzing the groundwater of a large basin, one is faced with the complexity associated with many measured variables. Therefore, in this study, PCA was used to recognize the pattern that explains the variance in the intercorrelated variables. PCA helps to show an association between variables, thus reducing the dimensionality of the data set. This analysis, therefore, reduced the measured parameters into four factors. Among these factors, two factors with eigenvalues >1 were extracted. These two factors accounted for 68.44% of the total variance of the dataset. Factors F1 (44.06%) and F2 (24.38%) account for most of the total variance in the original dataset (Table 6).
The results indicate that Factor 1 (F1) accounts for the highest variance, at 44.06% (Table 6). This variance is primarily influenced by electrical conductivity (EC), total dissolved solids (TDS), and the concentrations of Na⁺, HCO₃⁻, Cl⁻, and SO₄²⁻, suggesting a strong interrelationship among these variables. This implies that EC and TDS correlate highly with Na⁺, HCO₃⁻, SO₄²⁻, and Cl⁻. Therefore, F1 is primarily governed by geogenic processes, including cation exchange, silicate weathering, and carbonate dissolution. Additionally, the interaction between freshwater and saline water, along with the prolonged residence time of groundwater within the aquifer, contributes to the elevated ion concentrations. Furthermore, the dissolution and precipitation of calcite and dolomite mineral phases play a significant role in regulating the concentrations of HCO₃⁻.
Factor 2 (F2) accounts for 24.38% of the total variance and is primarily influenced by the concentration of Ca²⁺, Mg²⁺, K⁺, and NO3- (Table 6). In this factor, calcium, potassium, and magnesium could be attributed mainly to the weathering of silicate minerals in the aquifer. The high factor loading of Ca²⁺, Mg²⁺, K⁺, and NO3- could also indicate contamination of the aquifer through agricultural practices.
Additionally, it was noted that the pH influences occur in factor (F4), which also has moderate factor loadings of HCO₃⁻, suggesting that the geogenic buffering characteristics of the carbonate aquifer strongly influence F2. In carbonate aquifers, the carbonate equilibrium system provides significant pH buffering capacity. When acidic water infiltrates an aquifer rich in calcite minerals, the calcite dissolves, releasing carbonate ions into the groundwater. If the pH drops below 10.3, the carbonate ions react with hydrogen ions, effectively neutralizing acidity and stabilizing the pH. Conversely, an increase in carbonate ion concentration can lead to calcite precipitation, reducing the carbonate ion levels. In response, some bicarbonate ions (HCO₃⁻) may deprotonate, counteracting further pH increases and maintaining chemical equilibrium.
This buffering process is represented by the equation 14.
Therefore, the analysis indicates that Factor 2 is primarily governed by the interplay of silicate weathering and carbonate equilibrium processes within the aquifer, highlighting their crucial role in maintaining groundwater chemical stability.
Table 6.
Factor loading of principal component analysis.
| F1 | F2 | F3 | F4 | |
| EC | 0.879 | 0.027 | 0.009 | 0.011 |
| TDS | 0.908 | 0.052 | 0.015 | 0.001 |
| Cl- | 0.683 | 0.087 | 0.032 | 0.107 |
| SO42- | 0.838 | 0.002 | 0.001 | 0.014 |
| NO3- | 0.021 | 0.410 | 0.390 | 0.001 |
| HCO3- | 0.434 | 0.130 | 0.018 | 0.187 |
| Na+ | 0.974 | 0.001 | 0.007 | 0.006 |
| K+ | 0.054 | 0.364 | 0.327 | 0.106 |
| Ca2+ | 0.014 | 0.724 | 0.017 | 0.005 |
| Mg2+ | 0.013 | 0.713 | 0.018 | 0.079 |
| pH | 0.030 | 0.171 | 0.227 | 0.431 |
| Eigenvalue | 4.847 | 2.682 | 1.060 | 0.948 |
| Variability (%) | 44.062 | 24.380 | 9.634 | 8.617 |
| Cumulative % | 44.062 | 68.442 | 78.077 | 86.693 |
3.3. Drinking Water Quality
The suitability of the groundwater for drinking was evaluated by comparing it with the drinking water guidelines provided by the World Health Organization (WHO) [74] and Water Services Regulatory Board of Kenya (WASREB KENYA 2016) [75]( - Table 3). The maximum recommended limit in the WASREB recommendations is less than or equal to that of WHO recommendations, apart from the concentrations Cl-, Mg2+, and NO3-. This study, therefore, applied the WHO standard to assess the limits of the parameters because it is universally acceptable. Only HCO3- and Na parameters had a high percentage of samples exceeding the WHO maximum allowable limit, with 85.5% and 49.3%, respectively.
Water Quality Index (WQI)
Since many parameters need to be considered while assessing suitability for drinking purposes, drinking WQI, which is a calculated single value, was used. According to results in Table 7, only 23.26% of the samples are of good quality and suitable for drinking. Most of the samples have a poor rating, with 20.15 % being unsuitable for drinking.
Good drinking water quality occurs mainly in the central part of the study area along the Lagh Dera river (Figure 10). With increasing distance from the river, the water quality becomes poor to unsuitable.
Table 7.
Drinking water index rating class and percent sample representation.
| WQI | Rating class | Percent of samples |
|---|---|---|
| 0 -25 | Excellent | 0 |
| 26 -50 | Good | 23.26 |
| 51 - 75 | Poor | 44.19 |
| 76 - 100 | Very poor | 12.4 |
| >100 | Unsuitable | 20.15 |
The economic activity practiced by the residents in the study area is mainly pastoralism [7]. Therefore, it is vital to assess the suitability of the water for livestock consumption to prevent poisoning from toxic solutes, salt imbalances, and even diseases [95]. Unlike human drinking water standards, livestock water quality standards allow for higher salinity levels and total dissolved solids (TDS) [96]. TDS is the main parameter considered when assessing the suitability of water for livestock farming. Based on the FAO livestock drinking water standard, values less than 4000 mg/L and between 4000 - and 5000 mg/L are very satisfactory and satisfactory for most livestock apart from poultry in which values greater than 3000 mg/L are unfit [76]. The analyzed TDS values in the study area ranged from 313.8 mg/L to 8366.0 mg/L. 93.7% of the analyzed water had values less than 4000 within the permissible range for most livestock. Only 7.8% of the analyzed samples had TDS value greater than 3000 mg/L, therefore, deemed unfit for poultry consumption. Therefore, groundwater in the study area is mostly suitable for livestock consumption.
3.4. Irrigation Water Quality
Groundwater is the primary source of irrigation water in arid areas. Therefore, careful assessment of the water's suitability for irrigation projects is critical as it influences the mineral availability to the soils and plants, soil structure, and permeability of the soils [10] suitability of groundwater for agriculture is evaluated using the sodium adsorption ratio (SAR).
The calculated SAR values in the study area range from 0.7 to 516.4. The standard values of SAR are according to Richards [97] (Table 8). From the analysis, only 39.54% and 17.83 % of the analyzed groundwater samples can be used for irrigation as they fall into the excellent and good categories, respectively. However, 9.33% and 33.33 % of the sampled groundwater cannot be applied for irrigation as this water is categorized as doubtful and unsuitable, respectively (Table 5). The Wilcox diagram [98] (Figure 11) shows that approximately 45 % of the samples have low to medium (S1 and S2) SAR hazards. However, approximately more than 80% of the analyzed samples plotted in the C3 and C4 indicated high salinity (EC) hazard.
Irrigation Water Quality Index (IWQI)
The irrigation water index was used to assess the suitability of groundwater in the study area for irrigation purposes. The results indicate that most of the groundwater in the study area is unsuitable for irrigation, with only 12.4% having moderate restrictions (Table 9). The rest of the groundwater has high to severe restrictions, with 45.7% and 41.9%, respectively. Most of the groundwater with severe restriction for irrigation are in the north-northeastern part of the study area (Figure 12) whereas those with moderate and high restriction occurs along the Lagh Dera river. The moderate restriction IWQI water is applicable in waters with high permeability with moderate leaching salts [80,81]. Similarly, the high restriction water can be applied in highly permeable soils with no compact layers. The high restriction water should not be applied to soils under normal conditions [80].
Table 9.
Irrigation water quality index characteristics [79].
Table 9.
Irrigation water quality index characteristics [79].
| Water use restrictions | IWQI | |
| No restriction (NR) | 85-100 | 0 |
| Low restriction (LR) | 70-85 | 0 |
| Moderate restriction (MR) | 55-70 | 12.4 |
| High restriction (HR) | 40-55 | 45.7 |
| Severe restriction (SR) | 0-40 | 41.9 |
4. Discussion
The principal aquifer in the study area, known as the Merti Aquifer, exhibits unique groundwater chemistry influenced by geological and hydrological processes. Groundwater in this aquifer predominantly has a neutral to alkaline pH, consistent with findings from prior studies [49,52,54,58,85]. Elevated electrical conductivity (EC) and total dissolved solids (TDS) levels suggest significant mineralization, classifying the groundwater as fresh to brackish. The observed mineralization follows the Chebotarev sequence, where dissolved solutes increase laterally from the rivers and with depth, reflecting groundwater aging [48,52]. The aquifer's multilayered lithology includes weathered sandstone, limestone, gypsum, sand, silt, gravel, and clay-rich materials, which contribute to its diverse water chemistry [48,54].
The study area's groundwater chemistry is significantly influenced by rock weathering. The dissolution of gypsum contributes SO₄²⁻ and Ca²⁺, while silicate weathering provides Na⁺ and Mg²⁺. Carbonate weathering further adds Ca²⁺, Mg²⁺, and HCO₃⁻ ions. In addition, positive saturation indices for calcite, dolomite, and aragonite mineral phases indicate supersaturation, supporting the role of precipitation in regulating Ca²⁺, Mg²⁺, and HCO₃⁻ abundance [91].
Cation exchange also plays a critical role, as evidenced by the abundance of HCO₃⁻ and the dominance of Na-HCO₃ water facies in the aquifer. This process occurs when fresh recharge water interacts with paleo-sodium-rich brine, replacing Ca²⁺ and Mg²⁺ with Na⁺ [99]. This exchange explains the observed water chemistry in areas where recharge from the Lagh Dera River, rich in Ca-HCO₃ water, freshens saline Na-Cl water in the aquifer. Shallow wells in the southwestern study area and downstream sections of the Lagh Dera River also display Ca/Mg-HCO₃ water facies, indicative of young, fresh recharge water [49,52].
It was noted that since the study area's aquifer largely contains clay, the carbonate equilibrium and cation exchange processes provide adequate buffering capacity for pH. Additionally, the incongruent weathering of silicate minerals can further contribute to pH buffering, leading to an increase in sodium (Na⁺) and bicarbonate (HCO₃⁻) ions in the groundwater [100]. The current study observed that Na⁺ and HCO₃⁻ concentrations are relatively high and strongly correlate with electrical conductivity (EC) and total dissolved solids (TDS). In contrast, magnesium (Mg²⁺) and calcium (Ca²⁺) exhibit a weaker correlation with EC and TDS, suggesting that precipitation and ion exchange processes are actively influencing the groundwater system.
Overexploitation of the aquifer could lead to saline water intrusion or upconing, as noted by Luedeling et al., [87]. Still, this phenomenon remains minimal, with only 18.6% of groundwater samples indicating saline contamination (Table 5).
Most groundwater samples in the study area have elevated TDS, EC, Na+, and HCO3- values over the WHO guidelines (2017) maximum allowed limits. The high solute concentration of groundwater has deemed most of the groundwater unfit for human consumption, with only 23.26% having a good water quality index. Most of the groundwater with good WQI occurs along the river Lagh Dera due to its proximity to the recharge area [56] and the availability of transmissive aquifer materials [54]. The transmissivity has been observed to decrease laterally away from the Lagh Dera river axis, and this could be a likely reason for poor water quality. Furthermore, most of the groundwater in these zones is very old water [49], and the long residence time could be the major source of solute acquisition and, subsequently, poor drinking water quality. Since groundwater is the primary source of potable water, proper treatment such as desalination should be done to ensure community health. The dwellers in the study area are nomadic pastoralists, and most groundwater water is suitable for livestock consumption according to FAO (2016) standards. Concerning irrigation, most of the groundwater had high salinity and alkalinity, as exemplified by the high SAR indices, and therefore, was unsuitable for irrigation purposes. Moreover, with regard to the irrigation water quality index, most of the groundwaters were classified into the high and severe restriction categories. The severity pattern is similar to that of drinking water quality index with less severe groundwater occurring along the Lagh Dera with severity increasing laterally along the river axis. This poor quality was interpreted to be as a result of long groundwater residence time, poor transmissivity of the aquifer materials and increasing distances to zones of groundwater recharge [49,54,56]. Prolonged application of saline water for irrigation can cause poor soil permeability. Furthermore, saline water may affect the osmotic activities, inhibiting crop germination and growth [101,102]. Hence, water treatment, such as desalination, and soil treatment, such as the addition of gypsum, are essential if irrigation is carried out. Adding gypsum may help prevent sodium from displacing the adsorbed calcium and magnesium in the soil, which causes damage to the soil structure [103,104].
5. Conclusions
This study successfully achieved its objectives by identifying the primary geochemical processes influencing groundwater in the Ewaso Ngiro–Lagh Dera basin. The groundwater is predominantly fresh to brackish, with Na-HCO₃ as the dominant water type. Sodium (Na⁺) is the most abundant cation, while bicarbonate (HCO₃⁻) is the most abundant anion. Groundwater chemistry in the study area is shaped by natural processes such as ion exchange, silicate weathering, calcite, dolomite dissolution, gypsum dissolution, and mixing fresh and saline water.
The findings of this study enhance our understanding of how hydro geochemistry affects groundwater quality in the basin. An assessment of drinking water quality based on WHO (2017) standards indicates that the average levels of TDS, Cl⁻, SO₄²⁻, Ca²⁺, Mg²⁺, and total hardness (TH) are within permissible limits. However, elevated EC, HCO₃⁻, and Na⁺ values render some groundwater to have poor to unsuitable drinking WQI rating.
Irrigation suitability, assessed using SAR, reveals moderate to high salinity and alkalinity hazards in the groundwater. The IWQI rating of groundwater calculated using EC, SAR, Cl⁻, HCO₃⁻, and Na⁺ concentration showed that groundwater is mostly in the mostly in the moderate – severe restrictions categories. Consequently, most groundwater samples are not suitable for irrigation without proper management. This study recommends: (1) Careful management and treatment are necessary to utilize groundwater for domestic and agricultural purposes safely. (2) Farming practices should focus on crops tolerating high salinity levels. (3) Regular groundwater quality monitoring is essential to understand spatial and temporal variations, enabling sustainable groundwater management in the basin. We also recommend further studies investigating groundwater salinization processes in the aquifer using advanced geochemical and isotopic techniques. This will provide deeper insights into salinization mechanisms and support long-term groundwater sustainability in the region.
Author Contributions
Githinji Tabitha Wambui: Conceptualization, Investigation, methodology, formal analysis, data curation, and writing of the original draft paper. Dindi Edwin Wandumbi: Visualization, Supervision writing, review, and editing. Kuria Zacharia Njuguna: Visualization, methodology, supervision, writing, review, and editing. Olago Daniel Ochieng: Visualization, Supervision, Validating, Writing, review, and editing, Gicheru Chrisanthus Muchori: Investigation, data curation, review, and editing Writing, review, and editing
Funding
This research received no external funding
Data Availability Statement
The raw data supporting the conclusions of this article will be made available by the authors on request.
Acknowledgments
The Authors of this research manuscript acknowledge the Department of Earth and Climate Science, University of Nairobi for the provision of facilities used in this research. We also acknowledge Earthwater limited for availing the resources used in this research.
Conflicts of Interest
The authors declare that there is no conflict of interest regarding the publication of this article.
Abbreviations
The following abbreviations are used in this manuscript:
| EC | Electrical Conductivity |
| TDS | Total Dissolved Solids |
| WQI | Water Quality Index |
| IWQI | Irrigation Water Quality Index |
| PCA | Principal Component Analysis |
| FAO | Food and Agriculture Organization |
| WHO | World Health Organization |
| WASREB | Water Services Regulatory Board |
| NOCK | National Oil Corporation Kenya |
References
- Olago, D. O. Constraints and solutions for groundwater development, supply and governance in urban areas in Kenya. Hydrogeol J 2019 27, 1031–1050. [CrossRef]
- Osman, A. D. Groundwater quality in Wajir (Kenya) shallow aquifer: An examination of the association between water quality and water- borne diseases in children. Ph. D thesis, 2012 http://hdl.handle.net/1959.9/308716.
- Okello, C.; Tomasello, B.; Greggio, N.; Wambiji, N.; Antonellini, M. Impact of Population Growth and Climate Change on the Freshwater Resources of Lamu Island, Kenya. Water. 2015 7(3):1264-1290. [CrossRef]
- Li, P.; Wu, J.; Qian, H. Hydrochemical appraisal of groundwater quality for drinking and irrigation purposes and the major influencing factors: a case study in and around Hua County, China. Arab J Geosci 2016, 9, 15. [CrossRef]
- Nyoro, J. K. Agriculture and rural growth in Kenya. Tegemeo Institute. 2019 http://41.89.96.81:8080/xmlui/handle/123456789/2393.
- D’Alessandro, S.; Caballero, J.; Simpkin, S.; Lichte, J. Kenya agricultural risk assessment. World Bank Group. 2015. https://bit. ly/2RnCyhP.
- Ericksen, P.J.; Said, M.Y.; Leeuw, J.D.; Silvestri, S.; Zaibet, L.; Kifugo, S.C.; Sijmons, K.; Kinoti, J.; Ng'ang'a, L.; Landsberg, F.; Stickler, M. Mapping and valuing ecosystem services in the Ewaso Ng’iro Ng'iro watershed. 2011. https://hdl.handle.net/10568/12483.
- Rakotoarisoa, M.; Massawe, S. C.; Mude, A. G.; Ouma, R.; Freeman, H. A.; Bahiigwa, G.; & Karugia, J. T. Investment opportunities for livestock in the North Eastern Province of Kenya: a synthesis of existing knowledge. 2008 https://hdl.handle.net/10568/187.
- Muya, E. M.; Obanyi, S.; Ngutu, M.; Sijali, I. V.; Okoti, M.; Maingi, P. M.; Bulle, H. The physical and chemical characteristics of soils of Northern Kenya Aridlands: Opportunity for sustainable agricultural production. Journal of Soil Science and Environmental Management, 2011 2(1), 1-8. http://www.academicjournals.org/JSSEM.
- Aghazadeh, N.; Chitsazan, M.; Golestan, Y. Hydrochemistry and quality assessment of groundwater in the Ardabil area, Iran. Applied Water Science, 2017, 7, pp.3599-3616. [CrossRef]
- Edmunds, W. M. Hydrogeochemical processes in arid and semi-arid regions—focus on North Africa. In Understanding Water in a Dry Environment 2003, 267-304. CRC Press. [CrossRef]
- Coetsiers , M.; Walraevens, K. Chemical characterization of the Neogene Aquifer, Belgium. Hydrogeol J 2006, 14, 1556–1568. [CrossRef]
- Kumar, M.; Kumari, K.; Singh, U.K. and Ramanathan, A.L. Hydrogeochemical processes in the groundwater environment of Muktsar, Punjab: conventional graphical and multivariate statistical approach. Environmental Geology, 2009, 57, pp.873-884. [CrossRef]
- Chenini, I.; Farhat, B; Ben Mammou, A. Identification of major sources controlling groundwater chemistry from a multilayered aquifer system. Chemical Speciation & Bioavailability, 2010, 22(3), pp.183-189. [CrossRef]
- Rajesh, R.; Brindha, K.; Murugan, R. and Elango, L. Influence of hydrogeochemical processes on temporal changes in groundwater quality in a part of Nalgonda district, Andhra Pradesh, India. Environmental Earth Sciences, 2012, 65, pp.1203-1213. [CrossRef]
- Freeze, R. A.; Cherry, J. A. Groundwater 1979. Prentice-Hall Englewood Cliffs, New Jersey.
- Etikala, B.; Adimalla, N.; Madhav, S.; Somagouni, S. G.; Keshava Kiran Kumar, P. L. Salinity problems in groundwater and management strategies in arid and semi-arid regions. Groundwater geochemistry: pollution and remediation methods, 2021, 42-56. [CrossRef]
- Hailu, H.; Haftu, S. Hydrogeochemical studies of groundwater in semi-arid areas of northern Ethiopia using geospatial methods and multivariate statistical analysis techniques. Appl Water Sci 2023, 13, 86. [CrossRef]
- Laghrib, F.; Bahaj, T.; El Kasmi, S.; Hilali, M.; Kacimi, I.; Nouayti, N.; Dakak, H.; Bouzekraoui, M.; El Fatni, O. and Hammani, O. Hydrogeochemical study of groundwater in arid and semi-arid regions of the Infracenomanian aquifers (Cretaceous Errachidia basin, Southeastern Morocco). Using hydrochemical modeling and multivariate statistical analysis. Journal of African Earth Sciences, 2024, 209, p.105132. [CrossRef]
- Toth, J. The role of regional gravity flow in the chemical and thermal evolution of ground water. In Proc. First Canadian/American Conference on Hydrogeology, Practical Applications of Ground Water Geochemistry, Worthington, Ohio, 1984 (pp. 3-39). National Water Well Association and Alberta Research Council.
- Lakshmanan, E.; Kannan, R. and Kumar, M.S. Major ion chemistry and identification of hydrogeochemical processes of ground water in a part of Kancheepuram district, Tamil Nadu, India. Environmental geosciences, 2003, 10(4), pp.157-166. [CrossRef]
- Tizro, A. T.; Voudouris, K. S. Groundwater quality in the semi-arid region of the Chahardouly basin, West Iran. Hydrol Process 2008, 22, (16):3066 3078. [CrossRef]
- Chenini, I.; Mammou, A. B.; Turki, M. M.; Groundwater resources of a multilayered aquiferous system in arid area: Data analysis and water budgeting. Int. J. Environ. Sci. Technol. 2008, 5, 361–374. [CrossRef]
- Prasanna, M. V.; Chidambaram, S.; Srinivasamoorthy, K. Statistical analysis of the hydrogeochemical evolution of groundwater in hard and sedimentary aquifers system of Gadilam river basin, South India, Journal of King Saud University - Science, 2010 Volume 22, Issue 3, 133-145. [CrossRef]
- Zaidi, F.K.; Nazzal, Y.; Jafri, M.K. Naeem, M.; and Ahmed, I. Reverse ion exchange as a major process controlling the groundwater chemistry in an arid environment: a case study from northwestern Saudi Arabia. Environ Monit Assess 2015, 187, 607. [CrossRef]
- Sajil Kumar, P.J. and James, E.J. Identification of hydrogeochemical processes in the Coimbatore district, Tamil Nadu, India. Hydrological Sciences Journal, 2016 61(4), pp.719-731. [CrossRef]
- Kura, N.U.; Ramli, M.F.; Sulaiman, W.N.A.; Ibrahim, S.; Aris, A.Z. and Mustapha, A.; 2013. Evaluation of factors influencing the groundwater chemistry in a small tropical island of Malaysia. International journal of environmental research and public health, 10(5), pp.1861-1881. [CrossRef]
- Ravikumar, P.; Somashekar, R. K. Principal component analysis and hydrochemical facies characterization to evaluate groundwater quality in Varahi river basin, Karnataka state, India. Appl Water Sci 2017 7, 745–755. [CrossRef]
- Wenning, R. J.; Erickson, G. A. Interpretation and analysis of complex environmental data using chemometric methods. Trends in analytical chemistry, 1994. 13, 446-457. [CrossRef]
- Helena, B.; Pardo, R.; Vega, M.; Barrado, E.; Fernandez, J.M; Fernandez, L. Temporal evolution of groundwater composition in an alluvial aquifer (Pisuerga River, Spain) by principal component analysis. Water research, 2000, 34(3), pp.807-816. [CrossRef]
- Alassane, A.; Trabelsi, R.; Dovonon, L.F.; Odeloui, D.J.; Boukari, M.; Zouari, K.; Mama, D. Chemical evolution of the continental terminal shallow aquifer in the south of coastal sedimentary basin of Benin (West-Africa) using multivariate factor analysis. Journal of water resource and protection, 2015 7(6), pp.496-515. [CrossRef]
- Okiongbo, K.S.; Douglas, R.K. Evaluation of major factors influencing the geochemistry of groundwater using graphical and multivariate statistical methods in Yenagoa city, Southern Nigeria. Applied water science, 2015 5, pp.27-37. [CrossRef]
- Jackson, J.E. A User’s User's Guide to Principal Components Wiley 1991, New York 1.
- Meglen, R.R. Examining large databases: a chemometric approach using principal component analysis. Marine Chemistry, 1992, 39(1-3), pp.217-237. [CrossRef]
- Jalali, M. Application of Multivariate analysis to study water chemistry of groundwater in a semi-arid aquifer, Malayer, Western Iran. Desalination and Water Treatment, 2010, 19(1-3), pp.307-317. [CrossRef]
- Singhal, Anupam, Rajiv Gupta, A. N. Singh, and A. Shrinivas. Assessment and monitoring of groundwater quality in semi–arid region. Groundwater for sustainable development. 2020, 11: . [CrossRef]
- Horton, R.K. An index number system for rating water quality. J Water Pollut Control Fed, 1965 37(3), pp.300-306.
- Brown, Robert M., Nina I. McClelland, Rolf A. Deininger, and Ronald G. Tozer. "A water quality index-do we dare." Water and sewage works 2070, 117, no. 10.
- Ott, W. R. water quality indices: a survey of indices used in the United States. Environmental Protection Agency, Office of Research and Development, Office of Monitoring and Technical Support, 1978.
- Boah, D, K.; Twum, S. B.; Pelig-Ba, K. B. "Mathematical computation of water quality index of Vea dam in upper east region of Ghana." Environ Sci 2015, 3, no. 1: 11-16.
- Adimalla, N.; Li, P.; Venkatayogi, S. Hydrogeochemical Evaluation of Groundwater Quality for Drinking and Irrigation Purposes and Integrated Interpretation with Water Quality Index Studies. Environ. Process. 2018 5, 363–383. [CrossRef]
- Batarseh, M.; Imreizeeq, E.; Tilev, S.; Al Alaween, M.; Suleiman, W.; Al Remeithi, A.M.; Al Tamimi, M.K.; Al Alawneh, M.; Assessment of groundwater quality for irrigation in the arid regions using irrigation water quality index (IWQI) and GIS-Zoning maps: Case study from Abu Dhabi Emirate, UAE. Groundwater for Sustainable Development, 2021, 14, p.100611. [CrossRef]
- M'nassri, S.; El Amri, A.; Nasri, N.; Majdoub, R. Estimation of irrigation water quality index in a semi-arid environment using data-driven approach. Water Supply, 2022 22(5), pp.5161-5175. [CrossRef]
- Gad, M.; Saleh, A.H.; Hussein, H.; Elsayed, S.; Farouk, M.; Water quality evaluation and prediction using irrigation indices, artificial neural networks, and partial least square regression models for the Nile River, Egypt. Water, 2023. 15(12), p.2244. [CrossRef]
- Anyango, G.W.; Bhowmick, G.D.; Bhattacharya, N.S. A Critical Review of Irrigation Water Quality Index and Water Quality Management Practices in Micro-Irrigation for Efficient Policy Making. Desalination and Water Treatment, 2024, p.100304. [CrossRef]
- Mufeed, B.; Emad, I.; Seyda, T.; Mohammad, A.; Wael, S.; Abdulla, M.; Mansoor, K.T. Majdy, A. Assessment of groundwater quality for irrigation in the arid regions using irrigation water quality index (IWQI) and GIS-Zoning maps: a case study from Abu-Dhabi, Emirate, UAE. Groundwater for Sustainable Development Journal, 202114, p.100611. [CrossRef]
- Swarzenski, W. V.; Mundorff, M. J. Geohydrology of North Eastern Province, Kenya, USGS Water Supply Paper, 1977, 1757-N, 68.
- Mwango, F. K.; Muhangú, B. C.; Juma, C. O.; Githae, I. T. Groundwater resources in Kenya. In: Managing Shared Aquifer Resources in Africa. ISARM-AFRICA, 2002Tripoli, 2002 pp. 93–100.
- GIBB (Eastern Africa) Ltd.; Study of the Merti Aquifer. Kenya Country Office: final report 2004. volume 1 - main report.
- Mumma, A.; Lane, M.; Kairu, E.; Tuinhof, A. and Hirji, R. Kenya groundwater governance. Case study Report. 2011 http://www.groundwatergovernance.org/fileadmin/user_upload/groundwatergovernance/docs/Country_studies/GWGovernanceKenya.pdf .
- Kuria, D.N. and Kamunge, H.N.; 2013. Merti Aquifer Recharge zones determination using geospatial technologies. http://hdl.handle.net/123456789/51.
- EarthWater Ltd. (2012). Phase 1 – Aquifer Monitoring. Merti Aquifer Study. Nairobi.
- IGAD Design and development of a data system for the application of managed aquifer recharge (MAR) in the Merti aquifer. Technical Report Inland WaternResources Management Programme. 2015. https://www.un-igrac.org/special-project/igad-mar.
- Blandenier, L.; Recharge quantification and continental freshwater lens dynamics in arid regions: application to the Merti aquifer (Eastern Kenya). University of Neuchâtel Microsoft Word 2015,12.03 Final.docx (rero.ch).
- Krhoda, G.; Amimo, M.O. Groundwater quality prediction using logistic regression model for Garissa county. Africa Journal of Physical Sciences, 2019, 3, pp.13-27.
- Githinji, T.W.; Dindi, E.W.; Kuria, Z.N.; Olago, D.O. Application of analytical hierarchy process and integrated fuzzy-analytical hierarchy process for mapping potential groundwater recharge zone using GIS in the arid areas of Ewaso Ng'iro–Lagh Dera Basin, Kenya. HydroResearch, 2022, 5, pp.22-34. [CrossRef]
- Sklash, M.G.; Mwangi, M.P. An Isotopic Study of Groundwater Supplies in the Eastern Province of Kenya. J. Hydrol. 1991, 128, 257–275. [CrossRef]
- Lane,I. A Preliminary Assessment of the Hydrogeology and Hydrochemistry of the Merti Aquifer (North Eastern Province, Kenya: and Lower Juba. Somalia. 1995.
- Gachanja, A.; Tole, M. Management of Ground Water Resources of The MertiAquifer Preliminary Report. 2002. Nairobi.
- Reeves, C.V.; Karanja, F.M. and MacLeod, I.N. Geophysical evidence for a failed Jurassic rift and triple junction in Kenya. Earth and Planetary Science Letters, 1987 81(2-3), pp.299-311. [CrossRef]
- Greene, L.C.; Richards, D.R.; Johnson, R.A.; Crustal structure and tectonic evolution of the Anza rift, northern Kenya. Tectonophysics, 1991, 197(2-4), pp.203-211. [CrossRef]
- Bosworth, W. Mesozoic and early tertiary rift tectonics in East Africa. Seismology and relate sciences in East Africa. Tectonophysics 1992, 209, 115–137. [CrossRef]
- Bosworth, W.; Morley, C.K. Structural and stratigraphic evolution of the Anza rift, Kenya.Tectonophysics 1994, 236 (1–4), 93–115. [CrossRef]
- Matheson, F. J. Geology of the Garbatula Area, (Degree Sheet 37, NE). Report no. 1971 -88. Geological Survey of Kenya, Nairobi, Kenya.
- Dindi, E.W.; Crustal structure of the Anza graben from gravity and magnetic investigations. Tectonophysics, 1994, 236(1-4), pp.359-371. [CrossRef]
- National Oil Corporation Kenya (NOCK). Geological Map of Kenya with Bouguer Gravity Contours. Nairobi, Kenya. 1987 Ministry of Energy and Regional Development.
- ISO. Water quality–determination of selected elements by inductively coupled plasma optical emission spectrometry (ICP-OES). 2007, Second edition 2007-08.
- Piper, A.; M. A graphic procedure in the geochemical interpretation of water-analyses. Transactions, American Geophysical Union, 1944 25, 914–928. [CrossRef]
- Abidi, H. J.; Farhat, B.; Ben Mammou, A.; Oueslati, N. Characterization of recharge mechanisms and sources of groundwater salinization in Ras Jbel coastal aquifer (Northeast Tunisia) using hydrogeochemical tools, environmental isotopes, GIS, and statistics. Journal of Chemistry, 2017(1), p.8610894. [CrossRef]
- Tiwari, A. K.; Singh, A. K. Hydrogeochemical investigation and groundwater quality assessment of Pratapgarh district, Uttar Pradesh. J Geol Soc India 2014, 83, 329–343. [CrossRef]
- Appelo, C. A. J.; Postma, D. 1996. Geochemistry, Groundwater & Pollution. Balkema, Rotterdam.
- Sandilands, D. Bivariate Analysis. In: Michalos, A.C. (eds) Encyclopedia of Quality of Life and Well-Being Research. Springer, 2014 Dordrecht. [CrossRef]
- Trauth, M. H. Bivariate Statistics. In: MATLAB® Recipes for Earth Sciences. Springer, 2015, Berlin, Heidelberg. [CrossRef]
- Cotruvo, J. A. WHO guidelines for drinking water quality: first addendum to the fourth edition. J American Water Works Ass 2017, 109(7):44–51.
- WASREB, Kenya.; Water services regulatory board Drinking water quality and effluent monitoring guideline [online]. 2016 https://wasreb.go.ke/wp-content/uploads/2023/08/Drinking-Water-Guidelines-gwqem_Edited.pdf.
- Drechsel, P.; Marjani Zadeh, S.; Pedrero, F. (eds). Water quality in agriculture: Risks and risk mitigation. Rome, FAO & IWMI 2023. [CrossRef]
- Abdessamed, D.; Jodar-Abellan, A.; Ghoneim, S.S.M. et al. Groundwater quality assessment for sustainable human consumption in arid areas based on GIS and water quality index in the watershed of Ain Sefra (SW of Algeria). Environ Earth Sci 82, 510 (2023). [CrossRef]
- Darwish, M. H.; Megahed, H. A.; Sayed, A. G.; Abdalla, O.; Scopa, A.; Hassan, S. H. A. Hydro-Geochemistry and Water Quality Index Assessment in the Dakhla Oasis, Egypt. Hydrology, 2024 11(10), 160. [CrossRef]
- Meireles, A. C. M.; Andrade, E. M. D.; Chaves, L. C. G.; Frischkorn, H.; Crisostomo, L. A. A new proposal of the classification of irrigation water. Revista Ciência Agronômica, 2010, 41, 349-357.
- Ayers, R. S.; Westcot, D. W. Water quality for agriculture. 1985, Vol. 29. Rome: Food and agriculture organization of the United Nations.
- Tejashvini, A.; Subbarayappa, C. T.; Mudalagiriyappa.; Chowdappa, H. D.; Ramamurthy, V. Assessment of irrigation water quality for groundwater in Semi-Arid Region, Bangalore, Karnataka. Water Science, 2024, 38(1), 548–568. [CrossRef]
- Mondal, N. C.; Singh, V. S.; Rangarajan, R. Aquifer characteristics and its modeling around an industrial complex, Tuticorin, Tamil Nadu, India: A case study. J Earth Syst Sci 2009 118, 231–244 (2009). [CrossRef]
- Meybeck M. Global chemical weathering of surficial rocks estimated from river dissolved loads. American Journal of Science, 1987, 287, 401–428. [CrossRef]
- Rogers, R. J.; Geochemical comparison of groundwater in areas of New England, New York, and Pennsylvania. Groundwater 1989 27(5):690–712 . [CrossRef]
- Krhoda, G. O. Groundwater assessment in sedimentary basins of eastern Kenya, Africa. In: Regional Characterization of Water Quality Baltimore Symposium: International Association of Hydrological Sciences. 1989, pp. 111–124.
- Chebotarev, I.I. Metamorphism of natural waters in the crust of weathering—2. Geochem. Cosmochim. Acta 1955. 8, 137–170. [CrossRef]
- Luedeling, E.; Arjen, L. O.; Boniface, K.; Sarah, O.; Maimbo, M.; Keith, D. S. Fresh groundwater for Wajir—ex-ante assessment of uncertain benefits for multiple stakeholders in a water supply project in Northern Kenya. Front. Environ. Sci. 2015 3(16), 18. [CrossRef]
- Moujabber, M.E.; Samra, B.B.; Darwish, T. and Atallah, T. Comparison of different indicators for groundwater contamination by seawater intrusion on the Lebanese coast. Water resources management, 2006, 20, pp.161-180. [CrossRef]
- Sudaryanto and Naily, W. February. Ratio of major ions in groundwater to determine saltwater intrusion in coastal areas. In IOP conference series: earth and environmental science 2018 (Vol. 118, p. 012021). IOP Publishing. [CrossRef]
- Chidambaram, S.; Sarathidasan, J.; Srinivasamoorthy, K.; Thivya, C.; Thilagavathi, R.; Prasanna, M. V.; Singaraja, C.; Nepolian, M. Assessment of hydrogeochemical status of groundwater in a coastal region of Southeast coast of India. Appl Water Sci2018, 8, 27. [CrossRef]
- Appelo, C. A. J.; Postma, D. Geochemistry, groundwater and pollution,2nd edn.Balkema, Rotterdam, 2005. 683 pp.
- Schoeller, H. Geochemistry of groundwater. In: Groundwaterstudies—an international guide for research and practice.UNESCO, 1977, Paris, Chap. 15, pp 1–18.
- Schoeller, H. Hydrodynamique lans lekarst (ecoulemented emmagusinement). Actes Colloques Doubronik, I, AIHS et UNESCO, 1965 pp 3–20. https://digitalcommons.usf.edu/kip_articles/8272.
- García, G.M.; del V. Hidalgo, M.; Blesa, M.A. Geochemistry of groundwater in the alluvial plain of Tucuman province, Argentina. Hydrogeology Journal, 2001, 9, pp.597-610. [CrossRef]
- Saha, S.; Reza, A. H. M. S.; Roy, M. K. Hydrochemical evaluation of groundwater quality of the Tista floodplain, Rangpur, Bangladesh. Appl Water Sci 2019 9, 198. [CrossRef]
- Bhardwaj, V.; Singh, D. S.; Surface and groundwater quality characterization of Deoria district, Ganga plain, India. Environ Earth Sci 2011 63:383–395. [CrossRef]
- Richards, L. A. Diagnosis and improvement of saline and alkali soils, 1954 vol 78. LWW, Philadelphia. US Government Printing Office.
- Wilcox, L. V. Classification and use of irrigation water (Circular 969). 1955 USDA, Washington. https://dn720401.ca.archive.org/0/items/classificationus969wilc/classificationus969wilc.pdf.
- Sidibe A. M.; Lin, X.; Koné, S.; 2019. Assessing groundwater mineralization process, quality, and isotopic recharge origin in the Sahel Region in Africa MDPI Water 2019, 11, 789; [CrossRef]
- Seibert, S.; Atteia, O.; Ursula Salmon, S.; Siade, A.; Douglas, G. and Prommer, H. Identification and quantification of redox and pH buffering processes in a heterogeneous, low carbonate aquifer during managed aquifer recharge. Water Resources Research, 2016, 52(5), pp.4003-4025. [CrossRef]
- Singaraja, C.; Chidambaram, S.; Anandhan, P. Thivya, C.; Thilagavathi, R., Sarathidasan, J. Hydrochemistry of groundwater in a coastal region and its repercussion on quality, a case study—Thoothukudi district, Tamil Nadu, India. Arab J Geosci 2014, 7, 939–950. [CrossRef]
- Siddique, J.; Menggui, J.; Shah, M.H.; Shahab, A.; Rehman, F. and Rasool, U. Integrated approach to hydrogeochemical appraisal and quality assessment of groundwater from Sargodha District, Pakistan. Geofluids, 2020, 1, p.6621038. [CrossRef]
- Raju, N. J. Hydrogeochemical parameters for assessment of groundwater quality in the upper Gunjanaeru River basin, Cuddapah District, Andhra Pradesh, South India. Environ Geol 2007 52, 1067–1074. [CrossRef]
- Mohammed-Aslam, M. A.; Rizvi, S. S. Hydrogeochemical characterisation and appraisal of groundwater suitability for domestic and irrigational purposes in a semi-arid region, Karnataka state, India. Appl Water Sci 2020, 10, 237. [CrossRef]
Figure 1.
The study area map.
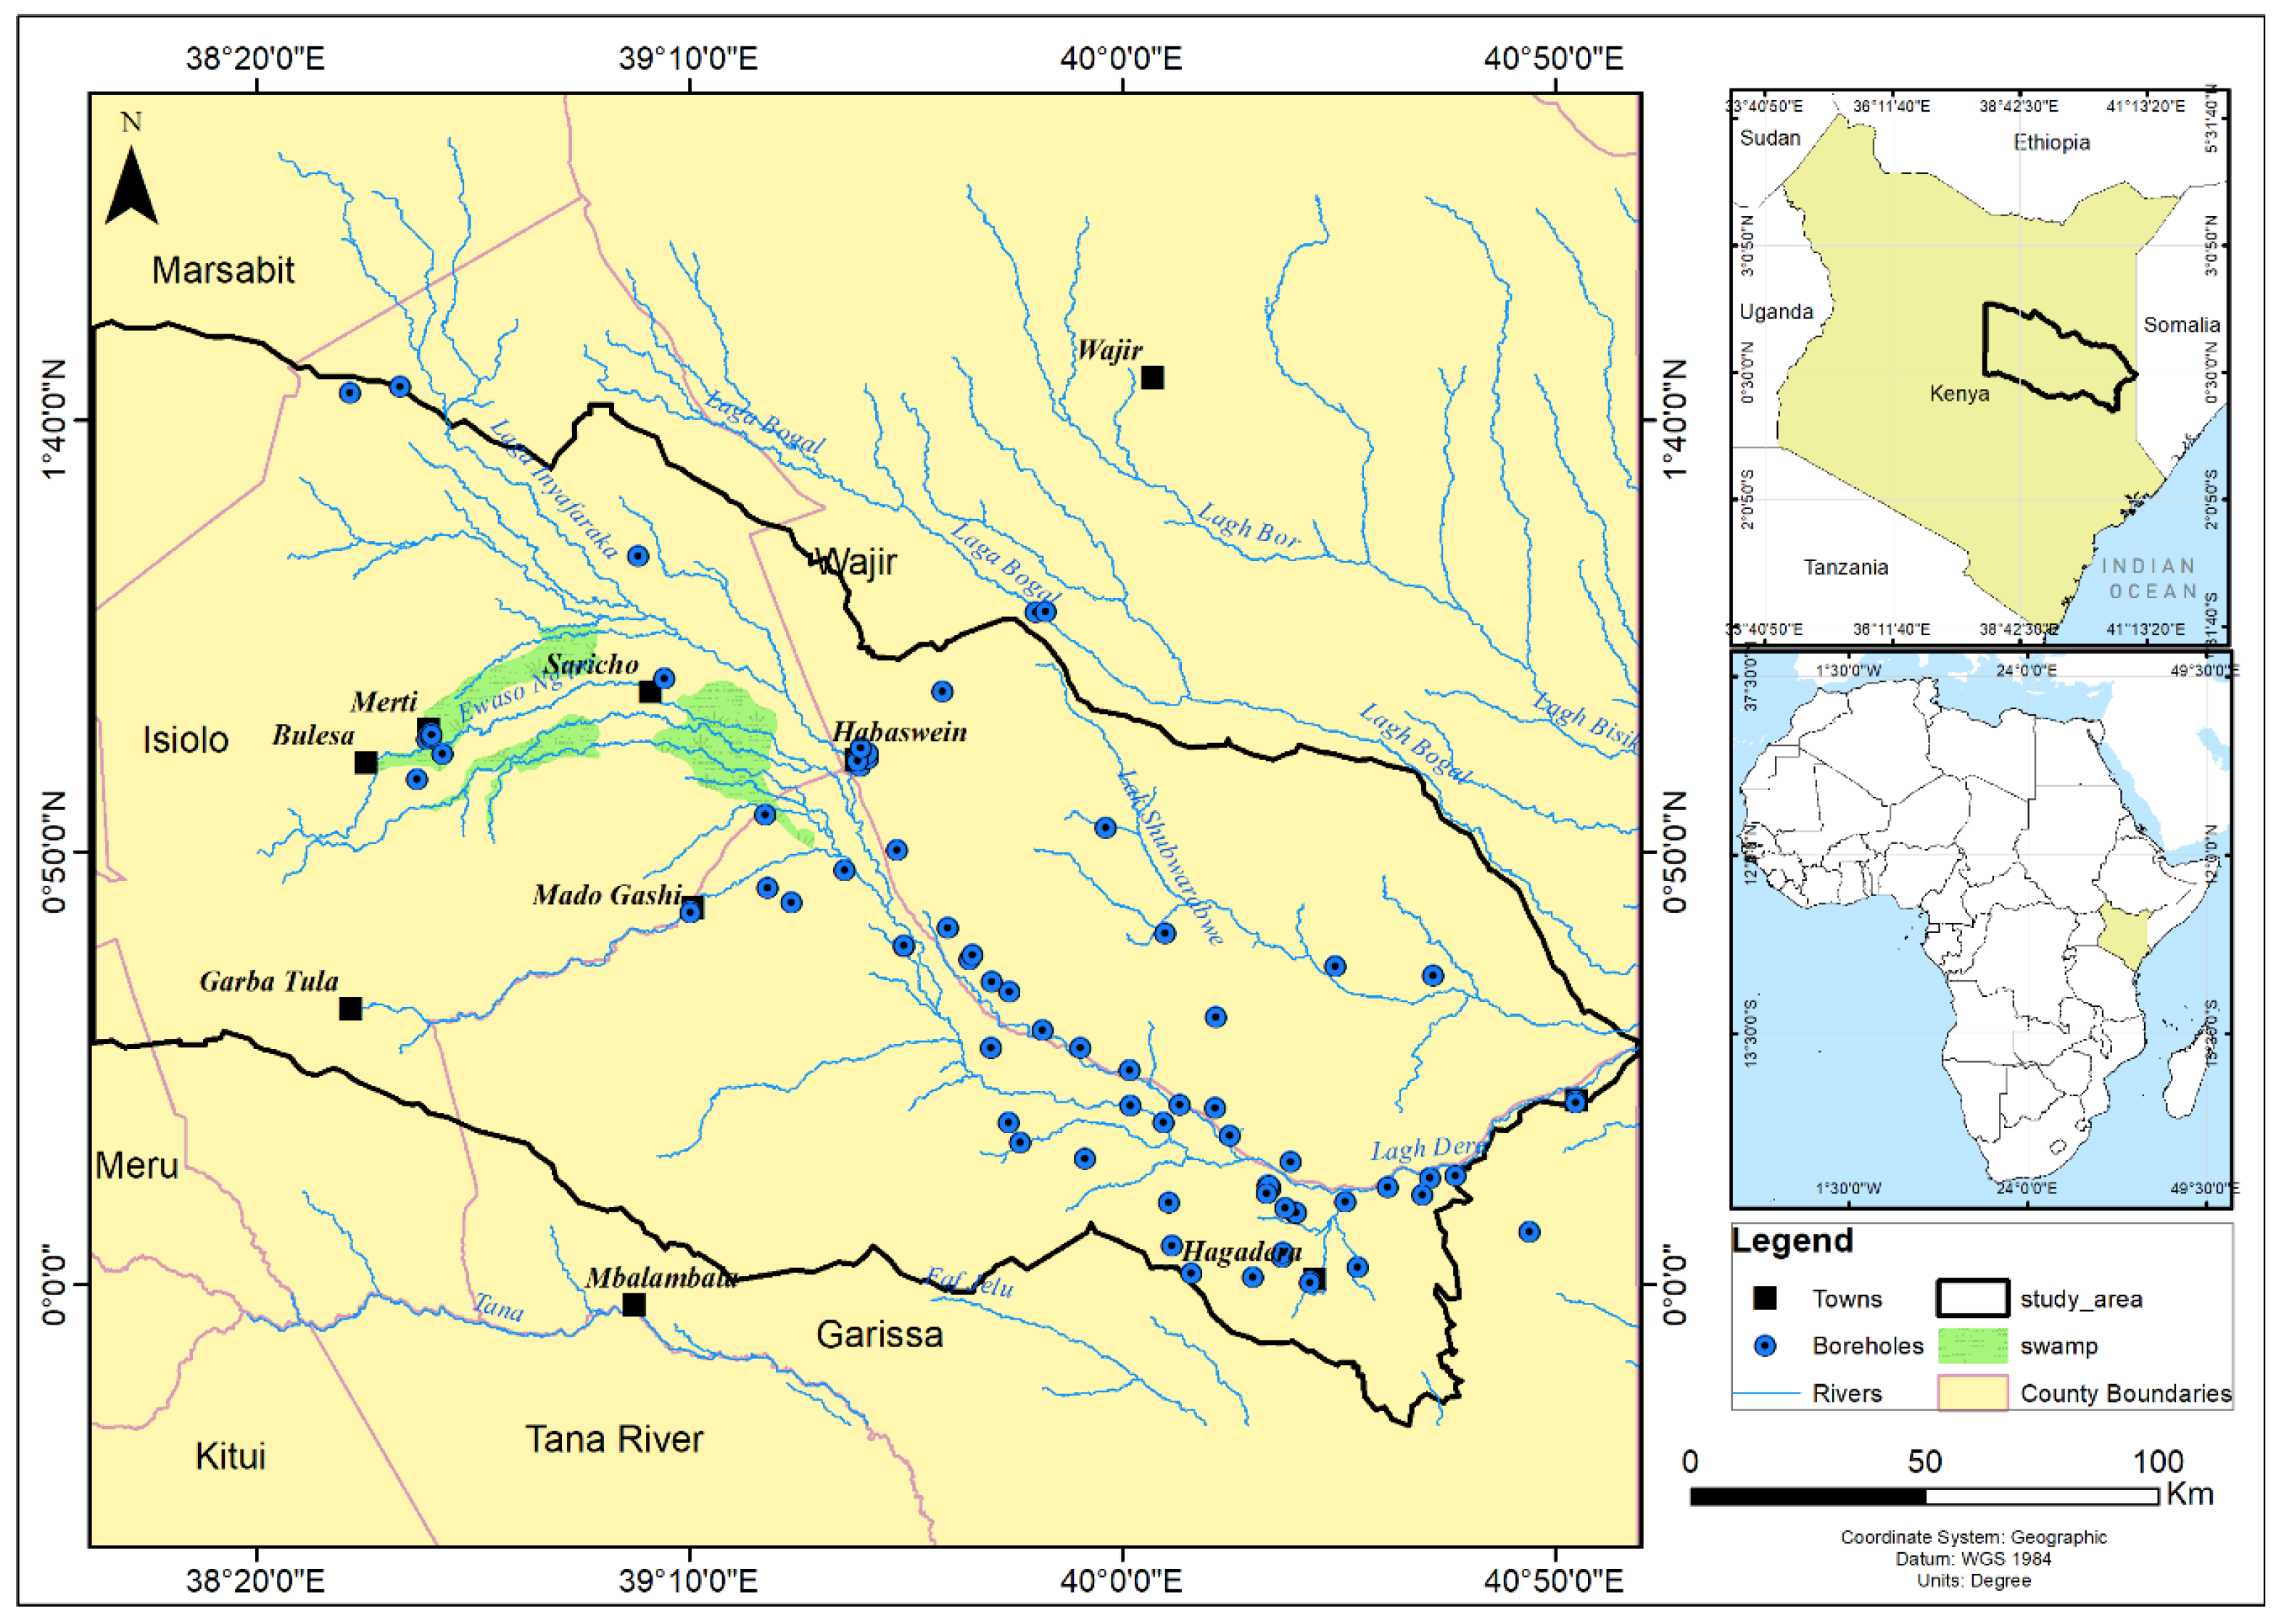
Figure 3.
A Piper diagram illustrating the geochemical classification of the groundwater water in the study area. The arrows in the bottom triangle indicate increasing NaHCO3 dominance. 1 represents alkaline earths exceeding alkalies, 2 represents alkalies exceeding alkaline earths, and 3: Weak acids exceed strong acids. and 4: strong acid exceeds weak acids [68].
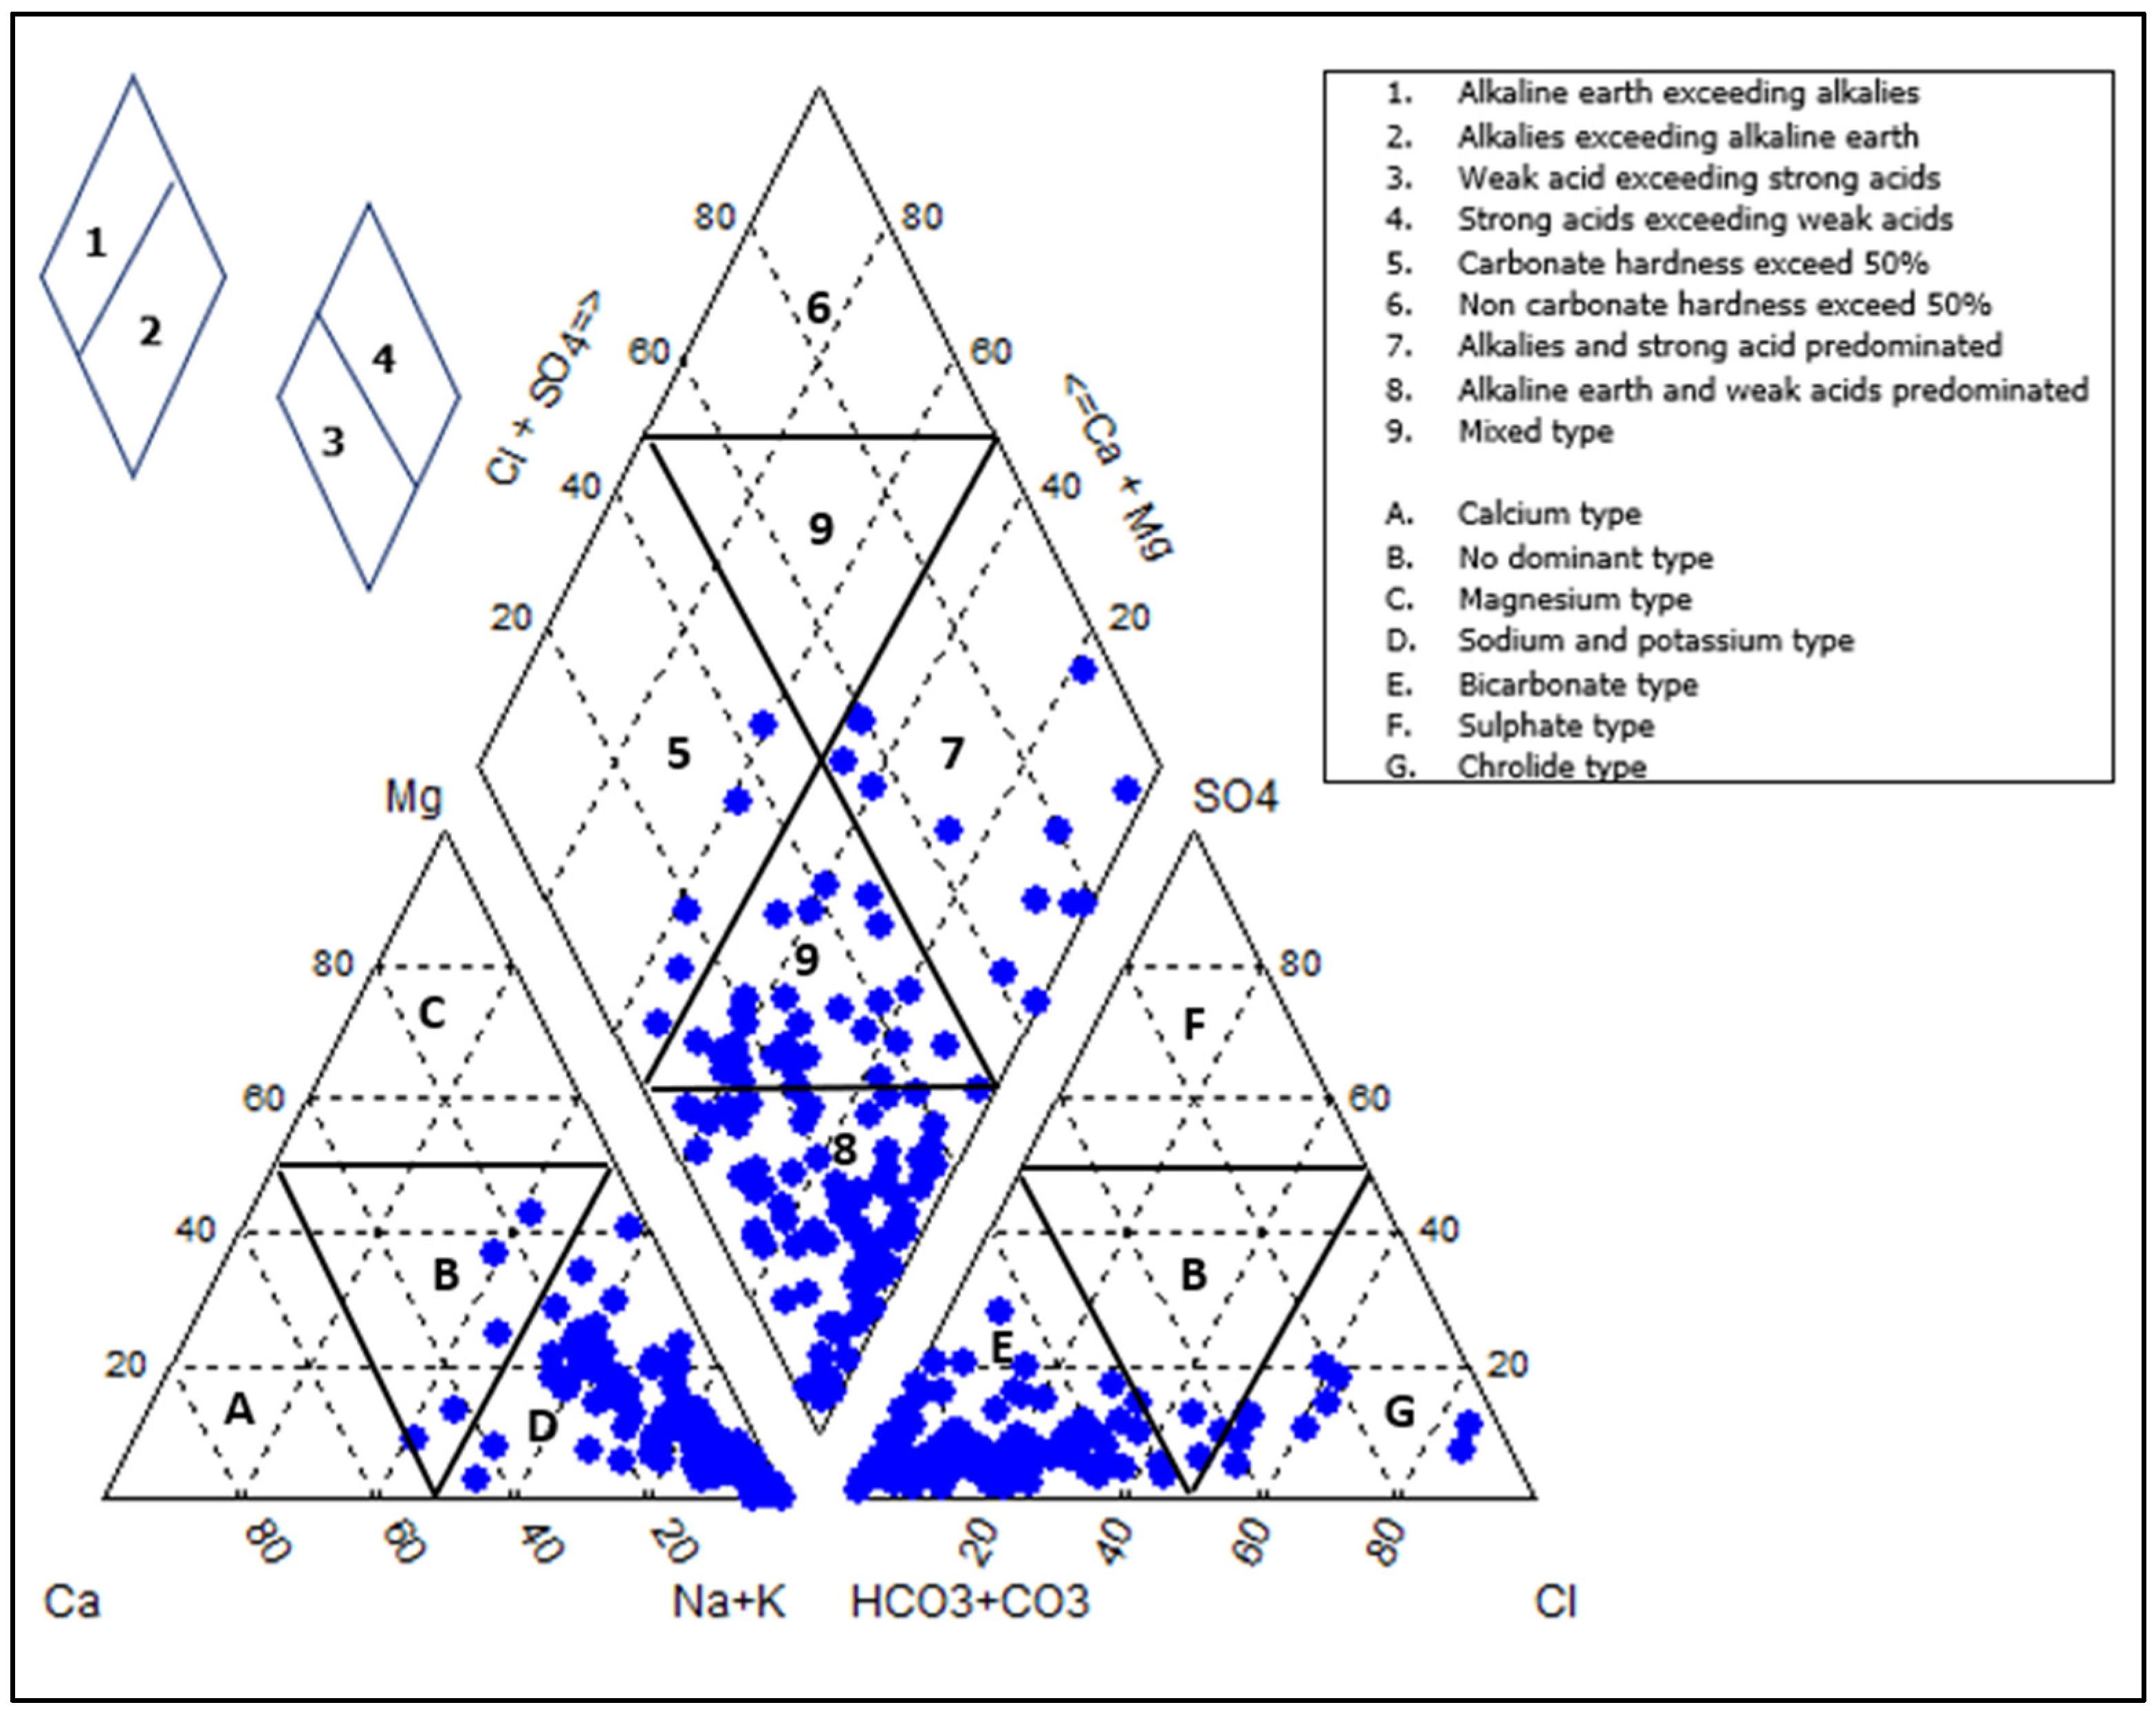
Figure 4.
Bivariate plots of Ca2+ versus HCO3- ions.
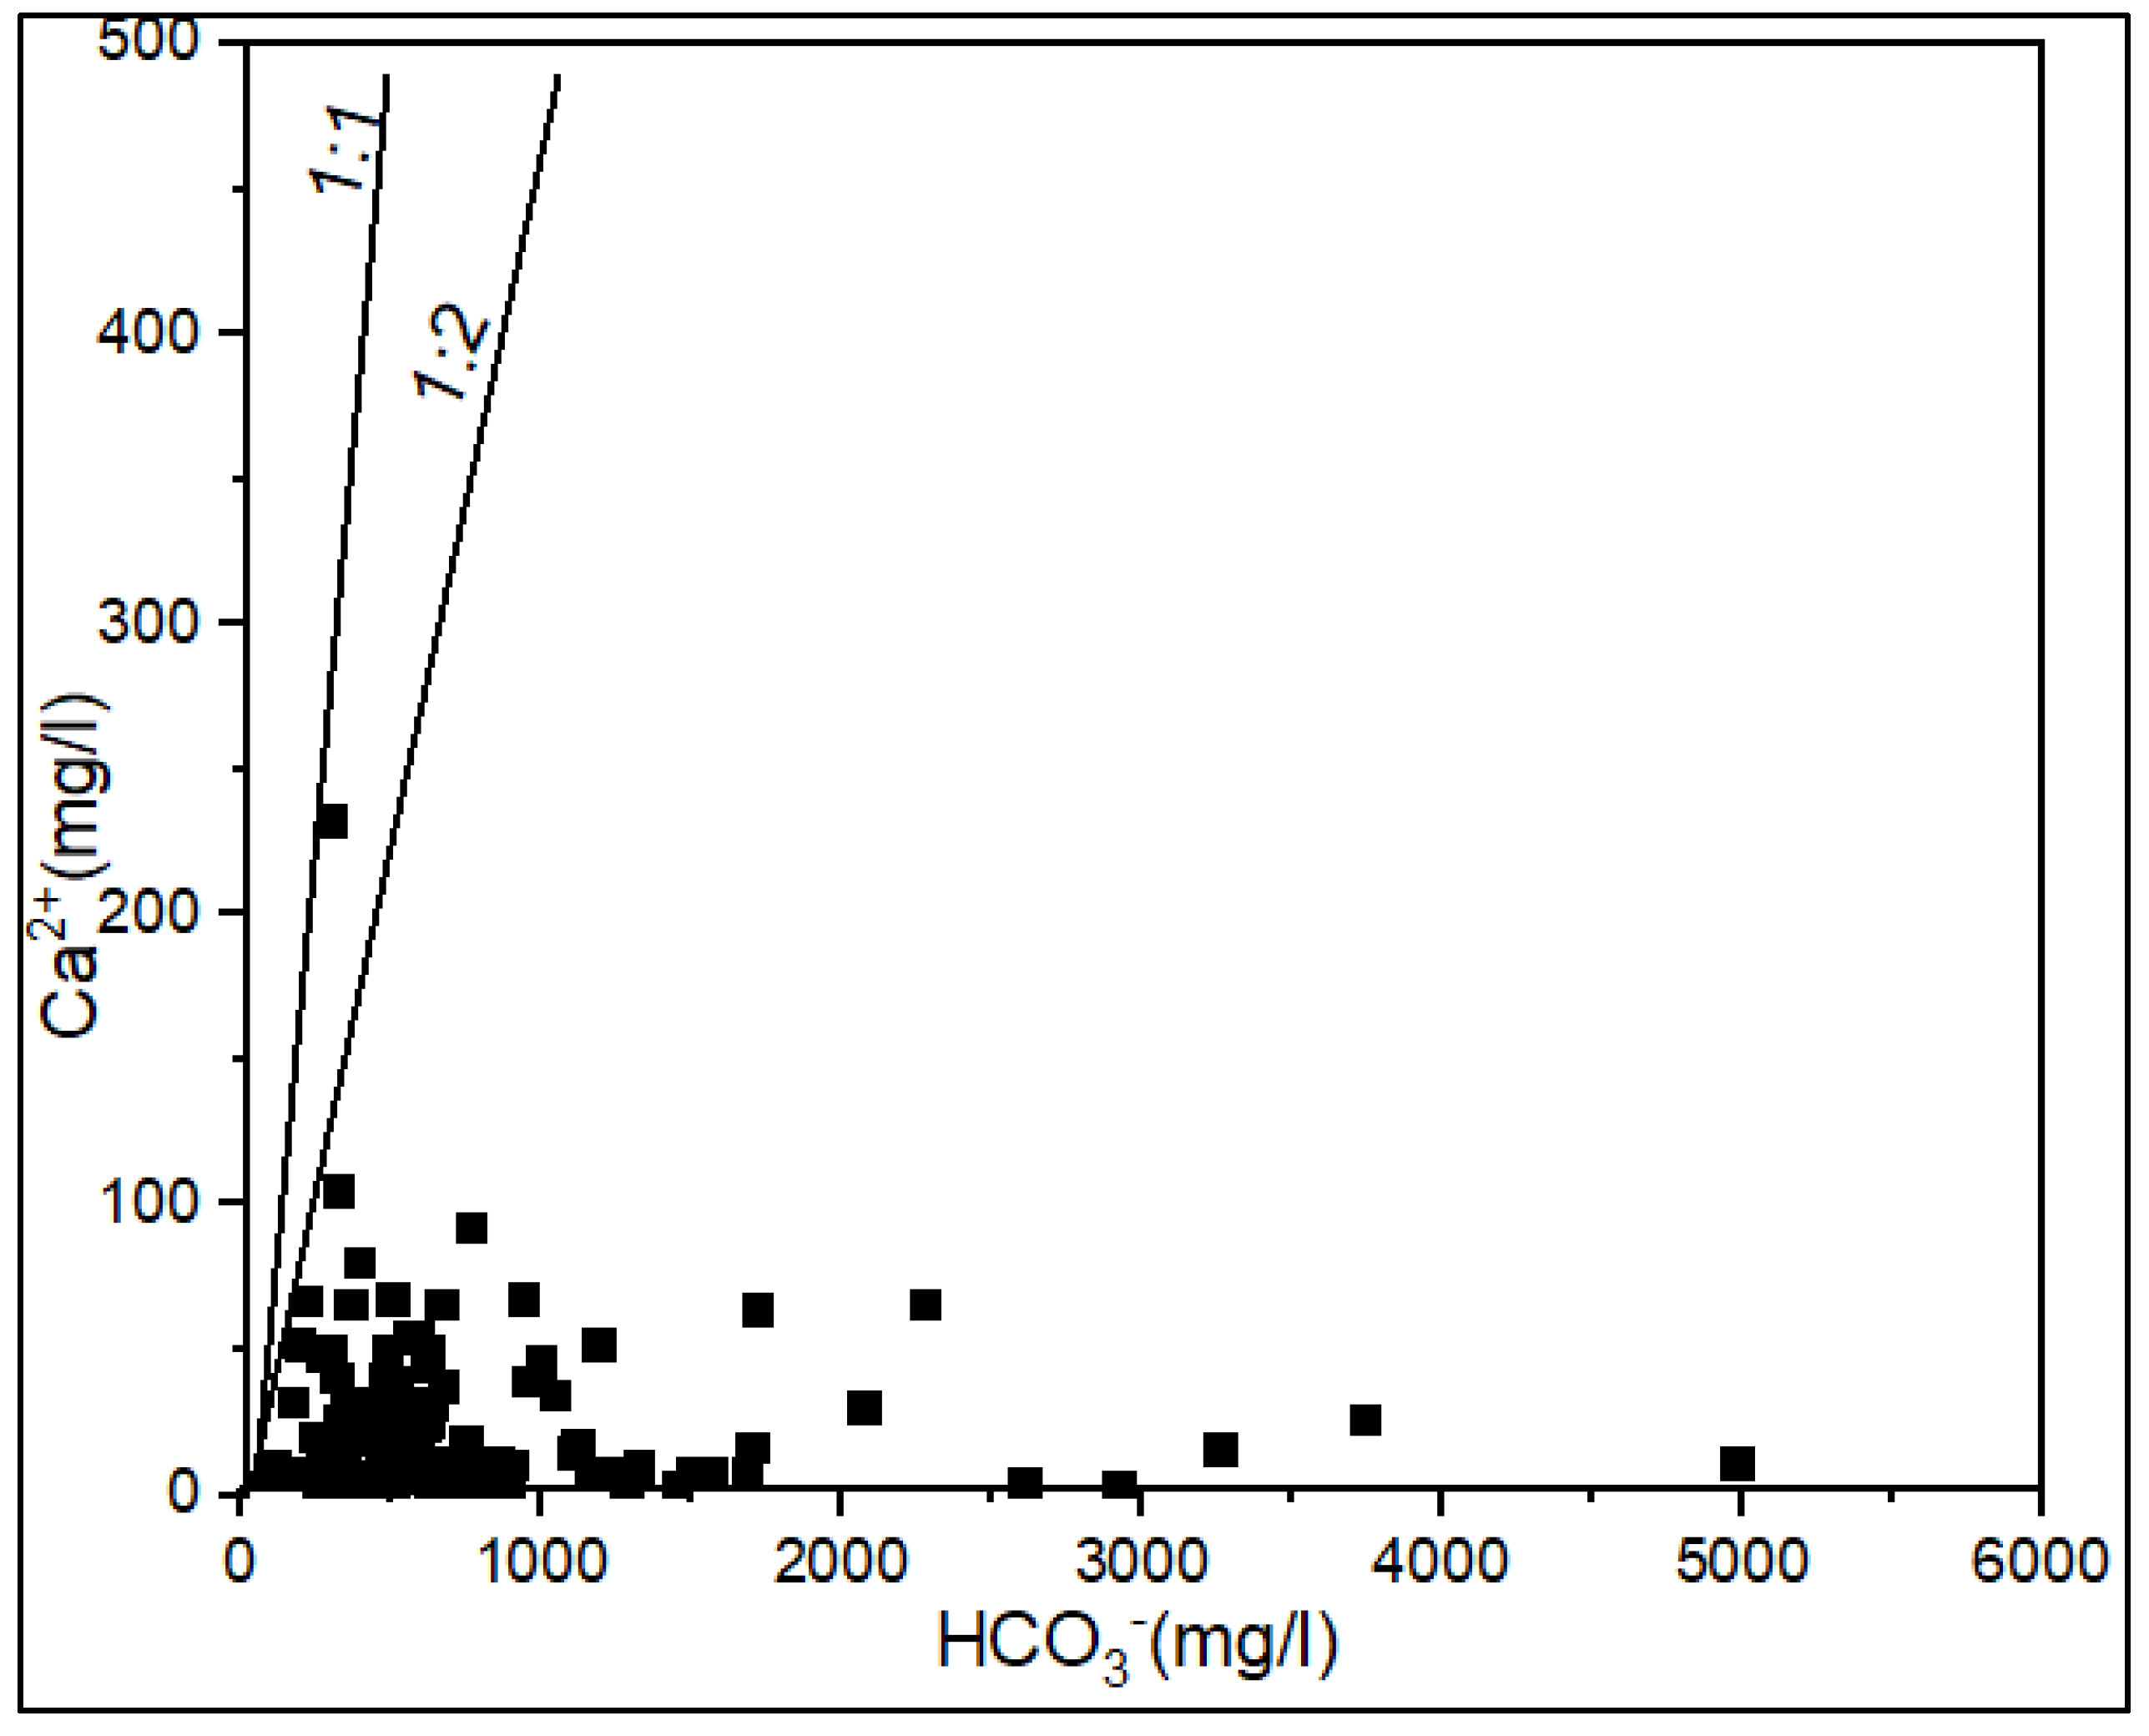
Figure 5.
Plots of (a)saturation index (SI) of aragonite, calcite, and dolomite (b) saturation index (SI) of anhydrite and gypsum.
Figure 5.
Plots of (a)saturation index (SI) of aragonite, calcite, and dolomite (b) saturation index (SI) of anhydrite and gypsum.
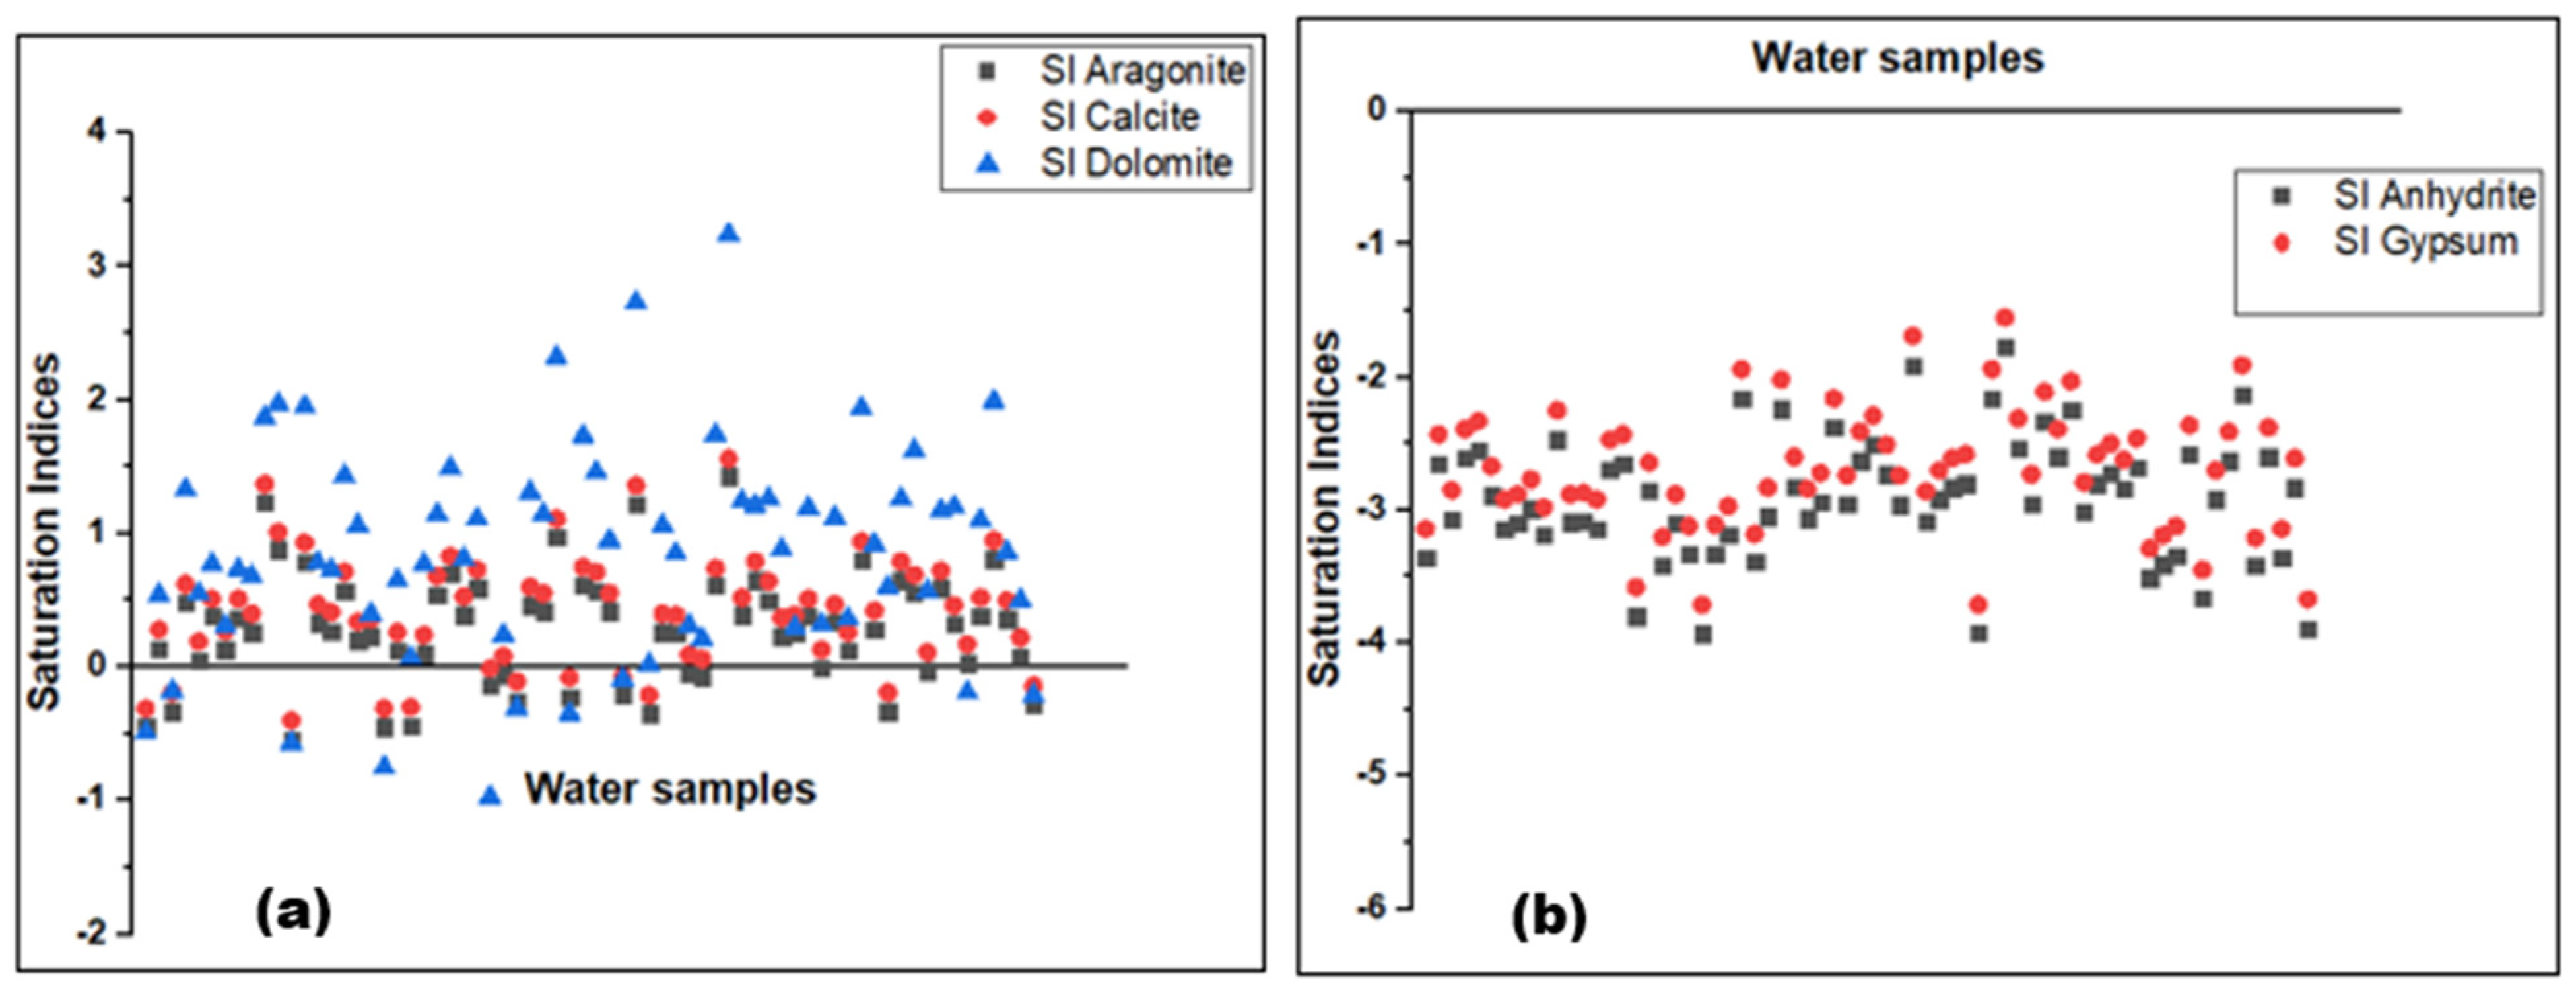
Figure 6.
Bivariate plots of Ca2+ versus S042- ions.
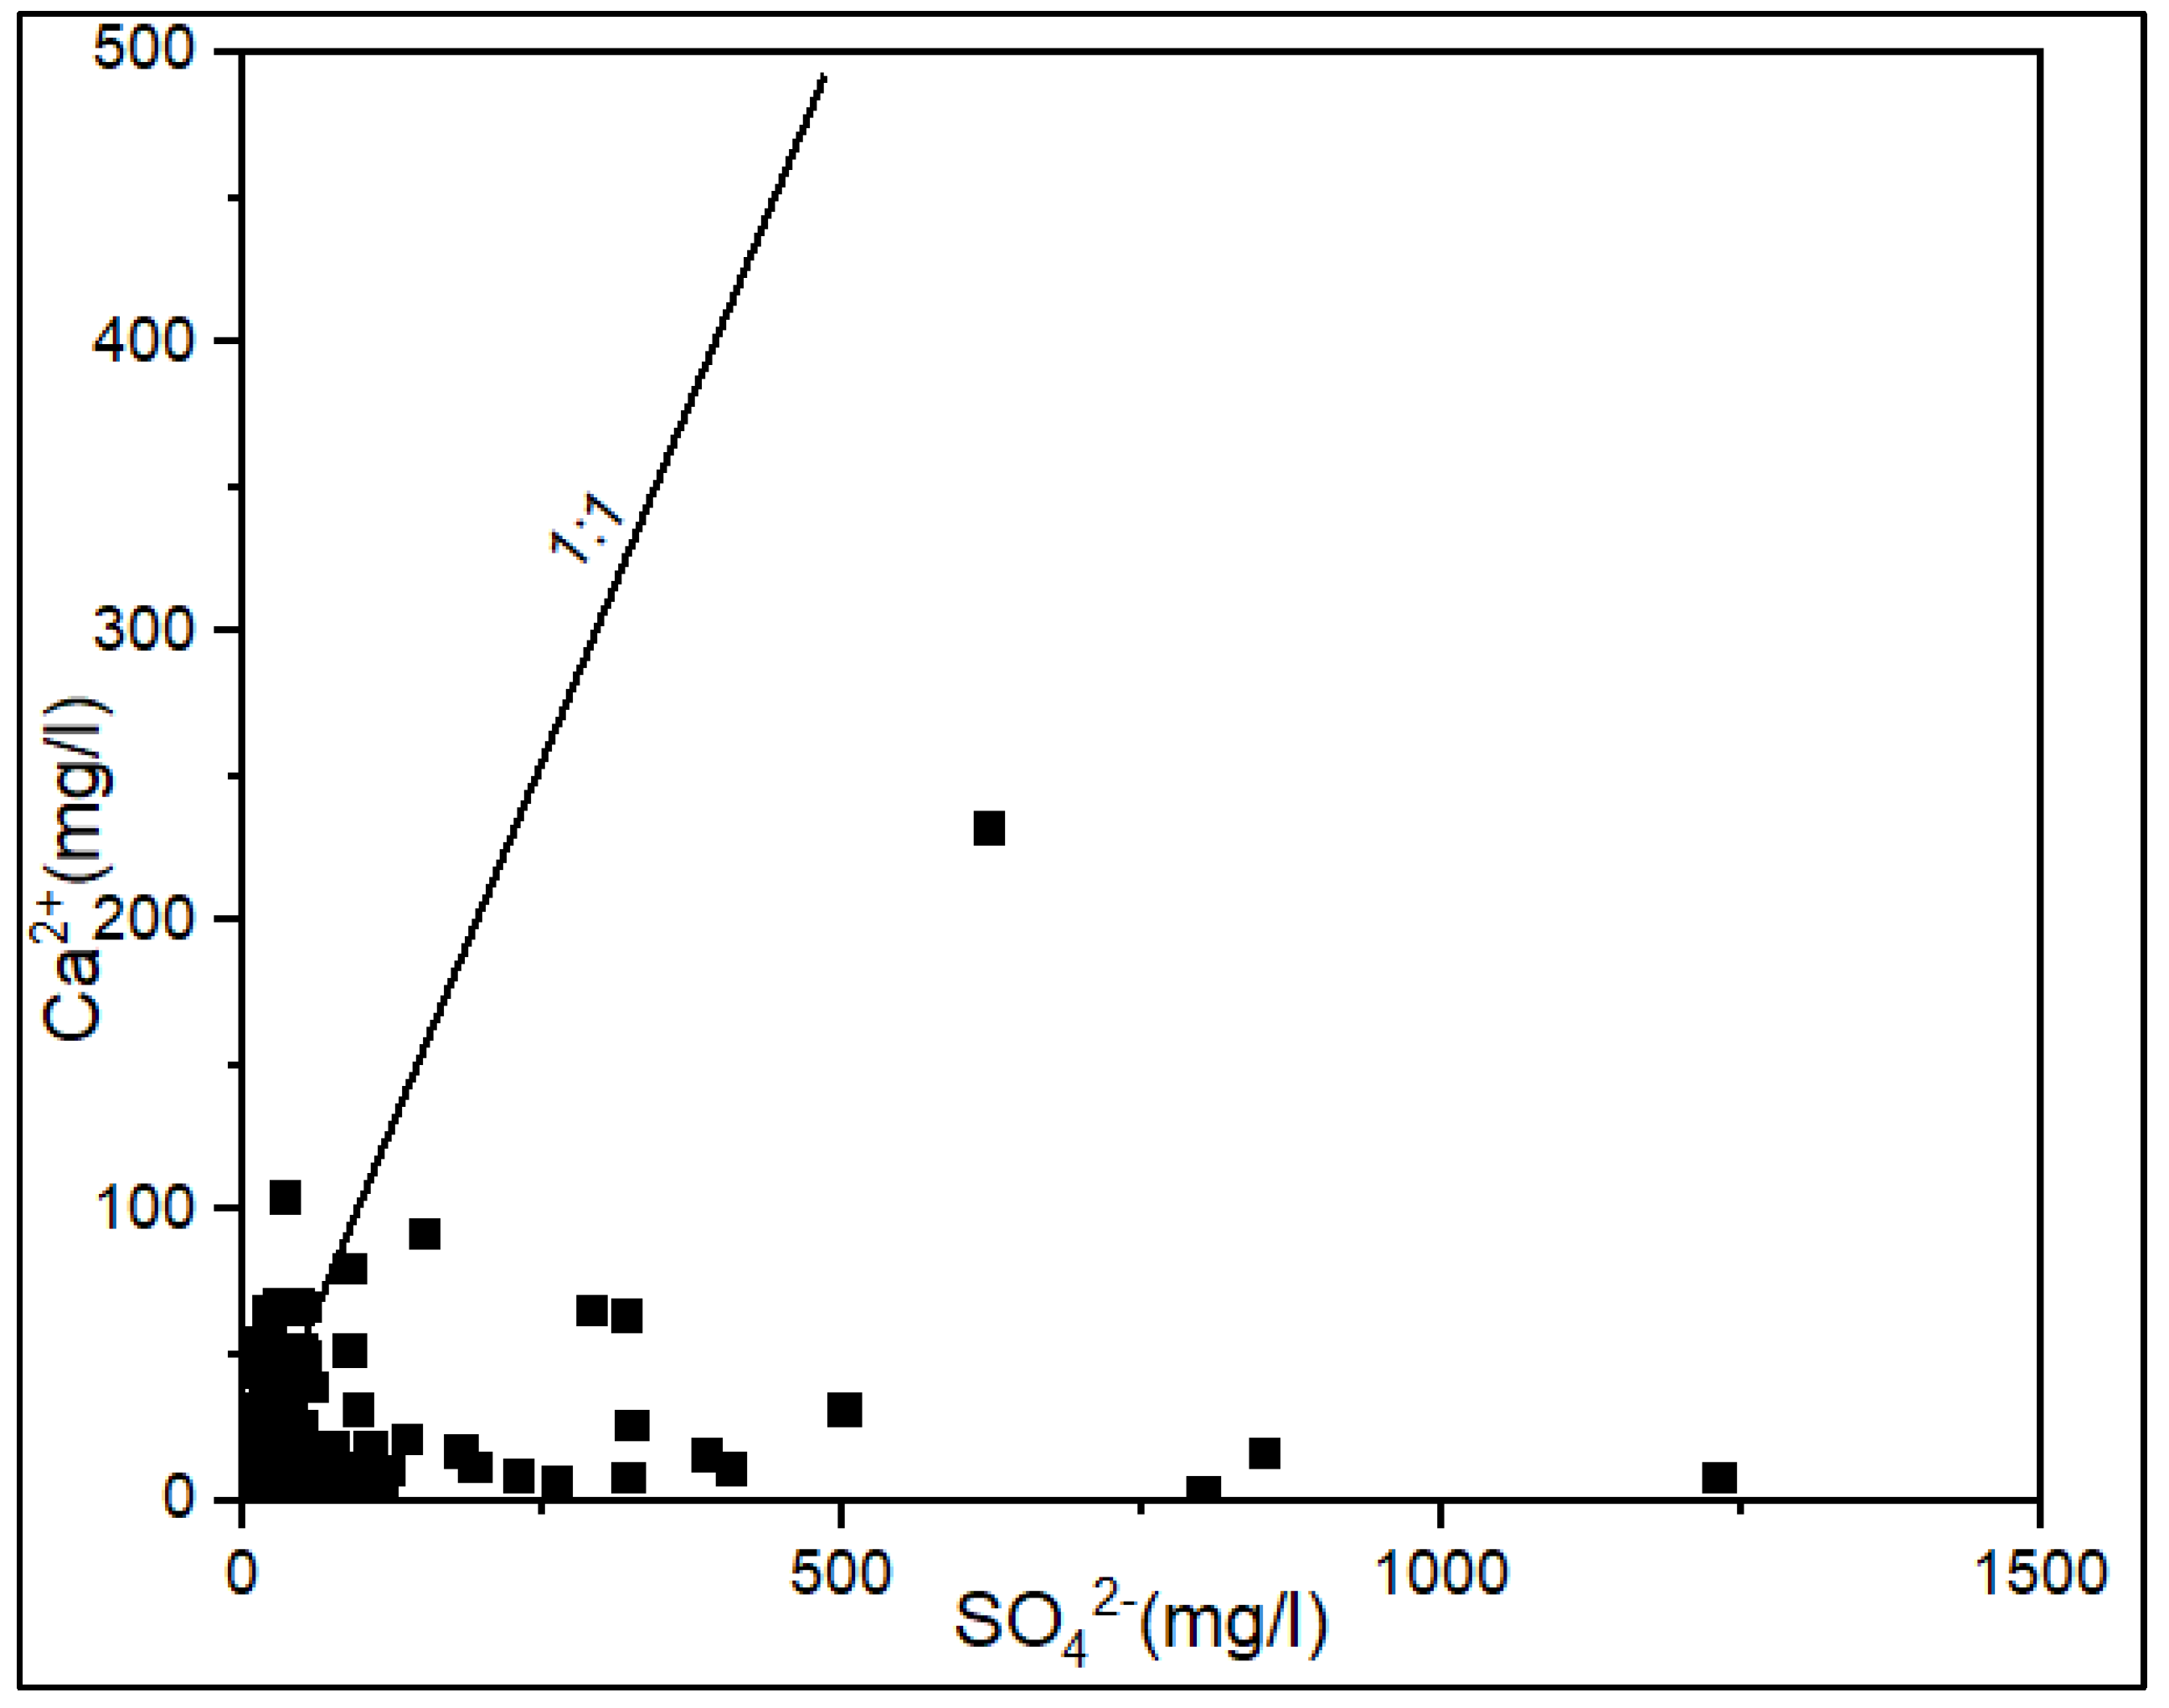
Figure 7.
Chloro-Alkaline Indices (CAI 1) for the analyzed groundwater samples.
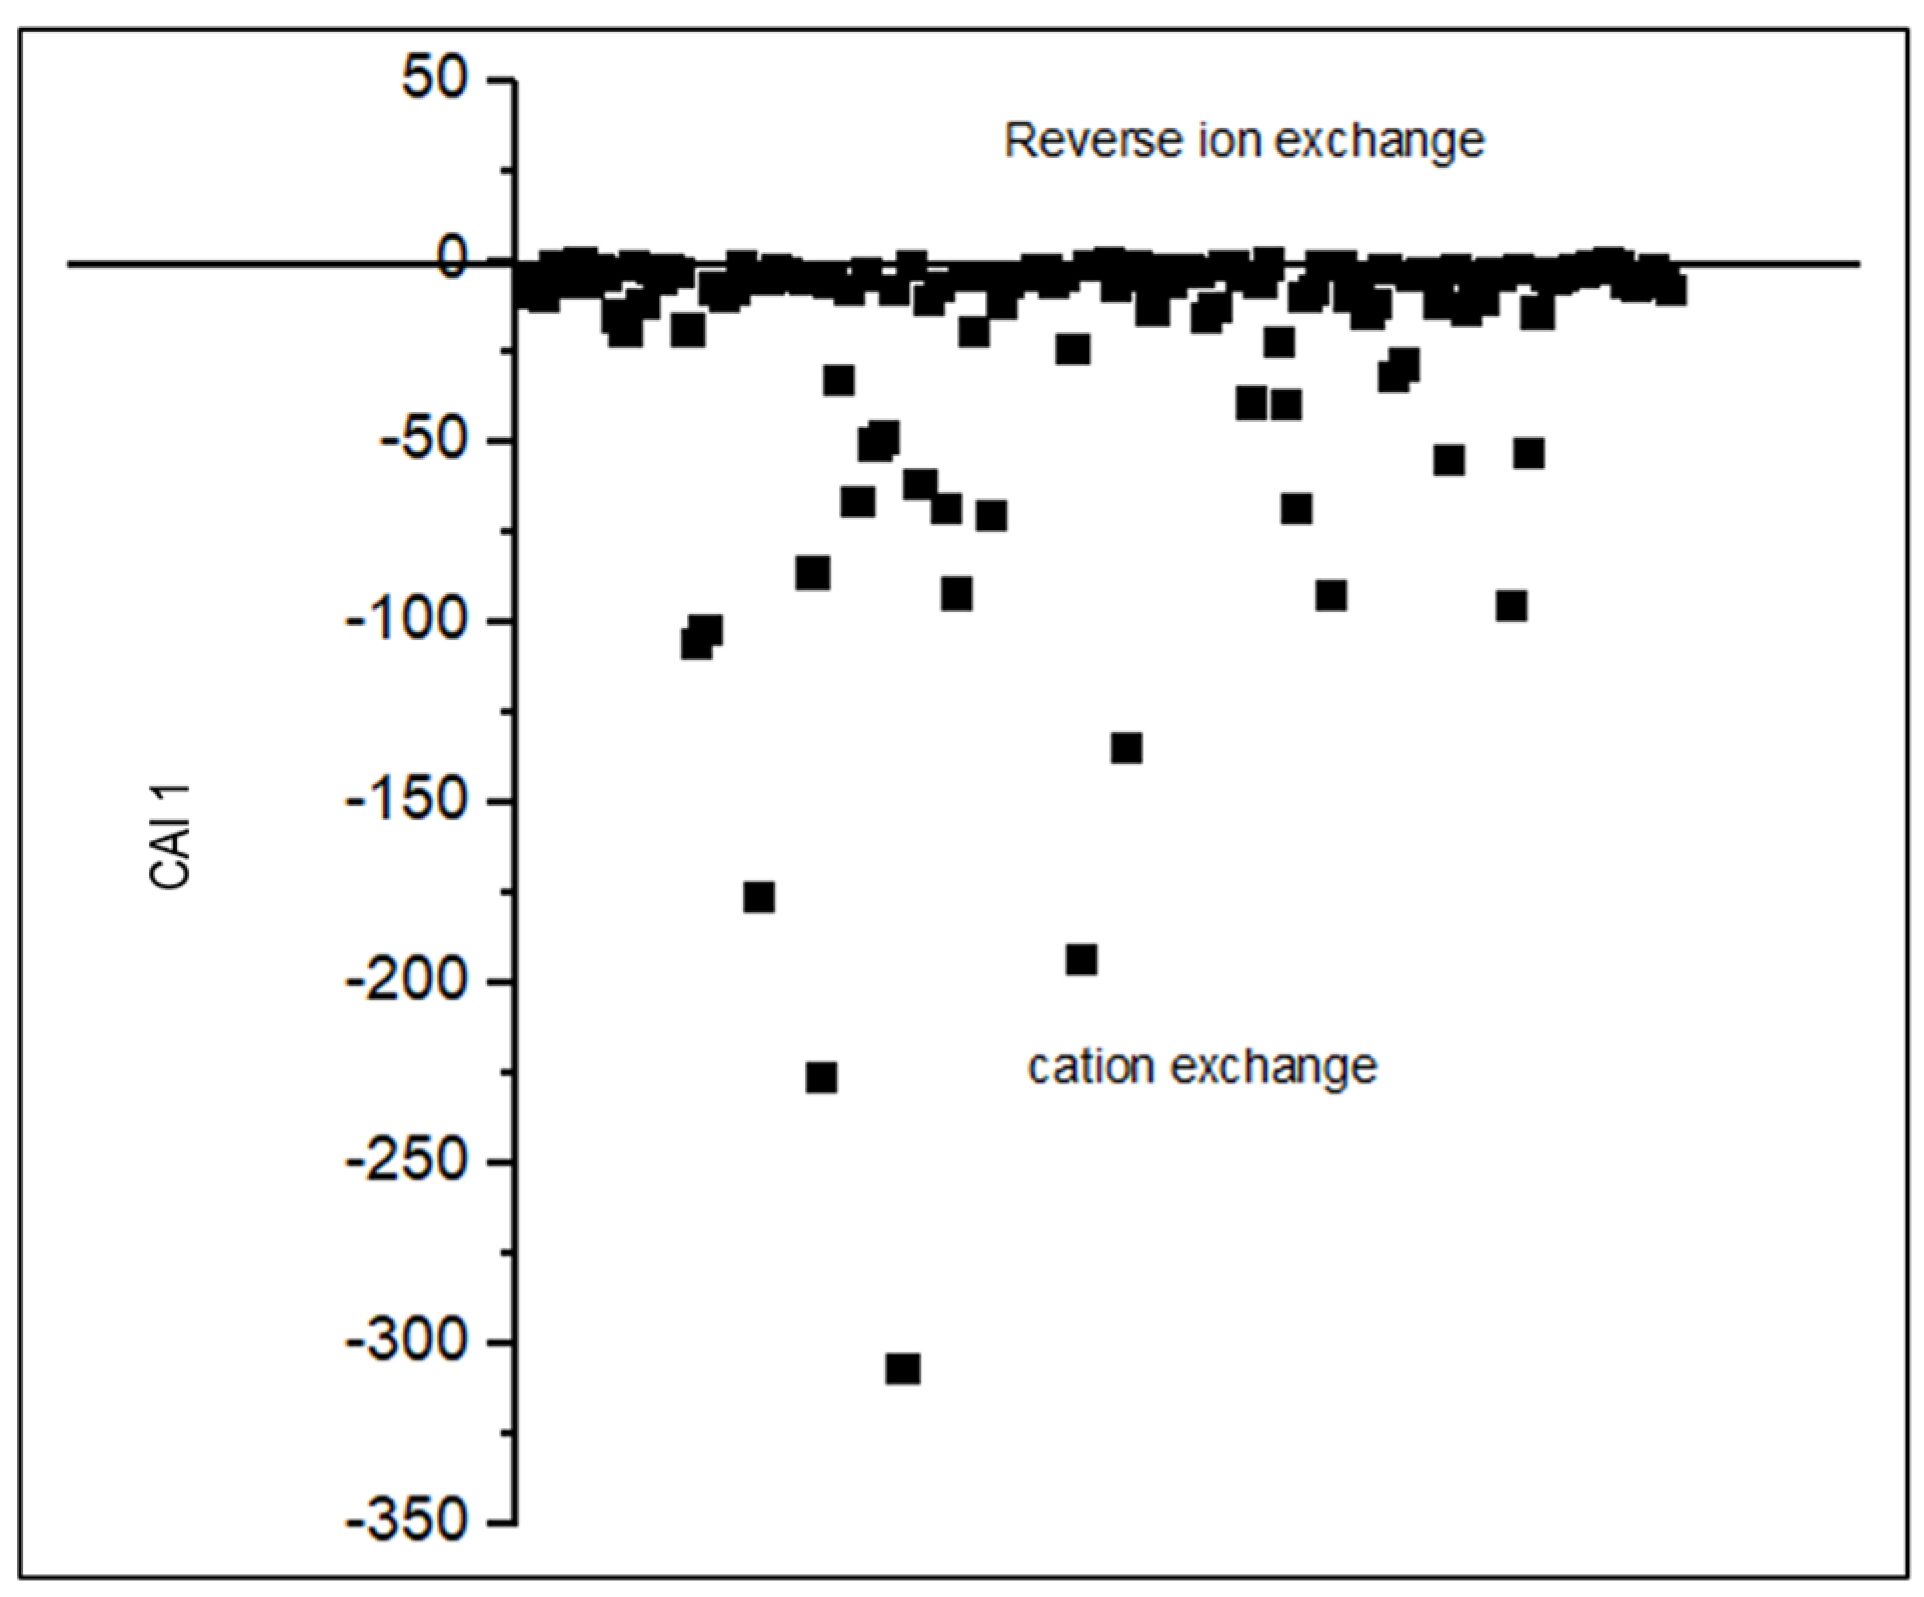
Figure 8.
Chloro-Alkaline Indices (CAI 2) for the analyzed groundwater samples.

Figure 9.
Chloro-Alkaline Indices (CAI) for the analyzed groundwater samples: (a) CAI 1 and (b) CAI 2 and (c) Bivariate plots indicating the dominance of cation ion exchange process.
Figure 9.
Chloro-Alkaline Indices (CAI) for the analyzed groundwater samples: (a) CAI 1 and (b) CAI 2 and (c) Bivariate plots indicating the dominance of cation ion exchange process.
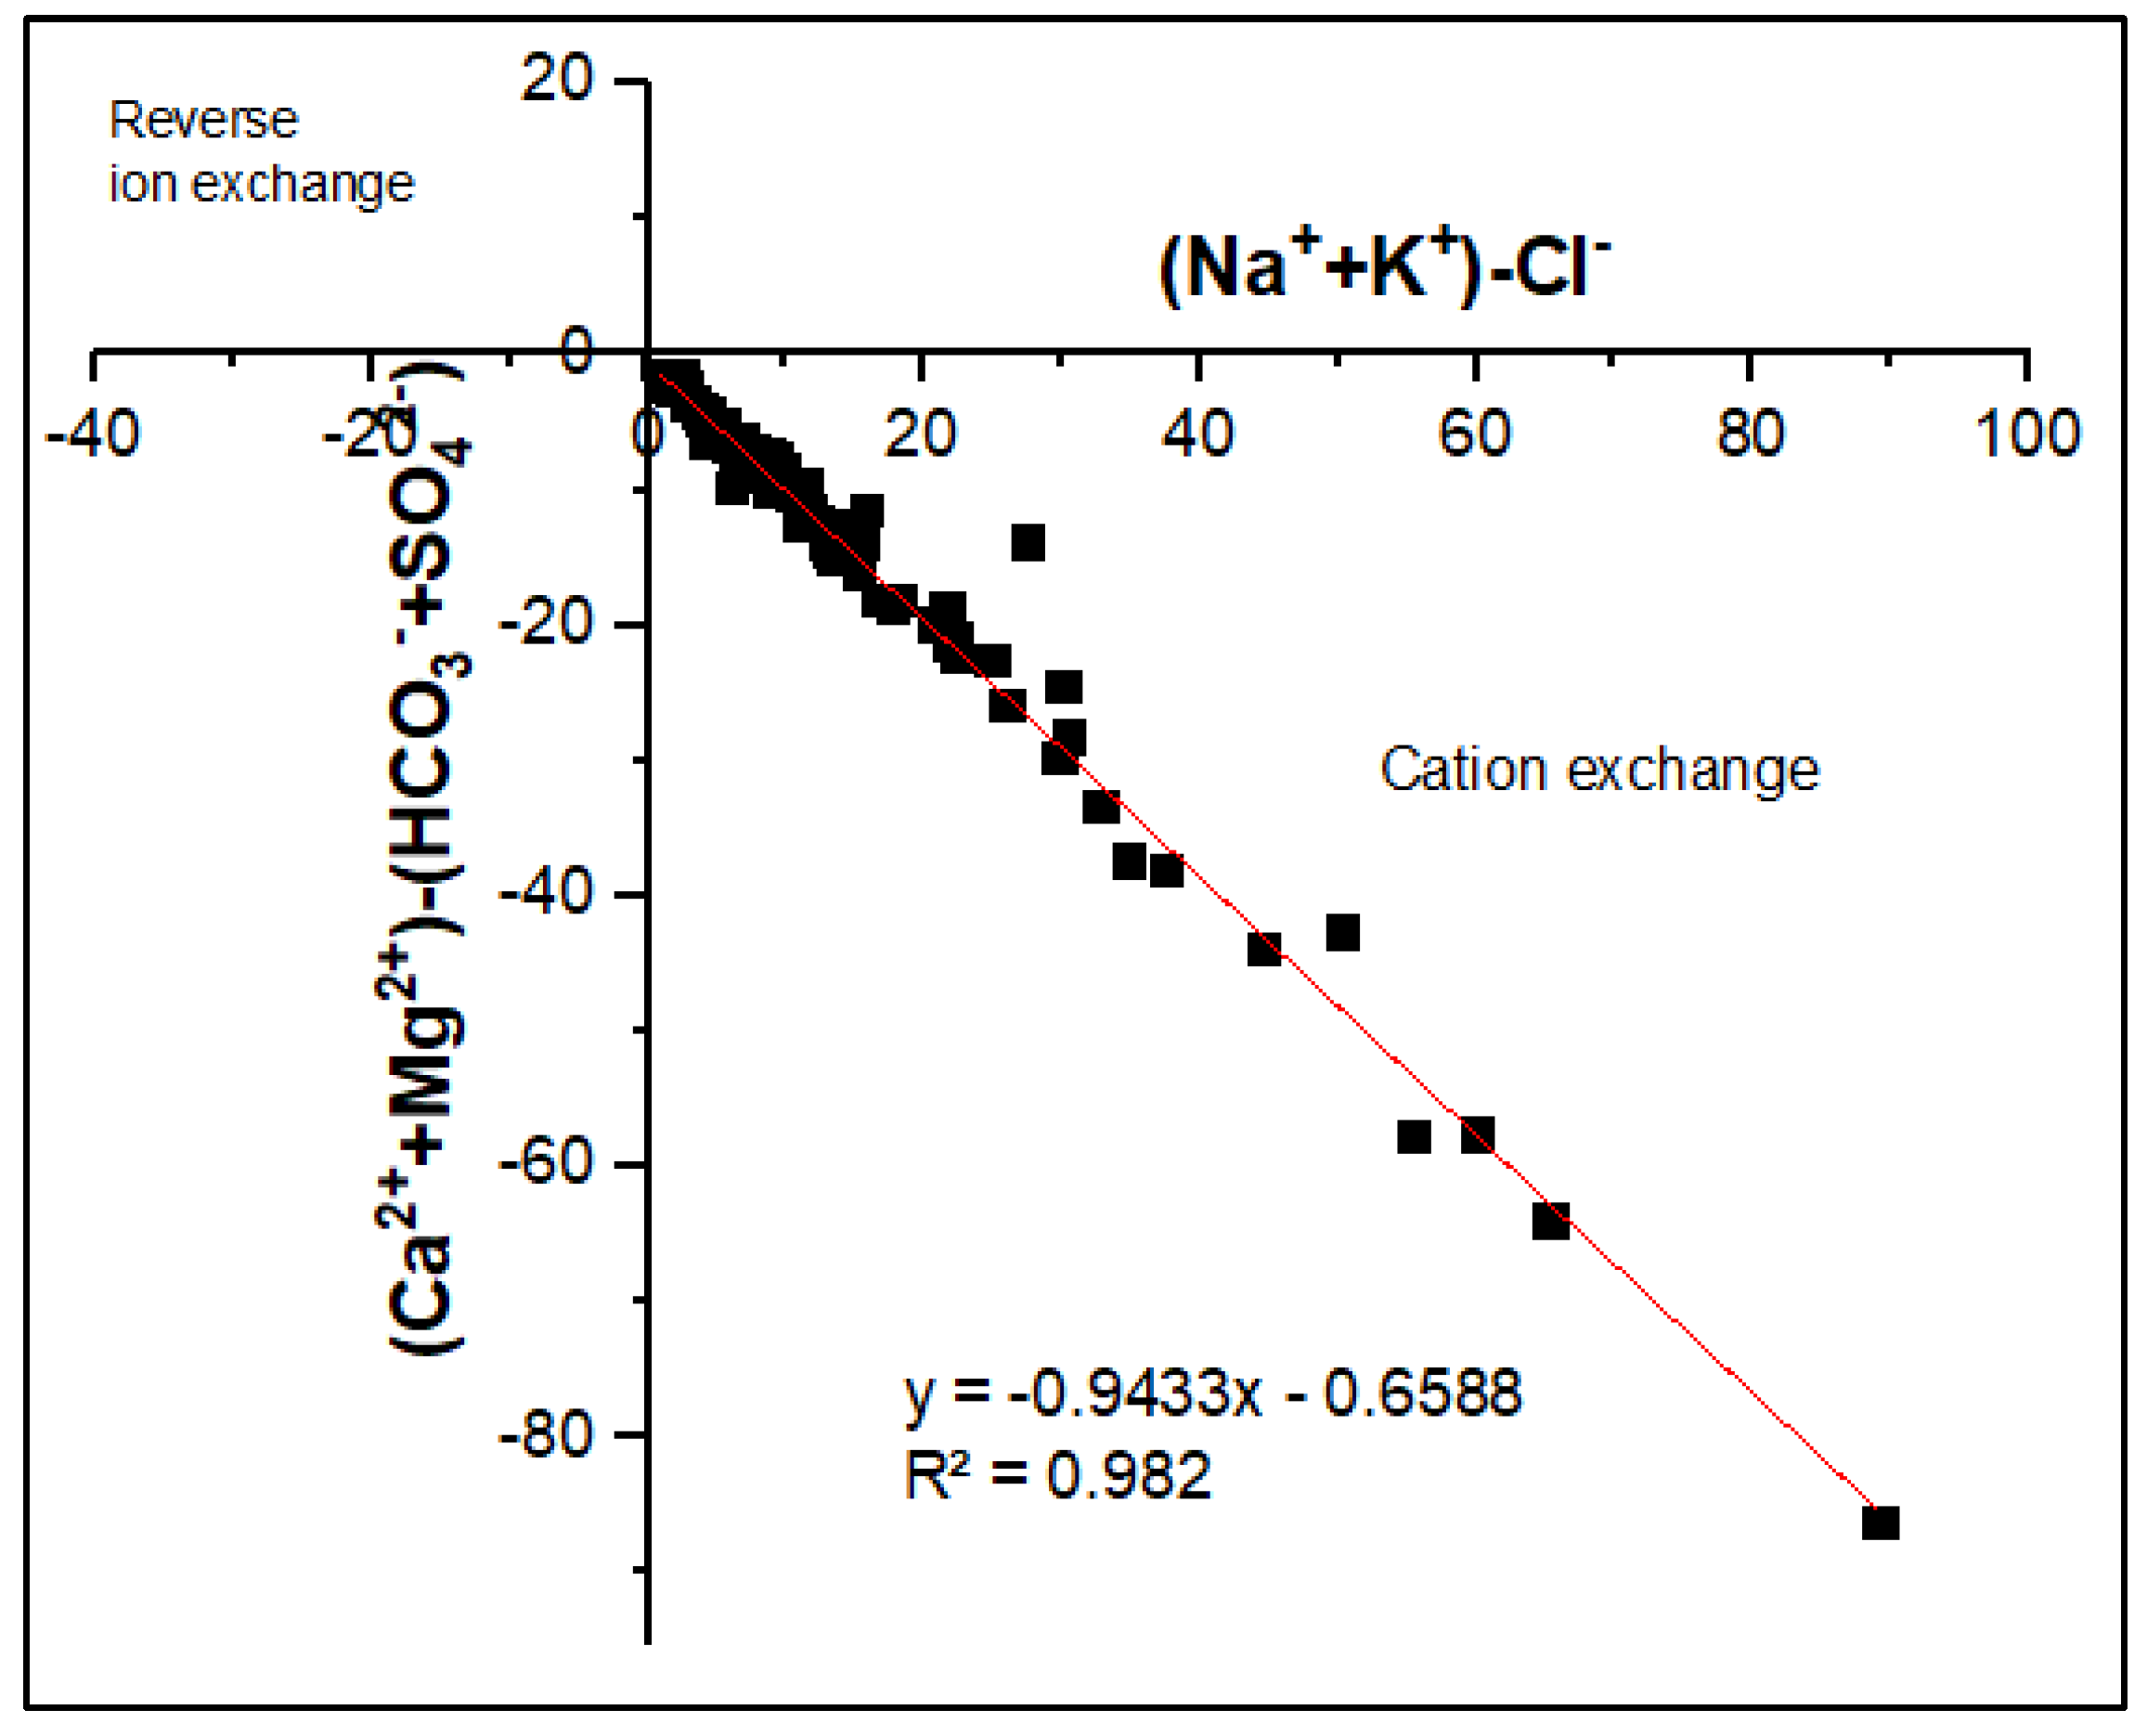
Figure 10.
The distribution of the drinking WQI categories in the study area.
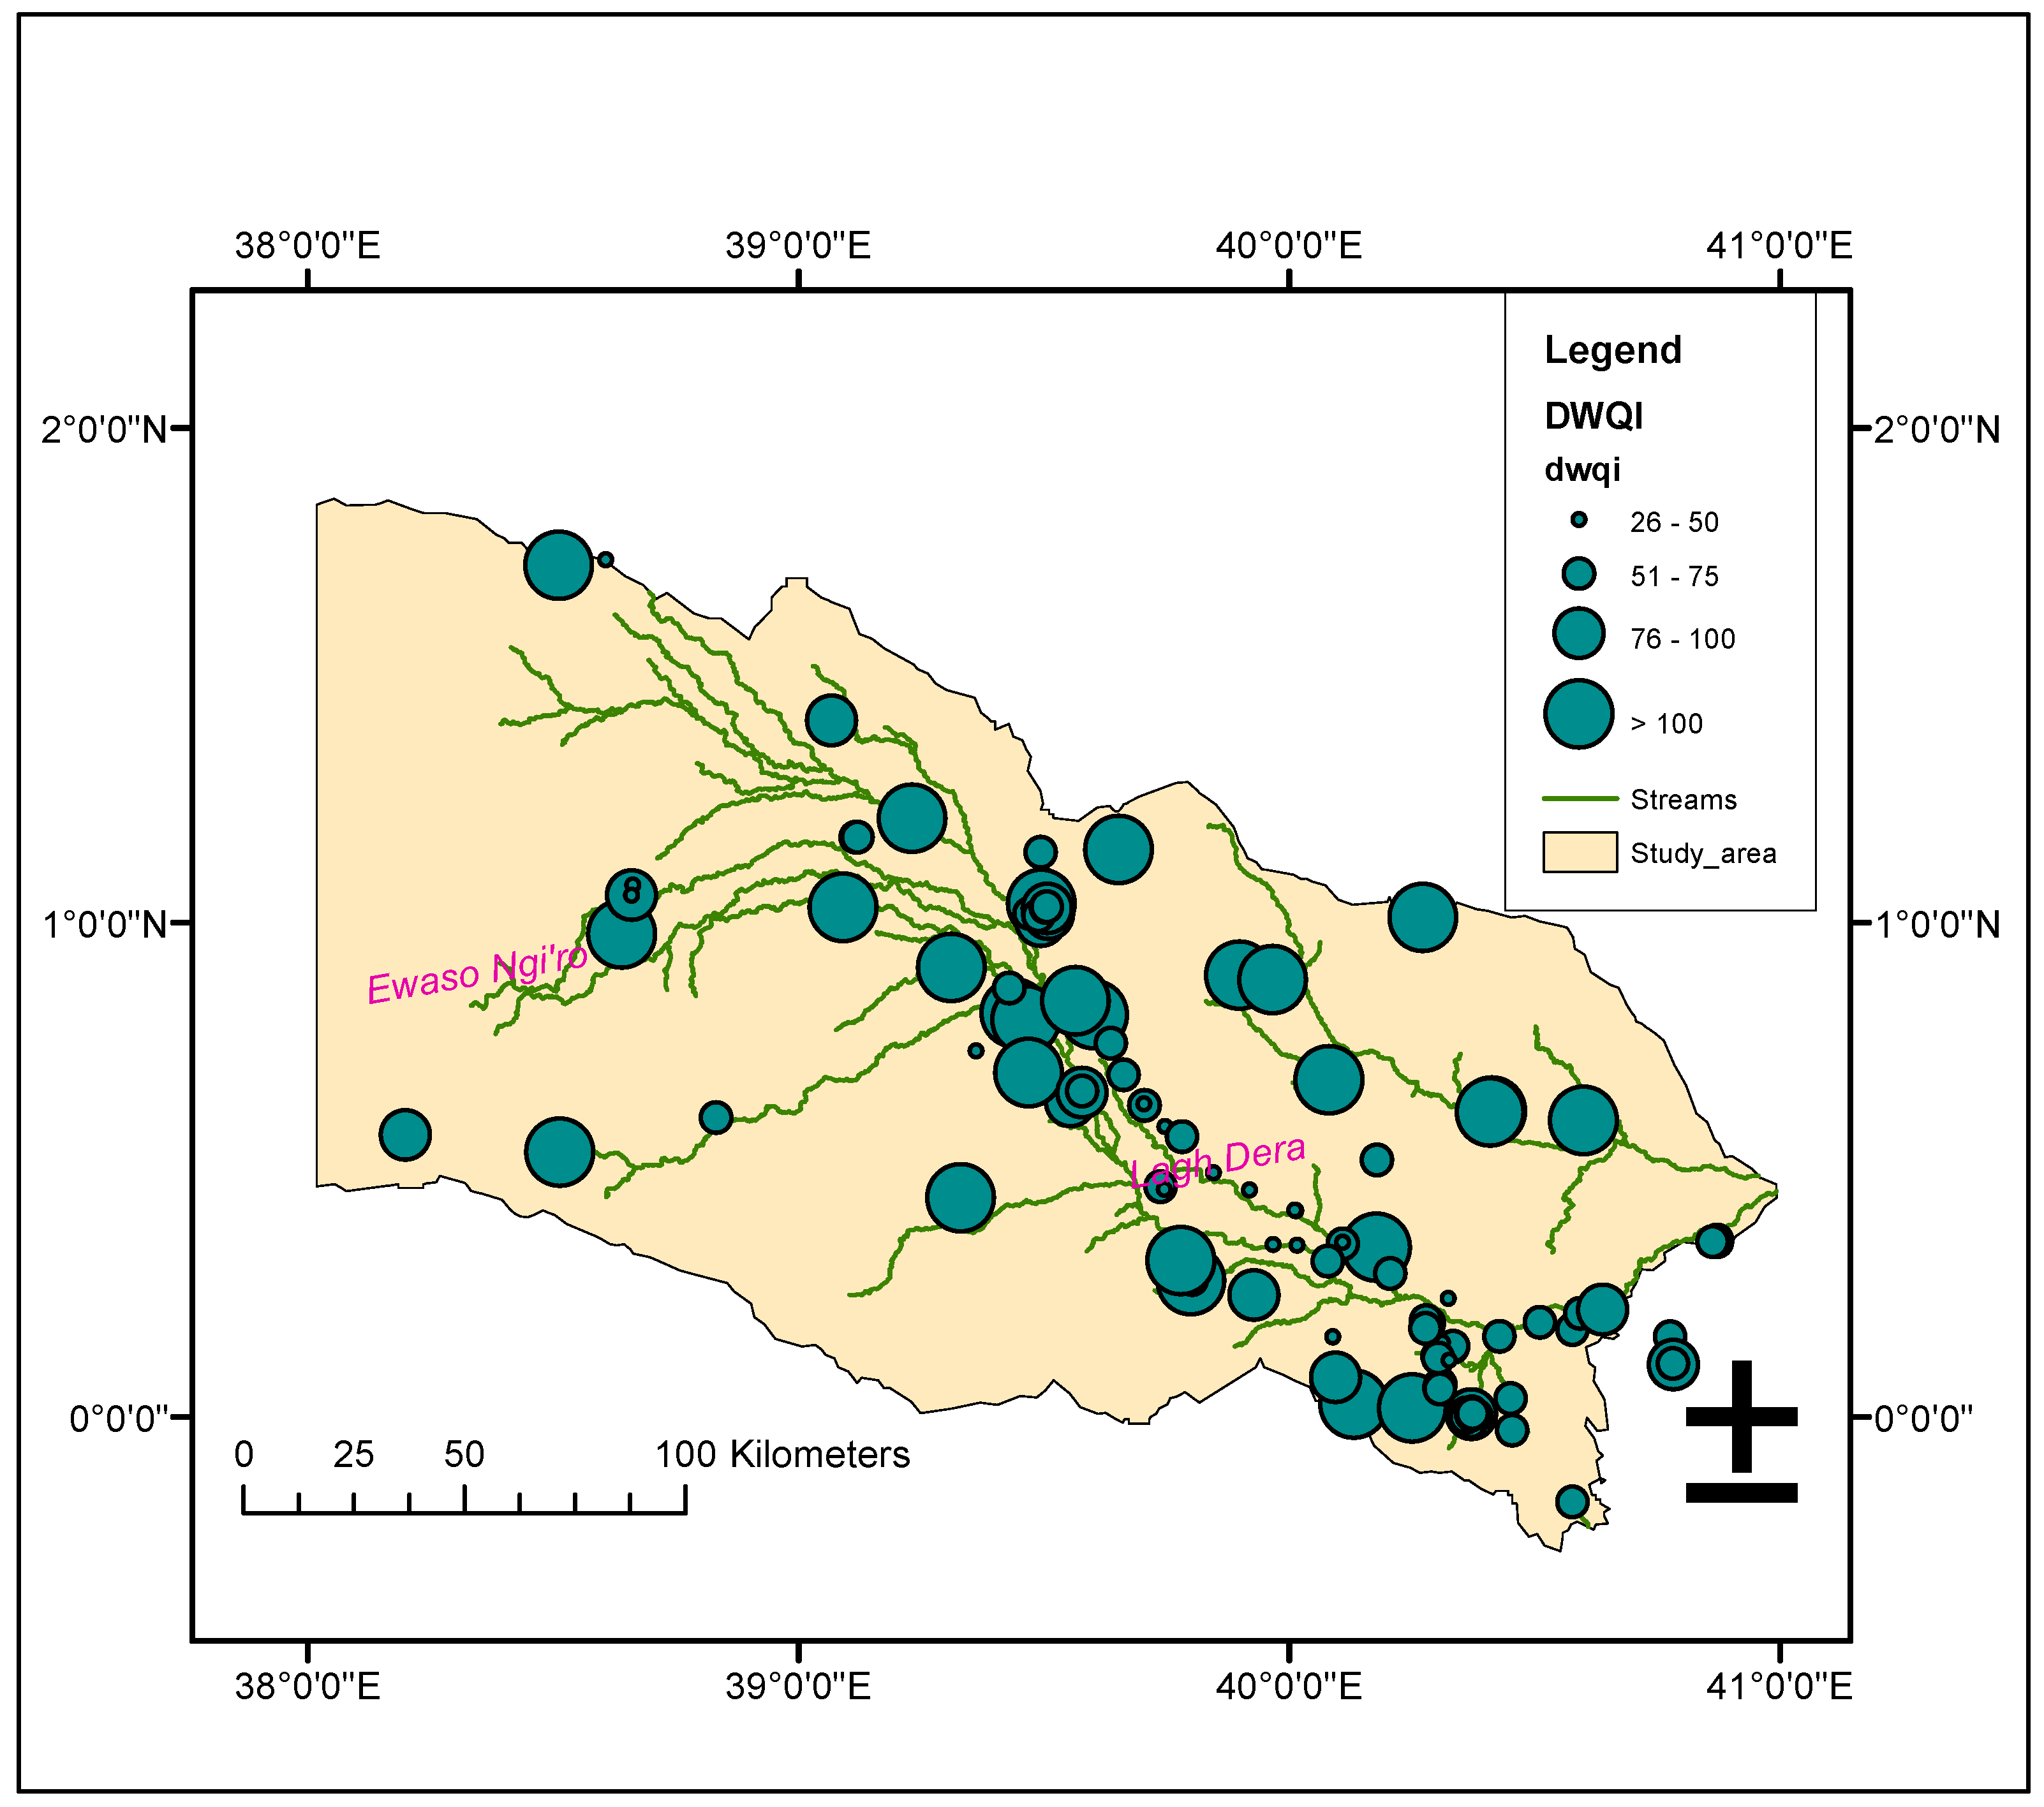
Figure 11.
Classification of the groundwater in the study area using the Wilcox salinity diagram.
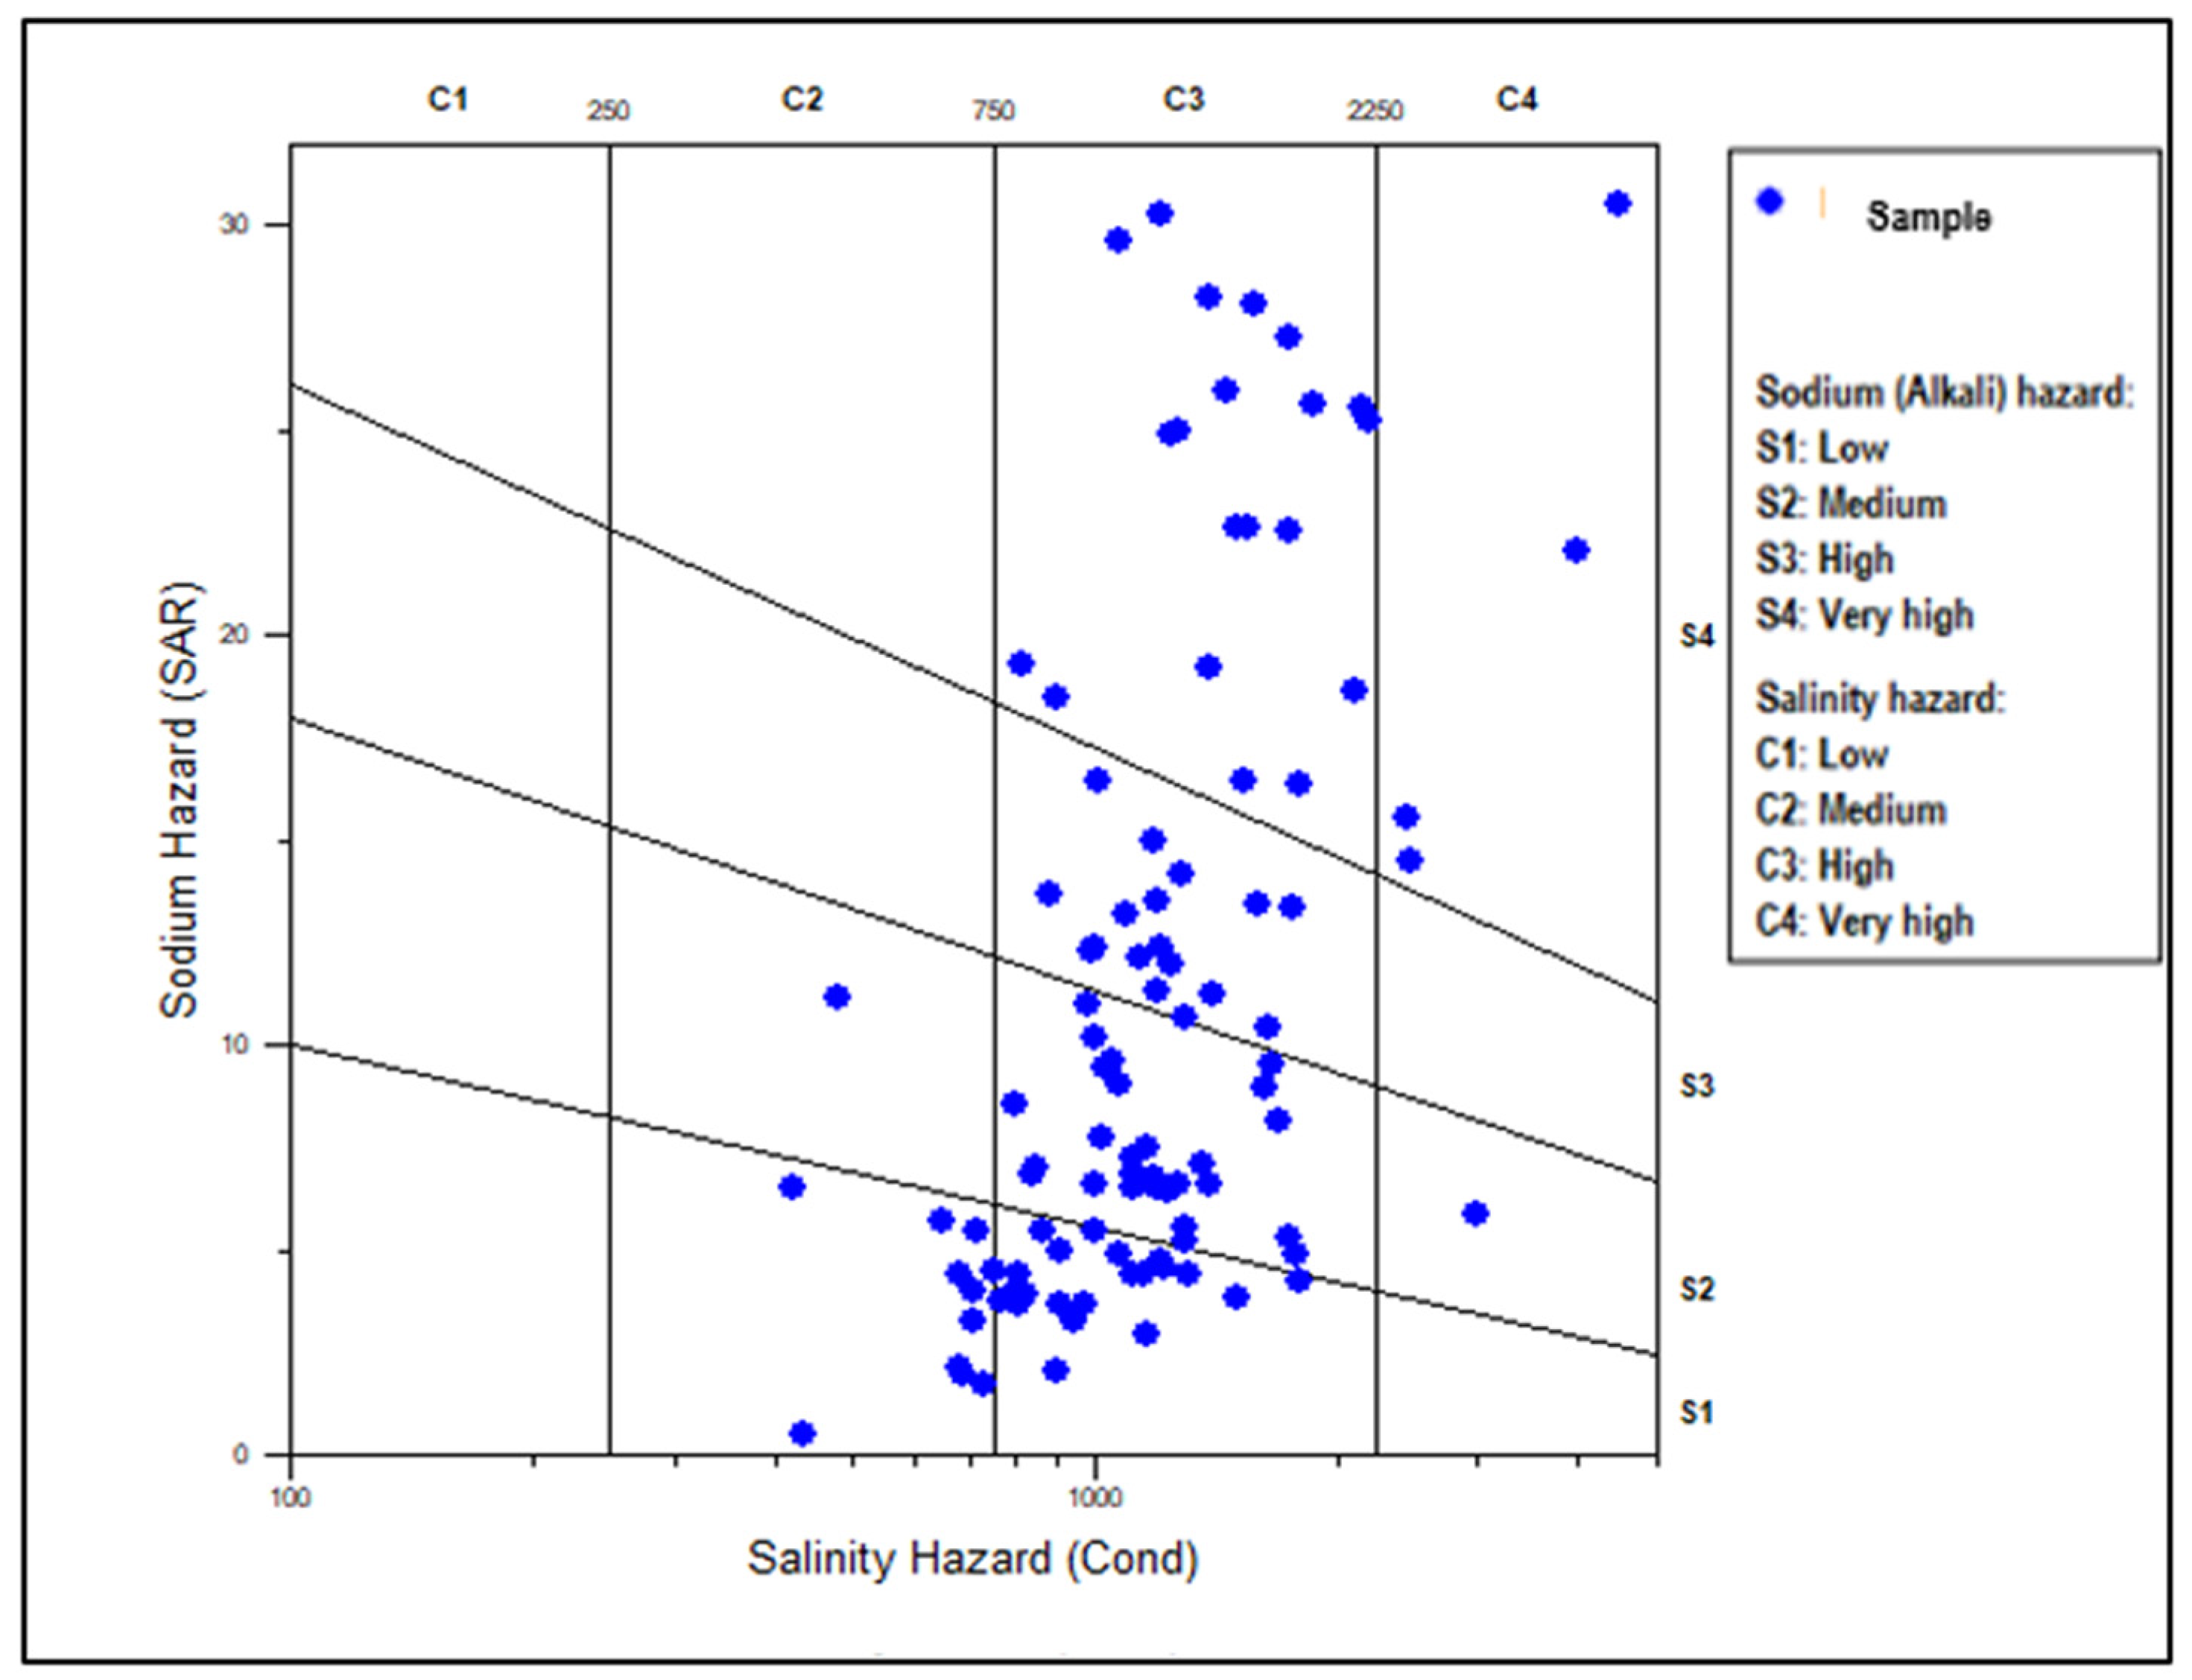
Figure 12.
The distribution of the IWQI categories in the study area.
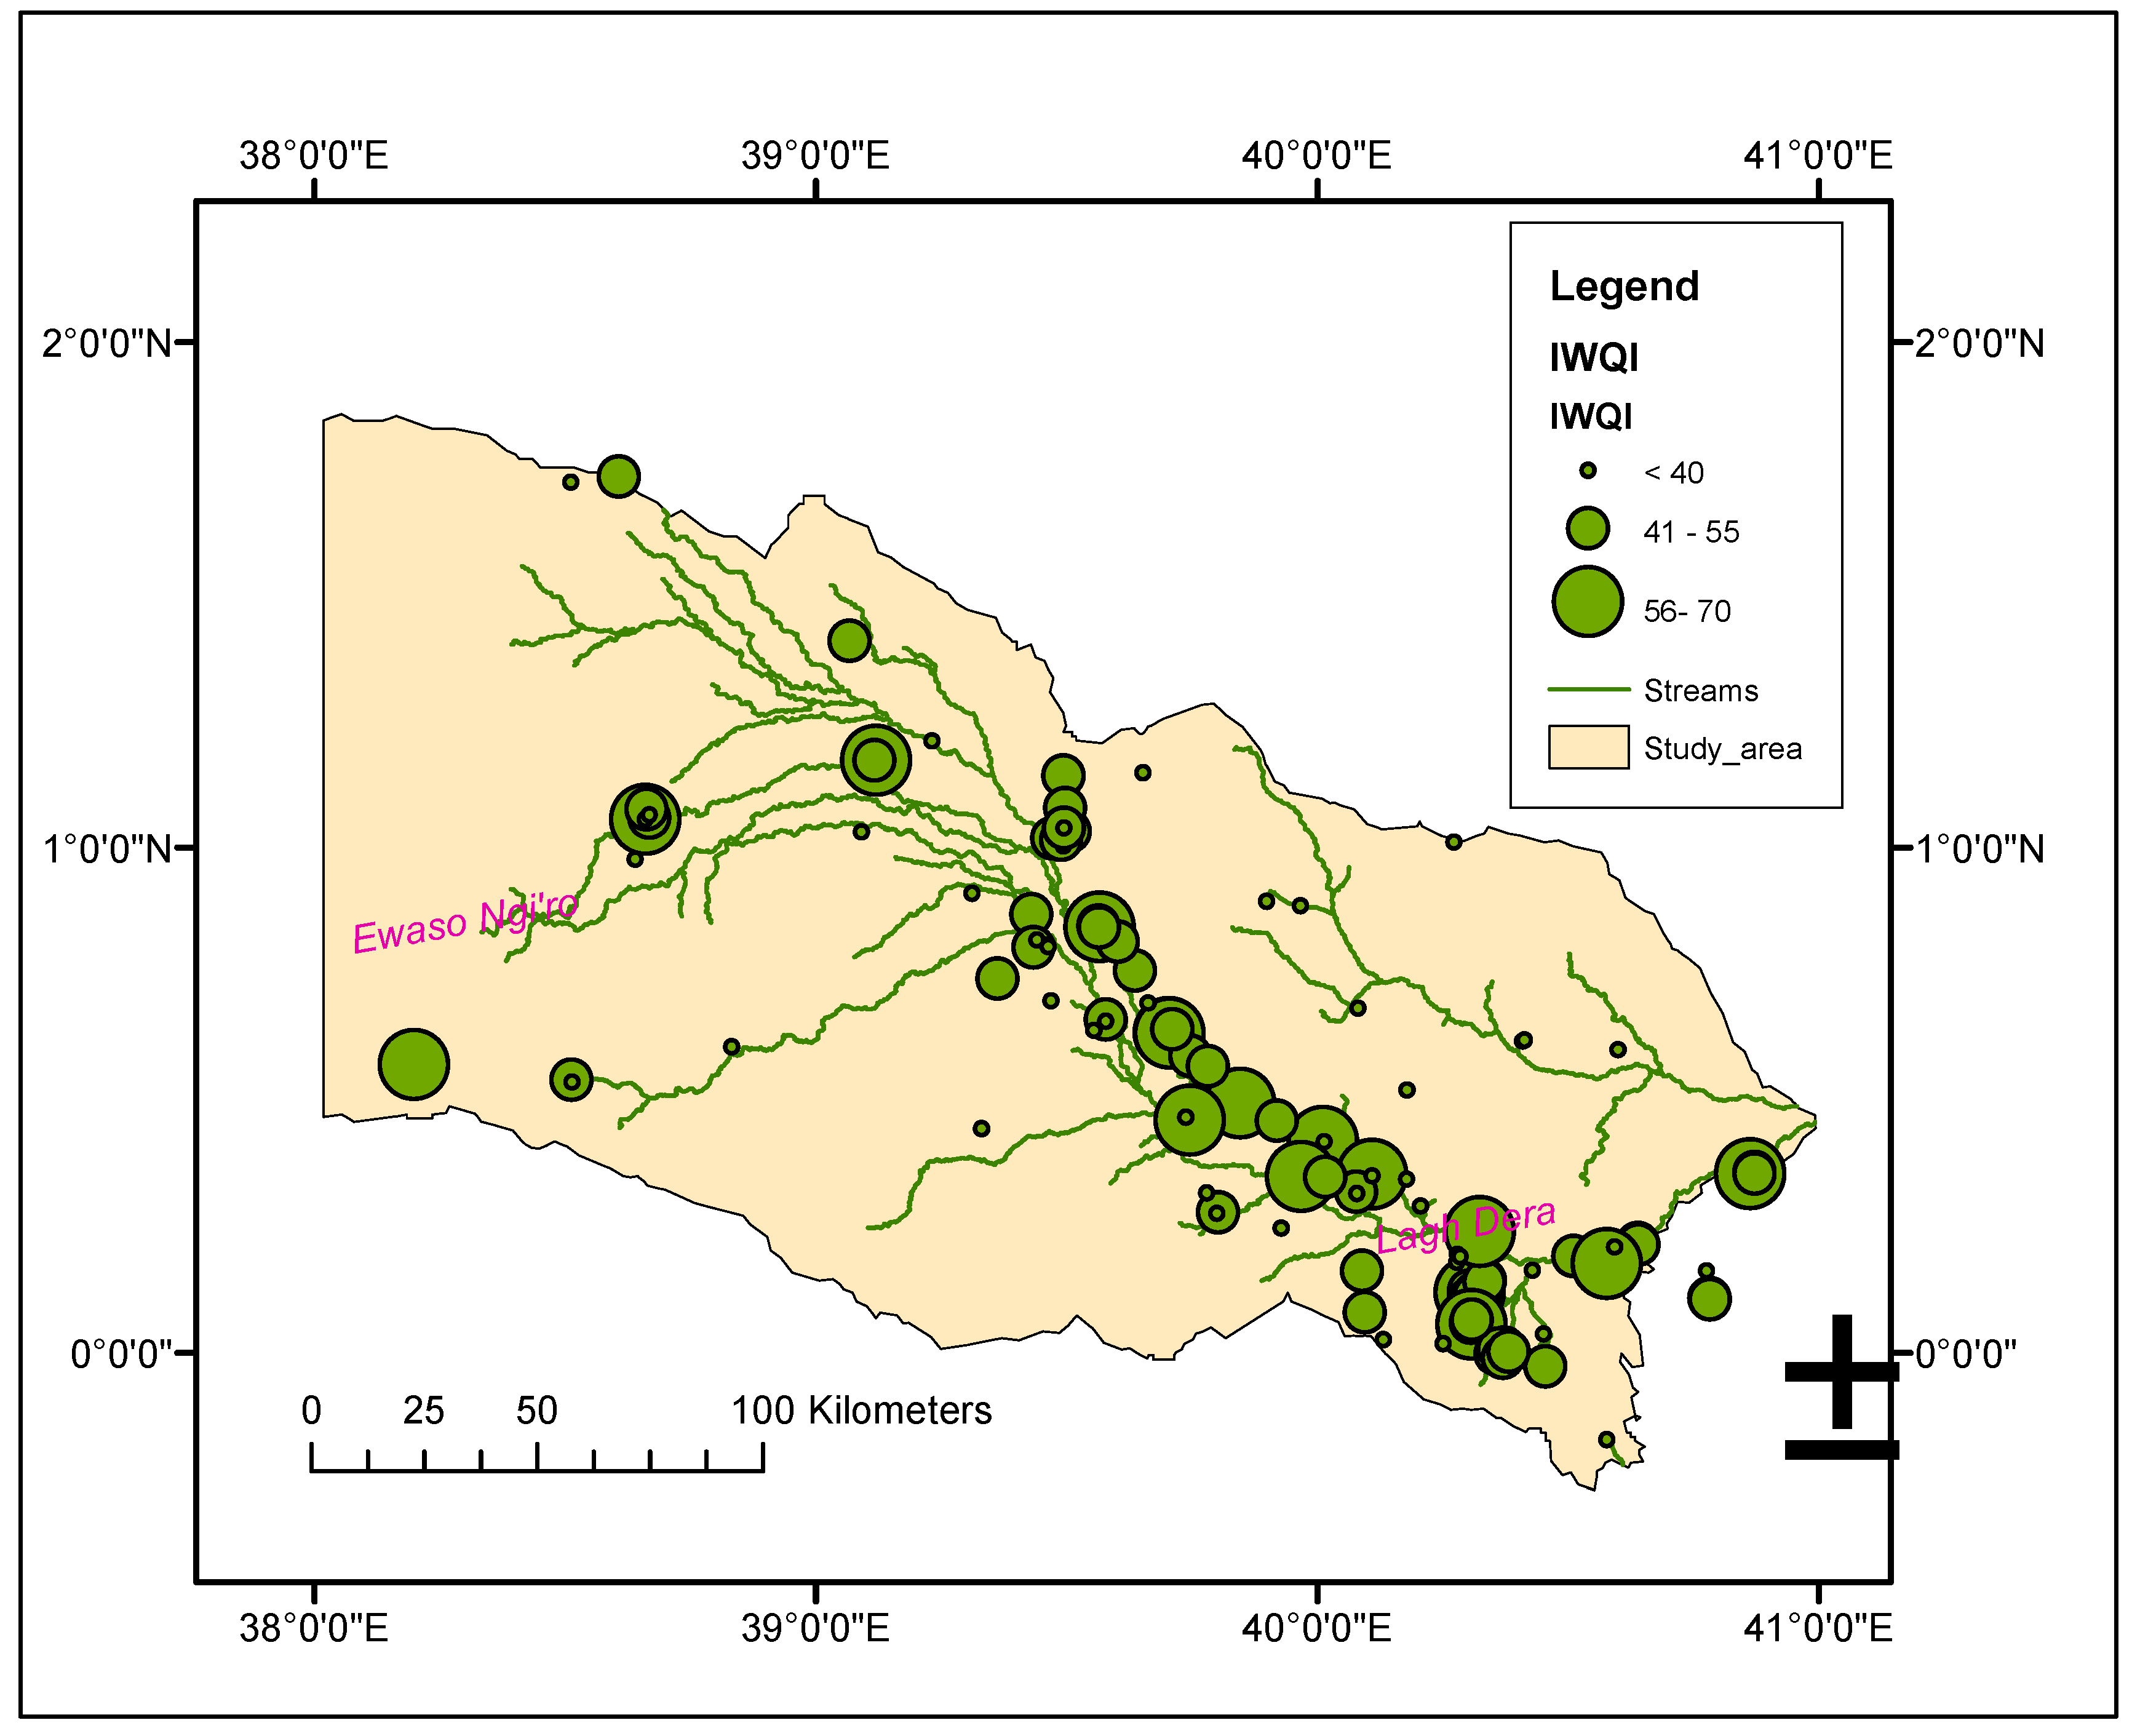
Table 1.
Weights for the IWQI parameters according to [79].
Table 1.
Weights for the IWQI parameters according to [79].
| Parameter | Weight (wi) |
|---|---|
| EC | 0.211 |
| Na+ | 0.204 |
| HCO3- | 0.202 |
| Cl- | 0.194 |
| SAR | 0.189 |
| Total | 1 |
| HCO3− (meq L−1) | Cl− (meq L−1) | Na+ (meq L−1) | SAR (meq L−1)1/2 | EC (μS cm−1) | Qi |
|---|---|---|---|---|---|
| 1 ≤ HCO3− <1.5 | 1 ≤ Cl− < 4 | 2 ≤ Na+ < 3 | 2 ≤ SAR < 3 | 200 ≤ EC < 750 | 85-100 |
| 1.5 ≤ HCO3−<4.5 | 4 ≤ Cl− < 7 | 3 ≤ Na+ < 6 | 3 ≤ SAR < 6 | 750 ≤ EC < 1500 | 60-85 |
| 4.5 ≤ HCO3−<8.5 | 7 ≤ Cl− < 10 | 6 ≤ Na+ < 9 | 6 ≤ SAR < 12 | 1500 ≤ EC < 3000 | 35-60 |
| HCO3− < 1 or HCO3− ≥ 8.5 | 1< Cl− ≥ 10 | Na+ < 2 or Na+ ≥ 9 | 2 < SAR ≥ 12 | EC > 200 or EC ≥ 3000 | 0-35 |
Table 4.
Correlation matrix between various parameters in groundwater.
| Variables | EC | TDS | Cl- | SO4- | NO3- | HCO3- | Na+ | K+ | Ca2+ | Mg2+ | pH |
|---|---|---|---|---|---|---|---|---|---|---|---|
| EC | 1 | 0.96 | 0.76 | 0.78 | -0.05 | 0.60 | 0.93 | 0.14 | -0.05 | -0.02 | 0.14 |
| TDS | 0.96 | 1 | 0.66 | 0.83 | -0.06 | 0.77 | 0.93 | 0.143 | -0.08 | -0.06 | 0.19 |
| Cl- | 0.76 | 0.66 | 1 | 0.80 | 0.33 | 0.15 | 0.86 | 0.20 | 0.31 | 0.26 | -0.01 |
| SO42- | 0.78 | 0.83 | 0.80 | 1 | 0.17 | 0.51 | 0.90 | 0.22 | 0.11 | 0.08 | 0.09 |
| NO3- | -0.05 | -0.06 | 0.33 | 0.17 | 1 | -0.11 | 0.17 | 0.12 | 0.56 | 0.42 | -0.03 |
| HCO3- | 0.60 | 0.77 | 0.15 | 0.51 | -0.11 | 1 | 0.63 | 0.05 | -0.13 | -0.13 | 0.31 |
| Na+ | 0.93 | 0.93 | 0.86 | 0.90 | 0.17 | 0.63 | 1 | 0.13 | 0.098 | 0.06 | 0.17 |
| K+ | 0.14 | 0.14 | 0.20 | 0.22 | 0.12 | 0.05 | 0.13 | 1 | 0.41 | 0.61 | -0.20 |
| Ca2+ | -0.05 | -0.08 | 0.31 | 0.11 | 0.56 | -0.13 | 0.10 | 0.41 | 1 | 0.66 | -0.25 |
| Mg2+ | -0.02 | -0.06 | 0.26 | 0.08 | 0.42 | -0.13 | 0.06 | 0.61 | 0.66 | 1 | -0.19 |
| pH | 0.14 | 0.20 | -0.01 | 0.09 | -0.03 | 0.31 | 0.17 | -0.20 | -0.25 | -0.19 | 1 |
| Values in bold are different from 0 with a significance level of alpha=0.05 | |||||||||||
Table 5.
Classification of groundwater using Cl-/ HCO3- ion ratio.
| Classification scheme | Categories | Ranges | Percent of samples |
|---|---|---|---|
| Cl-/ HCO3- | good quality | < 0.5 | 81.4 |
| slightly contaminated | 0.5 – 1.3 | 11.6 | |
| moderately contaminated | 1.3 – 2.8 | 5.4 | |
| highly contaminated | 2.8 – 6.6 | 0.7 | |
| extremely contaminated | 6.6 – 15.5 | 0.9 |
Table 8.
Showing the classification of groundwater in the study area using irrigation parameters.
| Classification scheme | Categories | Ranges | Percent of samples |
|---|---|---|---|
| SAR (Richards 1954) | Excellent | <10 | 39.54 |
| Good | 10-18 | 17.83 | |
| Doubtful | 18-26 | 9.30 | |
| Unsuitable | >26 | 33.33 |
Disclaimer/Publisher’s Note: The statements, opinions and data contained in all publications are solely those of the individual author(s) and contributor(s) and not of MDPI and/or the editor(s). MDPI and/or the editor(s) disclaim responsibility for any injury to people or property resulting from any ideas, methods, instructions or products referred to in the content. |
© 2025 by the authors. Licensee MDPI, Basel, Switzerland. This article is an open access article distributed under the terms and conditions of the Creative Commons Attribution (CC BY) license (http://creativecommons.org/licenses/by/4.0/).
Copyright: This open access article is published under a Creative Commons CC BY 4.0 license, which permit the free download, distribution, and reuse, provided that the author and preprint are cited in any reuse.


