
Submitted:
10 April 2025
Posted:
10 April 2025
You are already at the latest version
Abstract
This study explores the impact of polysaccharides from cultivated edible mushrooms Lentinus squarrosulus and Lentinus polychrous on bacterial microbiota, called bacteriome. Initially two mushroom mycelium isolates PB1 and LP1 were identified as L. squarrosulus PB1 and L. polychrous LP1, respectively, through molecular-based techniques. In-house mushroom cultivation and polysaccharide extraction revealed the sustainable source of mushroom polysaccharide. The fermentation of crude polysaccharide extracted from PB1 and LP1 designated as LS and LP, respectively, changed the gut bacteria by increasing the amounts of the beneficial bacteria genera of Bacteroides and Parabacteroides while reducing the harmful Prevotella. The fermentation process also led to an increase in a potentially opportunistic pathogen Fusobacterium. The reduction in the Firmicutes-to-Bacteroidota (F/B) ratio and Blautia-to-Bacteroides (Bla/Bac) was found after the fermentation with either LS and LP. Fermentation with LS and LP also led to pH reductions, this might be related to the fermentation end-products. This study highlights the potential of the reinforcing crude polysaccharides from these two Lentinus species for gut health applications. However, more in-depth research is needed to understand how these polysaccharides selectively stimulate with gut bacteria and their effects on different diseases to confirm their health benefits.
Keywords:
Lentinus polychrous
; Lentinus squarrosulus
; polysaccharide
; prebiotic
; human gut bacteriome
; in vitro fecal batch fermentation
1. Background
Currently, the study of the human microbiome has led to significant new medical knowledge, specifically the association between the human gut microbiome and the human states of either health or disease [1]. It has been found that key factors in the development of various diseases such as asthma [2], obesity [3], cardiovascular diseases [4], autism [5], and cancer [6] are influenced by the imbalance in the gut microbiome, called dysbiosis. This knowledge has led to the reasonable idea of developing new prevention and treatment strategies. Notably, recent studies have highlighted the therapeutic potential of prebiotics in disease management through the restoration of gut microbiome balance [7].
Prebiotics are defined as a substrate that is selectively utilized by host microorganisms, conferring a health benefit [8]. Unlike other nutrients, prebiotics resist digestion in the human gastrointestinal tract and instead undergo fermentation by gut microorganisms, especially probiotics. This fermentation process yields short-chain fatty acids (SCFAs) such as acetic acid, butyric acid, and propionic acid, along with other metabolites that support the health of vital organs, including the brain and heart [9,10]. Edible mushrooms have emerged as a significant source of prebiotic compounds, particularly polysaccharides like beta-glucans. In vitro studies have demonstrated that polysaccharides extracted from various wild mushrooms can stimulate the growth of probiotic strains such as Lactobacillus acidophilus and Lactobacillus rhamnosus [11]. Furthermore, in vitro fecal fermentation studies have revealed that polysaccharides from mushrooms, including Pleurotus eryngii [12], Tremella fuciformis [13], Agaricus bisporus [14], Hericium erinaceus [15], as well as dried fruiting body powder of Lentinus squarrosulus, can positively alter gut microbiota composition by increasing populations of beneficial bacteria, notably Bifidobacterium species [16]. These findings underscore the promising role of mushroom-derived polysaccharides in modulating the gut microbiome.
In the present study, we focused on two wild edible mushrooms, Lentinus squarrosulus PB1 and Lentinus polychrous LP1, identified through molecular-based methods. The fruiting bodies of these mushrooms were cultivated to serve as sources of polysaccharides. The extracted polysaccharides underwent characterization and were subsequently utilized in batch fecal fermentation experiments to assess their impact on human gut bacteriome composition. Our findings support the potential application of polysaccharides derived from edible mushrooms in modulating the human gut microbiome.
2. Methods
2.1. Ethical Approval
The procedure for the collection and usage of fecal samples from the volunteers was approved by the Ubon Ratchathani University Ethics Committee for Human Research under the permission number UBU-REC-35/2566.
2.2. Collection of Wild Edible Mushroom Mycelium
Two wild mushroom isolates coded as PB1 and LP1 are our wild mushroom mycelium collections. The mushroom mycelium PB1 was originally isolated from Piboonmungsahan district, Ubon Ratchathani, Thailand. The code LP1 refers to another isolate obtained from the forest at Ubon Ratchathani University, located in Warin Chamrab district, Ubon Ratchathani, Thailand. The mycelium was submerged in sterile distilled water and was kept at ambient temperature.
2.3. Fungal Genomic DNA Extraction
The stock mycelium of each mushroom was re-grown on potato dextrose agar (PDA) (Oxoid, Basingstoke, United Kingdom) at 32°C for 7 days. The mycelium was harvested and used for genomic DNA extraction. The genomic DNA of mushrooms was extracted using the Prep Fungi/Yeast Genomic DNA Extraction Mini Kit according to the manufacturer’s instructions (Favorgen Biotech Corp., Ping Tung, Taiwan). The quality of extracted DNA was verified by measuring the absorbance at 260 and 280 nanometers. The value of the ratio A260/280 between 1.8 and 2.0 was accepted for further use. The extracted DNA was stored at −20°C until use.
2.4. Species Identification of Mushrooms
The identification of wild mushroom species was conducted using the polymerase chain reaction (PCR) method to amplify the 28S rRNA gene, followed by nucleotide sequencing and analysis. The oligonucleotide primers and amplification conditions are processed as in the previous report [17]. The ingredients for PCR were sourced from the AllTaq™ PCR Core Kit (Qiagen, Maryland, USA). The amplified products (amplicons) were verified by gel electrophoresis. The amplicons were purified with a HiYield™ Gel/PCR DNA Fragments Extraction Kit (RBC Bioscience, Taiwan). Nucleotide sequencing was conducted at the ATGC (Thailand Science Park, Thailand) utilizing the chain-termination DNA technique. The sequencing result was compared to fungal 28S rDNA sequences held in the National Center for Biotechnology Information (NCBI) database using extremely comparable sequences (megablast) parameter settings. The Molecular Evolutionary Genetics Analysis Version 11 (MEGA11) used the neighbor-joining method with bootstrap values for 1,000 replicates to construct the phylogenetic tree [18].
2.5. In-House Cultivation of Mushrooms
The purified mycelium of both PB1 and LP1 was grown on PDA (Oxoid) at 32°C for 7 days. After incubation, the mycelium with a size of 1×1 centimeter (cm) was cut from PDA and transferred into a ripe millet-containing bottle. The culture was incubated at 32°C for 14 days. Insert 8 to 10 millet seeds enveloped in mushroom mycelium into four designated locations on the side of the sawdust plastic bags, which were then incubated at ambient temperature in the mushroom cultivation house. The water was sprayed on the bags twice per day. After 14 days of incubation, fruiting bodies of mushrooms were harvested and used for crude polysaccharide extraction. The mushroom cultivation was conducted at a Pundee mushroom farm in Warin Chamrap District, Ubon Ratchathani Province, Thailand.
2.6. The Extraction of Crude Polysaccharides
The crude polysaccharide extracted from each mushroom was prepared as described in our previous report with some modification [19]. Ten grams of dried, ethanol-prewashed mushroom powder were mixed with 90 ml of distilled water. The mixture was incubated at 90°C in a sonication water bath for 30 min. The mixture was further incubated in a water bath without sonication at the same temperature for 3 h. After room temperature cooling of the mixture, the mixture was centrifuged at 9000×g for 20 min. The clear upper supernatant was collected and added to the butanol-chloroform solution at a 1:1 ratio (clear upper supernatant: butanol-chloroform solution). The mixture was centrifuged at 9000×g for 5 min. The upper phase of the solution was collected and mixed with absolute ethanol (VWR, BDH Chemical, Pennsylvania, United States) at a 1:4 ratio (upper phase supernatant: absolute ethanol). The mixture was further incubated at 4°C for 24 h. The mixture was centrifuged at 9000×g for 20 min. The pellet of extracted polysaccharide was washed with absolute ethanol and dried at 50°C for 3 h. Thereafter, the crude polysaccharide was crushed into a fine powder using a sterile mortar and pestle. In this study, the crude polysaccharides extracted from L. squarrosulus PB1 and L. polychrous LP1, are hereafter called LS and LP, respectively. The extraction yields were calculated as our previous report [19].
2.7. Determination of Total Carbohydrate
The total carbohydrate composition of the crude polysaccharide was assessed as previously outlined [20]. Briefly, an appropriate dilution of 50 µl of crude polysaccharide was combined with 150 µl of concentrated sulfuric acid (Fisher Scientific, Seoul, Republic of Korea). Subsequently, the mixture was combined with 30 µl of 5% (w/v) phenol (Fisher Scientific, Waltham, Massachusetts, United States). The solution was maintained at 90°C for 5 min. The reaction mixture was then allowed to cool to ambient temperatures. The absorbance of the reaction solution was measured at a wavelength of 490 nm using a microplate reader (Bio Chrom/EZ Read 2000, Biochrom Ltd., Waterbeach, Cambridge, UK). A D-(+)-glucose solution (PanReac Applichem, Darmstadt, Germany) at varying concentrations was employed to ascertain the standard concentration point.
2.8. Determination of Reducing Sugar, Protein Content, and Phenolic Compounds
A 3,5-dinitrosalicylic acid (DNS) test was used to measure the amount of reducing sugar in the extracted crude polysaccharide, as explained earlier [21]. The absorbance of the reaction mixture was measured at 540 nm using a microplate reader. A D-glucose solution (PanReac Applichem) was employed to ascertain the standard concentration. The protein content of the extracted crude polysaccharides was assessed as previously described [22]. The absorbance of the reaction mixture was measured at 595 nm using a microplate reader. Bovine serum albumin (Sigma-Aldrich) was used to prepare the standard protein solution. Analysis of phenolic compound content in polysaccharide extract samples was performed using previously reported methods [23].
2.9. Simulation of Human Gastrointestinal Digestion
The simulation of human gastrointestinal ingesting conditions followed the previous description [24]. Briefly, the digestion process consisted of three consecutive phases: oral phase, gastric phase, and intestinal phase. Table 1 displays all the chemical solutions and buffers used in the digestion process. For the oral phase, 5 g of crude polysaccharide powder, either LS or LP was mixed with simulated salivary fluid (SSF) supplemented with 1500 U/ml alpha-amylase (α-Amylase from human saliva Type XIII-A, lyophilized powder, 300-1,500 units/mg protein, Sigma-Aldrich product no. A1031-1KU). The solution was mixed by vortexing and incubated at 37°C for 2 min. For the gastric phase, the solution was further mixed with simulated gastric fluid (SGF) supplemented with 25,000 U/ml pepsin (pepsin from porcine gastric mucosa ≥3,200 units/mg protein, Sigma-Aldrich product no. P6887). The solution was mixed by vortexing and incubated at 37°C for 2 h. During the incubation, the solution was vortexed every 15 min. After the incubation, simulated intestinal fluid (SIF) with 800 U/ml porcine pancreatin (Sigma-Aldrich, Cat. No. P7545) and bile salts (Sigma-Aldrich, product no. B8756) was added to the solution. The solution was mixed by vortexing and incubated at 37°C for 2 h. In the final step, the solution tubes were centrifuged at 9000 rpm for 10 min to separate the supernatant from the solid residue that was further used for the fermentation process. To prepare the control, called tubeA, in the digestion process, sterile water was used instead of crude polysaccharides.
2.10. Selection and Allocation of Volunteers for the Feces Donation
People who live in Khoo Mueang Subdistrict, Warinchamrap District, Ubon Ratchathani Province, were invited to be volunteers. The rationale and aims of the research project, as well as the criteria for selecting the volunteer, were thoroughly explained to the suspect volunteer. The criteria for selecting the volunteer included: 1) who had an age from 18 to 35 years old, 2) who had no condition with any recognized gastrointestinal diseases, and 3) who had not received antibiotics for 6 months prior to donating the fecal sample.
2.11. Fecal Slurry Preparation
The fecal samples were obtained from 4 registered volunteers without restriction to gender. The fecal samples were collected in sterile bottles and were kept in microaerobic conditions by using an anaerobic jar (Schuett Biotec, Göttingen, Germany) containing the oxygen absorber-CO2 generator system Campygen (Oxoid) and were carried to the microbiology laboratory, the College of Medicine and Public Health, Ubon Ratchathani University, Warinchamrap, Ubon Ratchathani, Thailand. The fecal slurry was prepared as previously described [25]. In short, 10 grams of each fecal sample were measured and thoroughly mixed in a 50 ml tube by shaking it continuously at 2000 rpm for 5 minutes. Thirty-two grams of mixed feces were aliquoted and dissolved with phosphate buffer pH 7.2 (Sigma-Aldrich) to obtain the final concentration of 32% (w/v) feces, which were immediately used in the fermentation process.
2.12. In Vitro Batch Fermentation
The crude polysaccharides, LS and LP, that have undergone gastrointestinal simulation digestion were used in the fermentation with the fecal slurry of volunteers using the batch fermentation method. Two control sets include the mConA (used of Milli-Q instead of tested substance) and mConB (used of solid residue and supernatant from tubeA from the simulation of the human gastrointestinal digestion step) were included in the experiment. The fermentation employed galacto-oligosaccharides (GOS) as the reference prebiotic. Table 2 displays the composition of each testicular sample, also referred to as the treatment. All solutions were made in 50 ml sterile tubes, mixed with a vortex, and the tube caps were slightly opened and kept in the BACTRON anaerobic chamber (Sheldon Manufacturing Inc., Cornelius, Oregon, USA) at 37°C. The mixture in each treatment was collected for genomic DNA extraction at 0 and 24 h of incubation.
2.13. Extraction and Qualification of Genomic DNA
The total genomic DNA from each sample was extracted by ZymoBIOMICS DNA Miniprep Kit (Zymo Research Corp., Irvine, CA, USA) following the manufacturer’s protocol. The quality and quantity of genomic DNA were measured by the Qubit Fluorometer (Thermo Fisher Scientific, USA). The conventional polymerase chain reaction (PCR) with primer pair 27F (5’-AGAGTTTGATCCTGGCTCAC-3’) and 1492R (5’-GGTTACCTTGTTACGCTT-3’) was used to amplify the target 16S rRNA gene of bacteria. The amplified product was verified by agarose gel electrophoresis. The extracted DNA was kept at -20 °C until use.
2.14. Metagenomics 16S rRNA Sequencing and Analysis
The V3–V4 hypervariable region of the 16S rRNA gene was amplified using universal primers (341F, 5’-CCTAYGGGRBGCASCAG-3’, 806R, 5’-GGACTACNNGGGTATCTAAT-3’), and high-fidelity Phusion polymerase, followed by purification with AMPure XP beads. Libraries were prepared with Illumina adapters and sequenced on an Illumina NovaSeq 6000 platform, generating 250 bp paired-end reads. Raw sequences were cleaned up using QIIME2 [27], with DADA2 [28] helping to remove errors and identify unique sequences. Taxonomic classification was performed using a Naïve Bayes classifier trained on the SILVA database (v138) [29]. Alpha diversity (Shannon, observed feature, Chao1, and Simpson indices) and beta diversity (Bray-Curtis and UniFrac) were analyzed in QIIME2, with principal coordinate analysis (PCoA) and NMDS for visualization. Phylogenetic trees were constructed using FastTree [30]. Differential abundance analysis was conducted using LEfSe [31].
3. Results
3.1. Species Identification of Mushrooms
The PCR results indicated that the amplified product with approximately 1,000 base pairs (bp.) was obtained from mushrooms with codes PB1 and LP1 (Figure 1, a). Nucleotide sequencing analysis of the amplified product from mushrooms PB1 and LP1 revealed that they had nucleotide sequences of 1,075 bp. and 1,045 bp., respectively. The 1,045 bp nucleotide sequence from LP1 showed a 100% identity with the nucleotide sequence of a large subunit of the 28S ribosomal RNA gene (LSU-28S rRNA) of the mushroom Lentinus polychrous voucher KM141387. (GenBank accession No. KP283514.1). The 1,075 bp nucleotide sequence from PB1 has an identical nucleotide sequence to the LSU-28S rRNA of the mushroom Lentinus squarrosulus voucher FRIM4180. (GenBank accession no. KP283517.1). Analysis of the phylogenetic tree (Figure 1, b) demonstrated that the LSU-28S rRNA nucleotide sequence of PB1 and LP1 mushrooms are closely grouped into the LSU-28S rRNA gene of the Lentinus squarrosulus group and the Lentinus polychrous group, respectively. Therefore, based on these analysis results, the species of PB1 and LP1 mushrooms can be classified as Lentinus squarrosulus and Lentinus polychrous, respectively. Thus, the strain name were designated as Lentinus squarrosulus PB1 and Lentinus polychrous LP1.
3.2. Deposition of Ribosomal RNA Gene Sequence in the NCBI Database
The LSU-28S rRNA gene sequences of L. polychrous LP1 and L. squarrosulus PB1 were deposited in the National Center for Biotechnology Information (NCBI) database with the accession numbers PQ340139 and OR554123, respectively.
3.3. Cultivation of Mushrooms
The results of cultivating mushroom mycelium in millet seeds showed that after 14 days of incubation, the mycelium of L. polychrous LP1 and L. squarrosulus PB1 developed fully white mycelium in the bottles (Figure 2, a). The results of growing mushrooms in sawdust plastic bags showed that L. polychrous LP1 had brownish funnel-shaped gills, while L. squarrosulus PB1 had white, button-like caps. (Figure 2, b). The fruiting bodies of mushrooms were initially harvested at approximately 14 days after cultivation (when the caps start to flatten). After two weeks of mushroom harvesting, it was found that each type of mushroom produced approximately 200 to 300 g/one sawdust plastic bag.
3.4. Compound Component in Extracted Crude Polysaccharides
After extraction, the crude polysaccharides derived from L. squarrosulus PB1 (designated as LS) and L. polychrous LP1 (designated as LP) were light brown in color (Figure 3). As shown in Table 3, it was revealed that the major components of both LS and LP were carbohydrates with low amounts of protein and reducing sugars. The extraction yield of crude polysaccharides (LS and LP) were 7.68±0.04 and 9.29±0.03, respectively. The polysaccharide contents of LS and LP were approximately calculated as 81.81% and 82.90% of total carbohydrates. Moreover, despite their small quantities, both LS and LP contain the phenolic compound.
3.5. Characteristics of Volunteers for the Feces Donation
The total of stool samples was collected from the four volunteers. All the volunteers were male, with an average age of 21.5 years. The general interview revealed they consumed a balanced diet, had no recognized chronic diseases, were not undergoing treatment for gastrointestinal diseases, had no history of infectious diseases, and had no history of taking any antibiotics in the past 6 months. All the volunteers are willing to participate in the research project.
3.6. Total Number of Fermentation Treatments
In this research, two testing treatments were examined to investigate how they affected the bacteriome in human feces. These treatments were crude polysaccharides of LS and LP. In addition, the control groups were included in the study: one was the reference prebiotic GOS, and the other two controls from the digestion process were called mConA and mConB. The original fecal slurry solution (BL) from the volunteers was also determined as the starting bacteriome. Each group was performed in quadruplicate, except for the control group of GOS, due to two fermentation tubes being lost during the fermentation; thus, only two GOS samples were retained. This is the same for the original fecal slurry solution (BL), three samples of BL were retained. The samples of pre- (0 h) and post-fermentation (24 h) were done in the fermentation process and were used for performing the nucleotide sequencing covering the hypervariable regions V3-V4 on the bacterial 16S rRNA gene.
3.7. Verification of the Genomic DNA Extracted Before and After the Fermentation
Based on conventional PCR followed by agarose gel electrophoresis, it was found that specific DNA fragments with approximately 1,500 base pairs (as indicated by the arrow in Figure 4) encompassing the 16S rRNA gene could be amplified from all fermentation treatments. Moreover, the quantity and purity of genomic DNA verified by NanoDrop spectrophotometer, (Thermo Fisher Scientific Inc., Wilmington, DE, USA) showed an acceptable amounts and quality that met an acceptable criterion for 16S metagenomic DNA sequencing (supplemental data Table S1).
3.8. The Quality of Nucleotide Sequencing Output
The sequencing data output revealed that the average number of paired-end raw reads (raw PE) per sample was 203,341 (Supplemental data Table S2). After retrieving the raw reads to obtain the effective reads (Nochime), 161,046 reads were finally retained, and the average length was 417 nucleotides.
3.9. Bacterial Species Present in the Samples Were Almost Detected and Analyzed
The Shannon refraction curve analysis (Figure 5) revealed that the number of sequence reads increased, but the observed amplicon sequence variants (ASVs) became flattened, indicating that nearly all bacterial species in all samples have been captured and sequenced, and thus, the sequencing results can be reliable and accurate.
3.10. Crude Polysaccharides Altered the Diversity of Gut Microbiota
The rank abundance curves analysis (Figure 6) demonstrates the diversity (species richness and evenness) of gut microbiota within the treatment groups. The species richness represents the total number of species, while the species evenness represents the distribution of individuals among species. After 24 h of fermentation, the reference prebiotic GOS (GOS.24h) treatment had the lowest value of species rank compared to other treatments, indicating the dominance of the fewest bacterial species in the sample. Similarly, the variety of bacterial species was less in the groups treated with LP (LP.24h) and LS (LS.24h) after 24 hours of fermentation compared to the samples taken before fermentation (0 h). Additionally, the alpha indices (Chao1 and Observed feature, which count all species including rare ones, and Shannon and Simpson, which measure how diverse the community is) are displayed in Figure 7. It was demonstrated that the number of bacterial species was slightly lowered after fermentation with crude polysaccharides LP and LS (Figure 7, a and b), but this decrease was not significant (p > 0.05). The evenness of the bacterial species was statistically significantly lowered after fermentation (Figure 7, c and d), indicating that LP and LS supported the growth of some specific bacterial species.
3.11. Beta Diversity Analysis Shows a Clear Distinction of Treatment Groups
The principal component analysis (PCA) (Figure 8, a) showed that the treatments could be divided into three main groups: group 1 included the treatments LP.24h and LS.24h, group 2 included the treatments BL, LP.0h, LS.0h, GOS.0h, mConA.0h, and mConB.0h, and group 3 included the treatments mConA.24h and mConB.24h. The GOS.24h treatment group was clearly different from the other groups, but it was most similar to group 1. This is similar to the analysis by principal coordinates analysis (PCoA) based on the weighted UniFrac distance, which also demonstrated the clear distinction between the treatments (Figure 8, b). Based on the Unweighted Pair-group Method with Arithmetic Mean (UPGMA), which was used to generate the cluster tree of the treatment groups, it was revealed that three major groups can be distinguished using the properties of species composition and structure (Figure 9). Thus, it could be indicated that there are significant differences in microbial community composition between the treatments, suggesting that crude polysaccharides (LP and LS) treatment has a notable impact on the gut microbiota.
3.12. Effect of Crude Polysaccharides LP and LS on the Fecal Gut Bacteriome at Different Taxonomy Levels
The impact of crude polysaccharides LS and LP on the fecal gut bacteriome at three taxonomy levels, including phylum, family, and genus, is described in this report. At the phylum level (Figure 10, a), it was revealed that the top 5 bacterial phyla, including Firmicutes, Bacteroidota, Actinobacteriota, Fusobacteriota, and Proteobacteria, were found in all treatments. A comparison of the bacterial growth at 0 h and 24 h of fermentation showed that the crude polysaccharide LP greatly increased the growth of the bacterial groups Actinobacteriota, Fusobacteriota, Proteobacteria, and Desulfobacteriota (p < 0.05), but it significantly decreased the number of bacteria in the group Firmicutes (p < 0.01). This was agreed upon with the fecal fermentation with LS. The phylum of Bacteroidota was slightly reduced after fermentation with LP, but it was the opposite in the case of LS. While the reference prebiotic GOS showed a strong promotion of the growth of bacteria in the phyla Firmicutes and Actinobacteriota, but a reduction of the phyla Fusobacteriota, Proteobacteria, and Desulfobacteriota was observed; unfortunately, the statistical measurement could not be performed due to insufficient sample size of the GOS sample group. Moreover, it was revealed that in the control groups, both mConA (the use of sterile distilled water instead of crude polysaccharides) and mConB (the solid residue of the control tube in the simulated gastrointestinal tract digestion) also increased the growth of bacteria in the Fusobacteriota and Proteobacteria phyla by a significant amount (p < 0.05). The value of relative abundance in the phylum taxonomy level is shown in supplemental data_Table3.
At the family level (Figure 10, b), both crude polysaccharides LS and LP promoted the growth of bacteria at similar family taxa. The major bacterial families that were found in all treatments included Prevotellaceae, Selenomonadaceae, Fusobacteriaceae, Lachnospiraceae, Bifidobacteriaceae, Veillonellaceae, Bacteroidaceae, Ruminococcaceae, Coriobacteriaceae, and Peptostreptococcaceae. Compared to the beginning of fermentation (0 h), both the LS.24h and LP.24h showed a notable rise (p < 0.05) in the number of bacteria belonging to the families Bacteroidaceae, Fusobacteriaceae, Tannerellaceae, Sutterellaceae, Veillonellaceae, and Bifidobacteriaceae. On the other hand, a significant decrease (p < 0.05) was observed in the families Prevotellaceae, Selenomonadaceae, Lachnospiraceae, and Ruminococcaceae. The GOS.24h sample group exhibited a notable rise in bacteria from the families Selenomonadaceae, Bifidobacteriaceae, Veillonellaceae, and Bacteroidaceae. However, there was also a decrease in the families Prevotellaceae, Fusobacteriaceae, and Lachnospiraceae. The value of relative abundance in family taxonomy level is shown in supplemental data_Table4.
Figure 10c exhibits the variations in the bacterial genera of the different treatments at 0 h and 24 h after the in vitro fermentation. The LP treatment of 24 h fermentation (LP.24h) showed the stimulation of the growth of bacterial genera of Bacteroides, Parabacteroides, Fusobacterium, Paraprevotella, and Sutterella, which were significantly higher (p < 0.01) than that of LP.0h. While the genera Prevotella_9, Megamonas, Faecalibacterium, and Blautia were significantly decreased (p < 0.05). These results were similar to the LS treatment group. Comparing the variation of bacterial genera within the GOS treatment group, it was demonstrated that the genera Bifidobacterium, Megamonas, and Megasphaera were strongly increased after 24 h fermentation (GOS.24h), while the Prevotella_9 was clearly reduced. The value of relative abundance at the genus taxonomy level is shown in supplemental data_Table5.
3.13. Crude Polysaccharides Reduced the Ratio of Firmicutes/Bacteroidetes and Blautia/Bacteroides
At the phylum level, following fermentation, there was a significant reduction in the abundance of Firmicutes in both the LP and LS treatment groupห (p < 0.001 for LP; p < 0.05 for LS), whereas the abundance of Bacteroidetes exhibited a modest increase, although this change was not statistically significant. And when considering the Firmicutes/Bacteroidetes ratio, it was found that the ratio decreased in both treatment groups (Figure 14, a). This is the same with the Blautia/Bacteroides ratio at the genus level. The level of abundance of Blautia was decreased, although the reduction is not statistically significant compared to the 0 h fermentation. Moreover, the Blautia/Bacteroides ratio decreased in both the treatment group after 24 h of fermentation compared to the 0 h group (Figure 14, b).
3.14. Changing of pH after the Fermentation
As shown in Figure 15, the initial pH value of all treatments was approximately 7.20. The treatment groups LS.24h and LP.24h showed a significant reduction in pH. The average pH values in the LS.24h and LP.24h groups were 5.73 and 5.78, respectively. While the GOS.24h treatment group had an average pH value of 4.77, the control groups mConA and mConB showed a slight decrease in pH, averaging 7.11 and 7.09, respectively.
4. Discussion
Since the emergence of knowledge about the microbiota and microbiome, which has led to an understanding of the role of the human gut microbiome in health and diseases [32,33]. The term microbiome encompasses the community of bacteria (bacteriome), eukaryotes (eukaryome), and viruses (virome). Of these, the bacteriome has been the most intensively investigated in their role in human health, as they are the most abundant microorganisms inhabiting the human gastrointestinal tract [34]. It has been found that the imbalance of gut microbiota, termed “dysbiosis”, leads to causing various diseases such as hypertension [35], obesity [36], cancers [37], inflammatory bowel diseases [38], and type 2 diabetes [39]. Thus, the restoration of gut microbiota into a healthy state, especially increasing the beneficial microbes, is a reasonable therapeutic approach.
Recently, it has been found that the polysaccharide extracted from edible mushrooms such as P. eryngii [12], T. fuciformis [13], A. bisporus [14], and H. erinaceus [40] had a beneficial influence on gut microbial composition. Leading to our study, two mushroom mycelium isolates, named PB1 and LP1, are from our wild mushrooms mycelium collection. These two isolates have been initially identified in the genus Lentinus spp. based on their fruiting body appearance. But discrimination of the species has not yet been done, due to the high similarity of their fruiting bodies and mycelium morphology within the genus. Thus, molecular identification techniques offer not only a more accurate and reliable approach but also address the shortcomings of traditional methods and enhance safety and quality in mushroom consumption and commerce [17]. Based on the PCR technique to amplify the 28S rRNA gene, and followed by nucleotide sequencing and analysis, it was revealed that the mushroom isolates PB1 and LP1 could be identified as Lentinus squarrosulus and Lentinus polychrous, respectively. This result is consistent with the phylogenetic analysis. Thus, the strains of PB1 and LP1 were then designated as Lentinus squarrosulus PB1 and Lentinus polychrous LP1.
For future downstream applications, producing a sufficient quantity of specific mushrooms (fruiting bodies) is essential. Compared to cultivated mushrooms, it has been reported that wild edible mushrooms have a higher quantity of nutritional content, flavors, and medicine-associated compounds [41], but their consistency quality depends on the exposed environment, leading to the uncontrollability of the consistency cultivation. For these reasons, cultivation of mushrooms in the more controllable systems, such as in a greenhouse, is an alternative strategy to ensure the consistent quality and sufficient amount of mushrooms. Our study demonstrated the use the plastic bag-based method and cultivation in a greenhouse of the L. squarrosulus PB1 and L. polychrous LP1. This method requires minimal equipment and space and can be done indoors without specialized climate control, thus leading to possibility of gaining the production mass of mushrooms. Our result demonstrated that the mushrooms could be harvested within 2 weeks after inoculation. This method has been successfully applied for cultivating medicinal mushrooms such as Lentinula edodes (Shiitake) [42], Ganoderma lucidum (Reishi) [43], and Auricularia polytricha [44]. However, the comparison of the nutrition and other compounds composed in both wild and cultivated mushrooms was not determined in the present study.
Numerous research publications have thoroughly explored the bioactive chemicals found in edible mushrooms exhibiting a range of health-promoting properties such as anti-cancer [45], anti-viral activities [46], antioxidant activity [47,48], and alleviating the severity of inflammatory bowel disease by modifying the gut microbiota [49]. Polysaccharides from edible mushrooms can be extracted using various methods, of which hot water extraction (HWE) is the most common due to its simplicity and effectiveness [50]. Studies have demonstrated that optimizing HWE conditions could enhance the yield of polysaccharide extracts, particularly through increased agitation [51], increasing the temperature, and extending the fermentation period [52]. Our result showed that adding the sonication step in an earlier step of the HWE method could enhance the extraction yield of crude polysaccharide extracted from L. squarrosulus PB1 and L. polychrous LP1, which were slightly higher than our previous report [19], indicating that the sonicating force had affected the enhancement of yields compared to conventional HWE methods. In addition to the polysaccharide, the phenolic compound was the attractive compound for determination, as it usually contributes to a range of health benefits, particularly antioxidation [23]. Our result showed that crude polysaccharides LS and LP contained phenolic compounds at a comparable concentration with previous reports [53]. Thus, the cultivated mushrooms, including L. squarrosulus and L. polychrous, are good sources of not only polysaccharides but also phenolic compounds, which can be further evaluated for their bioactive function.
Currently, there is an exponentially growing interest in evaluating the impact of mushroom-derived polysaccharides on the human gut microbiome, revealing their potential to enhance health through various mechanisms. In addition, the initial process of testing the fermentation of polysaccharide extracts with microorganisms in human feces involved subjecting the extracts to simulated human gastrointestinal digestion conditions, including the oral cavity, stomach, and intestines. This simulation realistically mimics the food intake process in the body. Previous studies have tested simulated gastrointestinal digestion before examining the fermentation, such as the polysaccharide extracts from Helicteres angustifolia L. [54], Volvariella volvacea [55], and Oudemansiella radicata [56]. These studies showed that the upper human gastrointestinal conditions did not affect the structure of the polysaccharide extracts from mushrooms, indicating the potential prebiotic properties of these polysaccharides. This method was employed in the present study. The polysaccharides LS and LP were subjected to the simulated human gastrointestinal digestion conditions. The digested product, supernatant, and solid phase were sequentially utilized in the fermentation process. However, the effect of this simulated digestion on the prebiotic properties of both polysaccharide LS and LP was not assessed throughout our study. This was one limitation in the present study.
The result of the metagenomic sequencing of the 16S rRNA gene of the samples revealed that the number of effective reads had the average length of 417 nucleotides. which was reflected in the length of the nucleotide sequence in the V3-V4 region (400-500 nucleotides) of general bacteria [57]. Thus, these sequencing outputs had an acceptable quality to be further analyzed and interpreted. According to the principal performance, the short-read sequencing technique is reliable and confident at the lowest taxonomy of the genus level [58], thus, taxonomic profiling of phylum, family, and genus are described in this study. After the in vitro batch fermentation, it was demonstrated that crude polysaccharides LP and LS led to a significant shift in the gut bacteriome composition. The rank abundance curves and alpha diversity indices indicated a reduction in bacterial diversity, especially the reduction of the species evenness value, which indicated that the polysaccharides LP and LS specifically supported the growth of some bacterial species as the dominant bacteria. These findings aligned with previous research suggesting that dietary polysaccharides can influence microbiome composition by supporting specific bacterial growth while suppressing certain taxa [59].
Analysis of the bacteriome-modulating property of crude polysaccharides LS and LP at the phylum level revealed that both crude polysaccharides LS and LP supported the growth of similar bacteria phyla. Of these, the phyla Firmicutes, Bacteroidota, Actinobacteriota, Fusobacteriota, and Proteobacteria were predomination. This might be explained by our previous report that both crude polysaccharide LS and LP had the similar sugar content, fucose was the highest composition [19]. This was in agreement with the previous study, which demonstrated that the major monosaccharides found in the crude polysaccharide of L. squarrosulus extracted by HWE were galactose, D-glucose, D-mannose, xylose, and fucose. However, the polysaccharide structure affecting the microbial gut diversity has not been discussed in any reports.
Compared to other treatment groups after fermentation, the phylum Bacteroidota and Fusobacteriota were relatively more abundant in the LP and LS treatment groups. This taxonomy profile was similar at the family and genus level, where the bacterial members of those two phyla were predominant. This was in concordance with previous reports on the polysaccharide from the mushroom. Volvariella volvacea [60] and Boletus auripes [61] promoted the growth of Bacteriodes. The phylum Bacteroidota (formerly Bacteroidetes) is one of the major bacterial phyla in the human gut microbiome and has an important role in complex polysaccharide digestion [62,63]. Many Bacteroidota species, such as Bacteroides thetaiotaomicron [64] and Bacteroides uniformis [65], were shown to be the primary bacteria for breaking down mushroom carbohydrates in the human gut. This could be the reason for the predominance of these bacteria in the LP and LS treatment groups.
In addition to the genus Bacteriodes, the genus Parabacteriodes, one of members of the phylum Bacteroidota, was also increased after fermentation with crude polysaccharides LS and LP. Recent studies have demonstrated that Parabacteroides species were predominant bacteria in fermenting mushroom-derived polysaccharides such as Tremella fuciformis [66], Flammulina velutipes [67], and Wolfiporia cocos [68]. Some certain species within the genus Parabacteroides have demonstrated probiotic potential, particularly Parabacteroides distasonis and Parabacteroides goldsteinii. It has been shown the therapeutic potential of these species for arthritis [69], colitis [70], and obesity [71]. This evidences support the use of this species as a next-generation probiotic.
It is not surprising that in the GOS treatment group, the beneficial bacteria, especially the Bifidobacterium species, was significantly increased compared to other treatment groups. This is due to the prebiotic properties of GOS that selectively support the growth of bifidobacteria [72]. Thus, in various formulations of synbiotics, GOS is often included as one of ingredients. As mentioned previously, the phylum Fusobacteriota also increased in LP and LS treatment groups. These bacterial phyla live in the human gastrointestinal tract, especially the oral cavity, as commensal residents [73]. Many documentations reported that this bacteria, especially the certain species Fusobacterium nucleatum, related to the pathogenesis of various types of cancer, especially colorectal cancer [74,75]. However, it is unclear that this bacterium is an initially causative pathogen for cancers. This might be our interesting research topic to elucidate the association between mushroom polysaccharide and cancer disease progression.
In addition to the increase of the Bacteroidota phylum, the phylum Firmicutes was reduced in the LP and LS treatment groups compared to other groups. This phylum consists of bacteria that are recognized as beneficial bacteria, such as the family of Lactobacillaceae, and harmful bacteria such as the family of Clostridiaceae. It has been reported that the Firmicutes-to-Bacteroidota (F/B) ratio in the gut is often related to specific health conditions, such as a high F/B ratio, which has been linked to obesity and metabolic syndrome [76]. Our result showed that the F/B ratio was decreased in both the LS and LP treatment groups. This was the same with the Blautia-to-Bacteroides (Bla/Bac) ratio at the genus level. The reduction of the Bla/Bac ratio was found in both the LS and LP treatment groups. Since it has been demonstrated that the Bla/Bac ratio was positively correlated with the obesity patients [77]. Thus, based on our result, it could be remarking on the potential application of crude polysaccharide LS and LP for the restoration of gut microbiota in a specific health condition.
The pH value in GOS treatment was significantly low compared to the 0 h fermentation. This was similar with the LS and LP treatment groups. These changes might be reflected in that SCFA and other organic compounds produced via the fermentation process. However, there is currently insufficient evidence to conclude that pH changes during the fecal fermentation of mushroom polysaccharides can control pathogenic bacteria. Further research is needed to explore this potential interaction within the human gut microbiome.
5. Conclusions
In conclusion, two edible mushrooms, Lentinus squarrosulus PB1 and Lentinus polychrous LP1, have been successfully identified at the species level by molecular methods. The crude polysaccharide was extracted, characterized, and used as a substrate for in vitro batch fermentation by fecal microbiota. These crude polysaccharides preferentially enhanced the population of bacteria in the phylum Bacteroidota, especially the genera of Bacteroides spp. and Parabacteroides spp. These two bacteria are being characterized as next-generation probiotics. However, the phylum Fusobacteriota, a potentially harmful bacterium, also increased after the fermentation with those two polysaccharides. Therefore, there is an opportunity for in-depth studies to elucidate the potential polysaccharide in an altering gut bacteriome in another model, such as in a human group who are staying with a certain disease.
Supplementary Materials
The following supporting information can be downloaded at the website of this paper posted on Preprints.org.
Author Contributions
M.P. prepared research proposal for grant receival, provide the ethic approval, designed and performed the experiments, analyzed data, and performed manuscript preparation and submission. C.K. performed the experiments and data analysis. P.S. collected the fecal samples and prepared fecal slurry. W.B. cultivated the mushrooms. P.P. and U.U. approved the manuscript for submission. provided equipment and culture medium and extracted crude polysaccharides. All authors have read and agreed to the published version of the manuscript.
Funding
This research was supported by the National Science, Research and Innovation Fund (Fundamental Fund, FF66) (grant to MP). Funding for English editing and publication fee was partially supported by the College of Medicine and Public Health and Ubon Ratchathani University.
Institutional Review Board Statement
Not applicable.
Informed Consent Statement
Not applicable.
Data Availability Statement
Data is contained within the article or Supplementary Material.
Acknowledgments
We would like to thank Malai Silaram and Sureepawn Kroongtong for preparing experimental equipment.
Conflicts of Interest
The authors declare no conflicts of interest.
References
- Lynch, S.V.; Pedersen, O. The Human Intestinal Microbiome in Health and Disease. N. Engl. J. Med. 2016, 375, 2369–2379. [Google Scholar] [CrossRef]
- Fujimura, K.E.; Lynch, S.V. Microbiota in Allergy and Asthma and the Emerging Relationship with the Gut Microbiome. Cell Host Microbe 2015, 17, 592–602. [Google Scholar] [CrossRef]
- Turnbaugh, P.J.; Ley, R.E.; Mahowald, M.A.; Magrini, V.; Mardis, E.R.; Gordon, J.I. An Obesity-Associated Gut Microbiome with Increased Capacity for Energy Harvest. Nature 2006, 444, 1027–1031. [Google Scholar] [CrossRef]
- Zuo, K.; Li, J.; Li, K.; Hu, C.; Gao, Y.; Chen, M.; Hu, R.; Liu, Y.; Chi, H.; Wang, H.; et al. Disordered gut microbiota and alterations in metabolic patterns are associated with atrial fibrillation. GigaScience 2019, 8. [Google Scholar] [CrossRef]
- Peralta-Marzal, L.N.; Rojas-Velazquez, D.; Rigters, D.; Prince, N.; Garssen, J.; Kraneveld, A.D.; Perez-Pardo, P.; Lopez-Rincon, A. A robust microbiome signature for autism spectrum disorder across different studies using machine learning. Sci. Rep. 2024, 14, 814. [Google Scholar] [CrossRef]
- Long, Y.; Tang, L.; Zhou, Y.; Zhao, S.; Zhu, H. Causal relationship between gut microbiota and cancers: a two-sample Mendelian randomisation study. BMC Med. 2023, 21, 66. [Google Scholar] [CrossRef]
- Bevilacqua, A.; Campaniello, D.; Speranza, B.; Racioppo, A.; Sinigaglia, M.; Corbo, M.R. An Update on Prebiotics and on Their Health Effects. Foods 2024, 13, 446. [Google Scholar] [CrossRef]
- Gibson, G.R.; Hutkins, R.; Sanders, M.E.; Prescott, S.L.; Reimer, R.A.; Salminen, S.J.; Scott, K.; Stanton, C.; Swanson, K.S.; Cani, P.D.; et al. Expert consensus document: The International Scientific Association for Probiotics and Prebiotics (ISAPP) consensus statement on the definition and scope of prebiotics. Nat. Rev. Gastroenterol. Hepatol. 2017, 14, 491–502. [Google Scholar] [CrossRef]
- Davani-Davari, D.; Negahdaripour, M.; Karimzadeh, I.; Seifan, M.; Mohkam, M.; Masoumi, S.J.; Berenjian, A.; Ghasemi, Y. Prebiotics: Definition, Types, Sources, Mechanisms, and Clinical Applications. Foods 2019, 8, 92. [Google Scholar] [CrossRef]
- Rahman, M.; Islam, F.; -Or-Rashid, H.; Al Mamun, A.; Rahaman, S.; Islam, M.; Meem, A.F.K.; Sutradhar, P.R.; Mitra, S.; Mimi, A.A.; et al. The Gut Microbiota (Microbiome) in Cardiovascular Disease and Its Therapeutic Regulation. Front. Cell. Infect. Microbiol. 2022, 12, 903570. [Google Scholar] [CrossRef]
- Nowak, R.; Nowacka-Jechalke, N.; Juda, M.; Malm, A. The preliminary study of prebiotic potential of Polish wild mushroom polysaccharides: the stimulation effect on Lactobacillus strains growth. Eur. J. Nutr. 2017, 57, 1511–1521. [Google Scholar] [CrossRef]
- Christodoulou, P.; Vlassopoulou, M.; Zervou, M.; Xanthakos, E.; Moulos, P.; Koutrotsios, G.; Zervakis, G.I.; Kerezoudi, E.N.; Mitsou, E.K.; Saxami, G.; et al. In Vitro Fermentation of Pleurotus eryngii Mushrooms by Human Fecal Microbiota: Metataxonomic Analysis and Metabolomic Profiling of Fermentation Products. J. Fungi 2023, 9, 128. [Google Scholar] [CrossRef]
- Zhu, X.; Su, J.; Zhang, L.; Si, F.; Li, D.; Jiang, Y.; Zhang, C. Gastrointestinal digestion fate of Tremella fuciformis polysaccharide and its effect on intestinal flora: an in vitro digestion and fecal fermentation study. Food Innov. Adv. 2024, 3, 202–211. [Google Scholar] [CrossRef]
- Duan, H.; Yu, Q.; Ni, Y.; Li, J.; Fan, L. Effect of Agaricus bisporus Polysaccharides on Human Gut Microbiota during In Vitro Fermentation: An Integrative Analysis of Microbiome and Metabolome. Foods 2023, 12, 859. [Google Scholar] [CrossRef]
- Priori, E.C.; Ratto, D.; De Luca, F.; Sandionigi, A.; Savino, E.; Giammello, F.; Romeo, M.; Brandalise, F.; Roda, E.; Rossi, P. Hericium erinaceus Extract Exerts Beneficial Effects on Gut–Neuroinflammaging–Cognitive Axis in Elderly Mice. Biology 2024, 13, 18. [Google Scholar] [CrossRef]
- Ayimbila, F.; Siriwong, S.; Nakphaichit, M.; Keawsompong, S. In vitro gastrointestinal digestion of Lentinus squarrosulus powder and impact on human fecal microbiota. Sci. Rep. 2022, 12, 2655. [Google Scholar] [CrossRef]
- Raja, H.A.; Miller, A.N.; Pearce, C.J.; Oberlies, N.H. Fungal Identification Using Molecular Tools: A Primer for the Natural Products Research Community. J. Nat. Prod. 2017, 80, 756–770. [Google Scholar] [CrossRef]
- Tamura, K.; Stecher, G.; Kumar, S. MEGA11: Molecular Evolutionary Genetics Analysis Version 11. Mol. Biol. Evol. 2021, 38, 3022–3027. [Google Scholar] [CrossRef]
- Panya, M.; Kaewraemruaen, C.; Saenwang, P.; Pimboon, P. Evaluation of Prebiotic Potential of Crude Polysaccharides Extracted from Wild Lentinus polychrous and Lentinus squarrosulus and Their Application for a Formulation of a Novel Lyophilized Synbiotic. Foods 2024, 13, 287. [Google Scholar] [CrossRef]
- Masuko, T.; Minami, A.; Iwasaki, N.; Majima, T.; Nishimura, S.-I.; Lee, Y.C. Carbohydrate analysis by a phenol–sulfuric acid method in microplate format. Anal. Biochem. 2005, 339, 69–72. [Google Scholar] [CrossRef]
- Miller, G.L. Use of Dinitrosalicylic Acid Reagent for Determination of Reducing Sugar. Anal. Chem. 1959, 31, 426–428. [Google Scholar] [CrossRef]
- Thetsrimuang, C.; Khammuang, S.; Chiablaem, K.; Srisomsap, C.; Sarnthima, R. Antioxidant properties and cytotoxicity of crude polysaccharides from Lentinus polychrous Lév. Food Chem. 2011, 128, 634–639. [Google Scholar] [CrossRef]
- Kim, M.-Y.; Seguin, P.; Ahn, J.-K.; Kim, J.-J.; Chun, S.-C.; Kim, E.-H.; Seo, S.-H.; Kang, E.-Y.; Kim, S.-L.; Park, Y.-J.; et al. Phenolic Compound Concentration and Antioxidant Activities of Edible and Medicinal Mushrooms from Korea. J. Agric. Food Chem. 2008, 56, 7265–7270. [Google Scholar] [CrossRef]
- Minekus, M.; Alminger, M.; Alvito, P.; Ballance, S.; Bohn, T.; Bourlieu, C.; Carrière, F.; Boutrou, R.; Corredig, M.; Dupont, D.; et al. A standardised staticin vitrodigestion method suitable for food – an international consensus. Food Funct. 2014, 5, 1113–1124. [Google Scholar] [CrossRef] [PubMed]
- Pérez-Burillo, S.; Molino, S.; Navajas-Porras, B.; Valverde-Moya, Á.J.; Hinojosa-Nogueira, D.; López-Maldonado, A.; Pastoriza, S.; Rufián-Henares, J.Á. An in vitro batch fermentation protocol for studying the contribution of food to gut microbiota composition and functionality. Nat. Protoc. 2021, 16, 3186–3209. [Google Scholar] [CrossRef] [PubMed]
- Chen, L.; Liu, J.; Ge, X.; Xu, W.; Chen, Y.; Li, F.; Cheng, D.; Shao, R. Simulated digestion and fermentation in vitro by human gut microbiota of polysaccharides from Helicteres angustifolia L. Int. J. Biol. Macromol. 2019, 141, 1065–1071. [Google Scholar] [CrossRef] [PubMed]
- Bolyen, E.; Rideout, J.R.; Dillon, M.R.; Bokulich, N.A.; Abnet, C.C.; Al-Ghalith, G.A.; Alexander, H.; Alm, E.J.; Arumugam, M.; Asnicar, F.; et al. Reproducible, Interactive, Scalable and Extensible Microbiome Data Science using QIIME 2. Nat. Biotechnol. 2019, 37, 852–857. [Google Scholar] [CrossRef]
- Callahan, B.J.; Mcmurdie, P.J.; Rosen, M.J.; Han, A.W.; Johnson, A.J.A.; Holmes, S.P. DADA2: High-resolution sample inference from Illumina amplicon data. Nat. Methods 2016, 13, 581–583. [Google Scholar] [CrossRef]
- Quast, C.; Pruesse, E.; Yilmaz, P.; Gerken, J.; Schweer, T.; Yarza, P.; Peplies, J.; Glöckner, F.O. The SILVA Ribosomal RNA Gene Database Project: Improved Data Processing and Web-Based Tools. Nucleic Acids Res. 2013, 41, D590–D596. [Google Scholar] [CrossRef]
- Price, M.N.; Dehal, P.S.; Arkin, A.P. FastTree 2—Approximately Maximum-Likelihood Trees for Large Alignments. PLoS ONE 2010, 5, e9490. [Google Scholar] [CrossRef]
- Segata, N.; Izard, J.; Waldron, L.; Gevers, D.; Miropolsky, L.; Garrett, W.S.; Huttenhower, C. Metagenomic biomarker discovery and explanation. Genome Biol. 2011, 12, R60. [Google Scholar] [CrossRef]
- Afzaal, M.; Saeed, F.; Shah, Y.A.; Hussain, M.; Rabail, R.; Socol, C.T.; Hassoun, A.; Pateiro, M.; Lorenzo, J.M.; Rusu, A.V.; et al. Human gut microbiota in health and disease: Unveiling the relationship. Front. Microbiol. 2022, 13. [Google Scholar] [CrossRef]
- Hou, K.; Wu, Z.-X.; Chen, X.-Y.; Wang, J.-Q.; Zhang, D.; Xiao, C.; Zhu, D.; Koya, J.B.; Wei, L.; Li, J.; et al. Microbiota in health and diseases. Signal Transduct. Target. Ther. 2022, 7, 135. [Google Scholar] [CrossRef]
- Sender, R.; Fuchs, S.; Milo, R. Revised Estimates for the Number of Human and Bacteria Cells in the Body. PLOS Biol. 2016, 14, e1002533. [Google Scholar] [CrossRef]
- Li, J.; Zhao, F.; Wang, Y.; Chen, J.; Tao, J.; Tian, G.; Wu, S.; Liu, W.; Cui, Q.; Geng, B.; et al. Gut microbiota dysbiosis contributes to the development of hypertension. Microbiome 2017, 5, 14. [Google Scholar] [CrossRef]
- Amabebe, E.; Robert, F.O.; Agbalalah, T.; Orubu, E.S.F. Microbial dysbiosis-induced obesity: role of gut microbiota in homoeostasis of energy metabolism. Br. J. Nutr. 2020, 123, 1127–1137. [Google Scholar] [CrossRef]
- Zou, S.; Fang, L.; Lee, M.-H. Dysbiosis of gut microbiota in promoting the development of colorectal cancer. Gastroenterol. Rep. 2017, 6, 1–12. [Google Scholar] [CrossRef]
- Nishida, A.; Inoue, R.; Inatomi, O.; Bamba, S.; Naito, Y.; Andoh, A. Gut microbiota in the pathogenesis of inflammatory bowel disease. Clin. J. Gastroenterol. 2017, 11, 1–10. [Google Scholar] [CrossRef]
- Sircana, A.; Framarin, L.; Leone, N.; Berrutti, M.; Castellino, F.; Parente, R.; De Michieli, F.; Paschetta, E.; Musso, G. Altered Gut Microbiota in Type 2 Diabetes: Just a Coincidence? Curr. Diabetes Rep. 2018, 18, 98. [Google Scholar] [CrossRef] [PubMed]
- Tian, B.; Geng, Y.; Xu, T.; Zou, X.; Mao, R.; Pi, X.; Wu, W.; Huang, L.; Yang, K.; Zeng, X.; et al. Digestive Characteristics of Hericium erinaceus Polysaccharides and Their Positive Effects on Fecal Microbiota of Male and Female Volunteers During in vitro Fermentation. Front. Nutr. 2022, 9, 858585. [Google Scholar] [CrossRef] [PubMed]
- Mleczek, M.; Budka, A.; Siwulski, M.; Mleczek, P.; Budzyńska, S.; Proch, J.; Gąsecka, M.; Niedzielski, P.; Rzymski, P. A comparison of toxic and essential elements in edible wild and cultivated mushroom species. Eur. Food Res. Technol. 2021, 247, 1249–1262. [Google Scholar] [CrossRef]
- Lee, H.-Y.; Ham, E.-J.; Yoo, Y.-J.; Kim, E.-S.; Shim, K.-K.; Kim, M.-K.; Koo, C.-D. Effects of Aeration of Sawdust Cultivation Bags on Hyphal Growth of Lentinula edodes. Mycobiology 2012, 40, 164–167. [Google Scholar] [CrossRef]
- Jeewanthi, L.A.M.N.; Ratnayake, K.; Rajapakse, P. Growth and Yield of Reishi Mushroom [Ganoderma lucidum (Curtis) P. Karst] in Different Sawdust Substrates. J. Food Agric. 2017, 10. [Google Scholar] [CrossRef]
- Wu, C.-Y.; Liang, C.-H.; Liang, Z.-C. Evaluation of Using Spent Mushroom Sawdust Wastes for Cultivation of Auricularia polytricha. Agronomy 2020, 10, 1892. [Google Scholar] [CrossRef]
- Zhao, Q.; Jiang, Y.; Zhao, Q.; Manzi, H.P.; Su, L.; Liu, D.; Huang, X.; Long, D.; Tang, Z.; Zhang, Y. The benefits of edible mushroom polysaccharides for health and their influence on gut microbiota: a review. Front. Nutr. 2023, 10, 1213010. [Google Scholar] [CrossRef]
- Baruah, P.; Patra, A.; Barge, S.; Khan, M.R.; Mukherjee, A.K. Therapeutic Potential of Bioactive Compounds from Edible Mushrooms to Attenuate SARS-CoV-2 Infection and Some Complications of Coronavirus Disease (COVID-19). J. Fungi 2023, 9, 897. [Google Scholar] [CrossRef] [PubMed]
- Petraglia, T.; Latronico, T.; Fanigliulo, A.; Crescenzi, A.; Liuzzi, G.M.; Rossano, R. Antioxidant Activity of Polysaccharides from the Edible Mushroom Pleurotus eryngii. Molecules 2023, 28, 2176. [Google Scholar] [CrossRef]
- Deveci, E.; Tel-Çayan, G.; Çayan, F.; Altınok, B.Y.; Aktaş, S. Characterization of Polysaccharide Extracts of Four Edible Mushrooms and Determination of In Vitro Antioxidant, Enzyme Inhibition and Anticancer Activities. ACS Omega 2024, 9, 25887–25901. [Google Scholar] [CrossRef]
- Ma, G.; Du, H.; Hu, Q.; Yang, W.; Pei, F.; Xiao, H. Health benefits of edible mushroom polysaccharides and associated gut microbiota regulation. Crit. Rev. Food Sci. Nutr. 2021, 62, 6646–6663. [Google Scholar] [CrossRef]
- Cheng, Y.; Gan, J.; Yan, B.; Wang, P.; Wu, H.; Huang, C. Polysaccharides from Russula: a review on extraction, purification, and bioactivities. Front. Nutr. 2024, 11, 1406817. [Google Scholar] [CrossRef]
- Sangthong, S.; Pintathong, P.; Pongsua, P.; Jirarat, A.; Chaiwut, P. Polysaccharides from Volvariella volvacea Mushroom: Extraction, Biological Activities and Cosmetic Efficacy. J. Fungi 2022, 8, 572. [Google Scholar] [CrossRef]
- Khalil, A.S.E.; Lukasiewicz, M. The Optimization of the Hot Water Extraction of the Polysaccharide-Rich Fraction from Agaricus bisporus. Molecules 2024, 29, 4783. [Google Scholar] [CrossRef] [PubMed]
- Butkhup, L.; Samappito, W.; Jorjong, S. Evaluation of bioactivities and phenolic contents of wild edible mushrooms from northeastern Thailand. Food Sci. Biotechnol. 2017, 27, 193–202. [Google Scholar] [CrossRef] [PubMed]
- Chen, L.; Liu, J.; Ge, X.; Xu, W.; Chen, Y.; Li, F.; Cheng, D.; Shao, R. Simulated digestion and fermentation in vitro by human gut microbiota of polysaccharides from Helicteres angustifolia L. Int. J. Biol. Macromol. 2019, 141, 1065–1071. [Google Scholar] [CrossRef]
- Hu, W.; Di, Q.; Liang, T.; Zhou, N.; Chen, H.; Zeng, Z.; Luo, Y.; Shaker, M. Effects of in vitro simulated digestion and fecal fermentation of polysaccharides from straw mushroom (Volvariella volvacea) on its physicochemical properties and human gut microbiota. Int. J. Biol. Macromol. 2023, 239, 124188. [Google Scholar] [CrossRef]
- Liu, Y.; Li, Y.; Ke, Y.; Li, C.; Zhang, Z.; Wu, Y.; Hu, B.; Liu, A.; Luo, Q.; Wu, W. In vitro saliva-gastrointestinal digestion and fecal fermentation of Oudemansiella radicata polysaccharides reveal its digestion profile and effect on the modulation of the gut microbiota. Carbohydr. Polym. 2021, 251, 117041. [Google Scholar] [CrossRef]
- Yarza, P.; Yilmaz, P.; Pruesse, E.; Glöckner, F.O.; Ludwig, W.; Schleifer, K.-H.; Whitman, W.B.; Euzéby, J.; Amann, R.; Rosselló-Móra, R. Uniting the classification of cultured and uncultured bacteria and archaea using 16S rRNA gene sequences. Nat. Rev. Microbiol. 2014, 12, 635–645. [Google Scholar] [CrossRef]
- Gehrig, J.L.; Portik, D.M.; Driscoll, M.D.; Jackson, E.; Chakraborty, S.; Gratalo, D.; Ashby, M.; Valladares, R. Finding the right fit: evaluation of short-read and long-read sequencing approaches to maximize the utility of clinical microbiome data. Microb. Genom. 2022, 8, 000794. [Google Scholar] [CrossRef]
- Álvarez-Mercado, A.I.; Plaza-Diaz, J. Dietary Polysaccharides as Modulators of the Gut Microbiota Ecosystem: An Update on Their Impact on Health. Nutrients 2022, 14, 4116. [Google Scholar] [CrossRef]
- Hu, W.; Di, Q.; Liang, T.; Zhou, N.; Chen, H.; Zeng, Z.; Luo, Y.; Shaker, M. Effects of in vitro simulated digestion and fecal fermentation of polysaccharides from straw mushroom (Volvariella volvacea) on its physicochemical properties and human gut microbiota. Int. J. Biol. Macromol. 2023, 239, 124188. [Google Scholar] [CrossRef]
- Luo, Q.; Li, X.; Li, H.; Kong, K.; Li, C.; Fang, Z.; Hu, B.; Wang, C.; Chen, S.; Wu, W.; et al. Effect of in vitro simulated digestion and fecal fermentation on Boletus auripes polysaccharide characteristics and intestinal flora. Int. J. Biol. Macromol. 2023, 249, 126461. [Google Scholar] [CrossRef]
- Shin, J.H.; Tillotson, G.; MacKenzie, T.N.; Warren, C.A.; Wexler, H.M.; Goldstein, E.J. Bacteroides and related species: The keystone taxa of the human gut microbiota. Anaerobe 2024, 85, 102819. [Google Scholar] [CrossRef]
- Patnode, M.L.; Beller, Z.W.; Han, N.D.; Cheng, J.; Peters, S.L.; Terrapon, N.; Henrissat, B.; Le Gall, S.; Saulnier, L.; Hayashi, D.K.; et al. Interspecies Competition Impacts Targeted Manipulation of Human Gut Bacteria by Fiber-Derived Glycans. Cell 2019, 179, 59–73.e13. [Google Scholar] [CrossRef]
- Shi, J.; Zhou, W.; Chen, G.; Yi, W.; Sun, Y.; Zeng, X. The Utilization by Bacteroides spp. of a Purified Polysaccharide from Fuzhuan Brick Tea. Foods 2024, 13, 1666. [Google Scholar] [CrossRef] [PubMed]
- Qu, Z.; Liu, H.; Yang, J.; Zheng, L.; Huang, J.; Wang, Z.; Xie, C.; Zuo, W.; Xia, X.; Sun, L.; et al. Selective utilization of medicinal polysaccharides by human gut Bacteroides and Parabacteroides species. Nat. Commun. 2025, 16, 638. [Google Scholar] [CrossRef]
- Fang, Y.; Zhang, Q.; Yu, C.; Xu, X.; Lei, P.; Xu, H.; Li, S. In vitro digestion and fecal fermentation of Tremella fuciformis exopolysaccharides from basidiospore-derived submerged fermentation. Food Res. Int. 2024, 196, 115019. [Google Scholar] [CrossRef]
- Wang, L.; Zhang, Y.; Zang, X.; Yang, Y.; Wang, W.; Zhang, J.; Que, Y.; Liang, F.; Wang, T.; Zhang, J.; et al. Physicochemical properties and fermentation characteristics of a novel polysaccharide degraded from Flammulina velutipes residues polysaccharide. Food Chem. X 2024, 24, 102049. [Google Scholar] [CrossRef] [PubMed]
- Ma, K.L.; Kei, N.; Yang, F.; Lauw, S.; Chan, P.L.; Chen, L.; Cheung, P.C.K. In Vitro Fermentation Characteristics of Fungal Polysaccharides Derived from Wolfiporia cocos and Their Effect on Human Fecal Microbiota. Foods 2023, 12, 4014. [Google Scholar] [CrossRef]
- Sun, H.; Sun, H.; Guo, Y.; Guo, Y.; Wang, H.; Wang, H.; Yin, A.; Yin, A.; Hu, J.; Hu, J.; et al. Gut commensalParabacteroides distasonisalleviates inflammatory arthritis. Gut 2023, 72, 1664–1677. [Google Scholar] [CrossRef]
- Kverka, M.; Zakostelska, Z.; Klimesova, K.; Sokol, D.; Hudcovic, T.; Hrncir, T.; Rossmann, P.; Mrazek, J.; Kopecny, J.; Verdu, E.F.; et al. Oral administration of Parabacteroides distasonis antigens attenuates experimental murine colitis through modulation of immunity and microbiota composition. Clin. Exp. Immunol. 2010, 163, 250–259. [Google Scholar] [CrossRef]
- Wang, K.; Liao, M.; Zhou, N.; Bao, L.; Ma, K.; Zheng, Z.; Wang, Y.; Liu, C.; Wang, W.; Wang, J.; et al. Parabacteroides distasonis Alleviates Obesity and Metabolic Dysfunctions via Production of Succinate and Secondary Bile Acids. Cell Rep. 2019, 26, 222–235.e5. [Google Scholar] [CrossRef] [PubMed]
- Li, W.; Wang, K.; Sun, Y.; Ye, H.; Hu, B.; Zeng, X. Influences of structures of galactooligosaccharides and fructooligosaccharides on the fermentation in vitro by human intestinal microbiota. J. Funct. Foods 2015, 13, 158–168. [Google Scholar] [CrossRef]
- Han, Y.W. Fusobacterium nucleatum: a commensal-turned pathogen. Curr. Opin. Microbiol. 2015, 23, 141–147. [Google Scholar] [CrossRef]
- Vallianou, N.G.; Kounatidis, D.; Tsilingiris, D.; Panagopoulos, F.; Christodoulatos, G.S.; Evangelopoulos, A.; Karampela, I.; Dalamaga, M. The Role of Next-Generation Probiotics in Obesity and Obesity-Associated Disorders: Current Knowledge and Future Perspectives. Int. J. Mol. Sci. 2023, 24, 6755. [Google Scholar] [CrossRef] [PubMed]
- Ye, C.; Liu, X.; Liu, Z.; Pan, C.; Zhang, X.; Zhao, Z.; Sun, H. Fusobacterium nucleatum in tumors: from tumorigenesis to tumor metastasis and tumor resistance. Cancer Biol. Ther. 2024, 25, 2306676. [Google Scholar] [CrossRef]
- Woting, A.; Blaut, M. The Intestinal Microbiota in Metabolic Disease. Nutrients 2016, 8, 202. [Google Scholar] [CrossRef]
- Kim, Y.; Son, D.; Kim, B.K.; Kim, K.H.; Seo, K.W.; Jung, K.; Park, S.J.; Lim, S.; Kim, J.H. Association between the Blautia/Bacteroides Ratio and Altered Body Mass Index after Bariatric Surgery. Endocrinol. Metab. 2022, 37, 475–486. [Google Scholar] [CrossRef]
Figure 1.
Mushroom molecular identification. (a) Ethidium bromide-stained agarose gel exhibiting LSU-28S rRNA amplified from L. squarrosulus PB1 and L. polychrous LP1. Lane M had VC DNA ladder. Lanes 1 and 2 contained PB1 and LP1 LSU-28S rRNA gene amplified products. Lane N contains PCR product without DNA template. The DNA ladder’s base pairs (bp) are shown on the gel. (b) Taxa evolutionary relationships are identified using LSU-28S rRNA gene data and neighbor-joining. Each node has bootstrap support above 50%. Evolutionary analyses were conducted using MEGA11. Pleurotus ostreatus was used as an outgroup. The arrow behind their taxonomy names indicates the LSU-28S rRNA of L. squarrosulus PB1 and L. polychrous LP1.
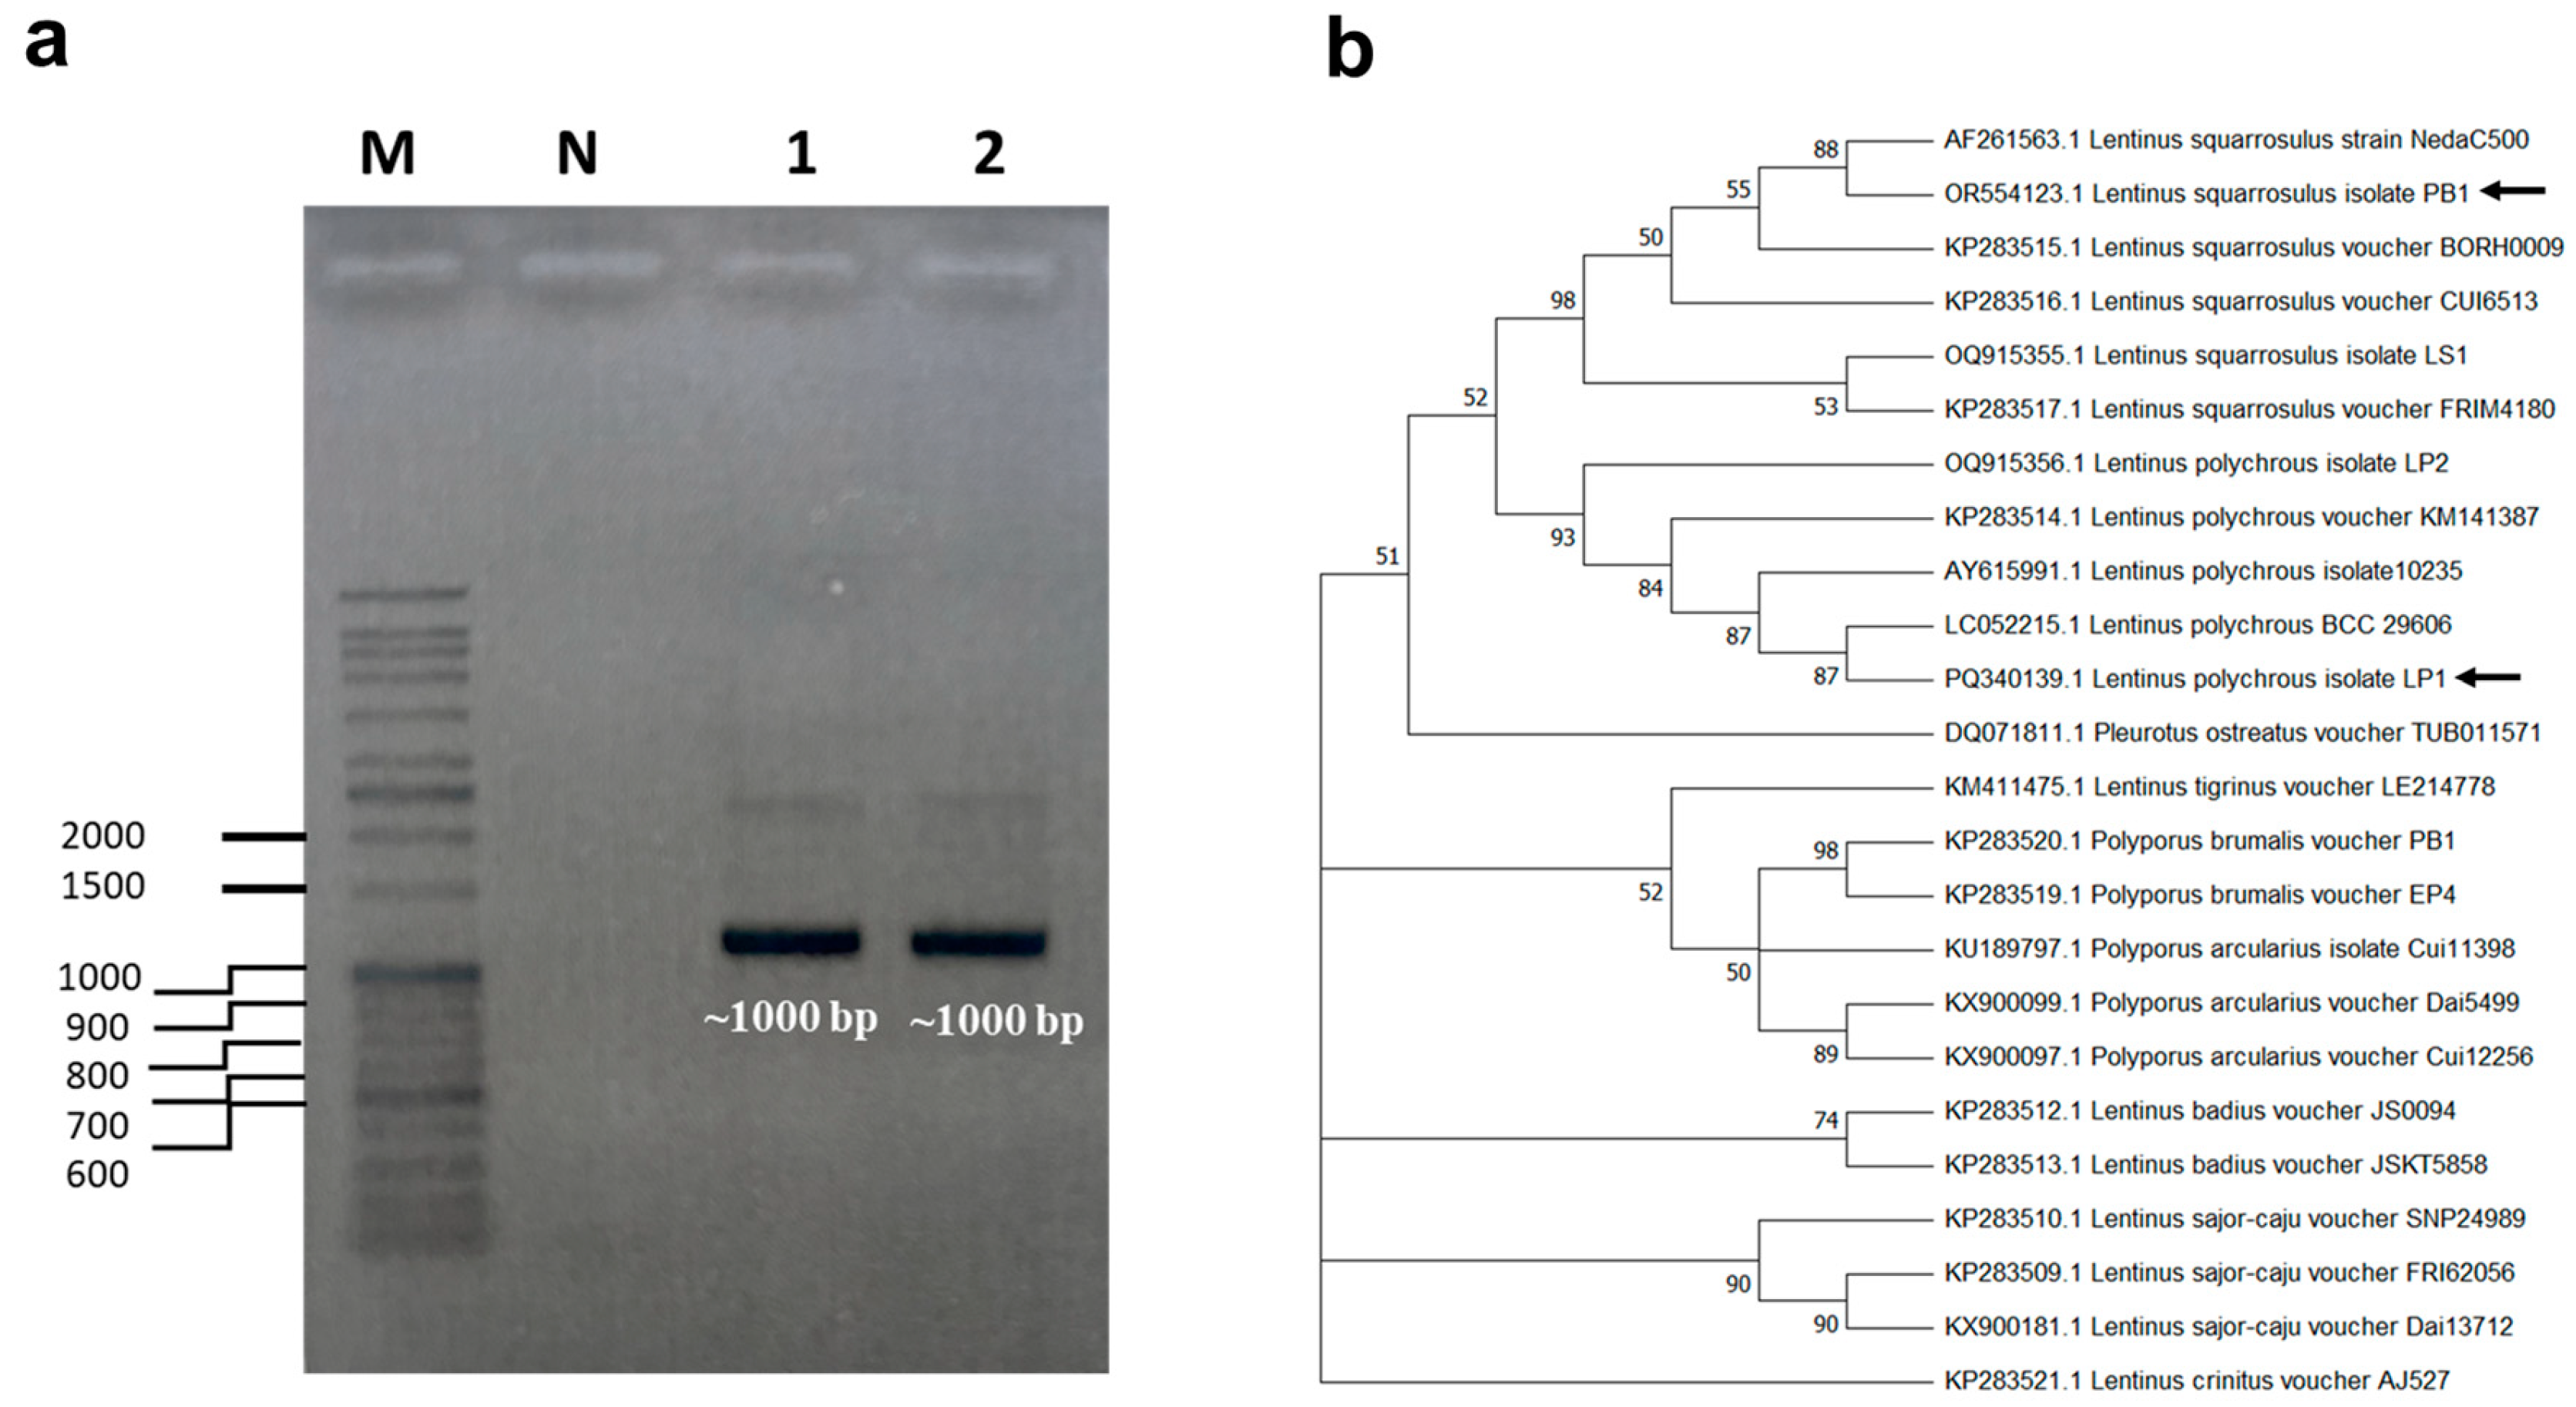
Figure 2.
Cultivation of mushrooms L.polychrous LP1 and L. squarrosulus PB1. (a) The mycelium grown on millet grains for 14 days. (b) the fruiting bodies of mushrooms in sawdust plastic bags after 14 days of cultivation.
Figure 2.
Cultivation of mushrooms L.polychrous LP1 and L. squarrosulus PB1. (a) The mycelium grown on millet grains for 14 days. (b) the fruiting bodies of mushrooms in sawdust plastic bags after 14 days of cultivation.

Figure 3.
Appearance of crude polysaccharide LS from L. squarrosulus PB1 (a) and LP from L. polychrous LP1 (b).
Figure 3.
Appearance of crude polysaccharide LS from L. squarrosulus PB1 (a) and LP from L. polychrous LP1 (b).
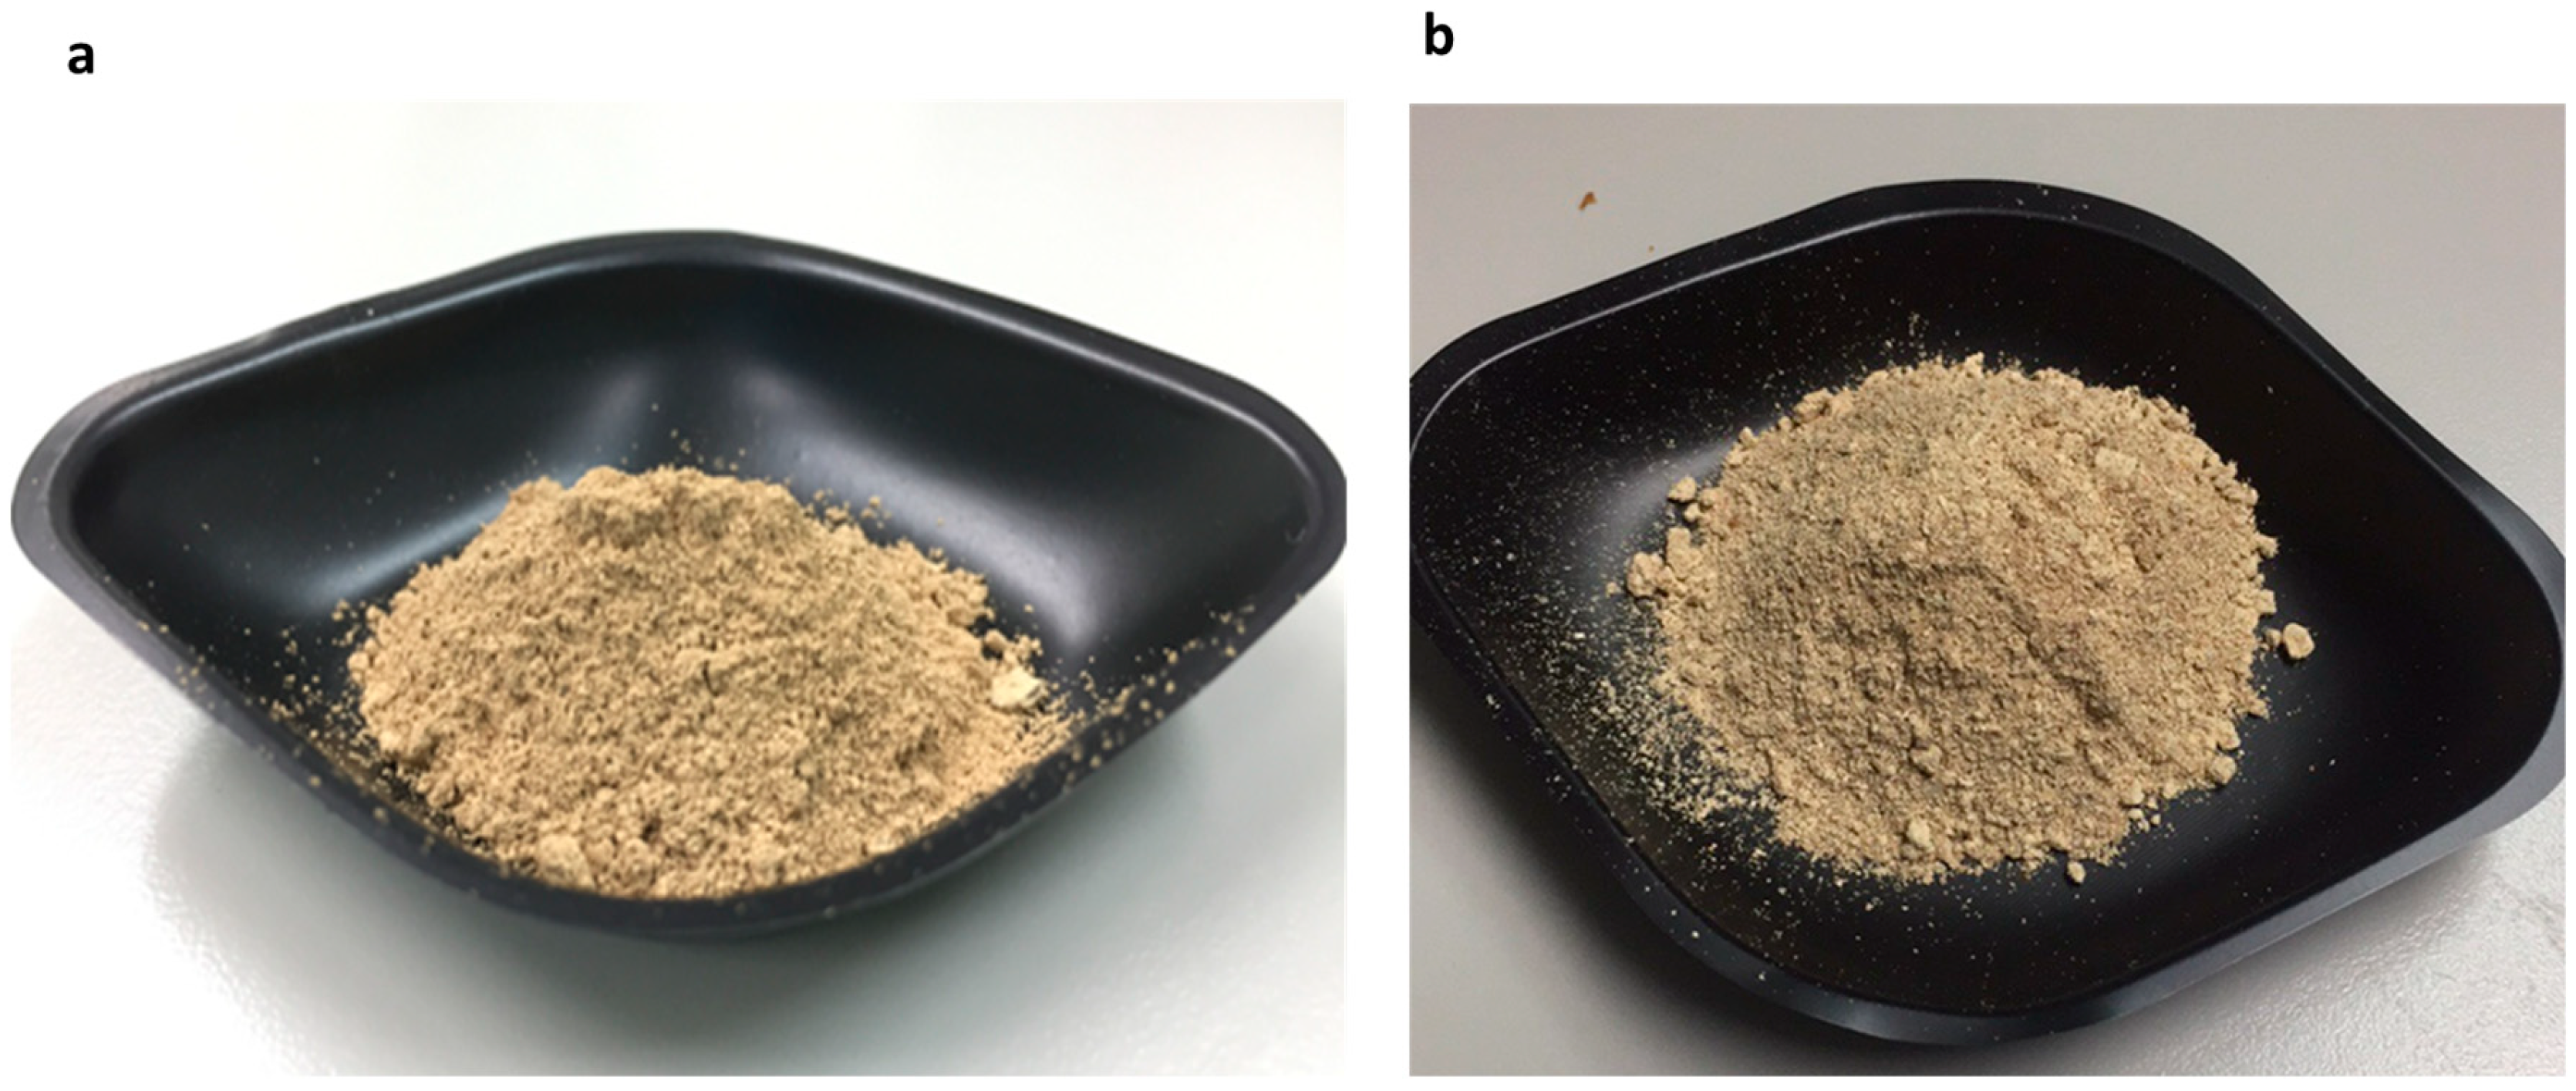
Figure 4.
Ethidium bromide-stained gel showing the amplified product of the partial 16S ribosomal RNA gene (16S rRNA) of bacteria of the samples at 0 h (a) and 24 h (b) after fermentation. Lane M contained the VC DNA ladder. Lane P contained the PCR product with genomic DNA of Escherichia coli as a positive control. Lane N contained the PCR product without any DNA template. The amplified products of different samples were explained as textually embedded in the figure. Arrow indicates the amplified product size in base pair (bp.).
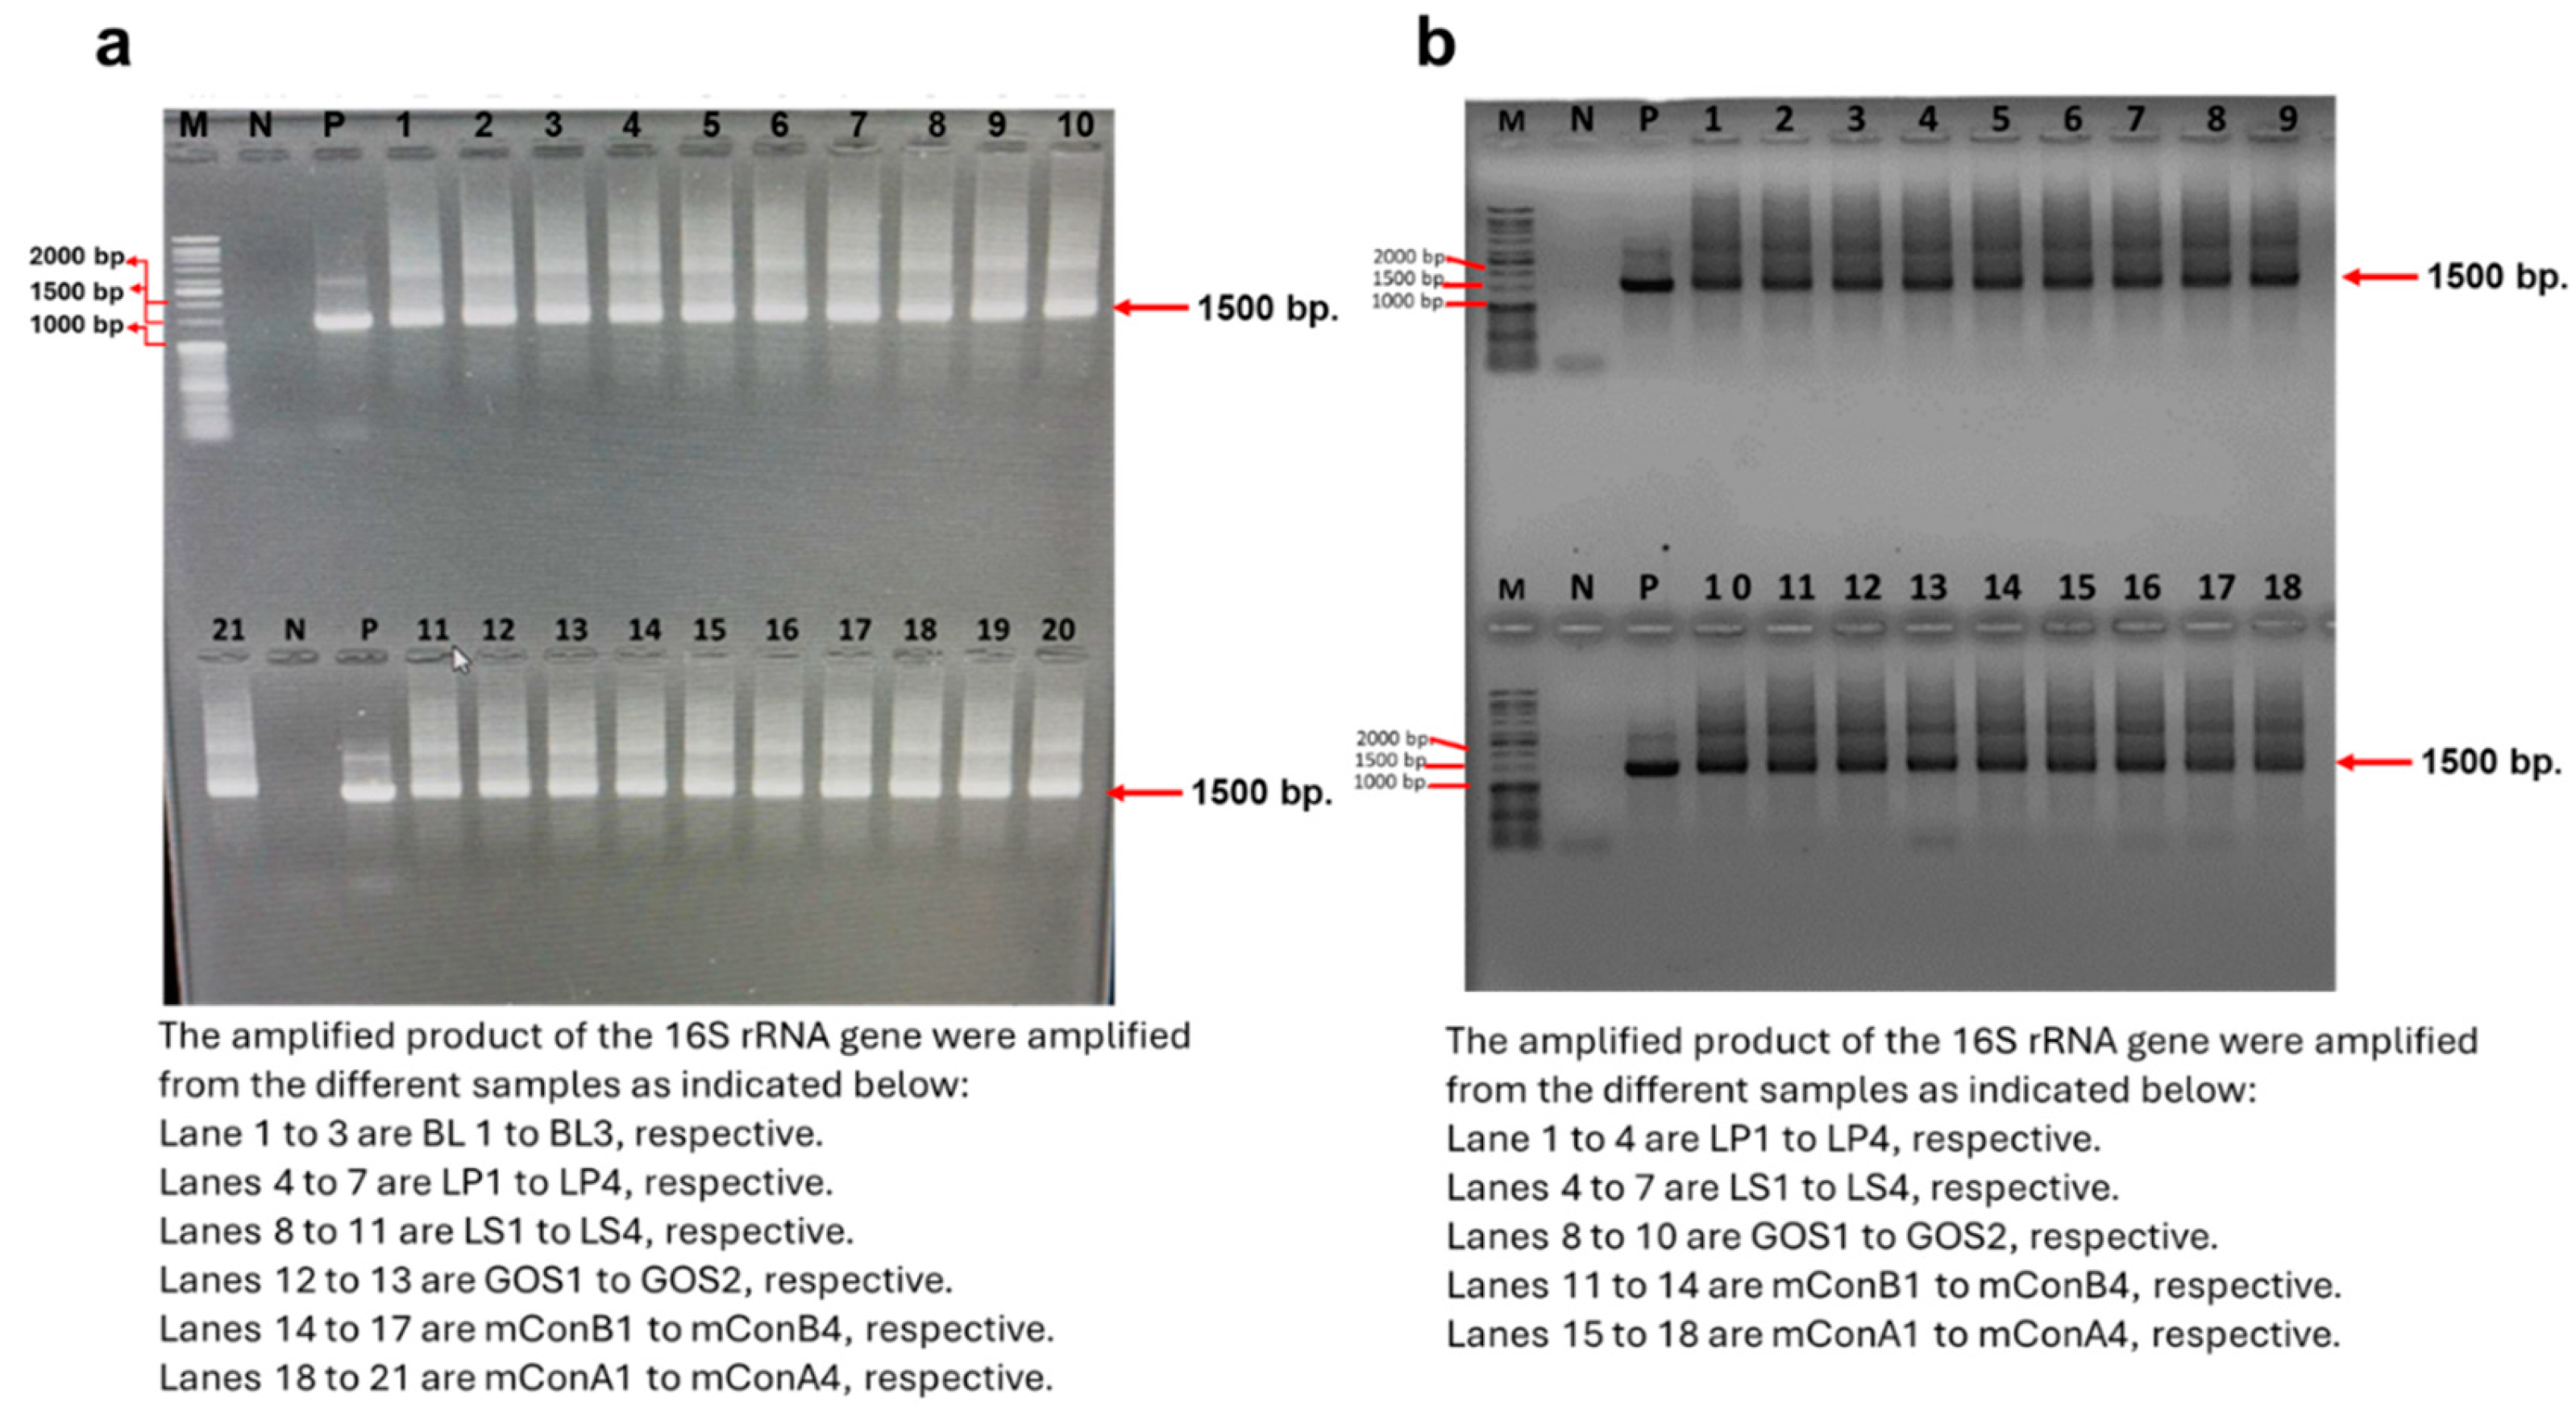
Figure 5.
The refraction curve analysis of Shannon. The sequence number is on the X-axis, and the observed amplicon sequence variants (ASVs) is on the Y-axis.
Figure 5.
The refraction curve analysis of Shannon. The sequence number is on the X-axis, and the observed amplicon sequence variants (ASVs) is on the Y-axis.
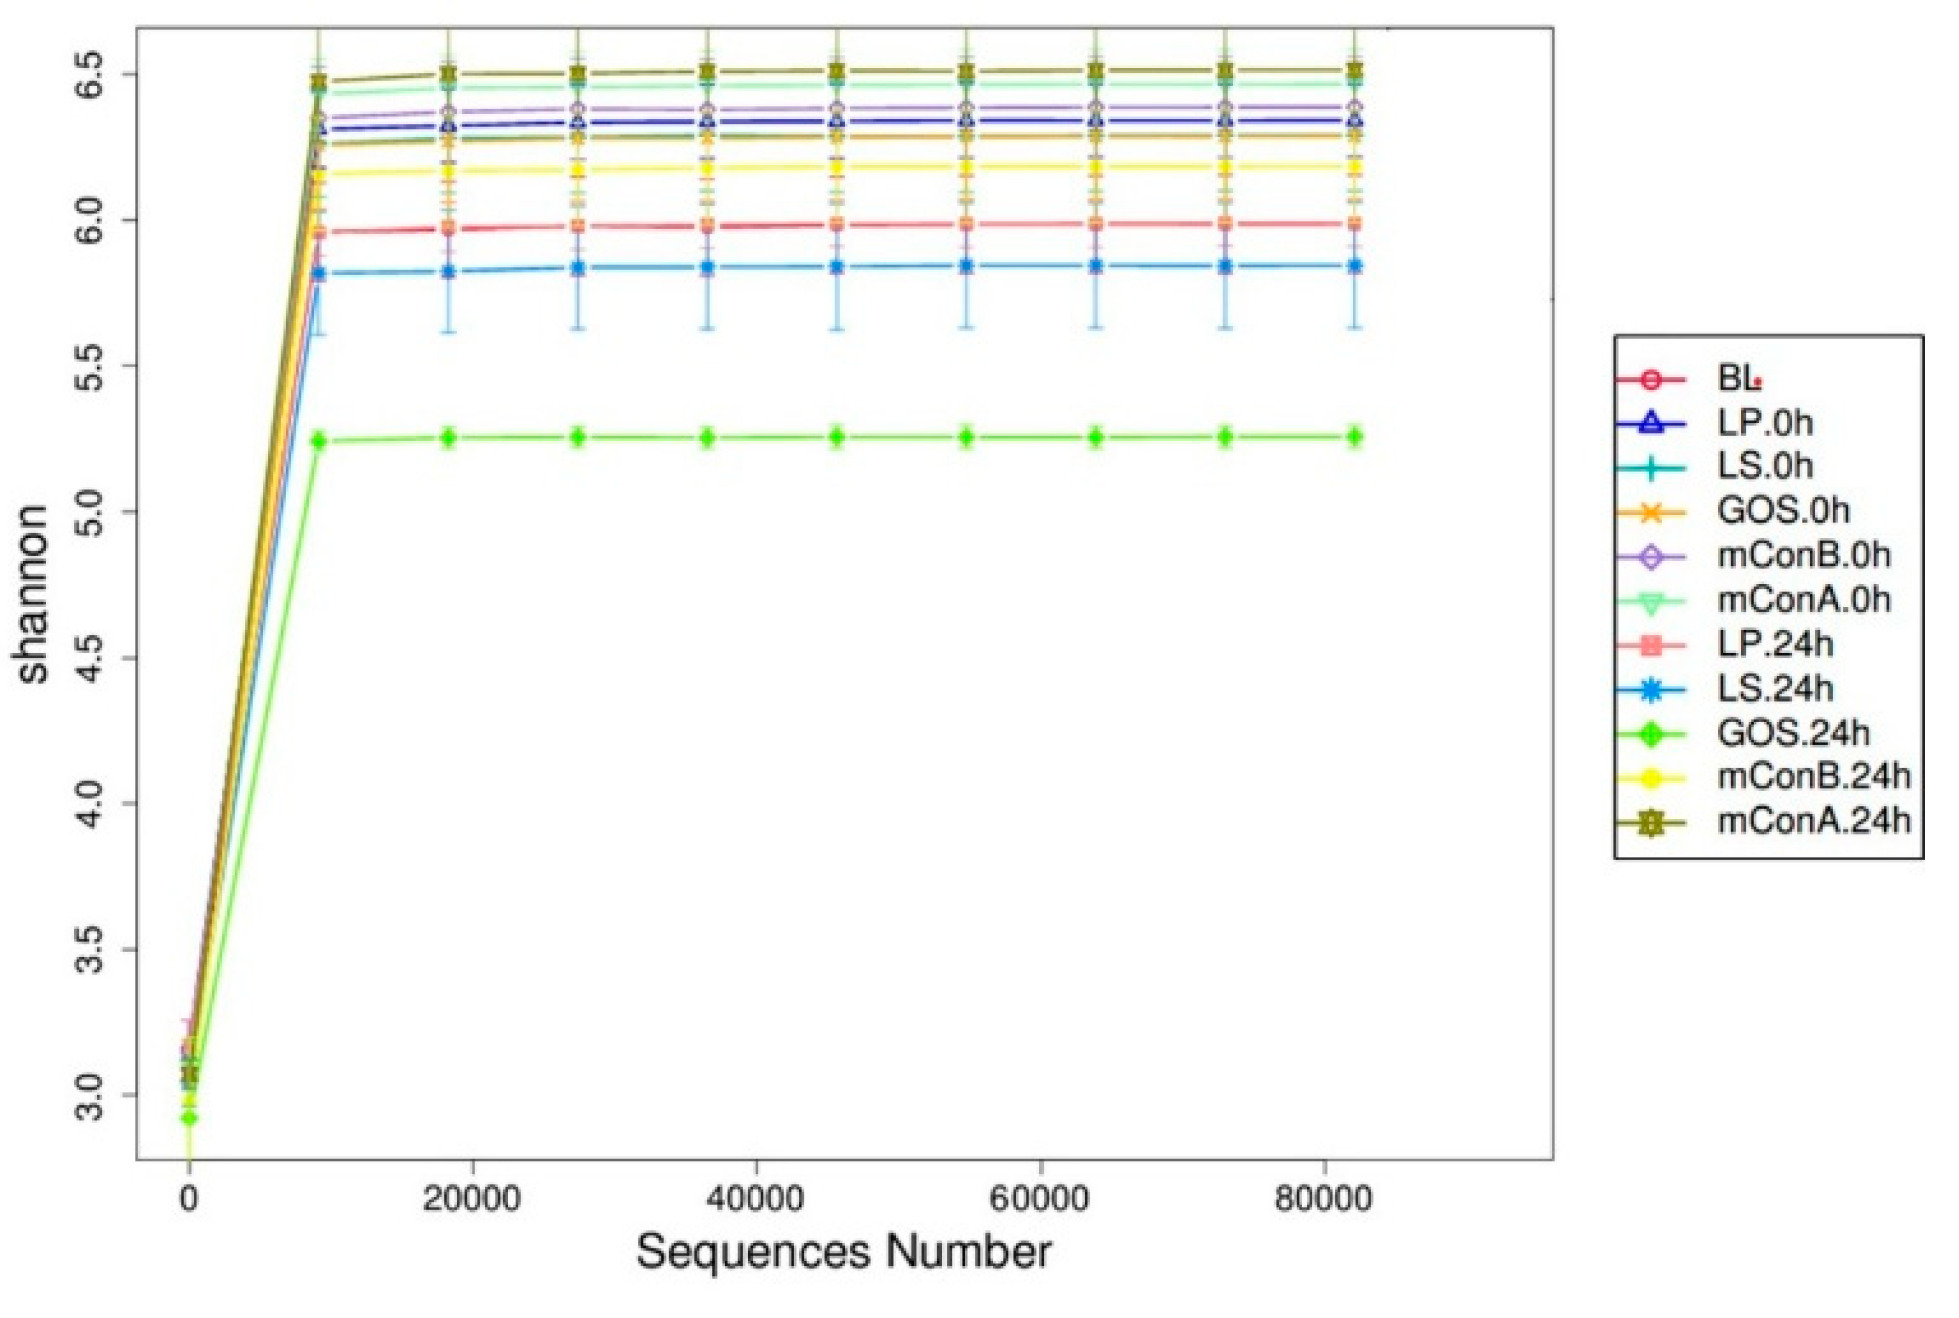
Figure 6.
The species rank abundance curve. The relative abundance of each species is plotted against their rank order.
Figure 6.
The species rank abundance curve. The relative abundance of each species is plotted against their rank order.
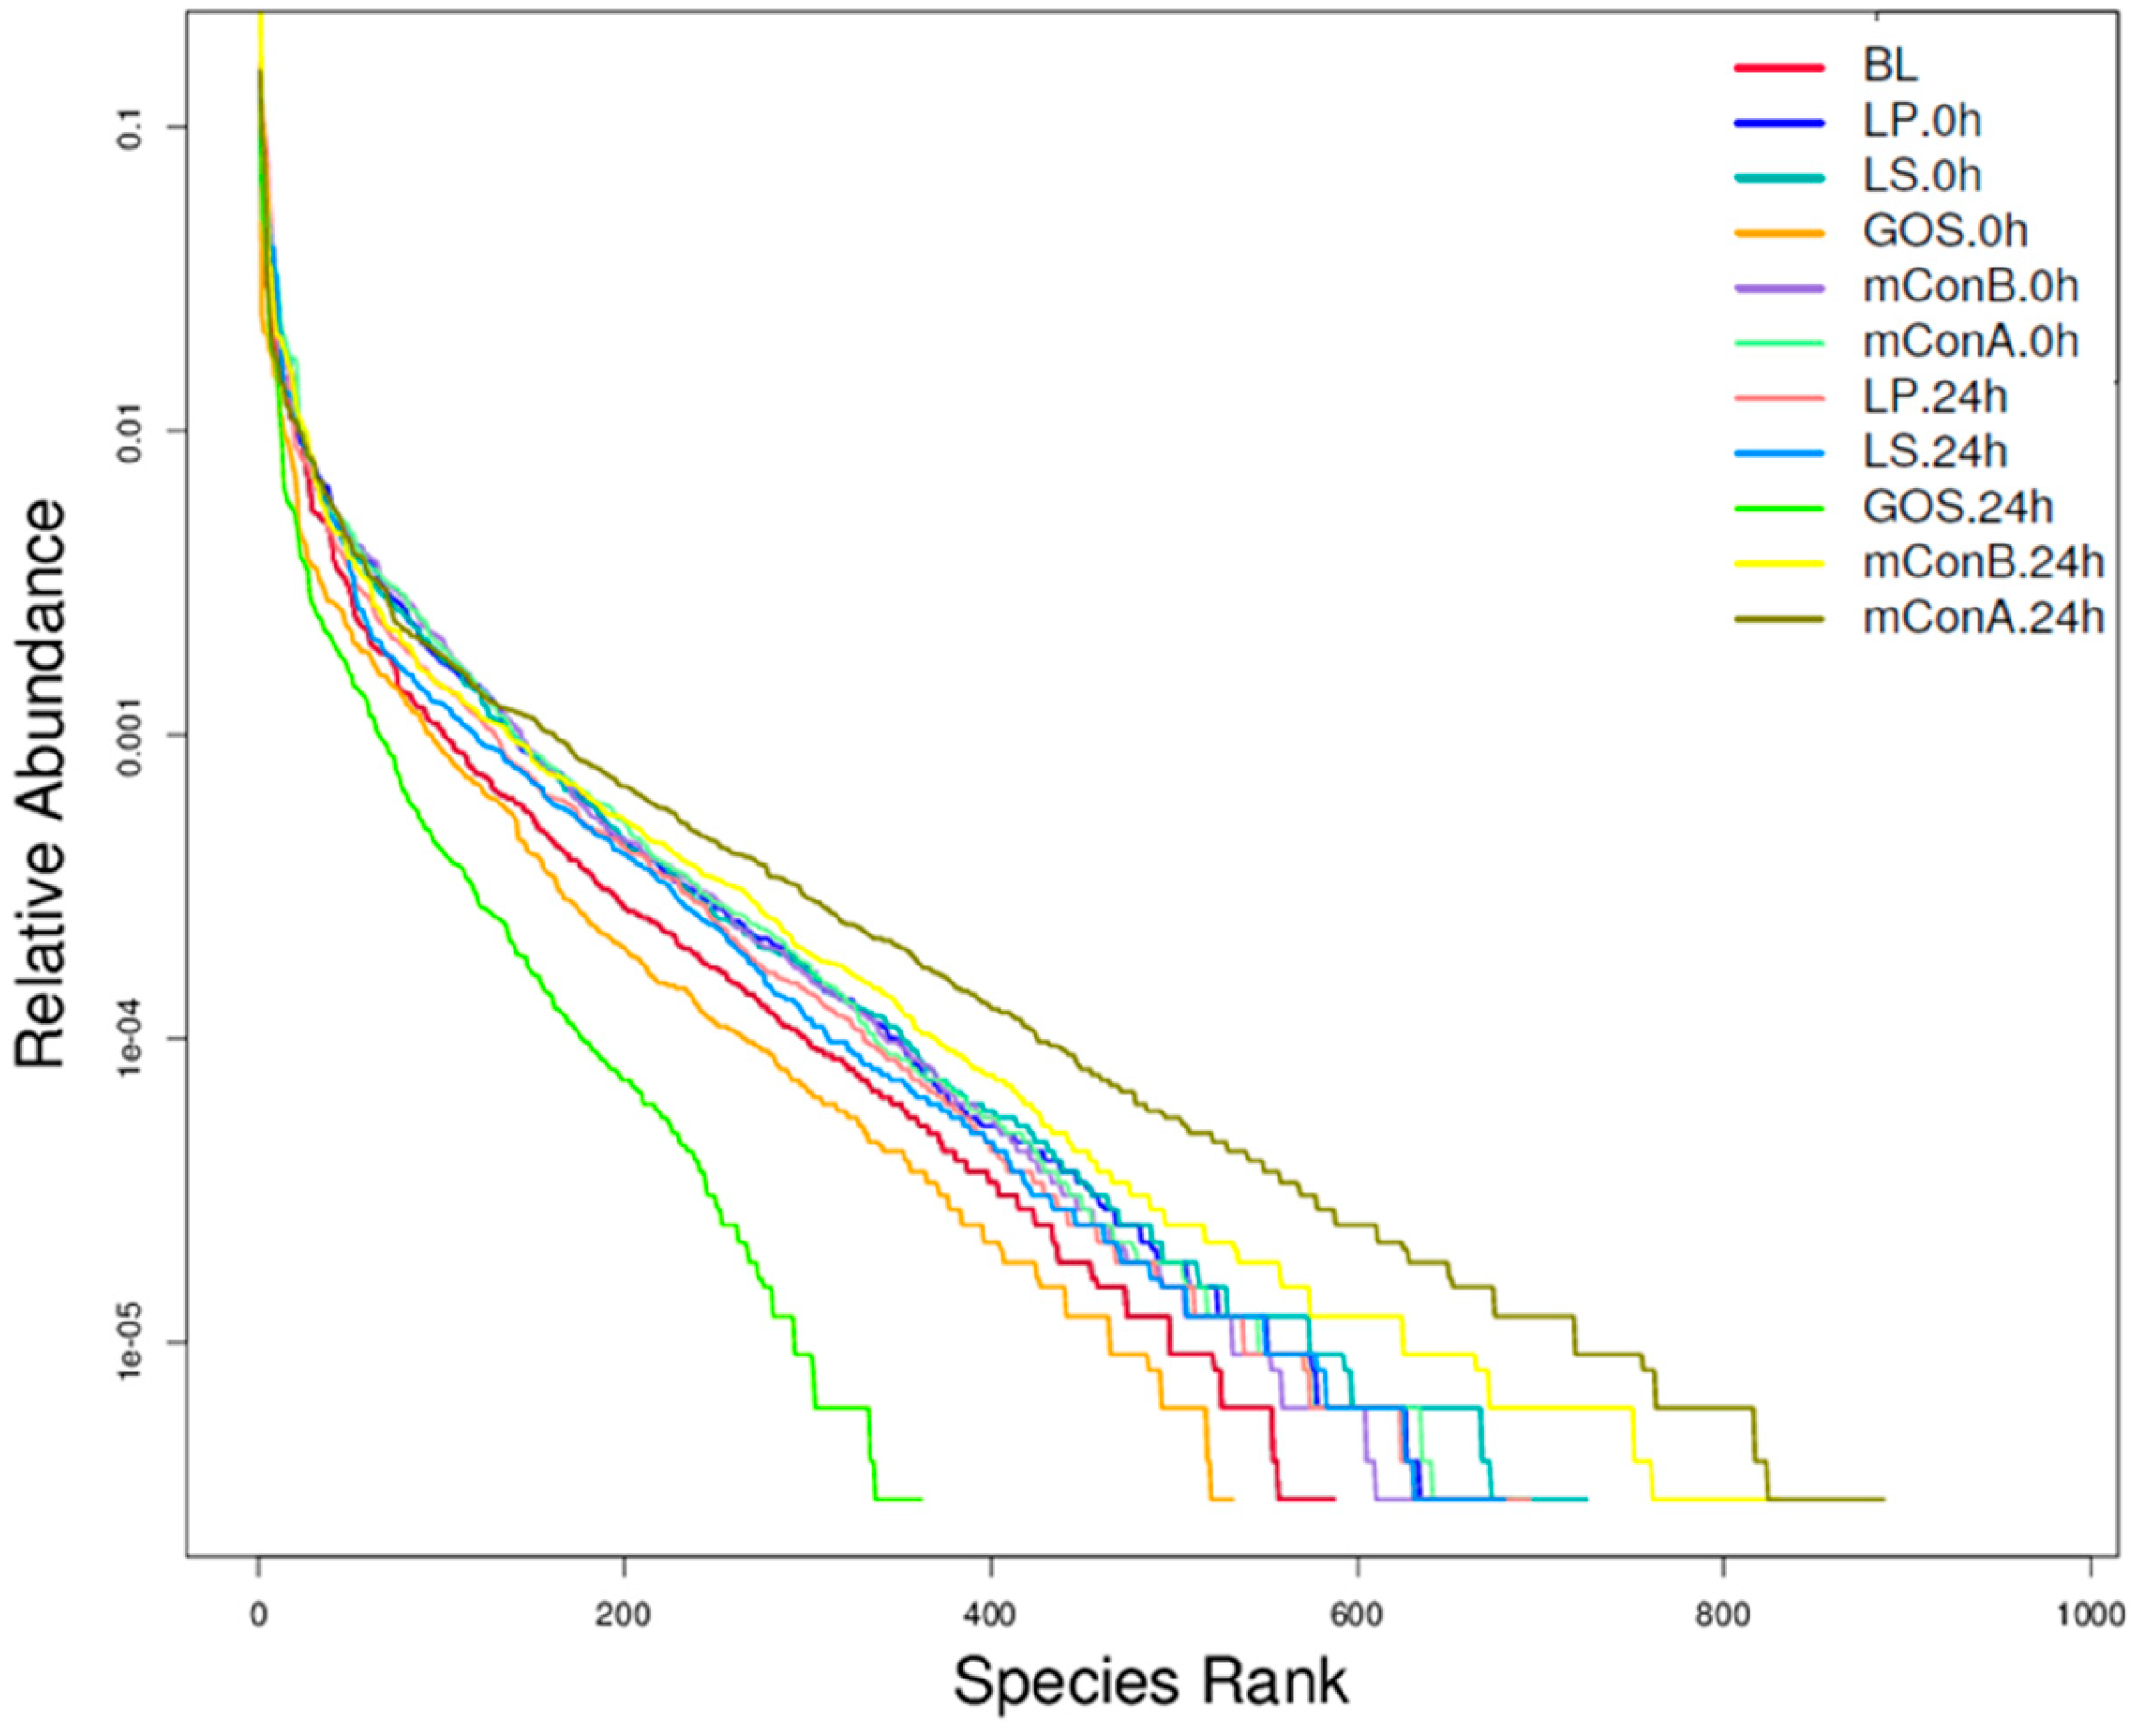
Figure 7.
The difference of alpha diversity indices of Chao1 (a), Observed feature (b), Shannon (c), and Simpson (d). The horizontal axis of the boxplot represents the groups, while the vertical axis represents the corresponding alpha diversity index value. The Kruskal-Wallis test carried out the statistical analysis. The significant differences of p < 0.05 and p < 0.01 are indicated by ∗and ∗∗, respectively.
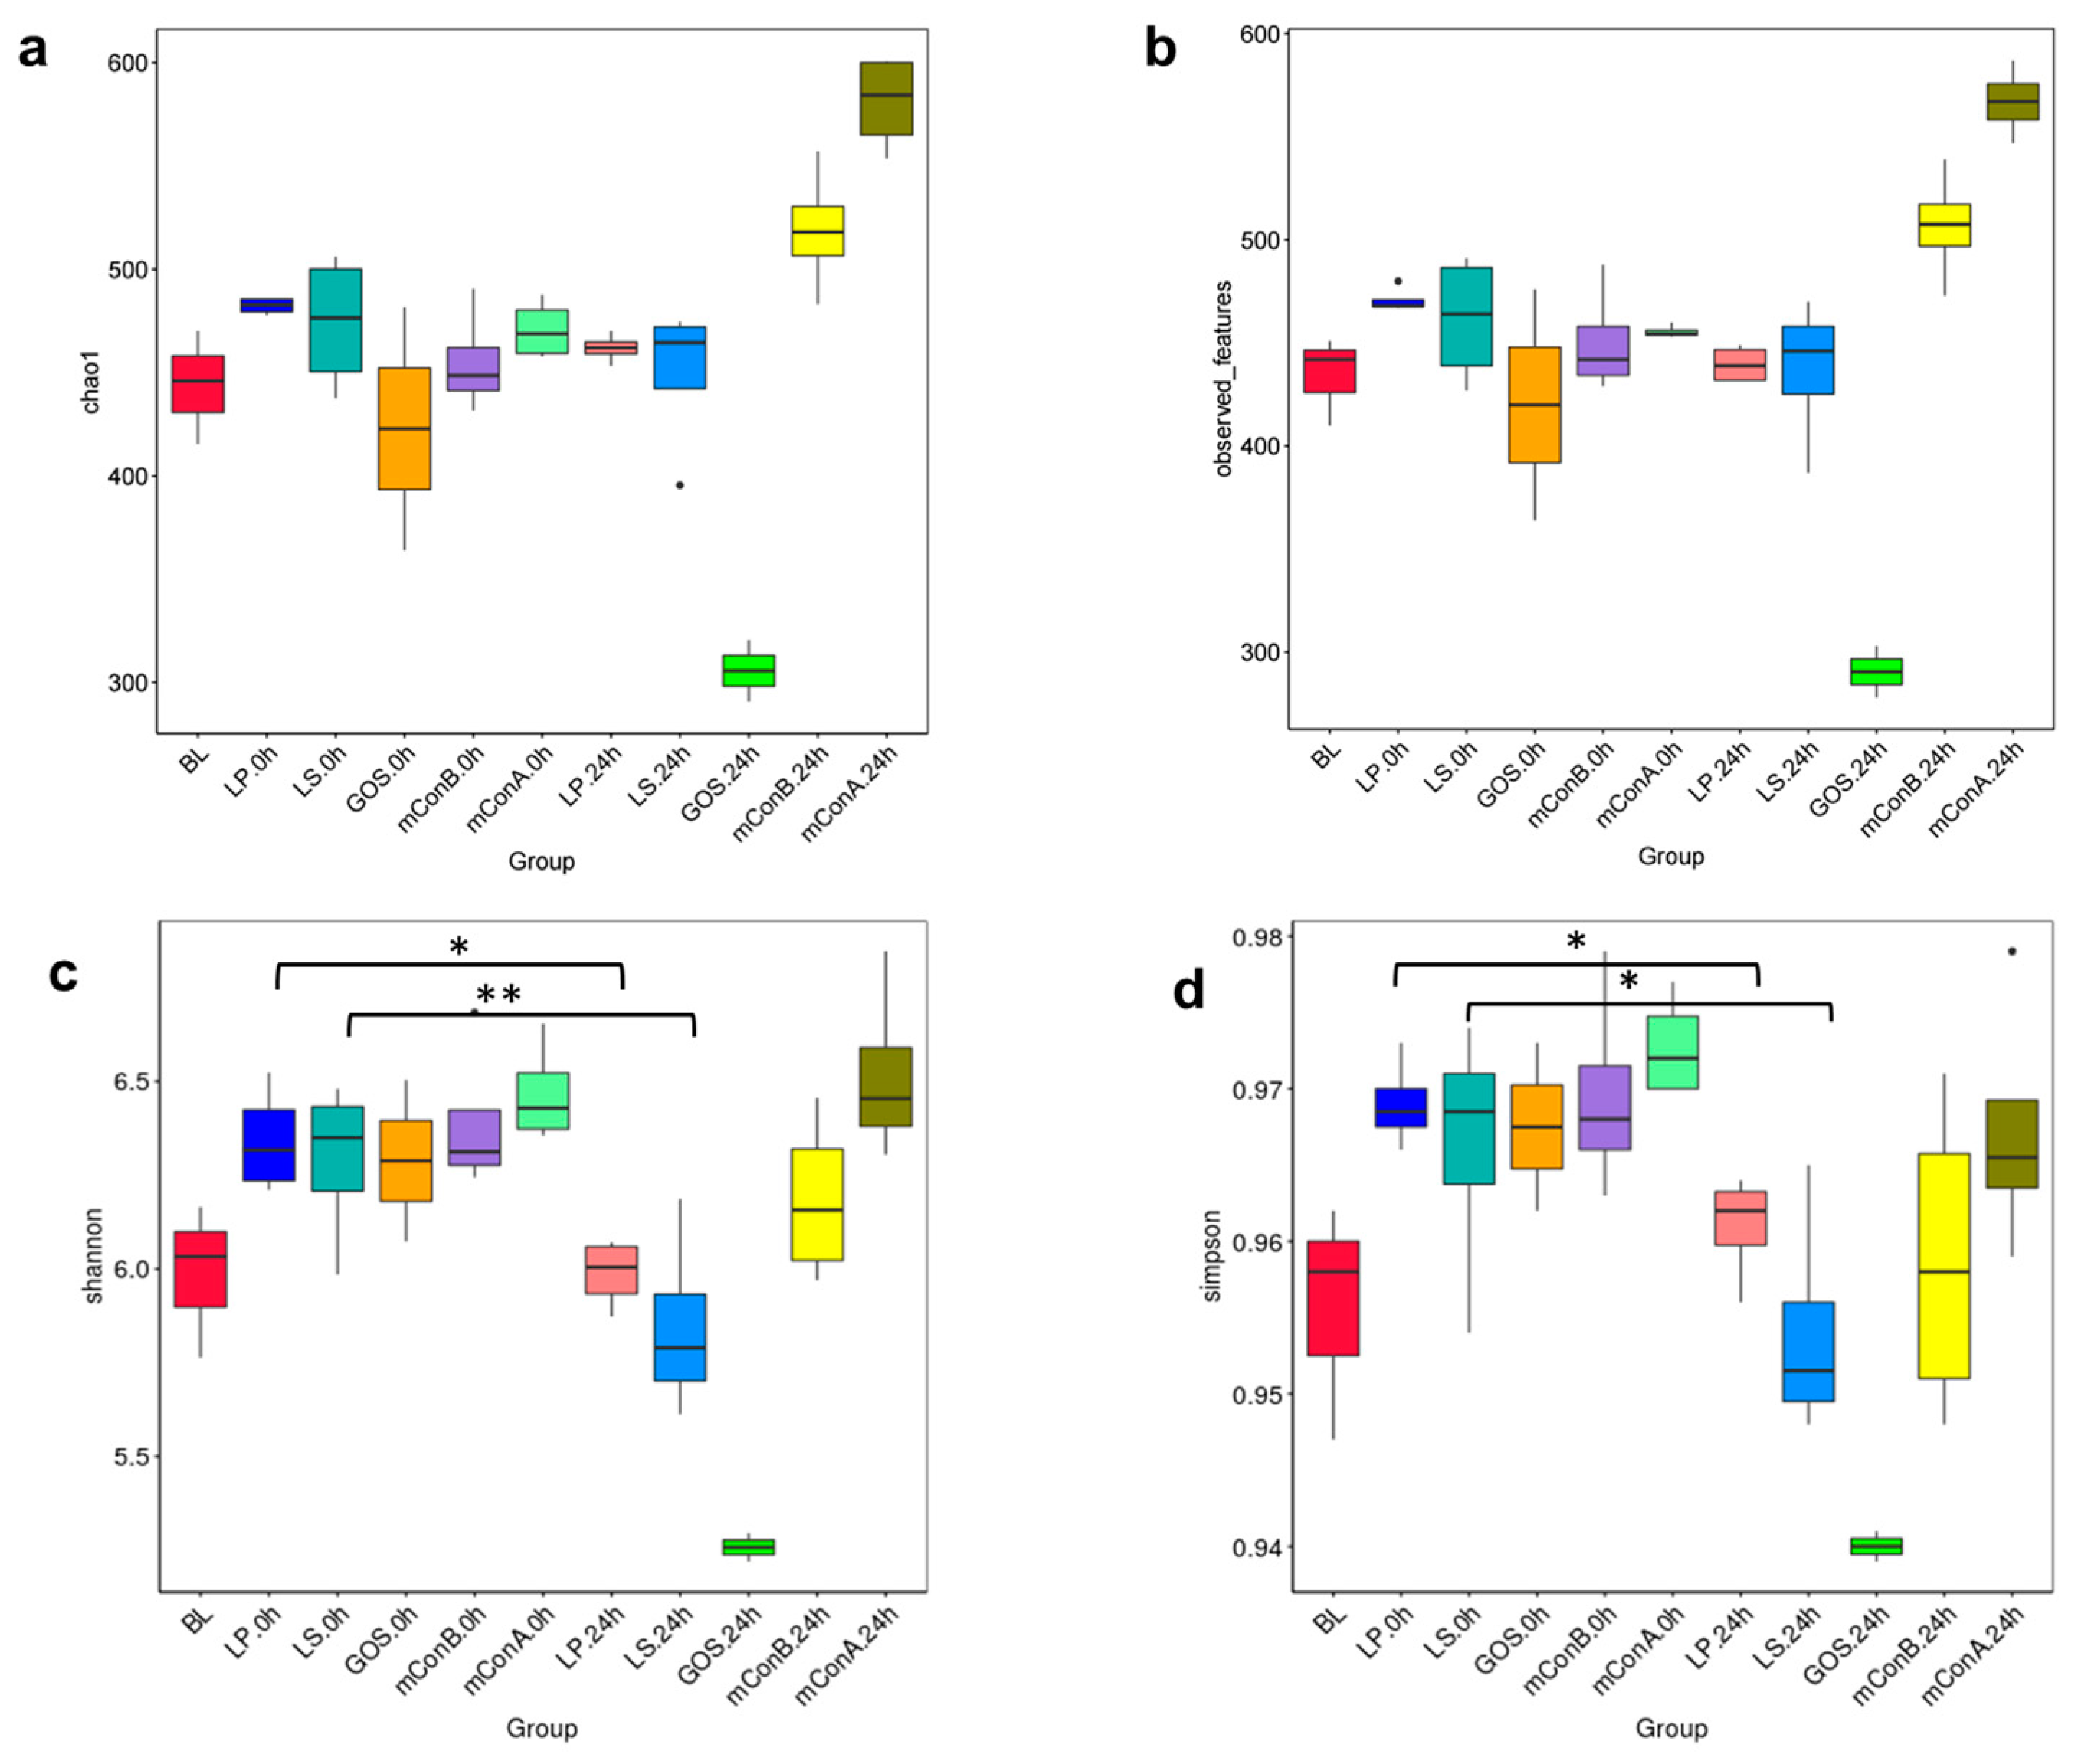
Figure 8.
Beta diversity analysis of bacterial composition of treatments. (a) Principal component analysis (PCA). (b) The principal coordinates analysis (PCoA) is based on weighted UniFrac distance. Each point represents a sample, plotted by a principal component on the X-axis and another principal component on the Y-axis, which was colored by group.
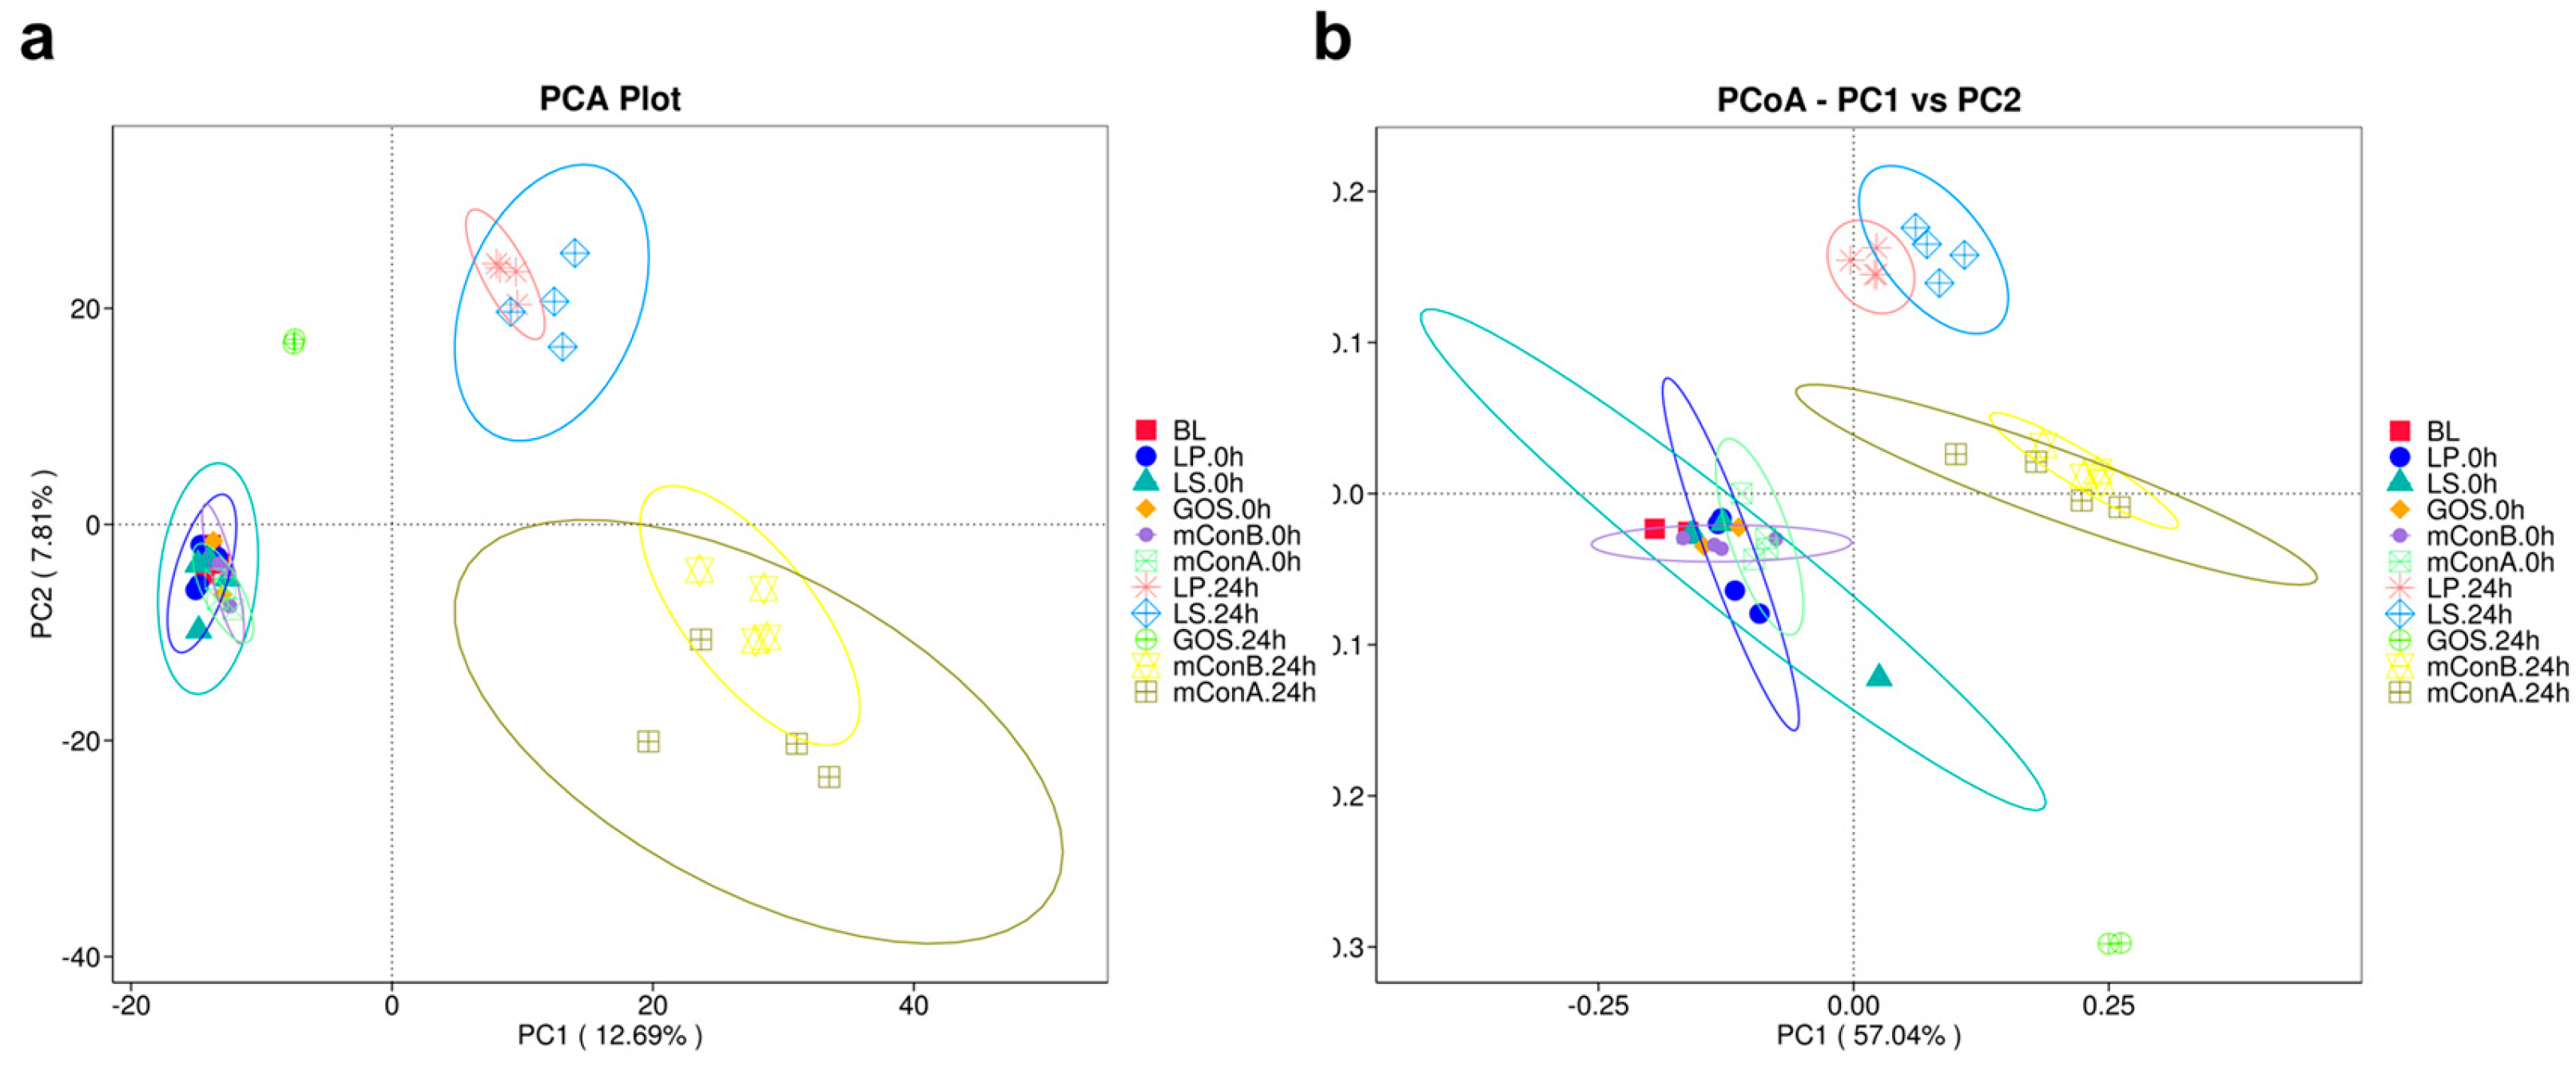
Figure 9.
The UPGMA cluster tree based on the weighted UniFrac distance shows the evolutionary relationships between different treatments in the dataset. Lotted with UPGMA tree on the left and the relative abundance in phylum map on the right. The treatments are grouped based on their similarities in composition and structure.
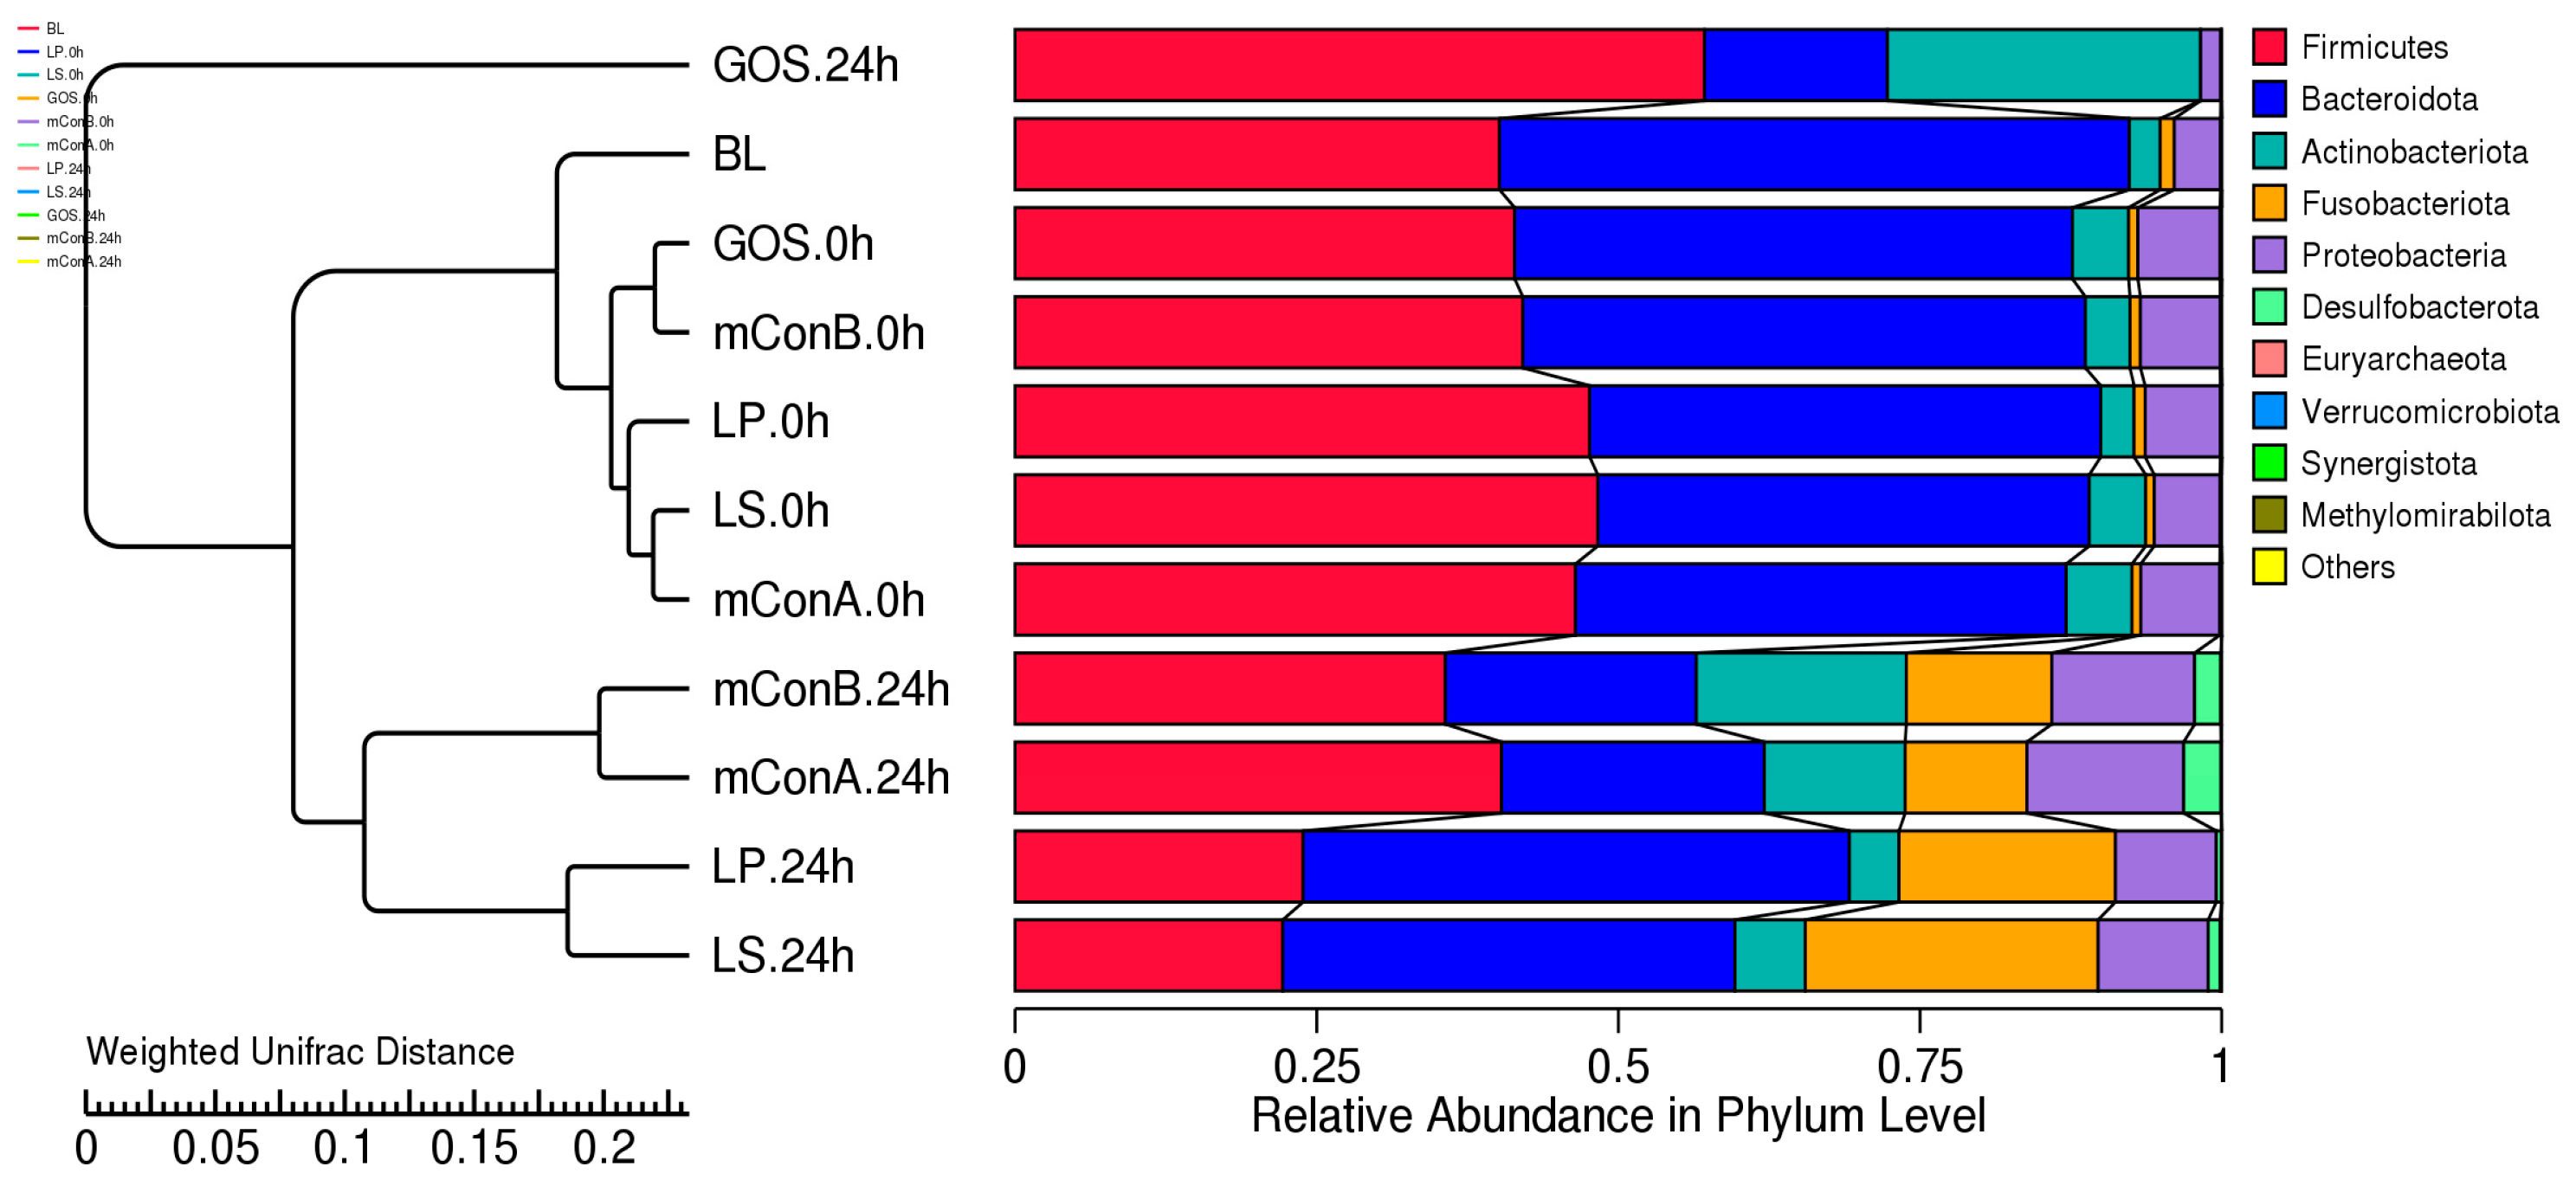
Figure 10.
Bacterial taxonomy profiling in the phylum (A), family (B), and genus (C) levels in the sample groups. The Y-axis represents “Relative Abundance,” and the X-axis represents “Sample Name.”. “Others” represents a total relative abundance of the rest of the phyla besides the top 10 phyla.
Figure 10.
Bacterial taxonomy profiling in the phylum (A), family (B), and genus (C) levels in the sample groups. The Y-axis represents “Relative Abundance,” and the X-axis represents “Sample Name.”. “Others” represents a total relative abundance of the rest of the phyla besides the top 10 phyla.
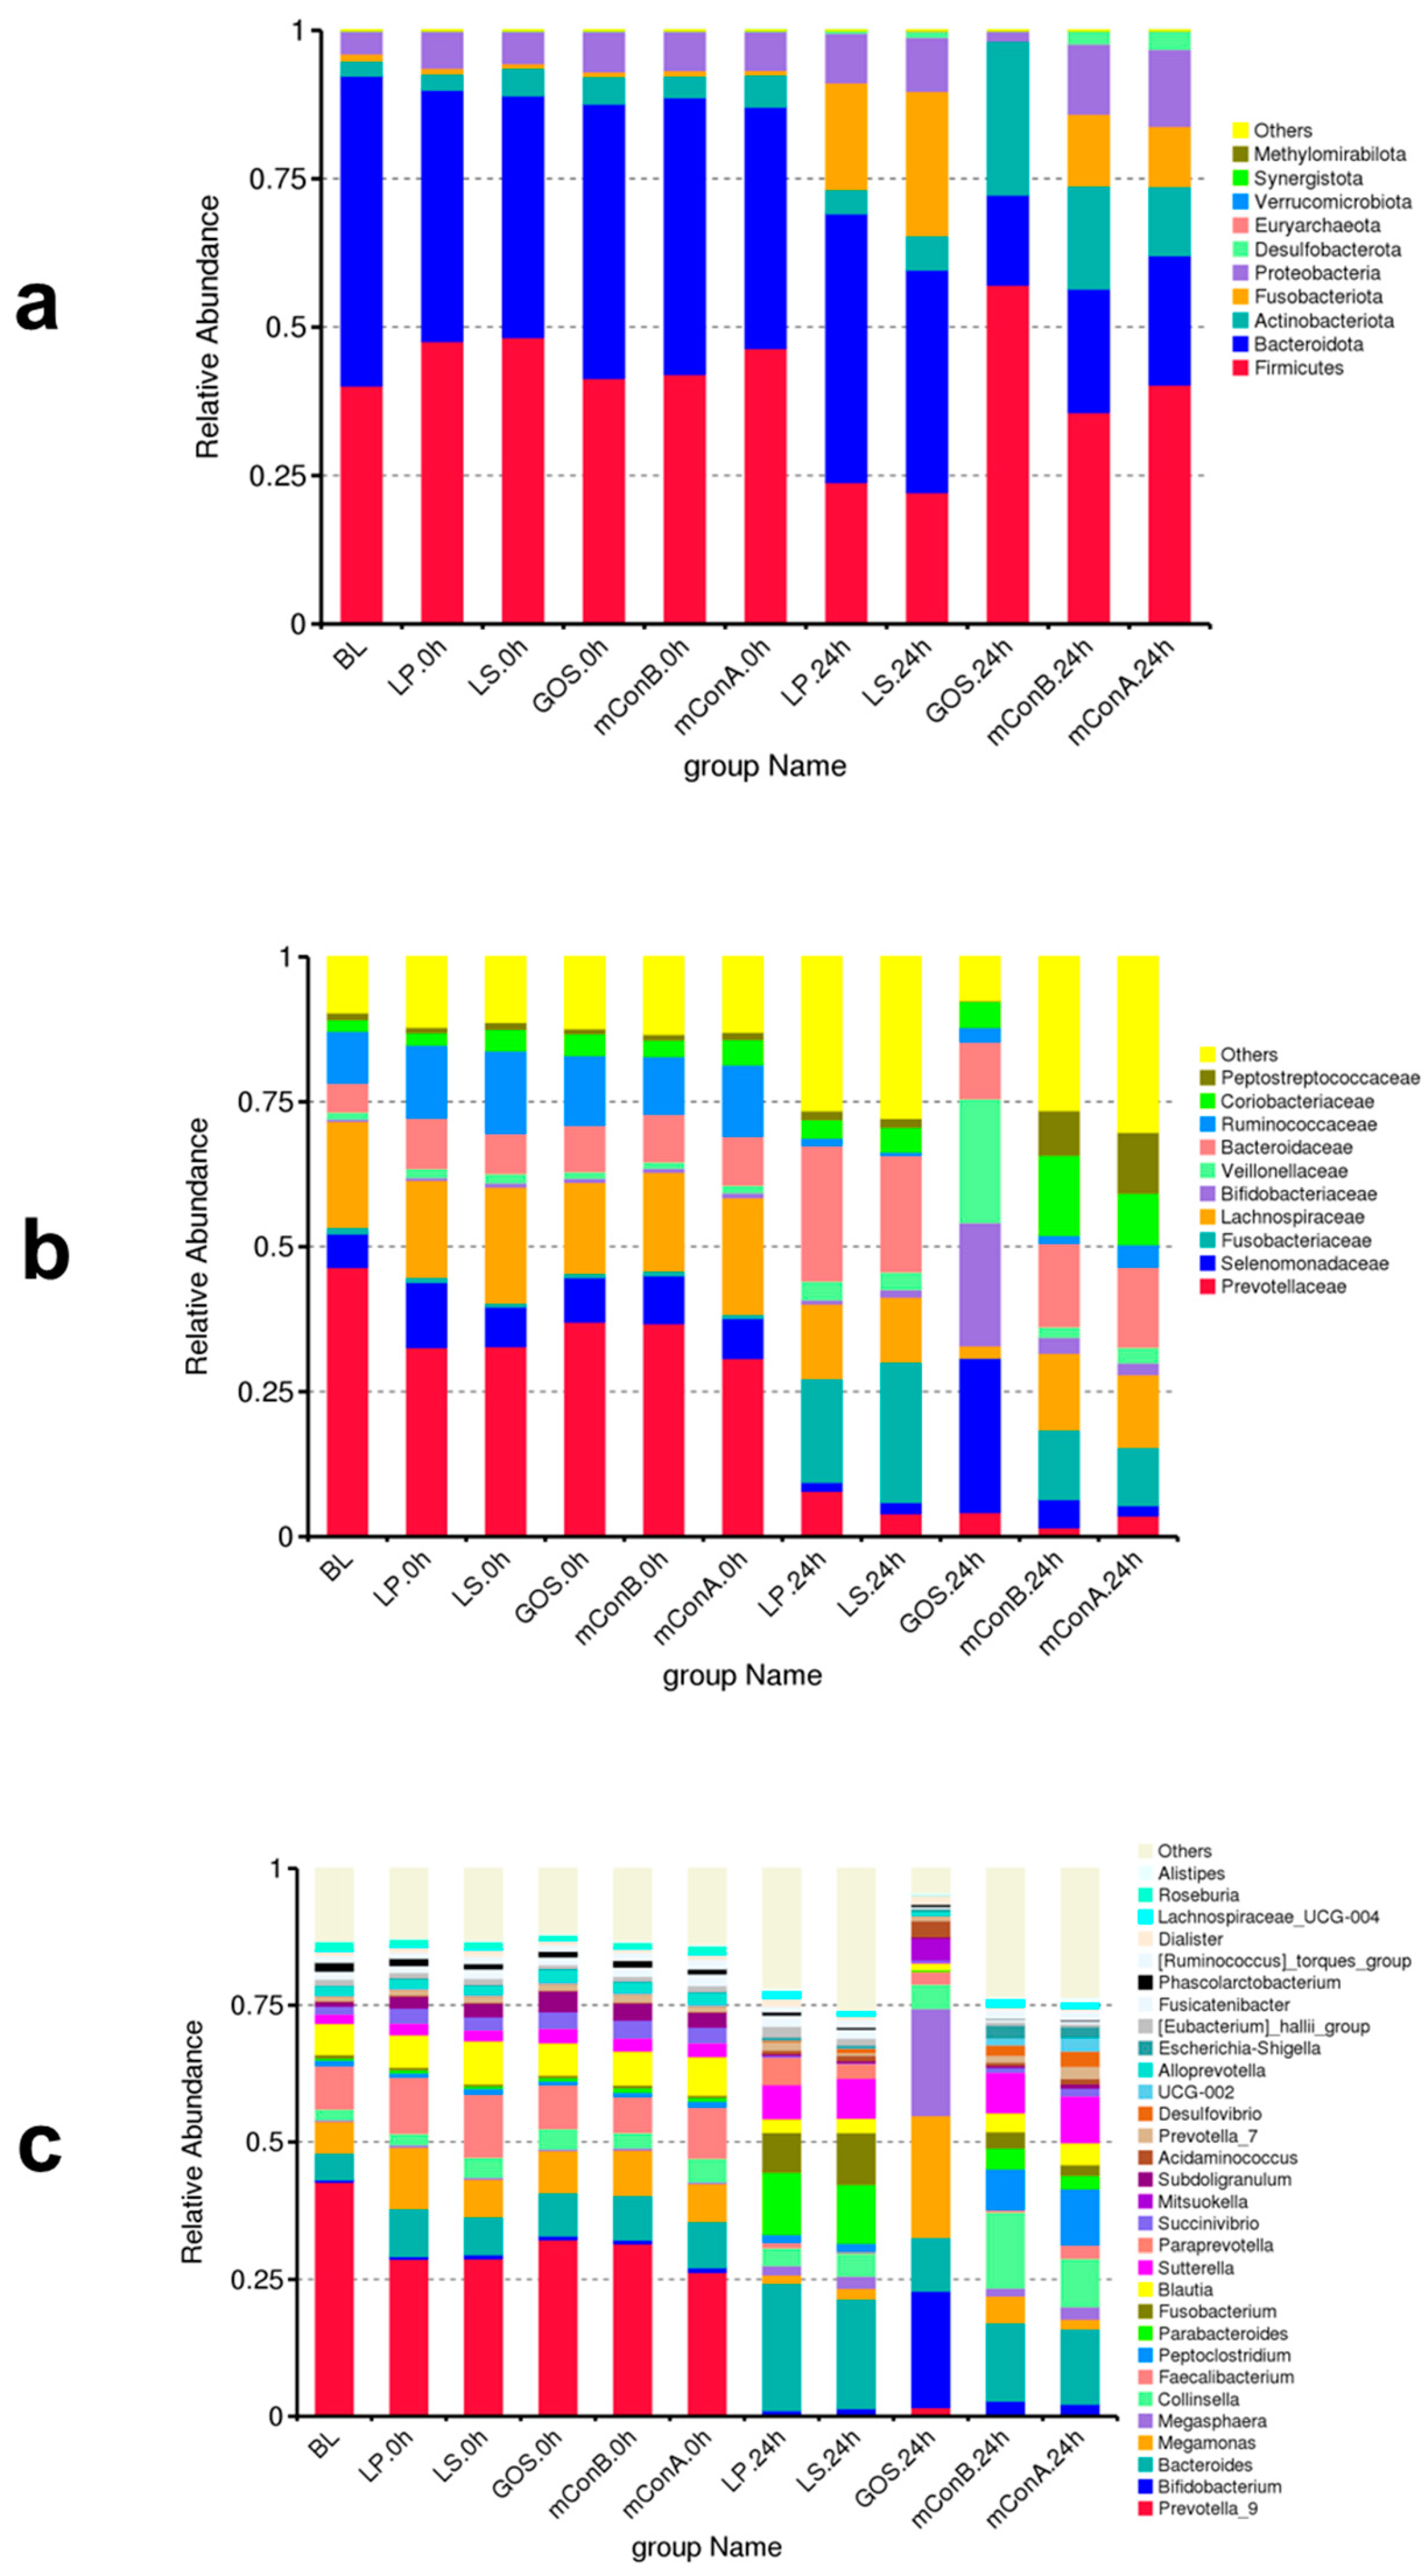
Figure 14.
The ratio of Firmicutes/Bacteroidetes (a) and Blautia/Bacteroides (b). The X-axis represents the type of crude polysaccharide, LS or LP. The Y-axis represents the ratio value.
Figure 14.
The ratio of Firmicutes/Bacteroidetes (a) and Blautia/Bacteroides (b). The X-axis represents the type of crude polysaccharide, LS or LP. The Y-axis represents the ratio value.
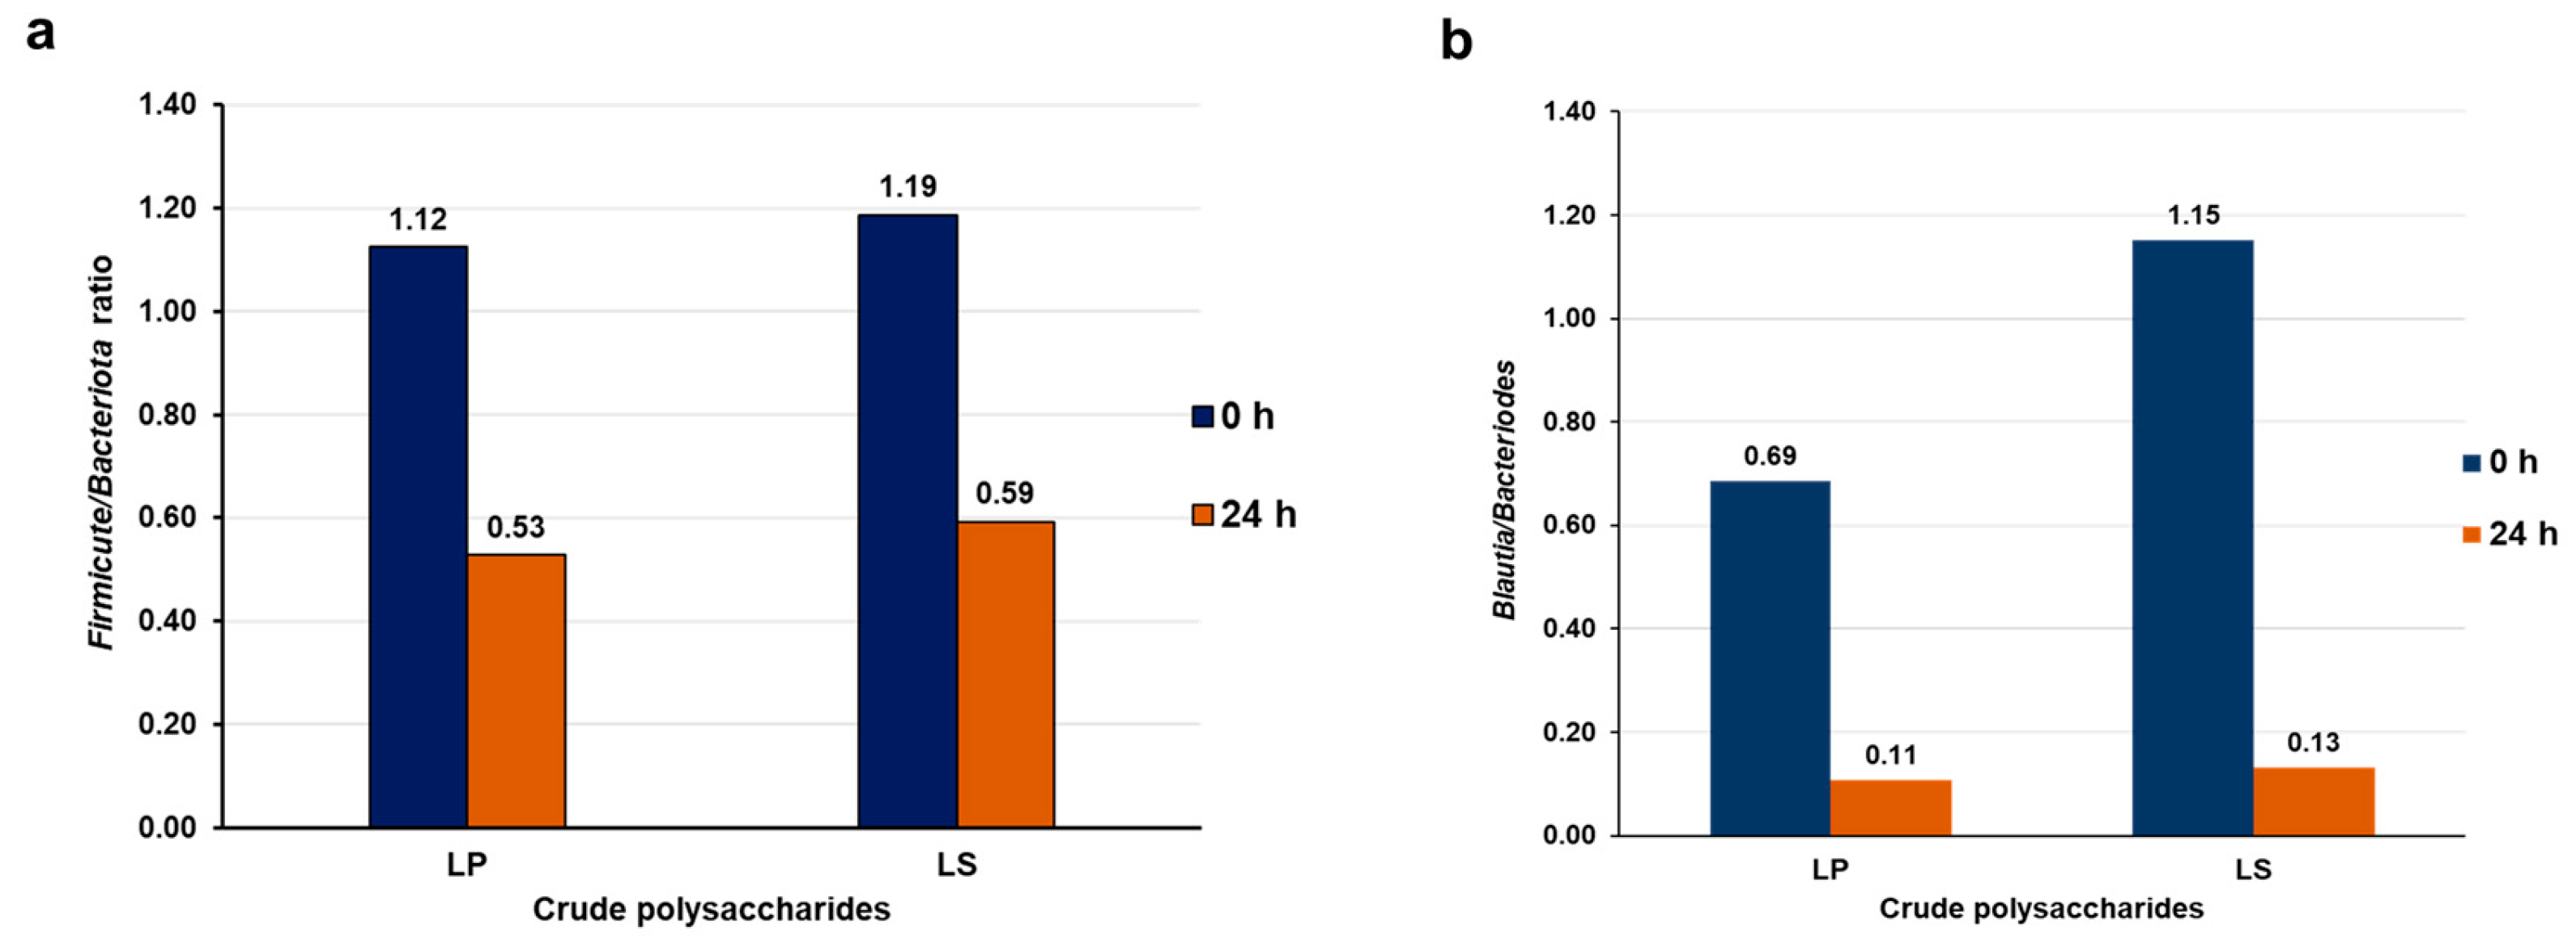
Figure 15.
Change of pH in each treatment group at 0 and 24 h after fermentation.
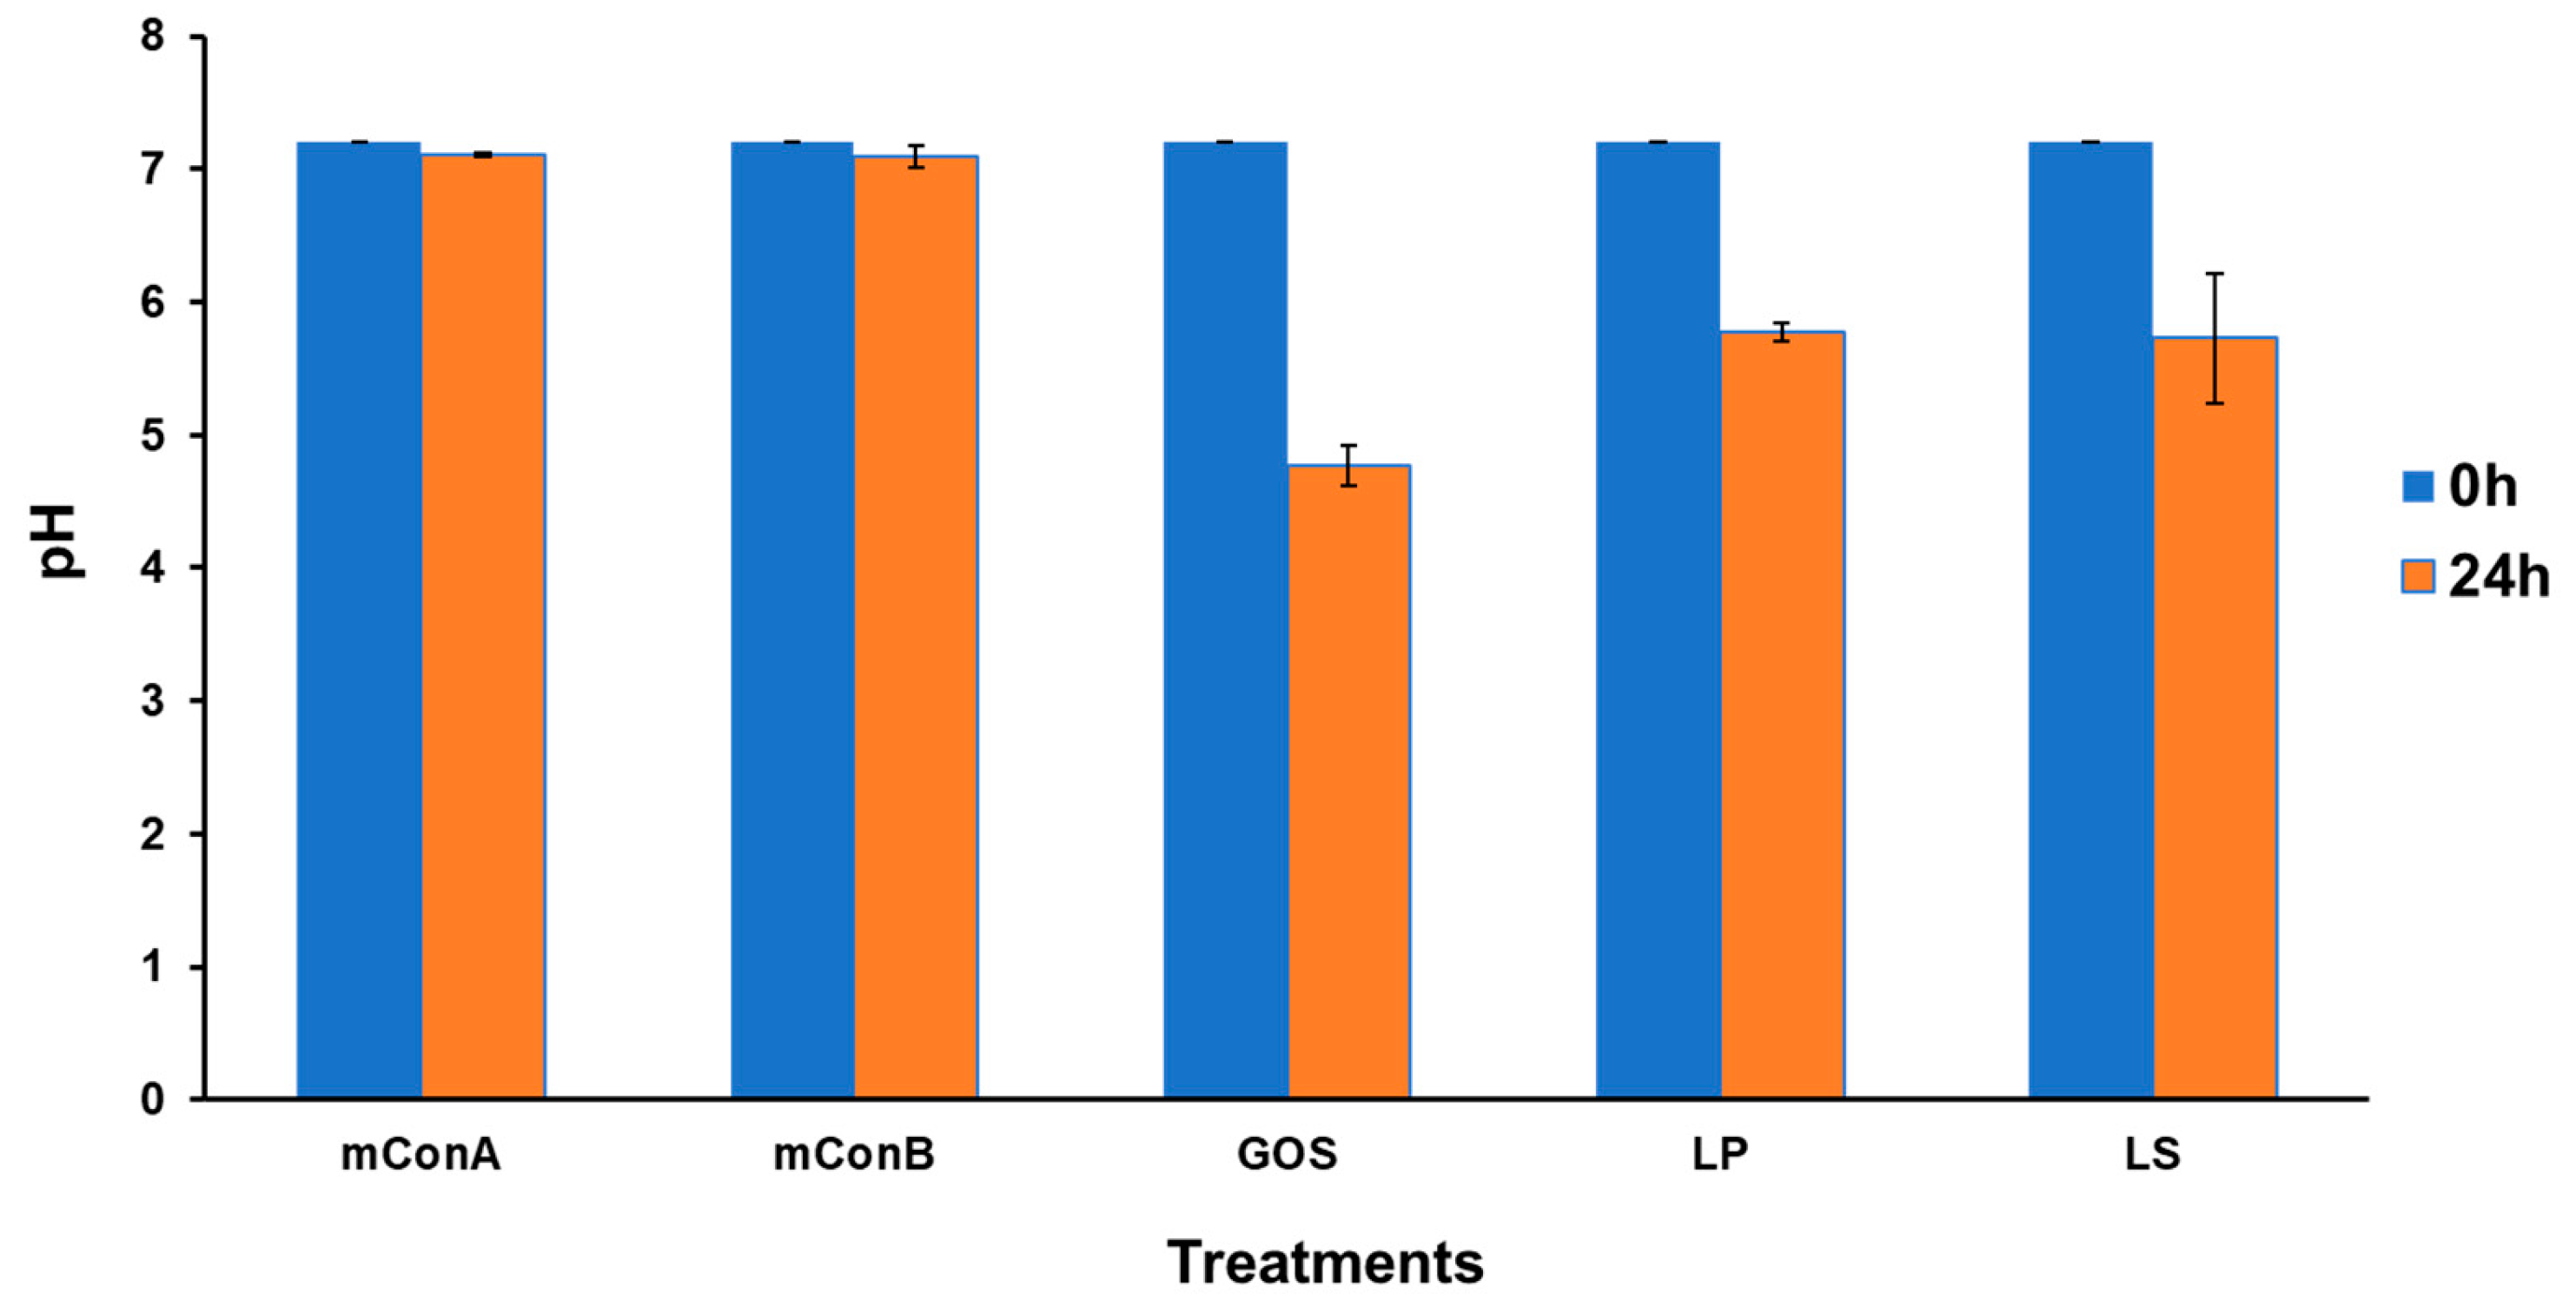

Table 1.
Chemical components in simulated digestive solutions.
| Chemicals | Simulated digestive solutions and their final concentration (mmol/l) | ||
|---|---|---|---|
| simulated salivary fluid (SSF) |
simulated gastric fluid (SGF) | simulated intestinal fluid (SIF) | |
| KCl | 15.10 | 6.90 | 6.80 |
| KH2PO4 | 3.70 | 0.90 | 0.80 |
| NaHCO3 | 13.60 | 25.00 | 85.00 |
| NaCl | - | 47.20 | 38.40 |
| MgCl2(H2O)6 | 0.15 | 0.10 | 0.33 |
| (NH4)2CO3 | 0.06 | 0.50 | - |
| CaCl2(H2O) | 1.50 | 0.15 | 0.60 |
| Final pH | 7.00 | 3.00 | 7.00 |
Table 2.
Components of each treatment for the in vitro batch fermentation.
| Treatments | Components | |||
|---|---|---|---|---|
| Fermentation mediuma | 32% (w/v) Fecal slurry | Supernatant from the simulation of human gastrointestinal digestion | Solid Residue from the simulation of human gastrointestinal digestion | |
| Crude polysaccharide LS | 7.5 ml | 2 ml | 350 µl | 0.5 g |
| Crude polysaccharide LP | 7.5 ml | 2 ml | 350 µl | 0.5 g |
| GOS | 7.5 ml | 2 ml | 0.5 g GOS was dissolved in 1.0 ml sterile water and filtered through a 0.2 µm syringe filterb | |
| mConA | 7.5 ml | 2 ml | 0.85 ml Milli-Q water | |
| mConB | 7.5 ml | 2 ml | 350 µl from tubeAc |
0.5 g from tubeAc |
a The fermentation medium composed of 2.0 g yeast extract, 0.02 g K₂HPO₄, 0.005 g CaCl₂, 1.0 g NaHCO₃, 0.05 g NaCl, 1.0 g peptone, 0.005 g MgSO₄, 0.23 g cysteine-HCl, 0.5 g resazurin, 0.01 g hemin, 1.0 mL Tween 80, 0.25 g bile salt, and 5 µL vitamin K1, which is a sugar-free medium, was prepared according to the method of Chen et al. [26]. b GOS was not subjected in simulation of human gastrointestinal digestion.c tubeA is obtained from the step of the simulation of human gastrointestinal digestion.
Table 3.
Yield of crude polysaccharides and the amount of total carbohydrates, reducing sugars, polysaccharides, total protein, and phenolic compound constituted in crude polysaccharides LS and LP (n = 3).
Table 3.
Yield of crude polysaccharides and the amount of total carbohydrates, reducing sugars, polysaccharides, total protein, and phenolic compound constituted in crude polysaccharides LS and LP (n = 3).
| Crude Polysaccharide | Yielda (%) |
Total Carbohydrate (mg/g) |
Reducing Sugar (mg/g) |
Polysaccharide (mg/g) |
Total Protein (mg/g) |
Phenolic compound (mg/g) |
|---|---|---|---|---|---|---|
| LS | 7.68±0.04 | 462.22 ± 28.70 | 83.82±4.32 | 378.41 ± 29.26 | 19.08±3.15 | 34.38±4.53 |
| LP | 9.29±0.03 | 509.74 ± 27.08 | 87.09±3.47 | 422.65 ± 25.84 | 28.46±1.32 | 67.72±2.88 |
The value is expressed as the mean ± S.D. of triplicate experiments.
Disclaimer/Publisher’s Note: The statements, opinions and data contained in all publications are solely those of the individual author(s) and contributor(s) and not of MDPI and/or the editor(s). MDPI and/or the editor(s) disclaim responsibility for any injury to people or property resulting from any ideas, methods, instructions or products referred to in the content. |
© 2025 by the authors. Licensee MDPI, Basel, Switzerland. This article is an open access article distributed under the terms and conditions of the Creative Commons Attribution (CC BY) license (http://creativecommons.org/licenses/by/4.0/).
Copyright: This open access article is published under a Creative Commons CC BY 4.0 license, which permit the free download, distribution, and reuse, provided that the author and preprint are cited in any reuse.


