
Submitted:
10 April 2025
Posted:
10 April 2025
You are already at the latest version
Abstract
Selecting an appropriate business development model is central to strategic decision-making in economic and business management. These models shape sustainable growth, long-term scalability, and strategic flexibility. Existing evaluation methods rely on heuristic or qualitative judgments that lack transparency, reproducibility, and sensitivity to evaluation criteria. To address these limitations, this study introduces a hybrid multi-criteria decision-making (MCDM) framework that integrates VIKOR, entropy weighting, and simulation to evaluate 35 business development models derived from 245 real-world cases. Evaluation covers six strategic criteria: scalability, adaptability, risk exposure, financial sustainability, implementation complexity, and market relevance. Entropy weighting assigns criterion importance based on data variability, and simulation generates input sets for sensitivity and stability analysis. Results highlight Cross-Border Investment, Tiered Access, and Crowd-Backed models as top-performing strategies across multiple dimensions. By combining multiple tools in a unified framework, the research advances MCDM methodology and supports strategic business development planning under uncertainty. This contribution strengthens both academic insight and managerial practice in economics and business management.
Keywords:
business development models
; VIKOR
; multi-criteria decision-making (MCDM)
; entropy weighting
; simulation
; strategic decision-making
; sustainability
1. Introduction
A volatile, interconnected economic environment shaped by shifting geopolitical and regional dynamics makes the selection of an effective business development model essential to securing sustainable development, long-term growth, scalability, and strategic resilience of organizations [1,2]. As Mick et al. (2024) observe, business development strategies that involve digital transformation influence how SMEs expand operations, access new markets, and adapt to dynamic technological, regulatory, and sustainability-related challenges [3]. Unlike business models focused on value creation and delivery, business development models define the structural pathways through which businesses grow, including strategies such as cross-border investment, diversification, platform scaling, and market penetration [4]. In contexts marked by innovation and resource constraints, these models serve as critical levers for strategic differentiation and sustainable performance [5,6].
Strategic decisions involving growth models require businesses to navigate multiple objectives, including financial feasibility, operational complexity, adaptability, and risk mitigation, within dynamic environments [7]. However, traditional evaluation methods, such as case comparisons or executive heuristics, fail to provide transparent, replicable, and criteria-weighted assessments [8]. Liao et al. (2023) argue that these conventional approaches lack coherence and rely on specific contexts, which reduces their utility in comparative evaluation [9]. Similarly, Büyüközkan and Görener (2015) emphasize that qualitative methods lack the rigor required in decision environments defined by uncertainty and multidimensional trade-offs [10].
In response to these methodological shortcomings, researchers have adopted multi-criteria decision-making (MCDM) techniques as a preferred approach [11,12]. Ferreira et al. (2019) demonstrate that MCDM methods such as AHP, TOPSIS, and VIKOR provide a systematic structure for evaluating alternatives based on competing priori-ties [13]. The VIKOR method applies a compromise-ranking logic that balances group utility with individual regret, making it suited for strategic decisions under uncertain-ty [14,15]. Amin et al. (2022) illustrate VIKOR’s strength in sustainability evaluations by integrating entropy-based and fuzzy modeling techniques to improve objectivity and precision in complex decisions [16].
Recent studies have expanded MCDM applications by integrating simulation and fuzzy logic to address unstable or incomplete data. Hoang et al. (2024) applied a hybrid MCDM model to corporate governance, while Khan et al. (2024) combined VIKOR with q-Rung Orthopair fuzzy entropy to evaluate software reliability under uncertainty [17,18]. Francis and Thomas (2023) highlight the value of integrating system dynamics and MCDM to test strategic policy robustness in dynamic conditions [19].
Although MCDM techniques have advanced in recent years, few studies apply them to business development models, and the VIKOR method remains underused in comparative evaluations. Mardani et al. (2015) note that researchers have concentrated MCDM techniques in the domains of sustainability and renewable energy, while giving limited attention to their application in growth-oriented strategic decision-making for business development [20].
Aktaş and Demirel (2021) likewise identify a lack of robust decision tools for selecting business development strategies that balance long-term performance across multiple dimensions [5]. This gap underscores the need for a generalized, data-driven framework that evaluates development models using measurable strategic criteria while addressing uncertainty and input sensitivity.
The study addresses the gap by developing an evaluation framework that integrates the VIKOR method, entropy weighting, and simulation to evaluate 35 business development models drawn from 245 cases across six criteria. Entropy weighting enhances objectivity in assigning the relative importance of each criterion, while simulation generates consistent data sets that support sensitivity and robustness testing [6,18]. Together, these tools provide a structured, quantitative alternative to heuristic and qualitative assessments.
Motivated by the need to support strategic business development planning through reproducible, evidence-based frameworks, this research addresses three core questions: How can decision-makers evaluate and compare diverse business development models across multiple criteria? Which models deliver the most balanced performance across adaptability, scalability, risk exposure, and financial sustainability? And how do variations in input values or decision-maker preferences affect the robustness of model rankings? By addressing these questions, the study advances MCDM method development and supports strategic business development planning in uncertain environments.
Despite increasing interest in strategic growth and sustainability, quantitative research on business development models remains limited in both scope and methodological rigor. This study addresses this gap by identifying a diverse range of empirically grounded development strategies and proposing a hybrid multi-criteria decision-making framework that integrates VIKOR, entropy weighting, and simulation. The proposed framework advances academic research and managerial application by enabling transparent, data-driven evaluation of business development under uncertainty.
2. Literature Review
As the competitive landscape shifts toward greater dynamism and uncertainty, the demand grows for structured, evidence-based tools that support business growth strategies [21,22,23]. To establish a comprehensive theoretical foundation for evaluating business development models within the broader context of strategic decision-making, this research examines existing literature on business development models, multi-criteria decision-making (MCDM) approaches, and simulation-based evaluation methods, aiming to identify conceptual insights, methodological progress, and ongoing challenges in strategic business development research.
2.1. Business Development Models in the Context of Strategic Decision-Making
Business development models refer to structured strategies organizations use to pursue expansion, access new markets, and build long-term competitiveness [24,25,26]. Unlike business models, which define how businesses create and deliver value, business development models focus on how organizations pursue growth through approaches such as cross-border investment, market penetration, industry diversification, crowd-based funding, and tiered access [27,28,29]. These models serve as strategic mechanisms aligned with the business’s resources, risk profile, and growth objectives [30,31].
Cross-border investment enables businesses to mitigate market saturation, access global supply chains, and diversify revenue bases [32,33]. Market penetration strategies rely on aggressive pricing or distribution to increase market share and may function as a precursor to global expansion [34]. Diversification spreads risk across industries or geographies but introduces challenges such as resource fragmentation and operational complexity [35]. Although these strategies hold substantial value, researchers lack a unified framework to compare them. Most studies evaluate individual approaches in isolation, which fragments the field and limits strategic decision-making [36,37,38].
2.2. State of the Art in Strategic Business Development Evaluation
Current research on business development models shows fragmentation, relies on context-specific analyses, and lacks generalizable evaluation frameworks [39,40]. Numerous studies focus on specific domains such as digital transformation [41], internationalization [42], or sustainability strategy [43], yet they fail to propose methods for comparing diverse models across strategic dimensions. Liao et al. (2023) emphasize that much of the decision-making literature remains siloed and methodologically in-consistent, reducing its effectiveness for strategic planning [9].
Scholars acknowledge the need for comparative, data-driven frameworks that assess trade-offs among competing business development models through a structured lens [44]. Arrais-Castro et al. (2018) highlight the challenge of integrating strategies within dynamic, multi-criteria environments [45], while Carayannis and Grigoroudis (2023) advocate for cohesive evaluation models that can guide regional and corporate level decision-making [46]. This need provides a clear rationale for adopting structured decision-support tools that connect theoretical inquiry with practical applications in strategic business development.
2.3. MCDM Approaches in Strategic Model Evaluation
Multi-Criteria Decision-Making (MCDM) methods provide structured approaches for evaluating strategic alternatives under complex and conflicting conditions [11,47]. Techniques such as AHP, TOPSIS, and VIKOR offer a framework to assess trade-offs across competing objectives, including financial return, scalability, adaptability, and risk [48,49].
Among these methods, VIKOR addresses decision problems that involve uncertainty and lack a single dominant alternative [14]. Hybrid models such as the Fermatean fuzzy BWM-VIKOR framework [50] improve precision in ranking sustainability-oriented strategies. Görçün et al. (2024) apply fuzzy MCDM to digital transformation evaluation [51], and Khoshsirat et al. (2024) apply similar tools to prioritize project disruptions under uncertainty [52].
Most studies exclude MCDM from the comparative evaluation of business development models. This gap limits the development of decision-support tools for selecting growth strategies based on measurable performance criteria.
2.4. Simulation and Hybrid Decision Models
One limitation of conventional MCDM applications is their reliance on subjective expert input, which constrains reproducibility and transparency [53]. To address this issue, recent studies advocate integrating MCDM with simulation or machine learning models [54,55]. Simulation enables the modeling of uncertain environments and sup-ports robust sensitivity and scenario analysis, both of which are critical to strategic business development decision-making [56].
Cui et al. (2023) and Saputro et al. (2023) integrate simulation with MCDM to analyze stability and trade-offs in uncertain systems [57,58]. Kabadayi and Dehghani-Mohamadabadi (2022) apply hybrid simulation–MCDM tools to evaluate supplier decision-making in logistics [59]. These approaches demonstrate that integrating simulation with MCDM enhances objectivity, adaptability, and robustness, aligning with the evolving demands of business development strategy evaluation.
2.5. Research Gap and Contribution
This study advances the literature by proposing a simulation-based VIKOR framework to evaluate 35 business development models, derived from 245 cases, using six strategic criteria. Unlike prior studies that rely on qualitative or case-based methods, this model offers a quantitative, replicable, and scalable evaluation tool grounded in decision science.
The research responds to calls for integrated, data-driven approaches that capture trade-offs among strategic alternatives in business development [9,46]. It incorporates simulation to manage input variability, applies entropy weighting to improve objectivity, and validates outcomes through robustness and sensitivity analysis. Bridging fragmented strategic literature and the need for decision-ready tools, the study introduces an evidence-based framework for business development planning. This contribution supports both academic inquiry and managerial decision-making in sustainability-oriented business environments.
3. Materials and Methods
This study applies the VIKOR multi-criteria decision-making (MCDM) method to evaluate 35 business development models, incorporating data collection, weight assignment, normalization, sensitivity, and robustness analysis to ensure consistency and transparency.
3.1. Research Design and Approach
This research adopts a quantitative design and applies the VIKOR method to evaluate 35 business development models against predefined strategic criteria. A comparative decision analysis evaluates trade-offs across real-world business development strategies to identify the most balanced model.
Grounded in established MCDM frameworks, the study employs a deductive de-sign to ensure objectivity in evaluation. To strengthen the reliability of the findings, sensitivity analysis examines changes in weight assignments, while robustness analysis assesses consistency under variations in decision-makers’ preferences, thereby enhancing practical relevance.
3.2. Multi-Criteria Decision-Making (MCDM) Model Selection
This study selects VIKOR as the primary MCDM method for its effectiveness in resolving business development decisions with conflicting criteria. Unlike methods that identify a single optimal solution, VIKOR emphasizes compromise solutions, making it suitable for business development models requiring trade-offs.
Business development models differ in market growth potential, competitive ad-vantage, financial investment requirements, and risk levels. Decision-makers struggle to choose from high-risk, high-reward strategies (e.g., Competitive Disruption) and low-risk, steady-growth models (e.g., Franchising). VIKOR provides a structured framework, allowing decision-makers to navigate strategic trade-offs when no single ‘best’ model exists.
Moreover, VIKOR considers both individual criterion performance and overall regret measures, making it appropriate for businesses seeking a flexible yet structured decision-making strategy [14]. Unlike TOPSIS and AHP, which focus on rank ordering, or ELECTRE, which requires intensive computation, VIKOR emphasizes compromise solutions suited to complex strategic trade-offs [60].
VIKOR applies to various industries, including technology, retail, and manufacturing. Businesses evaluating market expansion strategies, partnerships, or disruptive business development models can leverage VIKOR to assess multiple growth pathways and allocate financial resources strategically.
By employing VIKOR, this study establishes a replicable evaluation model that aligns business development strategies with data-driven decision-making principles.
3.3. Data Collection Process
The researchers designed this study using a comprehensive review of 245 re-al-world business development cases, collected from 15 reputable academic publishers and business case collections, including EBSCOhost, Elsevier ScienceDirect, Emerald Insight, Harvard Business Publishing, IMD Case Collection, Ivey Publishing, MDPI, MIT Sloan LearingEdge, ProQuest, SAGE Business Cases, SpringerLink, Stanford GSB Case Studies, Taylor & Francis Online, The Case Centre, and Wiley Online Library.
The case selection followed five key criteria:
- Business Development Focus: Each case highlights business expansion, partner-ships, market entry, business growth, or innovation-driven scaling;
- Strategic Decision-Making: The cases involve complex business development decisions, including competitive positioning, financial feasibility, scalability, and risk management;
- Diverse Business Development Models: Ensures a broad mix of models, covering various growth strategies across industries;
- Industry Relevance: Prioritizes cases offering cross-industry insights or broader applications beyond a single sector;
- Timeliness and Impact: Preference for recent cases (last 10–15 years) while retaining older cases with long-lasting strategic relevance.
This study compiles case data from public databases. To maintain clarity across a large and diverse case set, the main text excludes individual source links. Supplementary information provides a categorized summary for reference.
3.4. Business Development Models Identification
To identify business development models, the researchers reviewed 320 cases and selected 245 from 201 businesses. The analysis organizes these into eight categories encompassing 35 distinct models, which fall into the following thematic areas:
- Market Expansion and Competitive Strategy: Disruptive Innovation, Market Expansion, New Market Creation (Blue Ocean Strategy), Targeted Differentiation, Cross-Border Investment;
- Business Ownership and Structural Realignment: Business Spin-Off, Joint Venture, Business Holding, Industry Diversification;
- Acquisition and Integration Strategies: Industry Consolidation, Vertical Integra-tion, Industry Aggregation, Mergers & Acquisitions;
- Strategic Partnerships and Licensing: Strategic Partnership, Intellectual Property Licensing, Private Label;
- Digital Transformation and AI-Driven Growth: Digital Transformation, Platform Ecosystem, Network-Effect, Data Monetization;
- Recurring Revenue, Customer Engagement, and Value-Based Pricing Strategies: Recurring Revenue, Tiered Access, Customer Engagement;
- On-Demand Services and Sharing Economy: On-Demand Services, Peer-to-Peer (Collaborative Consumption);
- Financial Innovation and Alternative Monetization: Crowd-Backed, Business Venture, Lean Growth, Aggregator, Market Penetration, Independent Contractor, Intelligence-Powered, Mission-Driven, Cross-Service Bundling, Franchise Scaling.
3.5. Selection of Decision Criteria
This study evaluates business development models using six key decision criteria, derived from a review of research on business strategy, competitive advantage, and business development:
3.6. Simulation-Based Evaluation and Justification
This study adopts a simulation-based approach to construct the decision matrix, aiming to ensure objectivity and methodological consistency in evaluating business development models. Simulation minimizes reliance on subjective expert judgment and establishes a replicable foundation for multi-criteria decision-making. The simulation process employs the NumPy library in Python to generate data that represent performance scores for 35 business development models across six strategic evaluation criteria. Alignment with practices in decision sciences reinforces the framework’s relevance in contexts defined by uncertainty and limited empirical input.
Simulation assigns each criterion a continuous score ranging from 40 to 100, using a consistent scale applied to all alternatives. This range supports direct comparison across criteria. A uniform distribution generates the scores, treating all values in the range as having the same likelihood and preserving distributional neutrality. Although this approach excludes skewed patterns found in empirical data, it provides a con-trolled baseline that supports consistent comparison of model performance without introducing bias.
Integrating simulation with the VIKOR method enables systematic analysis of ranking stability under varying input conditions. The framework supports sensitivity analysis and robustness testing, both essential for assessing the consistency of model rankings across decision-making scenarios. This design enhances the framework’s generalizability across business development contexts and ensures transparency for reproducibility and academic engagement.
Acknowledging the limitations of this simulation approach is essential. The framework assumes independence among evaluation criteria and excludes potential interrelationships, such as the association linking market growth potential and risk exposure. This assumption improves analytical clarity but limits the accuracy of rep-resenting complex business environments. Future research may strengthen the frame-work by incorporating empirical data, applying correlated data structures, or selecting alternative distributions that reflect contextual specificity.
4. Quantitative Evaluation and Model Ranking
Selecting an optimal business development model is a critical decision that re-quires a systematic and data-driven approach. This chapter presents a practical evaluation framework designed to support practitioners in making informed decisions using multi-criteria decision-making (MCDM) techniques. To ensure an objective assessment and minimize bias, the study normalizes data and applies the Entropy Weighting Method, strengthening the evaluation process. The VIKOR method ranks business development models by balancing overall performance (utility) and risk (regret measure), delivering a comprehensive assessment. This structured approach pro-vides a clear, data-backed decision tool, enabling businesses to navigate trade-offs, optimize strategies, and make smarter choices for sustainable growth.
4.1. Modeling of Business Development Matrix
To ensure the evaluation of the Business Development Model reflects real-world scenarios, we use NumPy (Numerical Python), a Python-based numerical computing library, to generate simulation data. NumPy facilitates efficient array operations, random number generation, and mathematical modeling, making it a popular tool in data science, machine learning, and decision-making models [81,82,83,84].
NumPy-based simulation data finds broad application in multi-criteria decision-making (MCDM) by reducing dependence on expert judgment and ensuring un-biased initial conditions. Since business development model evaluating requires an objective analysis free from subjective deviations, NumPy-generated simulation data follows a logical commercial distribution, preventing unrealistic randomness. This approach enhances repeatability, aligns with scientific decision-making principles, and strengthens research credibility by reducing human-induced errors.
Figure 1 illustrates the process of generating raw simulation data using NumPy.
This flowchart outlines a structured process for evaluating business development models using simulation data. The evaluation begins with defining the decision matrix and criteria, followed by assigning logical value ranges. To introduce variability, the process uses NumPy, a numerical computing library, to generate structured simulation data for each criterion. Next, it organizes data as an array for calculations and structures it as a table to simplify analysis.
To prevent extreme outliers and maintain a balanced evaluation, the process con-strains the data range to 40-100. This range eliminates extreme low scores while pre-serving meaningful differentiation among business development models. It aligns with real-world business evaluation scoring systems, minimizing outliers’ impact and ensuring fair weight distribution. The structured range enhances interpretability, simplifies decision-making, and provides a practical framework for effective comparisons.
Finally, the process creates and stores a decision matrix for extended evaluation, enabling data-driven decision-making. Table 2 presents the decision matrix with the original simulated data, maintaining its raw form without modifications.
4.2. Calculation of Entropy Weights
Using the original simulation data, the process calculates entropy weights to ensure a fair and data-driven determination of each criterion’s importance in the multi-criteria decision-making process. Unlike subjective weight distribution, entropy weighting analyzes the inherent information within the data, assigning higher weights to criteria with greater variability and information content, while those with lower variability exert a smaller influence on the decision-making process. This approach eliminates subjectivity, strengthens the representation of each criterion’s significance, and enhances decision-making accuracy.
4.2.1. Normalization
Before calculating entropy weights, the original data of decision matrix must be normalized to ensure that all criteria are measured on the same scale. This is necessary because:
- Different criteria may use different units (e.g., revenue in dollars, customer satisfaction in percentages), making direct comparisons challenging;
- Some criteria have much larger numerical values than others, which could unfairly skew the results;
- Entropy calculations depend on probability distributions, so values must be scaled between 0 and 1 for meaningful results.
To ensure fair comparisons, we apply min-max normalization, which transforms the values while preserving their relative differences. The normalized value for each business development model () is calculated using the following formula:
where:
= Normalized value of criterion j for business development model i
= Original value in the decision matrix
=Maximum value for criterion j
=Minimum value for criterion j
This normalization process standardizes all criteria on a scale from 0 to 1, pre-venting any single criterion from dominating the ranking.
4.2.2. Compute Entropy for Each Criterion
After obtaining the normalized matrix, the calculation determines the Entropy () for each criterion.
where
4.2.3. Compute the Entropy Weight for Each Criterion
The entropy weight for each criterion is given by:
where:
The denominator ensures that all weights sum up to 1.
Table 3 presents the calculated entropy values and corresponding weights.
4.3. Calculation of Model Rankings and VIKOR Values
Using the entropy weights, we can calculate (utility measure), (regret measure), and (VIKOR index) for each business development model. The process follows these steps:
4.3.1. Compute the Utility and Regret Measures
where represents the weight of criterion j, and and represent the best and worst performance values for criterion j, respectively.
4.3.2. Calculate the VIKOR Index ()
In the VIKOR method, setting v = 0.5 balances the trade-off among maximum group utility (S), individual regret (R), and overall decision fairness. A higher v would favor collective benefit, while a lower v would emphasize worst-case avoidance, making 0.5 a neutral and fair compromise when no strong preference exists. Researchers adopt this value in multi-criteria decision-making studies, providing a stable and practical approach for ranking alternatives.
4.3.3. Ranking Business Development Models
The ranking of business development models relies on their values, where the lowest indicates the best compromise solution.
Table 4 display the calculated results and rankings.
5. Findings & Discussion
To assess the reliability of the business development matrix ranking, this research conducts sensitivity and robustness analyses along with a detailed discussion of the research findings.
5.1. Sensitivity Analysis
Since the v parameter in the VIKOR method reflects the decision maker’s preference for either collective benefit or individual regret, a higher v value indicates greater emphasis on maximum group utility (S), and a lower v value indicates stronger focus on minimum individual regret (R). A v value of 0.5 reflects equal importance for group utility (S) and individual regret (R). To test model sensitivity to decision-maker preferences, we varied v from 0.1 to 0.9.
As shown in Figure 2, the VIKOR Sensitivity Analysis examines how the ranking of different business development models fluctuates as the v parameter changes. The results indicate that models with top rankings at v = 0.5 maintain strong performance across most v values, suggesting ranking stability. Cross-Border Investment consistently achieves the lowest score, making it the most favorable choice under a bal-anced decision-making approach (v = 0.5). In contrast, models like Crowd-Backed and Recurring Revenue experience greater ranking fluctuations, indicating sensitivity to the v parameter. When v is low (v = 0.1), which prioritizes overall utility (), models such as Crowd-Backed and Recurring Revenue perform better. However, as v increases (v = 0.7 to 0.9), favoring regret minimization (), models such as Tiered Access and Data Monetization improve in ranking. This variation highlights the importance of trade-offs in multi-criteria decision-making. Models with minimal fluctuations across v values, such as Cross-Border Investment and Tiered Access, demonstrate ro-bust decision-making potential. In contrast, BD Models with significant shifts indi-cate that their ranking is contingent on decision-maker preferences. These findings emphasize the necessity of sensitivity analysis in VIKOR-based decision frameworks to ensure reliable and contextually appropriate model selection.
The sensitivity analysis results show how changes in the VIKOR trade-off parameter (v) affect business development model rankings. While some models, such as Cross-Border Investment and Tiered Access, maintain stable rankings across different v values, others show fluctuations, indicating stronger dependence on decision-maker preferences. However, sensitivity analysis alone fails to capture uncertainties within the decision matrix that may arise from input variation, measurement inconsistency, or business volatility. To strengthen the evaluation of ranking reliability, the next section introduces a robustness analysis. This analysis examines how small changes in the decision matrix influence model rankings, ensuring that the final recommendations remain valid under real-world uncertainty.
5.2. Robustness Analysis
Robustness analysis evaluates the stability of VIKOR rankings when small perturbations are introduced into the decision matrix. To simulate real-world uncertain-ties, this study applies a ±5% variation to the utility measure () and regret measure (). Cross-Border Investment and Tiered Access show minimal changes in (−0.0153 and −0.0301), retaining their original rankings and demonstrating strong robustness. These models remain optimal choices despite minor variations in evaluation criteria. In contrast, Data Monetization exhibits a greater shift (−0.0617), resulting in a drop from fifth to sixth place and indicating lower stability under uncertain conditions. Re-curring Revenue and Crowd-Backed models display moderate sensitivity— values vary slightly, though rankings are unaffected. The results affirm that robust models offer more dependable decision-making potential, while sensitive ones may require closer scrutiny. For risk mitigation and strategic resilience, decision-makers should prioritize models with proven robustness. Ultimately, this analysis reinforces the role of robustness testing in validating VIKOR-based rankings and enhancing the credibil-ity of multi-criteria decision-making in dynamic business contexts.
Figure 3 illustrates the variations in VIKOR’s robustness analysis under different scenarios.
5.3. Findings
This study applies the VIKOR method and Entropy Weighting to evaluate business development models, providing a data-driven foundation for strategic decision-making. The results identify Cross-Border Investment (Q = 0.0481), Tiered Access (Q = 0.0684), and Crowd-Backed (Q = 0.2710) as the top-performing models, demonstrating strong scalability, financial efficiency, and competitive advantage. Cross-Border Investment ranks highest due to its ability to mitigate market saturation risks, access new consumer bases, and diversify revenue streams, making it an ideal strategic choice for businesses seeking global expansion and portfolio diversification. Tiered Access models, commonly used in digital platforms and SaaS businesses, enable structured monetization through customer segmentation, ensuring long-term profitability while maintaining flexibility. Crowd-Backed business development models, which rely on community-driven funding and decentralized investment mechanisms, offer an alternative financial strategy that reduces upfront capital risks, making them attractive for startups and innovation-driven businesses.
The middle-ranked models, including New Market Creation (Q = 0.4278), Target-ed Differentiation (Q = 0.4362), Market Penetration (Q = 0.4562), Lean Growth (Q = 0.4959), and Industry Consolidation (Q = 0.5239), present viable strategic choices de-pending on the business context. New Market Creation offers disruptive potential but requires significant investment and market education, making it suitable for business-es willing to take high risks in exchange for long-term innovation-driven rewards. Targeted Differentiation allows businesses to develop niche competitive advantages, but a small market limits scalability. Market Penetration, emphasizing pricing strategies and aggressive expansion, is effective in markets with intense competition but demands high capital investment in marketing and distribution. Lean Growth, which favors gradual and resource-efficient expansion, is ideal for businesses with con-strained financial resources but strong organic growth potential. Industry Consolidation, based on mergers and acquisitions, suits businesses with sufficient capital and capability to achieve effective integration of acquired entities.
The lowest-ranked models reveal strategic vulnerabilities that demand close evaluation. Market Expansion (Q = 0.9387), Independent Contractor (Q = 0.9521), In-dustry Diversification (Q = 0.8776), Customer Engagement (Q = 0.8555), and Peer-to-Peer (Q = 0.8522) face challenges in financial sustainability, operational complexity, and external dependence. Expansion into new markets fails in many cases due to regulatory barriers, strong competition, and cultural misalignment, making this approach unsuitable for businesses lacking robust entry strategies. Contractor-based models, reliant on gig workers and freelance structures, face scalability limits caused by labor fluctuations and shifting employment laws. Diversification across industries, though intended to spread risk, can lead to overextension and inefficiencies, with greater impact on businesses lacking domain expertise. Engagement-focused strategies, while valuable for building loyalty, struggle to convert user interaction into stable revenue, resulting in substantial resource demands and limited financial return. Peer-to-Peer systems, despite leveraging network effects, encounter trust issues, legal restrictions, and monetization challenges that constrain long-term viability.
These findings establish a clear ranking of business development models, providing a strategic decision-making framework for businesses seeking to align their expansion strategies with market conditions, financial goals, and risk tolerance. However, quantitative rankings alone are insufficient for determining the most effective business development model. The next section explores the strategic implications of these rankings, offering guidance on how decision-makers can align model selection with business objectives and industry conditions.
5.4. Discussion
Research findings emphasize the critical role of strategic choice in selecting an optimal business development model. By integrating Entropy Weighting, the VIKOR method offers a structured framework for assessing trade-offs across utility (S) and regret (R), enabling businesses to evaluate models based on strategic alignment with goals, market position, and risk tolerance.
5.4.1. Application Potential of the Top-Ranked Models
The top-ranked models—Cross-Border Investment, Tiered Access, and Crowd-Backed—offer strategic advantages for businesses pursuing scalability, financial sustainability, and adaptability in dynamic markets. Cross-Border Investment supports international expansion and reduces market saturation risk, with strong applicability in industries shaped by trade liberalization and supply chain diversification. Tiered Access, common in subscription-based services and digital platforms, enables structured pricing that improves customer lifetime value and revenue stability. Crowd-Backed models provide a flexible, low-risk funding path suited to startups, social enterprises, and innovation-driven businesses lacking access to traditional capital.
5.4.2. Balanced Trade-Offs in the Middle-Ranked Models
The middle-ranked models offer flexible alternatives, though their suitability de-pends on business context and strategic priorities. New Market Creation and Market Penetration serve businesses prepared to pursue high-risk, high-reward strategies but demand robust market research, product differentiation, and significant marketing investment. Targeted Differentiation, while beneficial for brand positioning, offers limited scalability without support from continuous innovation or premium pricing. Industry Consolidation and Lean Growth provide viable paths for businesses focused on operational efficiency, cost control, or steady expansion, but both require sound financial and managerial planning to ensure long-term integration and sustained ad-vantage.
5.4.3. Strategic Challenges of the Lowest-Ranked Models
The lowest-ranked models carry significant strategic risks, and businesses tend to avoid these options unless specific conditions justify their adoption. Market Expansion and Industry Diversification, though appealing in theory, demand extensive strategic foresight, regulatory adaptation, and substantial capital reserves. Independent Con-tractor and Peer-to-Peer models encounter systemic challenges related to labor laws, trust barriers, and monetization uncertainty, making them risky choices for businesses without a strong technological or operational foundation. Businesses considering these models must establish contingency plans and evaluate whether their internal structure can absorb the associated risks.
5.4.4. Guidance for Decision-Makers
Decision-makers may apply the VIKOR-based ranking results as a structured tool to evaluate how available business development models align with organizational objectives. Rather than identifying a single optimal solution, the framework emphasizes trade-offs across strategic dimensions and guides the selection of adaptability, scalability, or financial sustainability based on organizational needs.
Businesses pursuing international expansion may find Cross Border Investment and Market Penetration suitable for accessing external markets and generating diversified revenue streams. These models demand significant capital, institutional navigation, and operational capacity. Digital and knowledge-intensive sectors tend to adopt Tiered Access or Recurring Revenue models, which support revenue stability and scalable growth with limited incremental cost.
Innovation-driven businesses operating under volatile market conditions adopt New Market Creation or Targeted Differentiation strategies to circumvent direct competition and influence consumer preferences. In contrast, entities with greater risk sensitivity pursue Lean Growth or Industry Consolidation models, emphasizing process control, cost efficiency, and structural integration within established value chains.
Effective model selection requires decision-makers to assess internal capabilities, external constraints, and long-term sustainability objectives. The proposed framework supplements evaluative judgment by offering a transparent, structured, and reproducible tool for comparing complex alternatives under uncertain conditions. Strategic alignment depends on sector dynamics, resource availability, and institutional context.
5.4.5. Summary
By integrating quantitative analysis with strategic decision-making principles, this study presents a data-driven yet adaptable framework for selecting an optimal business development model. The VIKOR-based ranking offers a structured approach to evaluate trade-offs and identify models that align with business goals, market conditions, and long-term sustainability. Future research should explore how external factors such as technological disruption, market volatility, and consumer behavior shifts influence the effectiveness of these business development models.
5.5. Limitations
Although VIKOR serves as a structured tool for evaluating business development models, it carries methodological constraints that affect its application across contexts. Real-world complexity, interdependencies among variables, and sensitivity to weight allocation influence the accuracy and relevance of its outcomes. These limitations support balanced interpretation by both researchers and practitioners.
- Limited Representation of Real-World Complexity
Simulated data depends on defined assumptions and controlled distributions, which may misrepresent actual market dynamics, industry shifts, and business performance. Fixed value ranges and preset distribution types reduce the model’s ability to reflect volatile or nonlinear conditions.
- Neglect of Interdependencies Among Business Factors
Variables such as market growth, competitive advantage, and scalability influence one another in practice. The simulation process, however, treats them as independent inputs. This assumption creates artificial data patterns that may fail to capture the complexity of real business systems.
- Exclusion of External and Contextual Variables
Businesses operate within changing environments shaped by regulation, technology, macroeconomic cycles, and customer behavior. The simulation framework excludes these influences and overlooks qualitative factors such as brand equity and strategic leadership, which shape business outcomes alongside financial metrics.
- Sensitivity to Weight Allocation
VIKOR rankings shift with changes in criteria weights. Inaccurate or unsupported weight assignments can produce inconsistent or misleading results. Data limitations and unclear expert consensus create challenges due to the sensitivity of weight allocation.
- Assumption of Balanced Performance as Ideal
VIKOR prioritizes compromise solutions, assuming that balanced performance reflects optimality. However, strategic priorities vary. A tech venture may favor rapid scalability, while a financial institution may emphasize risk control. As a result, the highest-ranking model may conflict with sector-specific preferences.
- Static Criteria in Dynamic Environments
The model applies fixed evaluation criteria, yet business environments evolve. Emerging technologies, shifting market demands, and evolving consumer behavior alter the relevance of criteria over time. Without adaptive mechanisms, rankings may lose validity under changing conditions.
- Challenges Difficulty Quantifying Qualitative Factors
Elements such as brand trust, leadership vision, and organizational culture influence business development but resist quantification. Translating these factors into numerical values risks oversimplification and may exclude critical dimensions of strategic evaluation.
Despite the identified limitations, simulation modeling offers a systematic foundation for evaluating complexity and uncertainty in business environments. This study advances business development methodology and broadens VIKOR’s relevance in strategic decision-making.
6. Conclusions
This study proposes a structured, simulation-based evaluation framework to sup-port strategic decision making in the selection of business development models under conditions of uncertainty. By integrating the VIKOR method, entropy weighting, and simulation, the framework offers a reproducible and transparent tool that addresses limitations of traditional heuristic and qualitative assessments. The study evaluates 35 business development models derived from 245 real world cases, using six strategic criteria grounded in established literature: market growth potential, competitive ad-vantage, financial investment requirement, operational complexity, scalability, and risk level.
Although the study employs simulated data to construct the decision matrix, it derives the business development models from real world cases and selects evaluation criteria based on standards from the strategic management literature. This approach ensures both empirical relevance and methodological rigor. Integrating simulation enhances objectivity in assessment, facilitates sensitivity and robustness testing, and provides a consistent basis for comparative evaluation. These design choices reinforce the transparency and replicability of the proposed decision-making framework through their combined methodological function.
The findings highlight Cross Border Investment, Tiered Access, and Crowd Backed business development models as the most favorable under the VIKOR based ranking. These models offer a strong balance of scalability, financial sustainability, and adaptability. Sensitivity and robustness analyses confirm the stability of these top-ranking models under variable input conditions and decision maker preferences, adding empirical support to the framework’s reliability. The results provide decision makers with a clear, data driven foundation for selecting business development strategies aligned with organizational goals and external environments.
This research extends the application of multi criteria decision making techniques to business development strategy and addresses a domain that has received limited methodological attention. The framework provides practitioners with a practical tool for evaluating strategic alternatives in complex and sustainability driven contexts. Future research may expand the framework to sector specific applications, incorporate real time or corporate level data, or integrate emerging artificial intelligence-based tools to strengthen decision support.
Advancing a data informed and structured approach to evaluating business development models, the framework delivers insights for researchers and practitioners focused on long term strategic growth.
Supplementary Materials
The following supporting information can be downloaded at the website of this paper posted on Preprints.org.
Author Contributions
The author confirms sole responsibility for all aspects of the manuscript. Conceptualization, methodology, formal analysis, investigation, data curation, original draft writing, review and editing, visualization, and project administration were all completed by the author.
Funding
This research received no external funding.
Institutional Review Board Statement
Not applicable.
Informed Consent Statement
Not applicable.
Data Availability Statement
The original contributions presented in this study are included in the article/supplementary material. Further inquiries can be directed to the corresponding author.
Acknowledgments
The author thanks the organizations and platforms that provided access to the case materials used in this study.
Conflicts of Interest
The author declares no conflict of interest.
Abbreviations
The following abbreviations are used in this manuscript:
| VIKOR | VlseKriterijumska Optimizacija I Kompromisno Resenje; This is a Serbian phrase, which translates to: “Multicriteria Optimization and Compromise Solution” |
| MCDM | multi-criteria decision-making |
| NumPy | Numerical Python |
| AHP | Analytic Hierarchy Process |
| TOPSIS | Technique for Order Preference by Similarity to Ideal Solution |
| ELECTRE | Elimination and Choice Expressing Reality |
References
- Moore, S. B., & Manring, S. L. Strategy development in small and medium sized enterprises for sustainability and increased value creation. J. Clean. Prod. 2009, 17, 276-282. [CrossRef]
- Mirzaee, H., & Ashtab, S. Sustainability, Resiliency, and Artificial Intelligence in Supplier Selection: A Triple-Themed Review. Sustainability 2024, 16, 8325. [CrossRef]
- Mick, M. M. A. P., Kovaleski, J. L., & Chiroli, D. M. D. G. Sustainable Digital Transformation Roadmaps for SMEs: A Systematic Literature Review. Sustainability 2024, 16, 8551. [CrossRef]
- Venzin, M. Building an international financial services firm: how successful firms design and execute cross-border strategies. Oxford University Press: Oxford, England, 2009.
- Aktaş, N., & Demirel, N. A hybrid framework for evaluating corporate sustainability using multi-criteria decision making. Environ. Dev. Sustain. 2021, 23, 15591-15618. [CrossRef]
- Wang, C. N., Nguyen, N. A. T., Dang, T. T., & Lu, C. M. A compromised decision-making approach to third-party logistics selection in sustainable supply chain using fuzzy AHP and fuzzy VIKOR methods. Maths. 2021, 9.8: 886. [CrossRef]
- Nair, A., Rustambekov, E., McShane, M., & Fainshmidt, S. Enterprise risk management as a dynamic capability: A test of its effectiveness during a crisis. Manag. Decis. Econ. 2014, 35, 555-566. [CrossRef]
- Talero-Sarmiento, L., Gonzalez-Capdevila, M., Granollers, A., Lamos-Diaz, H., & Pistili-Rodrigues, K. Towards a Refined Heuristic Evaluation: Incorporating Hierarchical Analysis for Weighted Usability Assessment. Big Data Cogn. Comput. 2024, 8, 69. [CrossRef]
- Liao, H., He, Y., Wu, X., Wu, Z., & Bausys, R. Reimagining multi-criterion decision making by data-driven methods based on machine learning: A literature review. Inf. Fusion 2023, 100, 101970. [CrossRef]
- Büyüközkan, G., & Görener, A. Evaluation of product development partners using an integrated AHP-VIKOR model. Kybernetes 2015, 44, 220-237. [CrossRef]
- Kaya, İ., Çolak, M., & Terzi, F. Use of MCDM techniques for energy policy and decision-making problems: A review. Int. J. Energy Res. 2018, 42, 2344-2372. [CrossRef]
- Zakeri, S. M. H., Tabatabaee, S., Ismail, S., Mahdiyar, A., & Wahab, M. H. Developing an MCDM model for the benefits, opportunities, costs and risks of BIM adoption. Sustainability 2023, 15, 4035. [CrossRef]
- Ferreira, F. A., Ilander, G. O. P. B., & Ferreira, J. J. MCDM/A in practice: methodological developments and real-world applications. Manag. Decis. 2019, 57, 295-299. [CrossRef]
- Opricovic, S., & Tzeng, G. H. Compromise solution by MCDM methods: A comparative analysis of VIKOR and TOPSIS. Eur. J. Oper. Res. 2004, 156, 445-455. [CrossRef]
- Phochanikorn, P., & Tan, C. A new extension to a multi-criteria decision-making model for sustainable supplier selection under an intuitionistic fuzzy environment. Sustainability 2019, 11, 5413. [CrossRef]
- Amin, F. U., Dong, Q. L., Grzybowska, K., Ahmed, Z., & Yan, B. R. A novel fuzzy-based VIKOR–CRITIC soft computing method for evaluation of sustainable supply chain risk management. Sustainability 2022, 14, 2827. [CrossRef]
- Hoang, P. D., Nguyen, L. T., Tran, B. Q., & Ta, D. T. Corporate governance for sustainable development in Vietnam: Criteria for SOEs based on MCDM approach. PLoS ONE 2024, 19, e0302306. [CrossRef]
- Khan, F. M., Munir, A., Albaity, M., Nadeem, M., & Mahmood, T. (2024). Software Reliability Growth Model Selection by using VIKOR Method Based on q-Rung Orthopair Fuzzy Entropy and Divergence Measures. IEEE Access 2024, 12, 86572-86582. [CrossRef]
- Francis, A., & Thomas, A. (2023). System dynamics modelling coupled with multi-criteria decision-making (MCDM) for sustainability-related policy analysis and decision-making in the built environment. Smart Sustain. Built Environ. 2023, 12, 534-564. [CrossRef]
- Mardani, A., Jusoh, A., Zavadskas, E. K., Cavallaro, F., & Khalifah, Z. Sustainable and renewable energy: An overview of the application of multiple criteria decision making techniques and approaches. Sustainability 2015, 7, 13947-13984. [CrossRef]
- Rousseau, D. M. Making evidence-based organizational decisions in an uncertain world. Organ. Dyn. 2018, 47, 135-146. [CrossRef]
- Schneckenberg, D., Velamuri, V. K., Comberg, C., & Spieth, P. Business model innovation and decision making: uncovering mechanisms for coping with uncertainty. R D Manag. 2017, 47, 404-419. [CrossRef]
- Barends, E., & Rousseau, D. M. Evidence-based management: How to use evidence to make better organizational decisions. Kogan Page Publishers: London, U. K., 2018.
- Bröring, S., & Herzog, P. Organising new business development: open innovation at Degussa. Eur. J. Innov. Manag. 2008, 11, 330-348(19). [CrossRef]
- Achtenhagen, L., Ekberg, S., & Melander, A. Fostering growth through business development: Core activities and challenges for micro-firm entrepreneurs. J. Manag. Organ. 2017, 23, 167-185. [CrossRef]
- Wei, Y. M., & Lin, H. M. Scrutinizing Business Development Research: Dynamic Retrospective Analysis and Conceptual Evolution. Adm. Sci. 2024, 14, 81. [CrossRef]
- Shimizu, K., Hitt, M. A., Vaidyanath, D., & Pisano, V. Theoretical foundations of cross-border mergers and acquisitions: A review of current research and recommendations for the future. J. Int. Manag. 2004, 10, 307-353. [CrossRef]
- Kling, G., Ghobadian, A., Hitt, M. A., Weitzel, U., & O’Regan, N. The effects of cross-border and cross-industry mergers and acquisitions on home-region and global multinational enterprises. Br. J. Manag. 2014, 25, S116-S132. [CrossRef]
- Kurowska-Pysz, J. Opportunities for cross-border entrepreneurship development in a cluster model exemplified by the Polish–Czech border region. Sustainability 2016, 8, 230. [CrossRef]
- Davis, C. H., & Sun, E. Business development capabilities in information technology SMEs in a regional economy: An exploratory study. J. Technol. Transf. 2006, 31, 145-161. [CrossRef]
- Wei, Y. M., & Lin, H. M. Revisiting business development: a review, reconceptualization, and proposed framework. Cogent Bus. Manag. 2024, 11, 2351475. [CrossRef]
- Boateng, A., Qian, W., & Tianle, Y. Cross-border M&As by Chinese firms: An analysis of strategic motives and performance. Thunderbird Int. Bus. Rev. 2008, 50, 259-270. [CrossRef]
- Deng, P., & Yang, M. Cross-border mergers and acquisitions by emerging market firms: A comparative investigation. Int. Bus. Rev. 2015, 24, 157-172. [CrossRef]
- Meyer, K. E., & Tran, Y. T. T. Market penetration and acquisition strategies for emerging economies. Long Range Plan. 2006, 39, 177-197. [CrossRef]
- Luo, Y., & Tung, R. L. International expansion of emerging market enterprises: A springboard perspective. J. Int. Bus. Stud. 2007, 38, 481-498. [CrossRef]
- Nag, R., Hambrick, D. C., & Chen, M. J. What is strategic management, really? Inductive derivation of a consensus definition of the field. Strateg. Manag. J. 2007, 28, 935-955. [CrossRef]
- Ronda-Pupo, G. A., & Guerras-Martin, L. Á. Dynamics of the evolution of the strategy concept 1962–2008: a co-word analysis. Strateg. Manag. J. 2012, 33, 162-188. [CrossRef]
- Durand, R., Grant, R. M., & Madsen, T. L. The expanding domain of strategic management research and the quest for integration. Strateg. Manag. J. 2017, 38, 4-16. [CrossRef]
- Chen, V. Z., & Hitt, M. A. Knowledge synthesis for scientific management: Practical integration for complexity versus scientific fragmentation for simplicity. J. Manag. Inq. 2021, 30, 177-192.
- Welch, C., Paavilainen-Mäntymäki, E., Piekkari, R., & Plakoyiannaki, E. Reconciling theory and context: How the case study can set a new agenda for international business research. J. Int. Bus. Stud. 2022, 53, 4-26. [CrossRef]
- Liu, H., & Jung, J. S. Impact of Digital Transformation on ESG Management and Corporate Performance: Focusing on the Empirical Comparison between Korea and China. Sustainability 2024, 16, 2817. [CrossRef]
- Ratten, V., Ramadani, V., Dana, L. P., Hoy, F., & Ferreira, J. Family entrepreneurship and internationalization strategies. Rev. Int. Bus. Strategy 2017, 27, 150-160. [CrossRef]
- Sadic, S., Demir, E., & Crispim, J. Towards a connected world: Collaborative networks as a tool to accomplish the SDGs. J. Clean. Prod. 2024, 142726. [CrossRef]
- Onari, M. A., Rezaee, M. J., Saberi, M., & Nobile, M. S. An explainable data-driven decision support framework for strategic customer development. Knowl.-Based Syst. 2024, 295, 111761. [CrossRef]
- Arrais-Castro, A., Varela, M. L. R., Putnik, G. D., Ribeiro, R. A., Machado, J., & Ferreira, L. Collaborative framework for virtual organisation synthesis based on a dynamic multi-criteria decision model. Int. J. Comput. Integr. Manuf. 2018, 31, 857-868. [CrossRef]
- Carayannis, E. G., & Grigoroudis, E. Toward a new impact assessment approach of smart specialization strategies using multiple criteria decision analysis. IEEE Trans. Eng. Manag. 2023, 71, 8795-8808. [CrossRef]
- Zavadskas, E. K., & Turskis, Z. Multiple criteria decision making (MCDM) methods in economics: an overview. Technol. Econ. Dev. Econ. 2011, 17, 397-427. [CrossRef]
- Radulescu, C. Z., & Radulescu, M. A hybrid group multi-criteria approach based on SAW, TOPSIS, VIKOR, and COPRAS methods for complex IoT selection problems. Electronics 2024, 13, 789. [CrossRef]
- Chaube, S., Pant, S., Kumar, A., Uniyal, S., Singh, M. K., Kotecha, K., & Kumar, A. (2024). An overview of multi-criteria decision analysis and the applications of AHP and TOPSIS methods. Int. J. Math. Eng. Manag. Sci. 2024, 9, 581. [CrossRef]
- Gao, F., Han, M., Wang, S., & Gao, J. A novel Fermatean fuzzy BWM-VIKOR based multi-criteria decision-making approach for selecting health care waste treatment technology. Eng. Appl. Artif. Intell. 2024, 127, 107451. [CrossRef]
- Görçün, Ö. F., Mishra, A. R., Aytekin, A., Simic, V., & Korucuk, S. Evaluation of Industry 4.0 strategies for digital transformation in the automotive manufacturing industry using an integrated fuzzy decision-making model. J. Manuf. Syst. 2024, 74, 922-948. [CrossRef]
- Khoshsirat, M., Mousavi, S. M., Zavadskas, E. K., & Antucheviciene, J. A New Interval-Valued Fuzzy MCDM Approach to Prioritize Solution Strategies in Project Disruption Management. Transform. Bus. Econ. 2024, 23.
- Li, J., Dai, Y., Jiang, R., & Li, J. Objective multi-criteria decision-making for optimal firefighter protective clothing size selection. Int. J. Occup. Saf. Ergon. 2024, 30, 968-976. [CrossRef]
- Guo, Z., Liu, J., Liu, X., Meng, Z., Pu, M., Wu, H., ... & Chen, F. An integrated MCDM model with enhanced decision support in transport safety using machine learning optimization. Knowl.-Based Syst. 2024, 301, 112286. [CrossRef]
- Wyrembek, M., & Baryannis, G. Using MCDM methods to optimise machine learning decisions for supply chain delay prediction: A stakeholder-centric approach. Logforum 2024, 20. [CrossRef]
- Ascough Ii, J. C., Maier, H. R., Ravalico, J. K., & Strudley, M. W. Future research challenges for incorporation of uncertainty in environmental and ecological decision-making. Ecol. Model. 2008, 219, 383-399. [CrossRef]
- Cui, H., Dong, S., Hu, J., Chen, M., Hou, B., Zhang, J., ... & Chen, F. A hybrid MCDM model with Monte Carlo simulation to improve decision-making stability and reliability. Inf. Sci. 2023, 647, 119439. [CrossRef]
- Saputro, T. E., Figueira, G., & Almada-Lobo, B. Hybrid MCDM and simulation-optimization for strategic supplier selection. Expert Syst Appl. 2023, 219, 119624. [CrossRef]
- Kabadayi, N., & Dehghanimohammadabadi, M. Multi-objective supplier selection process: a simulation–optimization framework integrated with MCDM. Ann. Oper. Res. 2022, 1-23. [CrossRef]
- Mardani, A., Zavadskas, E. K., Govindan, K., Amat Senin, A., & Jusoh, A. VIKOR technique: A systematic review of the state of the art literature on methodologies and applications. Sustainability 2016, 8, 37. [CrossRef]
- Christensen, C., Raynor, M. E., & McDonald, R. Disruptive innovation. Harv. Bus. Rev.: Brighton, MA, USA, 2013; 20151-20111.
- Guttentag, D. Airbnb: disruptive innovation and the rise of an informal tourism accommodation sector. Curr. Issues Tour. 2015, 18, 1192-1217. [CrossRef]
- Agyei-Boapeah, H., Evans, R., & Nisar, T. M. Disruptive innovation: Designing business platforms for new financial services. J. Bus. Res. 2022, 150, 134-146. [CrossRef]
- Bharadwaj, S., Clark, T., & Kulviwat, S. Marketing, market growth, and endogenous growth theory: An inquiry into the causes of market growth. J. Acad. Mark. Sci. 2005, 33, 347-359. [CrossRef]
- Sakarya, S., Eckman, M., & Hyllegard, K. H. Market selection for international expansion: Assessing opportunities in emerging markets. Int. Mark. Rev. 2007, 24, 208-238. [CrossRef]
- Weerawardena, J., & Mavondo, F. T. Capabilities, innovation and competitive advantage. Ind. Mark. Manag. 2011, 40, 1220-1223. [CrossRef]
- Hana, U. Competitive advantage achievement through innovation and knowledge. J. Compet. 2013, 5, 82-96. [CrossRef]
- Teece, D. J. Business models, business strategy and innovation. Long Range Plan. 2010, 43, 172-194. [CrossRef]
- Hall, B. H., & Lerner, J. The financing of R&D and innovation. In Handbook of the Economics of Innovation, North-Holland: Amsterdam, Netherlands, 2010; Volume 1, pp. 609-639. [CrossRef]
- Frizelle, G., & Woodcock, E. Measuring complexity as an aid to developing operational strategy. Int. J. Oper. Prod. Manag. 1995, 15, 26-39. [CrossRef]
- Poutanen, P., Soliman, W., & Ståhle, P. The complexity of innovation: an assessment and review of the complexity perspective. Eur. J. Innov. Manag. 2016, 19, 189-213. [CrossRef]
- Nielsen, C., & Lund, M. Building Scalable Business Models. MIT Sloan Manag. Rev. 2018, 59, 65-69. https://sloanreview.mit.edu/article/building-scalable-business-models/.
- Coviello, N., Autio, E., Nambisan, S., Patzelt, H., & Thomas, L. D. Organizational scaling, scalability, and scale-up: Definitional harmonization and a research agenda. J. Bus. Ventur. 2024, 39, 106419. [CrossRef]
- Bowers, J., & Khorakian, A. Integrating risk management in the innovation project. Eur. J. Innov. Manag. 2014, 17, 25-40. [CrossRef]
- Liu, Z., Ding, R., Wang, L., Song, R., & Song, X. Cooperation in an uncertain environment: The impact of stakeholders’ concerted action on collaborative innovation projects risk management. Technol. Forecast. Soc. Change 2023, 196, 122804. [CrossRef]
- Wang, C. N., Nhieu, N. L., Nguyen, H. P., & Wang, J. W. Simulation-based optimization integrated multiple criteria decision-making framework for wave energy site selection: A case study of Australia. IEEE Access 2021, 9, 167458-167476. [CrossRef]
- Samala, T., Manupati, V. K., Machado, J., Khandelwal, S., & Antosz, K. A systematic simulation-based multi-criteria decision-making approach for the evaluation of semi–fully flexible machine system process parameters. Electronics 2022, 11, 233. [CrossRef]
- Le, M. T., & Nhieu, N. L. A behavior-simulated spherical fuzzy extension of the integrated multi-criteria decision-making approach. Symmetry 2022, 14, 1136. [CrossRef]
- Mirzaaliyan, M., Hajian Heidary, M., & Amiri, M. Evaluating the supply chain resilience strategies using discrete event simulation and hybrid multi-criteria decision-making (case study: natural stone industry). J. Simul. 2024, 18, 851-867. [CrossRef]
- Hodosi, G., Sule, E., & Bodis, T. Multi-criteria decision making: A comparative analysis. In Economic and Social Development (Book of Proceedings), 103rd International Scientific Conference on Economic and Social Development (p. 81), Vararadin, Croatian, 21-22 November 2023.
- Harris, C. R., Millman, K. J., Van Der Walt, S. J., Gommers, R., Virtanen, P., Cournapeau, D., ... & Oliphant, T. E. Array programming with NumPy. Nature 2020, 585, 357-362. [CrossRef]
- Van Der Walt, S., Colbert, S. C., & Varoquaux, G. The NumPy array: a structure for efficient numerical computation. Comput. Sci. Eng. 2011, 13, 22-30. [CrossRef]
- Więckowski, J., Kizielewicz, B., & Sałabun, W. pyFDM: A Python library for uncertainty decision analysis methods. SoftwareX 2022, 20, 101271. [CrossRef]
- Więckowski, J., Kizielewicz, B., & Sałabun, W. Handling decision-making in Intuitionistic Fuzzy environment: PyIFDM package. SoftwareX 2023, 22, 101344. [CrossRef]
Figure 1.
Process for Generating Original Simulation Data Using NumPy.
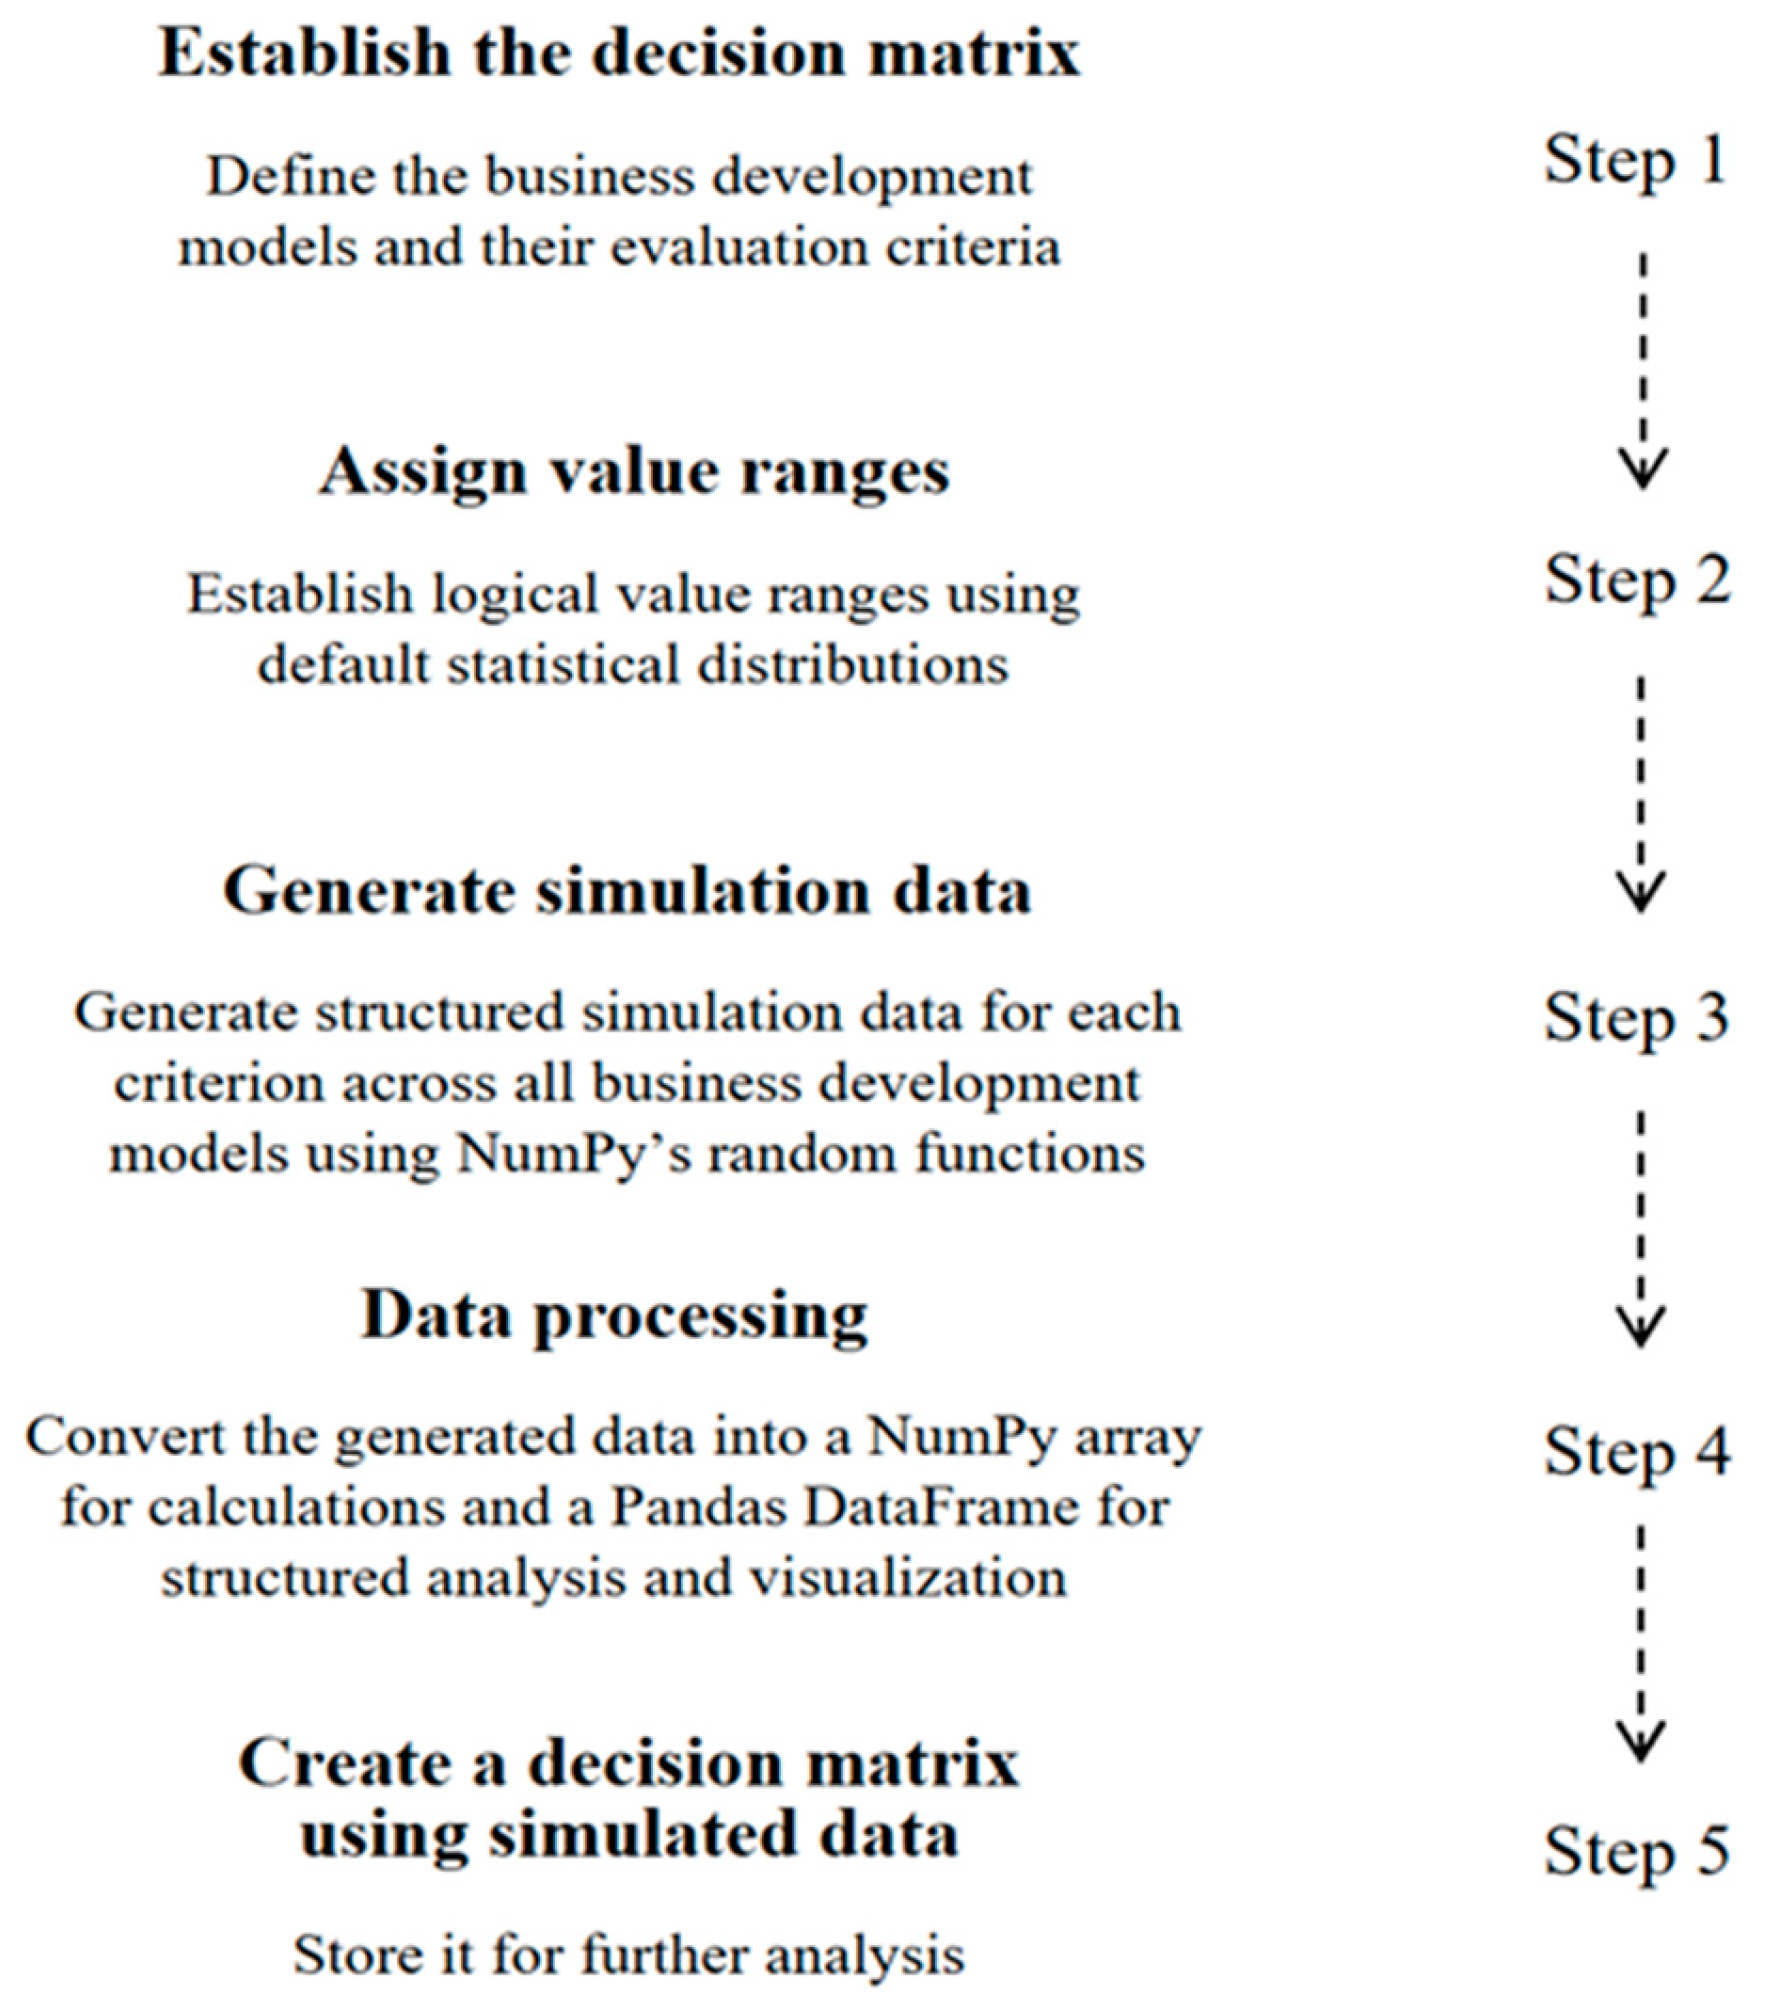
Figure 2.
VIKOR Sensitivity Analysis.
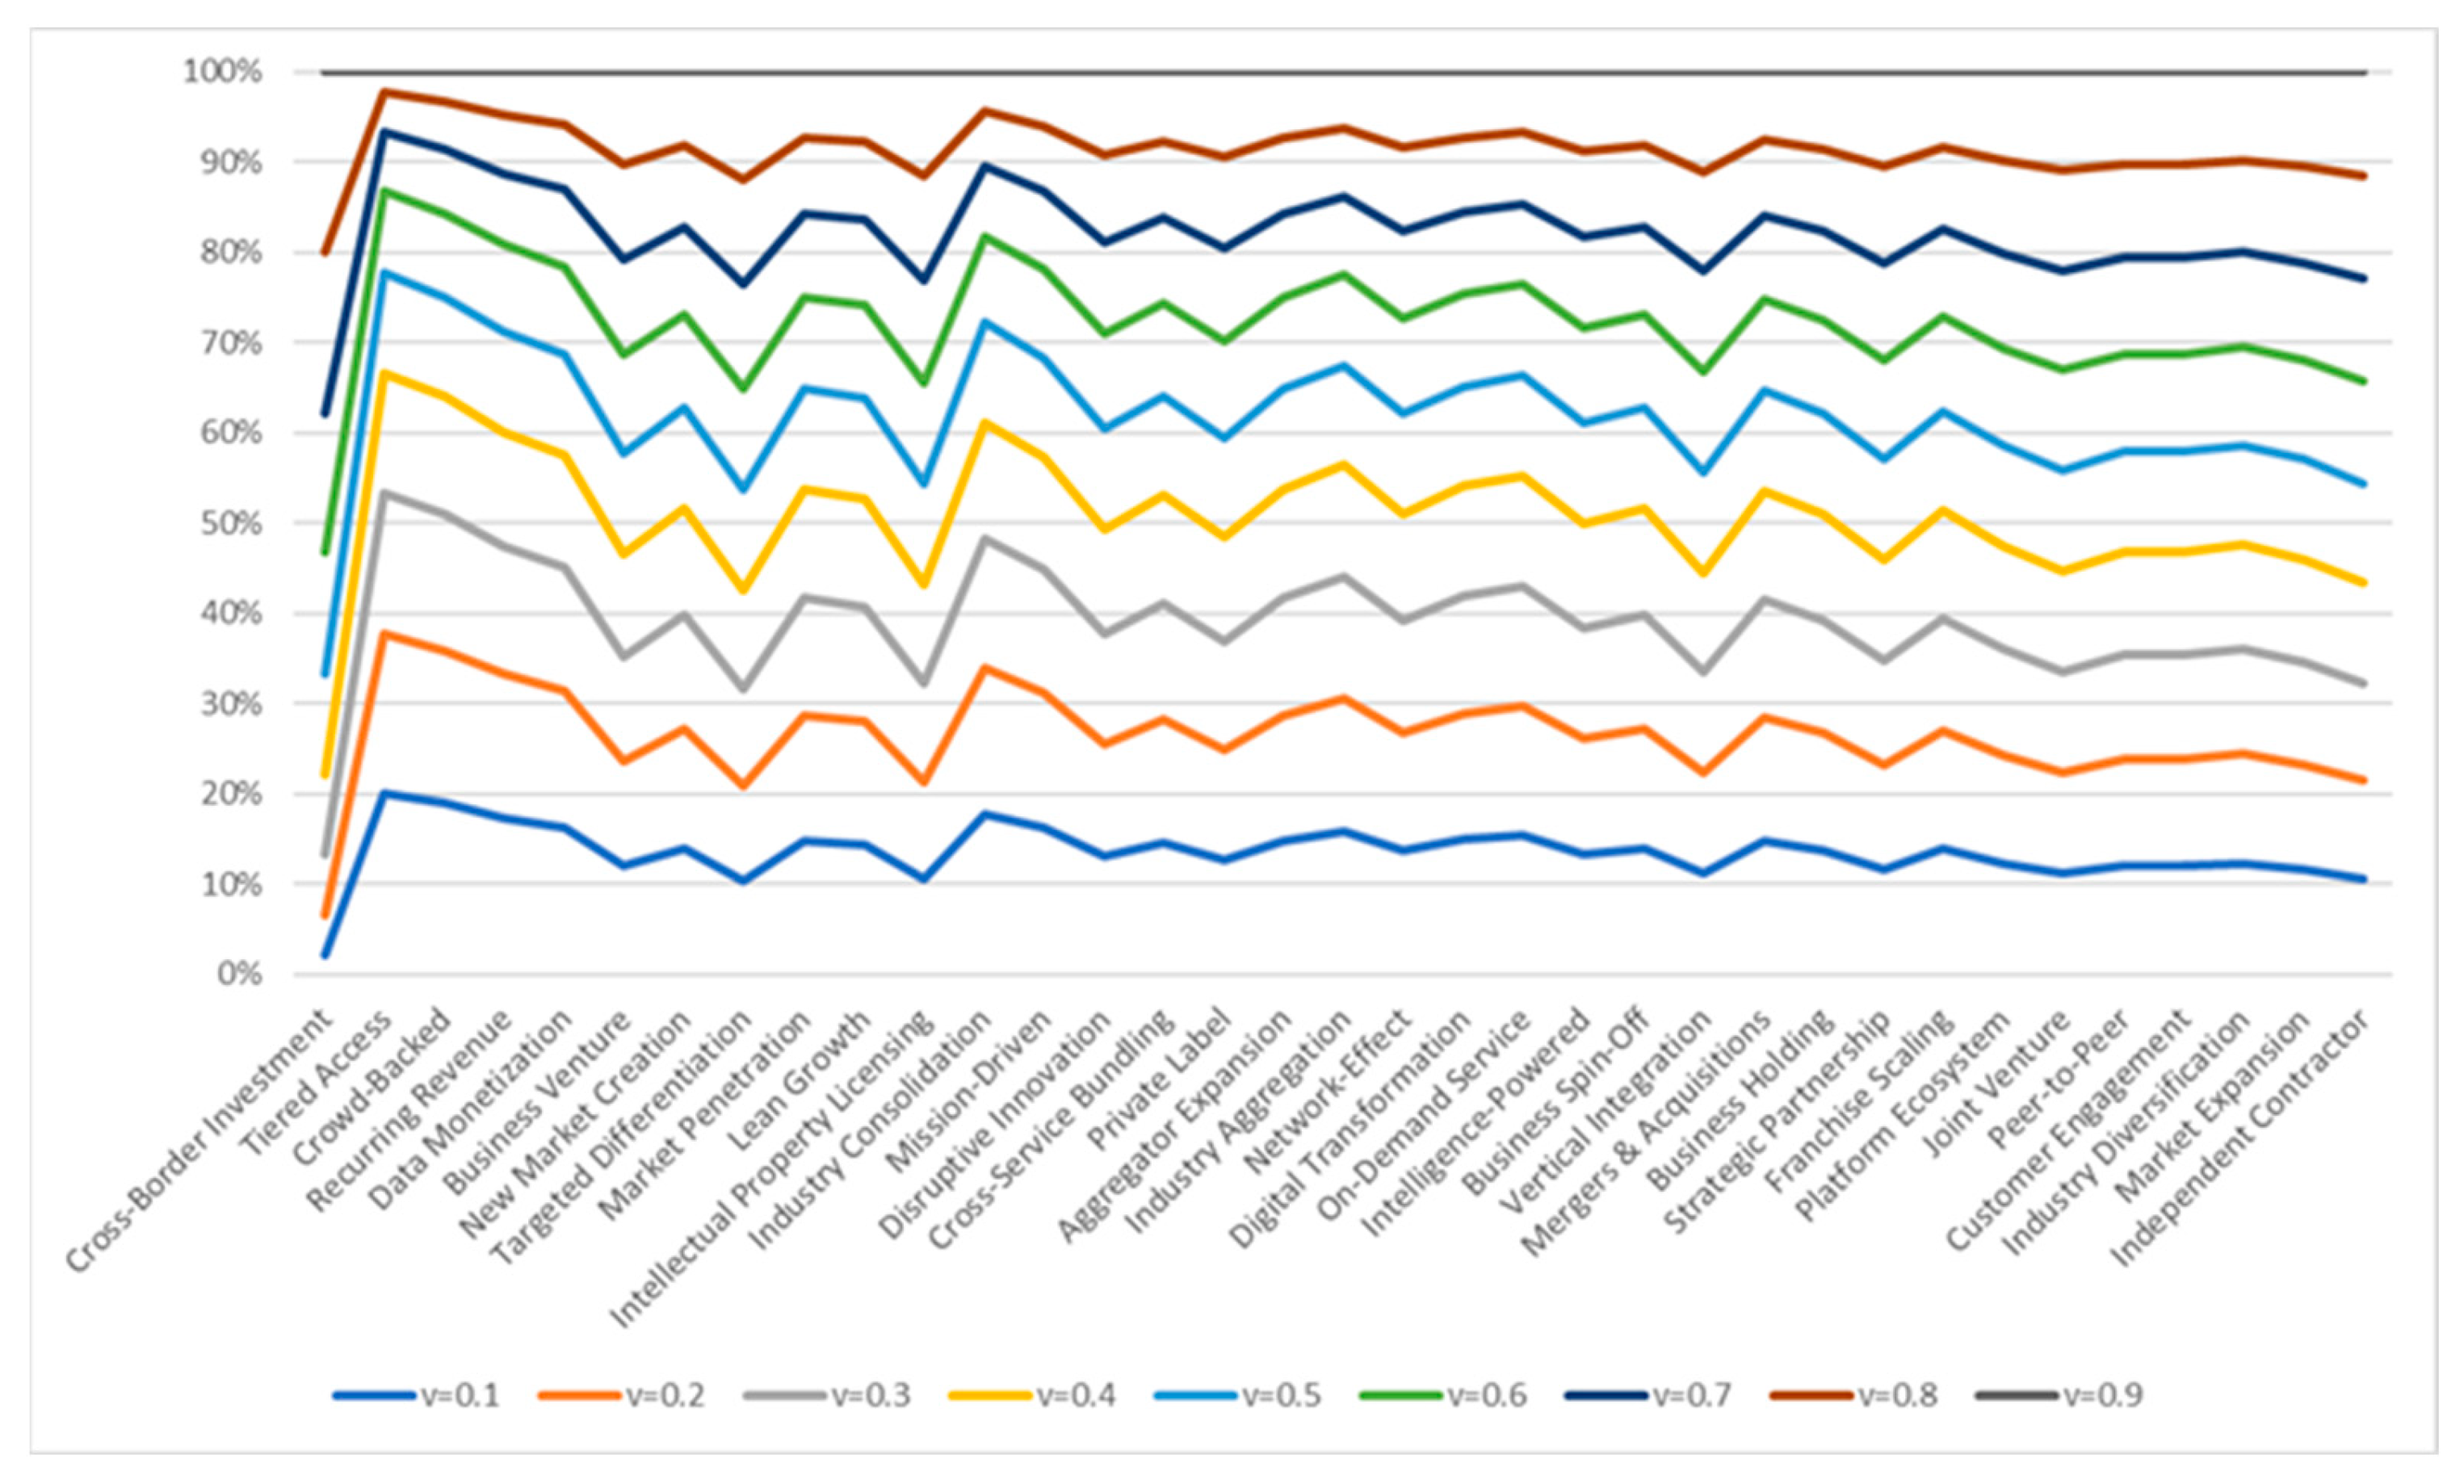
Figure 3.
VIKOR Robustness Analysis.
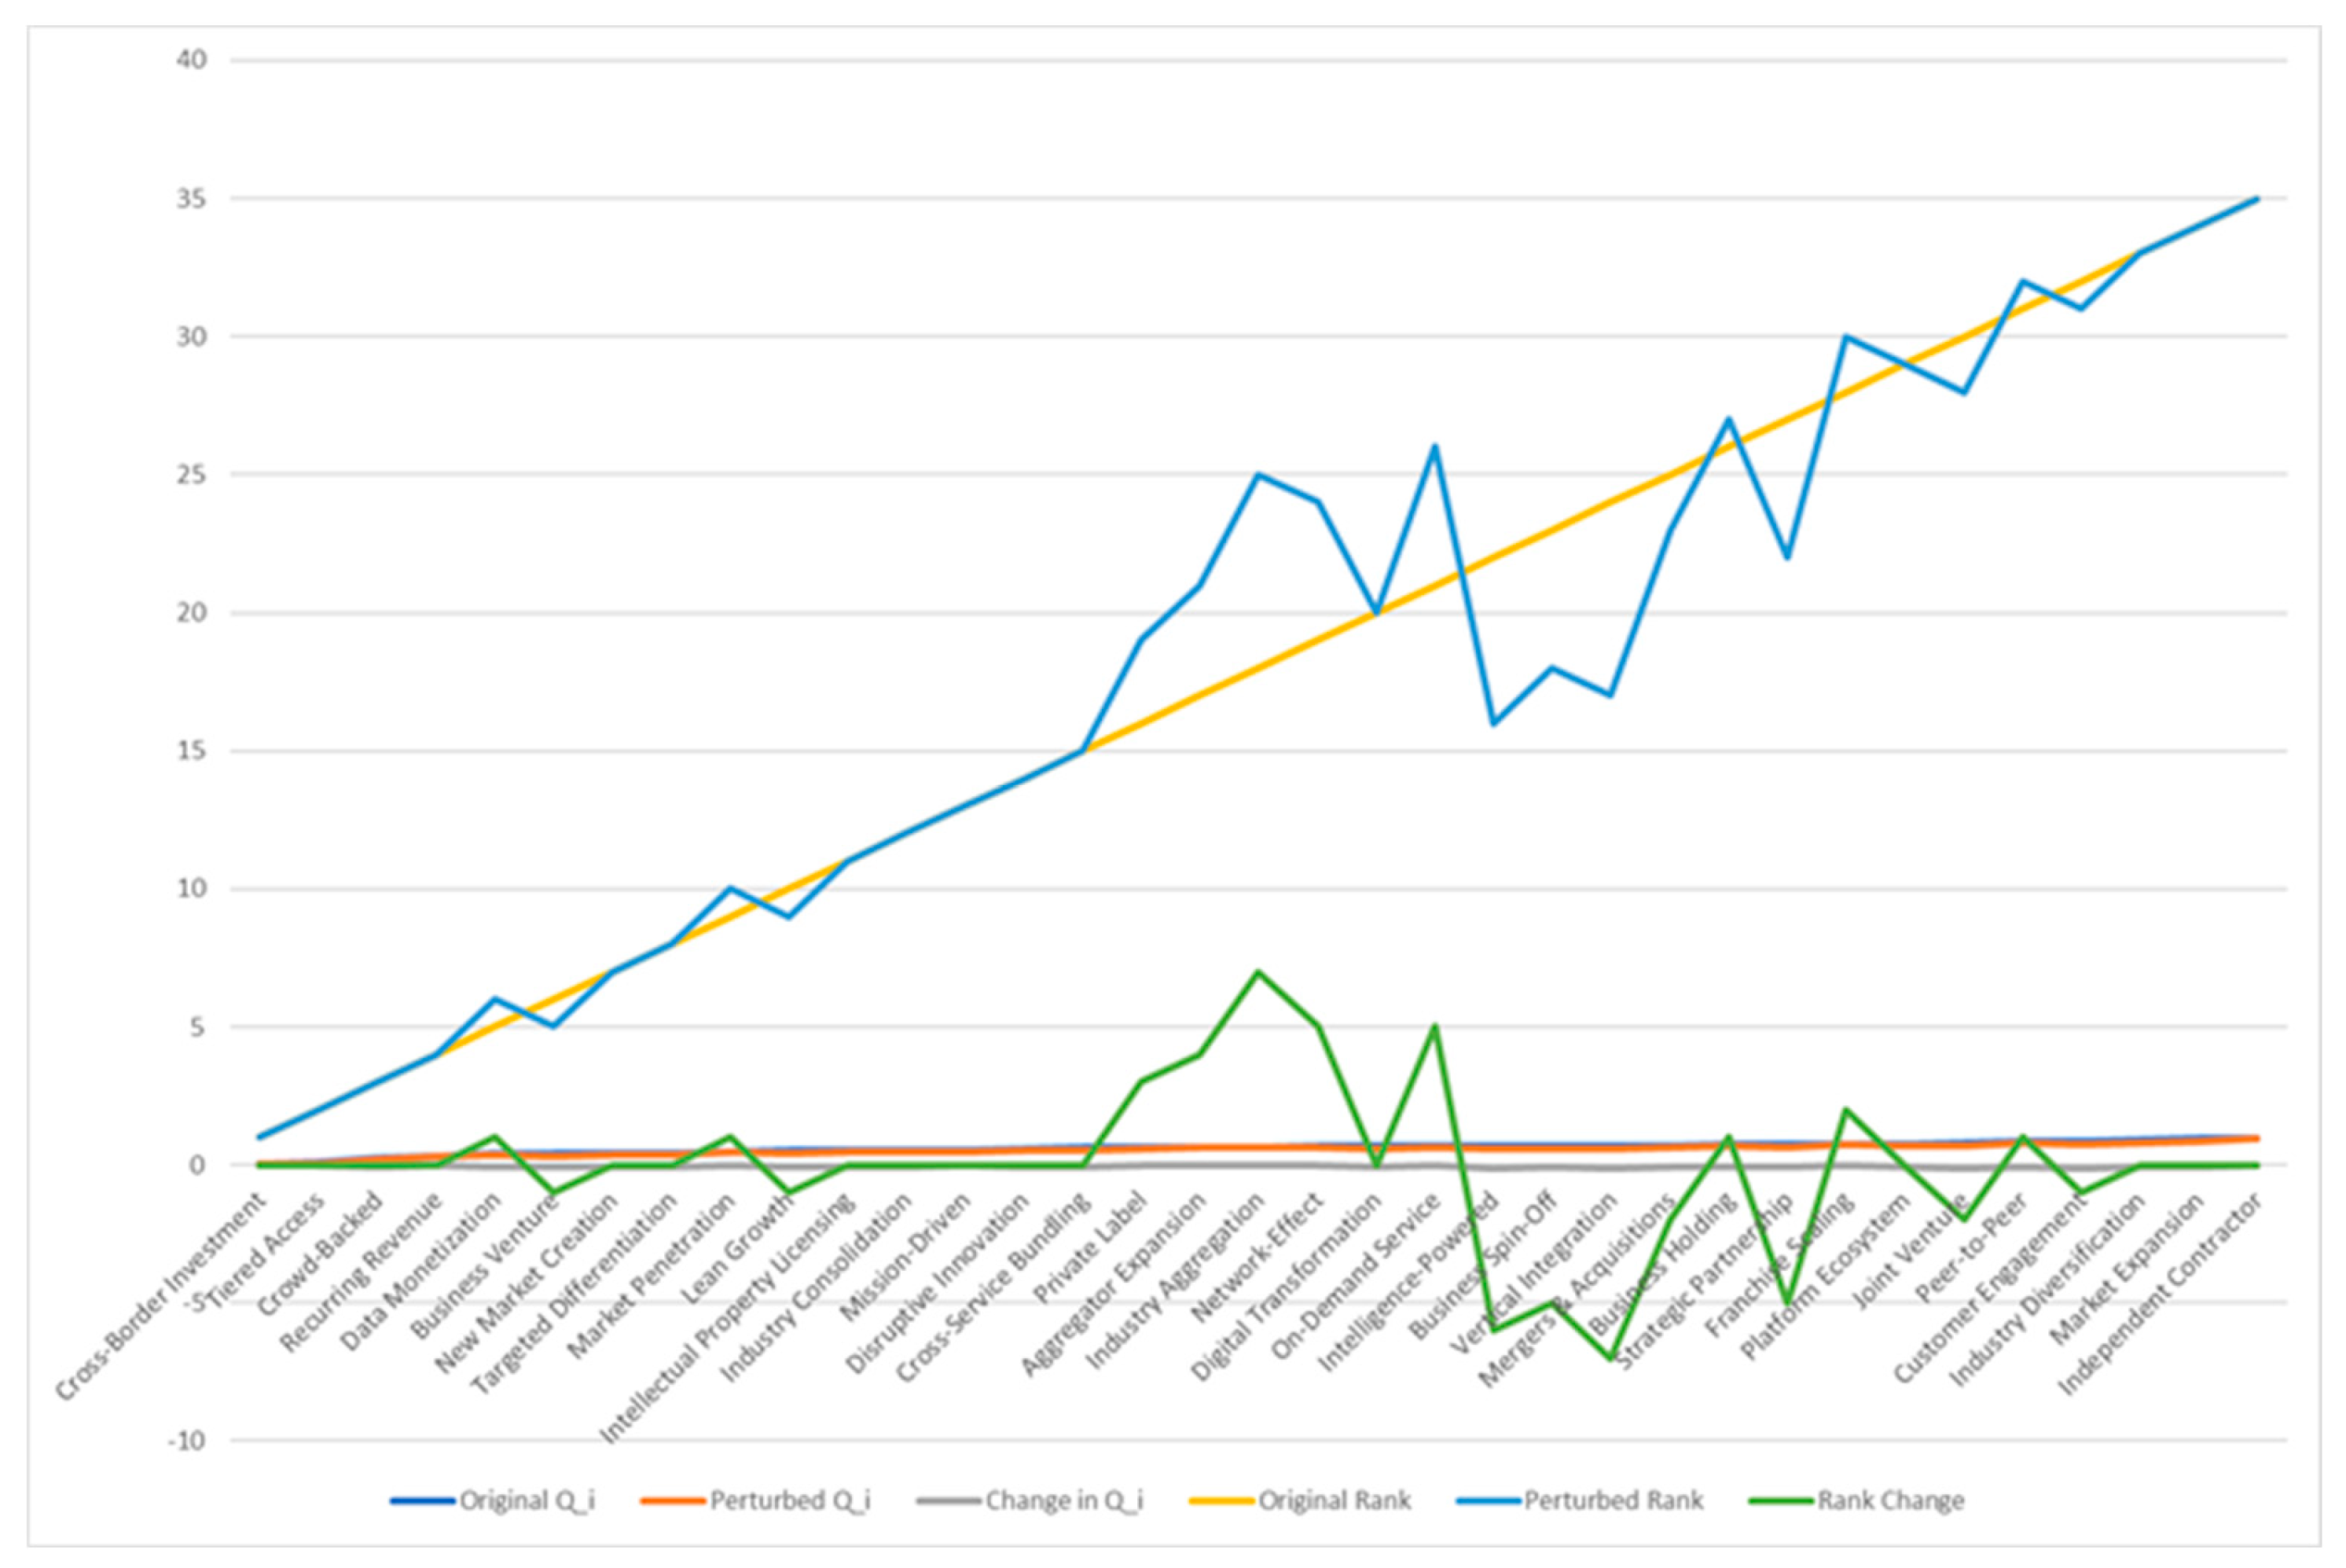

Table 1.
Business Development Models.
| Categories | Business Development Models | Definition |
| 1. Market Expansion and Competitive Strategy Models (Strategic models focused on entering new markets, competitive positioning, and industry disruption.) | Disruptive Innovation Model | Entry into an existing market with groundbreaking innovations that displace incumbents. |
| Market Expansion Model | Strategic expansion into new geographic regions and customer segments. | |
| New Market Creation Model (Blue Ocean Strategy) | Establishing new market spaces instead of competing within existing ones. | |
| Targeted Differentiation Model | Targeting a niche market through unique product or service differentiation. | |
| Cross-Border Investment Model | Establishing new operations in an untapped market from the ground up. | |
| 2. Business Ownership, Structural Realignment, and Financial Independence Models (Models that focus on business restructuring, business finance, and governance optimization.) | Corporate Spin-Off Model | Separating a business unit to form an independent entity for operational efficiency. |
| Joint Venture Model | Formation of a new business entity through co-ownership by multiple businesses. | |
| Corporate Holding Model | Parent business oversight over multiple semi-independent subsidiaries. | |
| Industry Diversification Model | Expansion into unrelated industries to minimize risk and maximize financial resilience. | |
| 3. Acquisition, Integration, and Business Consolidation Models (Growth strategies through acquisitions, vertical/horizontal integration, and industry consolidation.) | Industry Consolidation Model | Acquiring competitors within the same industry to increase market share and reduce competition. |
| Vertical Integration Model | Expanding business operations by acquiring upstream (suppliers) or downstream (distributors) entities. | |
| Industry Aggregation Model | Merging multiple smaller businesses in a fragmented industry to create economies of scale. | |
| Mergers & Acquisitions Model | Business expansion through business takeovers and ownership transfers. | |
| 4. Strategic Partnerships, Licensing, and Revenue-Generation Models (Models focused on strategic collaborations, licensing agreements, and shared revenue streams.) | Strategic Partnership Model | Non-equity partnerships between businesses to leverage mutual strengths. |
| Intellectual Property Licensing Model | Licensing brand assets, patents, or proprietary content for external use. | |
| Private Label Model | Rebranding and selling externally manufactured products under a proprietary name. | |
| 5. Digital Transformation, Platform-Based Growth, and AI-Driven Models (Utilizing digital technology, AI, and platform ecosystems for scalability and monetization.) | Digital Transformation Model | Adoption of technology to modernize traditional business operations. |
| Platform Ecosystem Model | Interconnected digital and physical assets operating within a unified user experience. | |
| Network-Effect Model | Leveraging increased user participation to drive exponential business value. | |
| Data Monetization Model | Commercializing data insights for predictive analytics, targeted marketing, and revenue generation. | |
| 6. Recurring Revenue, Customer Engagement, and Value-Based Pricing Models (Monetization strategies through subscriptions, engagement, and loyalty programs.) | Recurring Revenue Model | Generating predictable revenue streams through ongoing customer payments. |
| Tiered Access Model | Offering free access with paid premium features for enhanced customer acquisition. | |
| Customer Engagement Model | Optimizing customer relationships and loyalty for long-term profitability. | |
| 7. On-Demand Service Delivery and Sharing Economy Models (Business development models providing immediate service access and resource-sharing platforms.) | On-Demand Service Model | Real-time access to products and services via digital platforms. |
| Peer-to-Peer Model (Collaborative Consumption Model) | Enabling private asset owners to rent their resources to others. | |
| 8. Alternative Monetization, Financial Innovation, and Value-Driven Business Development Models (Innovative financial models focused on crowdfunding, venture capital, and alternative pricing.) | Crowd-Backed Business Development Model | Raising capital through public contributions or blockchain-based investment. |
| Corporate Venture Investment Model | Large businesses funding startups for strategic and financial returns. | |
| Lean Growth Model | Testing market demand through agile, data-driven business experimentation. | |
| Aggregator Expansion Model | Consolidating offerings from multiple providers under one unified brand. | |
| Market Penetration Growth Model | Selling an entry-level product at a low margin to drive sales of complementary goods. | |
| Independent Contractor Growth Model | Platform-facilitated employment for freelancers and short-term laborers. | |
| Intelligence-Powered Growth Model | Using machine learning to create customized consumer experiences. | |
| Mission-Driven Growth Model | Aligning innovation with business social responsibility and sustainability. | |
| Cross-Service Bundling Model | Selling bundled products/services through recurring payment plans. | |
| Franchise Scaling Model | Scaling business through independent franchisees while maintaining brand uniformity. |
Table 2.
Business Development Decision Matrix (Simulation Data).
| Business Development Model | Market Growth Potential | Competitive Advantage | Financial Investment Requirement | Operational Complexity | Scalability | Risk Level |
| Disruptive Innovation | 62.47241 | 97.04286 | 83.91964 | 75.91951 | 49.36112 | 49.35967 |
| Market Expansion | 43.48502 | 91.97057 | 76.06690 | 82.48435 | 41.23507 | 98.19459 |
| New Market Creation | 89.94656 | 52.74035 | 50.90950 | 51.00427 | 58.25453 | 71.48539 |
| Targeted Differentiation | 65.91670 | 57.47375 | 76.71117 | 48.36963 | 57.52868 | 61.98171 |
| Cross-Border Investment | 67.36420 | 87.11056 | 51.98043 | 70.85407 | 75.54487 | 42.78702 |
| Corporate Spin-Off | 76.45269 | 50.23145 | 43.90310 | 96.93313 | 97.93792 | 88.50384 |
| Joint Venture | 58.27683 | 45.86033 | 81.05398 | 66.40915 | 47.32229 | 69.71061 |
| Corporate Holding | 42.06331 | 94.55922 | 55.52680 | 79.75134 | 58.70266 | 71.20408 |
| Industry Diversification | 72.80262 | 51.09127 | 98.17508 | 86.50797 | 96.36994 | 93.68964 |
| Industry Consolidation | 75.87400 | 95.31245 | 45.30955 | 51.75897 | 42.71364 | 59.51982 |
| Vertical Integration | 63.32064 | 56.28094 | 89.72425 | 61.40520 | 56.85607 | 72.56176 |
| Industry Aggregation | 48.45545 | 88.13182 | 44.47304 | 99.21322 | 86.33469 | 51.92294 |
| Mergers & Acquisitions | 40.33133 | 88.92769 | 82.41144 | 83.74043 | 86.27622 | 44.44268 |
| Strategic Partnership | 61.50794 | 46.95214 | 91.78621 | 77.39789 | 59.85388 | 43.81350 |
| Intellectual Property Licensing | 58.65894 | 59.51100 | 83.77637 | 78.25345 | 93.23276 | 68.33290 |
| Private Label | 47.17565 | 82.79469 | 85.64710 | 73.67663 | 86.25803 | 69.62774 |
| Digital Transformation | 71.36397 | 65.65246 | 41.52515 | 46.47349 | 41.88575 | 78.18462 |
| Platform Ecosystem | 58.86136 | 70.51424 | 94.45399 | 54.95753 | 64.62298 | 85.33307 |
| Network-Effect | 53.72789 | 44.61879 | 57.38509 | 49.67328 | 95.78186 | 88.48722 |
| Data Monetization | 78.00423 | 92.28764 | 88.22032 | 51.19420 | 93.55354 | 72.36053 |
| Recurring Revenue | 88.44641 | 93.76548 | 59.08021 | 46.60312 | 53.67611 | 65.62647 |
| Tiered Access | 89.08089 | 91.64383 | 40.41713 | 70.64484 | 65.04466 | 53.32647 |
| Customer Engagement | 47.19192 | 60.25691 | 96.57458 | 59.39218 | 71.12744 | 82.18114 |
| On-Demand Service | 61.81778 | 98.30692 | 97.74684 | 55.10694 | 69.83491 | 58.05270 |
| Peer-to-Peer | 57.09043 | 42.21322 | 76.57386 | 70.16074 | 43.08873 | 56.71879 |
| Crowd-Backed | 94.49595 | 54.37371 | 48.69369 | 69.36717 | 99.13903 | 54.52332 |
| Corporate Venture | 80.32813 | 85.69718 | 54.25825 | 83.69298 | 62.06699 | 77.93835 |
| Lean Growth | 78.01178 | 72.14648 | 45.41739 | 90.11815 | 59.24680 | 51.19111 |
| Aggregator Expansion | 42.44651 | 75.45358 | 80.65386 | 40.99527 | 70.72558 | 53.58975 |
| Market Penetration | 78.71037 | 50.46199 | 81.45626 | 63.20412 | 96.20380 | 48.25126 |
| Independent Contractor | 60.46398 | 46.80841 | 95.48162 | 92.64036 | 55.47650 | 79.59904 |
| Intelligence-Powered | 89.03333 | 73.31205 | 71.77903 | 54.51114 | 45.58617 | 93.83295 |
| Mission-Driven | 94.02508 | 77.98609 | 60.34179 | 60.95257 | 83.55734 | 93.82662 |
| Cross-Service Bundling | 93.22519 | 86.79253 | 78.52190 | 45.04840 | 49.69772 | 93.91325 |
| Franchise Scaling | 76.38574 | 40.55182 | 46.08829 | 79.81011 | 40.30370 | 49.64848 |
Table 3.
Entropy Values and Weights of Business Development Criteria.
| Criterion | Entropy () | Weight () |
| Market Growth Potential | 0.9408 | 0.1559 |
| Competitive Advantage | 0.9327 | 0.1772 |
| Financial Investment Requirement | 0.9234 | 0.2016 |
| Operational Complexity | 0.9565 | 0.1145 |
| Scalability | 0.9197 | 0.2113 |
| Risk Level | 0.9470 | 0.1396 |
Table 4.
Business Development Model Rankings and VIKOR Values.
| Rank | Business Development Model | Si | Ri | Qi |
| 1 | Cross-Border Investment | 1.8089 | 0.5129 | 0.0481 |
| 2 | Tiered Access | 1.4943 | 0.5795 | 0.0684 |
| 3 | Crowd-Backed | 1.6031 | 0.7607 | 0.2710 |
| 4 | Recurring Revenue | 1.7947 | 0.7727 | 0.3126 |
| 5 | Data Monetization | 2.0402 | 0.8276 | 0.4065 |
| 6 | Corporate Venture | 2.7175 | 0.7334 | 0.4132 |
| 7 | New Market Creation | 2.4394 | 0.7890 | 0.4278 |
| 8 | Targeted Differentiation | 3.0434 | 0.7072 | 0.4362 |
| 9 | Market Penetration | 2.3604 | 0.8284 | 0.4562 |
| 10 | Lean Growth | 2.5173 | 0.8438 | 0.4959 |
| 11 | Intellectual Property Licensing | 3.2855 | 0.7507 | 0.5178 |
| 12 | Industry Consolidation | 1.9263 | 0.9590 | 0.5239 |
| 13 | Mission-Driven | 2.2343 | 0.9212 | 0.5321 |
| 14 | Disruptive Innovation | 2.9309 | 0.8461 | 0.5615 |
| 15 | Cross-Service Bundling | 2.7152 | 0.9227 | 0.6072 |
| 16 | Private Label | 3.1900 | 0.8736 | 0.6294 |
| 17 | Aggregator Expansion | 2.7312 | 0.9609 | 0.6489 |
| 18 | Industry Aggregation | 2.4789 | 1.0000 | 0.6504 |
| 19 | Network-Effect | 3.0070 | 0.9296 | 0.6588 |
| 20 | Digital Transformation | 2.7177 | 0.9731 | 0.6593 |
| 21 | On-Demand Service | 2.6119 | 0.9926 | 0.6631 |
| 22 | Intelligence-Powered | 3.1403 | 0.9213 | 0.6707 |
| 23 | Corporate Spin-Off | 3.0322 | 0.9608 | 0.6948 |
| 24 | Vertical Integration | 3.7635 | 0.8537 | 0.6965 |
| 25 | Mergers & Acquisitions | 2.8722 | 1.0000 | 0.7105 |
| 26 | Corporate Holding | 3.1604 | 0.9680 | 0.7217 |
| 27 | Strategic Partnership | 3.6991 | 0.8894 | 0.7233 |
| 28 | Franchise Scaling | 3.2231 | 1.0000 | 0.7641 |
| 29 | Platform Ecosystem | 3.6690 | 0.9356 | 0.7661 |
| 30 | Joint Venture | 4.0835 | 0.9081 | 0.8012 |
| 31 | Peer-to-Peer | 3.9929 | 0.9712 | 0.8522 |
| 32 | Customer Engagement | 4.0075 | 0.9723 | 0.8555 |
| 33 | Industry Diversification | 3.9655 | 1.0000 | 0.8776 |
| 34 | Market Expansion | 4.3655 | 1.0000 | 0.9387 |
| 35 | Independent Contractor | 4.7669 | 0.9534 | 0.9521 |
Disclaimer/Publisher’s Note: The statements, opinions and data contained in all publications are solely those of the individual author(s) and contributor(s) and not of MDPI and/or the editor(s). MDPI and/or the editor(s) disclaim responsibility for any injury to people or property resulting from any ideas, methods, instructions or products referred to in the content. |
© 2025 by the authors. Licensee MDPI, Basel, Switzerland. This article is an open access article distributed under the terms and conditions of the Creative Commons Attribution (CC BY) license (http://creativecommons.org/licenses/by/4.0/).
Copyright: This open access article is published under a Creative Commons CC BY 4.0 license, which permit the free download, distribution, and reuse, provided that the author and preprint are cited in any reuse.


