
Submitted:
27 July 2025
Posted:
29 July 2025
You are already at the latest version
Abstract
Business development plays a key role in organizational growth, yet its evaluation remains difficult due to limited data integration and delayed outcomes. This study introduces a structured, computational model that applies the Analytic Hierarchy Process using Python to evaluate business development across six defined process phases. Each phase contains three performance indicators designed to reflect both strategic alignment and operational clarity. Scenario-based simulations represent growth, efficiency, and balanced orientations to examine how strategy influences outcomes. A case drawn from published literature illustrates the model’s structure and application. Evaluation outputs enable consistent scoring and structured comparison while supporting alignment between decision intent and process performance. Weight sensitivity testing confirms internal consistency and adaptability across decision-making contexts. The framework provides a decision support tool that integrates performance metrics with multi-phase evaluation logic to enhance transparency, traceability, and strategic learning.
Keywords:
business development
; analytic hierarchy process
; simulation modeling
; decision support system
; performance evaluation
; multi-criteria decision analysis
; information-based modeling
1. Introduction
Organizational growth requires structured and strategic business development (BD) [1,2]. Companies must identify, evaluate, and pursue opportunities in competitive and dynamic markets [3,4]. Business development extends beyond sales and short-term growth [5,6]. It includes screening ideas, assessing fit, conducting due diligence, negotiating terms, and managing alliances [7,8]. These activities require alignment of strategy and execution and coordination among internal functions [9,10].
Despite its importance, business development lacks a consistent definition in academic research [11,12,13]. Some studies equate it with client acquisition and revenue generation [14,15], while others treat it as a broader function involving innovation, partnerships, and long-term value creation [16,17,18]. This inconsistency creates confusion in both academic and practical settings. The scope of business development varies across industries, firm sizes, strategic orientations, and organizational structures [19,20]. These differences raise questions about which indicators to measure and which evaluation methods to apply.
Evaluating business development performance involves distinct challenges [10,21]. Business development moves across extended timelines and relies on external actors and unstable conditions [22,23]. Strategic intent, partner behavior, and execution quality define results [24,25,26]. Some initiatives yield no immediate financial gain but still improve strategic position or organizational learning [27,28,29]. Conventional metrics focus on cost, output volume, or short-term return, missing broader sources of value in business development activities [30,31].
Research in this area remains fragmented. Many studies focus on specific components such as opportunity identification, partner selection, or alliance formation [32,33,34]. Others rely on conceptual models without defined indicators. Case studies provide insight but offer limited support for comparison or generalization. Without structured tools, managers rely on informal methods or subjective judgment, which weakens consistency and limits long-term improvement.
This study closes these gaps with a structured method for evaluating business development performance. The model captures process complexity and supports variation in strategic priorities. Analytic Hierarchy Process structures the evaluation criteria, and Python ensures consistency in execution [35,36]. Simulation and a real-world case from DuPont demonstrate the model’s applicability.
The model organizes business development into six phases: screening, identification, evaluation, due diligence, negotiation, and alliance management [37]. Each phase includes three indicators selected through a literature review of strategic alliances, innovation processes, and organizational performance. This structure captures how firms progress from initial contact to long-term partnership management. By evaluating performance at each phase, the model enables comparison across projects and time periods.
To validate the model, the study simulates scenarios aligned with distinct strategic orientations. These include a growth-oriented scenario focused on early-phase activity, an efficiency-oriented scenario centered on analysis and control, and a balanced scenario that gives equal weight to all phases [38,39]. Simulations use the Saaty nine-point scale to score indicators. The Analytic Hierarchy Process (AHP) framework calculates both phase-level and overall performance scores [40,41], showing how each strategic priority shapes outcomes. Application to a real-world case confirms the framework’s practical relevance.
Stability tests confirm the model’s reliability. Adjusting phase weights yields consistent results and preserves internal logic [42,43]. This flexibility allows managers to align the model with strategic goals without disrupting its structure. The framework supports use cases such as annual reviews, project evaluations, milestone tracking, and cross-project comparison.
This research contributes by integrating theory, structure, and application in a unified model. It provides a comprehensive framework for evaluating a function that receives limited attention in academic literature. By linking business development activities to measurable outcomes, the model supports informed decision-making and strategic alignment. Python implementation ensures transparency and scalability. The framework addresses a clear gap and offers practical value for both researchers and practitioners.
2. Literature Review
2.1. Business Development as a Strategic Function
Business development serves as a strategic mechanism through which firms achieve long-term growth and competitive advantage [24,44]. It integrates diverse functions such as innovation, alliance formation, and market expansion, enabling organizations to identify and exploit new opportunities [45,46]. Unlike operational functions focused on efficiency, business development operates with ambiguity, bridging gaps between strategic planning and execution [47,48].
Several scholars emphasize business development’s role in navigating uncertainty and facilitating cross-functional collaboration [10,49]. Its strategic nature allows firms to respond to external shifts, build partnerships, and adapt their value propositions [25,50]. Effective evaluation and alignment require viewing business development as a dynamic, strategic process rather than a transactional activity [51].
2.2. Gaps in Performance Evaluation
Despite the increasing importance of business development in strategic management, the academic literature lacks robust evaluation frameworks [52,53]. Many existing approaches prioritize financial or output-based metrics, which fail to capture business development’s multidimensional contributions, such as relationship building, strategic fit, and long-term value creation [54,55].
As a result, many managers assess initiatives using criteria that misalign with strategic objectives [51]. This misalignment creates ambiguity in performance tracking and undermines learning [56]. A critical gap remains in models that evaluate business development across its phases using structured criteria that reflect both qualitative and strategic dimensions.
2.3. Phase-Based Frameworks in the Literature
Several scholars propose business development models structured around sequential phases. While Lorenzi (2013) emphasizes process structure, Forsman (2008) takes a project-based view, and Hollander (2002) introduces multi-dimensional performance factors [32,37,57]. Park et al. (2017) extend the discussion by linking business development to measurable outcomes like commercialization success [58].
While these models offer valuable insight into business development’s structure, they fall short of providing actionable performance metrics [59]. Their descriptive nature limits their utility for empirical assessment or management control [60]. Therefore, researchers must integrate phase-based models with quantifiable indicators to improve decision-making and strengthen accountability [61].
2.4. Selecting Performance Indicators
The identification of performance indicators forms a critical part of business development evaluation [62,63]. Indicators must reflect strategic intent, operational feasibility, and adaptability [64,65]. Drawing from strategic management and business development literature, this study assigns three indicators to each phase, balancing process efficiency, outcome quality, and strategic alignment.
Selected indicators include opportunity alignment, resource compatibility, risk mitigation, and knowledge transfer [66,67]. These draw from established frameworks such as the Balanced Scorecard, value creation theory, and alliance capability models. Their inclusion grounds the evaluation in both theory and practice, enhancing robustness and clarity.
2.5. Analytic Hierarchy Process (AHP)
Analytic Hierarchy Process structures complex decisions through ranked comparisons of qualitative and quantitative criteria, allowing consistent and transparent evaluation across business development phases [68,69]. This method uses pairwise comparison and prioritization to support weight assignment across multiple evaluation criteria, enhancing decision clarity and consistency [70,71]. Scholars have applied AHP in various business contexts, including logistics, project evaluation, and human resource assessment, confirming its adaptability and robustness for performance measurement [72,73].
2.6. Simulation for Scenario Testing and Case Validation
Simulation allows organizations to test how different strategic orientations influence business development performance [78]. By adjusting weights and priorities, they can model outcomes under growth-focused, efficiency-driven, or balanced strategies. This process supports proactive planning and clarifies trade-offs in resource allocation and timing.
Scenario-based simulation aligns the model with practical decision-making and enhances its applicability. Its use in a case study confirms feasibility in real-world settings.
Sensitivity analysis reveals how assumptions shape decision outcomes and enables stakeholders to assess stability across scenarios [79]. This predictive capability complements the AHP framework, making the overall model both analytical and practical. Such dual functionality supports the needs of both researchers and decision-makers seeking data-driven tools.
2.7. Comparison with Conventional Evaluation
Performance evaluations focus on short-term financial outcomes or output metrics. These measures suit stable operations but fail to capture the strategic role and long-term value of business development. Business development needs broader criteria that address uncertainty, external interaction, and learning [67].
Conventional metrics ignore the sequential and cumulative nature of development activities. Each phase builds on the previous one, and failure in any stage can compromise the entire effort. Effective evaluation requires precision, continuity, and strategic alignment. Standard methods lack these qualities.
Table 1 summarizes key differences between business development evaluation and conventional performance assessment.
These contrasts highlight the need for distinct evaluation frameworks tailored to business development contexts.
2.8. Challenges in Business Development Evaluation
Evaluating business development involves challenges such as intangible outcomes, delayed impact, and reliance on external actors. Evaluation criteria must reflect non-financial benefits such as strategic positioning, innovation potential, and partnership quality [55,56].
AHP combined with simulation addresses these challenges through structured prioritization and scenario-based testing. This hybrid approach helps organizations manage complexity while maintaining consistency and adaptability in evaluation.
Table 2 outlines each challenge and its implications in greater detail.
Prior studies propose conceptual models and partial evaluation methods for business development, but they lack integrated frameworks that connect strategic phases with measurable indicators. This study addresses that gap by introducing a structured model enhanced with simulation, supporting both empirical analysis and practical application.
3. Materials and Methods
3.1. Research Design
This study uses a structured research design based on established theory to build and test a performance evaluation model for business development. It treats business development as a dynamic process with multiple phases that connect strategy and execution. The model builds on Lorenzi’s (2013) work and defines six phases [37]: screening, identification, evaluation, due diligence, negotiation, and alliance management. Three key performance indicators (KPIs) define each phase. Strategic management and innovation literature reinforce this structure.
AHP offers a structured way to evaluate business development. It breaks the problem into a hierarchy and assigns weights to KPIs based on their relevance. Simulation complements AHP by supporting scenario-based analysis and aligning evaluation with strategic needs.
3.2. Business Development Process Framework
The business development process follows a structured sequence of six interdependent phases, each serving a distinct purpose and contributing to strategic goals. Screening serves as the initial filter, identifying opportunities aligned with strategic priorities. Identification evaluates prospective partners or projects for alignment with organizational needs. Evaluation dives deeper into the feasibility and potential impact of the selected initiatives, incorporating both qualitative insights and quantitative assessments.
Due diligence serves as a critical validation step. It assesses risk, verifies assumptions, and ensures access to all necessary information before commitments. Negotiation establishes the terms of engagement, aligning stakeholder expectations and securing mutually beneficial agreements. Alliance management focuses on maintaining the relationship post-implementation, ensuring that collaborations deliver on their intended value. This phased framework is essential for aligning evaluation with the realities of strategic business development.
3.3. Assumptions of the Framework
This model relies on the idea that business development follows a structured sequence that supports systematic evaluation. Each phase adds distinct value to strategic outcomes, and the model uses defined KPIs to track performance. These indicators emphasize strategic fit, relationship strength, and execution quality. The model assumes organizations possess sufficient insight to evaluate each phase reliably.
AHP plays a central role by capturing stakeholder priorities and aligning them with strategic choices. The framework treats the relative weight of each phase and indicator as measurable and stable. Decision-makers use pairwise comparisons to gain insight into trade-offs and alignment. These assumptions shape a model built for strategic relevance and practical use.
3.4. Construction of Performance Indicators
A structured method develops performance indicators with relevance, clarity, and strategic alignment. Each phase of business development defines its purpose and expected outcomes. The method draws insight from literature in strategic management, innovation, and performance evaluation. Foundational concepts include the Balanced Scorecard, stakeholder theory, and resource-based views.
The study defines key indicators for every phase using literature and case analysis. These indicators capture both qualitative and quantitative aspects such as strategic alignment, partner engagement, knowledge exchange, and execution quality. Simulations test the indicators across varied scenarios to examine their responsiveness. This process ensures theoretical grounding and enables practical use.
The method supports internal validity by linking each indicator to the core function of its related phase. Each KPI stems from literature and aligns with the intended outcome of its activity. The design prevents overlap among indicators and keeps measurement consistent with the phase-specific goal.
External validity comes from using accepted frameworks with broad recognition, rather than case-specific data or expert opinion. The model offers flexibility to fit various business contexts. Organizations in different industries can apply or adjust the indicators based on their strategic focus. This structure supports transferability without loss of conceptual integrity.
Table 3 presents the six business development phases alongside their corresponding evaluation indicators. Each indicator highlights a distinct aspect of performance aligned with strategic goals, operational clarity, and organizational capacity. The descriptions draw on a synthesis of strategic management literature and case analysis to ensure both theoretical grounding and practical relevance. Representative sources that informed indicator development appear within the table.
3.5. Evaluation Method: Analytic Hierarchy Process
The Analytic Hierarchy Process serves as the core methodology for evaluating business development performance. AHP facilitates structured decision-making by organizing complex problems into a hierarchy consisting of a goal, criteria (phases), and sub-criteria (indicators). The model enables pairwise comparisons among criteria to derive relative weights, thereby reflecting the perceived importance of each element. This process ensures consistency in evaluation and supports data-driven decision-making.
AHP uses fixed weights drawn from theoretical and empirical sources instead of relying on expert judgment. This structure improves objectivity and supports consistent replication across scenarios. Scenario testing compares strategic orientations such as growth, efficiency, and balanced focus to reveal their impact on performance. Combining AHP with simulation strengthens the model’s logic and supports practical use. Citing real cases shows its feasibility in applied settings.
3.6. Data Sources and Simulation Logic
This study uses secondary data drawn from literature, case examples, and simulated scenarios to test the evaluation model. Simulations allow for controlled examination of the model under different strategic conditions. Each scenario reflects practical challenges such as partner risk, market shifts, and conflicts in strategic goals. Python handles score calculation, simulation runs, and visual output to ensure consistency across trials.
Simulation reveals how assumptions and strategic choices influence business development outcomes. A variety of test cases highlight the model’s range and show when specific KPIs or phases carry greater weight. This method avoids restrictions tied to confidential corporate data while producing results that apply to broader organizational contexts.
3.7. Methodological Limitations
The model provides a structured way to assess business development, but several limitations remain. Simulated data fails to reflect the complexity of real decisions and the influence of unforeseen factors on business outcomes. Fixed weights offer consistency but risk oversimplifying the shifting priorities common in strategic work.
AHP brings clarity through hierarchy and comparison but treats phases and indicators as independent. In practice, business development includes overlap, mutual influence, and shifts shaped by context. Model development can expand to include real-time inputs, cross-industry testing, and flexible weighting. Despite limitations, the current version offers a practical base for evaluating strategic business development.
3.8. Summary
The method builds and tests a model for evaluating business development through a structured design. A six-phase framework connects to performance indicators, and the model applies AHP and simulation to evaluate outcomes. Each phase addresses a distinct strategic role, and indicators reflect insights from literature and scenario analysis aligned with real-world priorities.
Key assumptions and limitations shape the model. Simulated data and fixed weights introduce constraints but offer a foundation for early validation. Structured logic, scenario testing, and strategic focus support a practical approach to measuring business development and enable future refinement.
4. Developing a Model to Evaluate Business Development Performance
A performance evaluation model reflects business development workflows. Its structure progresses from indicators to an overall assessment. Six phases structure the model: Screening, Identification, Evaluation, Due Diligence, Negotiation, and Alliance Management. Each phase includes three indicators that guide measurement and enable comparison.
Analytic Hierarchy Process organizes decision criteria and runs strategic scenario simulations. This framework connects business development activities with strategic goals. Users define parameters that align with specific organizational needs. A final case example illustrates the model and confirms its practical feasibility.
4.1. Structuring Performance Evaluation by Process Phase
Performance evaluation begins with the structure of the business development process because each phase shapes outcomes in a distinct way. Strategic activities unfold through a sequence of decisions, assessments, and engagements rather than as a single event. Evaluating performance by stage clarifies how execution quality changes and shows where teams create or miss value. This structure reflects how organizations manage uncertainty and allocate effort across time.
Six phases organize the business development process. Screening identifies initial opportunities. Identification examines potential partners. Evaluation tests feasibility. Due Diligence confirms assumptions. Negotiation sets commitments. Alliance Management sustains outcomes. Each phase fulfills a different purpose and demands different capabilities.
The model assigns three indicators to each phase. These indicators capture aspects such as strategic fit, risk control, and coordination quality. Scoring follows a ten-point scale and provides a consistent format for measuring contribution and comparing projects.
Indicator scores reflect the strength or weakness of execution in each area. High resource assessment scores suggest strong planning and clear internal coordination. Low agreement quality scores reveal unresolved expectations or vague commitments.
Stage-level evaluation reveals patterns across multiple initiatives. It shows whether recurring gaps affect certain phases or whether strategic emphasis matches actual practice. This method helps organizations diagnose performance gaps and improve execution when financial results remain incomplete or unpredictable.
Evaluating business development by process stage links actions to strategic goals. It turns abstract intentions into observable performance and supports informed decisions during project reviews or planning sessions.
4.2. Structuring Evaluation with Analytic Hierarchy Process
The Analytic Hierarchy Process structures the evaluation model into three levels that connect strategic objectives with specific performance indicators. This layered approach supports clear scoring, consistent comparisons, and alignment with process phases.
The top level sets the evaluation goal. In this case, the goal involves measuring business development performance across multiple phases and dimensions.
The second level identifies six core criteria. These criteria reflect the phases of business development: Screening, Identification, Evaluation, Due Diligence, Negotiation, and Alliance Management. Each phase addresses a different stage of execution and requires unique capabilities.
The third level defines specific indicators for each phase. These indicators translate strategic tasks into observable performance. Evaluators use them to compare progress across initiatives or scenarios.
This structure helps decision-makers simplify complex evaluations. By breaking the process into smaller parts, the model improves clarity and traceability. Each score supports diagnostic insight and strategic alignment.
The three-level hierarchy ensures full coverage of business development functions and allows consistent weighting and aggregation. The model connects long-term goals with process-level observations and supports structured judgment throughout the evaluation.
Figure 1 illustrates the AHP model’s three-level structure for evaluating business development performance. Six process phases form the middle level and guide execution across the workflow. Specific indicators anchor the bottom level and link measurement to each phase. This arrangement supports consistent weighting, traceable scoring, and alignment between strategic goals and operational results.
4.3. Phase Weight Assignment with AHP
4.3.1. Determining the Importance Sequence of Phases
The sequence of phase importance reflects logic and business needs, ranked from most to least important as follows:
- Due Diligence;
- Evaluation;
- Alliance Management;
- Negotiation;
- Identification
- Screening.
Due Diligence: Represents a critical checkpoint in many cases where all prior findings converge. Mistakes here can have severe consequences, so it gets the highest importance.
Evaluation: Plays a key role in assessing strategic fit and potential success. It holds strong influence but shows weaker decisiveness than Due Diligence.
Alliance Management: Supports long-term value realization and goal alignment, contributing to sustained success.
Negotiation: Shapes formal agreements and resource commitments. It holds greater influence than screening at the initial phase but carries lower criticality than evaluation and due diligence.
Identification: Helps structure the opportunity list and improves evaluation focus but carries moderate strategic weight.
Screening: Functions as an initial filter. It holds strategic relevance but makes a smaller contribution to outcomes than subsequent phases.
Our preliminary judgment of each phase’s impact and importance in meeting business goals guided this sequence. This is our assumption based on the standardized AHP method. In actual applications, decision makers can adjust it with flexibility to match enterprise strategy and priorities.
4.3.2. Constructing the Pairwise Comparison Matrix
Next, using the standardization steps of the AHP method, we constructed a pairwise comparison matrix based on the Saaty scale (1-9 scale) according to the importance sequence mentioned above. The logic for constructing the matrix is as follows:
- When phase i is more important than phase j, the value at position aij in the matrix is an integer from 1 to 9, with larger values indicating greater differences in importance;
- When phase i is less important than phase j, the value at position aij in the matrix is 1/aji;
- When phases i and j are equally important, the value at position aij in the matrix is 1.
For example:
- Due Diligence is slightly more important than Evaluation, so a12=2;
- Due Diligence is extremely more important than Screening, so a16=9.
Table 4 presents the comparison matrix built using the Saaty scale.
4.3.3. Standardization Process
To calculate the relative weight of each phase, we performed standardization on the pairwise comparison matrix, with the following steps:
- 1.
- Column Sum Standardization:
- Calculate the sum of each column in the comparison matrix;
- Divide each element in the matrix by the sum of its column to obtain the standardized matrix.
- 2.
- Row Average Method:
- Calculate the average of each row in the standardized matrix to obtain the relative weight of each phase (Priority Vector);
- Normalize the values of each column (divide each element by the sum of its column) to obtain the normalized matrix, as shown in Table 5.
4.3.4. Calculate the Weight Vector
We calculated the weight of each business development phase by averaging the values in each row of the normalized matrix. This step produced a priority vector, which reflects the relative importance of each phase in the overall evaluation model.
Table 6 shows the calculated weights. Due Diligence received the highest weight (0.4044609), followed by Evaluation (0.27862927) and Alliance Management (0.14102955). Negotiation (0.09799976), Identification (0.0505145), and Screening (0.027) followed in descending order.
These weights represent the strategic influence of each phase. Higher weights signal greater impact on performance outcomes. In subsequent stages, we used these values to adjust simulation scores and compute composite results.
4.3.5. Consistency Check
To ensure the logical consistency of the pairwise comparison matrix, we conducted a consistency check, which includes:
- Calculating the weighted sum vector:
Multiply the original comparison matrix by the weight vector to obtain the weighted sum vector.
- 2.
- Calculating the maximum eigenvalue λmax;
- 3.
- Calculating the consistency index (CI):
Where:
λmax is the largest eigenvalue.
n is the dimension of the matrix (here 6).
- 4.
- Calculating the consistency ratio (CR):
Where RI is the Random Index, for n = 6, RI = 1.24.
- 5.
- When CR<0.1, the matrix is considered to have good logical consistency.
Table 7 shows the consistency test results.
4.4. Simulation Design for Model Testing
To validate the AHP-based evaluation framework under varying strategic configurations, we designed a simulation that emulates diverse business development scenarios. Simulation allows controlled testing of the model’s ability to combine qualitative judgments and quantitative indicators and to examine its sensitivity to structured uncertainty. This approach supports a multi-layered examination of applicability, discriminative capacity, and parameter robustness.
4.4.1. Scenario Setting
The simulation tested three strategic configurations. Each one reflected a typical business development approach and allowed direct evaluation of the model’s ability to distinguish and quantify performance under different goals.
Scenario A presents a growth-oriented strategy. It focuses on market expansion, acquiring new partners, and building long-term opportunities. The highest scores appear in phases involving identification and alliance management. This scenario tests the model’s treatment of aggressive priorities that focus on external growth.
Scenario B uses an efficiency-centered strategy. It emphasizes process discipline, thorough evaluation, and risk control. The highest scores occur in the evaluation and due diligence phases. This case tests the model’s handling of internal control and quality-driven behavior.
Scenario C uses a balanced strategy. It treats all business development phases with equal importance. The scores remain consistent across phases. This case shows how the model responds to strategies that assign equal weight to all phases.
We assigned performance scores to 18 key indicators for each case. The model processed these inputs through the AHP hierarchy to compute composite performance outcomes.
This setup checks whether the model detects alignment of strategic intent with performance structure. A higher composite score suggests stronger alignment between scenario emphasis and phase importance in the AHP model.
4.4.2. Aggregating Performance Outputs
The model aggregated each scenario’s performance by applying AHP-derived weights to the KPI inputs and summing them through the hierarchy. This process maintained consistent treatment of indicator-phase relationships and allowed direct comparison across scenarios.
Scenario A outperformed others in Alliance Management and Identification, showing that strategies focused on partner engagement and initial screening align with phases that receive greater weight in the model. The model recognized this alignment by assigning a higher composite score, confirming its ability to capture expansion-focused priorities.
Scenario B led in Evaluation and Due Diligence, phases that hold substantial weight in the AHP structure. This outcome reflects the model’s sensitivity to performance in quality-driven areas and supports its relevance for efficiency-oriented strategies.
Scenario C produced consistent mid-level scores across all phases. The model responded predictably to this uniform input, reinforcing its capacity to reflect balanced execution without bias toward any specific strategic focus.
These results confirm that the model quantifies performance levels and incorporates strategic alignment into its evaluations. It rewards strategic emphasis that matches the weighted structure of business development and embeds strategic logic in its evaluation outcomes. Table 8 presents the results of the empirical simulation.
4.4.3. Sensitivity and Robustness Analysis
We tested model stability by adjusting Due Diligence weight from 0.32 to 0.48. This phase holds the highest weight and shapes key risk outcomes in business development.
Each variation required proportional rescaling of the remaining weights to maintain a normalized structure. Following each adjustment, we recalculated total scenario scores to track changes in rank order and overall performance.
Scenario B consistently produced the highest score, indicating strong robustness underweight variation. In contrast, Scenario A showed greater variability, suggesting moderate sensitivity to changes in non-priority phases. The results for Scenario C remained stable, reflecting its uniform scoring structure.
These findings demonstrate the model’s resilience and strategic fidelity:
- It remains robust under moderate judgmental uncertainty in weight setting;
- Scenarios with strong alignment to high-weight phases, such as Scenario B, show increased stability;
- The framework supports practical use in environments where expert weight assignments differ across decision-makers or contexts;
- It preserves structural validity and interpretive consistency under input variation.
Figure 2 presents the results of the sensitivity and robustness analysis.
4.5. Empirical Case
This study applies the evaluation model to a case from DuPont based on secondary literature. The case outlines DuPont’s business development efforts in innovation and alliance formation. Each phase in the model uses selected indicators to assess performance.
Appendix A presents the full case. Although the case draws from published sources, it demonstrates how the model handles real-world examples with incomplete data. The model identifies which phases drive outcomes and highlights performance variation across strategic priorities.
4.5.1. Implications of Empirical Case
This illustration supports the model’s relevance. It shows how structured evaluation clarifies complex business development efforts. Managers can use similar applications to diagnose strengths and weaknesses across phases, link strategy with execution, and improve decision-making.
The DuPont case provides meaningful insights by demonstrating how the proposed framework reflects actual business development practice. It shows:
- Alignment with Real-World Processes: DuPont’s approach aligns with the six phases and chosen indicators, which supports the model’s relevance;
- Support for Structured Evaluation: It illustrates how the framework captures strategic focus, coordination, and performance, reinforcing the model’s utility;
- Theoretical and Practical Relevance: By linking academic structure with corporate action, it strengthens the connection between research and application.
This alignment confirms the model’s potential as a reliable tool for both researchers and practitioners.
4.5.2. The Role of Performance Evaluation Model
- Enhancing Decision-Making Systematically;
Structured Indicator Design: The framework offers a multi-layered indicator system based on the Analytic Hierarchy Process, helping DuPont systematically track performance across different business development phases, such as screening, identification, evaluation, due diligence, negotiation, and alliance management.
Multi-Criteria Decision Support: DuPont can use the framework’s indicators (e.g., strategic fit, risk identification, value creation) to compare multiple criteria and ensure that decisions in each phase align with the company’s overall strategic goals.
- 2.
- Increasing Transparency in Performance Management;
Quantifiable Performance Metrics: The framework converts intangible metrics such as partnership compatibility and negotiation flexibility into specific indicators. These indicators support evaluation with reduced subjectivity.
Visualized Results: Simulations and data analysis produce performance visuals across strategic scenarios. Managers use these results to identify strengths and locate weaknesses in business development.
- 3.
- Strengthening Strategic Execution Flexibility;
Adaptability to Different Strategic Goals: The framework supports weight adjustments, allowing DuPont to adapt indicator allocation based on specific business development strategies, such as growth-focused, efficiency-focused, or balanced approaches.
Cross-Functional Coordination: The framework facilitates internal collaboration, helping DuPont integrate resources across departments and improve the overall effectiveness of strategy execution.
- 4.
- Supporting Long-Term Value Creation;
Evaluating Non-Financial Outcomes: The framework goes beyond short-term financial returns to evaluate the long-term value of business development efforts, such as market positioning, knowledge accumulation, or the expansion of collaboration networks. This is critical for DuPont’s innovation and sustainability goals.
Tracking Milestone Progress: The framework provides clear tools for tracking milestones during business development processes, ensuring that projects progress as planned.
- 5.
- Improving Strategic Comparisons;
Multi-Scenario Simulations: Through simulations of different strategic scenarios (e.g., rapid growth or efficiency prioritization), DuPont can compare performance outcomes across various approaches, helping management choose the optimal strategy.
Annual Reviews and Strategic Insights: DuPont applies performance results from the framework during annual reviews and project evaluations. These reviews support adjustments to future business development strategy.
- 6.
- Increasing Practical Value of the Model.
The DuPont case demonstrates the framework’s effectiveness within a large multinational corporation. This application confirms its value across practical business development settings.
Connecting Theory and Practice: By applying the framework to the DuPont case, it bridges academic theory with practical usage, offering a structured management tool for business development.
The performance evaluation framework brings substantial benefits to the DuPont case, including systematic decision-making, enhanced transparency, strategic flexibility, long-term value creation, effective strategic comparisons, and practical application. DuPont strengthens business development processes through structured evaluation. This application highlights the framework’s potential for broader use in professional settings.
4.6. Practical Applications and Implementation Contexts
The AHP-based evaluation framework developed in this research offers flexible and structured tools for assessing business development performance across organizational levels and timeframes.
Organizations can use this model to evaluate individual business development personnel by translating role-specific indicators into weighted performance scores that reflect strategic emphasis and actual outcomes. It supports team-level assessment by aggregating indicators from members to identify strengths and gaps in collaboration.
The framework accommodates multiple evaluation formats:
- Annual reviews help track long-term contributions and alignment with strategic goals;
- Project-based evaluations capture outcomes linked to specific initiatives;
- Milestone assessments support phase-based reviews, such as post–due diligence or post–negotiation checkpoints.
By combining quantitative data with expert weighting, the model allows both standardized benchmarking and contextual customization. It supports internal diagnostics, cross-project comparisons, and external validation within partnerships or governance reviews.
The evaluation framework serves as a structured instrument for diagnosis and strategic decision support. It helps organizations align business development activities with overarching goals and offers a consistent foundation for performance measurement.
5. Discussion
Performance theory provides a basis to understand evaluation results. Strategic choices influence business development outcomes in distinct ways. The model identifies patterns that align operational activities with overarching goals. Insights from this analysis strengthen coordination between decisions and development planning.
5.1. Interpretation Based on Performance Theory
Performance theory emphasizes the need for goal clarity, measurable indicators, and continuous feedback to guide organizational behavior. The evaluation model reflects these principles by structuring business development in six phases and linking each with performance indicators to turn strategic intent into operational practice. This structure supports goal alignment and promotes accountability.
Simulated scenarios demonstrate how strategic priorities shape business development outcomes. A growth-oriented approach excels in opportunity recognition and external collaboration. An efficiency-focused strategy shows strength in internal assessment and risk control. This balanced configuration achieves moderate results across all phases. These differences confirm that effective execution requires aligning strategic focus with operational delivery.
The model enables clear visibility into performance at multiple levels. Decision-makers can identify which phases contribute most to overall success or signal the need for corrective action. This supports continuous performance improvement and adaptive learning. Early testing of strategies improves decision quality and lowers the risk of misalignment.
Structured evaluation systems, as illustrated in the model, reinforce organizational control by offering repeatable, transparent, and comparable assessments. When integrated into planning and review cycles, such systems encourage learning, resource prioritization, and cross-functional coordination. This reflects performance theory’s view that organizations improve when data-driven feedback loops guide decisions.
5.2. Strategy and Organizational Coordination
Strong coordination depends on clear strategy, effective communication, and alignment of daily operations. The evaluation model helps examine whether these conditions are present. It simulates strategic options and compares their results to assess the effectiveness of translating intentions into outcomes.
Different scenarios express varied priorities. A growth strategy strengthens phases tied to exploration and external partnerships. An efficiency strategy focuses on internal checks and decision validation. This configuration yields uniform results across functions.
These results show that strategy must shape practice. Leaders need to embed their goals in daily operations. This requires consistent direction across roles, regular review of outcomes, and shared understanding across teams.
Comparing strategies under a common framework highlights gaps in execution. Managers can use this view to align plans with processes. Shared evaluation tools improve communication, guide resource use, and bring different departments into closer cooperation. The model helps unify performance goals and strategic learning.
5.3. Evaluation and Strategic Planning
Strategic planning benefits from structured tools that connect vision with specific actions. Evaluation supports this connection by showing whether selected strategies meet expectations. The model gives managers a way to examine which focus areas help or hinder execution. Scenario comparisons show how priorities shape measurable outcomes.
Growth strategies show strength in identifying and pursuing external opportunities. Efficiency strategies emphasize internal checks and structured decision processes. Balanced strategies maintain steady results without concentrated focus. These outcomes show the need to match strategic intent with actual capabilities.
Effective planning depends on feedback that arrives on schedule and in a form that supports action. The model helps leaders evaluate outcomes and adjust decisions before implementation begins. Managers can adjust plans using specific data from each phase.
Clear evaluation builds accountability. Linking performance to specific choices makes learning and change easier. This model encourages routine checks on strategy and steady alignment between changing goals and available resources.
5.4. Evaluation and Short-Term Accountability
Business development requires long-term commitment, and its outcomes emerge over time. Still, regular operations require accountability. The model identifies mechanisms within the business development process that allow regular monitoring without losing sight of long-term goals. Structured evaluation helps prevent drift by reinforcing strategic focus through phase-specific indicators.
Much of the existing literature examines business development success or failure in hindsight. Few studies offer ways to evaluate short-term performance in ongoing processes. This research contributes a new perspective by providing a structured method to assess immediate outcomes while maintaining alignment with strategic objectives.
By bridging long-term goals with short-term feedback, the model supports decision-makers in maintaining strategic discipline. It creates opportunities for performance discussion in practice and academia, opening paths for expanded management practices and deeper inquiry.
5.5. Research Outlook
The evaluation model uses simulated scenarios and provides a structured basis for analysis. Future research should apply this framework to actual business development cases to validate its utility and refine its assumptions. Empirical testing can reveal whether the indicators and weights hold across different organizational contexts or require adjustment.
Expanding the model with adaptive components, such as real-time data inputs or iterative feedback loops, could improve responsiveness. Researchers might explore alternative decision-making tools that enhance precision or address complexity in dynamic environments. Exploring hybrid models that combine AHP with methods like machine learning or system dynamics could provide greater predictive capability.
Continued development of this framework promises to strengthen its relevance. Applied consistently, it offers a foundation for aligning strategic planning with operational measurement in business development. This creates opportunities for coherent decision-making, stronger resource allocation, and lasting performance gains.
6. Conclusions
This study presents a structured model for evaluating business development performance using the Analytic Hierarchy Process and scenario simulation. Business development involves multiple phases that evolve across extended timelines and may lack clear evaluation criteria. The model organizes these activities into defined phases with concrete indicators, supporting structured and consistent assessment.
Each simulation scenario highlights distinct strategic behaviors. A growth-focused strategy emphasizes external engagement. An efficiency-focused strategy centers on internal control. This balanced approach maintains attention across all phases. These patterns show how strategic focus shapes outcomes and reinforce the need for alignment between strategic planning and operational execution.
The model enables ongoing evaluation within long-term processes. It identifies phase-level performance trends and offers a consistent structure for monitoring business development. Managers can detect issues early, adjust plans accordingly, and ensure that decisions support broader goals.
This study addresses a gap in existing literature by presenting a method for evaluating short-term performance in ongoing development efforts. The model supports immediate feedback, operational learning, and resource coordination. It allows decision-makers to assess current activities without waiting for long-term results.
Future research should apply the model to real business cases. Testing the indicators and weights in different organizations can improve accuracy and generalizability. Additional exploration of data integration or model enhancements may increase its responsiveness and decision support value.
This work contributes a structured and practical approach to business development evaluation. It connects strategic planning with operational practice and offers a tool for consistent assessment, informed decision-making, and long-term performance improvement.
Supplementary Materials
The following supporting information can be downloaded at the website of this paper posted on Preprints.org. The appendix includes the full evaluation results from the DuPont case, including indicator scores by phase, comparison matrices, and weight calculations. These materials support transparency and allow replication or adaptation for other contexts.
Author Contributions
The author confirms sole responsibility for all aspects of the manuscript. Conceptualization, methodology, formal analysis, investigation, data curation, original draft writing, review and editing, visualization, and project administration were all completed by the author.
Funding
This research received no external funding.
Institutional Review Board Statement
Not applicable.
Informed Consent Statement
Not applicable.
Data Availability Statement
The original contributions presented in this study are included in the article/supplementary material. Further inquiries can be directed to the corresponding author.
Acknowledgments
The author acknowledges the contributions of the academic community and open-source software developers whose work supported this study.
Conflicts of Interest
The author declares no conflict of interest.
Abbreviations
The following abbreviations are used in this manuscript:
| BD | Business Development |
| AHP | Analytic Hierarchy Process |
| KPIs | Key Performance Indicators |
Appendix A
DuPont Business Development Performance Evaluation Case Study
- Case Background
DuPont is a global leading chemical company whose business development activities focus primarily on new market expansion and technological innovation. This appendix analyzes DuPont’s business development activities in the Chinese market using the performance evaluation model outlined in this study. DuPont’s Business Initiative Process (BIP) framework has facilitated its success across screening, identification, evaluation, due diligence, negotiation, and alliance management phases.
- 2.
- Analytical Framework
The performance evaluation model employed in this study encompasses six key phases, each with several Key Performance Indicators. The following sections present the analysis results and performance scores for DuPont’s case.
- 3.
- Case Analysis
- Screening Phase;
| KPI Indicator | Analysis Results | Performance Score |
| Relevance of Opportunities | DuPont’s screening process aligns closely with its strategic objectives, especially in identifying opportunities in emerging markets like China. | 9/10 |
| Efficiency of Assessment | Screening efficiency is high, but further quantification of filtering quality is needed to ensure accurate prioritization. | 8.5/10 |
| Timeliness | The screening process is timely, meeting the fast-changing demands of the market. | 9/10 |
- Identification Phase;
| KPI Indicator | Analysis Results | Performance Score |
| Strategic Fit | Opportunity identification aligns with DuPont’s long-term goals, supporting market expansion and technological innovation. | 9/10 |
| Partner Potential | Partner selection is reasonable, with strong capabilities and reputation supporting project success. | 9/10 |
| Resource Requirements | Resource requirements are accurately estimated, with resources allocated effectively to high-priority projects. | 8.5/10 |
- Evaluation Phase;
| KPI Indicator | Analysis Results | Performance Score |
| Analytical Depth | Analytical depth is high, but further validation of comprehensive analysis is necessary to support decision-making. | 8.5/10 |
| Risk Identification | Risk identification is good, but a more comprehensive risk assessment is needed to reduce uncertainty. | 7.5/10 |
| Alignment with Goals | Opportunity analysis aligns well with DuPont’s strategic goals, supporting project success. | 9/10 |
- Due Diligence Phase;
| KPI Indicator | Analysis Results | Performance Score |
| Information Accuracy | Data collected is reliable and accurate, supporting the decision-making process. | 9/10 |
| Financial Clarity | Financial information is transparent, supporting decision-making, but further validation of financial forecasts is needed. | 8.5/10 |
| Risk Transparency | Risk transparency is good, but there is room for improvement in disclosing potential risks in greater detail. | 8/10 |
- Negotiation Phase;
| KPI Indicator | Analysis Results | Performance Score |
| Agreement Effectiveness | Negotiated agreements are effective, supporting mutual goals and delivering anticipated value. | 9/10 |
| Flexibility | Agreements are flexible and adaptable to future changes, but further validation of adaptability is needed. | 8.5/10 |
| Value Realization | Negotiation outcomes align closely with value delivery, supporting project success. | 8.8/10 |
- Alliance Management Phase;
| KPI Indicator | Analysis Results | Performance Score |
| Strategic Alignment | Alliance activities align closely with DuPont’s strategic objectives, supporting long-term collaboration. | 9/10 |
| Communication Flow | Communication with partners is effective, timely, and responsive, supporting project execution. | 9/10 |
| Outcome Monitoring | Outcome monitoring is good, supporting milestone achievement, but further quantification of performance is needed. | 8.5/10 |
- 4.
- Evaluation Results
- Screening and Identification: DuPont showed high strategic fit and processing speed, reflecting its structured scanning of emerging opportunities and market needs;
- Evaluation and Due Diligence: The firm’s use of risk assessments and structured project criteria led to strong scores in these phases, particularly in assessment clarity and alignment;
- Negotiation: Moderate scores were assigned due to limited data on negotiation adaptability, though agreement quality appeared strong;
- Alliance Management: DuPont’s emphasis on performance monitoring, communication, and long-term integration led to high scores in this phase.
- 5.
- Overall Performance Evaluation
Based on the performance evaluation model, DuPont’s business development activities achieve an overall performance score of 8.68/10, demonstrating strong results with areas for improvement. Key strengths and weaknesses are summarized below:
Strengths:
- High efficiency in the screening phase and strong alliance management capabilities;
- Negotiation outcomes effectively support mutual goals and value delivery.
Weaknesses:
- Risk transparency and analytical depth need further enhancement;
- Financial forecast accuracy requires more detailed data support;
- 6.
- Case Limitations
The empirical cases presented draw on secondary sources from existing literature. While these sources provide valuable insights into real-world business development practices, they do not always offer complete information across all six evaluation phases or indicators. As such, some indicator scores rely on inference rather than direct measurement. These limitations may affect the precision of individual evaluations but still allow the model to illustrate its broader applicability and logic.
- 7.
- Future Research Directions
Future research can further validate the performance evaluation model through:
- Expanding case studies: Analyzing business development activities of other companies or industries;
- Collecting quantitative data: Including metrics such as market growth rates and return on investment;
- Designing simulation scenarios: Testing the model’s applicability in diverse markets or contexts.
References
- Achtenhagen, L.; Ekberg, S.; Melander, A. Fostering Growth through Business Development: Core Activities and Challenges for Micro-Firm Entrepreneurs. J. Manag. Organ. 2017, 23, 167–185. [Google Scholar] [CrossRef]
- Roberts, E.B. New Ventures for Corporate Growth. Harv. Bus. Rev. 1980, 58, 134–142. [Google Scholar]
- Witthaut, D.; von Delft, S. New Business Development—Recognizing and Establishing New Business Opportunities. Bus. Chem. 2017, 14, 195–230. [Google Scholar]
- O’Brien, T.C.; Fadem, T.J. Identifying New Business Opportunities. Res.-Technol. Manag. 1999, 42, 15–19. [Google Scholar] [CrossRef]
- Cook, T.A. Mastering Global Business Development and Sales Management; CRC Press: Boca Raton, FL, USA, 2020. [Google Scholar]
- Eremina, A.R.; Bardadym, M.V.; Hurtova, N.V.; Zhadko, K.S.; Datsenko, V.V. Innovative Marketing Tools for Business Development in the Early Stages of the Crisis. SSRN 2020. https://ssrn.com/abstract=3572705.
- Kind, S.; zu Knyphausen-Aufseß, D. What Is “Business Development”?—The Case of Biotechnology. Schmalenbach Bus. Rev. 2007, 59, 176–199. [Google Scholar] [CrossRef]
- Zahra, S.A.; Kaul, A.; Bolívar-Ramos, M.T. Why Corporate Science Commercialization Fails: Integrating Diverse Perspectives. Acad. Manag. Perspect. 2018, 32, 156–176. [Google Scholar] [CrossRef]
- Cabral, J.J.; Deng, C.; Kumar, M.S. Internal Resource Allocation and External Alliance Activity of Diversified Firms. J. Manag. Stud. 2020, 57, 1690–1717. [Google Scholar] [CrossRef]
- Aalbers, R.; Dolfsma, W.; Leenders, R. Vertical and Horizontal Cross-Ties: Benefits of Cross-Hierarchy and Cross-Unit Ties for Innovative Projects. J. Prod. Innov. Manag. 2016, 33, 141–153. [Google Scholar] [CrossRef]
- Sørensen, H.E. Making Planning Work: Insights from Business Development. Int. J. Entrep. Innov. Manag. 2018, 22, 33–56. [Google Scholar] [CrossRef]
- Davis, C.H.; Sun, E. Business Development Capabilities in Information Technology SMEs in a Regional Economy: An Exploratory Study. J. Technol. Transf. 2006, 31, 145–161. [Google Scholar] [CrossRef]
- de Cros Peronard, J.P. An Integrated View on Managing Business Development in Organizations. J. Creat. Bus. Innov. 2022, 8, 5–23. [Google Scholar]
- Read, D.C.; Goss, R.C.; Hopkins, E. Strategic Business Development and Client Prospecting in the Third-Party Apartment Management Industry. Int. J. Strateg. Prop. Manag. 2017, 21, 346–356. [Google Scholar] [CrossRef]
- Giglierano, J.; Vitale, R.; McClatchy, J.J. Business Development in the Early Stages of Commercializing Disruptive Innovation: Considering the Implications of Moore’s Life Cycle Model and Christensen’s Model of Disruptive Innovation. Innov. Mark. 2011, 7, 29–39. [Google Scholar]
- Bäck, A.; Taipale-Erävala, K. Business Development in Growth-Oriented Microenterprises: Enhancing Innovation Capability. Int. J. Manag. Enterp. Dev. 2023, 22, 171–194. [Google Scholar] [CrossRef]
- Feilhauer, S.; Hahn, R. Firm–Nonprofit Collaboration: Explaining the Rationale Behind Firms’ Cross-Sector Partner Choices. Long Range Plan. 2021, 54, 101952. [Google Scholar] [CrossRef]
- Kukushkin, M.; Otto, T.; Howard, T.J. Value-Centric Business Development: Descriptive and Prescriptive Research into Five Different Companies. Proc. Est. Acad. Sci. 2015, 64, 543–557. [Google Scholar] [CrossRef]
- Wei, Y.M.; Lin, H.M. Revisiting Business Development: A Review, Reconceptualization, and Proposed Framework. Cogent Bus. Manag. 2024, 11, 2351475. [Google Scholar] [CrossRef]
- Vanhaverbeke, W.; Peeters, N. Embracing Innovation as Strategy: Corporate Venturing, Competence Building and Corporate Strategy Making. Creat. Innov. Manag. 2005, 14, 246–257. [Google Scholar] [CrossRef]
- Coulson-Thomas, C. Winning Business: Business Development Issues and Priorities. Strateg. Change 2001, 10, 37. [Google Scholar] [CrossRef]
- Ensslin, L.; Ensslin, S.; Dutra, A.; Longaray, A.; Dezem, V. Performance Assessment Model for Bank Client’s Services and Business Development Process: A Constructivist Proposal. Int. J. Appl. Decis. Sci. 2018, 11, 100–126. [Google Scholar] [CrossRef]
- Van de Vrande, V. Balancing Your Technology-Sourcing Portfolio: How Sourcing Mode Diversity Enhances Innovative Performance. Strateg. Manag. J. 2013, 34, 610–621. [Google Scholar] [CrossRef]
- Noda, T.; Bower, J.L. Strategy Making as Iterated Processes of Resource Allocation. Strateg. Manag. J. 1996, 17, 159–192. [Google Scholar] [CrossRef]
- Kolk, A.; Van Tulder, R.; Kostwinder, E. Business and Partnerships for Development. Eur. Manag. J. 2008, 26, 262–273. [Google Scholar] [CrossRef]
- Burgers, J.H.; Van Den Bosch, F.A.; Volberda, H.W. Why New Business Development Projects Fail: Coping with the Differences of Technological versus Market Knowledge. Long Range Plan. 2008, 41, 55–73. [Google Scholar] [CrossRef]
- La Rocca, A.; Perna, A.; Snehota, I.; Ciabuschi, F. The Role of Supplier Relationships in the Development of New Business Ventures. Ind. Mark. Manag. 2019, 80, 149–159. [Google Scholar] [CrossRef]
- Mittra, J. Life Science Innovation and the Restructuring of the Pharmaceutical Industry: Merger, Acquisition and Strategic Alliance Behaviour of Large Firms. Technol. Anal. Strateg. Manag. 2007, 19, 279–301. [Google Scholar] [CrossRef]
- McGrath, R.G. Exploratory Learning, Innovative Capacity, and Managerial Oversight. Acad. Manag. J. 2001, 44, 118–131. [Google Scholar] [CrossRef]
- Arvey, R.D.; Murphy, K.R. Performance Evaluation in Work Settings. Annu. Rev. Psychol. 1998, 49, 141–168. [Google Scholar] [CrossRef] [PubMed]
- Bower, D.C.; Finegan, A.D. New Approaches in Project Performance Evaluation Techniques. Int. J. Manag. Proj. Bus. 2009, 2, 435–444. [Google Scholar] [CrossRef]
- Forsman, H. Business Development Success in SMEs: A Case Study Approach. J. Small Bus. Enterp. Dev. 2008, 15, 606–622. [Google Scholar] [CrossRef]
- Ahmad, N.A.; Rasul, M.S.; Othman, N.; Jalaludin, N.A. Generating Entrepreneurial Ideas for Business Development. Sustainability 2022, 14, 4905. [Google Scholar] [CrossRef]
- Gadde, L.E.; Hjelmgren, D.; Skarp, F. Interactive Resource Development in New Business Relationships. J. Bus. Res. 2012, 65, 210–217. [Google Scholar] [CrossRef]
- Saaty, T.L. Analytic Hierarchy Process. In Encyclopedia of Operations Research and Management Science; Springer: Boston, MA, USA, 2013; pp. 52–64. [Google Scholar] [CrossRef]
- Van Rossum, G.; Drake Jr, F.L. Python Tutorial; Vol. 620, Centrum voor Wiskunde en Informatica: Amsterdam, The Netherlands, 1995. [Google Scholar]
- Lorenzi, V. Business Development and Opportunity Identification in Global Markets. In Proceedings of the 35th DRUID Celebration Conference, Barcelona, Spain, 17–19 June 2013. [Google Scholar]
- Mennillo, G.; Schlenzig, T.; Friedrich, E. (Eds.) Balanced Growth: Finding Strategies for Sustainable Development; Springer Science & Business Media: Berlin/Heidelberg, Germany, 2011. [Google Scholar]
- Furuya, H.; Inada, K.I. Balanced Growth and Intertemporal Efficiency in Capital Accumulation. Int. Econ. Rev. 1962, 3, 94–107. [Google Scholar] [CrossRef]
- Forman, E.H.; Gass, S.I. The Analytic Hierarchy Process—An Exposition. Oper. Res. 2001, 49, 469–486. [Google Scholar] [CrossRef]
- Saaty, T.L. Decision Making for Leaders: The Analytic Hierarchy Process for Decisions in a Complex World; RWS Publications: Pittsburgh, PA, USA, 2001. [Google Scholar]
- Carmines, E.G.; Zeller, R.A. Reliability and Validity Assessment; Sage Publications: Beverly Hills, CA, USA, 1979. [Google Scholar]
- Roberts, P.; Priest, H. Reliability and Validity in Research. Nurs. Stand. 2006, 20, 41–46. [Google Scholar] [CrossRef]
- Wei, Y.M. A Hybrid Multi-Criteria Decision-Making Framework for the Strategic Evaluation of Business Development Models. Information 2025, 16, 454. [Google Scholar] [CrossRef]
- Mahnke, V.; Venzin, M.; Zahra, S.A. Governing Entrepreneurial Opportunity Recognition in MNEs: Aligning Interests and Cognition under Uncertainty. J. Manag. Stud. 2007, 44, 1278–1298. [Google Scholar] [CrossRef]
- Bowonder, B.; Miyake, T. Globalization, Alliances, Diversification and Innovation: A Case Study from Hitachi Ltd. Creat. Innov. Manag. 1994, 3, 11–28. [Google Scholar] [CrossRef]
- Abdallah, C.; Langley, A. The Double Edge of Ambiguity in Strategic Planning. J. Manag. Stud. 2014, 51, 235–264. [Google Scholar] [CrossRef]
- Wiita, N.; Leonard, O. How the Most Successful Teams Bridge the Strategy Execution Gap. Harv. Bus. Rev. 2017, 23. [Google Scholar]
- Choi, E.; Lee, K.C. Relationship between Social Network Structure Dynamics and Innovation: Micro-Level Analyses of Virtual Cross-Functional Teams in a Multinational B2B Firm. Comput. Hum. Behav. 2016, 65, 151–162. [Google Scholar] [CrossRef]
- Giesecke, J. The Value of Partnerships: Building New Partnerships for Success. J. Libr. Adm. 2012, 52, 36–52. [Google Scholar] [CrossRef]
- Tallon, P.P. A Process-Oriented Perspective on the Alignment of Information Technology and Business Strategy. J. Manag. Inf. Syst. 2007, 24, 227–268. [Google Scholar] [CrossRef]
- Goyal, V.; Mishra, P. Evaluating Channel Partner’s Performance: Impact of Task Environments on the Relevance of Measurement Metrics. J. Bus. Ind. Mark. 2019, 34, 488–504. [Google Scholar] [CrossRef]
- Desai, R.; Patel, S. Analysing the Research Development in Green Finance: Performance Analysis and Directions for Future Research. FIIB Bus. Rev. 2025, 23197145241306838. [Google Scholar] [CrossRef]
- Johnsen, Å.; Vakkuri, J. Is There a Nordic Perspective on Public Sector Performance Measurement? Financ. Account. Manag. 2006, 22, 291–308. [Google Scholar] [CrossRef]
- Wong, K.Y.; Tan, L.P.; Lee, C.S.; Wong, W.P. Knowledge Management Performance Measurement: Measures, Approaches, Trends and Future Directions. Inf. Dev. 2015, 31, 239–257. [Google Scholar] [CrossRef]
- Barbato, G.; Turri, M. An Analysis of Methodologies, Incentives, and Effects of Performance Evaluation in Higher Education: The English Experience. In Governance and Performance Management in Public Universities: Current Research and Practice; Springer International Publishing: Cham, Switzerland, 2022; pp. 49–68. [Google Scholar] [CrossRef]
- Hollander, J. Improving Performance in Business Development: Genesis, a Tool for Product Development Teams; Ph.D. Thesis, Groningen University, Groningen, The Netherlands, 2002. [Google Scholar]
- Park, J.; Kim, J.; Sung, S.I. Performance Evaluation of Research and Business Development: A Case Study of Korean Public Organizations. Sustainability 2017, 9, 2297. [Google Scholar] [CrossRef]
- Harris, M.; Tayler, B. Don’t Let Metrics Undermine Your Business: An Obsession with the Numbers Can Sink Your Strategy. Harv. Bus. Rev. 2019, 97, 62–70. [Google Scholar]
- Manheim, D. Building Less-Flawed Metrics: Understanding and Creating Better Measurement and Incentive Systems. Patterns 2023, 4, 100842. [Google Scholar] [CrossRef]
- Fisher, N.I. Performance Measurement: Issues, Approaches, and Opportunities. Harv. Data Sci. Rev. 2021, 3, 1–29. [Google Scholar] [CrossRef]
- Van De Ven, M.; Machado, P.L.; Athanasopoulou, A.; Aysolmaz, B.; Türetken, O. Key Performance Indicators for Business Models: A Systematic Review and Catalog. Inf. Syst. E-Bus. Manag. 2023, 21, 753–794. [Google Scholar] [CrossRef]
- Mtau, T.T.; Rahul, N.A. Optimizing Business Performance through KPI Alignment: A Comprehensive Analysis of Key Performance Indicators and Strategic Objectives. Am. J. Ind. Bus. Manag. 2024, 14, 66–82. [Google Scholar] [CrossRef]
- Kotter, J. Strategic Management and Business Planning as a Basis for Establishing KPIs. In Key Performance Indicators: The Complete Guide to KPIs for Business Success; 2024; p. 160.
- Aithal, P.S.; Aithal, S. Key Performance Indicators (KPI) for Researchers at Different Levels and Strategies to Achieve It. Int. J. Manag. Technol. Soc. Sci. 2023, 8, 294–325. [Google Scholar] [CrossRef]
- Van De Ven, M.R.; Machado, P.L.; Athanasopoulou, A.; Aysolmaz, B.; Türetken, O. Key Performance Indicators for Business Models: A Review of Literature. In Proceedings of the 30th European Conference on Information Systems (ECIS 2022): New Horizons in Digitally United Societies, Timișoara, Romania, 18–24 June 2022; p. 126, AIS Electronic Library. [Google Scholar]
- Morgenshtern, O.; Fadil, T. Building One KPI to Rule Them All. MIT Sloan Manag. Rev. 2025, 66, 70–75. [Google Scholar]
- Chan, Y.C.L.; Lynn, B.E. Performance Evaluation and the Analytic Hierarchy Process. J. Manag. Account. Res. 1991, 3, 57–87. [Google Scholar]
- Lee, H.; Kwak, W.; Han, I. Developing a Business Performance Evaluation System: An Analytic Hierarchical Model. Eng. Econ. 1995, 40, 343–357. [Google Scholar] [CrossRef]
- Cheng, E.W.; Li, H. Analytic Hierarchy Process: An Approach to Determine Measures for Business Performance. Meas. Bus. Excell. 2001, 5, 30–37. [Google Scholar] [CrossRef]
- Yang, J.; Ping, S. Applying Analytic Hierarchy Process in Firm’s Overall Performance Evaluation: A Case Study in China. Multinatl. Bus. Rev. 2002, 10, 73–78. [Google Scholar]
- Zhang, J.; Tan, W. Research on the Performance Evaluation of Logistics Enterprise Based on the Analytic Hierarchy Process. Energy Procedia 2012, 14, 1618–1623. [Google Scholar] [CrossRef]
- Albayrak, E.; Erensal, Y.C. Using Analytic Hierarchy Process (AHP) to Improve Human Performance: An Application of Multiple Criteria Decision Making Problem. J. Intell. Manuf. 2004, 15, 491–503. [Google Scholar] [CrossRef]
- Bhagwat, R.; Sharma, M.K. Performance Measurement of Supply Chain Management Using the Analytical Hierarchy Process. Prod. Plan. Control 2007, 18, 666–680. [Google Scholar] [CrossRef]
- Yahya, S.; Kingsman, B. Vendor Rating for an Entrepreneur Development Programme: A Case Study Using the Analytic Hierarchy Process Method. J. Oper. Res. Soc. 1999, 50, 916–930. [Google Scholar] [CrossRef]
- Gurumurthy, A.; Kodali, R. An Application of Analytic Hierarchy Process for the Selection of a Methodology to Improve the Product Development Process. J. Model. Manag. 2012, 7, 97–121. [Google Scholar] [CrossRef]
- Van Horenbeek, A.; Pintelon, L. Development of a Maintenance Performance Measurement Framework Using the Analytic Network Process (ANP) for Maintenance Performance Indicator Selection. Omega 2014, 42, 33–46. [Google Scholar] [CrossRef]
- Zott, C. Dynamic Capabilities and the Emergence of Intraindustry Differential Firm Performance: Insights from a Simulation Study. Strateg. Manag. J. 2003, 24, 97–125. [Google Scholar] [CrossRef]
- Kasprzyk, J.R.; Nataraj, S.; Reed, P.M.; Lempert, R.J. Many Objective Robust Decision Making for Complex Environmental Systems Undergoing Change. Environ. Model. Softw. 2013, 42, 55–71. [Google Scholar] [CrossRef]
- Mazzarol, T.; Reboud, S. Screening Opportunities. In Commercialisation and Innovation Strategy in Small Firms: Learning to Manage Uncertainty; Springer: Singapore, 2022; pp. 145–195. [Google Scholar]
- Hamilton, H.R. Screening Business Development Opportunities. Bus. Horiz. 1974, 17, 13–24. [Google Scholar] [CrossRef]
- Friedrich, R.; Lee, J.S.; Salih, R.K.; Boni, A.A.; York, J.M. Life Science Case Examples Using the Quick Screen Tool for Opportunity Assessments. Am. J. Manag. 2024, 24, 82–96. [Google Scholar] [CrossRef]
- Boh, W.F.; Ravindran, T. Identifying Business Opportunities Through Innovation. Manuscript in Preparation, 2023.
- Gaglio, C.M.; Katz, J.A. The Psychological Basis of Opportunity Identification: Entrepreneurial Alertness. Small Bus. Econ. 2001, 16, 95–111. [Google Scholar] [CrossRef]
- Mills, D.A.; Siempelkamp, P. Identifying Significant New Business Opportunities. In The PDMA Handbook of New Product Development, 2nd ed.; Wiley: Hoboken, NJ, USA, 2012; pp. 167–180. [Google Scholar]
- Robben, H. Opportunity Identification. In Wiley International Encyclopedia of Marketing; Wiley: Hoboken, NJ, USA, 2010. [Google Scholar]
- Ardichvili, A.; Cardozo, R.; Ray, S. A Theory of Entrepreneurial Opportunity Identification and Development. J. Bus. Ventur. 2003, 18, 105–123. [Google Scholar] [CrossRef]
- Li, D.; Eden, L.; Hitt, M.A.; Ireland, R.D. Friends, Acquaintances, or Strangers? Partner Selection in R&D Alliances. Acad. Manag. J. 2008, 51, 315–334. [Google Scholar] [CrossRef]
- Hitt, M.A.; Dacin, M.T.; Levitas, E.; Arregle, J.L.; Borza, A. Partner Selection in Emerging and Developed Market Contexts: Resource-Based and Organizational Learning Perspectives. Acad. Manag. J. 2000, 43, 449–467. [Google Scholar] [CrossRef]
- Sun, Y.; Du, S.; Ding, Y. The Relationship between Slack Resources, Resource Bricolage, and Entrepreneurial Opportunity Identification—Based on Resource Opportunity Perspective. Sustainability 2020, 12, 1199. [Google Scholar] [CrossRef]
- Van Burg, E.; Podoynitsyna, K.; Beck, L.; Lommelen, T. Directive Deficiencies: How Resource Constraints Direct Opportunity Identification in SMEs. J. Prod. Innov. Manag. 2012, 29, 1000–1011. [Google Scholar] [CrossRef]
- Delen, D.; Ram, S. Research Challenges and Opportunities in Business Analytics. J. Bus. Anal. 2018, 1, 2–12. [Google Scholar] [CrossRef]
- Sedkaoui, S. How Data Analytics Is Changing Entrepreneurial Opportunities? Int. J. Innov. Sci. 2018, 10, 274–294. [Google Scholar] [CrossRef]
- Buntak, K.; Kovacic, M.; Sesar, V. The Importance of Identifying Opportunities and Risk in Ensuring Business Continuity. In Proceedings of the 46th International Scientific Conference on Economic and Social Development, Varazdin, Croatia, October 2019; p. 354. [Google Scholar]
- Paasi, J.; Valkokari, P.; Maijala, P.; Toivonen, S.; Luoma, T.; Molarius, R. Managing Opportunities, Risk and Uncertainties in New Business Creation—Working Report. VTT Publications 2008. [Google Scholar]
- Roelens, B.; Steenacker, W.; Poels, G. Realizing Strategic Fit within the Business Architecture: The Design of a Process-Goal Alignment Modeling and Analysis Technique. Softw. Syst. Model. 2019, 18, 631–662. [Google Scholar] [CrossRef]
- Aversano, L.; Grasso, C.; Tortorella, M. Goal-Driven Approach for Business/IT Alignment Evaluation. Procedia Technol. 2013, 9, 388–398. [Google Scholar] [CrossRef]
- Harvey, M.G.; Lusch, R.F. Expanding the Nature and Scope of Due Diligence. J. Bus. Ventur. 1995, 10, 5–21. [Google Scholar] [CrossRef]
- Lawrence, G.M. Due Diligence in Business Transactions; Law Journal Press: New York, NY, USA, 2024; Volume 629. [Google Scholar]
- Wangerin, D. M&A Due Diligence, Post-Acquisition Performance, and Financial Reporting for Business Combinations. Contemp. Account. Res. 2019, 36, 2344–2378. [Google Scholar] [CrossRef]
- Rosenbloom, A.H. (Ed.) Due Diligence for Global Deal Making: The Definitive Guide to Cross-Border Mergers and Acquisitions, Joint Ventures, Financings, and Strategic Alliances; John Wiley & Sons: Hoboken, NJ, USA, 2010. [Google Scholar]
- Morrison, N.J.; Kinley, G.; Ficery, K.L. Merger Deal Breakers: When Operational Due Diligence Exposes Risk. J. Bus. Strategy 2008, 29, 23–28. [Google Scholar] [CrossRef]
- Spedding, L.S. Due Diligence Handbook: Corporate Governance, Risk Management and Business Planning; Elsevier: Oxford, UK, 2009. [Google Scholar]
- Scanzoni, J.; Godwin, D.D. Negotiation Effectiveness and Acceptable Outcomes. Soc. Psychol. Q. 1990, 53, 239–251. [Google Scholar] [CrossRef]
- Fells, R.; Sheer, N. Effective Negotiation: From Research to Results; Cambridge University Press: Cambridge, UK, 2019. [Google Scholar]
- Druckman, D. The Situational Levers of Negotiating Flexibility. J. Confl. Resolut. 1993, 37, 236–276. [Google Scholar] [CrossRef]
- Druckman, D.; Druckman, J.N. Visibility and Negotiating Flexibility. J. Soc. Psychol. 1996, 136, 117–120. [Google Scholar] [CrossRef]
- Purdy, J.M. Negotiation Approaches: Claiming and Creating Value. In Negotiation Excellence: Successful Deal Making; Lee, K., Ed.; World Scientific: Singapore, 2011; pp. 57–77. [Google Scholar] [CrossRef]
- Falcão, H. Value Negotiation: How to Finally Get the Win-Win Right; FT Press: Upper Saddle River, NJ, USA, 2012. [Google Scholar]
- Kale, P.; Singh, H. Managing Strategic Alliances: What Do We Know Now, and Where Do We Go from Here? Acad. Manag. Perspect. 2009, 23, 45–62. [Google Scholar] [CrossRef]
- Ben Jemaa-Boubaya, K.; Cheriet, F.; Smida, A. Role of Objectives Alignment in Strategic Alliance Instability. Manag. Int. 2020, 24, 78–90. [Google Scholar] [CrossRef]
- Butler, C.J. Internal and Lateral Communication in Strategic Alliance Decision Making. Manag. Decis. 2010, 48, 698–712. [Google Scholar] [CrossRef]
- Franco, M.; Haase, H.; Rodrigues, M. The Role of Inter-Organisational Communication in the Performance of Strategic Alliances: A Relational Perspective. EuroMed J. Bus. 2024, in press. [Google Scholar] [CrossRef]
- Musarra, G.; Robson, M.J.; Katsikeas, C.S. The Influence of Desire for Control on Monitoring Decisions and Performance Outcomes in Strategic Alliances. Ind. Mark. Manag. 2016, 55, 10–21. [Google Scholar] [CrossRef]
- Tjemkes, B.; Vos, P.; Burgers, K. Strategic Alliance Management, 3rd ed.; Routledge: New York, NY, USA, 2023. [Google Scholar]
- Karol, R.A.; Loeser, R.C.; Tait, R.H. Better New Business Development at DuPont—I. Res.-Technol. Manag. 2002, 45, 24–30. [Google Scholar] [CrossRef]
- Karol, R.A.; Loeser, R.C.; Tait, R.H. Better New Business Development at DuPont—II. Res.-Technol. Manag. 2002, 45, 47–56. [Google Scholar] [CrossRef]
Figure 1.
Hierarchical structure of the business development performance evaluation model.
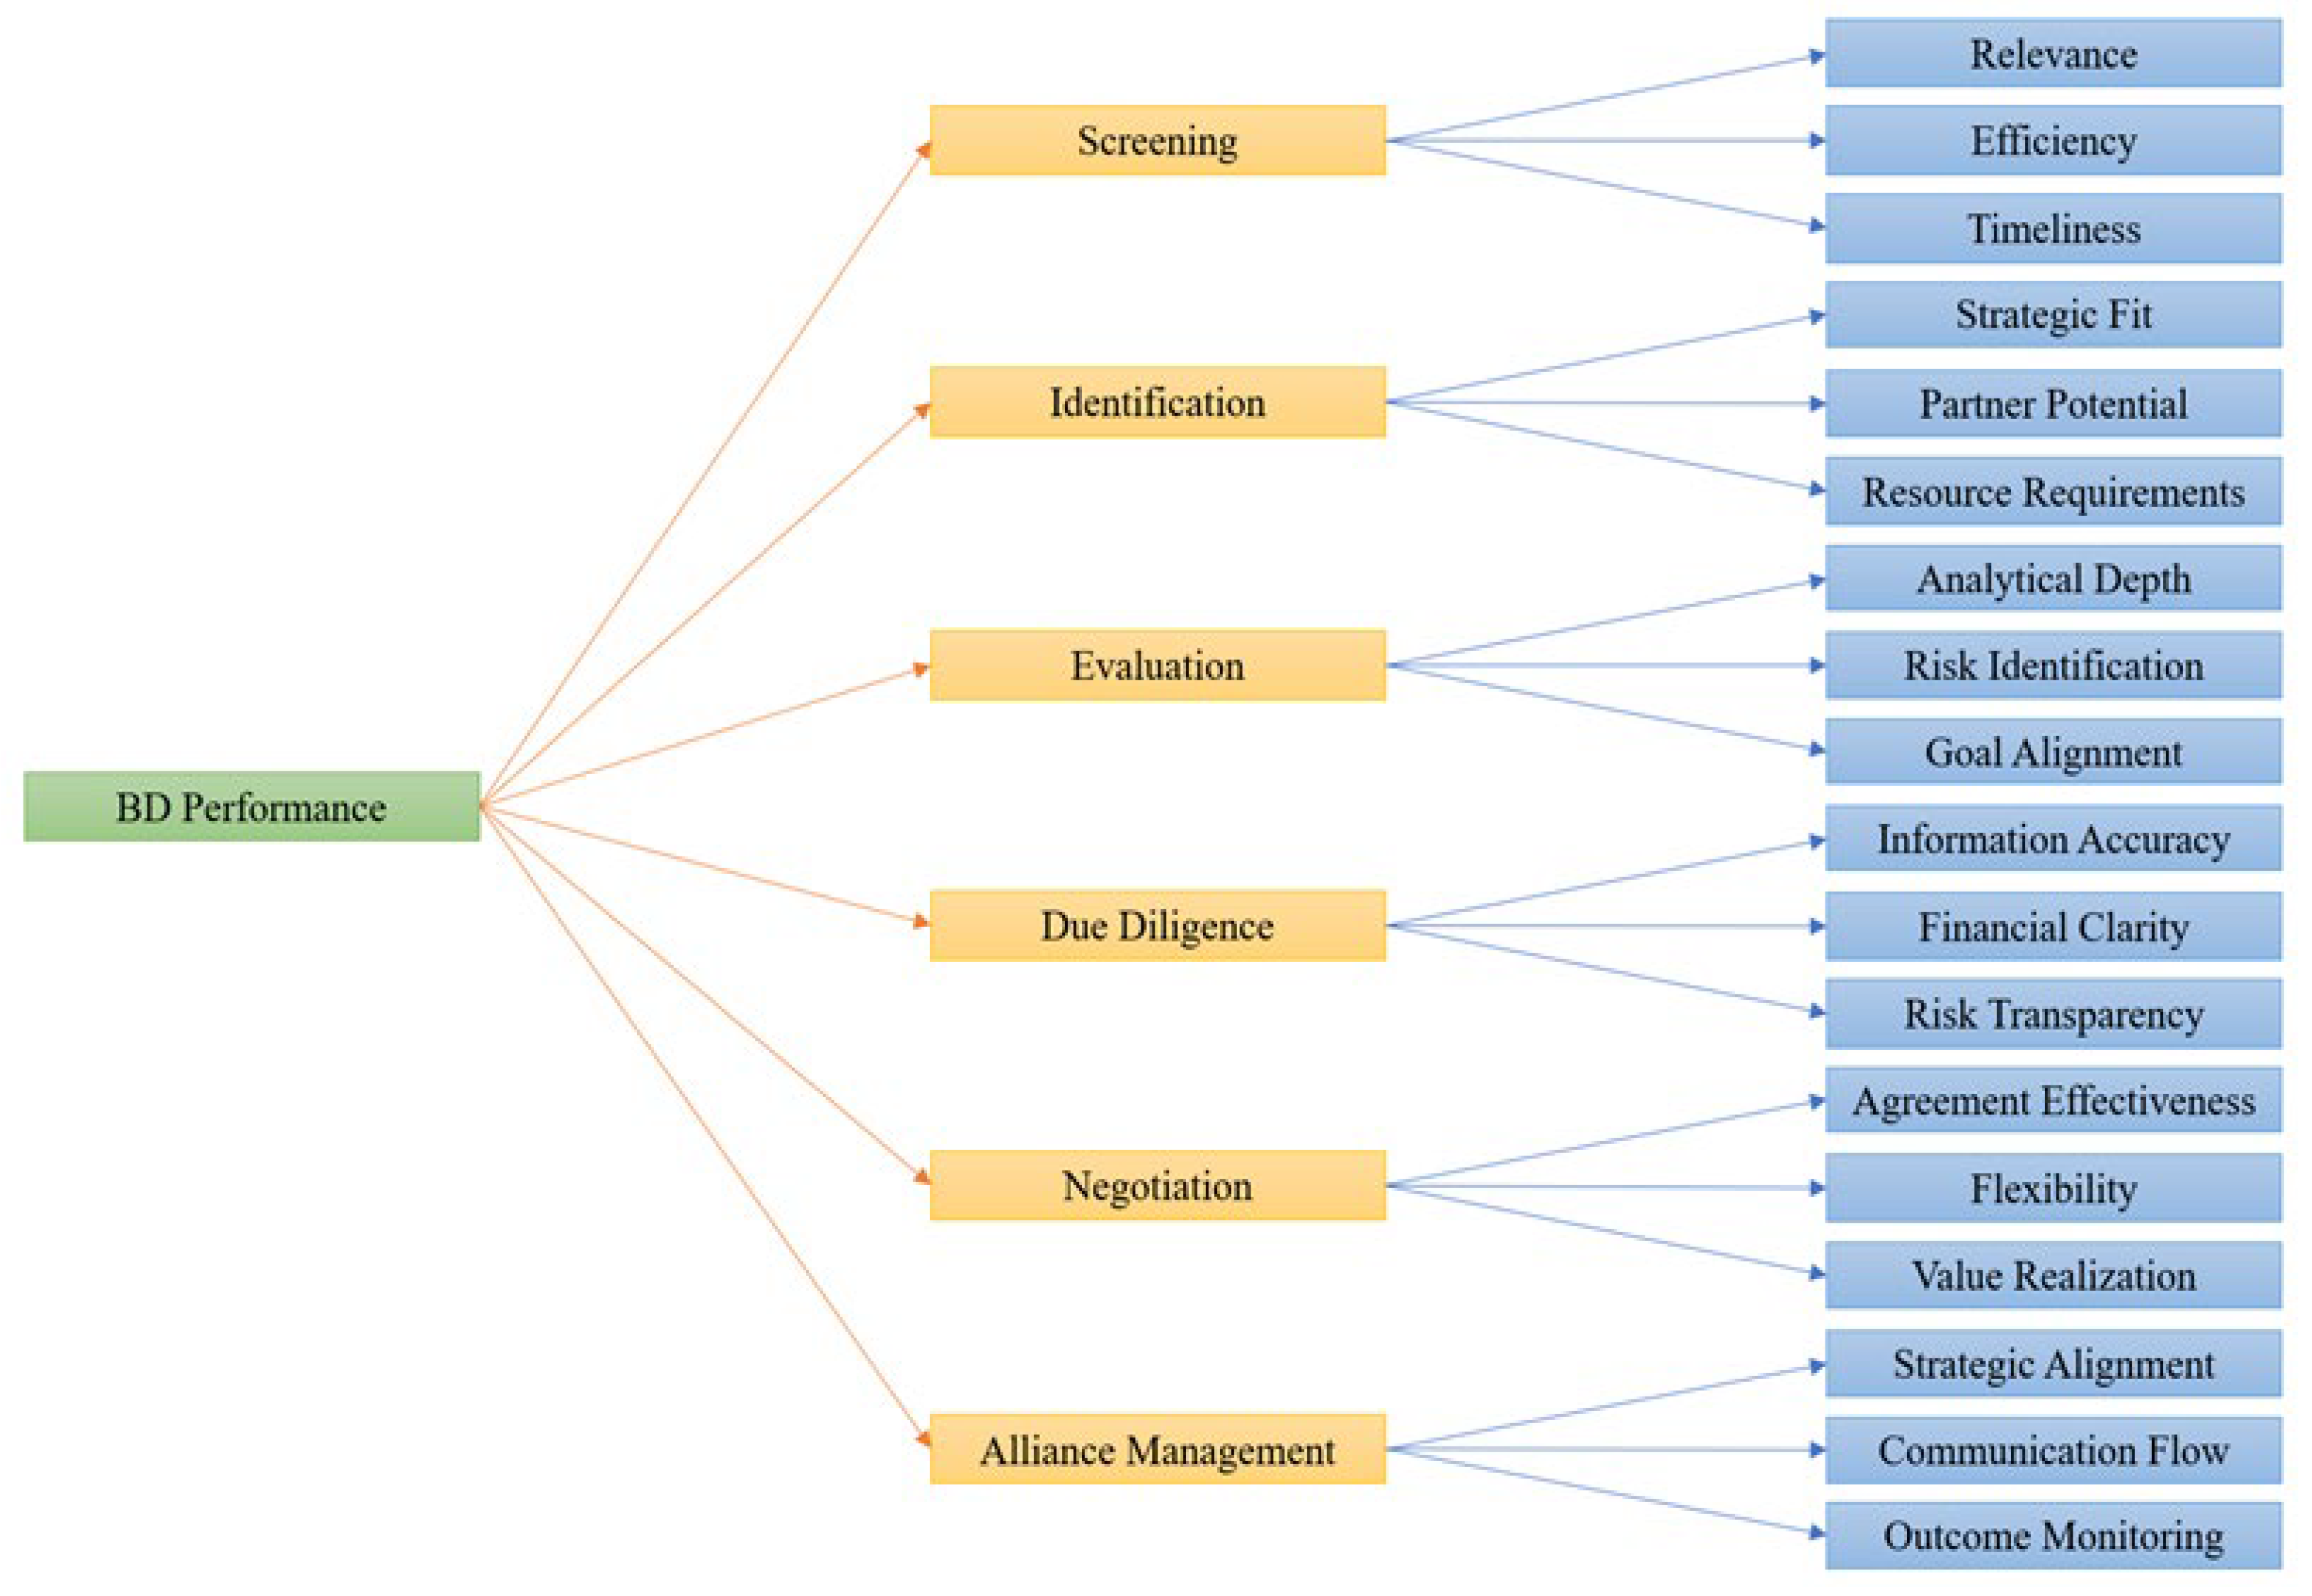
Figure 2.
Sensitivity and Robustness Analysis Results.
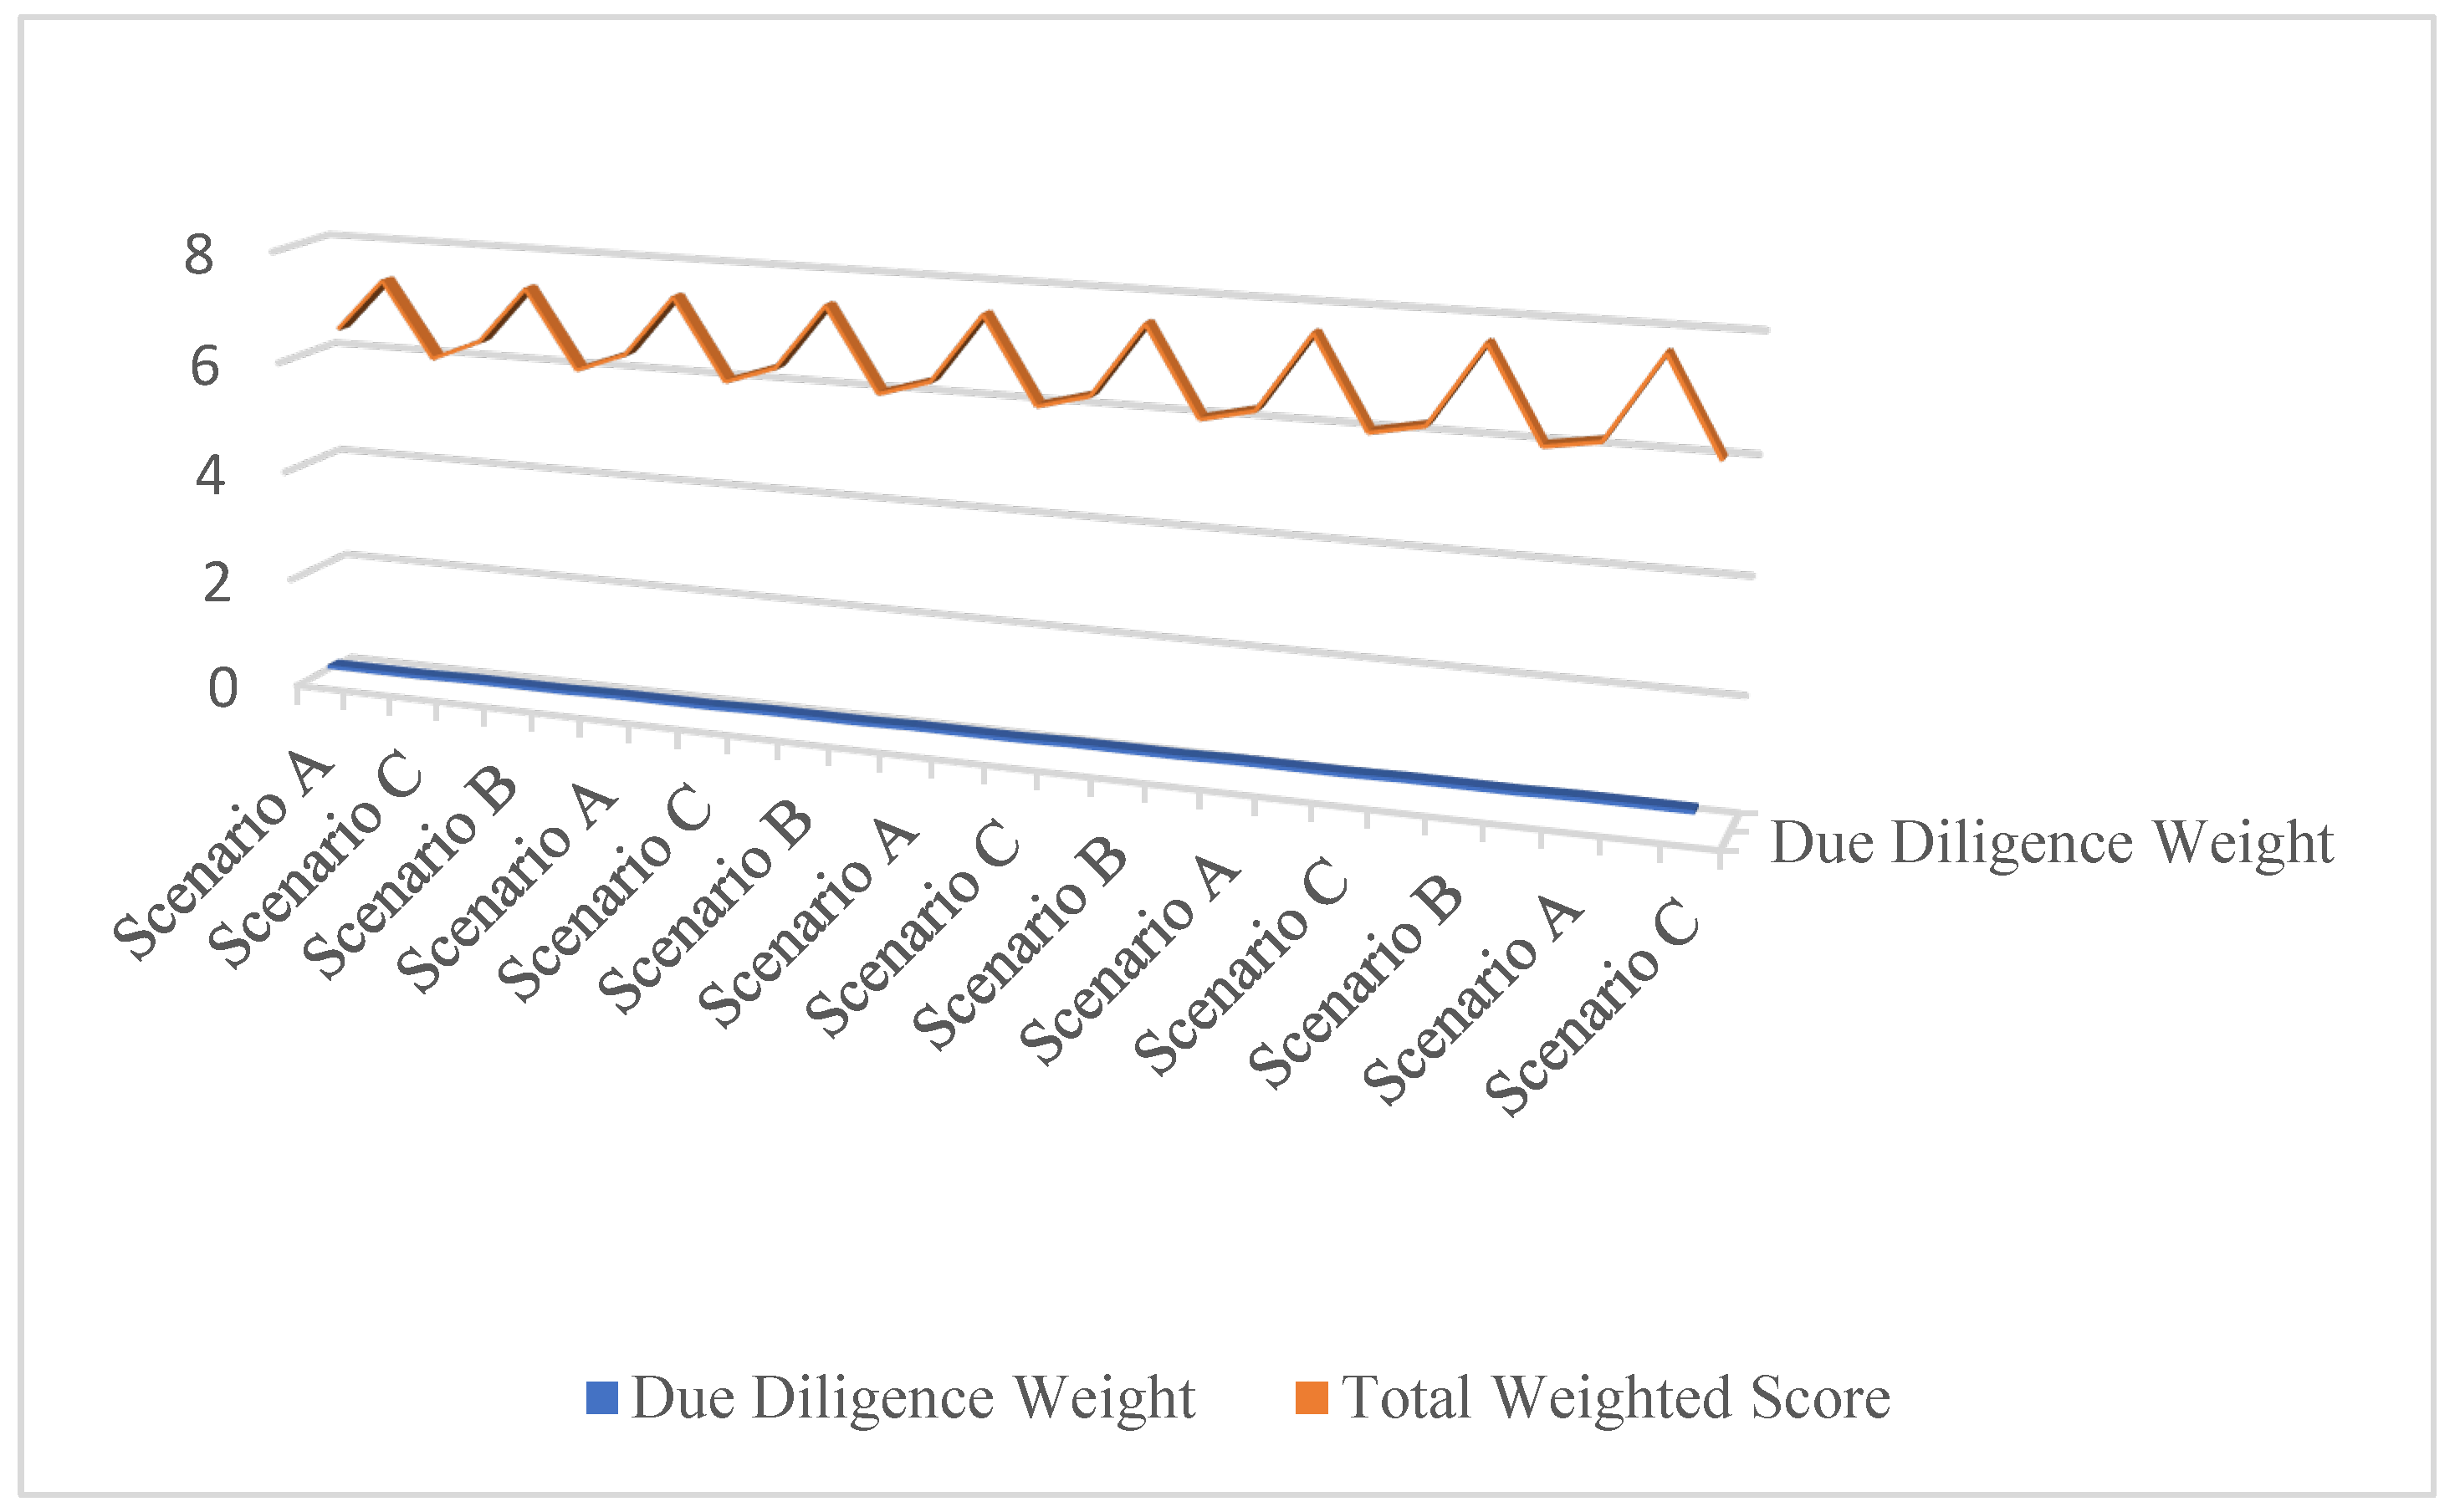

Table 1.
Comparison Between BD and General Performance Evaluation.
| Aspect | BD Performance Evaluation | General Performance Evaluation |
|---|---|---|
| Outcome Type | Strategic value, innovation, market growth | Output-based (sales, cost, delivery) |
| Time Frame | Long-term, delayed feedback | Short-term, regular cycles |
| Data Scope | Fragmented, often confidential | Structured and standardized |
| Goal Focus | Adaptive and learning-oriented | Fixed and KPI-driven |
| Functional Scope | Cross-departmental, shared accountability | Department-specific, clear roles |
Table 2.
Challenges in Evaluating Business Development Performance.
| Challenge | Description |
|---|---|
| No Standard Metrics | Absence of shared benchmarks across firms limits comparability. |
| Subjective Judgment | Limited data lead to dependence on opinion, reducing reliability. |
| Complex Impact | External and internal factors obscure causal links. |
| Slow Feedback | Long timelines weaken adjustment opportunities. |
| Intangible Results | Outcomes like trust and strategic fit resist clear measurement. |
Table 3.
Phases and evaluation indicators of business development process.
| Phases | Indicators | Description | Representative Literature |
|---|---|---|---|
| Screening | Relevance | Relevance measures the degree of alignment between a potential opportunity and the organization’s strategic goals. A relevant opportunity supports long-term growth, fits the firm’s market position, and reflects existing priorities in innovation, scale, or capability. | [80,81] |
| Efficiency | Efficiency evaluates the resource use and procedural clarity in identifying and filtering opportunities. This includes time, effort, and information handling required to reach a decision point without unnecessary delay or duplication. | [82,83] | |
| Timeliness | Timeliness measures whether the process concludes within a window that provides a time advantage over competitors or market changes. A timely process ensures readiness to proceed without delay or missed openings. | [84,85] | |
| Identification | Strategic Fit | Strategic fit evaluates the alignment between the potential partner’s capabilities and the organization’s long-term goals. It considers factors such as market position, technological compatibility, and alignment in values or strategic intent. | [86,87] |
| Partner Potential | Partner potential measures the future value the candidate can contribute to the collaboration. It focuses on growth capacity, innovation strength, and the ability to support joint objectives over time. | [88,89] | |
| Resource Requirements | Resource requirements assess input demands the partnership places on the organization, including capital, staff, and infrastructure. This category includes financial investment, staffing, technology integration, and operational support necessary for successful engagement. | [90,91] | |
| Evaluation | Analytical Depth | Analytical depth examines the extent of evaluation based on financial, strategic, operational, and market data. A high-quality evaluation investigates core assumptions, performance drivers, and potential outcomes based on evidence. | [92,93] |
| Risk Identification | Risk identification captures the extent to which the analysis reveals potential threats to success. This category includes legal, financial, operational, and reputational risks that could hinder implementation or long-term value. | [94,95] | |
| Goal Alignment | Goal alignment evaluates the strength of support the opportunity provides for strategic and operational objectives. It confirms that intended outcomes match the firm’s mission, current capabilities, and future direction. | [96,97] | |
| Due Diligence | Information Accuracy | Information accuracy measures the reliability and completeness of data collected during investigation. It confirms that verified inputs and consistent documentation support the opportunity. | [98,99] |
| Financial Clarity | Financial clarity evaluates the transparency and structure of financial data provided by the prospective partner. It includes revenue streams, cost structure, debt levels, and valuation assumptions. | [100,101] | |
| Risk Transparency | Risk transparency captures the strength of threat identification across legal, operational, market, and compliance areas. It helps decision-makers act with full awareness of potential exposure. | [102,103] | |
| Negotiation | Agreement Effectiveness | Agreement effectiveness measures the strength of alignment between negotiated terms and strategic goals. It reflects clarity in roles and supports reduction of ambiguity. A strong agreement creates clear commitments that enable implementation without delays or disputes. | [104,105] |
| Flexibility | Flexibility evaluates the capacity of the agreement to accommodate future change. It accounts for adjustment mechanisms that address shifts in scope, timeline, or resources while preserving mutual benefit. | [106,107] | |
| Value Realization | Value realization assesses how much the negotiated outcome contributes to expected benefits. This includes direct returns, strategic advantage, and synergy captured through the terms of the deal. | [108,109] | |
| Alliance Management | Strategic Alignment | Strategic alignment measures consistency between alliance activities and the organization’s long-term goals. It tracks whether the partnership continues to support shared direction and business intent. | [110,111] |
| Communication Flow | Communication flow evaluates the precision and consistency of information exchange within the alliance. It includes message accuracy, feedback mechanisms, and access to relevant updates that support coordination. | [112,113] | |
| Outcome Monitoring | Outcome monitoring assesses progress against defined objectives throughout the alliance lifecycle. It focuses on performance tracking, issue identification, and timely response to deviations from expected results. | [114,115] |
Table 4.
Table 4. A Pairwise Comparison Matrix Using Saaty Scale.
| Due Diligence | Evaluation | Alliance Management | Negotiation | Identification | Screening | |
|---|---|---|---|---|---|---|
| Due Diligence | 1 | 2 | 4 | 5 | 7 | 9 |
| Evaluation | 1/2 | 1 | 3 | 4 | 6 | 8 |
| Alliance Management | 1/4 | 1/3 | 1 | 2 | 4 | 6 |
| Negotiation | 1/5 | 1/4 | 1/2 | 1 | 3 | 5 |
| Identification | 1/7 | 1/6 | 1/4 | 1/3 | 1 | 3 |
| Screening | 1/9 | 1/8 | 1/6 | 1/5 | 1/3 | 1 |
Table 5.
A Pairwise Comparison Matrix Using Saaty Scale.
| Due Diligence | Evaluation | Alliance Management | Negotiation | Identification | Screening | |
|---|---|---|---|---|---|---|
| Due Diligence | 0.453727 | 0.516129 | 0.448598 | 0.398936 | 0.328125 | 0.28125 |
| Evaluation | 0.226864 | 0.258065 | 0.336449 | 0.319149 | 0.28125 | 0.25 |
| Alliance Management | 0.113432 | 0.086022 | 0.11215 | 0.159574 | 0.1875 | 0.1875 |
| Negotiation | 0.090745 | 0.064516 | 0.056075 | 0.079787 | 0.140625 | 0.15625 |
| Identification | 0.064818 | 0.043011 | 0.028037 | 0.026596 | 0.046875 | 0.09375 |
| Screening | 0.050414 | 0.032258 | 0.018692 | 0.015957 | 0.015625 | 0.03125 |
Table 6.
Weight of Each Phase.
| Phase | Weight (Priority Vector) |
|---|---|
| Due Diligence | 0.40446090 |
| Evaluation | 0.27862927 |
| Alliance Management | 0.14102955 |
| Negotiation | 0.09799976 |
| Identification | 0.05051450 |
| Screening | 0.02736603 |
Table 7.
Consistency Test Results.
| Metric | Value |
|---|---|
| λmax | 6.275 |
| Consistency Index (CI) | 0.055 |
| Random Index (RI) | 1.240 |
| Consistency Ratio (CR) | 0.044 |
Table 8.
Empirical Simulation Results.
| Phase | Score | Weighted | |||||
|---|---|---|---|---|---|---|---|
| Scenario A | Scenario B | Scenario C | Scenario A | Scenario B | Scenario C | ||
| Screening | 7 | 5 | 6 | 0.191562 | 0.13683 | 0.164196 | |
| Identification | 8.666667 | 5.666667 | 6 | 0.437792 | 0.286249 | 0.303087 | |
| Evaluation | 5.666667 | 8.333333 | 6 | 1.578899 | 2.32191 | 1.671776 | |
| Due Diligence | 5.333333 | 8.666667 | 6 | 2.157125 | 3.505328 | 2.426765 | |
| Negotiation | 7 | 5.666667 | 6 | 0.685998 | 0.555332 | 0.587999 | |
| Alliance Management | 8.666667 | 5 | 6 | 1.222256 | 0.705148 | 0.846177 | |
| Total | 7.055556 | 6.388889 | 6 | 6.273633 | 7.510797 | 6 | |
Disclaimer/Publisher’s Note: The statements, opinions and data contained in all publications are solely those of the individual author(s) and contributor(s) and not of MDPI and/or the editor(s). MDPI and/or the editor(s) disclaim responsibility for any injury to people or property resulting from any ideas, methods, instructions or products referred to in the content. |
© 2025 by the authors. Licensee MDPI, Basel, Switzerland. This article is an open access article distributed under the terms and conditions of the Creative Commons Attribution (CC BY) license (http://creativecommons.org/licenses/by/4.0/).
Copyright: This open access article is published under a Creative Commons CC BY 4.0 license, which permit the free download, distribution, and reuse, provided that the author and preprint are cited in any reuse.


