Submitted:
09 April 2025
Posted:
10 April 2025
You are already at the latest version
Abstract
A non-contact fall detection system, which integrates 4D imaging radar sensors with arti-ficial intelligence (AI) technology, is proposed to monitor fall accidents among the elderly. Existing wearable devices may cause discomfort during use, and camera-based systems raise privacy concerns. The solution developed in this study addresses these issues by adopting 4D radar sensors. The radar sensors generate Point Cloud data to enable the system to analyze the positions and postures of the body. Using a CNN model, these pos-tures are classified into standing, sitting, and lying, while criteria based on changes in the speed and position distinguish between falls and slow-lying movements. The Point Cloud data were normalized and organized using zero padding and k-means clustering to en-hance the learning efficiency. The proposed model achieved 98.66% accuracy in posture classification and 95% in fall detection. The monitoring system provides real-time visual representations through a web-based dashboard and Unity-based 3D avatars, along with immediate alerts in case of a fall. In conclusion, this study demonstrates the effectiveness of real-time fall detection technology and highlights the need for further research on mul-ti-sensor integration and application in various indoor environments.
Keywords:
4D Imaging radar sensor
; CNN
; Point Cloud
; Fall detection
; Elderly safety
1. Introduction
The growth in the aging population as a result of declining birth rates and advancements in medical technology has led to an increase in single-person elderly households. These demographic changes significantly impact the economy, social welfare, housing conditions, and labor markets, and necessitate new policy and technological approaches. Particularly, factors such as spousal loss, children's independence, and the pursuit of autonomy contribute to the rising trend of single-person elderly households, which, while enabling independent lifestyles, also raise concerns about vulnerability during emergencies [1].
Health issues in older adults, including reduced muscle strength, impaired balance, weakened vision, and conditions such as arthritis, are major contributors to falls. These falls can result in severe injuries, decreased mobility, and mental health challenges. Therefore, the prevention and management of falls have emerged as critical factors in maintaining and improving the quality of life for the elderly [2,3,4,5].
The demand for technological solutions to ensure the safety and enhance the quality of life for older adults is growing. In particular, smart healthcare services that monitor the safety of the elderly and provide immediate responses in the event of falls are becoming a key area of research. These services leverage advanced technologies and monitoring systems to manage safety in real time, respond promptly to emergencies, improve the quality of life, and reduce the cost to society [6,7].
Traditional fall detection methods are divided into contact-based and non-contact-based approaches. Wearable devices, which are a contact-based solution, can monitor biometric data but are often criticized for discomfort and user resistance. Also, non-contact camera-based methods eliminate the discomfort associated with wearable devices but raise concerns regarding privacy intrusion, blind spots, and detection limitations in environments with poor visibility [8,9,10,11,12].
To overcome these limitations, this study proposes a novel approach that entails the use of radar sensors. These sensors emit high-frequency signals and analyze the reflected signals to detect the target's position, speed, and movement. Radar sensors are non-contact devices that can detect location, speed, motion, and Doppler power while preserving the target’s privacy and ensuring stable performance across various environments [13].
By leveraging the spatial invariance of CNNs(Convolutional Neural Networks), it is possible to effectively classify postures observed from various angles and positions, which makes these networks suitable for analyzing patterns of body movements in three-dimensional data [14]. The inherent characteristics of CNNs allow consistent classification of human postures observed from diverse perspectives. By integrating radar sensors and CNN-based AI models, this developed a fall detection monitoring system that contributes to the safety and quality of life of older adults. Here, we propose a method for classifying postures and detecting falls using CNNs based on spatial coordinate data obtained from radar sensors.
2. Materials and Methods
2.1. Experimental Setup
In this study, we utilized the Retina-4sn radar from Smart Radar System, operating within a frequency range of 77–81 GHz. This sensor provides high-resolution 4D imaging and measures the position, velocity, size, and height of the target. The radar was installed at a height of 2 meters to optimize signal reception and minimize interference, with the experimental setup designed to cover a detection range of 7m × 7m. The azimuth and elevation angles were configured at 90° (±45°) to enable objects’ contours to be monitored across a wide range of angles both vertically and horizontally. With a rapid data update rate of 50ms, the radar is capable of processing multiple frames per second, ensuring real-time responsiveness in dynamic environments. The experimental environment was optimized to collect diverse posture data, considering installation height, direction, and tilt for stable measurements.
The 4D imaging radar generates Point Cloud data by detecting and analyzing object movements, and representing them as points in three-dimensional virtual space. These data visually express the location and shape of objects, which enhances the analytical efficiency and supports precise spatial interpretation.
A systematic data collection environment for Point Cloud data was designed to develop an AI model for human posture classification. The experimental setup emphasized optimizing the installation height, direction, tilt, and measurement space to reflect real-world application conditions.
As shown in Figure 1, the radar was installed at the manufacturer-recommended height of 2 meters to optimize the signal reception angle and minimize interference from obstacles. The radar was aligned frontally to precisely measure the target's movement and reduce interference. Additionally, the tilt was set at −45° to ensure that the target was positioned at the center of the radar detection range. This facilitated reliable data acquisition for movements at ground level such as lying postures. This configuration enabled the stable collection of various postural changes, thereby maximizing the efficiency and performance of AI model training. These settings align with the optimal tilt angle range (30°–60°) reported in previous studies, further reinforcing the reliability of the experimental design [15].
2.2. Point Cloud Data Collection
In this study, Point Cloud data, representing a three-dimensional virtual space for detecting and analyzing object movements, were collected within a range of 3m on both sides and 7m forward to capture diverse postures. To optimize data quality, the environment was configured without obstacles to accurately capture target movements and minimize interference from external factors.
The experimental results showed that data stability decreased beyond a range of 2.5m on either side. The detection distance was increased incrementally from 1m to 7m in intervals of 1m, and the number and density of points in the Point Cloud data were quantified. The characteristics identified from the experimental results presented in Table 1 are as follows.
Within the 1–3m range, 700–1500 points were detected per frame and this was sufficient to maintain uniform data distribution and high density. In particular, the 2–3m range exhibited the highest precision and stability, making it the optimal distance for capturing detailed movements such as posture classification. Unfortunately, at a distance of 1m, despite the high number and density of points, lower-body data were frequently lost. In the 4–5m range, point intervals became irregular, and the density gradually decreased, whereas, beyond 6m, the data quality sharply declined.
These experimental results clearly demonstrate that the distance between the target and the radar directly impacts the quality and reliability of the Point Cloud data. Therefore, setting an appropriate detection range is essential for collecting reliable data.
The data collected in this study provided a stable foundation for securing high-quality training datasets, which were used to maximize the performance of the AI model.
In this study, posture data were classified into three categories: standing, sitting, and lying down, as presented in Table 2, when using the Point Cloud for AI training. Point Cloud data for the three categories were collected from the front, back, right, and left directions to minimize potential body occlusion effects. Irregular or unclear movements were included in the unknown category to maintain data quality and improve the accuracy of the model. Irregular or unclear movements were included in the unknown category to maintain data quality and improve the accuracy of the model.
The standing posture included both standing still and walking movements, with static and dynamic movement data collected. The sitting posture was based on the state of sitting on a chair and included not only stable postures but also subtle movements. The lying down posture was based on the state of lying down on a chair, with data collection including the process of lying down slowly. This can be used to distinguish between abrupt falls and natural lying motions.
The radar system processed data at 30 frames per second, and approximately 1,500 frames were collected for each posture by capturing data for 50 seconds per posture. Data integrity was maintained by classifying ambiguous postures into the unknown category. This approach to dataset construction was designed to precisely classify posture data by minimizing false positives and missed detections. Data were captured in various environments and under various conditions to ensure that the AI model maintains high reliability and accuracy in real-world applications. This is expected to enhance the effectiveness of radar-based posture analysis systems and contribute to their applicability in practical use cases.
2.3. Point Cloud Data Preprocessing
Successful training of the AI model requires the Point Cloud data collected from the radar sensors to be systematically preprocessed. Point Cloud data contain high-dimensional and complex information, including information about the position, velocity, time, and Doppler power. Using these raw data as direct input into AI models can lead to issues such as overfitting or reduced learning efficiency. Therefore, preprocessing is necessary to remove noise, extract the key information required by the learning model, and optimize the performance and stability.
In this study, preprocessing focused on spatial position information directly related to posture classification within the Point Cloud data. This approach removed unnecessary information to enhance the data processing speed, ensure real-time performance, and improve the processing efficiency of the model. Simplifying the data lowers the computational cost and model complexity while maximizing accuracy and practicality.
The number of samples generated in Point Cloud data varies depending on the target's actions and movements. For example, rapidly moving targets generate more points, while static targets result in fewer points. This data imbalance could render the input data less consistent and would negatively affect the learning performance. To address this issue, normalization and balance adjustment processes were implemented to improve the quality of the training data to enable the model to operate more reliably across diverse behavioral patterns.
The data were collected over 50 seconds, resulting in 1,500 frames, with the number of points per frame (N) ranging from 200 to 1,500 (Table 1). Considering that the data used as input for deep learning models must maintain a consistent size, frames with varying lengths were normalized to N=500. Frames with fewer than 500 points (N≤500) were padded with zeros using the back-padding technique by filling the missing portions with the value "0" without introducing artificial values. The point (0, 0, 0) in the three-dimensional space has clearly distinguishable spatial characteristics and does not have a significant negative impact on model training, so no further post-processing is performed after zero padding.
This method maintained consistency in the input data and improved the learning efficiency. Consequently, Point Cloud data with varying lengths were transformed to ensure they were suitable for deep learning models, particularly to enhance the stability and performance during training and inference.
Frames with N>500 were processed using the K-means clustering algorithm, as shown in Figure 2. The data were divided into k=500 clusters, and new Point Cloud data were generated using the centroid of each cluster. This effectively eliminated excessive data while retaining key spatial features [16].
As shown in Figure 2, before the application of K-means clustering, the original Point Cloud data were irregularly distributed, and this could adversely affect the learning efficiency of AI models. However, as demonstrated in Figure 2, the Point Cloud data (N=500) generated after clustering effectively preserved the primary spatial features of the original data and reduced irregularity. This improvement is expected to further enhance the stability and performance of the learning model.
Radar signals may distort the data sequence during the collection process due to factors such as the time required for the signal to complete a round-trip, movement of the target, and changes in the distance to the radar equipment. Particularly, data sequences collected from subtle body movements or rotations may appear random and could potentially degrade the performance of location-pattern learning models such as CNNs. This issue was addressed by applying a systematic data sorting method. The reconstruction of data sequences to ensure consistency enhances the ability of the learning model to efficiently learn patterns. Ultimately, this improves the model training performance and prediction accuracy. The Point Cloud data in each frame are expressed as coordinate values in 3D space, (xi, yi, zi), represented as pi=(xi, yi, zi), i=1, 2, … , N. To systematically sort these data, an ascending order sorting method, as shown in Equation 1, was applied to the Point Cloud data pi [17].
Equation 1 defines the lexicographical order between two vectors (xa, ya, za) and (xb, yb, zb). This order establishes a rule to determine whether one vector is "smaller" or "greater" than the other. If the first coordinate xa < xb, then (xa, ya, za) is considered "smaller." If xa = xb, the data are sorted based on ya < yb. Lastly, if xa = xb and ya = yb, the data are sorted based on za < zb. The sorting criteria involve sorting all points in the ascending order of their x-coordinates first. For points with identical x-coordinates, they are further sorted in ascending order of their y-coordinates. Finally, for points with identical x- and y-coordinates, sorting is conducted in the ascending order of their z-coordinates.
This sorting process is illustrated through the pre-sorted state and the post-sorted state in Table 3. During this process, the actual distances or relative positions between the points remain unchanged, and only the order in which the data are input is rearranged.
This sorting method systematically organizes the sequence of Point Cloud data to ensure consistency in the input order for the CNN model. This allows the model to effectively learn patterns and maximize its performance.
2.4. Design of the Artificial Intelligence
In this study, the CNN architecture was designed to classify three postures (Standing, Sitting, Lying) for fall detection, as illustrated in Figure 3. This CNN architecture effectively learns the complex spatial features of Point Cloud data to achieve high classification accuracy [14].
In the preprocessing stage, techniques such as zero padding and K-means clustering were used to normalize and balance the Point Cloud data to lower the amount of noise and establish a stable learning environment. This process transforms the input data into a form suitable for CNN training.
In the feature extraction stage, the Point Cloud data were mapped into a 2D array, followed by two stages of 2D convolution layers for progressive feature learning. The first convolution layer used 16 channels to capture basic positional and spatial features, while the second layer used 64 channels to learn more abstract and complex features. Each convolution layer employed the Leaky ReLU activation function to handle negative values effectively, and pooling layers reduced the amount of data while retaining essential information to enhance the computational efficiency.
In the classification stage, the extracted features were transformed into a 1D vector through a Flatten layer, and posture classification was performed using a fully connected layer. During this process, Dropout (0.5) was applied to randomly deactivate some neurons during training, thereby serving to lower the dependency on specific neurons and prevent overfitting. Finally, the output layer, with a Softmax activation function, provided the predicted probabilities for the three classes: Standing, Sitting, and Lying.
The data sorting and normalization techniques applied in this study eliminated randomness in Point Cloud data and maintained a consistent input structure. This contributed to securing the stability needed for the learning model to effectively learn patterns to maximize its performance.
2.5. Comparative Analysis of Fall Detection
To effectively detect falls, the establishment of clear criteria that distinguish between normal, slow-lying movements and falls is essential. During a fall, the height (zmax) of the body part farthest from the ground (the crown of the head) and the velocity change at this height are prominent features for identification. This study proposes a method for differentiating between the movements of lying down slowly and falling by analyzing and comparing the zmax values and velocity changes of zmax.
Figure 4 illustrates that during movement that involves lying down slowly (standing → lowering posture (A) → sitting (B) → leaning the upper body forward (C) → lying down), the zmax value gradually decreases over time. In the "standing → lowering posture → sitting" segment (B), zmax decreases consistently, whereas, in the "sitting → leaning the upper body forward" segment (C), an intentional posture adjustment to maintain body stability causes zmax to momentarily increase before decreasing again. This pattern indicates that the body maintains its balance in a controlled manner during the process of lying down slowly.
In contrast, Figure 4 shows that during a fall, zmax decreases abruptly without intermediate stages and this movement is characterized by significant fluctuations. Because falls occur in an uncontrolled manner, the body rapidly approaches the ground within a short time, resulting in this characteristic pattern. The sudden, sharp changes in zmax during a fall distinctly differ from the gradual changes observed for movement when lying down normally. These differences make the zmax value an effective indicator for distinguishing between normal movements and falls.
Additionally, Figure 5 compares the velocity changes at zmax between movement that involves lying down slowly and falling. In Figure 5, during the process of lying down slowly, the velocity of zmax exhibits a relatively gradual and consistent pattern over several hundred frames. In contrast, when a fall occurs, the velocity of zmax changes rapidly and irregularly within a very short period of time. This velocity pattern reflects the involuntary and uncontrolled nature of falls and serves as a critical criterion for distinguishing between movements associated with lying down slowly and falling.
This study quantitatively analyzed the changes in zmax and velocity at zmax to propose clear criteria for differentiating between movement when lying down slowly and movement when falling. This analysis contributes to improving the accuracy of real-time fall detection systems and provides a foundation for efficient application in various real-life scenarios.
3. Principal Result
3.1. Performance Analysis and Evaluation of the Posture Classification Model
The performance of the CNN model that was used for classifying the three postures (Standing, Sitting, Lying) was optimized for fall detection using 5-fold cross-validation. Figure 6 visually illustrates the 5-fold cross-validation process and the performance evaluation results for each iteration.
The 5-fold cross-validation process involves dividing the data into five folds, using one fold (black) as the test set and the remaining four folds (gray) as the training set during each iterative cycle. The test fold is rotated cyclically across iterations to ensure that each fold is used once as test data. This method reduces the biases caused by data splitting, measures the average performance and stability of the CNN model, and effectively evaluates its generalization capability across diverse data distributions.
As shown in Figure 6, the test fold was rotated over five iterations, and the test accuracy of the CNN model was evaluated iteratively in each cycle. The test accuracy consistently exceeded 98% across all iterations, indicating the strong predictive performance of the model even with varying data distributions. The average test accuracy, calculated to be 98.66%, demonstrated the exceptional performance and robust generalization capability of the CNN model in fall detection and posture classification tasks. These results confirmed that the proposed CNN model delivers reliable performance in fall detection and posture classification.
3.2. Performance Analysis and Evaluation of the Posture Classification Model
The accuracy of the proposed fall detection algorithm was evaluated by conducting experiments by hanging a black curtain in front of the radar system (Figure 7). Participants randomly performed motions that involved lying down slowly or falling, during which the changes in zmax and the velocity of these changes were measured.
A total of 10 volunteers participated in the experiments, with each randomly performing motion that involved lying down slowly or falling. The measured frame counts revealed that motions associated with lying down primarily required 80–90 frames to capture in their entirety, whereas fall motions occurred over approximately 20–30 frames.
Analysis of the detection accuracy presented in Table 4 revealed that the accuracy for detecting "lying down motion" was 100%, whereas that for the "fall motion" was 90%. Overall, out of a total of 20 movements (10 lying down + 10 falls) performed by the participants, 19 cases were detected correctly, resulting in an overall accuracy of 95%. Furthermore, velocity change analysis showed that the motions undertaken when lying down slowly involved gradual changes within a range of ±0.8 m/sec, whereas the motion of falling entailed rapid changes at ±2.3 m/sec.
In conclusion, the motion of lying down slowly involved gradual velocity changes over a longer period (80–90 frames), whereas falling occurred by way of rapid and significant velocity changes for a shorter duration (20–30 frames). This clear distinction demonstrates the ability of the algorithm to differentiate between the two motions. The results highlight the practical applicability of the fall detection system in various user environments, suggesting that radar technology is a promising alternative or complement to conventional vision-based systems.
3.3. Fall Detection Monitoring System
Based on the design of the AI model, we developed a monitoring system that combines the three-posture (standing, sitting, lying) classification model with a fall detection algorithm that accepts radar Point Cloud data for processing. The system—built on a web page and the Unity engine development platform—enables the subject’s condition to be monitored in real time and provides immediate alerts to the administrators in the event of a fall.
The web-based fall detection system allows users to register and view subject information, monitor the subject’s location and condition in real time, and send immediate notifications to registered emergency contacts upon detecting a fall. In Figure 8 and Figure 9, the subject's location and status are visualized as a heatmap based on the duration of stay and a set of pictograms to enable their movement paths to be intuitively tracked. This functionality is valuable for predicting health anomalies or emergency situations in advance.
The avatar-based user interface, developed using the Unity game engine, is designed to provide an intuitive real-time view of the subject’s location and condition. As depicted in Figure 10, the avatar reflects the subject's actual movements while respecting their privacy. This implementation obviates the need for additional cameras and allows for monitoring the subject’s status from various angles to effectively eliminate blind spots.
This system provides an environment that allows the user to accurately assess the subject's condition and take prompt action when necessary. By sending immediate alerts during a fall, the system enables rapid responses to emergencies while protecting an individual’s privacy by using radar data instead of video footage. Additionally, the extensibility of the Unity game engine allows for flexible design tailored to diverse user environments and requirements.
In conclusion, the proposed system overcomes the limitations of traditional fall detection technologies by offering a practical and efficient solution for real-time monitoring and emergency response.
3.4. Discussions
This study proposed and validated a monitoring system that utilizes contactless radar sensors and CNN-based human posture classification and fall detection. The 4D imaging radar, which operates in the 77–81 GHz frequency band, provides high spatial resolution by using short wavelengths, thereby enabling precise detection of even subtle human movements. This capability allows not only accurate distance and velocity measurements but also the detection of human motion through various materials and barriers, such as clothing, furniture, and thin walls, demonstrating effective operation in non-line-of-sight (NLOS) environments. Using these radar characteristics, the study successfully classified standing, sitting, and lying postures with high accuracy.
The experimental results showed that stable data collection via radar sensors becomes less reliable when the detection range exceeds 2.5m laterally. However, a frontal detection range of 2–3m was identified as the optimal distance to ensure both precision and stability, making it suitable for detecting human motion in indoor environments. These findings provide a stable foundation for processing high-quality data suitable for AI training.
Point Cloud data, which contain high-dimensional information such as the position, velocity, time, and Doppler power, were normalized and clustered for effective learning. Zero padding and k-means clustering were applied to organize the data, followed by posture classification using a CNN-based AI model. Additionally, analysis of the variations in the zmax values and velocity made it possible to distinguish between the movements associated with lying down and falling. The former of these two (i.e., lying down) was characterized by gradually decreasing zmax values, reflecting controlled body balance as the body posture changed from vertical to horizontal. In contrast, falls were characterized by a sharp decrease in zmax with irregular variations, indicative of sudden, uncontrolled motions. These patterns serve as critical indicators for fall detection.
Evaluation of the system performance through blind testing revealed a fall detection accuracy of 90% and a posture classification accuracy of 98.66%. These results demonstrate the utility of radar sensor signals for AI model training to effectively classify the user status and detecting falls. Furthermore, the system integrated a web-based interface and Unity engine-based avatar simulation to provide an intuitive and real-time responsive environment for users.
The web interface supports real-time status monitoring and long-term health state analysis through data logging and review. The Unity engine-based avatar simulation reflects actual movements of the monitored subject while protecting their privacy, which allows the subject’s condition to be intuitively observed from multiple angles. This comprehensive environment enables effective subject monitoring and contributes to health management.
The system demonstrated stable operation across various environments and holds promise for application in the home and in complex indoor settings. It offers a practical and reliable solution for real-time monitoring and health management, with great potential to improve the quality of life.
3.5. Conclusions
In this study, a real-time monitoring system was developed and validated by integrating radar sensors with artificial intelligence (AI) technology for posture classification and fall detection. The CNN model achieved an average classification accuracy of 98.66%, while the fall detection algorithm demonstrated a 95% accuracy in distinguishing fall events. Notably, experimental results confirmed that utilizing zmax and velocity changes effectively differentiates between falls and slow-lying movements.
Additionally, a real-time monitoring feature was implemented using a web-based dashboard and a 3D avatar interface developed with the Unity engine. This system allows intuitive monitoring of the user’s condition and provides immediate alert notifications in the event of a fall, ensuring a rapid response. The avatar-based interface addresses privacy concerns associated with camera-based systems while enabling effective monitoring of the user’s status from multiple angles without requiring additional video equipment.
However, as the study was conducted in a controlled experimental environment, further validation in diverse home settings is necessary. In particular, additional experiments would have to be conducted in environments with real-world challenges, such as metallic structures and electromagnetic interference, to enhance the reliability of the system. Additionally, research is needed to address the potential occurrence of false alarms caused by sudden movements that are not actual falls.
Future research should focus on collecting additional data that reflects home environments and user conditions, as well as expanding the training dataset to improve the generalization performance of the AI model. Furthermore, analyzing the user's movements after a fall and introducing a stepwise classification approach, such as "suspected fall" and "confirmed fall," could effectively reduce false alarms. Additionally, integrating other sensors, such as temperature and pressure sensors, could pave the way for a comprehensive healthcare platform capable of early detection of health anomalies. Such advancements would transform the system from merely detecting falls to a comprehensive safety management solution that monitors overall health status and provides early warnings for life-threatening situations.
This system has significant potential to address societal challenges, such as the increase in single-person households in aging societies, and could serve as a critical technological foundation for such solutions. By demonstrating the technical feasibility of a real-time monitoring system, this study provides valuable foundational data for commercialization by incorporating advanced technology and diverse real-world scenarios.
Abbreviations
| CNN | Convolution Neural Network |
| AI | Artificial intelligence |
References
- Abell JG, Steptoe A. Why is living alone in older age related to increased mortality risk? A longitudinal cohort study. Age and Ageing 2021;50(6):2019-2024.
- Fhon JRS, et al. Association between sarcopenia, falls, and cognitive impairment in older people: a systematic review with meta-analysis. Int J Environ Res Public Health 2023;20(5):4156-4167.
- Oytun MG, et al. Relationships of fall risk with frailty, sarcopenia, and balance disturbances in mild-to-moderate Alzheimer’s disease. J Clin Neurol 2023;19(3):251-259.
- Chen X, et al. Association between sarcopenia and cognitive impairment in the older people: a meta-analysis. Eur Geriatr Med 2022;13(4):771-787.
- Kim SH, Kim EY. The effects of stress and depression on the quality of life in single elderly households. J Korean Soc Sch Community Health Educ 2018;19(2):43-52.
- Rubenstein LZ. Falls in older people: epidemiology, risk factors and strategies for prevention. Age and Ageing 2006;35(suppl_2):37-41.
- Wang X, Ellul J, Azzopardi G. Elderly fall detection systems: a literature survey. Front Robot AI 2020;7:1-22.
- Xefteris VR, et al. Performance, challenges, and limitations in multimodal fall detection systems. IEEE Sens J 2021;21(17).
- Villa M, Casilari E. Wearable fall detectors based on low power transmission systems. Technologies 2024;12(9):166-196.
- De Miguel K, et al. Home camera-based fall detection system for the elderly. Sensors 2017;17(12):2864-2885.
- Ren L, Peng Y. Research of fall detection and fall prevention technologies: a systematic review. IEEE Access 2019;7.
- Koshmak G, Loutfi A, Linden M. Challenges and issues in multisensor fusion approach for fall detection. Sensors 2016.
- Cippitelli E, et al. Radar and RGB-depth sensors for fall detection: a review. IEEE Sensors J; 2017(17):3585-3604.
- Zeiler MD, Fergus R. Visualizing and understanding convolutional networks. In: Computer Vision–ECCV 2014: 13th European Conference; 2014 Sep 6-12; Zurich, Switzerland. Springer International Publishing; 2014.
- Koo BT, Park PJ, Han SH. Trends in intelligent radar technology. Electron Telecommun Trends 2021;36(2):12-21.
- Zhang K, et al. A new k-means clustering algorithm for point cloud. Int J Hybrid Inf Technol; 2015(8):157-170.
- An S, Ogras UY. MARS: mmWave-based assistive rehabilitation system for smart healthcare. ACM Trans Embed Comput Syst (TECS) 2021;1(1):1-22.
Figure 1.
Radar system installation diagram for experiments.
Figure 2.
Visualization of Clustering Results in 3D Point Cloud Space: Overview of K-means Clustering and Comparative Analysis of Data Distribution Before and After Clustering.
Figure 2.
Visualization of Clustering Results in 3D Point Cloud Space: Overview of K-means Clustering and Comparative Analysis of Data Distribution Before and After Clustering.
Figure 3.
Schematic representation of the architecture of the CNN model designed for classifying three postures (Standing, Sitting, Lying).
Figure 3.
Schematic representation of the architecture of the CNN model designed for classifying three postures (Standing, Sitting, Lying).
Figure 4.
Analysis of Changes in zmax Over Time: Comparison of Postural Transitions During Slow-Lying Movements and Falls.
Figure 4.
Analysis of Changes in zmax Over Time: Comparison of Postural Transitions During Slow-Lying Movements and Falls.

Figure 5.
Analysis of Velocity Changes at zmax: Comparison of Slow-Lying Movements and Falls.
Figure 6.
K-fold cross-validation result for training and testing.
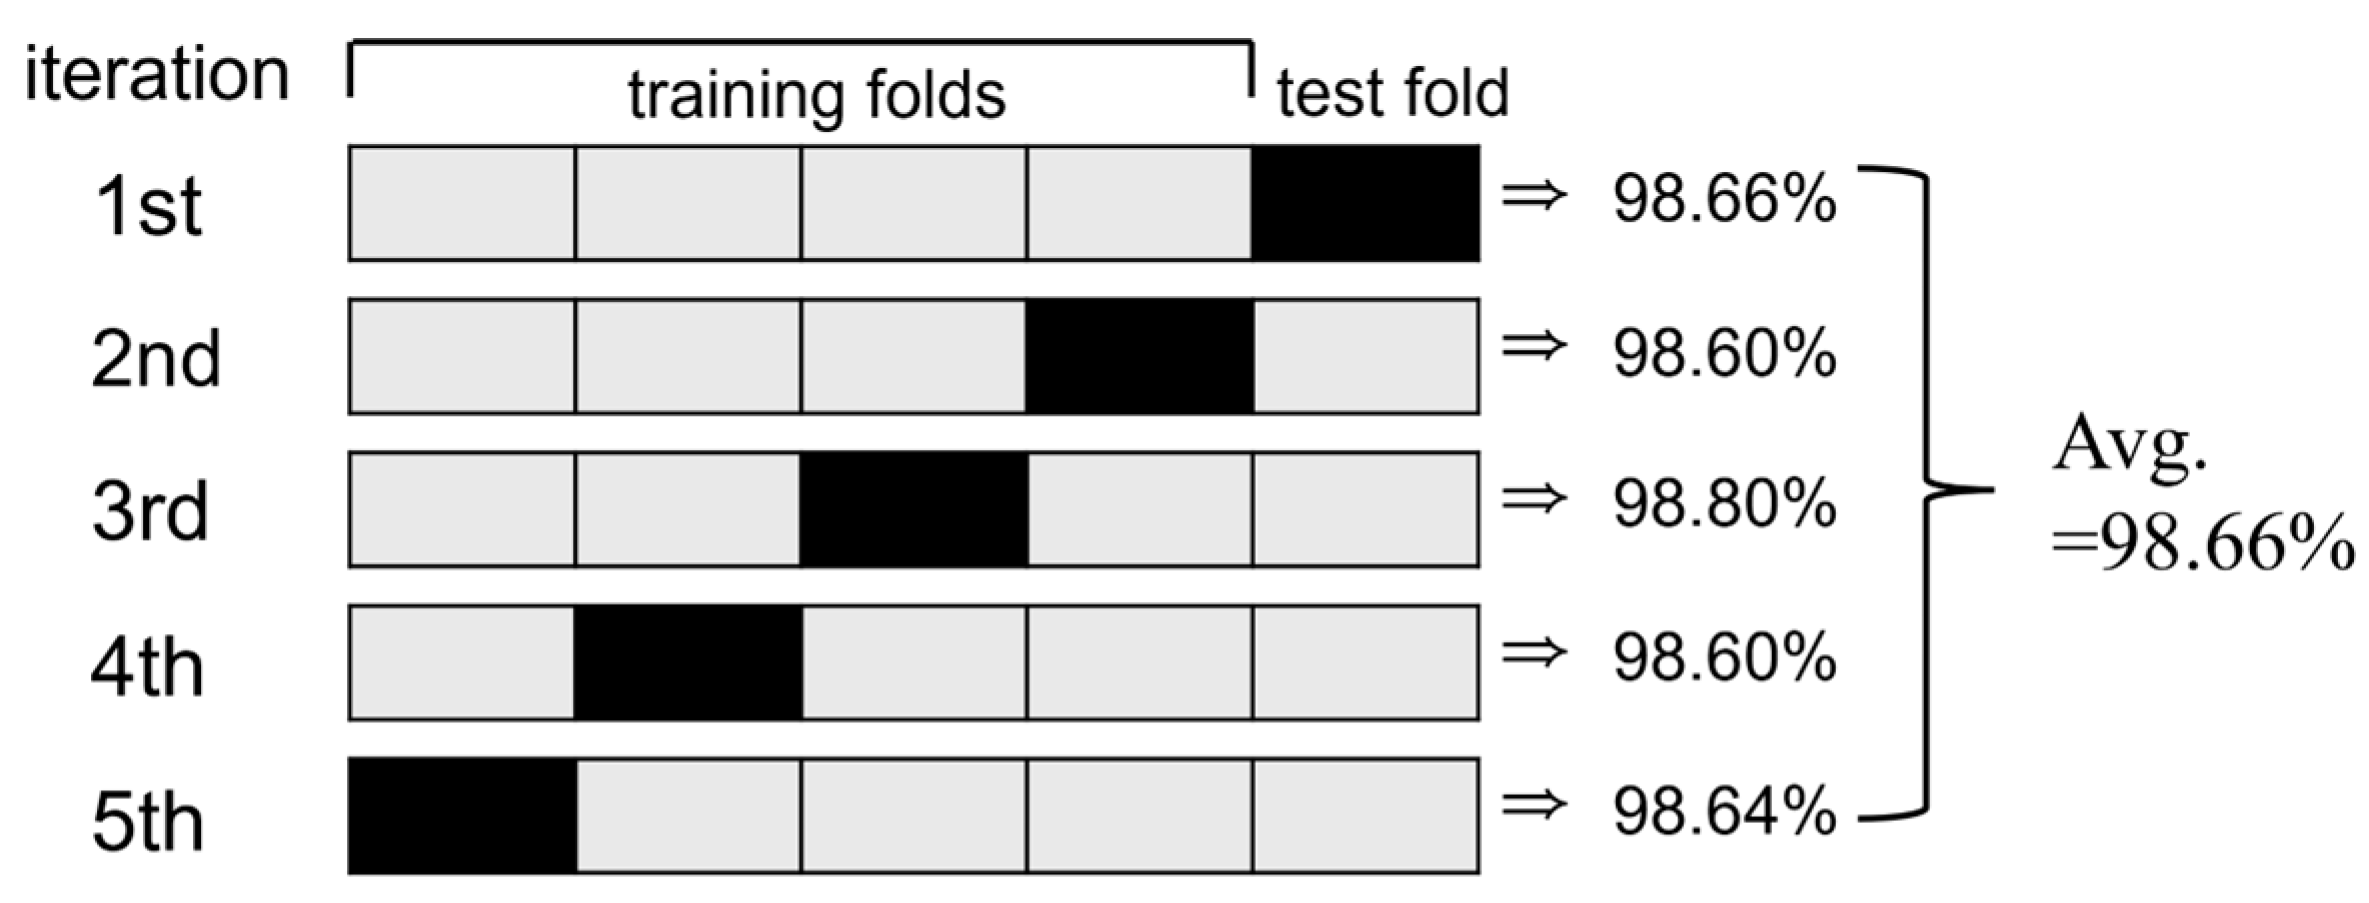
Figure 7.
Fall detection experiment in a blind environment.
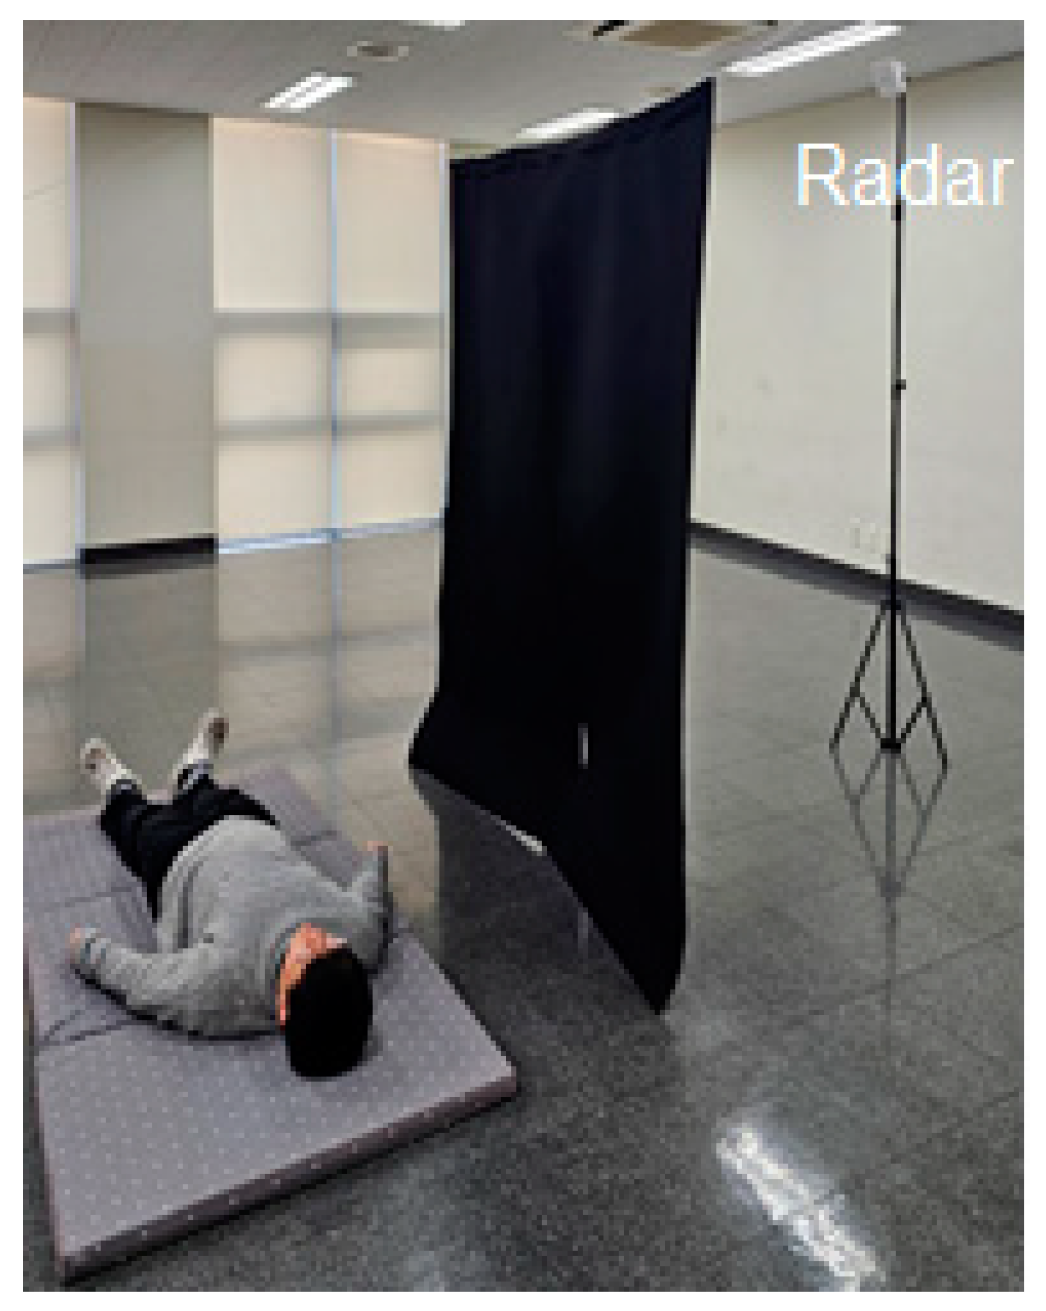
Figure 8.
Heatmap showing the position and status of the subject on the web page.
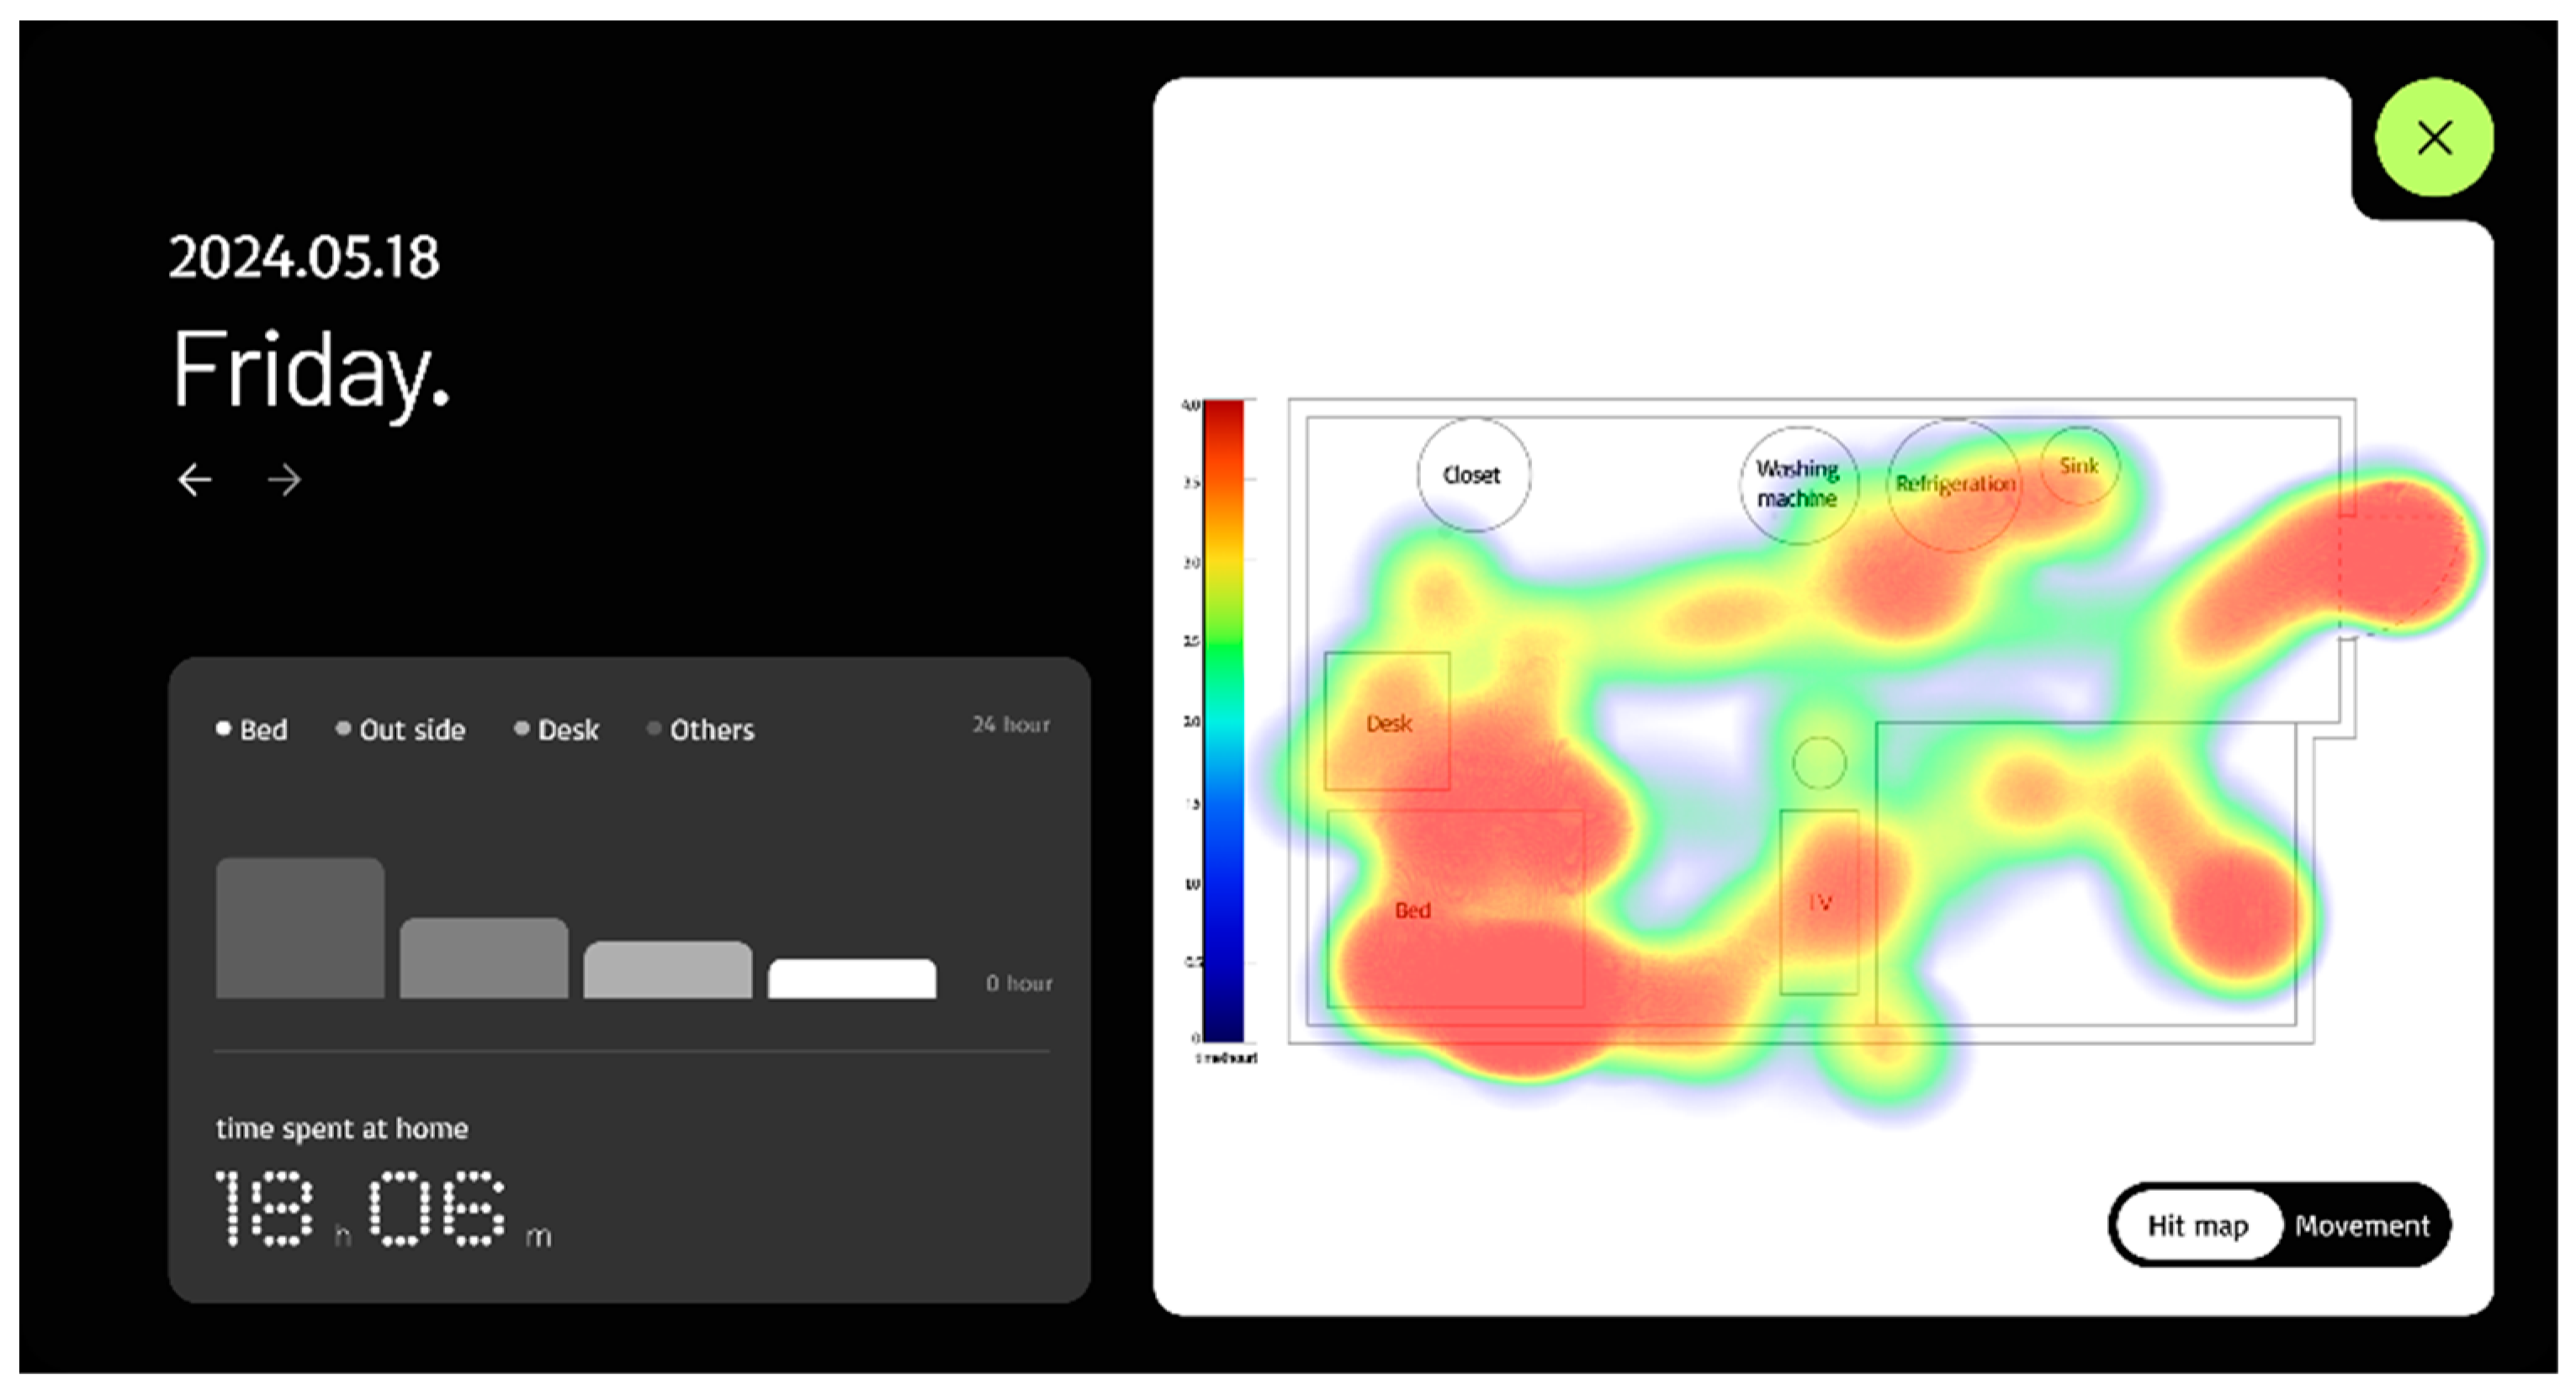
Figure 9.
Pictogram showing the position and status of the subject on the web page.
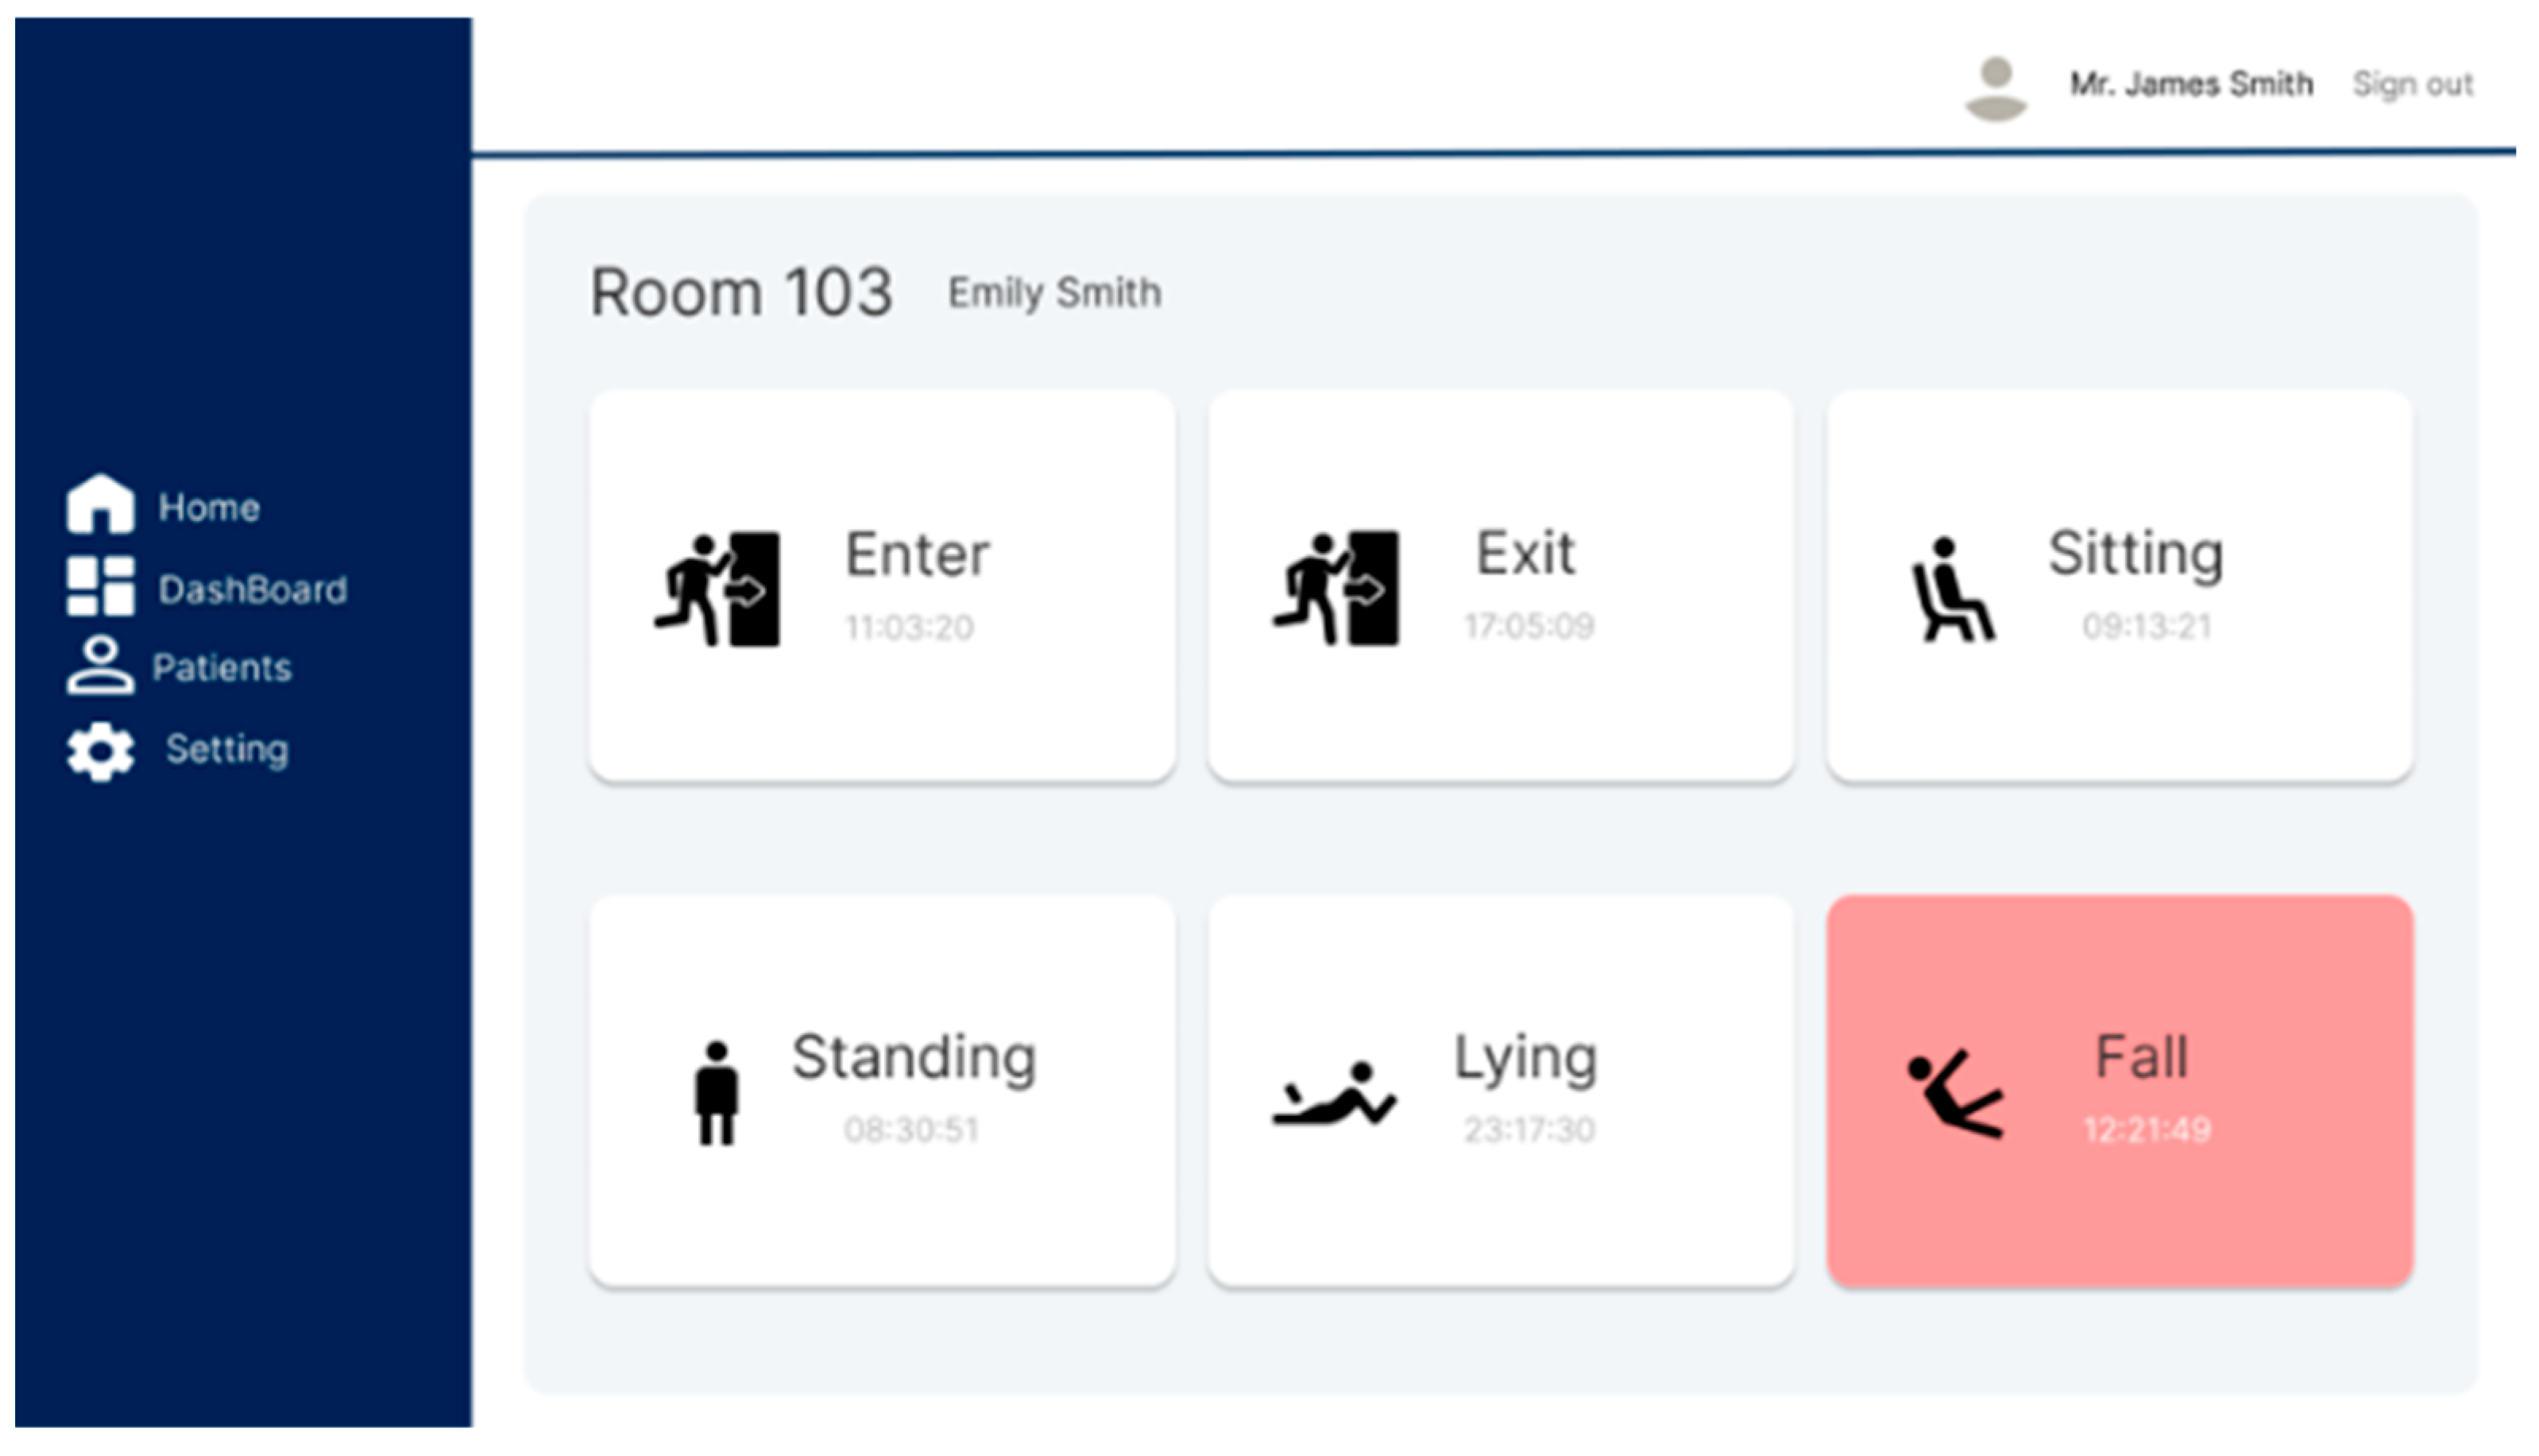
Figure 10.
Real-time position and status using avatars in the Unity Engine.
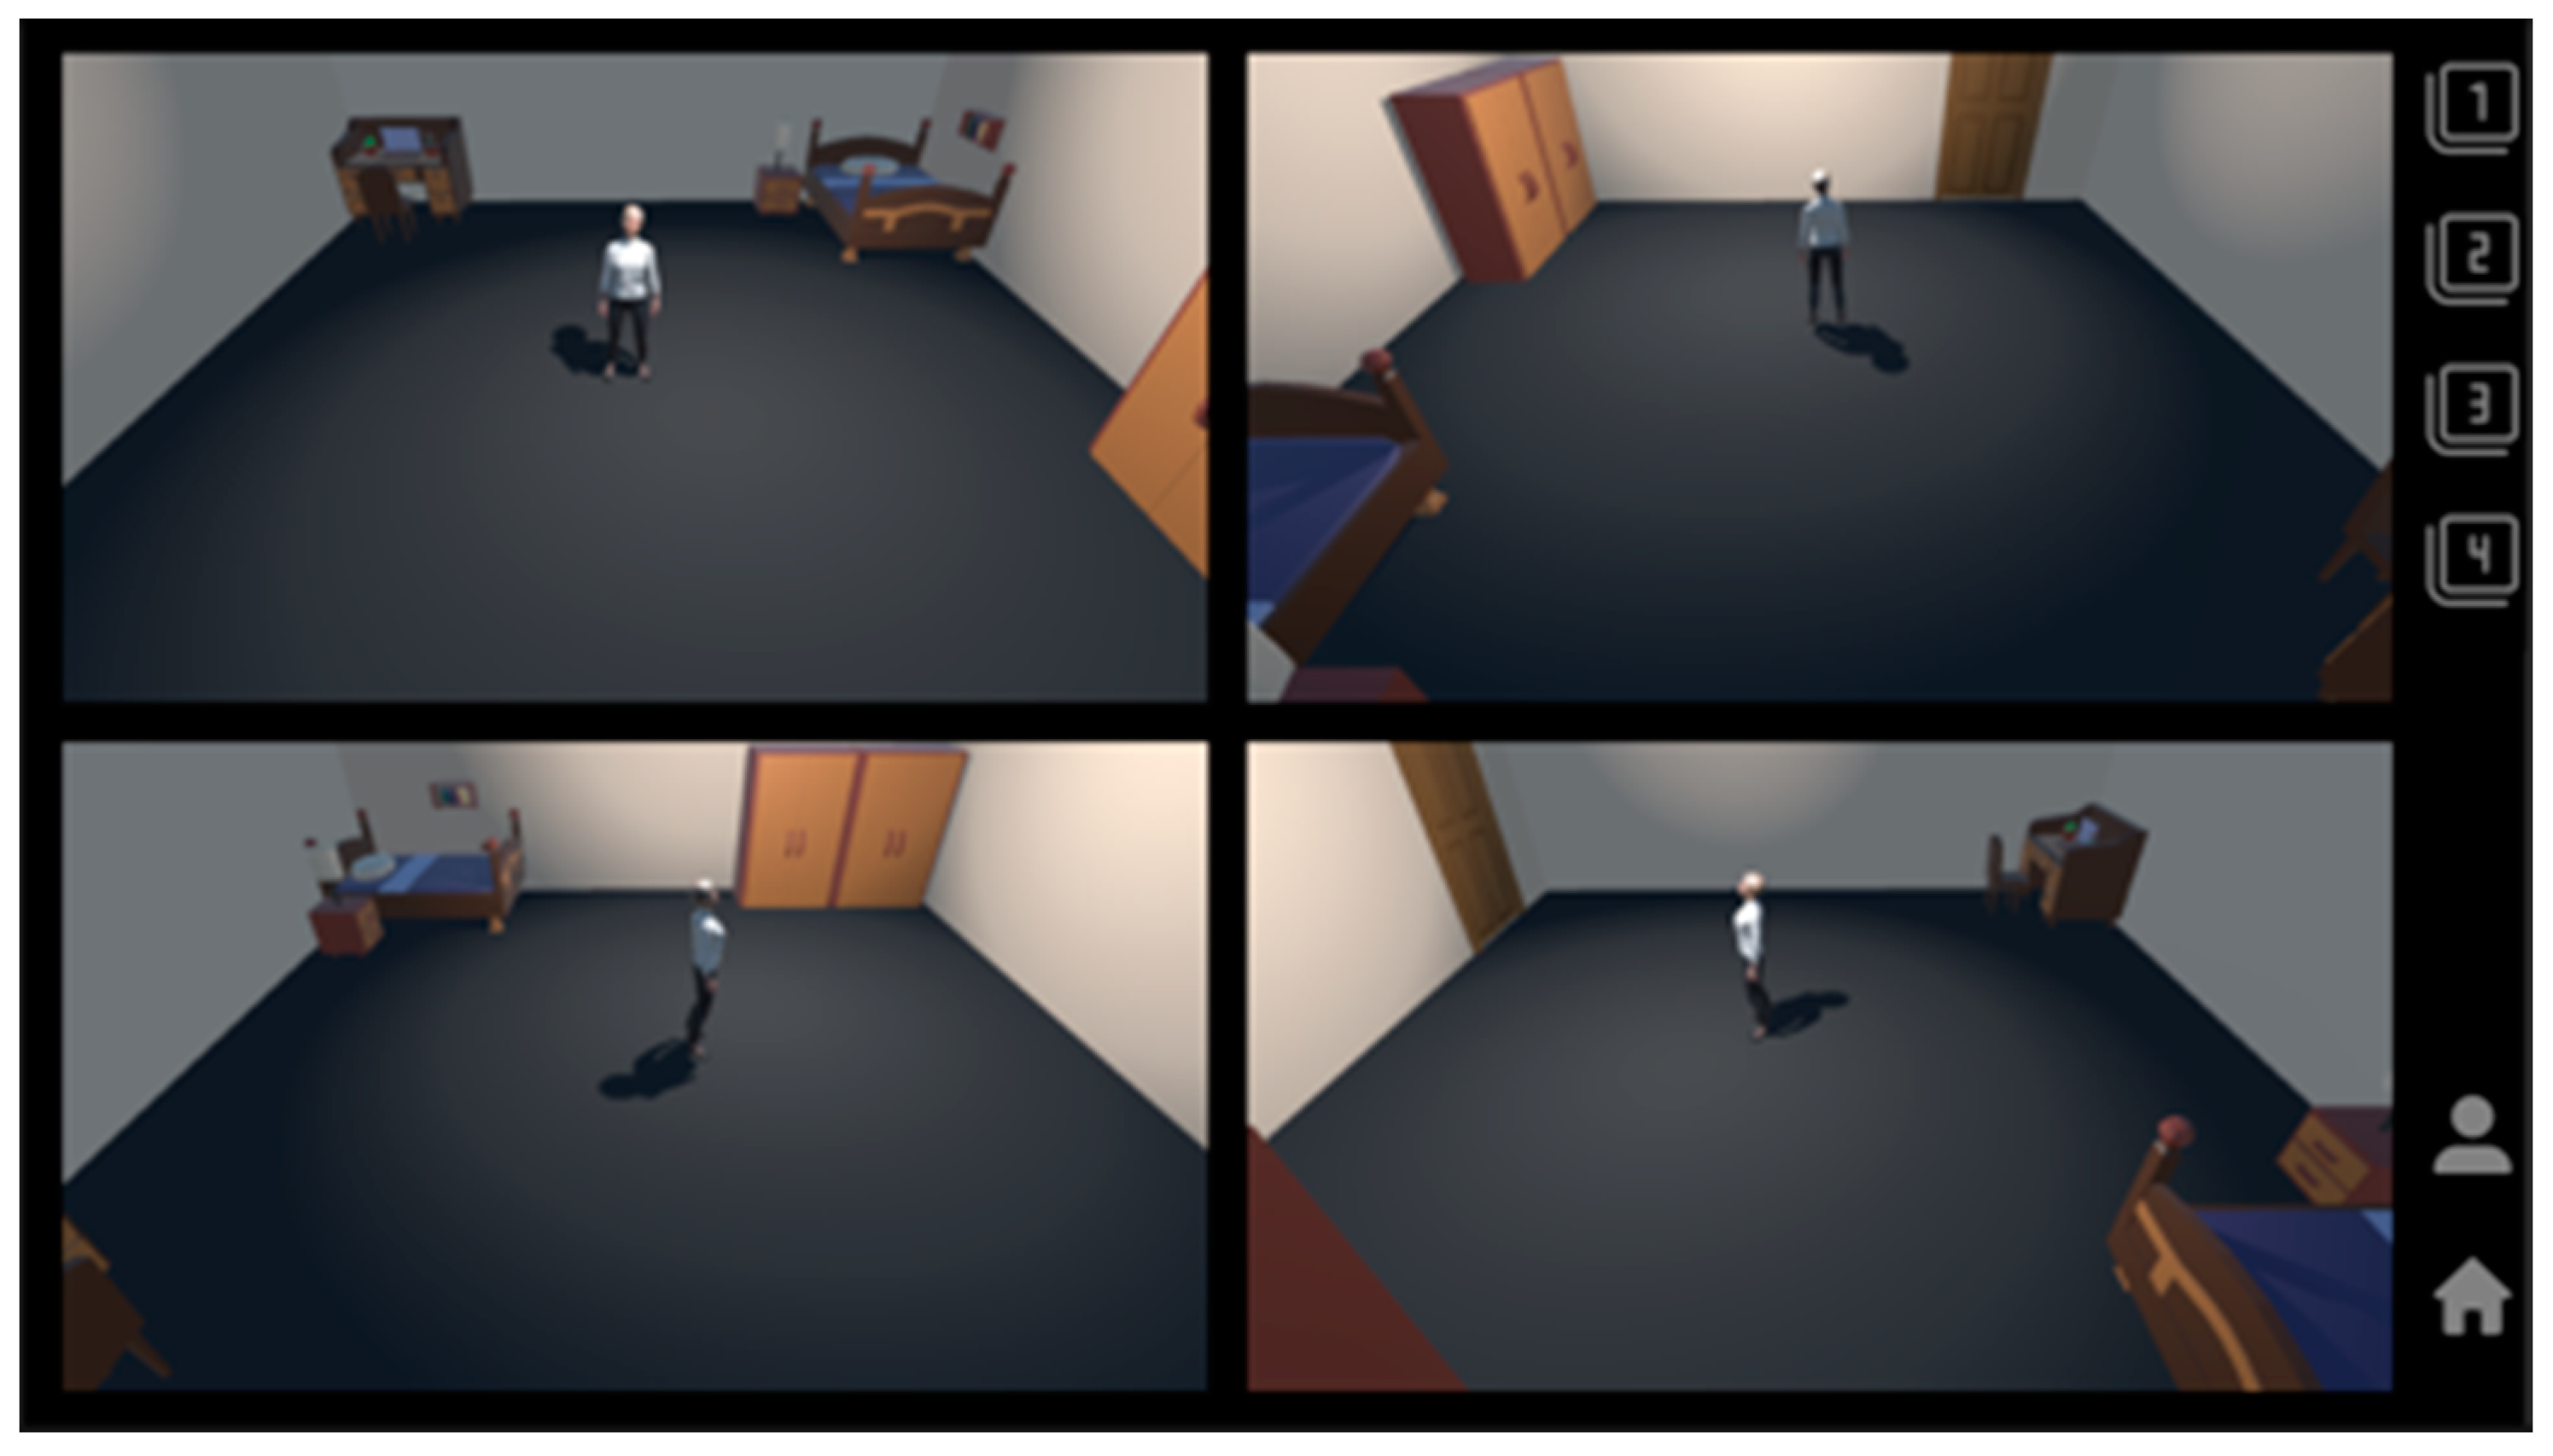

Table 1.
Point Cloud count and density by distance from radar.
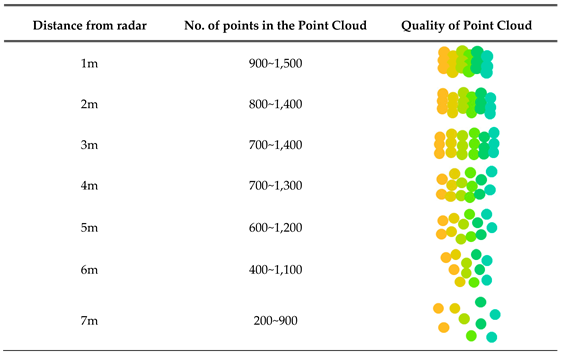 |
Table 2.
Visualization of Point Cloud data by posture.
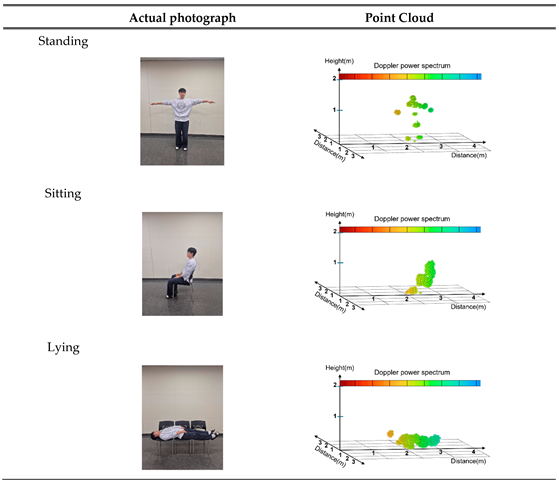 |
Table 3.
Comparison of Point Cloud data before and after alignment in the x, y, and z coordinates.
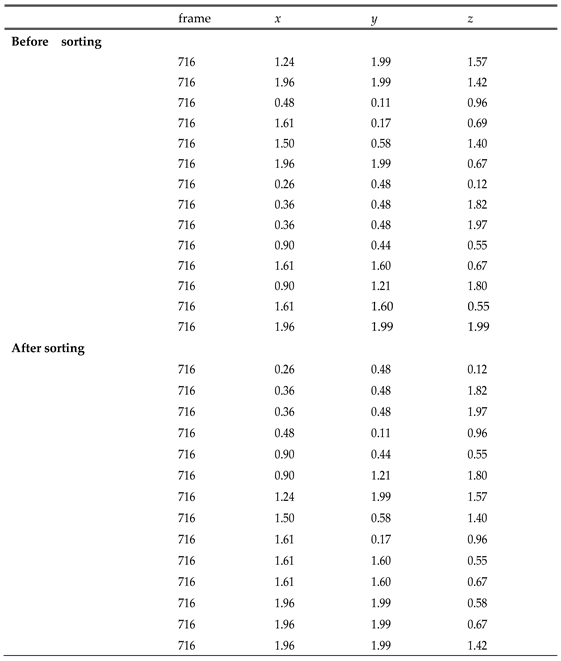 |
Table 4.
Detection Accuracy Analysis for Slow-Lying Movements and Falls Based on Frame Count and zmax Position Changes.
Table 4.
Detection Accuracy Analysis for Slow-Lying Movements and Falls Based on Frame Count and zmax Position Changes.
| Volunteer | zmax(m) | Frame | State | Detection | |
| Lying down slowly | |||||
| 1 | 0~1.8 | 90 | lying | lying | |
| 2 | 0~1.7 | 90 | lying | lying | |
| 3 | 0~2.0 | 90 | lying | lying | |
| 4 | 0~1.8 | 90 | lying | lying | |
| 5 | 0~1.7 | 80 | lying | lying | |
| 6 | 0~1.8 | 80 | lying | lying | |
| 7 | 0~1.7 | 90 | lying | lying | |
| 8 | 0~1.9 | 80 | lying | lying | |
| 9 | 0~2.0 | 80 | lying | lying | |
| 10 | 0~1.8 | 80 | lying | lying | |
| Falling | |||||
| 1 | 0~1.7 | 20 | fall | fall | |
| 2 | 0~1.8 | 20 | fall | fall | |
| 3 | 0~2.0 | 30 | fall | fall | |
| 4 | 0~1.9 | 20 | fall | fall | |
| 5 | 0~1.7 | 30 | fall | lying | |
| 6 | 0~1.8 | 20 | fall | fall | |
| 7 | 0~2.0 | 20 | fall | fall | |
| 8 | 0~1.9 | 30 | fall | fall | |
| 9 | 0~1.7 | 30 | fall | fall | |
| 10 | 0~1.7 | 25 | fall | fall |
Table 5.
Detection Accuracy Analysis for Slow-Lying Movements and Falls Based on Frame Count and zmax Velocity Changes.
Table 5.
Detection Accuracy Analysis for Slow-Lying Movements and Falls Based on Frame Count and zmax Velocity Changes.
| Volunteer | Velocity(m/sec) | Frame | State | Detection | |
| Lying down slowly | |||||
| 1 | −0.51 ~ +0.65 | 90 | lying | lying | |
| 2 | −0.43 ~ +0.65 | 90 | lying | lying | |
| 3 | −0.58 ~ +0.72 | 90 | lying | lying | |
| 4 | −0.72 ~ +0.80 | 90 | lying | lying | |
| 5 | −0.58 ~ +0.80 | 80 | lying | lying | |
| 6 | −0.51 ~ +0.80 | 80 | lying | lying | |
| 7 | −0.72 ~ +0.80 | 90 | lying | lying | |
| 8 | −0.65 ~ +0.72 | 80 | lying | lying | |
| 9 | −0.72 ~ +0.72 | 80 | lying | lying | |
| 10 | −0.80 ~ +0.65 | 80 | lying | lying | |
| Falling | |||||
| 1 | −2.32 ~ +2.10 | 20 | fall | fall | |
| 2 | −1.09 ~ +1.88 | 20 | fall | fall | |
| 3 | −2.17 ~ +2.25 | 30 | fall | fall | |
| 4 | −1.09 ~ +2.25 | 20 | fall | fall | |
| 5 | −0.72 ~ +1.88 | 30 | fall | lying | |
| 6 | −0.58 ~ +2.17 | 20 | fall | fall | |
| 7 | −2.32 ~ +1.74 | 20 | fall | fall | |
| 8 | −1.01 ~ +1.74 | 30 | fall | fall | |
| 9 | −0.87 ~ +2.25 | 30 | fall | fall | |
| 10 | −0.58 ~ +1.59 | 25 | fall | fall |
Disclaimer/Publisher’s Note: The statements, opinions and data contained in all publications are solely those of the individual author(s) and contributor(s) and not of MDPI and/or the editor(s). MDPI and/or the editor(s) disclaim responsibility for any injury to people or property resulting from any ideas, methods, instructions or products referred to in the content. |
© 2025 by the authors. Licensee MDPI, Basel, Switzerland. This article is an open access article distributed under the terms and conditions of the Creative Commons Attribution (CC BY) license (http://creativecommons.org/licenses/by/4.0/).
Copyright: This open access article is published under a Creative Commons CC BY 4.0 license, which permit the free download, distribution, and reuse, provided that the author and preprint are cited in any reuse.


