
Submitted:
08 April 2025
Posted:
09 April 2025
You are already at the latest version
Abstract
Background/Objectives: Symptomatic intravertebral vacuum cleft (SIVC) is a complication of vertebral compression fractures (VCFs) that leads to persistent pain and deformity. Its prediction remains challenging due to multifactorial causes. Paraspinal muscle fat infiltration has been associated with spinal fracture outcomes but has not been extensively explored in SIVC prediction. To develop machine learning (ML) models for predicting SIVC and to evaluate the role of muscle-related variables in improving predictive performance. Methods: Demographic, radiological, and muscle-related variables were collected. ML models—including Logistic Regression, Random Forest, XGBoost, and Multi-Layer Perceptron—were trained and tested under two input conditions: baseline variables (SETTING_1) and baseline plus muscle-related variables (SETTING_2). Model performance was evaluated using accuracy, area under the receiver operating characteristic curve (AUC), and feature importance analysis. Results: The Random Forest model in SETTING_2, which incorporated muscle-related variables, achieved the highest accuracy (96.6%) and AUC (0.956). Multifidus fatty infiltration (MFfi), erector spinae fatty infiltration (ESfi), and endplate CSA were identified as the most significant predictors. The inclusion of muscle-related variables significantly improved the predictive performance of all ML models. Conclusions: ML models, particularly Random Forest, demonstrated high accuracy in predicting SIVC when muscle-related variables were included. Paraspinal muscle fat infiltration is a critical predictor of SIVC and should be integrated into risk assessment strategies to improve early diagnosis and management.
Keywords:
Machine Learning
; Intravertebral Vacuum Cleft
; Vertebral Compression Fracture
; Risk Factor
1. Introduction
Vertebral compression fracture (VCF) is a common spinal condition that has been increasing in prevalence in recent decades. If unresolved through conservative treatment due to various factors, it can lead to persistent back pain, kyphotic deformity, and neurological deterioration. [1,2,3,4,5] A hallmark of this condition is the intravertebral vacuum cleft (IVC), a distinctive radiological feature associated with non-union of VCF, some of which requires surgical intervention. [6,7] “Symptomatic” IVC (SIVC) represents a distinct clinical entity where patients with VCF develop recurrent pain after initial improvement, accompanied by characteristic radiographic findings of IVC.
Unlike typical VCF cases that show spontaneous improvement, SIVC patients experience persistent or recurring pain (VAS >3) that correlates with specific radiological features. Early detection and accurate prediction of SIVC are clinically significant, yet this remains challenging due to the multifactorial nature of its pathogenesis. [8,9] SIVC has been reported to occur slightly more frequently in females, with other risk factors including renal disease, diabetes, chronic steroid use, osteoporosis, alcoholism, hypothyroidism, and radiation therapy. [6,8,10,11,12,13,14] Recent studies have also reported that fat infiltration of the paraspinal muscles may increase the risk of VCF or influence clinical and radiological outcomes following spinal fractures. [15,16,17]
In recent decades, the rapid development of machine learning (ML) algorithms has significantly impact on orthopedic surgery. ML enables high-accuracy analysis and prediction of complex patterns in medical imaging, electronic medical records (EMR), and other clinical datasets. [18] Previous studies have demonstrated the utility of ML in predicting osteoporotic VCF using magnetic resonance imaging (MRI) and demographic data alongside bone mineral density scores. [19,20] However, to our knowledge, no previous studies have employed ML approaches incorporating muscle-related variables to predict VCF and SIVC.
Therefore, the primary objective of this study was to determine whether muscle-related variables were significant risk factors in the prediction of SIVC using ML by comparing demographics and variables measured from plain radiography with and without muscle-related variables. The secondary objective was to investigate which ML algorithms could best predict SIVC and to what extent muscle-related variables had significant effects.
2. Materials and Methods
2.1. Study Design and Patient Population
This study was a retrospective analysis of patients diagnosed with VCF who were enrolled between March 2013 and February 2023 (Figure 1). This study was approved by the Institutional Review Board (IRB) of the institution. The inclusion criteria were as follows: patients diagnosed with VCF at the thoracolumbar junction (TLJ, T10-L2) and patients diagnosed with SIVC at the TLJ. The exclusion criteria were patients with pathological VCF, such as tumors or infection, patients with multiple-location VCF, patients without MRI, and patients without adequate plain thoracolumbar anteroposterior and lateral radiographs.
2.2. Definition and Diagnostic Criteria of SIVC
SIVC was defined by the following criteria:
-
Clinical Criteria:
- -
- Initial acute pain following VCF
- -
- Period of initial improvement with conservative treatment
- -
- Development of recurrent pain (VAS >3)
- -
- Location-specific pain corresponding to the level of vacuum cleft
-
Radiographic Criteria:
- -
- Radiographic evidence of intravertebral vacuum cleft (IVC) on plain thoracolumbar radiographs
- -
- Absence of other significant pathology at the affected and adjacent levels, such as new fractures
To address potential diagnostic subjectivity, two independent spine specialists (YHK, JA) confirmed the diagnosis of SIVC.
2.3. Data Collection
A clinical data warehouse (CDW) containing all medical records from the institution was used to select and study patients. Demographic and radiological data were collected from all enrolled patients. The demographic data included sex, age, diabetes, hypertension, adrenal insufficiency, hyperthyroidism, hypothyroidism, and steroid use. Radiological characteristics were measured using the following variables: the “angle” (local kyphotic angle) and compression ratio of the VCF were measured from the lateral view of the plane radiograph (PR) (Figure 2). From the axial view of MRI, the cross-sectional areas (CSA) of the VCF location and multifidus (MF) and erector spinae (ES) muscles were measured. Additionally, the percentage of fatty infiltration in MF (MFfi) and ES (ESfi) was measured using the imaging pre-processing ImageJ software (version 1.8.0) (Figure 3). In this study, relational multifidus (rMF) was defined as the MF/CSA of the endplate, and relational erector spinae (rES) was defined as the MF/CSA of the endplate.
2.4. Machine Learning Models
To confirm the known risk factors for VCF and SIVC, we conducted experiments using variables extracted from PR and EMR for SETTING_1 and variables extracted from PR, EMR, and MRI for SETTING_2. The patients were randomly divided into training (70%) and test (30%) datasets. A training set is used to develop the model. Supplementary 5-fold cross-validation was used to optimize the hyperparameters of the machine learning model in the training set, and the data of the training set were augmented using the SMOTE package to effectively learn fewer datasets. The test set was used to evaluate the performance of the learned models: Logistic Regression (LR) [21], random forest (RF) [22], extreme gradient boosting (XGBoost) [23], multilayer perceptron (MLP) [24]. Training and testing processes were conducted in Python 3.9.12 and PyCharm environments.
2.5. Evaluation Matrix
For objective performance evaluation, the areas under the accuracy, specificity, sensitivity, precision, F1-score, and area under the receiver operating characteristics curve (AUROC) of the models were measured and averaged ten times for each method in the test set.
3. Results
3.1. Patient Characteristics
Of the 1694 patients, data from 694 who met the inclusion criteria and did not violate the exclusion criteria were included in the study; of these, 485 were used for training the ML models and 209 were used for testing (Table 1).
3.2. Machine Learning Models
The LR, RF, XGBoost, and MLP models showed that the AUC in SETTING_1 was 0.699, 0.698, 0.643, and 0.708, respectively, and the accuracies were 0.757, 0.871, 0.856, and 0.760, respectively (Figure 4, Table 2). The AUC in SETTING_2 was 0.947, 0.956, 0.951, and 0.904, respectively, and the accuracies were 0.951, 0.966, 0.962, and 0.961, respectively (Figure 5, Table 2). All ML models demonstrated superior performance in SETTING_2 compared to SETTING_1. Among them, the RF model achieved the highest accuracy in both settings. Notably, in SETTING_2, the RF model outperformed all other models, exhibiting the highest accuracy and AUC.
3.3. Feature Importance
Figure 6 illustrates the feature importance ranking of the RF model in SETTING_1, where ‘Angle’ (local kyphotic angle), age, and ‘Solondo’ (steroid use) were identified as the top three predictors. In contrast, the RF model in SETTING_2, which outperformed all other models (Figure 7), highlighted MFfi, ESfi, and ‘Disc’ (Endplate CSA) as the most influential predictors for SIVC, with feature importance values of 0.871, 0.702, and 0.575, respectively. Notably, feature importance values range from 0 to 1, indicating their relative contribution to the model’s predictive performance.
4. Discussion
In this study, we successfully predicted VCF and SIVC using muscle-related variables using ML models. The superior performance of SETTING_2 (incorporating muscle variables) over SETTING_1 (conventional variables only) suggests that muscle-related factors play a crucial role in SIVC development. The high feature importance of MFfi and ESfi (0.871 and 0.702 respectively) indicates that paravertebral muscle status may be more predictive of SIVC than traditional risk factors such as age and steroid use. This will also provide insight into the accurate diagnosis of SIVC in the future. To the best of our knowledge, this is the first study to explore SIVC using machine learning (ML) in conjunction with muscle-related variables. To date, SIVC has primarily been identified through radiological assessments. However, challenges in accurately distinguishing SIVC from VCF can result in inadequate treatment. Given that SIVC requires distinct treatments, such as bone cement augmentation, and has unique clinical features and prognoses compared with VCF, precise identification is essential [25].
In line with our hypothesis, both MFfi and ESfi were ranked among the top three predictors. Previous studies have reported that MF and ES play crucial roles in maintaining spinal balance [26,27]. This suggests that fat infiltration weakens the supportive capacity of the spine, potentially contributing to the development of SIVC. Consistent with this, previous studies have reported that fat infiltration in the ES and MF is associated with reduced spinal bone mineral density (BMD) [28,29], while fat infiltration in the MF has been linked to an increased risk of osteoporotic VCF [15]. In addition, it is noteworthy that high fat infiltration is associated with a low union rate following lumbar interbody fusion procedures [30,31]. This suggests that fat infiltration in the posterior muscles significantly affects the stability of the spinal column. In this study, the role of fat infiltration in the paravertebral muscles in the occurrence of SIVC was confirmed using feature importance analysis.
Enlargement of the endplate cross-sectional area (CSA), potentially resulting from the formation of intravertebral clefts, reflects biomechanical changes within the vertebral structure. These changes may represent a compensatory response to redistribute the mechanical load or indicate progressive instability associated with advanced spinal degeneration [32]. This finding emphasizes the complex nature of endplate pathology and its important role in SIVC development. Furthermore, structural changes in the endplate CSA could serve as valuable biomarkers for identifying patients at risk of SIVC [33]. However, further research is required to establish whether this predictor has a causal role or simply correlates with the condition and to determine how it can be integrated into diagnostic or therapeutic approaches.
The use of steroid has been identified as a contributing risk factor for the development of SIVC [6]. In this study, SETTING_2 demonstrated lower feature importance values for steroid use compared to other factors, while SETTING_1 highlighted its significance as one of the top three predictors. However, high-quality studies specifically investigating the relationship between steroid use and SIVC are limited. Notably, long-term improper use of steroids has been reported to increase the risk of new vertebral fractures, suggesting that inappropriate steroid use compromises vertebral stability [34,35].
Diabetes has been reported as a risk factor for SIVC and has been reported to be strongly associated with frailty index, which implies a significant impact on overall health and resilience [12]. Several mechanisms have been demonstrated to explain this relationship. Diabetes often contributes to muscle loss (or sarcopenia) and weakness, both essential components of frailty [36]. Nutritional challenges associated with diabetes, including altered dietary patterns and nutrient absorption, can further intensify frailty [37]. Additionally, diabetes is commonly accompanied by comorbidities such as cardiovascular disease, obesity, and kidney disease, all of which significantly affect the frailty burden [38]. While some studies suggest that diabetes does not always have a direct association with SIVC, its long-term complications and systemic effects contribute to its potential role in diminishing physical and structural resilience [39,40]. This, in turn, could indirectly impact outcomes such as vertebral stability and the risk of SIVC.
Age has been reported as a significant risk factor for the occurrence of past VCF [41,42]. In this study, the age parameter showed significant results in SETTING_1, but the age parameter in SETTING_2 did not show significant results compared to other variables. This means that muscle-related variables representing an individual’s health status are more important than chronological age in the fracture-healing process. Of course, age should not be overlooked in the occurrence of SIVC because there have been reports that age, osteoporosis, and sarcopenia are correlated [43]. However, it can be seen that it should be interpreted differently from the meaning of risk factors mentioned in previous studies [36].
This study provides data-driven insights and valuable medical perspectives. With the development of computer and data science, grafting into the medical field is taking place. This provides an accurate identification and diagnosis of SIVC and can lead to the discovery of risk factors through data analysis.
Nevertheless, several limitations should be considered when interpreting our results. First, the retrospective nature of the study meant that standardized pain scores were not available throughout the follow-up period, potentially affecting our ability to fully characterize pain progression patterns. Second, while we carefully defined SIVC criteria, the distinction between SIVC-related pain and other sources of chronic pain relies partly on clinical judgment. Third, potential contributing factors such as frailty index [44], BMI, and BMD were excluded due to missing data. Fourth, our focus on single-level fractures, while improving study homogeneity, limits generalizability to multilevel cases. Finally, the relatively small number of SIVC cases (n=40) suggests the need for larger validation studies. Given these limitations, future studies should investigate the potential clinical application of muscle-related predictors in the early diagnosis and treatment of SIVC, further validating their role in improving patient outcomes.
5. Conclusions
This study identified paravertebral muscle variables as novel risk factors for SIVC, and highlighted effective prediction methods. Among these, the RF model demonstrated the best performance, suggesting that it is a reliable strategy for SIVC prediction.
Author Contributions
Conceptualization, JCL.; methodology, YS, JA.; formal analysis, YS, JA; investigation, JA, JL; data curation, JL; writing—original draft preparation, JA; writing—review and editing, JS, JA; statistical analysis, YS; visualization, JL; critical revision, JS, JA, YHK, YS, JSL, HYP; supervision, YHK; funding acquisition, JA. All authors have read, reviewed and approved the final version of the manuscript. JA and JS contributed equally to this work.
Funding
This work was supported by the Institute of Clinical Medicine Research of Bucheon St. Mary’s Hospital, Research Fund, 2024. There was no other external funding source.
Institutional Review Board Statement
This study was conducted in accordance with the Declaration of Helsinki, and approved by the Institutional Review Board of Bucheon St. Mary’s Hospital, The Catholic University of Korea. (IRB No.: HC24WASI0020, 09/04/2024).
Informed Consent Statement
Written informed consent was waived due to the retrospective nature of the study and the use of fully anonymized medical records and imaging data, which precluded any personal identification of patients.
Data Availability Statement
The patients’ data were collected in Bucheon St. Mary’s Hospital, The Catholic University of Korea. The datasets generated and/or analysed during the current study are available from the corresponding author (YS) on reasonable request.
Acknowledgments
Statistical consultation was supported by the Department of Mathematics, The Catholic University of Korea. We used clinical data warehouse (CDW) technology of the Catholic Medical Center.
Conflicts of Interest
The authors declare no personal competing interests in any of the materials, or devices described in this article. No benefits in any form have been received or will be received from a commercial party related directly or indirectly to the subject of this article. (JA: nothing to disclose, JS: nothing to disclose, YHK: nothing to disclose, JCL: nothing to disclose, JSL: nothing to disclose, HYP: nothing to disclose, JL: nothing to disclose, YS: nothing to disclose).
Abbreviations
The following abbreviations are used in this manuscript:
| SIVC | Symptomatic intravertebral vacuum cleft |
| VCF | Vertebral compression fracture |
| EMR | Electronic medical records |
| ML | Machine learning |
| TLJ | Thoracolumbar junction |
| MF | Multifidus |
| ES | Erector spinae |
| MFfi | MF fat infiltration |
| ESfi | ES fat infiltration |
| CSA | Cross-sectional area |
| rMF | Relative CSA of multifidus per CSA of endplate |
| rES | Relative CSA of erector spinae per CSA of endplate |
| LR | Logistic regression |
| RF | Random forest |
| XGBoost | Extreme gradient boosting |
| MLP | Multi-layer perceptron |
| AUROC | Area under the receiver operating characteristic curve |
| BMD | Bone mineral density |
| BMI | Body mass index |
| PR | Plain radiograph |
References
- Watanabe, K.; Lenke, L.G.; Bridwell, K.H.; Kim, Y.J.; Koester, L.; Hensley, M. Proximal junctional vertebral fracture in adults after spinal deformity surgery using pedicle screw constructs: analysis of morphological features. Spine 2010, 35, 138–145. [Google Scholar] [CrossRef] [PubMed]
- Park, W.M.; Choi, D.K.; Kim, K.; Kim, Y.J.; Kim, Y.H. Biomechanical effects of fusion levels on the risk of proximal junctional failure and kyphosis in lumbar spinal fusion surgery. Clin. Biomech. 2015, 30, 1162–1169. [Google Scholar] [CrossRef]
- Silverman, S. The clinical consequences of vertebral compression fracture. Bone 1992, 13 (Suppl. 2), S27–S31. [Google Scholar] [CrossRef]
- Heggeness, M.H. Spine fracture with neurological deficit in osteoporosis. Osteoporos. Int. 1993, 3, 215–221. [Google Scholar] [CrossRef] [PubMed]
- Baba, H.; Maezawa, Y.; Kamitani, K.; Furusawa, N.; Imura, S.; Tomita, K. Osteoporotic vertebral collapse with late neurological complications. Paraplegia 1995, 33, 281–289. [Google Scholar] [CrossRef]
- Sarli, M.; Manghi, F.C.P.; Gallo, R.; Zanchetta, J.R. The vacuum cleft sign: an uncommon radiological sign. Osteoporos. Int. 2005, 16, 1210–1214. [Google Scholar] [CrossRef]
- Jang, J.-S.; Kim, D.-Y.; Lee, S.-H. Efficacy of percutaneous vertebroplasty in the treatment of intravertebral pseudarthrosis associated with noninfected avascular necrosis of the vertebral body. Spine 2003, 28, 1588–1592. [Google Scholar] [CrossRef] [PubMed]
- Osterhouse, M.D.; Kettner, N.W. Delayed posttraumatic vertebral collapse with intravertebral vacuum cleft. J. Manip. Physiol. Ther. 2002, 25, 270–275. [Google Scholar] [CrossRef]
- He, D.; Yu, W.; Chen, Z.; Li, L.; Zhu, K.; Fan, S. Pathogenesis of the intravertebral vacuum of Kümmell's disease. Exp. Ther. Med. 2016, 12, 879–882. [Google Scholar] [CrossRef]
- Adamska, O.; Modzelewski, K.; Stolarczyk, A.; Kseniuk, J. Is Kummell’s Disease a Misdiagnosed and/or an Underreported Complication of Osteoporotic Vertebral Compression Fractures? A Pattern of the Condition and Available Treatment Modalities. J. Clin. Med. 2021, 10, 2584. [Google Scholar] [CrossRef]
- Nickell, L.T.; Schucany, W.G.; Opatowsky, M.J. Kummell disease. Proc (Bayl Univ Med Cent). 2013, 26, 300–301. [Google Scholar] [CrossRef] [PubMed]
- Maheshwari, P.R.; Nagar, A.M.; Prasad, S.S.; Shah, J.R.; Patkar, D.P. Avascular necrosis of spine: a rare appearance. Spine 2004, 29, E119–E122. [Google Scholar] [CrossRef] [PubMed]
- Ito, Y.; Hasegawa, Y.; Toda, K.; Nakahara, S. Pathogenesis and diagnosis of delayed vertebral collapse resulting from osteoporotic spinal fracture. Spine J. 2002, 2, 101–106. [Google Scholar] [CrossRef]
- Swartz, K.; Fee, D. Kümmell’s disease: a case report and literature review. Spine 2008, 33, E152–E155. [Google Scholar] [CrossRef] [PubMed]
- Lee, D.G.; Bae, J.H. Fatty infiltration of the multifidus muscle independently increases osteoporotic vertebral compression fracture risk. BMC Musculoskelet. Disord. 2023, 24, 508. [Google Scholar] [CrossRef]
- Kim, J.Y.; Chae, S.U.; Kim, G.D.; Cha, M.S. Changes of paraspinal muscles in postmenopausal osteoporotic spinal compression fractures: magnetic resonance imaging study. J. Bone Metab. 2013, 20, 75–81. [Google Scholar] [CrossRef]
- Jeon, I.; Kim, S.W.; Yu, D. Paraspinal muscle fatty degeneration as a predictor of progressive vertebral collapse in osteoporotic vertebral compression fractures. Spine J. 2022, 22, 313–320. [Google Scholar] [CrossRef]
- Martin, B.I.; Bono, C.M. Artificial intelligence and spine: rise of the machines. Spine J. 2021, 21, 1604–1605. [Google Scholar] [CrossRef]
- Yabu, A.; Hoshino, M.; Tabuchi, H.; Takahashi, S.; Masumoto, H.; Akada, M.; Morita, S.; Maeno, T.; Iwamae, M.; Inose, H.; et al. Using artificial intelligence to diagnose fresh osteoporotic vertebral fractures on magnetic resonance images. Spine J. 2021, 21, 1652–1658. [Google Scholar] [CrossRef]
- Wang, Y.; Mehrabi, S.; Sohn, S.; Atkinson, E.J.; Amin, S.; Liu, H. Natural language processing of radiology reports for identification of skeletal site-specific fractures. BMC Med Inform. Decis. Mak. 2019, 19 (Suppl. 3), 73. [Google Scholar] [CrossRef]
- Wright, R.E. Logistic regression. Reading and understanding multivariate statistics. American Psychological Association; 1995:217-244.
- Breiman, L. Random forests. Mach. Learn. 2001, 45, 5–32. [Google Scholar] [CrossRef]
- Chen, T.; Guestrin, C. XGBoost: A Scalable Tree Boosting System. presented at: Proceedings of the 22nd ACM SIGKDD International Conference on Knowledge Discovery and Data Mining; 2016, San Francisco, California, USA. [CrossRef]
- Pal, S.; Mitra, S. Multilayer perceptron, fuzzy sets, and classification. IEEE Trans. Neural Networks 1992, 3, 683–697. [Google Scholar] [CrossRef] [PubMed]
- Lane, J.I.; Maus, T.P.; Wald, J.T.; Thielen, K.R.; Bobra, S.; Luetmer, P.H. Intravertebral clefts opacified during vertebroplasty: pathogenesis, technical implications, and prognostic significance. AJNR Am J Neuroradiol. 2002, 23, 1642–1646. [Google Scholar]
- Gu, Y.; Wang, C.; Hu, J.; Chen, Y.; Yu, W.; Wang, Z.; Wang, X.; Yuan, W. Association Between the Cervical Extensor Musculature and the Demographic Features, Symptoms, and Sagittal Balance in Patients with Multilevel Cervical Spondylotic Myelopathy. World Neurosurg. 2023, 169, e40–e50. [Google Scholar] [CrossRef] [PubMed]
- Suo, M.; Zhang, J.; Sun, T.; Wang, J.; Liu, X.; Huang, H.; Li, Z. The association between morphological characteristics of paraspinal muscle and spinal disorders. Ann. Med. 2023, 55, 2258922. [Google Scholar] [CrossRef] [PubMed]
- Zhao, Y.; Huang, M.; Sosa, M.S.; Cattell, R.; Fan, W.; Li, M.; Chen, J.; Gao, M.; Zhou, Q.; Li, S.; et al. Fatty infiltration of paraspinal muscles is associated with bone mineral density of the lumbar spine. Arch. Osteoporos. 2019, 14, 99. [Google Scholar] [CrossRef]
- Tekin, Z.N.; Karatekin, B.D. Relationship between the Properties of Paraspinal Muscles and Bone Mineral Density in Osteoporotic Patients. J. Coll. Physicians Surg. Pak. 2022, 32, 1137–1142. [Google Scholar] [CrossRef]
- You, K.-H.; Cho, M.; Lee, J.H. Effect of Muscularity and Fatty Infiltration of Paraspinal Muscles on Outcome of Lumbar Interbody Fusion. J. Korean Med Sci. 2023, 38, e151. [Google Scholar] [CrossRef]
- Han, G.; Zou, D.; Liu, Z.; Zhang, B.; Gong, C.; Zhou, S.; Li, W.; Sun, Z.; Li, W. Fat infiltration of paraspinal muscles as an independent risk for bone nonunion after posterior lumbar interbody fusion. BMC Musculoskelet. Disord. 2022, 23, 232. [Google Scholar] [CrossRef]
- Moore, R.J. The vertebral end-plate: what do we know? Eur. Spine J. 2000, 9, 92–96. [Google Scholar] [CrossRef]
- Ollila, L.; Oura, P.; Karppinen, J.; Niinimäki, J.; Junno, J.-A. Association between vertebral cross-sectional area and lumbar disc displacement—a population-based study. Eur. Spine J. 2024, 33, 900–905. [Google Scholar] [CrossRef] [PubMed]
- Li, W.; Wang, H.; Dong, S.; Tang, Z.-R.; Chen, L.; Cai, X.; Hu, Z.; Yin, C. Establishment and validation of a nomogram and web calculator for the risk of new vertebral compression fractures and cement leakage after percutaneous vertebroplasty in patients with osteoporotic vertebral compression fractures. Eur. Spine J. 2021, 31, 1108–1121. [Google Scholar] [CrossRef] [PubMed]
- Hiwatashi, A.; Westesson, P. Patients with osteoporosis on steroid medication tend to sustain subsequent fractures. Am. J. Neuroradiol. 2007, 28, 1055–1057. [Google Scholar] [CrossRef]
- Lisco, G.; Disoteo, O.E.; De Tullio, A.; De Geronimo, V.; Giagulli, V.A.; Monzani, F.; Jirillo, E.; Cozzi, R.; Guastamacchia, E.; De Pergola, G.; et al. Sarcopenia and Diabetes: A Detrimental Liaison of Advancing Age. Nutrients 2023, 16, 63. [Google Scholar] [CrossRef]
- Wang, M.; Tan, Y.; Shi, Y.; Wang, X.; Liao, Z.; Wei, P. Diabetes and Sarcopenic Obesity: Pathogenesis, Diagnosis, and Treatments. Front. Endocrinol. 2020, 11, 568. [Google Scholar] [CrossRef]
- Karakousis, N.D.; Biliou, S.; Pyrgioti, E.E.; Georgakopoulos, P.N.; Liakopoulos, V.; Papanas, N. Frailty, sarcopenia and diabetic kidney disease: where do we stand? Int. Urol. Nephrol. 2023, 55, 1173–1181. [Google Scholar] [CrossRef] [PubMed]
- Murray, C.E.; Coleman, C.M. Impact of Diabetes Mellitus on Bone Health. Int. J. Mol. Sci. 2019, 20, 4873. [Google Scholar] [CrossRef]
- Henderson, S.; Ibe, I.; Cahill, S.; Chung, Y.-H.; Lee, F.Y. Bone Quality and Fracture-Healing in Type-1 and Type-2 Diabetes Mellitus. J. Bone Jt. Surg. 2019, 101, 1399–1410. [Google Scholar] [CrossRef]
- McCarthy, J.; Davis, A. Diagnosis and Management of Vertebral Compression Fractures. Am Fam Physician 2016, 94, 44–50. [Google Scholar]
- Cheng, Y.; Cheng, X.; Wu, H. Risk factors of new vertebral compression fracture after percutaneous vertebroplasty or percutaneous kyphoplasty. Front. Endocrinol. 2022, 13, 964578. [Google Scholar] [CrossRef]
- Nielsen, B.R.; Abdulla, J.; Andersen, H.E.; Schwarz, P.; Suetta, C. Sarcopenia and osteoporosis in older people: a systematic review and meta-analysis. Eur. Geriatr. Med. 2018, 9, 419–434. [Google Scholar] [CrossRef] [PubMed]
- Kim, H.-J.; Park, S.; Park, S.-H.; Park, J.; Chang, B.-S.; Lee, C.-K.; Yeom, J.S. Prevalence of Frailty in Patients with Osteoporotic Vertebral Compression Fracture and Its Association with Numbers of Fractures. Yonsei Med J. 2018, 59, 317–324. [Google Scholar] [CrossRef] [PubMed]
Figure 1.
Diagram illustrating the data collection process and the segmentation process into training and test sets.
Figure 1.
Diagram illustrating the data collection process and the segmentation process into training and test sets.
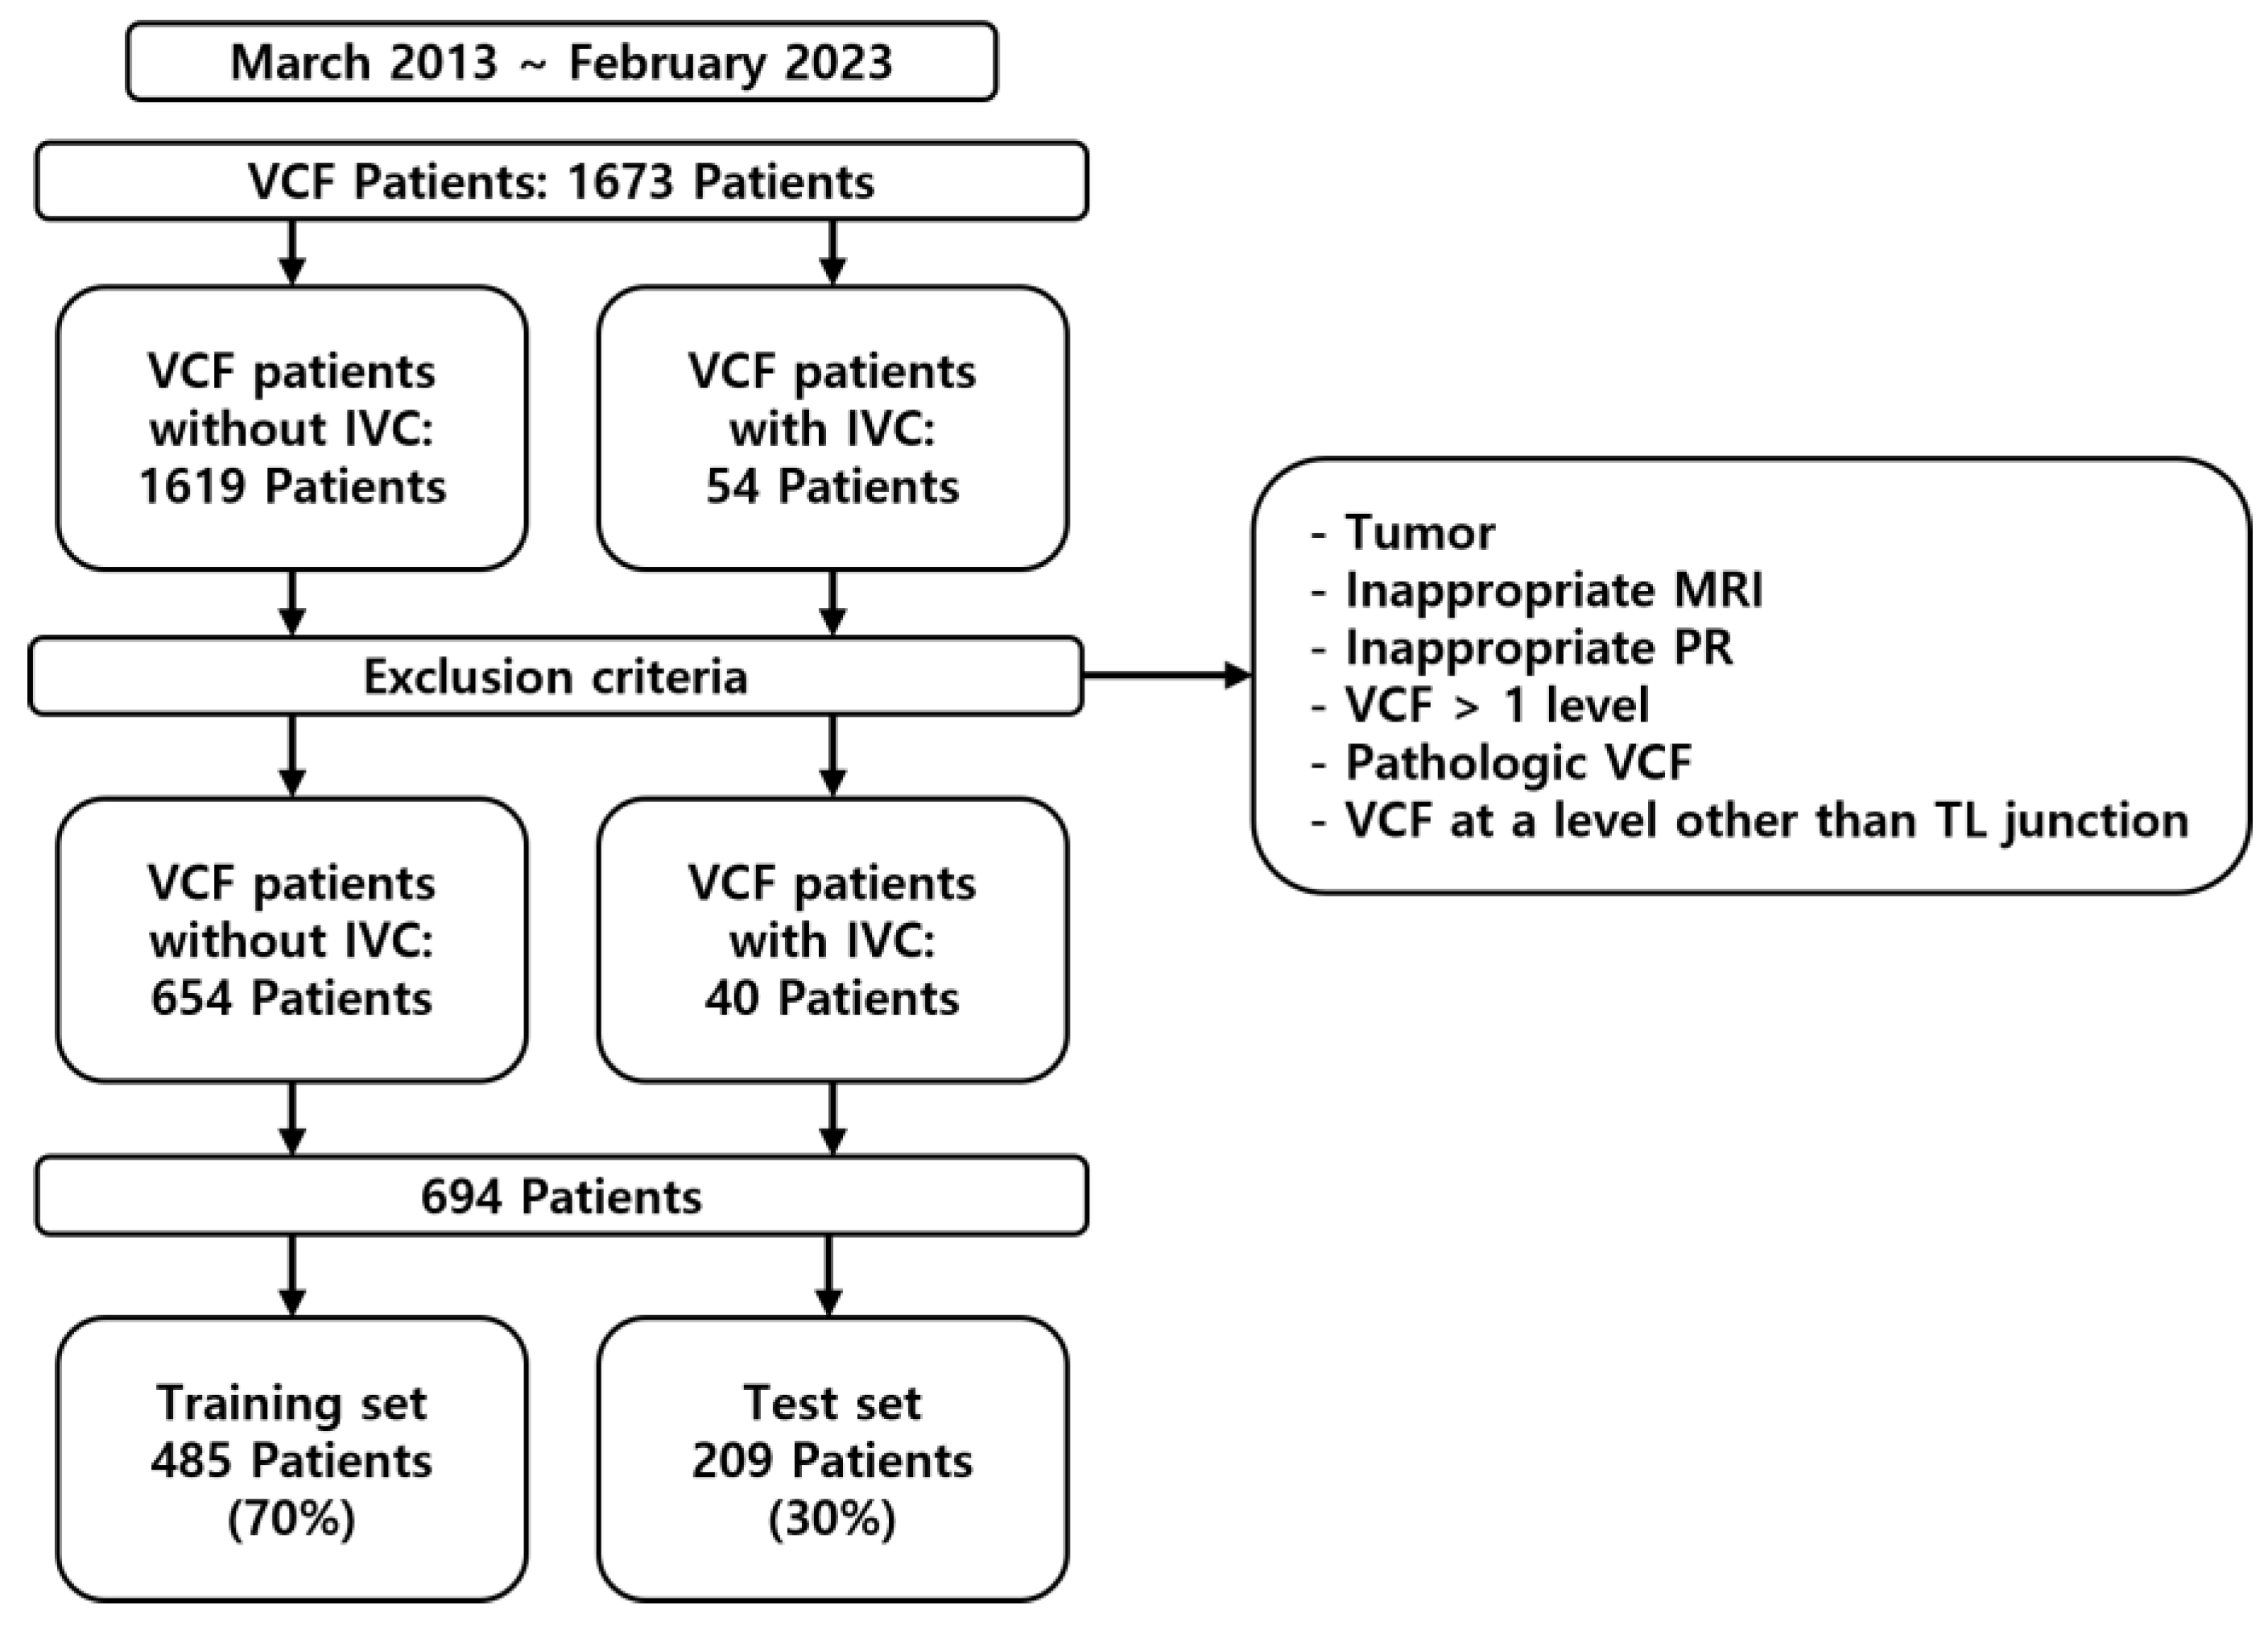
Figure 2.
Measurement of kyphotic angular and compression value. The kyphotic angular and compression value are measured within the picture archiving and communication (PACS) system PR lateral view; D shows the kyphotic angle of the T11 fracture; the compression value is calculated as ((A+C)/2)-B)/ ((A+2)/2).
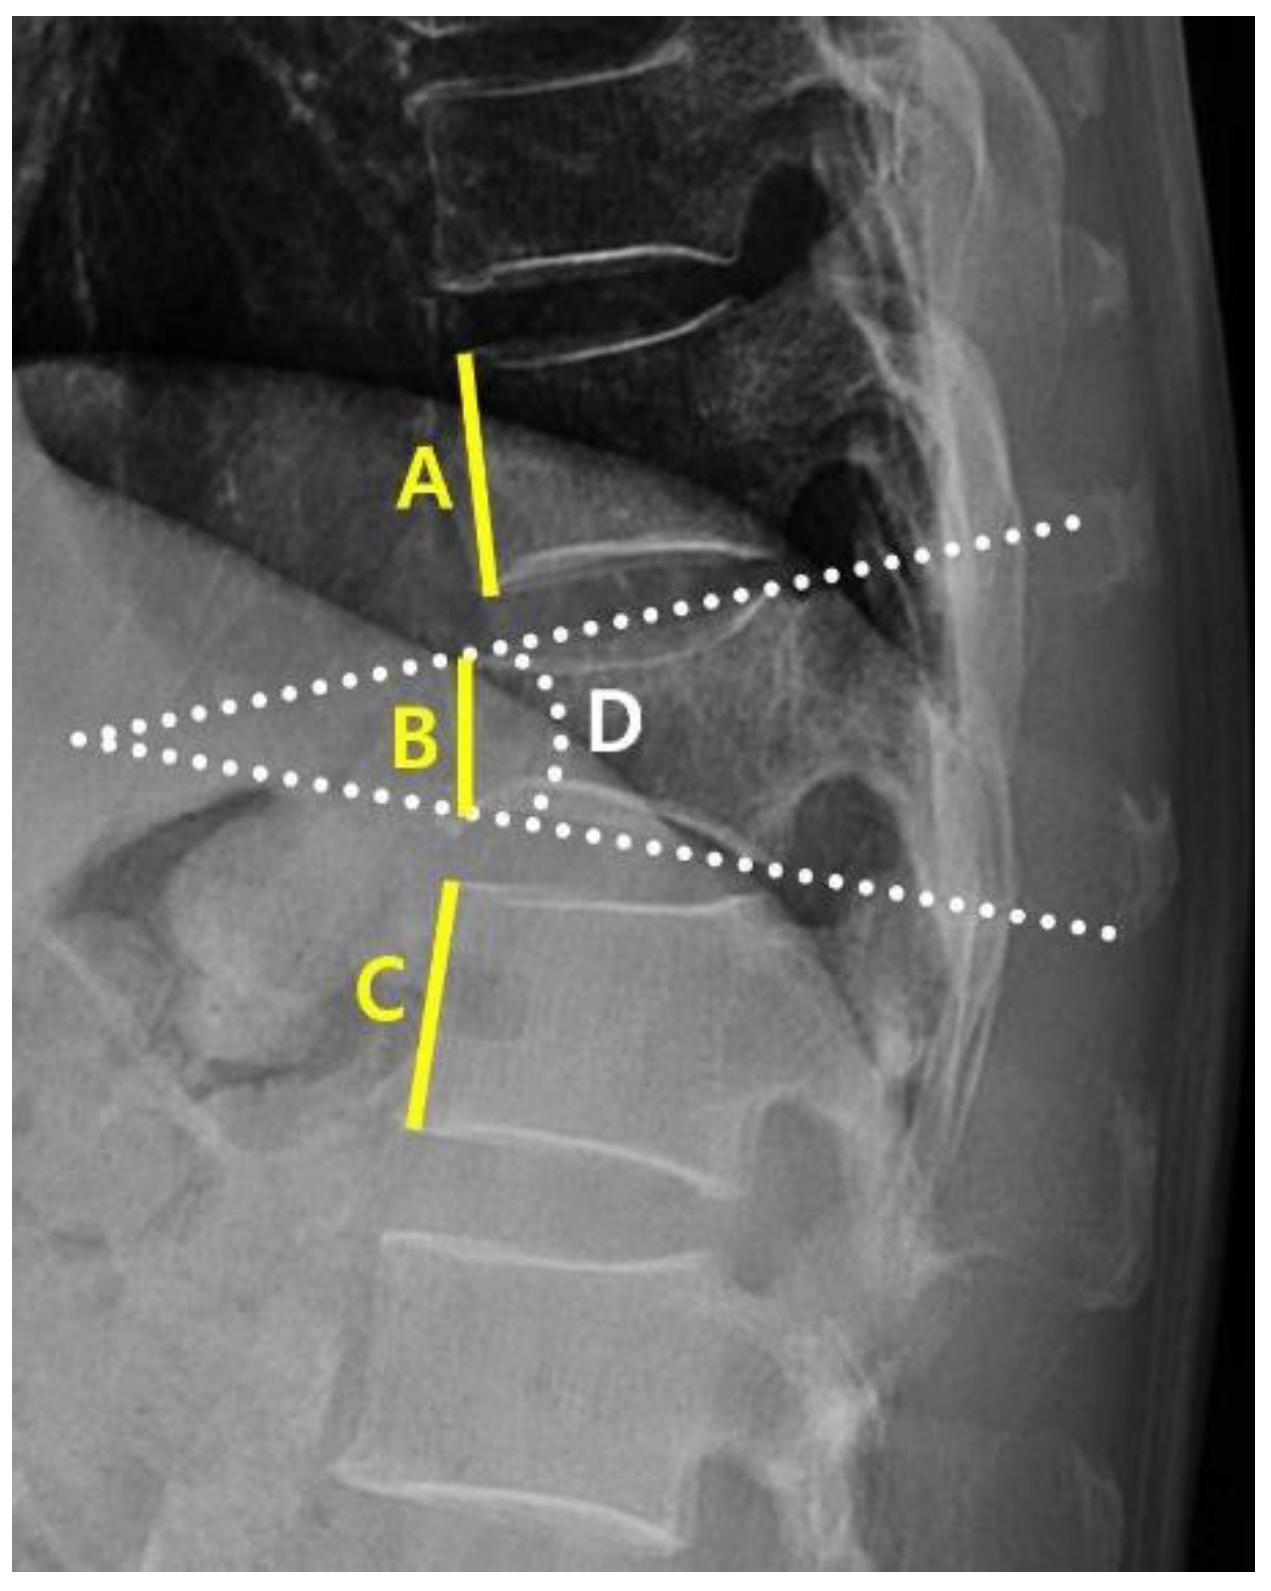
Figure 3.
Measurement variables from axial view, (a) Measurement of CSA of endplate, MF and ES of VCF location, measured within PACS system MRI axial view. The CSA of MF, ES was calculated as the mean of the left and right CSA. (b) MFfi and ESfi measured within ImageJ program and calculated as the mean of the left and right fatty infiltration percentage.
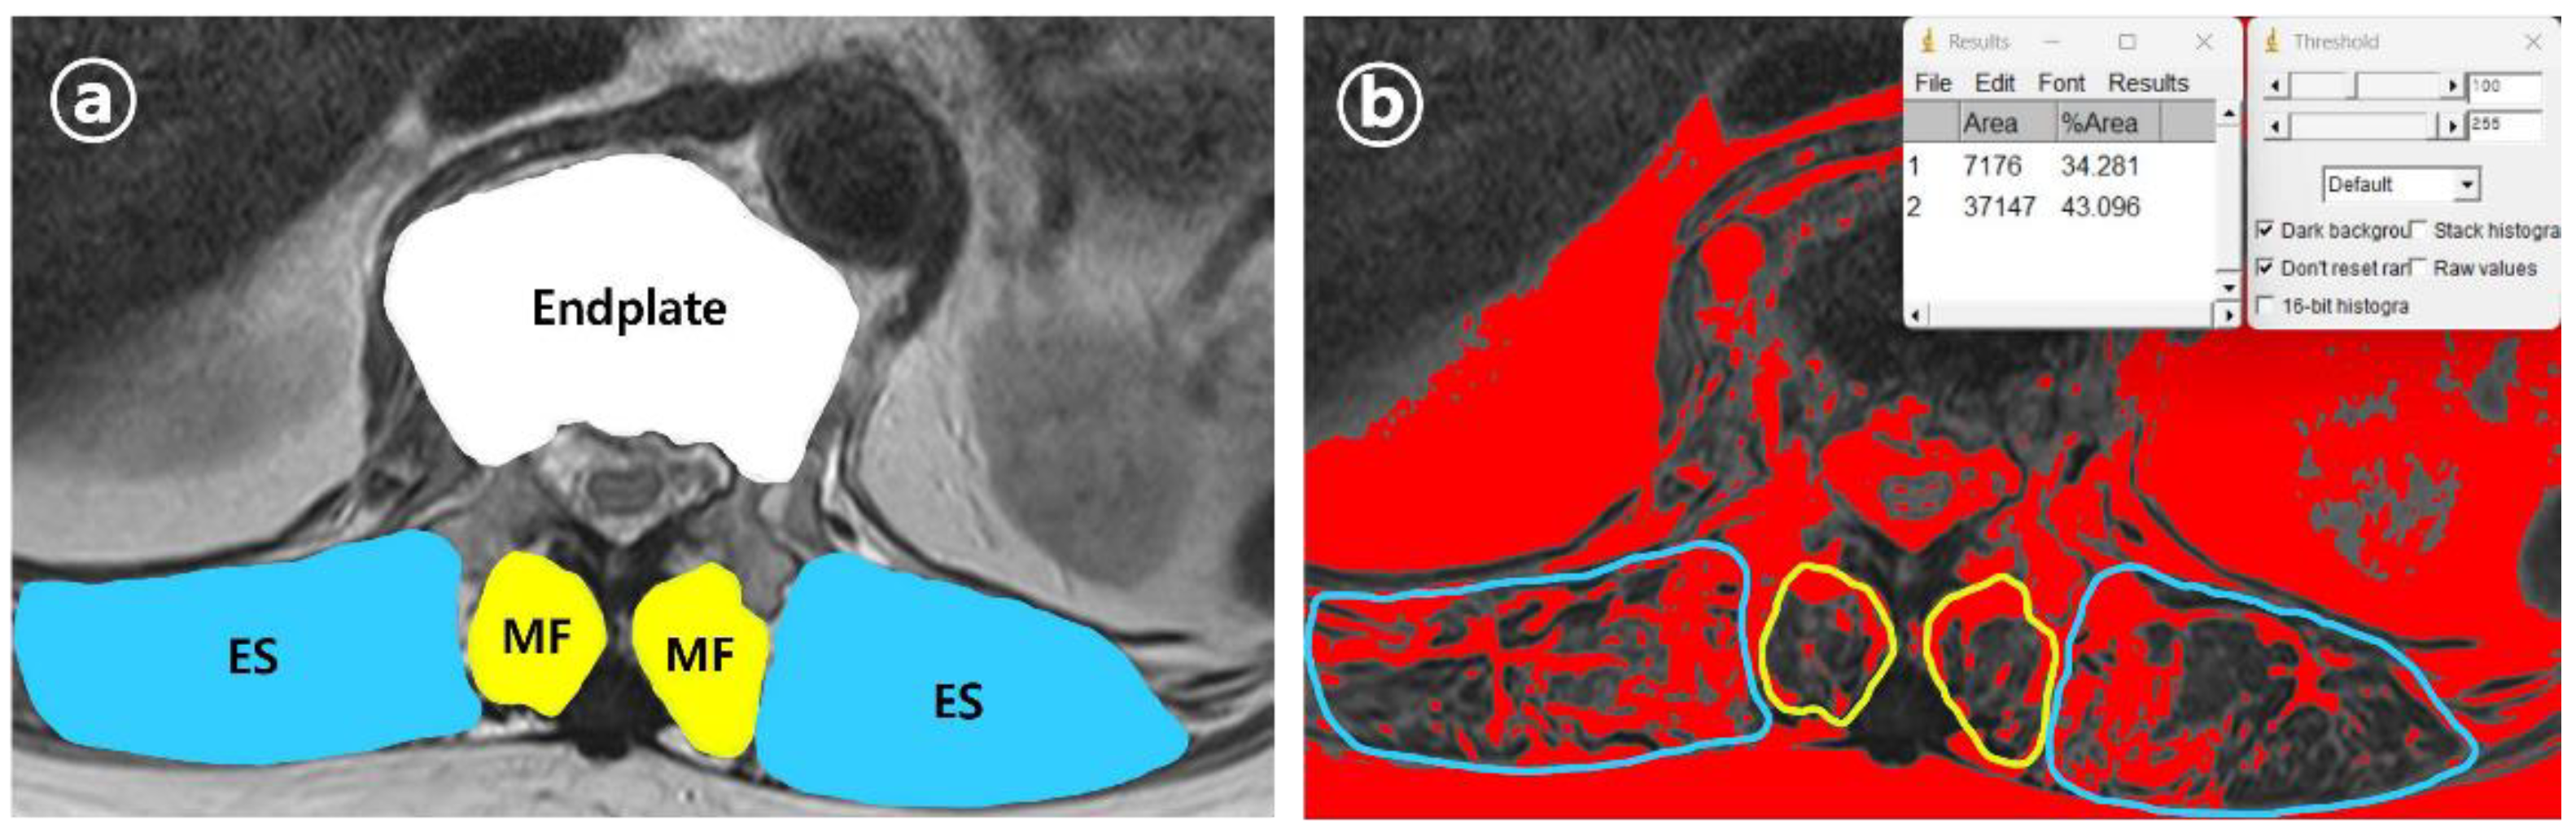
Figure 4.
Receiver operating characteristic curve for each ML model on SETTING_1.
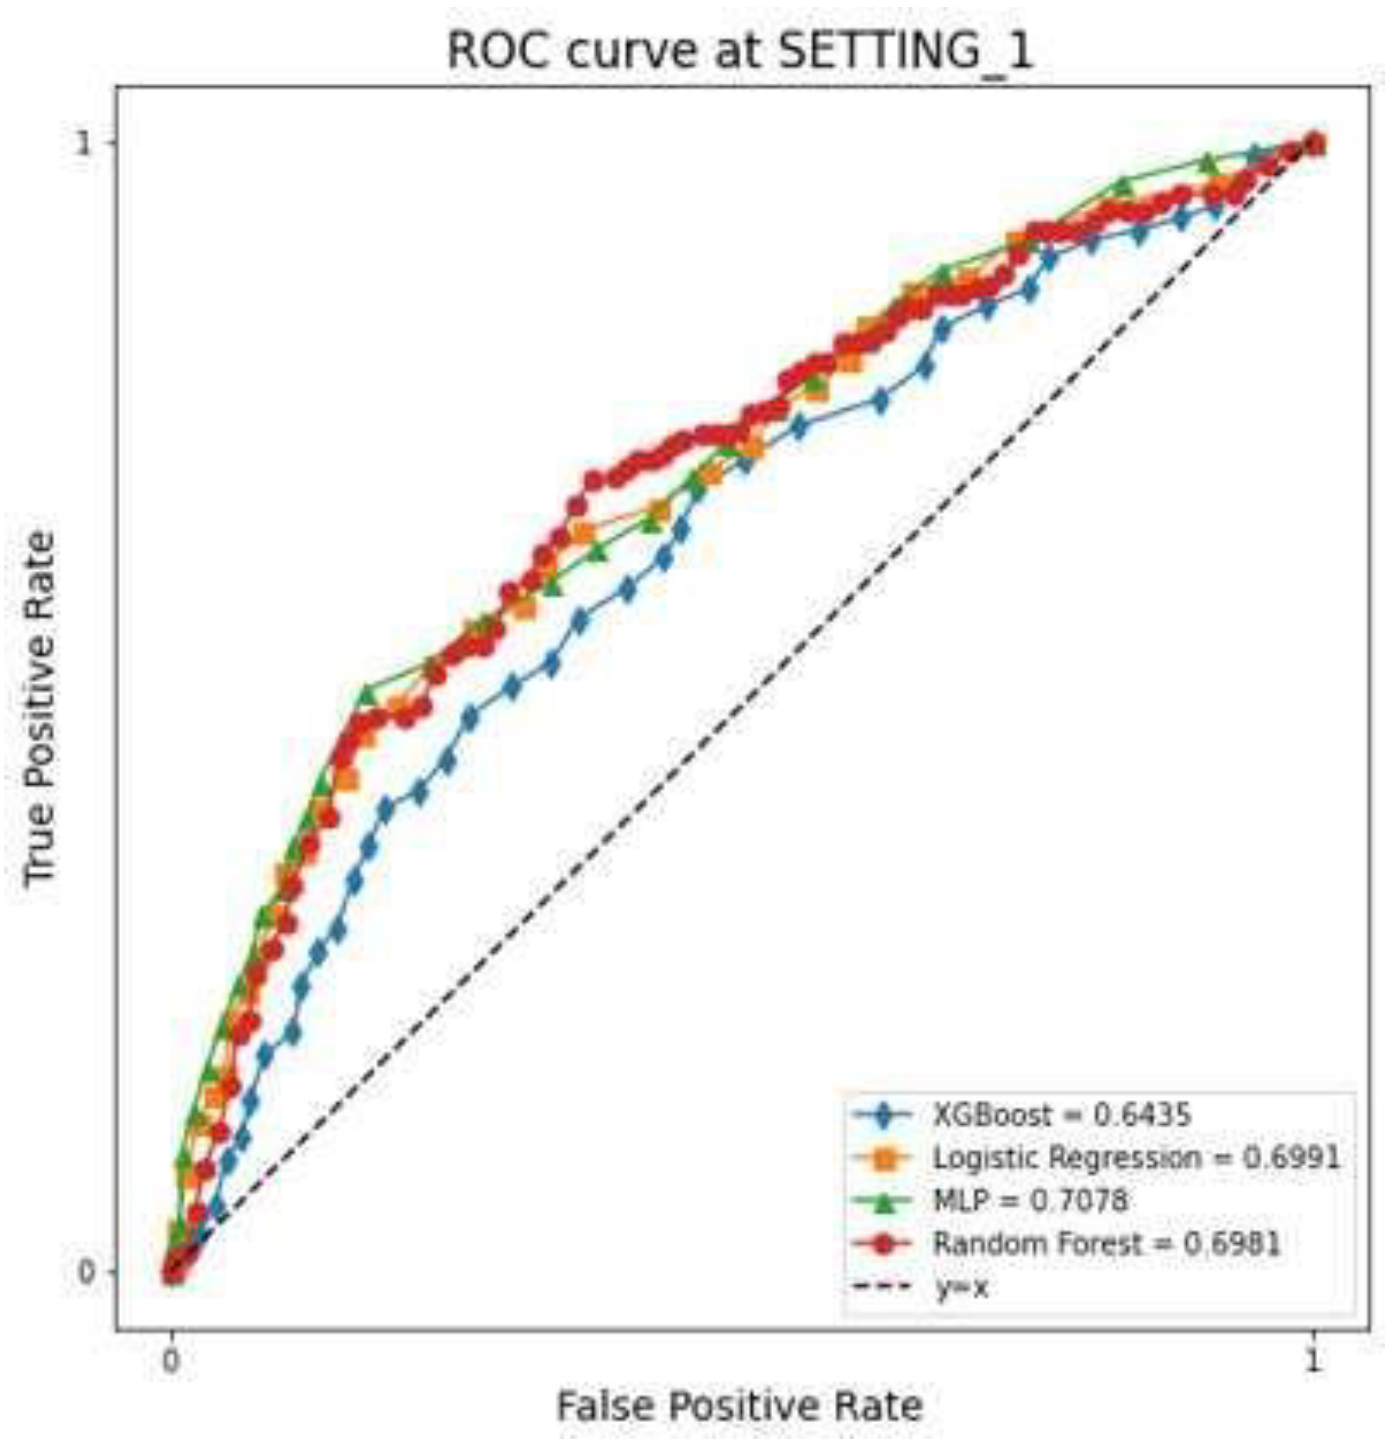
Figure 5.
Receiver operating characteristic curve for each ML model on SETTING_2.
Figure 6.
Feature importance of RF in SETTING_1.
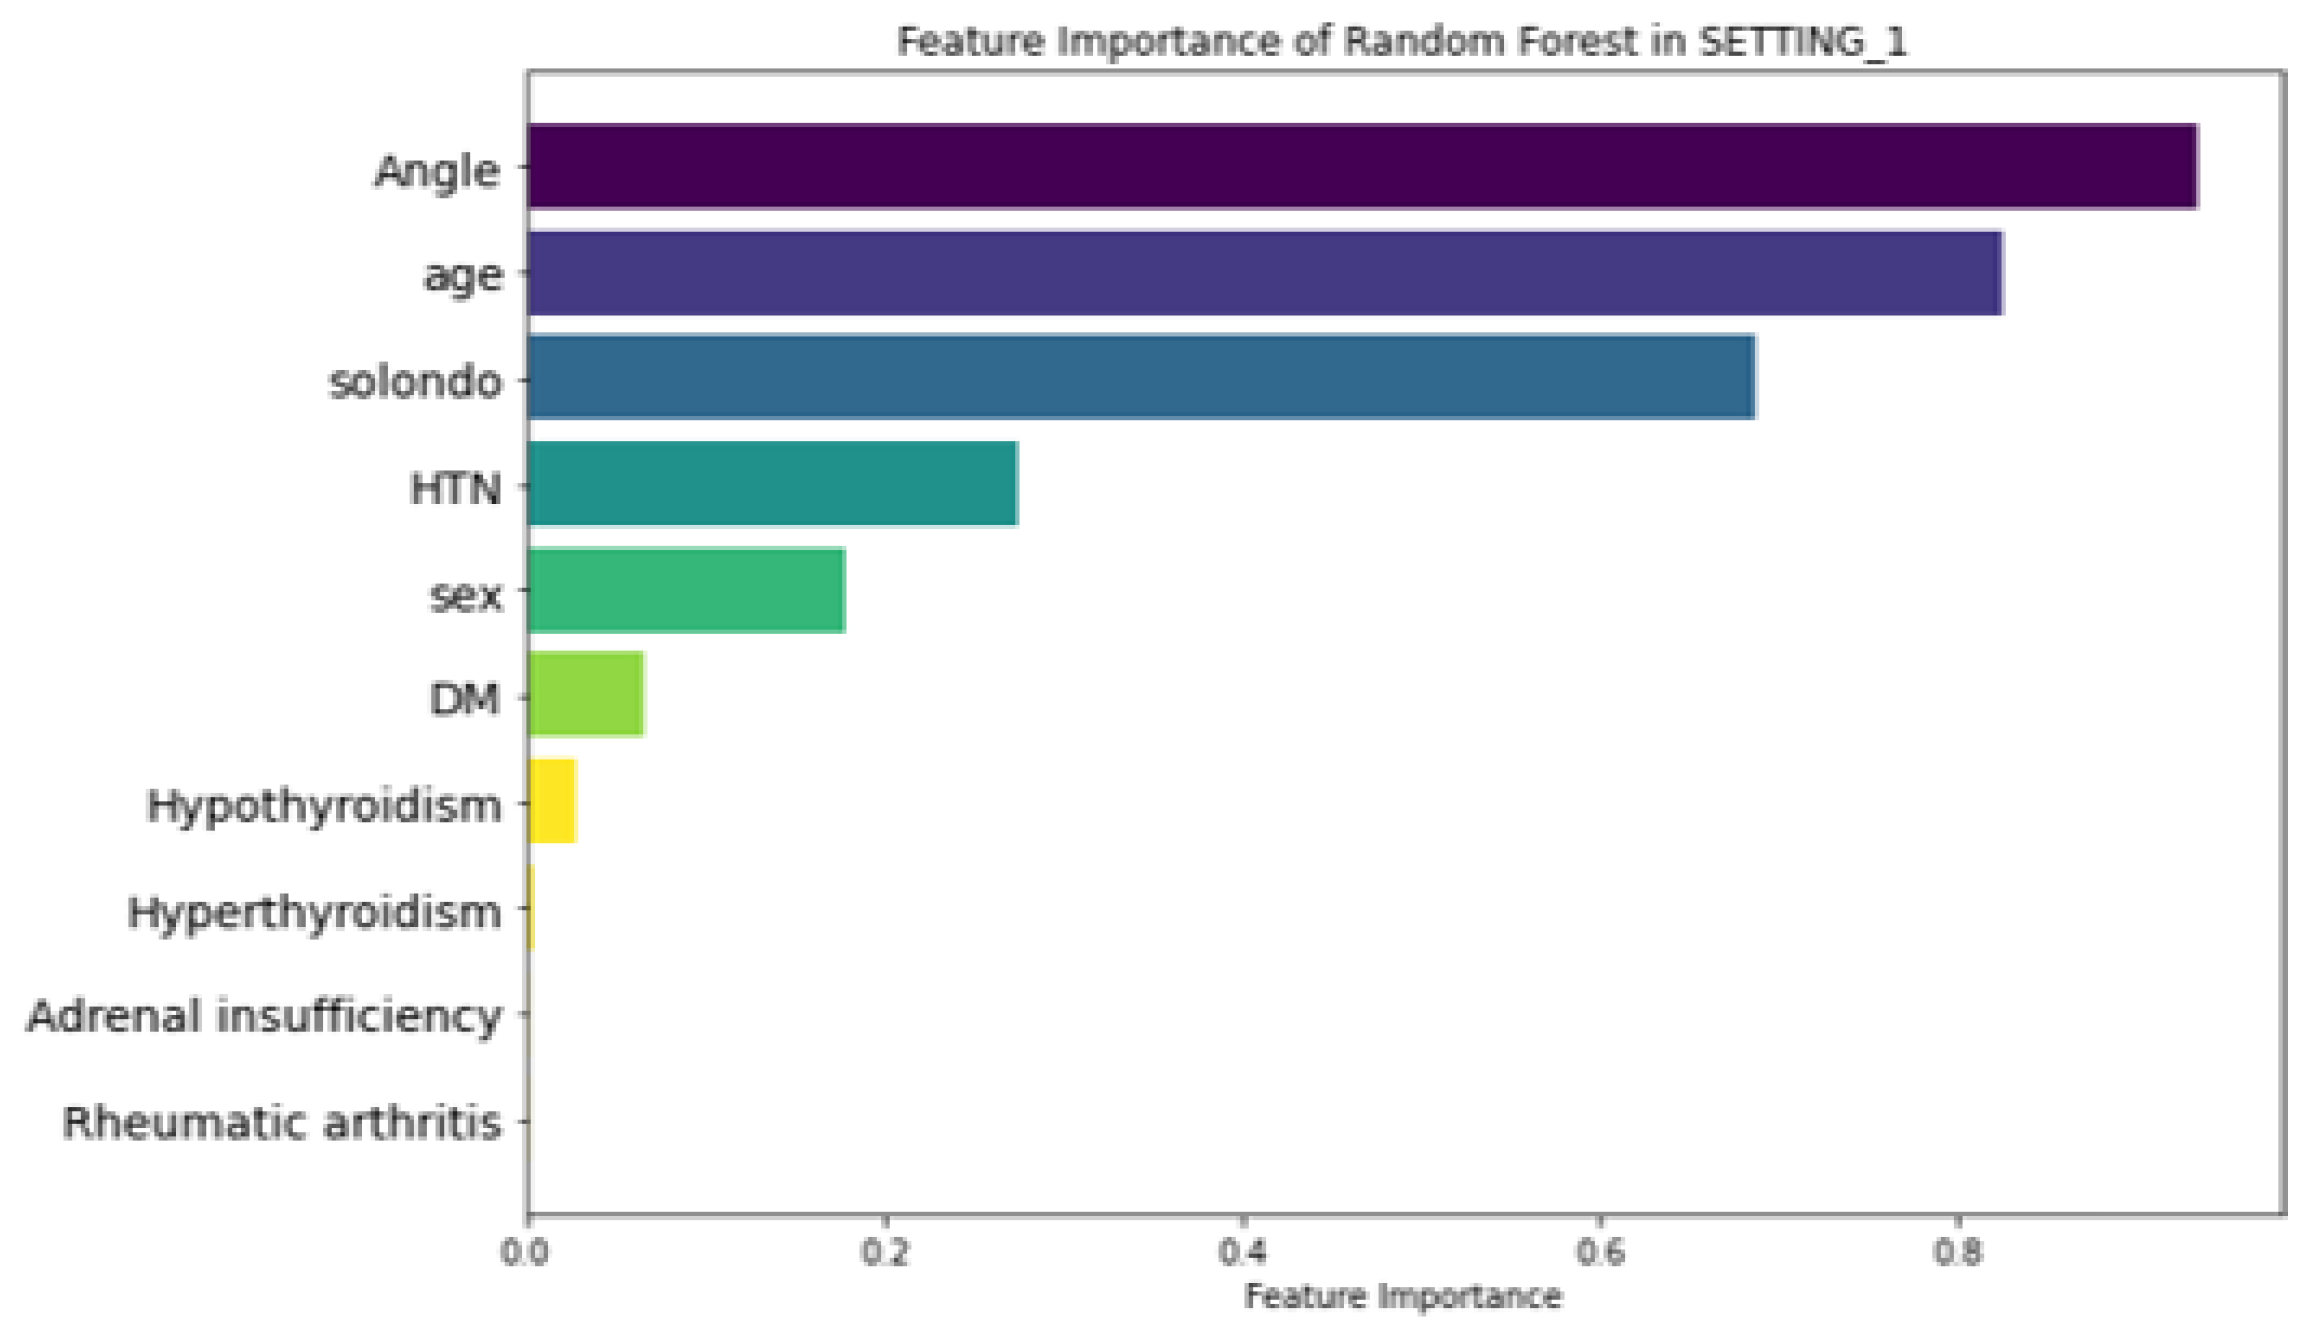
Figure 7.
Feature importance of RF in SETTING_2.
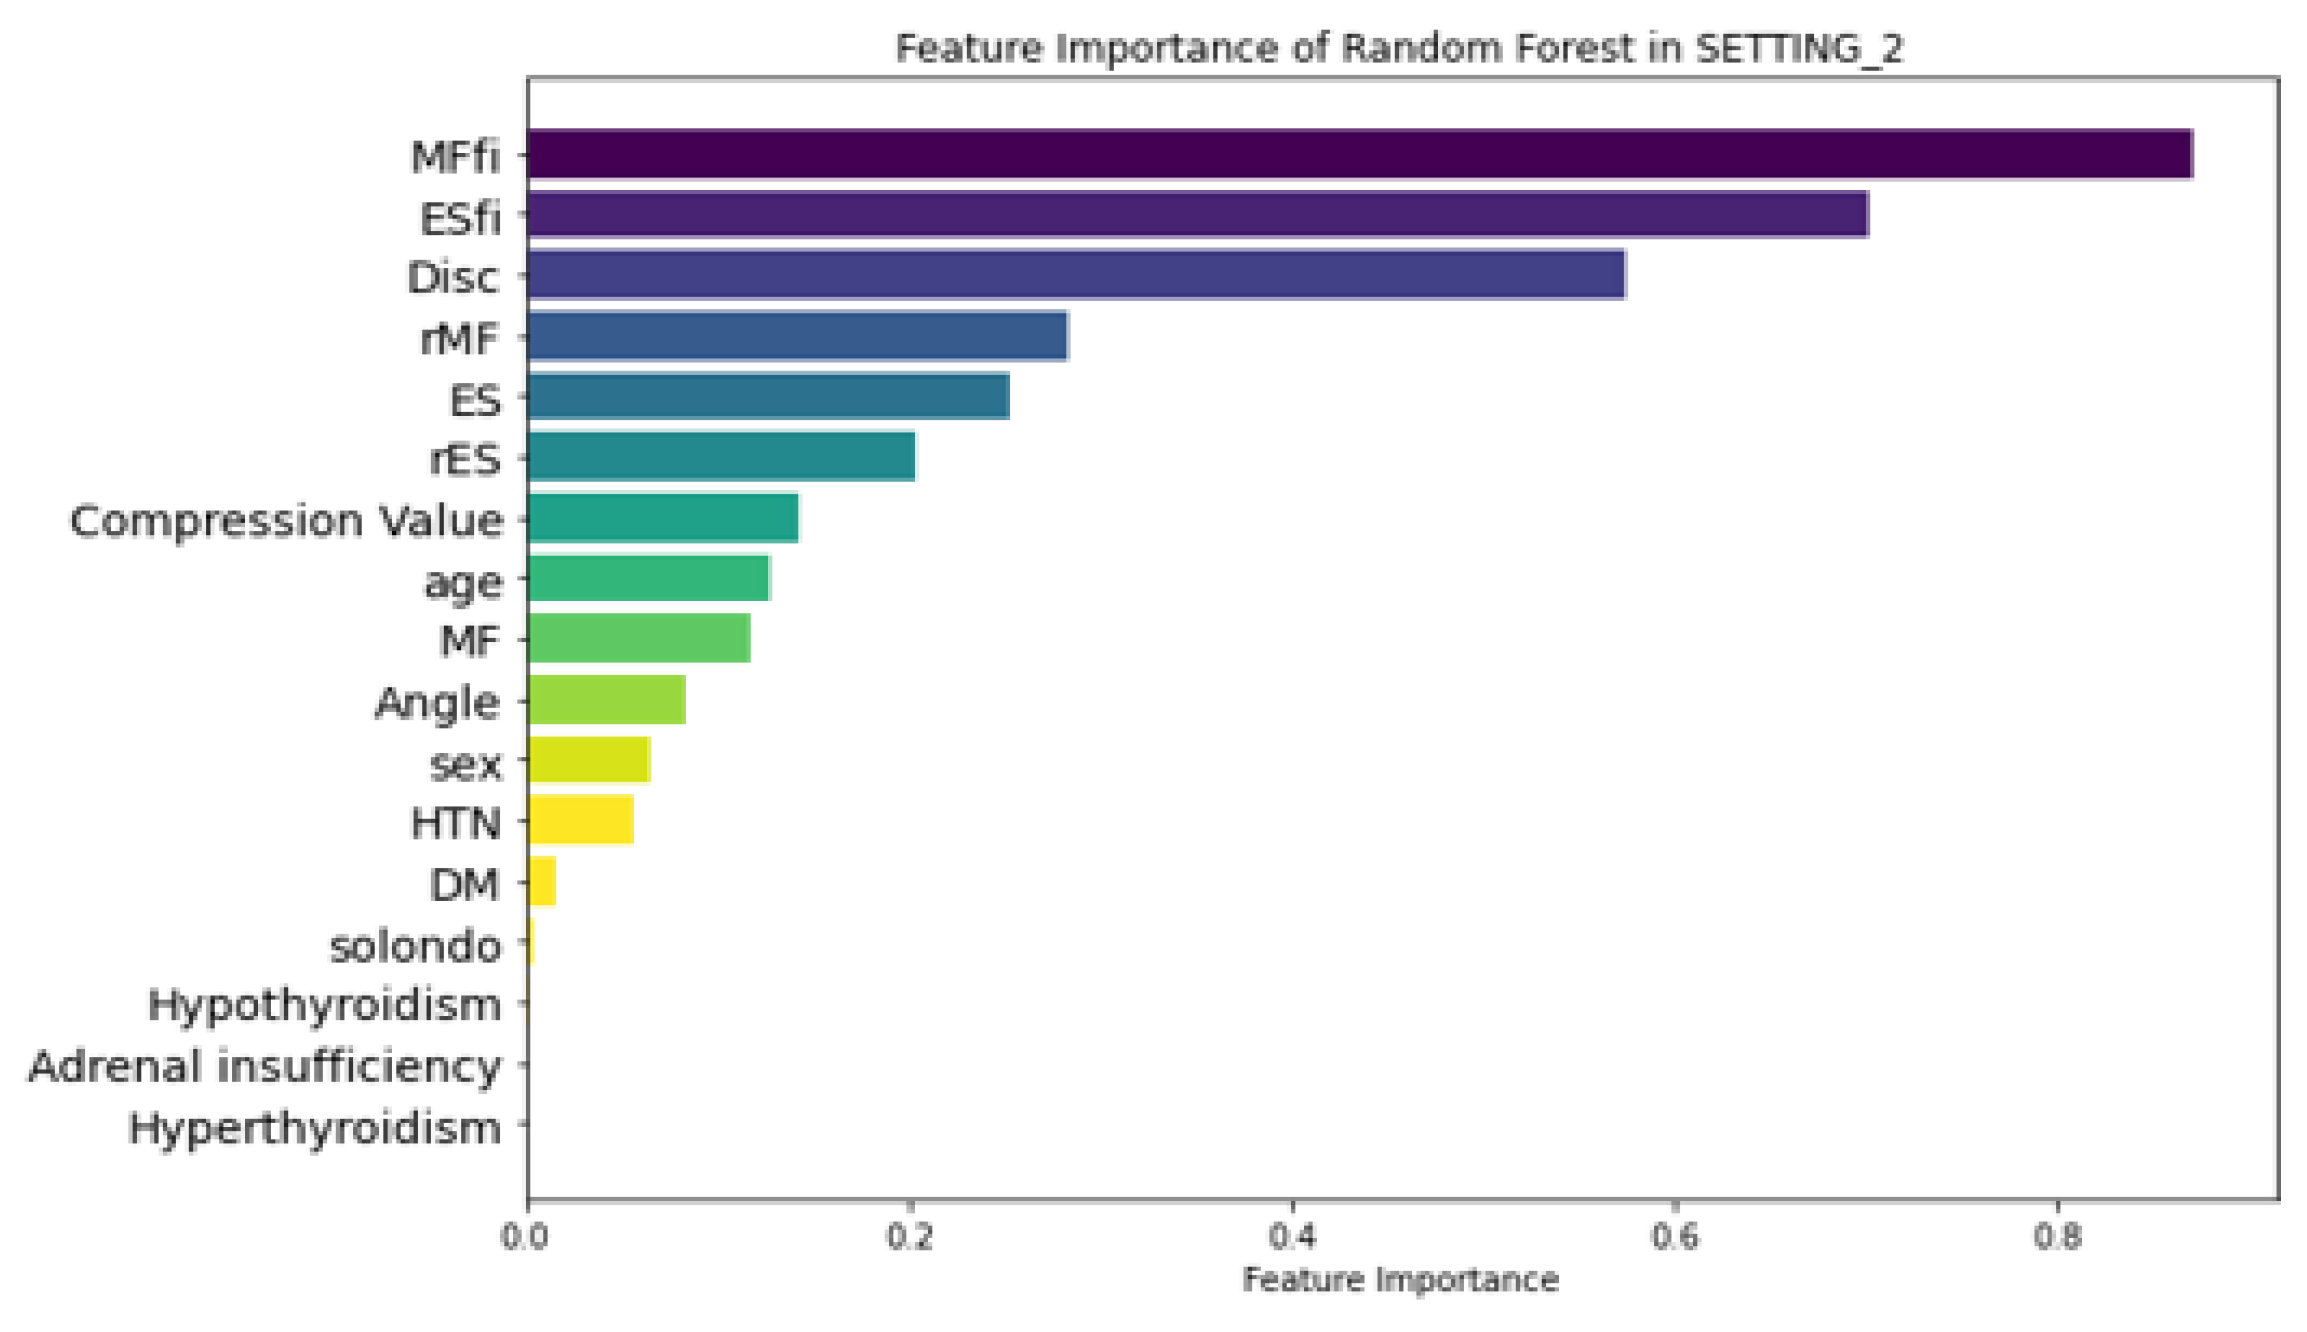

Table 1.
Patient demographics.
| Data Source | Characteristics | Number of Patients (%) | Description | p Value | |
|---|---|---|---|---|---|
| VCF Patients Without IVC |
VCF Patients with IVC |
||||
| EMR | Age | 72.44 ± 1.15 | 79.85 ± 3.35 | Age at diagnosis | <0.05* |
| Sex | F: 464 (71%) M: 190 (29%) |
F: 27 (67%) M: 13 (33%) |
Sex of patients | 0.7746 | |
| DM | P: 76 (12%) N: 578 (88%) |
P: 4 (10%) N: 36 (90%) |
Diabetes status | 0.9549 | |
| HTN | P: 259 (40%) N: 395 (60%) |
P: 13 (67%) N: 27 (33%) |
Hypertension status | 0.4676 | |
| Adrenal insufficiency | P: 7 (1%) N: 647 (99%) |
P: 1 (3%) N: 39 (97%) |
Adrenal insufficiency status | 0.9527 | |
| Hyperthyroidism | P: 1 (1%) N: 653 (99%) |
P: 0 (0%) N: 40 (100%) |
Hyperthyroidism status | 1.0 | |
| Hypothyroidism | P: 10 (2%) N: 644 (98%) |
P: 0 (0%) N: 40 (100%) |
Hypothyroidism status | 0.9169 | |
| Steroid | P: 23 (4%) N: 631 (96%) |
P: 1 (3%) N: 39 (97%) |
Continuous taking oral steroids= for more than 3 months | 1.0 | |
| PR (Lateral view) | Kyphotic angle (°) | 19.89 ± 0.49 | 25.01 ± 4.21 | Kyphotic angulation at VCF | <0.05* |
| Compression Value | 34.41 ± 1.27 | 48.31 ± 6.50 | Compression ratio at VCF | <0.05* | |
| MRI (Axial view) | Disc (cm/m2) | 12.51 ± 0.21 | 15.14 ± 0.93 | CSA of endplate at VCF | <0.05* |
| MF (cm/m2) | 4.13 ± 0.14 | 2.95 ± 0.31 | CSA of MF at VCF | <0.05* | |
| MFfi (%) | 16.39 ± 0.53 | 37.29 ± 4.58 | Fatty infiltration percentage of MF | <0.05* | |
| rMF | 0.34 ± 0.01 | 0.20 ± 0.02 | CSA of relative MF at VCF | <0.05* | |
| ES (cm/m2) | 20.37 ± 0.66 | 12.12 ± 1.43 | CSA of ES at VCF | <0.05* | |
| ESfi (%) | 10.25 ± 0.51 | 29.03 ± 4.85 | Fatty infiltration percentage of ES | <0.05* | |
| rES | 1.66 ± 0.05 | 0.83 ± 0.11 | CSA of relative ES at VCF | <0.05* | |
*, Statistically significant.
Table 2.
Performance of each machine learning model on test set.
| Datasets | Models | Accuracy | Specificity | Sensitivity | Precision | F1-score | AUROC |
|---|---|---|---|---|---|---|---|
| SETTING_1 | Logistic Regression | 0.757 | 0.957 | 0.143 | 0.527 | 0.223 | 0.699 |
| Random Forest | 0.871 | 0.958 | 0.185 | 0.365 | 0.244 | 0.698 | |
| XGBoost | 0.856 | 0.949 | 0.154 | 0.296 | 0.192 | 0.643 | |
| Multi-Layer Perceptron | 0.76 | 0.961 | 0.151 | 0.553 | 0.232 | 0.708 | |
| SETTING_2 | Logistic Regression | 0.951 | 0.987 | 0.606 | 0.825 | 0.693 | 0.947 |
| Random Forest | 0.966 | 0.982 | 0.737 | 0.731 | 0.731 | 0.956 | |
| XGBoost | 0.962 | 0.987 | 0.661 | 0.796 | 0.72 | 0.951 | |
| Multi-Layer Perceptron | 0.961 | 0.978 | 0.748 | 0.716 | 0.723 | 0.904 |
Disclaimer/Publisher’s Note: The statements, opinions and data contained in all publications are solely those of the individual author(s) and contributor(s) and not of MDPI and/or the editor(s). MDPI and/or the editor(s) disclaim responsibility for any injury to people or property resulting from any ideas, methods, instructions or products referred to in the content. |
© 2025 by the authors. Licensee MDPI, Basel, Switzerland. This article is an open access article distributed under the terms and conditions of the Creative Commons Attribution (CC BY) license (http://creativecommons.org/licenses/by/4.0/).
Copyright: This open access article is published under a Creative Commons CC BY 4.0 license, which permit the free download, distribution, and reuse, provided that the author and preprint are cited in any reuse.


