Submitted:
07 April 2025
Posted:
08 April 2025
You are already at the latest version
Abstract
Understanding the relationship between geological and geomorphological processes is essential for reconstructing landscape evolution. This study investigates the influence of geology and geomorphology on landscape development in central Brazil, specifically within the Natividade Group distribution area. To achieve this, we integrated remote sensing data (Sentinel-2 and SRTM imagery) with geospatial analyses to generate two key maps: (i) a pedogeomorphological map, which classifies landforms and soil-landscape relationships, and (ii) a predictive geological-geomorphological map, which models spatial patterns of geological and geomorphological influence using machine-learning techniques. The identified pedoforms were grouped into three major slope classes, each reflecting distinct relationships among lithology, relief, and soil development. This classification structure enhances the interpretation of landscape evolution by linking physical terrain characteristics to underlying geological controls. The pedogeomorpho-logical map identified nine distinct pedoforms, reflecting variations in drainage density and patterns, relief and lithology. The spatial distribution of these parameters indicates strong correlations between soil development, geomorphological processes, and the underlying geological framework. Pedoforms associated with resistant lithology, such as quartzite-rich metasedimentary rocks, are linked to shallow, poorly developed soils, especially related to the Natividade Group, whereas areas with phyllite, schist, and Paleoproterozoic basement rocks of the Almas and Aurumina Terranes exhibit deeper, chemically weathered soils. These findings highlight the role of soil formation as a key indicator of landscape evolution in tropical climate regions. The predictive mapping approach employed a Random Forest classifier trained with 15 environmental predictors derived from remote sensing datasets. This analysis resulted in six landscape classes, revealing the ongoing interaction between geology, geomorphology, and surface pro-cesses. While the predictive model effectively delineated geological-geomorphological units, its moderate accuracy suggests that additional variables, such as geophysical data, could enhance classification. The results confirm that the interplay between geology and geomorphology significantly influences landscape evolution, though other factors, such as climate and vegetation, also play crucial roles. Tectonic events, including the Rhyacian amalgamation (~2.2 Ga), Statherian taphrogenesis (~1.6 Ga), Neoproterozoic orogeny (~600 Ma), and the formation of the Sanfranciscana Basin (~100 Ma), have left imprints on the region’s current landscape. The combination of remote sensing techniques with ge-ological and geomorphological studies provides a comprehensive framework for un-derstanding landscape evolution and supports land-use planning, environmental con-servation, and risk assessment in geologically complex regions.
Keywords:
Pedoforms
; Siliceous Rocks
; Tropical Climate
; Pedogenesis
; Landforms
1. Introduction
A complex interplay of geological, geomorphological, pedological and climatic factors, control the landscape evolution with rock type variations and structural configuration playing a fundamental role in terrain morphology and differential erosion [1]. These processes shape the present-day topography and reflect long-term geological and environmental changes [2]. In the South Tocantins State region, the geological history of the Natividade Group is a key factor in defining modern geomorphological features, influencing the distribution of landforms, drainage patterns, and terrain stability. Understanding these relationships is essential for reconstructing landscape evolution and assessing how past geological events have contributed to the present morphology.
This study investigates the geological and geomorphological controls on landscape evolution in the Natividade Basin, located in southeastern Tocantins State, central Brazil. The region is of particular interest due to the presence of the Natividade Gold Mine, a historic mining operation that has played a significant role in local economic development. The proximity of the mine to urban areas highlights the need for a detailed understanding of the geological and geomorphological factors shaping the landscape, as they influence terrain stability and land-use planning. Despite extensive geological research on the region’s basement complex and associated gold mineralization, the sedimentary basin itself remains understudied, even though it plays a fundamental role in defining regional landforms.
The Natividade Group consists of a Paleo-Mesoproterozoic metasedimentary sequence with a maximum depositional age of 1,776 Ma [3]. The basin evolved during the late Paleoproterozoic (Statherian), possibly extending into the early Mesoproterozoic, within the context of the northern external zone of the Neoproterozoic Brasília Belt [4,5]. Its formation was influenced by thermo-flexural subsidence, leading to the deposition of mixed siliciclastic-carbonate platforms and shallow-water turbidite facies. Geological models suggest that the Almas Block represented a high-paleorelief area that separated the Araí Basin to the south from the Natividade Basin to the north [3,6], a configuration that is still reflected in the present-day landscape.
Previous studies have identified eleven sedimentary rock types within the Natividade Group, clustered into four assemblages: (i) Sand-Silt-Carbonate, (ii) Sand-Conglomerate, (iii) Sand, and (iv) Silt-Clay. These rock types were deposited in four distinct environments: a mixed siliciclastic-carbonate platform, an internal siliciclastic platform, an open-marine siliciclastic platform, and a shallow-water turbidite system [6]. The lithological and structural characteristics of these units have played a central role in shaping the modern landscape, controlling variations in topography, drainage density, and landform distribution.
According to the geomorphological mapping of the Tocantins State [7], the study area comprises three major geomorphological units: the Basements in Complex Styles of the Alto Tocantins Depression, the Fold Belts and Metasedimentary Covers of the Serra de Natividade, and the Mangabeiras Stepped Relief of the Urucuia Group.
To investigate the relationship between the geological framework and landscape evolution, this study integrates geospatial analysis and remote sensing data. The research is based on two key geospatial products: (i) a landform or pedo-geomorphological map, which derives information on soil stratification based on geomorphic units and slope variations, and (ii) a predictive geological-geomorphological map, generated using Sentinel-2 and SRTM imagery, incorporating multiple remote sensing indices. These datasets offer a comprehensive perspective on the region’s landscape dynamics, enabling a deeper understanding of how geological and geomorphological processes have influenced terrain evolution over time.
By correlating geological and geomorphological characteristics with modern landscape features, this study aims to enhance knowledge of the Natividade region’s landscape evolution. The findings are expected to support future geological and geomorphological research, improve land-use planning strategies, and provide a framework for studying similar paleosedimentary basins worldwide.
2. Geological and Environmental Context
2.1. Geological Setting
The Natividade Group is a sedimentary sequence related to the Proterozoic basins in the Northern Brasília Belt, spanning from the Paleoproterozoic (Statherian) to the early Neoproterozoic (Tonian) [3,8]. The Veadeiros Supergroup includes the Araí, Traíras, and Paranoá groups, as well as the Quilombo Formation, and may encompass units with geographic and geochronological similarities, such as the Natividade, Serra da Mesa, and Canastra groups. The study area lies within the Tocantins Structural Province (Figure 1) [9], which comprises the Brasília, Araguaia, and Paraguay orogenetic belts [10,11].
In Brazil, the Amazonian and São Francisco cratons are partially covered by rift, sag, and rift-sag type volcano-sedimentary units deposited during the Paleoproterozoic and Mesoproterozoic. These basins are generally located at the margins or interiors of these cratonic landmasses and are commonly surrounded by Neoproterozoic fold belts (Figure 1a and b). The northern segment of the Brasília Belt is characterized by a general NE-SW structural trend and an overall east to southeast vergence. The external zone of the Brasília Belt, where the study area is located, comprises a pile of sedimentary sequences deformed against the western margin of the São Francisco Craton, including significant exposures of their sialic basement [12,13,14,15].
During the evolution of the Brasília Belt basement, an accretionary orogeny developed with the amalgamation of micro-blocks in the São Francisco Craton western margin from 2.5 to 2.2 Ga [19,20,21]. According to [22] all pre-Neoproterozoic rocks in the central-northern part of the Brasília Belt are grouped in the Goiás Massif, which can be divided into four distinct tectonic domains: the Archean-Paleoproterozoic Crixás-Goiás Domain and the Paleoproterozoic Almas-Conceição do Tocantins, Cavalcante-Arraias, and Campinorte domains.
This study adopts the [21] terminology, who defined the terms Almas Terrane for the Almas-Conceição do Tocantins and Aurumina Terrane for the Cavalcante-Arraias domain. The studied rocks are located in the Almas Terrane, which consists of an amphibolite facies greenstone-TTG (tonalite-trondhjemite-granodiorite) association [21,23,24]. Bordering the Almas Terrane, the Aurumina Terrane is characterized by peraluminous granite and tonalite/granodiorite emplaced on the western border of the São Francisco Craton at 2.11-2.16 Ga [25].
The Almas Greenstone Belt occurs in the Almas Terrane (Figure 1c) and hosts the Vira Saia and Paiol gold mines. It is preserved as narrow belts along the margins of TTG batholiths and is represented by the Riachão do Ouro Group (RO) [21,23,26]. The commonly cited U-Pb zircon age of 2,206 ± 13 Ma [27] for the Almas Greenstone Belt lacks consistency since the authors did not present geochronological data or the sample locations. The maximum depositional age of the Morro do Carneiro volcano-sedimentary sequence is 2,234 ± 18 Ma, and its minimum depositional age is 2,211 ± 9 Ma, thus representing an orogenic basin formed during the Almas Terrane accretion [21].
[3] after compiling the available data, proposed geotectonic models for the Natividade Group. Following the Rhyacian and the amalgamation of the Almas-Natividade Terrane, the region remained tectonically stable. In the Statherian (~1.78 Ga), crustal extension initiated in the south and decreased towards the north, leading to fault nucleation and intense volcanic activity in the south, while volcanic activity rapidly diminished towards the Natividade Basin. This extension allowed magma to ascend in the south but was insufficient to break the plate in the north, ceasing continental sedimentation.
After the volcanic pulses, the Natividade Basin underwent thermo-flexural subsidence, creating accommodation space for the Natividade Group deposition. Zircon grain ages distribution indicates a strong contribution from the Almas-Natividade Terrane, interpreted as a paleogeographic control. The high relief area separated the Araí Basin from the Natividade Basin. Although the erosive surface between volcanic layers and marine sedimentary deposits is not well documented, the scarcity of acidic metavolcanic rocks and the nature of the contact with the crystalline basement support this interpretation.
The paleogeography of the crystalline basement controlled the Natividade Group deposition, particularly the high paleorelief of the Almas Block, which facilitated gravitational flows in the southeast and the deposition of siliciclastic and carbonate sediments directly over the crystalline basement [6,17,28]. The Natividade Basin is classified as a sag-type basin, where sedimentary environments enabled massive carbonate accumulation on a platform controlled by basement paleorelief. The metavolcanic sample yielded an 1,824 Ma zircon U-Pb age, and the youngest detrital zircon grains from the metasedimentary sequence resulted in a maximum depositional age of 1,776 Ma for the paleobasin [3].
In the present study, we used the terminology proposed by [6], which characterized the Natividade Group by a mixed platform with simultaneous deposition of shallow water turbidite in a basin controlled by thermo-flexural subsidence, describing eleven sedimentary rock types grouped into four rock assemblages corresponding to specific depositional conditions:
i) Sand-Silt-Carbonate Assemblage - mixed platform environment with simultaneous siliciclastic and carbonate deposition; ii) Sand-Conglomerate Assemblage - shallow turbidite environment, related to mass flow controlled by the paleorelief of the source area; iii) Sand Assemblage - internal platform in backshore and foreshore conditions; iv) Silt-Clay Assemblage - external siliciclastic in an open-marine platform with primarily fine-grained deposition.
Finally, in the study area, located in the northeastern portion, lies the Phanerozoic cover of the São Francisco Craton, defined as the Sanfranciscana Basin. This Phanerozoic cover is predominantly composed of continental sedimentary rocks, with a minor presence of alkaline volcanic rocks southward. The basin origin is related to isostatic rearrangement in the Paleozoic, with reactivations in the Mesozoic and neotectonic activity in the Cenozoic. Its origin and tectonic evolution were controlled by the marginal belts of the São Francisco Craton (Brasília and Araçuaí belts) and by the opening of the South Atlantic, during the pre- to post-rift phases and by transform faults during the open ocean phase [29].
In the study area, the São Franciscana Basin is represented by the Urucuia Group (Upper Cretaceous), predominantly composed of sandstone. This group is subdivided into the Posse and Serra das Araras Formations, which present distinct depositional characteristics. The Posse Formation consists of two facies: the first corresponds to aeolian deposits from dry dune fields, while the second represents interwoven fluvial deposits, mainly accumulated in channels. On the other hand, braided fluvial deposits, with sedimentation in sand and gravel characterize the Serra das Araras Formation sheets [29]. These sedimentary rocks form plateaus with flat tops and steeply eroded slopes [30].
2.2. Environmental Characterization
The study area comprises the Brazilian Cerrado biome, which represents the Neotropical savanna vegetation of Central Brazil. The climate is classified according to [31] as C2wA'a' (dry sub-humid with moderate water deficiency), with an average annual rainfall of approximately 1500 mm.
This biome is characterized by a diverse mosaic of ecosystems, including tropical grasslands, savannas often referred to as Cerrado stricto-sensu and seasonal forests, regardless of their floristic composition [32]. In the carbonate hilltops of the Natividade Group, within the Cerrado biome, Tropical Deciduous Forest, also known as "dry forest" [33], can be found. The environmental heterogeneity of the Cerrado, marked by a wide range of vegetation types, topographical features, and climatic conditions, makes it an ideal setting for applying soil spatial predictive models [34].
Additionally, the Cerrado biome exhibits significant latitudinal (n) and altitudinal variability. Its broad geographic distribution across diverse erosion surfaces (r), including lowlands (< 300 m), plains, and extensive plateaus (900-1600 m) [35], contributes to substantial climatic diversity (c) [34,36,37].
One of the most relevant models for soil prediction is SCORPAN, developed by [38]. This soil spatial predictive function establishes quantitative relationships between soil properties and environmental covariates, encompassing geology, geomorphology, pedology, and other relevant factors [34]. SCORPAN builds upon the CLORPT model [39], which defines soil formation based on climate (C), organisms (O), relief (R), parent material (P), and time (T). SCORPAN extends this concept by incorporating additional variables: soil information (S) and spatial location (N). These factors are primarily represented through rasterized images obtained via remote/proximal sensing or geoprocessing-derived data.
The study area is predominantly composed of the Upper Tocantins Depression (37.06%), characterized by gently undulating relief and low-altitude terrains. The Natividade Ridge follows with 27.87%, representing elevated and rugged topography. The Mangabeiras Stepped Relief covers 21.65%, featuring stepped landforms and transitional elevations. The Dissected Plateau of Tocantins accounts for 12.46%, marked by dissected terrains and moderate slopes. The Fluvial Plains occupy a smaller portion (0.85%), associated with flat, sedimentary areas. Lastly, the Stepped Plateaus of the Western Chapadão of Bahia represent only 0.10%, indicating isolated occurrences of stepped plateaus [40] (Figure 2).
Thus, the predominance of rugged morphologies, such as stepped plateaus, dissected plateaus, and ridges, favors the formation of young soils like Entisols (Leposol) (30.47%) and Inceptisol (Cambisol) (2.52%). Oxisols (Ferrasol) (23.66%) are commonly associated with Plinthic subgroups (Plinthosol) (26.95%) in various geomorphological units, particularly in plateau regions, which facilitates the occurrence of intense pedogenetic processes. Another significant soil type is Ultisol and Alfisol (12.82%), predominantly found in the Upper Tocantins Depression (37.06%). Finally, Entisol/Aquic suborders (Gleysol) (3.58%) are less common and associated with Fluvial Plains (Tocantins State Government, 2012b).
3. Materials and Methods
Figure 3 brings the illustration of the methodological framework applied to the present study, which is detailed in the subsequent sections. The framework was developed to address the specific research objectives.
3.1. Geomorphological and Geological Classification Map Using Random Forest (Sentinel-2 & SRTM)
3.1.1. Sentinel-2 and SRTM Data
This study utilized Sentinel-2 (Level L2A) and SRTM data for geomorphological and geological classification, considering the specificities of each dataset according to the research objectives. Sentinel-2 Level L2A images, which have undergone atmospheric correction, were selected to ensure greater accuracy in spectral analysis. The chosen image corresponds to the scene from September 13, 2025, selected due to its low cloud cover. The data were obtained directly from the open-access Copernicus website.
Spectral analysis focused on selecting bands 4 (Red, 665 nm), 3 (Green, 560 nm), 2 (Blue, 490 nm), 8A (Narrow NIR, 865 nm), 11 (SWIR-1, 1610 nm), and 12 (SWIR-2, 2190 nm) due to their relevance for geological studies. The SWIR-1 (1610 nm) and SWIR-2 (2190 nm) bands are sensitive to the presence of clays and hydrothermal alteration processes, while the Narrow NIR band (865 nm) helps differentiate between soil and vegetation [41,42,43].
In addition to individual bands, spectral indices were calculated to enhance specific geological features, including: Normalized Difference Water Index (B3-B8/B3+B8), which is sensitive to soil and vegetation moisture [44]; the Iron Oxide Index (B4/B2), used to highlight the presence of iron oxides [45]; and the Clay Index (B11/B12), associated with clay minerals [46]. Additionally, the Normalized Difference Vegetation Index was computed using the red (Band 4) and near infrared (Band 8) bands, to evaluate vegetation cover [47] and its potential influence on erosion processes.
The combination of these bands and spectral indices enabled a detailed characterization of the study area's geology and geomorphology, contributing to the interpretation of erosional processes and landform features.
The Shuttle Radar Topography Mission - SRTM data were obtained from the Topodata/INPE platform [48], which provides pre-processed digital elevation models with improved spatial resolution and corrections for terrain artifacts. These data were essential for generating geomorphometric variables relevant to the study [49].
Pre-processing included filling depressions (sinks) using the Fill Sinks tool within the SAGA extension in QGIS [50]. This step ensures a continuous surface, preventing artificial interruptions in drainage pathways. The same tool was applied to generate the flow direction, which serves as the basis for delineating drainage networks and understanding terrain connectivity. Subsequently, terrain derivatives were computed using another SAGA plugin, including slope, aspect, and total curvature maps, which provide insights into the terrain inclination, orientation, and concavity/convexity [51]. The flow accumulation model was generated, which was later used to derive the Topographic Wetness Index - TWI, an indicator of potential water concentration zones and their influence on surface dynamics.
The Erosion Sensitivity Index - ESI was calculated by combining slope and total curvature derived from SRTM data with the NDVI obtained from Sentinel imagery. This integration of topographic and vegetation factors provides a more comprehensive assessment of erosion susceptibility, capturing both terrain dynamics and vegetation cover influence [52,53].
3.1.2. Random Forest Classification
The Random Forest classifier, a supervised machine-learning algorithm, integrates decision trees with an ensemble learning approach to improve classification accuracy. Three keys parameters were selected for Random Forest: Ntree (the number of trees to grow), Mtry (the number of variables considered at each node split), and variable importance (the contribution of each variable or band to model performance). The optimal values for Ntree and Mtry were determined iteratively by minimizing the mean square error - MSE.
In this study, we applied the Random Forest algorithm using the Dzetsaka classification tool in QGIS.
Sentinel and SRTM imageries were loaded into the Dzetsaka interface, and multiple spectral signatures were captured for each geological/geomorphological category. The number of trees was set to 100, while the maximum depth, variables per split, and other parameters were left at their default settings. The classification successfully performed.
Sentinel-2 and SRTM imagery were employed to analyze and estimate the geological and geomorphological influences on the modern landscape of the Paleo-Mesoproterozoic Natividade Basin, based on their ability to capture spectral and topographic variations. Fifteen predictive variables were employed, including Sentinel-2 bands 2, 3, 4, 8, 11, and 12, as well as spectral indices such as NDWI, NDVI, Clay Index, and Iron Oxide Index. Additionally, terrain derivatives derived from SRTM data slope, aspect, erosion sensitivity index, and topographic wetness index were incorporated, as they effectively characterize the region’s current landscape. All input raster layers were normalized and resampled to a 100 m cell size to ensure consistency across datasets.
To generate training data, a geological-geomorphological features map based on a combination of bibliographic review, field campaigns, and satellite image interpretation were produced. From this map, five geological/geomorphological classes of interest were defined. Using the methodology of [54], 100 random points per class were generated, and raster values corresponding to geological/geomorphological features were extracted for these points using ArcGIS 10.3 ArcToolbox tools.
For classification, QGIS v3.24 was used. The classification was conducted with the Scikit-learn library and the Dzetsaka plugin, which facilitated the supervised classification of Sentinel-2 and SRTM imagery using the Random Forest classifier.
3.1.3. Accuracy Assessment
Errors in the mapping process can arise due to misclassification at categorical boundaries, as spatially and categorically continuous features are assigned to discrete classes. Additionally, variations in mapping techniques, differences in input data, and analyst bias can contribute to classification errors in maps derived from remotely sensed data. Accuracy assessment is a crucial step in identifying these errors and quantitatively evaluating the reliability of the final classification.
To assess accuracy, a confusion matrix (error matrix) was applied, which compares the predicted class labels against the reference data. The Dzetsaka plugin in QGIS includes an option to split the training dataset for model evaluation. 70% of the data were allocated for model training and retained 30% for validation, allowing for an independent assessment of classification quality [54]. The confusion matrix organizes classification results by displaying correctly classified instances along the main diagonal, while omission and commission errors appear in the off-diagonal elements. Two keys metrics were derived from this matrix: overall accuracy (OA), which measures the proportion of correctly classified instances across all classes, providing a general estimate of classification performance, and the Kappa Index (κ), which accounts for agreement beyond chance, offering a more robust evaluation of classification accuracy by considering both correct and incorrect classifications across all classes. These accuracy metrics ensure a reliable assessment of how well the classification model represents the geological and geomorphological features of the study area.
3.2. Pedo-Geomorphological Map
The relationship between landforms and soils at different spatial scales allows the inference of soil unit distribution through digital topography analyses [55]. Additionally, pedoforms are intrinsically linked to slope variations, which influence soil formation and landscape evolution [2,56,57,58,59]. Given these interdependencies, the methodology of [1] was applied to map the pedoforms of the Natividade Group region. This approach defines pedoforms based on the integration of geomorphological units and slope classes, followed by their interpretation in relation to regional soil distribution.
The first stage involved the generation of the geoform map, which was created by combining geomorphological units with slope classes. To achieve this, it was performed a spatial overlay analysis using the raster calculation tool in ArcGIS 10.8.2. A summation operation was applied to merge the geomorphological unit map with the slope classification map, ensuring that all slope classes were represented within the geomorphological units identified in the study area. This step allowed more refined delineation of terrain variations and their potential influence on pedogenesis.
Following the geoform classification, it was proceeded with the generation of the pedoform map, in which the geoform units were further refined by incorporating regional soil information. The association between geoforms and soil classes was established based on known relationships between terrain characteristics, soil distribution, and lithological variations. This step was essential for improving the accuracy of the pedoform classification, as different rock types and geomorphological processes influence soil properties and spatial distribution.
To ensure the reliability of the final maps, field validation was conducted. The pedoforms classifications were crosschecked with direct field observations to verify their accuracy. This process involved examining representative locations across the study area to confirm whether the mapped landforms and soil units corresponded to real-world conditions. Adjustments were made where necessary to improve classification accuracy and ensure that the final pedoform map effectively captured the geomorphological and pedological characteristics of the Natividade Group region.
By integrating digital terrain analysis, remote sensing data, and field validation, this methodological approach provides a robust framework for understanding the landscape evolution of the study area and its relationship with geological and geomorphological processes.
4. Results
Two main maps were generated to analyze the landscape evolution of the Natividade region: a Pedo-Geomorphological Map and a Predictive Geological-Geomorphological Map. The first highlights the relationship between relief and soil distribution, while the second reveals geological and structural patterns shaping the modern landscape. Together, these maps provide a comprehensive view of the geomorphological and geological influences on terrain evolution.
4.1. Pedo-Geomorphological Map (PGM)
The Pedo-Geomorphological Map was produced by combining geomorphological units with slope classes, allowing a detailed analysis of terrain variation and its relationship with soil distribution [1]. This process resulted in the identification of nine pedo-geomorphological units, each corresponding to one of the nine soil types present in the region (Figure 4). The spatial distribution of these units revealed distinct patterns, where flatter areas are predominantly associated with deeper, more developed soils, while steeper terrains are linked to less developed soils, influenced by erosion and geological resistance [60]. These patterns reflect the underlying lithology, where quartzite-rich areas characterized by rugged relief and thin soils, while sequences richer in silt and clay, as well as Paleoproterozoic basement rocks, support more stable and thicker soil profiles.
Pedo-geomorphological Unit 1 - landforms associated with flat reliefs (0 to 5°), exhibiting small, circular morphologies that are barely discernible on maps, typically associated with lagoons and hydromorphic soils. This unit is related to impermeable basement rocks of the Almas Terrane, which consist of an amphibolite facies greenstone-TTG association.
Pedo-geomorphological Unit 2 - landforms associated with flat reliefs (0 to 5°), particularly within the geomorphological unit of the dissected Tocantins plateau. The unit is related to areas with more intensive agricultural activity and the occurrence of well-developed soils, such as Oxisol and Plinthic subgroups. These soils are commonly found in the northwestern portion of the area, associated with the basement of the Aurumina Terrane, characterized by peraluminous granite and tonalite/granodiorite.
Pedo-geomorphological Unit 3 - landforms associated with gentle reliefs (0 to 5°), allowing the formation of deeper soils, such as Oxisol and Plinthic subgroups. However, shallower soils also occur, such as Lithic Entisol and Inceptisol. These soils are found in the Natividade Group, especially related to the association of Silt-Clay and Sand-Silt-Carbonate assemblages. Their occurrence is common in the northwestern portion of the area, related to the basement of the Aurumina Terrane, characterized by peraluminous granite and tonalite/granodiorite.
Pedo-geomorphological Unit 4 - encompasses landforms with gentle to moderate slopes (5° to 15°), strongly associated with drainage networks and valley systems. Geomorphologically, these areas are linked to fluvial plains, the dissected Tocantins Plateau, and the Natividade Ridge. The predominant soils are Aquic Entisols, often accompanied by other Entisol suborders, with occasional occurrences of more developed soil classes. Geologically, this unit is closely associated with recent fluvial deposits from the Sanfranciscana Basin and exhibits a distinct morphological alignment with the Natividade Group, while its connection to the crystalline basement is less pronounced.
Pedo-geomorphological Unit 5 - the unit is characterized by flat relief, with slopes ranging from 0 to 5°, associated with the Patamares das Mangabeiras compartment. In this context, the occurrence of soils is related to Entisol, specifically the quartz sandy suborder, due to their predominantly sandy texture, and the Lithic Subgroups of Entisol, which are characterized by shallow soils over hard bedrock or weathered material [61]. The presence of these soils reflects the influence of the Phanerozoic cover of the Sanfranciscana Basin (Urucuia Group), where sandy sediments play a key role in the formation of the landscape.
Pedo-geomorphological Unit 6 - the predominant relief class is flat (0° to 5°), with the most prominent geomorphological feature being the Upper Tocantins Depression. The soils are well developed and deep, with an association of Alfisol, Plinthosol subgroups, and Oxisol, indicating well-drained areas that favor intense weathering processes. Geologically, the region is primarily underlain by the Paleoproterozoic basement, particularly rocks from the Almas Terrane. The Aurumina Terrane, which occurs in this unit, is characterized by peraluminous granite and tonalities rocks.
Pedo-geomorphological Unit 7 - the predominant relief class is gently sloping to moderately steep (5° to 15°), with the possibility of occurring in areas of steeply undulating (15° to 30°) terrain. This unit is predominantly found in more rugged portions of the geomorphological unit of the Upper Tocantins Depression, frequently associated with areas near the Natividade Ridge. Geologically, it is found in the structurally more complex portions of the Paleoproterozoic basement, especially near the contact with the Natividade Group. Due to the relatively low level of detail in the soil mapping, this unit may theoretically occur in various soil associations, such as Alfisols and Plinthic subgroups. However, based on field observations and remote sensing product analysis, the predominant occurrence is of Entisol and Inceptisol. When it occurs within the Natividade Group, this unit is typically found on relatively flatter hills (undulating relief) and is associated with the sand-silt-carbonate and sand-conglomerate assemblages. In this context, it is related to the internal portions of Pedo-geomorphological Units 8 and 9.
Pedo-geomorphological Unit 8 - the predominant relief class in the area is steep (15° to 30°). This geomorphological unit is located at the boundaries of the Natividade Ridge, indicating regions of geomorphological break, especially in the transition to the Upper Tocantins Depression. The predominant soils are an Entisol association of Typic Udorthents and Lithic Udorthents, reflecting the direct influence of topographic characteristics and geological context. Geologically, this configuration generally occurs at the abrupt contact between the Natividade Group and the Paleoproterozoic basement. These areas may be associated with large carbonate lenses, exhibiting steep relief from the Sand-Silt-Carbonate assemblage, as well as quartz-rich portions from both the Sand-Silt-Carbonate and Sand-Conglomerate assemblage. Finally, structural control marked by shear zones and, consequently, areas of high slope gradient are associated with this pedo-geomorphological unit.
Pedo-geomorphological Unit 9 - this unit typically occurs at hilltops and crests within the Natividade Ridge, characterized by steep slopes (15° to 30°), with sections reaching the mountainous category (> 30°). The predominant soils are Entisol, particularly Lithic Udorthent, with exposed bedrock. This unit is commonly associated with Pedo-geomorphological Unit 8, located near the contact zone between the Natividade Group and the Paleoproterozoic basement, although in slightly more internal sectors. It is strongly associated with the quartzite of the Sand-Conglomerate assemblage, which are siliceous rocks more resistant to denudation processes and erosion.
4.2. Predictive Geological-Geomorphological Map (PGG Map)
The Geological-Geomorphological Predictive Map was generated using the Random Forest technique, incorporating 15 predictive layers derived from SRTM and Sentinel-2 imagery. These layers include slope, topographic wetness index (TWI), total curvature, erosion, aspect, NDVI, NDWI, clay index, iron oxide index, and spectral bands B2, B3, B4, B8A, B11, and B12 (Figure 5). The combination of these variables allows for a detailed analysis of the geological and geomorphological patterns in the study area.
A crucial step in this process was the construction of the Regional Geological-Geomorphological Map, which aided as the primary reference dataset for training the predictive model. This map was developed based on the interpretation of high-resolution satellite imagery, topographic data, and extensive fieldwork (Figure 6). It provides a comprehensive representation of the geological formations, geomorphic features, and structural elements that characterize the landscape. To generate training data for the predictive model, 100 random points were extracted for each geological-geomorphological unit identified in this reference map.
The analysis identified six distinct geological-geomorphological units in the study area, each reflecting specific characteristics related to geology, topography, and spectral patterns observed in satellite images.
PGG Unit 1 - it is associated with the Natividade Group, occurring in areas of high topography with steep slopes, indicating its resistance to erosional processes and connection to more resistant geological structures. It is also related to drainages and other areas with topographic variations.
PGG Unit 2 - it is located in the northeastern portion of the study area and is linked to the Sanfranciscana Basin (Urucuia Group), associated with a high density of spectral patterns related to land management, suggesting the influence of depositional processes and anthropogenic activities.
PGG Unit 3 - it corresponds to the Almas Terrane, associated with pasture areas and spectral patterns indicative of anthropogenic activities.
PGG Unit 4 - it corresponds to a major drainage area in the region, reflecting spectral patterns associated with water. Geologically, it corresponds to the Almas and Aurumina Terranes, displaying structural patterns characteristic of this unit.
PGG Unit 5 - it corresponds to the Riachão do Ouro Group Greenstone Belt (Almas Terrane Greenstone) and is associated with a moderate density of spectral patterns related to land use and management, reflecting an area of low relief.
PGG Unit 6 - it is also linked to the Almas Terrane and exhibits a spectral pattern characteristic of vegetation, indicating greater natural vegetation cover compared to the other geological-geomorphological units.
These units reflect the interaction between geological and geomorphological processes in the region, providing insights into landscape evolution and identifying patterns related to geological structuring and surface processes.
The resulting Geological-Geomorphological Predictive Map reflects the complex interplay between geology, geomorphology, and landscape evolution in the region. By integrating spectral, topographic, and environmental variables, it enhances the understanding of spatial patterns and their geological significance. To assess the reliability of the classification, overall accuracy and the kappa index were calculated, yielding values of 52% and 0.4, respectively. These metrics indicate a moderate agreement between the predicted and reference data, highlighting both the potential and the challenges of predictive mapping in geologically complex terrains (Figure 7).
5. Discussion
To enhance the discussion of the fundamental aspects of this study, two main axes were considered: (1) the relationship between the generated maps and landscape evolution, and (2) the influence of geology and geomorphology on the landscape development.
5.1. Relationship Between the Generated Maps and Landscape Evolution
The interaction between pedology and geomorphology can be analyzed at multiple levels, as soils and landforms are influenced not only by topography and slope but also by their relative position within the landscape [57,62]. In this study, we aimed to investigate the landscape evolution of the region encompassing the Natividade Group in central Brazil by integrating Sentinel-2 and SRTM imagery with geomorphological and geological analyses.
Through the pedogeomorphological/landscape map, we identified and interpreted nine distinct pedoforms/landforms, each associated with specific soil types in the region. These units reflect variations in relief, drainage patterns, and lithology, providing valuable insights into the long-term landscape dynamics. The spatial distribution of these pedoforms suggests a strong correlation between soil development, geomorphological processes, and the underlying geological framework [1]. This mapping approach enhances our understanding of how different environmental factors have interacted over time to shape the current landscape configuration.
The pedoforms identified in this study reflect the intricate relationship between bedrock composition and soil development, demonstrating how soils serve as key indicators of landscape evolution. Different rock types influence soil formation processes, dictating the mineralogical composition, weathering rates, and nutrient availability. In turn, these soils record the long-term geomorphological changes that have shaped the region. In general, more resistant lithologies, such as quartz-rich metasedimentary rocks, are often linked to shallow, poorly developed soils, whereas less resistant rocks, like phyllite and schist, and granitic rocks tend to produce deeper, more chemically altered soils.
In the study area, pedo-geomorphological units were grouped based on slope classes, highlighting the relationship between geology, geomorphology, and pedology. These groups were defined within three main relief classes, with each class being further associated with specific PGM (Pedo-geomorphological map) and PGG (Predictive Geological-Geomorphological map) units. This approach integrates geomorphological features, slope gradients, and soil types, offering a comprehensive understanding of the landscape's evolution and its controlling factors (Figure 8).
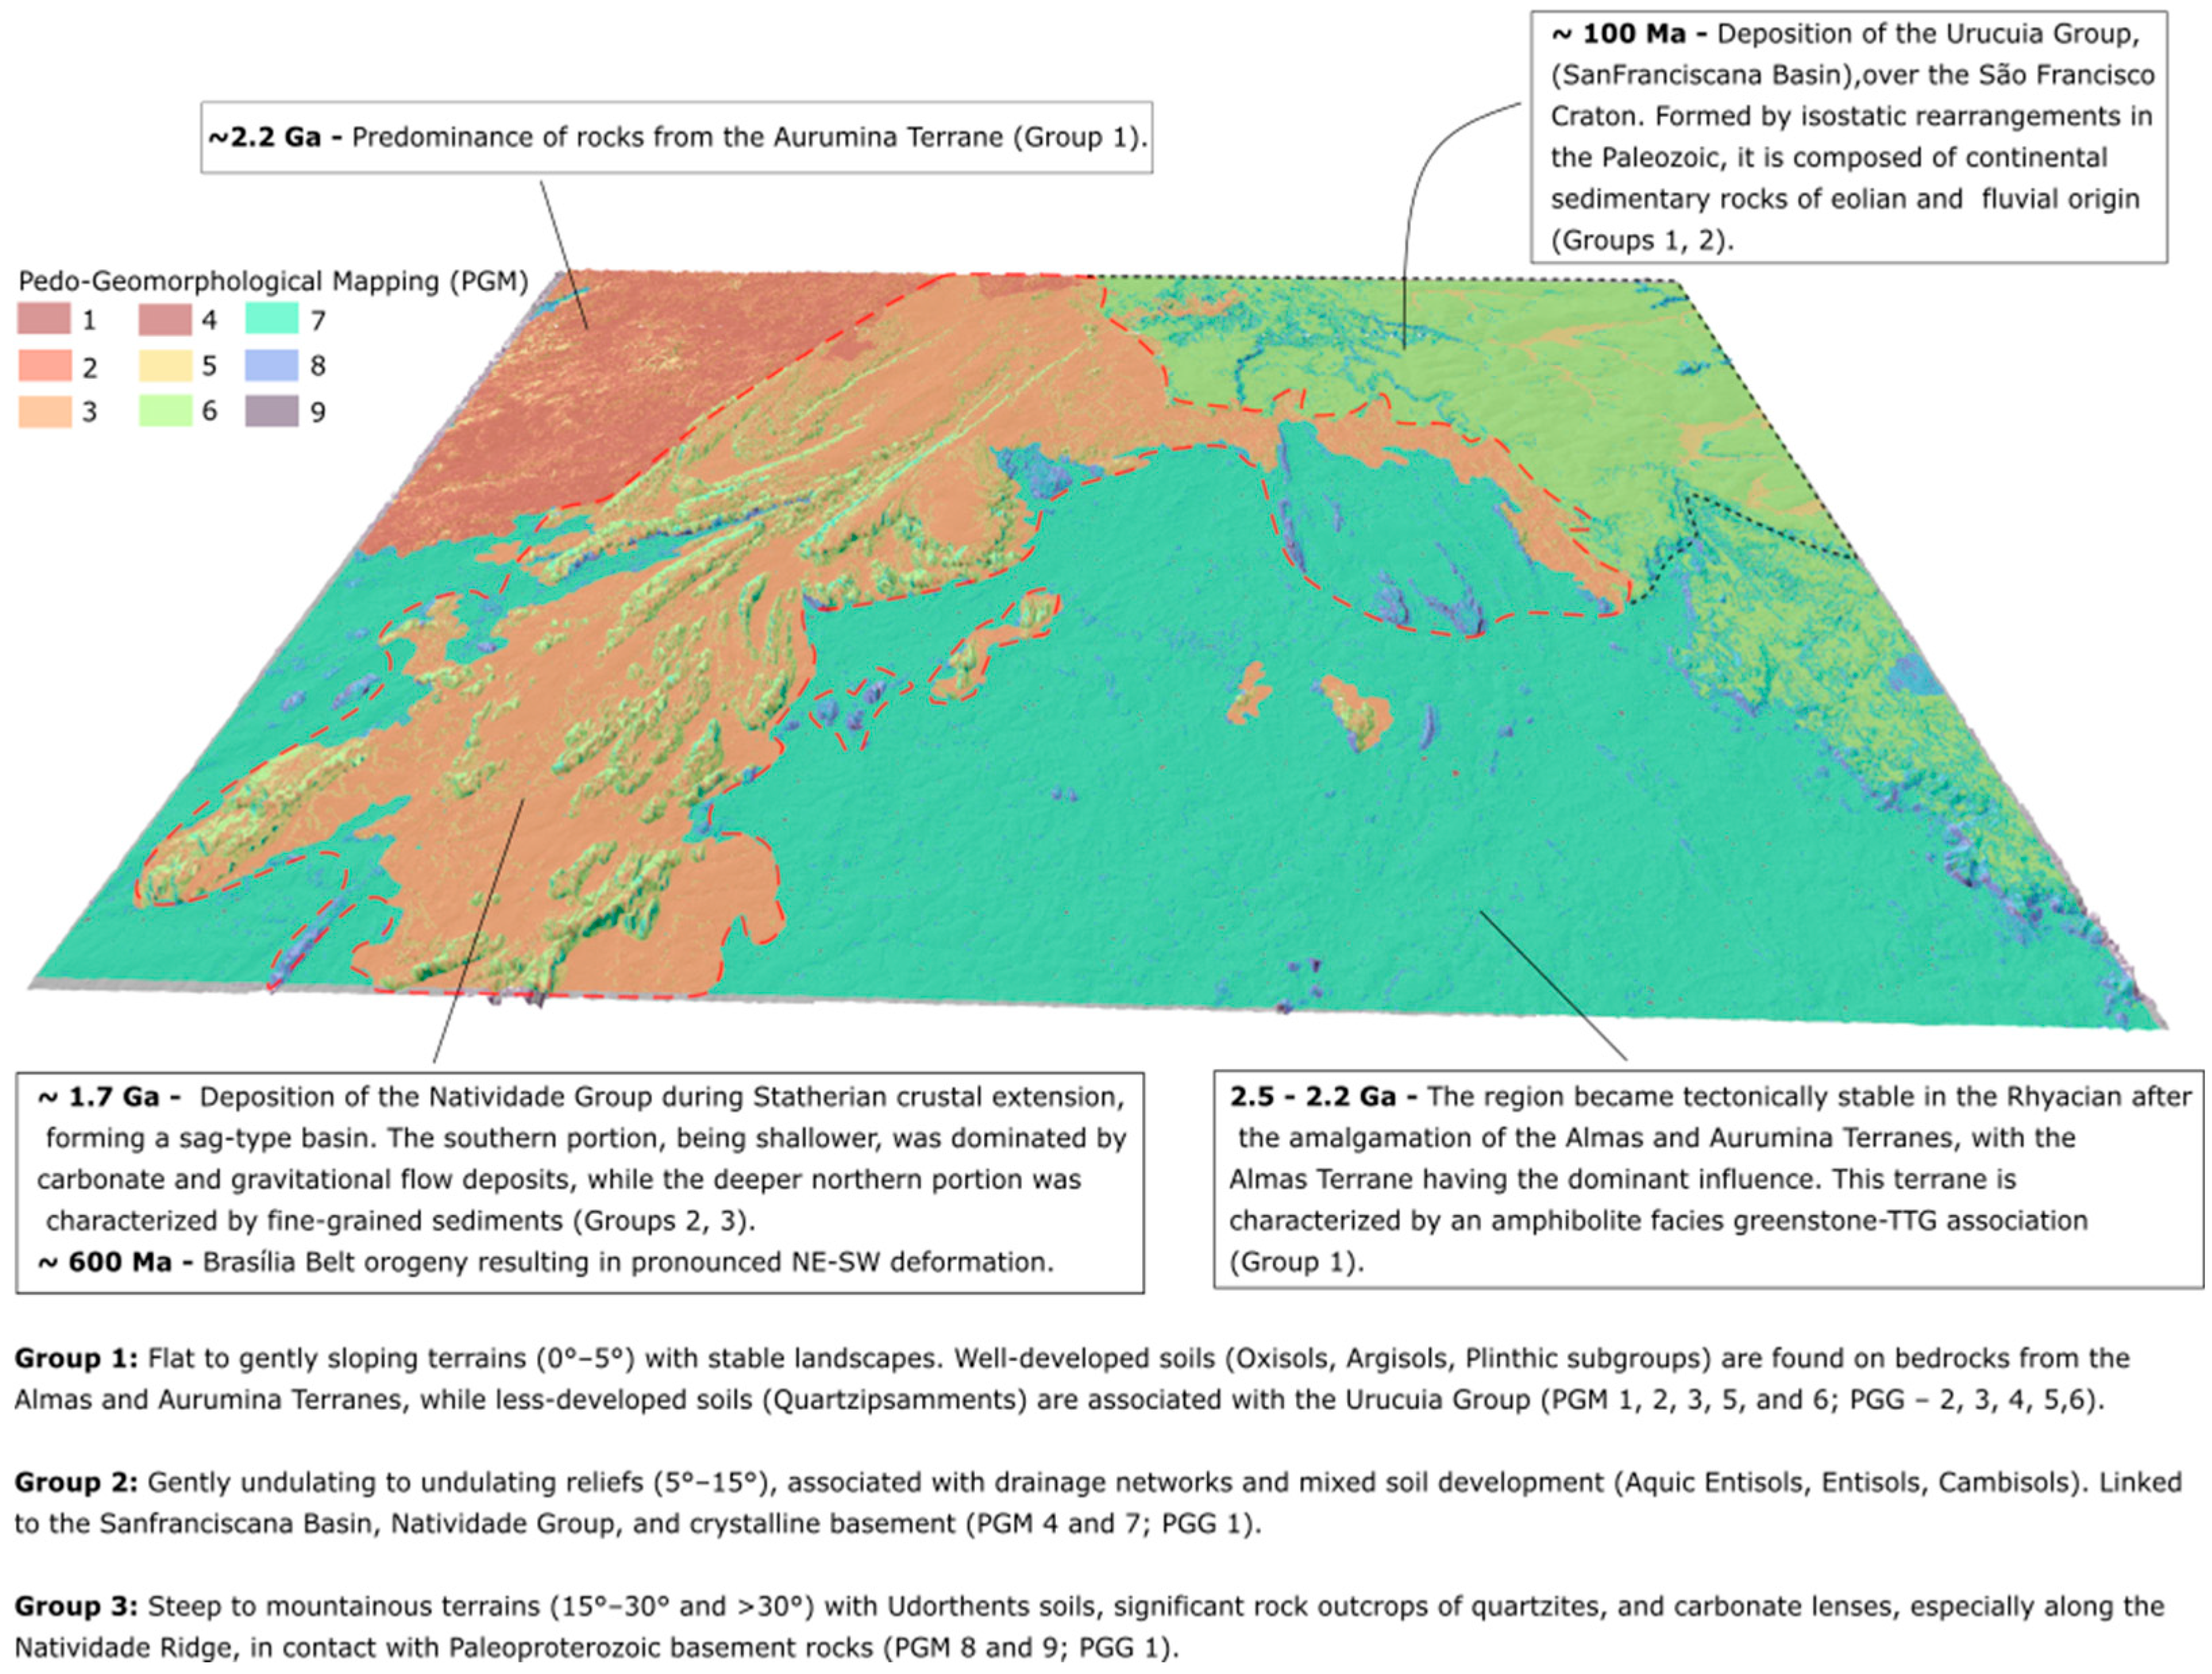
Group 1 encompasses units characterized by flat to gently sloping terrains (0°–5°), associated with stable landscapes and deep, well-developed soils (PGG Units 2, 3, 4, 5, and 6). It includes PGM Units 1, 2, 3, 5, and 6, which are linked to well-developed soils such as Oxisols, Argisols, and Plinthic subgroups, associated with bedrocks from the Almas and Aurumina Terranes, as well as less-developed soils like Quartzipsamments, which are associated with the Sanfranciscana Basin (Urucuia Group).
Group 2 comprises areas with gently undulating to undulating reliefs (5°–15°), strongly associated with drainage networks and valley systems, featuring a mix of soil development stages (PGG Unit 1). This unit includes less-developed soils such as Aquic Entisols (PGM Unit 4) and Entisols and Inceptisols (PGM Unit 7). Geologically, these areas are associated with the Sanfranciscana Basin, the Natividade Group, and the crystalline basement.
Group 3 encompasses units with steep to mountainous terrains (15°–30° and >30°). It includes Units 8 and 9, predominantly characterized by Udorthents soils. These areas feature significant rock outcrops composed of quartzites and substantial carbonate lenses, especially along the ridges and edges of the Natividade Ridge, in contact with Paleoproterozoic basement rocks (PGG Unit 1).
By analyzing the spatial distribution of pedoforms, it is possible to infer past and present geomorphological dynamics. The presence of well-developed soils in stable, low-relief areas suggests long periods of weathering with minimal erosion, while thinner soils in steeper terrains indicate active denudation. In this sense, the soil distribution serves as a geological-geomorphological archive, recording the landscape's transformation over time and reinforcing the importance of integrating pedological studies into broader geomorphological analyses.
The hills and ridges in the region show rounded shapes which indicate old mountains evolution. Even the lower flattened areas are covered by thick soil regolith that corroborate long-term geomorphological evolution.
The continuous plinthosol horizon, commonly associated with lithified iron oxide crusts, also indicates an ancient geomorphological evolution. This layer is preserved at the 500 to 550-meter elevation surface and may represent a former regional phreatic surface, where fluctuations in the water table were responsible for changes in iron oxidation. Iron mobilization is related to the ion valence, which is mobile at 2+ and tends to precipitate when oxidized to 3+.
The predictive map was created to study the influence of geology and geomorphology on the current landscape, incorporating both SRTM and Sentinel-2 imagery. This approach was designed to identify and analyze spatial patterns that reflect the region’s current geomorphological and geological characteristics. The primary goal was to use these remote sensing data sources to understand how geological and geomorphological factors continue to shape the landscape in the present day.
The predictive map was generated by applying a Random Forest algorithm to 15 different environmental predictors, including slope, TWI, curvature, erosion, aspect, NDVI, NDWI, and others derived from the SRTM and Sentinel-2 data. These predictors were selected once they reflect various aspects of the current landscape, such as topography, vegetation cover, and moisture conditions, which are all influenced by the underlying geology and geomorphology. The model was trained using points extracted from a geologically mapped region, which provided a basis for identifying spatial patterns of geological and geomorphological influence.
As a result, six distinct classes were obtained, each representing different aspects of the current landscape. These classes were interpreted as reflecting the ongoing interaction between the geology and geomorphology of the region, capturing how geological formations and topographic features are expressed in the present-day landscape. By combining these predictive results with field observations and geological knowledge, the map provides valuable insights into how past geological processes continue to shape the region’s present-day landforms and surface characteristics.
The accuracy index obtained in this study was moderate, indicating that while the predictive geological-geomorphological mapping was effective, it is not entirely representative of the landscape’s complexity. This result highlights that the relationship between geology and landscape evolution is significant but not absolute, as other environmental and climatic factors also play essential roles in shaping the terrain [39].
Although the predictive model successfully mapped the geological-geomorphological units, some limitations suggest that additional attributes could improve classification accuracy. For instance, geophysical data, such as magnetometer and gamma ray spectrometry, could provide valuable insights into subsurface variations that influence surface processes. However, the absence of high-resolution geophysical maps for the study area prevents their integration into the analysis.
Despite these limitations, the generated map effectively captured the major geological-geomorphological units, reinforcing the strong influence of geological structures and lithology on landscape evolution. The correspondence between mapped units and known geological features confirms the approach's reliability in identifying broad landscape patterns and their geological controls.
5.2. Influence of Geology and Geomorphology in the Landscape Evolution
In this sense, it is possible to understand that the role of geology and geomorphology in landscape evolution is fundamental, as these factors dictate the physical characteristics and spatial arrangement of landforms over time. Geology, through the distribution of rock types and structures, directly influences the formation and modification of landforms, while geomorphology governs the processes of erosion, sedimentation, and the development of surface features. Together, they shape the topography, soil formation, and drainage patterns that define the landscape.
Based on the Model by [3], the Almas Block (crystalline basement), particularly the Conceição do Tocantins region, is considered a high paleorelief area due to the following factors: the deposition of the Natividade Group, which contains shallow water turbidites, required elevated source areas to control sedimentation. Furthermore, these data are corroborated by the current landscape, where the predominance of carbonates and mass flow deposits (Sand-Conglomerate Assemblage) in the southern portion of the Natividade Group, near the Almas Block, suggests a shallower sea depth to the south of the basin. To the north, the predominance of fine-grained terrigenous sediments and the absence of flow deposits indicate a deeper basin (Figure 8).
It is worth mentioning that the high paleorelief area is just identified through magnetometer data and geological interpretations, indicating tectonic stability during the Rhyacian, following the amalgamation of the Almas-Natividade Terrane [3]. In the current landscape, these regions consist of flat surfaces with a higher proportion of deep soils and intense agricultural activity.
Another important factor in the current relief of the region was imposed by the orogeny related to the Neoproterozoic fold belts, which originated the Brasília Belt. The area is characterized by the northern segment, which presents a NE-SW structural trend and an overall east to southeast vergence, which also strongly influences the current landscape, especially with the topographic highs of the Serra do Natividade, which have undergone significant shortening due to tectonic inversion.
Finally, the last major geological event recorded in the northeastern portion of the area was the development of the Sanfranciscana Basin, with significant reflections in the current landscape configuration. This Phanerozoic cover is predominantly composed of continental sedimentary rocks, which, due to the high proportion of quartz, promote the predominant occurrence of related to Entisols (sandy suborder), typically in higher flat reliefs when compared to the basement.
Thus, the interaction between these elements is particularly important in regions with complex geological histories, such as the Natividade region. Here, the influence of the underlying geological formations, such as the Natividade Group, Almas-Aurumina terranes and Urucuia Group, has a lasting impact on the region’s geomorphology, contributing to its present-day geomorphology. Additionally, the combination of these factors with climate and vegetation further refines the landscape, creating patterns of soil distribution, landforms, and drainage that reflect both past and ongoing processes of landscape evolution.
By integrating remote sensing data with field-based geological and geomorphological studies, this research highlights how the evolution of the landscape in the Natividade region is shaped not only by the geological framework but also by the dynamic interplay between these natural processes. The results underscore the importance of understanding these relationships in order to better manage and plan for land use, environmental conservation, and risk mitigation in areas with complex geological and geomorphological settings.
In a general view, the current land uses in the region are compatible with the landscape suitability, where the major agricultural and grasslands are developed in lowlands, flat relief with thick soil cover. The main farms preservation areas and wildlife reserves are distributed in the high relief regions with hills and ridges.
The analysis of land stability shows the lowlands, with flattened relief pattern areas with the most stable terrains. However, some highlands even with high slope also show high geotechnical stability due to the substrate related to quartzite and metaconglomerate which are the most resistant rocks in the region.
6. Conclusion
The study area has undergone significant transformations throughout geological time, beginning with the amalgamation and stabilization of the Almas Terrane during the Rhyacian, which led to the formation of a pronounced paleorelief. This was followed by the deposition of the Natividade Group, related to the Statherian Taphrogenesis process, and later by tectonic inversion during the Neoproterozoic. Subsequently, the deposition of the Phanerozoic cover of the Sanfranciscana Basin occurred. This complex geological history has had a profound influence on the current landscape, which has been further shaped by ongoing processes related to climate, vegetation, and topography.
The integration of geological, geomorphological, and pedological data was crucial for a comprehensive understanding of landscape evolution in the study area. By combining remote sensing data (SRTM and Sentinel-2) with field observations, two key cartographic products were generated: the Pedo-Geomorphological Map and the Predictive Geological-Geomorphological Map.
The Pedo-Geomorphological Map revealed a clear relationship between geomorphological features and soil distribution, with thicker soils predominating in flatter areas linked to the Almas-Aurumina Terrains and the Urucuia Group, and shallower soils found in regions associated with the Natividade Group. In contrast, the Predictive Geological-Geomorphological Map, generated using the Random Forest algorithm and validated through fieldwork, identified six distinct geological-geomorphological units, each reflecting patterns shaped by geological formations, topography, and surface processes.
Although the maps showed moderate accuracy, they offer valuable insights into the interactions between geological, geomorphological, and pedological factors, significantly enhancing our understanding of the landscape's formation and evolution. The integration of remote sensing techniques with field data proved to be an effective method for mapping and analyzing the factors influencing terrain development, underscoring the continuing role of geological structures and geomorphological features in soil development.
The regional directions and relief trends are fully controlled by the geological structures at depth, including folds axis, faults and thrusts planes. The ridges, continuous hills and parallel valleys are northeast-aligned (North 20 to 30° East) what is the same direction of the folds and faults related to the Neoproterozoic orogenesis.
Author Contributions
Conceptualization, Toscani, R., Matos, D. R.; methodology, Toscani, R., Matos, D. R.; software, Toscani, R., Matos, D. R.; validation, Toscani, R., Matos, D. R., Campos, J. E. G.; formal analysis, Toscani, R., Campos, J. E. G.; investigation, Toscani, R., Matos, D. R., Campos, J. E. G.; data curation, Matos, D. R.; writing—original draft preparation, Toscani, R., Matos, D. R.; writing—reviewand editing, Toscani, R., Matos, D. R., Campos, J. E. G. All authors have read and agreed to the published version of the manuscript.
Funding
This research received no external funding.
Data Availability Statement
All data created is available in the manuscript.
Conflicts of Interest
The authors declare no conflicts of interest.
References
- Lacerda, M.P.C. , Barbosa, I. O. Pedomorphogeological relationships and distribution of pedoforms in the Águas Emendadas ecological station, Federal District. Revista Brasileira de Ciência do Solo 2012, 36, 709–721. [Google Scholar]
- Conacher, A.J. , Dalrymple, J B. The nine unit landsurface model. An approach to pedogeomorphic research. Geoderma, 1977, 18, 127–144. [Google Scholar]
- Toscani, R. , Campos, J.E.G., Martins-Ferreira, M.A.C., Matos, D.R., Borges, C.C.A., Dias, A.N.C., Chemale, F. The Statherian Natividade Basin evolution constrained by U–Pb geochronology, sedimentology, and paleogeography, central Brazil. Journal of South American Earth Sciences, 2021, 112-2, 103618.
- Dardenne, M.A. The Brasília fold belt. Tectonic Evolution of South America; Cordani, E. J. Milani, A. T. Filho, Ed.; Sociedade Brasileira de Geologia: Sao Paulo, Brazil, 2000; pp. 231–263. [Google Scholar]
- Valeriano, C.D.M. , Pimentel, M. M., Heilbron, M., Almeida, J. C. H., & Trouw, R. A. J. Tectonic evolution of the Brasília Belt, Central Brazil, and early assembly of Gondwana. Geological Society, London, Special Publications2008, 294-1, 197–210.
- Toscani, R. , Campos, J. E.G., Matos, D.R., Martins-Ferreira, M.A.C. Complex depositional environments on a siliciclastic carbonate platform with shallow-water turbidites: The Natividade Group, central Brazil. Journal of South American Earth Sciences, 2021, 102, 102939. [Google Scholar]
- State of Tocantins, Brazil. Atividade do Programa de Zoneamento Ecológico-Econômico do Estado do Tocantins: Integração à Base de Dados Geográficos do Estado do Tocantins., 2012 Available online:. Available online: https://www.to.gov.br/seplan/zoneamento-ecologico-economico-do-estado-do-tocantins/5n96nvzropdp (accessed on 06 April 2025).
- Martins-Ferreira, M.A.C. , Chemale, F. , Coelho Dias, A.N.C., & Campos, J.E.G. Proterozoic intracontinental basin succession in the western margin of the São Francisco Craton: Constraints from detrital zircon geochronology. Journal of South American Earth Sciences, 2018, 81, 165–176. [Google Scholar]
- Almeida, F.F.M. , Hasui, Y., Brito Neves, B.B., Fuck, R.A. Brazilian structural provinces: An introduction. Earth-Science Reviews,1981, 17-1, 1–29.
- Almeida, F.F.M. O Cráton do São Francisco. Revista Brasileira de Geociências,1977, 7-4, 349–364.
- Pimentel, M.M. The tectonic evolution of the Neoproterozoic Brasília Belt, central Brazil: A geochronological and isotopic approach. Brazilian Journal of Geology,2016, 46-1, 67–82.
- Fuck, R.A. , Pimentel, M.M., Alvarenga, C.J.S., & Dantas, E.L. The Northern Brasília Belt. São Francisco Craton, Eastern Brazil. Tectonic Genealogy of a Miniature Continent Heilbron, M., Cordani, U. G., Alkmim F. F., Eds.; Springer, 2017; pp. 205–220.
- Saboia, A. M. , Oliveira, C. G., Dantas, E. L., Scandolara, J. E., Cordeiro, P., Rodrigues, J. B., & Sousa, I. M. C. The 2.26 to 2.18 Ga Arc-Related Magmatism of the Almas-Conceição do Tocantins Domain: An Early Stage of the São Francisco Paleocontinent Assembly in Central Brazil. Journal of South American Earth Sciences, 2020, 104, 102757. [Google Scholar]
- Saboia, A. M. , Fuck, R. A., Dantas, E. L. Oliveira, C. G., Corrêa, R. T., Rodrigues, J. B., Scandolara, J. E., Costa, F. G., Cuadros, F. A., Uchigasaki, K. Paleoproterozoic (2.26–2.0 Ga) arc magmatism and geotectonic evolution of the Cavalcante-Natividade Block, Central Brazil. J. S. Am. Earth Sci. 2025, 154, 105350. [Google Scholar]
- Saboia, A. M.; Oliveira, C. G.; Dantas, E. L.; Cordeiro, P.; Scandolara, J. E.; Rodrigues, J. B.; Sousa, I. M. C. The Siderian crust (2. 47–2.3 Ga) of the Goiás Massif and its role as a building block of the São Francisco paleocontinent. Precambrian Res. 2020, 350, 105901. [Google Scholar]
- Uhlein, A.; Paim, P. S. G.; Tassinari, C. C. G.; Pedreira, A. J. Análise estratigráfica de bacias rifte Paleo-Mesoproterozoicas dos crátons Amazônico e São Francisco, Brasil. Geonomos 2015, 23(2), 1–13. [Google Scholar] [CrossRef]
- Saboia, A. M. O vulcanismo em Monte do Carmo e Litoestratigrafia do Grupo Natividade, Estado de Tocantins; Dissertação de Mestrado, Universidade de Brasília: Brasília, 2009; 96p. [Google Scholar]
- Schobbenhaus, C.; Bellizzia, A. (Coords.). Mapa geológico da América do Sul, escala 1:5.000.000; CGMW - CPRM - DNPM - UNESCO: Brasília, 2001; Available online: https://rigeo.sgb.gov.br/handle/doc/2542?mode=full (accessed on 06 April 2025).
- Fuck, R. A.; Dantas, E. L.; Pimentel, M. M.; Botelho, N. F.; Armstrong, R.; Laux, J. H.; Junges, S. L.; Soares, J. E.; Praxedes, I. F. Paleoproterozoic crust-formation and reworking events in the Tocantins Province, central Brazil: A contribution for Atlantica supercontinent reconstruction. Precambrian Res. 2014, 244, 53–74. [Google Scholar] [CrossRef]
- Sousa, I. M. C.; Giustina, M. E. S. D.; Oliveira, C. G. Crustal evolution of the northern Brasília Belt basement, central Brazil: A Rhyacian orogeny coeval with a pre-Rodinia supercontinent assembly. Precambrian Res. 2016, 273, 129–150. [Google Scholar] [CrossRef]
- Martins-Ferreira, M. A. C.; Dias, A. N. C.; Chemale, F.; Campos, J. E. G.; Seraine, M.; Novais-Rodrigues, E. Multistage crustal accretion by magmatic flare-up and quiescence intervals in the western margin of São Francisco Craton: U–Pb–Hf and geochemical constraints from the Almas Terrane. Gondwana Res. 2020, 85, 32–54. [Google Scholar] [CrossRef]
- Cordeiro, P. F. O.; Oliveira, C. G. The Goiás Massif: Implications for a pre-Columbia 2. 2–2.0 Ga continent-wide amalgamation cycle in central Brazil. Precambrian Res. 2017, 298, 403–420. [Google Scholar]
- Cruz, E. L. C. C. A gênese e o contexto tectônico da mina Córrego Paiol, Terreno Almas-Conceição: um depósito de ouro hospedado em anfibolito do embasamento da Faixa de Dobramento Brasília; Tese de Doutorado, Universidade de Brasília: Brasília, 2001; 189p. [Google Scholar]
- Borges, C. C. A.; Toledo, C. L. B.; Silva, A. M.; Chemale, F.; Santos, B. A.; Figueiredo, F. L.; Zacchi, E. N. P. Unraveling a Hidden Rhyacian magmatic arc through provenance of metasedimentary rocks of the Crixás greenstone belt, Central Brazil. Precambrian Res. 2021, 353, 106022. [Google Scholar] [CrossRef]
- Cuadros, F. A.; Botelho, N. F.; Fuck, R. A.; Dantas, E. L. The peraluminous Aurumina Granite Suite in central Brazil: An example of mantle–continental crust interaction in a Paleoproterozoic cordilleran hinterland setting? Precambrian Res. 2017, 299, 75–100. [Google Scholar] [CrossRef]
- Costa, J. B. S. Aspectos lito-estruturais e evolução crustal da região centro-norte de Goiás; Tese de Doutorado, Instituto de Geociências, Universidade Federal do Pará: Pará, 1984; 210p. [Google Scholar]
- Dardenne, M. A. , Giustina, M. E. S. D., Sabóia, A. M., Bogossian, J. Datação geocronológica U–Pb da sequência vulcânica de Almas, Tocantins. In Simpósio Geológico Centro-Oeste, 11; SBG: 2009; pp. 1 CD-ROM.
- Gorayeb, P. S. S.; Costa, J. B. S.; Lemos, R. L.; Gama, J. R. T.; Bemerguy, R. L.; Hasui, Y. O Pré-Cambriano da Região de Natividade, GO. Rev. Bras. Geoci. 1988, 18, 391–397. [Google Scholar] [CrossRef]
- Campos, J. E. G.; Dardenne, M. A. Origem e evolução tectônica da Bacia Sanfranciscana. Rev. Bras. Geoci. 1997, 27(3), 283–294. [Google Scholar] [CrossRef]
- Bomfim, L. F. C.; Gomes, R. A. D. Aquífero Urucuia – Geometria e Espessura: Idéias para Discussão. In XIII Congresso Brasileiro de Águas Subterrâneas; Associação Brasileira de Águas Subterrâneas: São Paulo, 2002; pp. 1–9. [Google Scholar]
- Köppen, W. Climatología: Con un estudio de los climas de la tierra; Fondo de Cultura Económica: México, 1948. [Google Scholar]
- Batalha, M. A. O cerrado não é um bioma. Biota Neotrop. 2011, 11, 21–24. [Google Scholar] [CrossRef]
- Ribeiro, J. F.; Walter, B. M. T. Physiognomies of the Cerrado Biome. In Cerrado: Environment and Flora; Sano, S. M., Almeida, S. P., Ribeiro, J. F., Eds.; Empresa Brasileira de Pesquisa Agropecuária - Centro de Pesquisa Agropecuária dos Cerrados: Planaltina, DF, Brazil, 2008; pp. 152–212. [Google Scholar]
- Pelegrino, M. H. P.; Guilherme, L. R. G.; Lima, G. O.; Poppiel, R.; Adhikari, K.; Demattê, J. M.; Curi, N.; Menezes, M. D. Optimizing soil texture spatial prediction in the Brazilian Cerrado: Insights from random forest and spectral data. Geoderma Regional 2025, 40, e00922. [Google Scholar] [CrossRef]
- IBGE. Brasil | Mapa de Biomas do Brasil. Escala 1:5,000,000. IBGE – Instituto Brasileiro de Geografia e Estatística, 2004. URL: https://www.ibge.gov.br/geociencias/informacoes-ambientais/vegetacao/15842-biomas.html. (accessed on 06 April 2025).
- Motta, P. E. F.; Curi, N.; Franzmeier, D. P. Relation of soils and geomorphic surfaces in the Brazilian Cerrado. In The Cerrado. In The Cerrados of Brazil: Ecology and Natural History of a Neotropical Savanna; Oliveira, P. S., Marquis, R. J., Eds.; Columbia University Press: New York, NY, 2002; p. 368. [Google Scholar]
- Ribeiro, J. F.; Walter, B. M. T. Fitofisionomias do bioma cerrado. In Cerrado: Ambiente e Flora; Sano, S. M., Almeida, S. P. de, Eds.; EMBRAPA-CPAC: Planaltina, DF, 1998; pp. 89–166. [Google Scholar]
- McBratney, A. B.; Mendonça Santos, M. L.; Minasny, B. On digital soil mapping. Geoderma 2003, 117, 3–52. [Google Scholar] [CrossRef]
- Jenny, H. Factors of soil formation. Soil Sci. 1941, 52, 415. [Google Scholar] [CrossRef]
- State of Tocantins, Brazil. Plano de informação de solos em escala 1:250.000 com recorte espacial para o sudeste do Estado do Tocantins: Atualização de dados vetoriais temáticos geoespaciais da Base de Dados Geográficos. Atividade do Programa de Zoneamento Ecológico-Econômico do Estado do Tocantins. Integra a Base de Dados Geográficos do Estado do Tocantins, 2012. URL: https://geoportal.to.gov.br/geonetwork/srv/api/records/e7d58a49-ed18-4ab8-ad9b-0d6049bd4a30, (accessed on 06 April 2025).
- Van der Werff, H.; Van der Meer, F. Sentinel-2A MSI and Landsat 8 OLI provide data continuity for geological remote sensing. Remote Sens. 2016, 8(11), 883. [Google Scholar] [CrossRef]
- Thomas, A.; Radzuma, T.; Mukosi, N. C. Usefulness of Sentinel-2 satellite data to aid in geoscientific mapping work: A case study of Giyani Greenstone Belt area. Episodes J. Int. Geoscience 2023, 46(3), 407–419. [Google Scholar] [CrossRef]
- Malainine, C. E.; Raji, O.; Ouabid, M.; Bodinier, J. L.; El Messbahi, H. Prospectivity mapping of carbonatite-associated iron oxide deposits using an integration process of ASTER and Sentinel-2A multispectral data. Int. J. Remote Sens. 2022, 43(13), 4951–4983. [Google Scholar] [CrossRef]
- Gao, B. C. A normalized difference water index for remote sensing of vegetation liquid water from space. Imaging Spectrometry 1995, 2480, 225–236. [Google Scholar]
- Sabins, F. F. Remote sensing for mineral exploration. Ore Geol. Rev. 1999, 14, 157–183. [Google Scholar] [CrossRef]
- Danoedoro, P.; Zukhrufiyati, A. Integrating spectral indices and geostatistics based on Landsat-8 imagery for surface clay content mapping in Gunung Kidul area, Yogyakarta, Indonesia. In Proceedings of the 36th Asian Conference on Remote Sensing, Asia Quezon, Metro Manila, Philippines, 12 May 2015. [Google Scholar]
- Casari, R. A. D. C. N.; Neumann, M. B.; Ribeiro, W. Q.; Olivetti, D.; Tavares, C. J.; Pereira, L. F.; Ramos, M. L. G.; Pereira, A. F.; Silva Neto, S. P.; Roig, H. L. Estimation of Soybean Evapotranspiration Using SSEBop Model with High-Resolution Imagery from an Unmanned Aerial Vehicle. Rev. Bras. Meteorol. 2024, 39, e39240007. [Google Scholar] [CrossRef]
- Valeriano, M. M.; Rossetti, D. F. Topodata: Brazilian full coverage refinement of SRTM data. Appl. Geogr. 2012, 32(2), 300–309. [Google Scholar] [CrossRef]
- Jesus, G. P. M.; Pistune, H. F.; Silva, M. A. S. Applications of computing in geomorphology studies–A case study. Iberoam. J. Appl. Comput. 2023, 11(1).
- Passy, P.; Théry, S. The use of SAGA GIS modules in QGIS. QGIS Gen. Tools 2018, 1, 107–149 822. [Google Scholar]
- Vujovi´c, F.; ´Culafi´c, G.; Valjarevi´c, A.; Br ¯danin, E.; Durlevi´c, U. Comparative geomorphometric analysis of drainage basin using AW3D30 model in ArcGIS and QGIS environment: Case Study of the Ibar River Drainage Basin, Montenegro. Agric. For. 2024, 70(1), 217–230. [Google Scholar]
- Milevski, I. Estimation of soil erosion risk in the upper part of Bregalnica watershed—Republic of Macedonia, based on digital elevation model and satellite imagery. In Proceedings from the 5th International Conference on Geographic Information Systems, Fatih University, Istanbul, 08; pp 351–358. 20 July.
- Chapungu, L.; Nhamo, G.; Dube, K.; Chikodzi, D. Soil erosion in the savanna biome national parks of South Africa. Phys. Chem. Earth, Parts A/B/C 2023, 130, 103376. [Google Scholar] [CrossRef]
- Tabosa, L. F. C.; Yokoyama, E.; Mendes, T. L.; Almo, P. M.; de Aguiar, G. Z. Utilizing Random Forest algorithm for identifying mafic and ultramafic rocks in the Gameleira Suite, Archean-Paleoproterozoic basement of the Brasília Belt, Brazil. J. South Am. Earth Sci. 2024, 141, 104952. [Google Scholar] [CrossRef]
- Silveira, C. T.; Oka-Fiori, C.; Santos, L. J. C.; Sirtoli, A. E.; Silva, C. R.; Botelho, M. F. Soil prediction using artificial neural networksvand topographic attributes. Geoderma 2013, 195, 165–172. [Google Scholar] [CrossRef]
- Acton, D. F. The relationship of pattern and gradient of slopes to soil type. Can. J. Soil Sci. 1965, 45(1), 96–101. [Google Scholar] [CrossRef]
- Gerrard, A. J. Soil geomorphology; Springer Science & Business Media: 1992; p 272.
- Ippoliti, R. G. A.; Costa, L. M.; Schaefer, C. E. G. R.; Fernandes Filho, E. I.; Gaggero, M. R.; Souza, E. Análise digital do terreno: ferramenta na identificação de pedoformas em microbacia na região de “Mar de Morros” (MG). Rev. Bras. Ciência Solo 2005, 29, 267–276. [Google Scholar] [CrossRef]
- Rocha, A. B. A.; Barbosa, V. R. F.; Faria, K. M. S.; Martins, E. S.; Soares Neto, G. B. Geomorphologic Map of the Brazilian Cerrado by geomorphometric archetypes. Rev. Bras. Geomorfologia 2022, 23(3), 1674–1684. [Google Scholar] [CrossRef]
- Leão, T. P. Solos: uma introdução; Editora Universidade de Brasília: Brasília, 2024; ISBN 978-65-5846-063-3. [Google Scholar]
- Dantas, M. E.; Shinzato, E.; Carvalho Filho, A. de; Lumbreras, J. F.; Teixeira, W. G.; Rocha, M. G.; Machado, M. F. Origem das 846 paisagens do estado do Tocantins. In: Rocha, M. G. (Org.), Geodiversidade do Estado do Tocantins. In Rocha, M. G. (Org.), Geodiversidade do Estado do Tocantins; CPRM: Goiânia, 2019. [Google Scholar]
- Jakhmola, R. P. , Dash, C., Singh, S., Patel, N. K., Verma, A. K., Pati, P., Awasthi, A. K., Sarma, J. N. Holocene landscape evolution of the Brahmaputra River valley in the upper Assam Basin (India): Deduced from the soil-geomorphic studies. Quaternary Science Reviews, 316, 2023, 108243.
- Campos, J. E. G. Hidrogeologia do Distrito Federal: bases para a gestão dos recursos hídricos subterrâneos. Revista Brasileira de Geociências, 34(1), 2004, 41-48.
- Martins-Ferreira, M. A. C. , & Campos, J. E. G. Compartimentação geomorfológica como suporte para estudos de evolução 854 geotectônica: Aplicação na região da Chapada dos Veadeiros, GO. Revista Brasileira de Geomorfologia, 18(3), 2017.
Figure 1.
Study area context: (a) Location of the study area in relation to the Brasiliano/Pan-African cratons; (b) Study area (red rectangle) within Brazil, situated in the Neoproterozoic Tocantins Province [16]; (c) Detailed view of the study area, highlighting the Natividade Group and its subdivisions (Adapted from [6,17] and modified from [18]).

Figure 2.
Map illustrating the relationship between soil types and geomorphological units in the study area. Data Soure from [7,40].
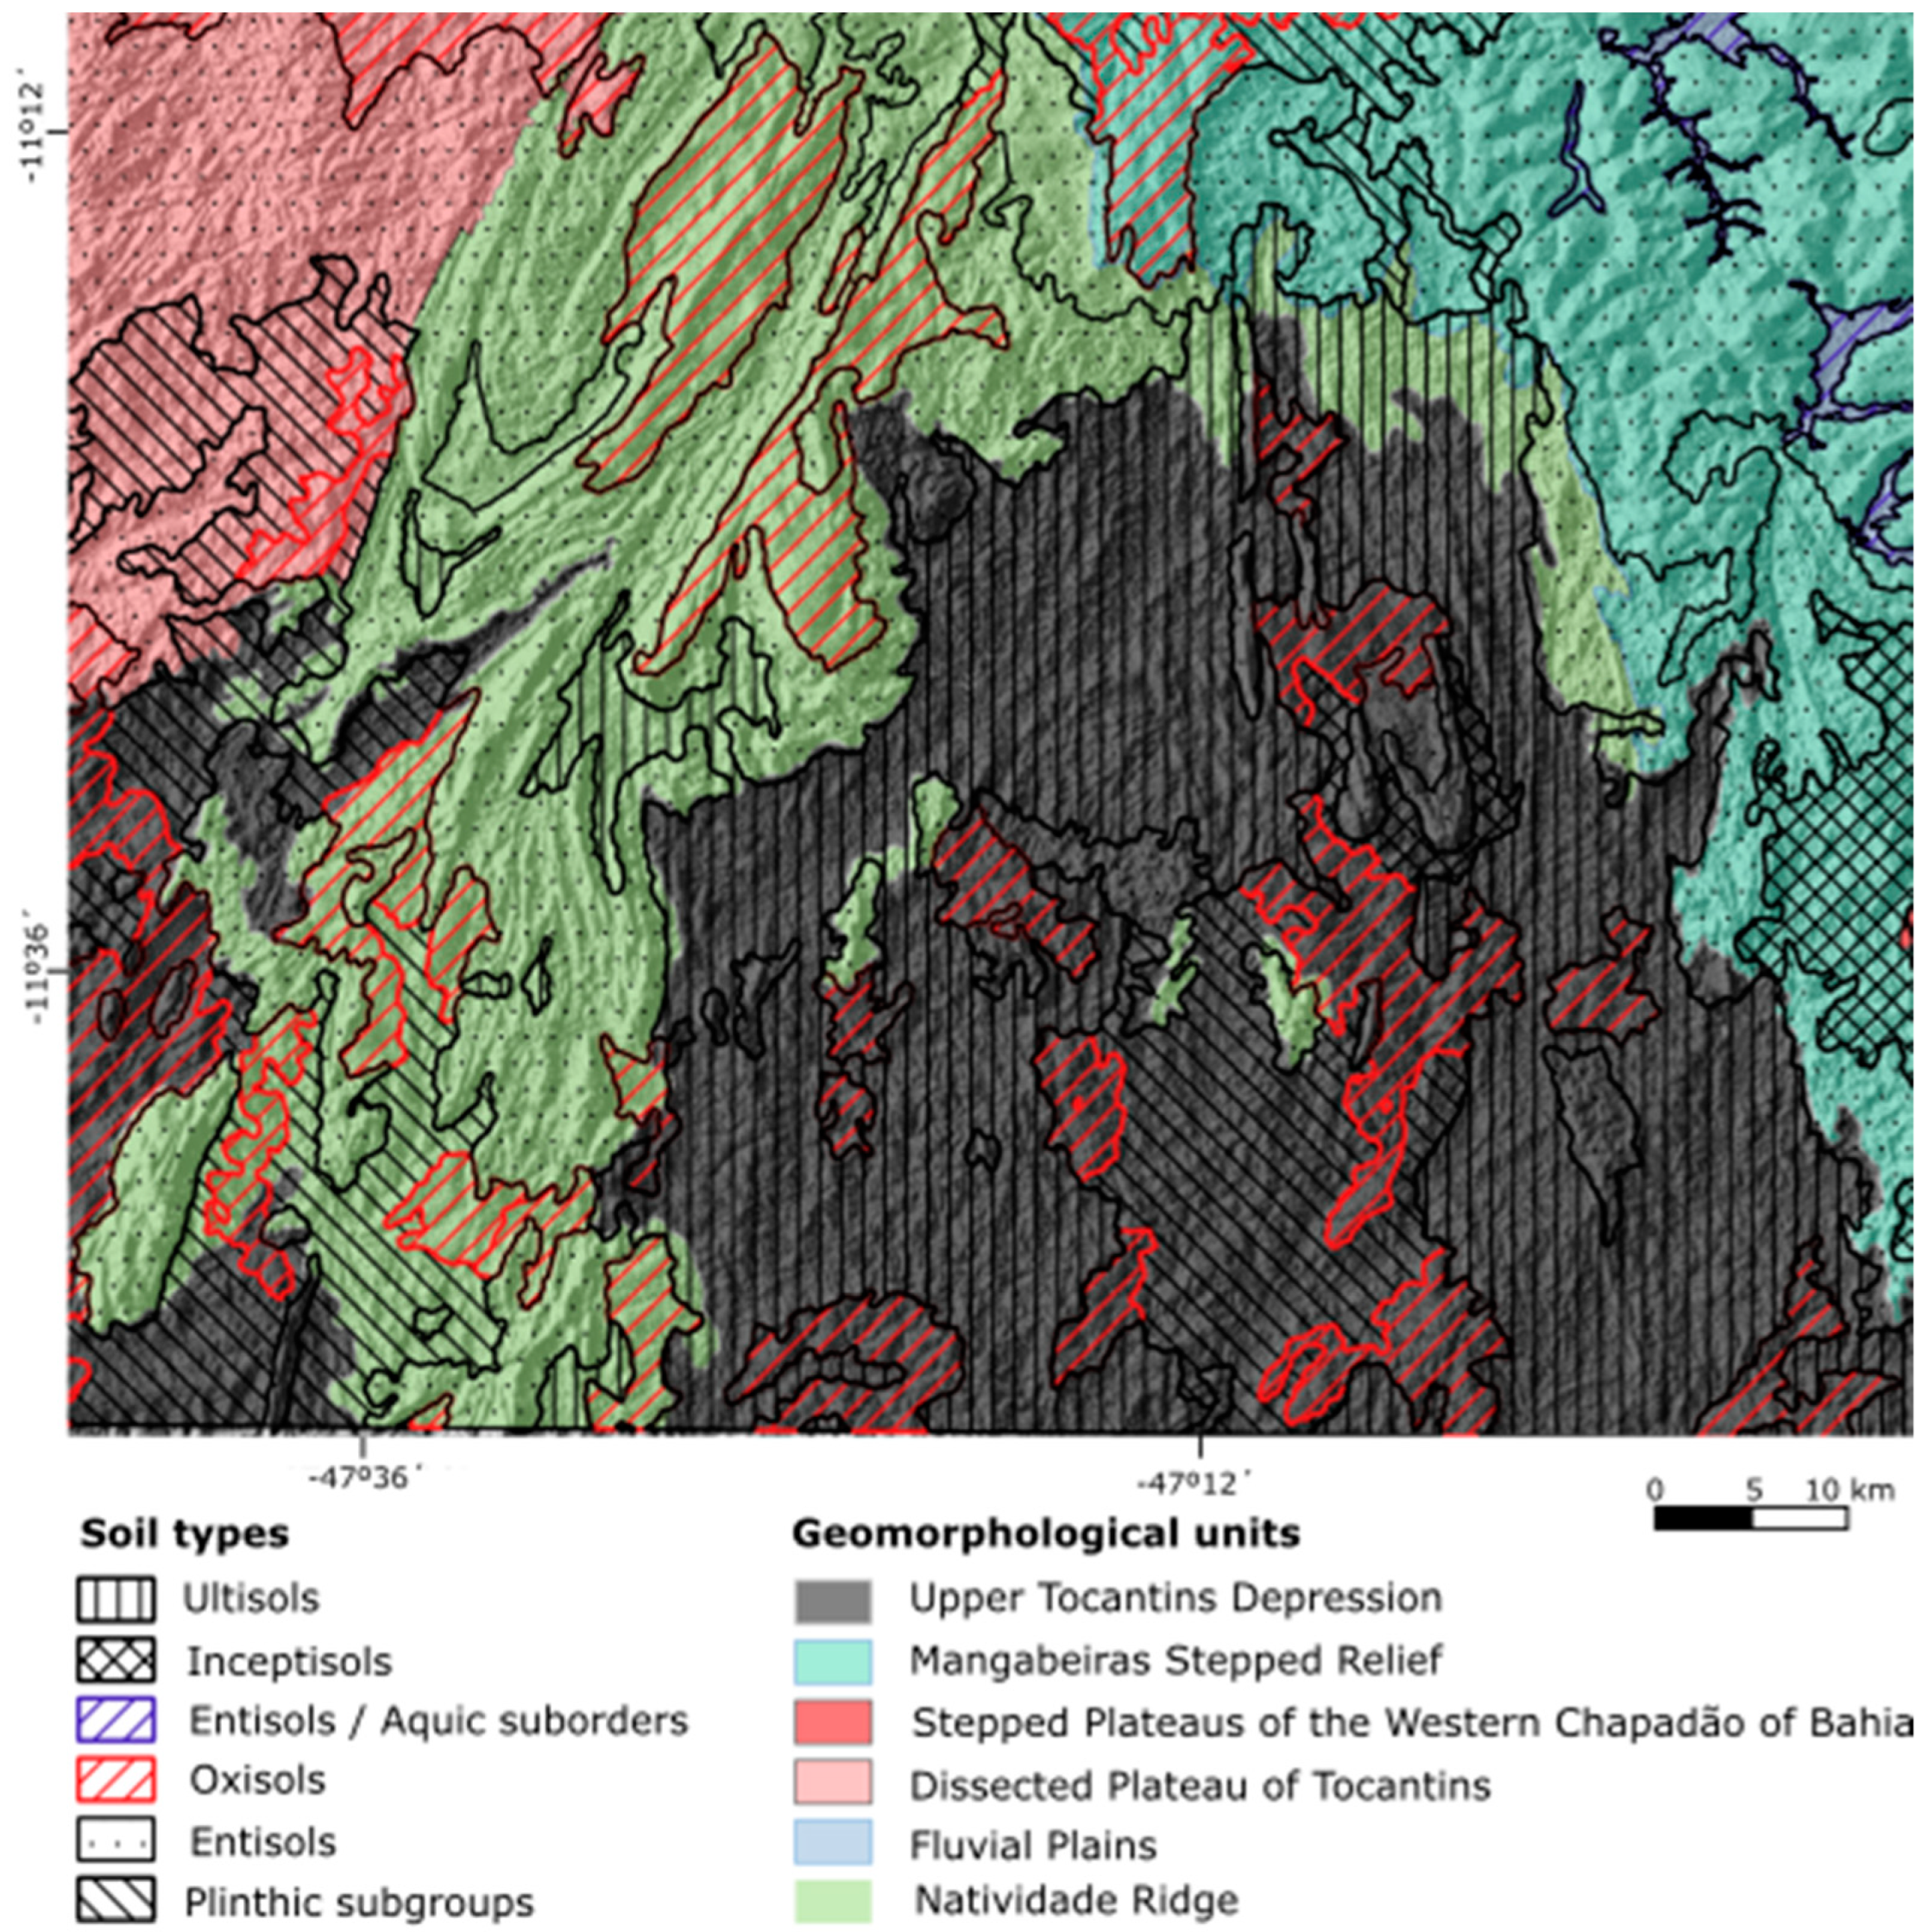
Figure 3.
Methodological framework employed in this study.
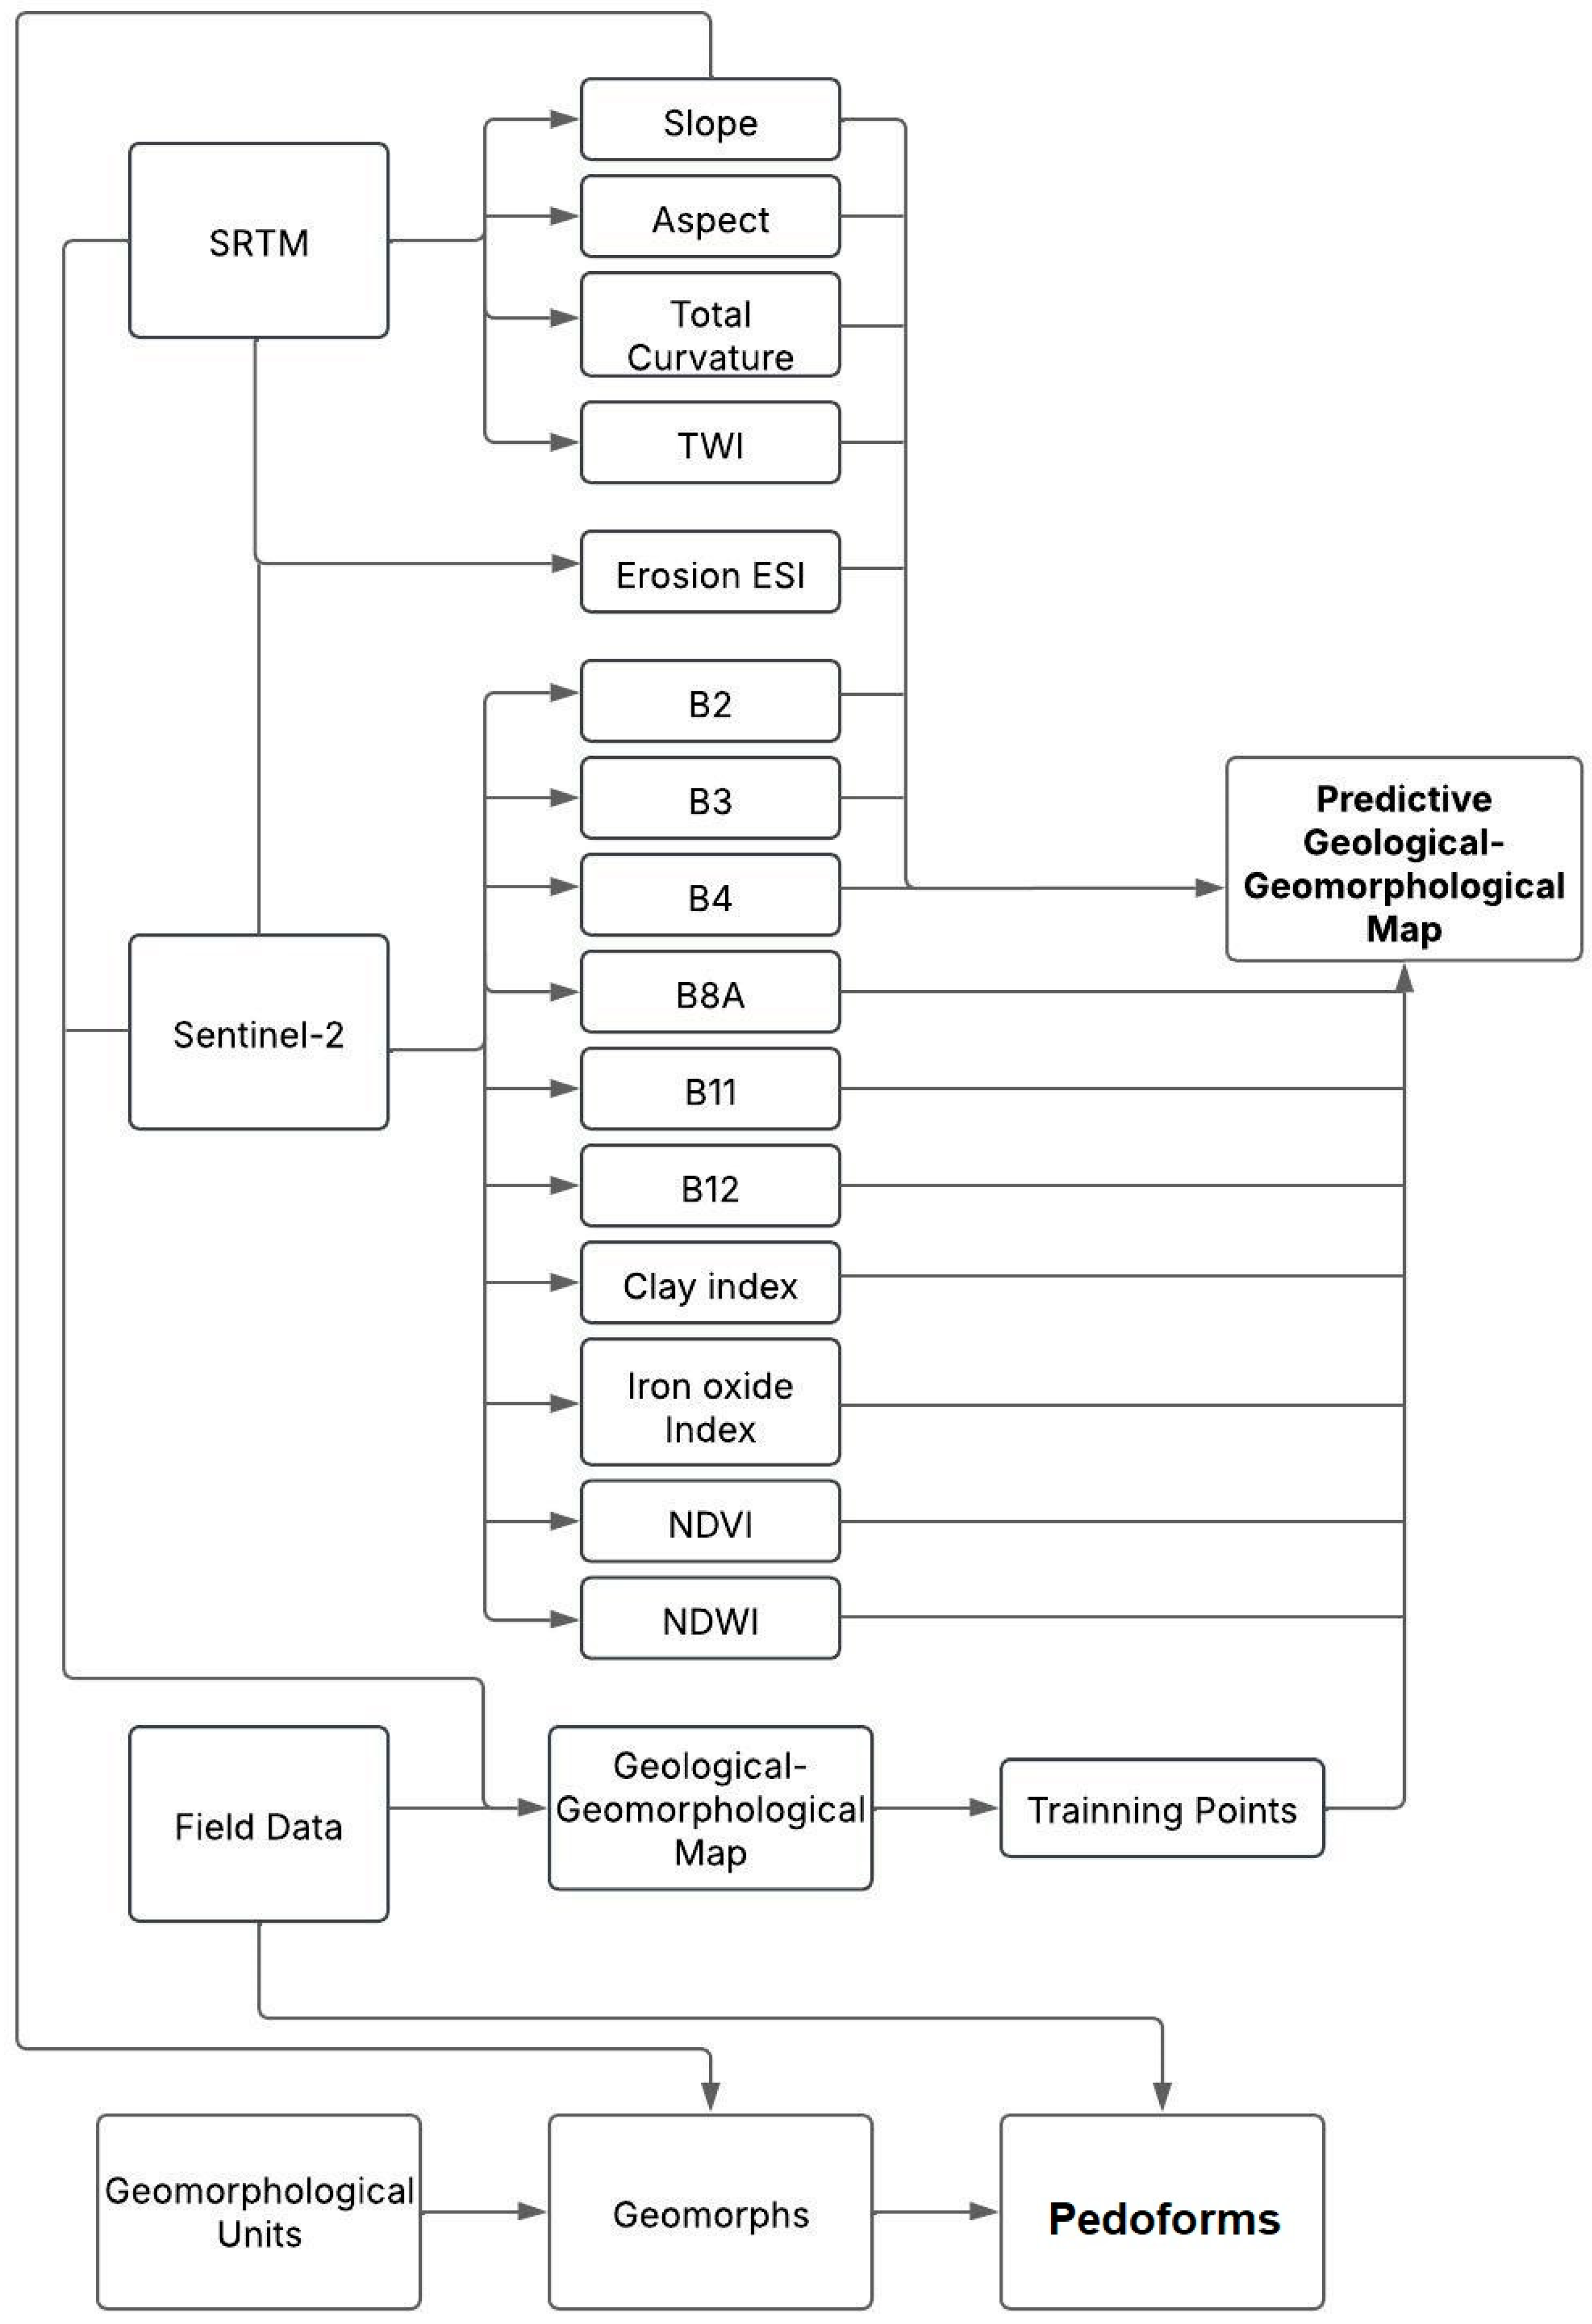
Figure 4.
(a) Geomorphological units; (b) Slope classes and soil type integration. (c) Pedo-geomorphological units for the study area.
Figure 4.
(a) Geomorphological units; (b) Slope classes and soil type integration. (c) Pedo-geomorphological units for the study area.
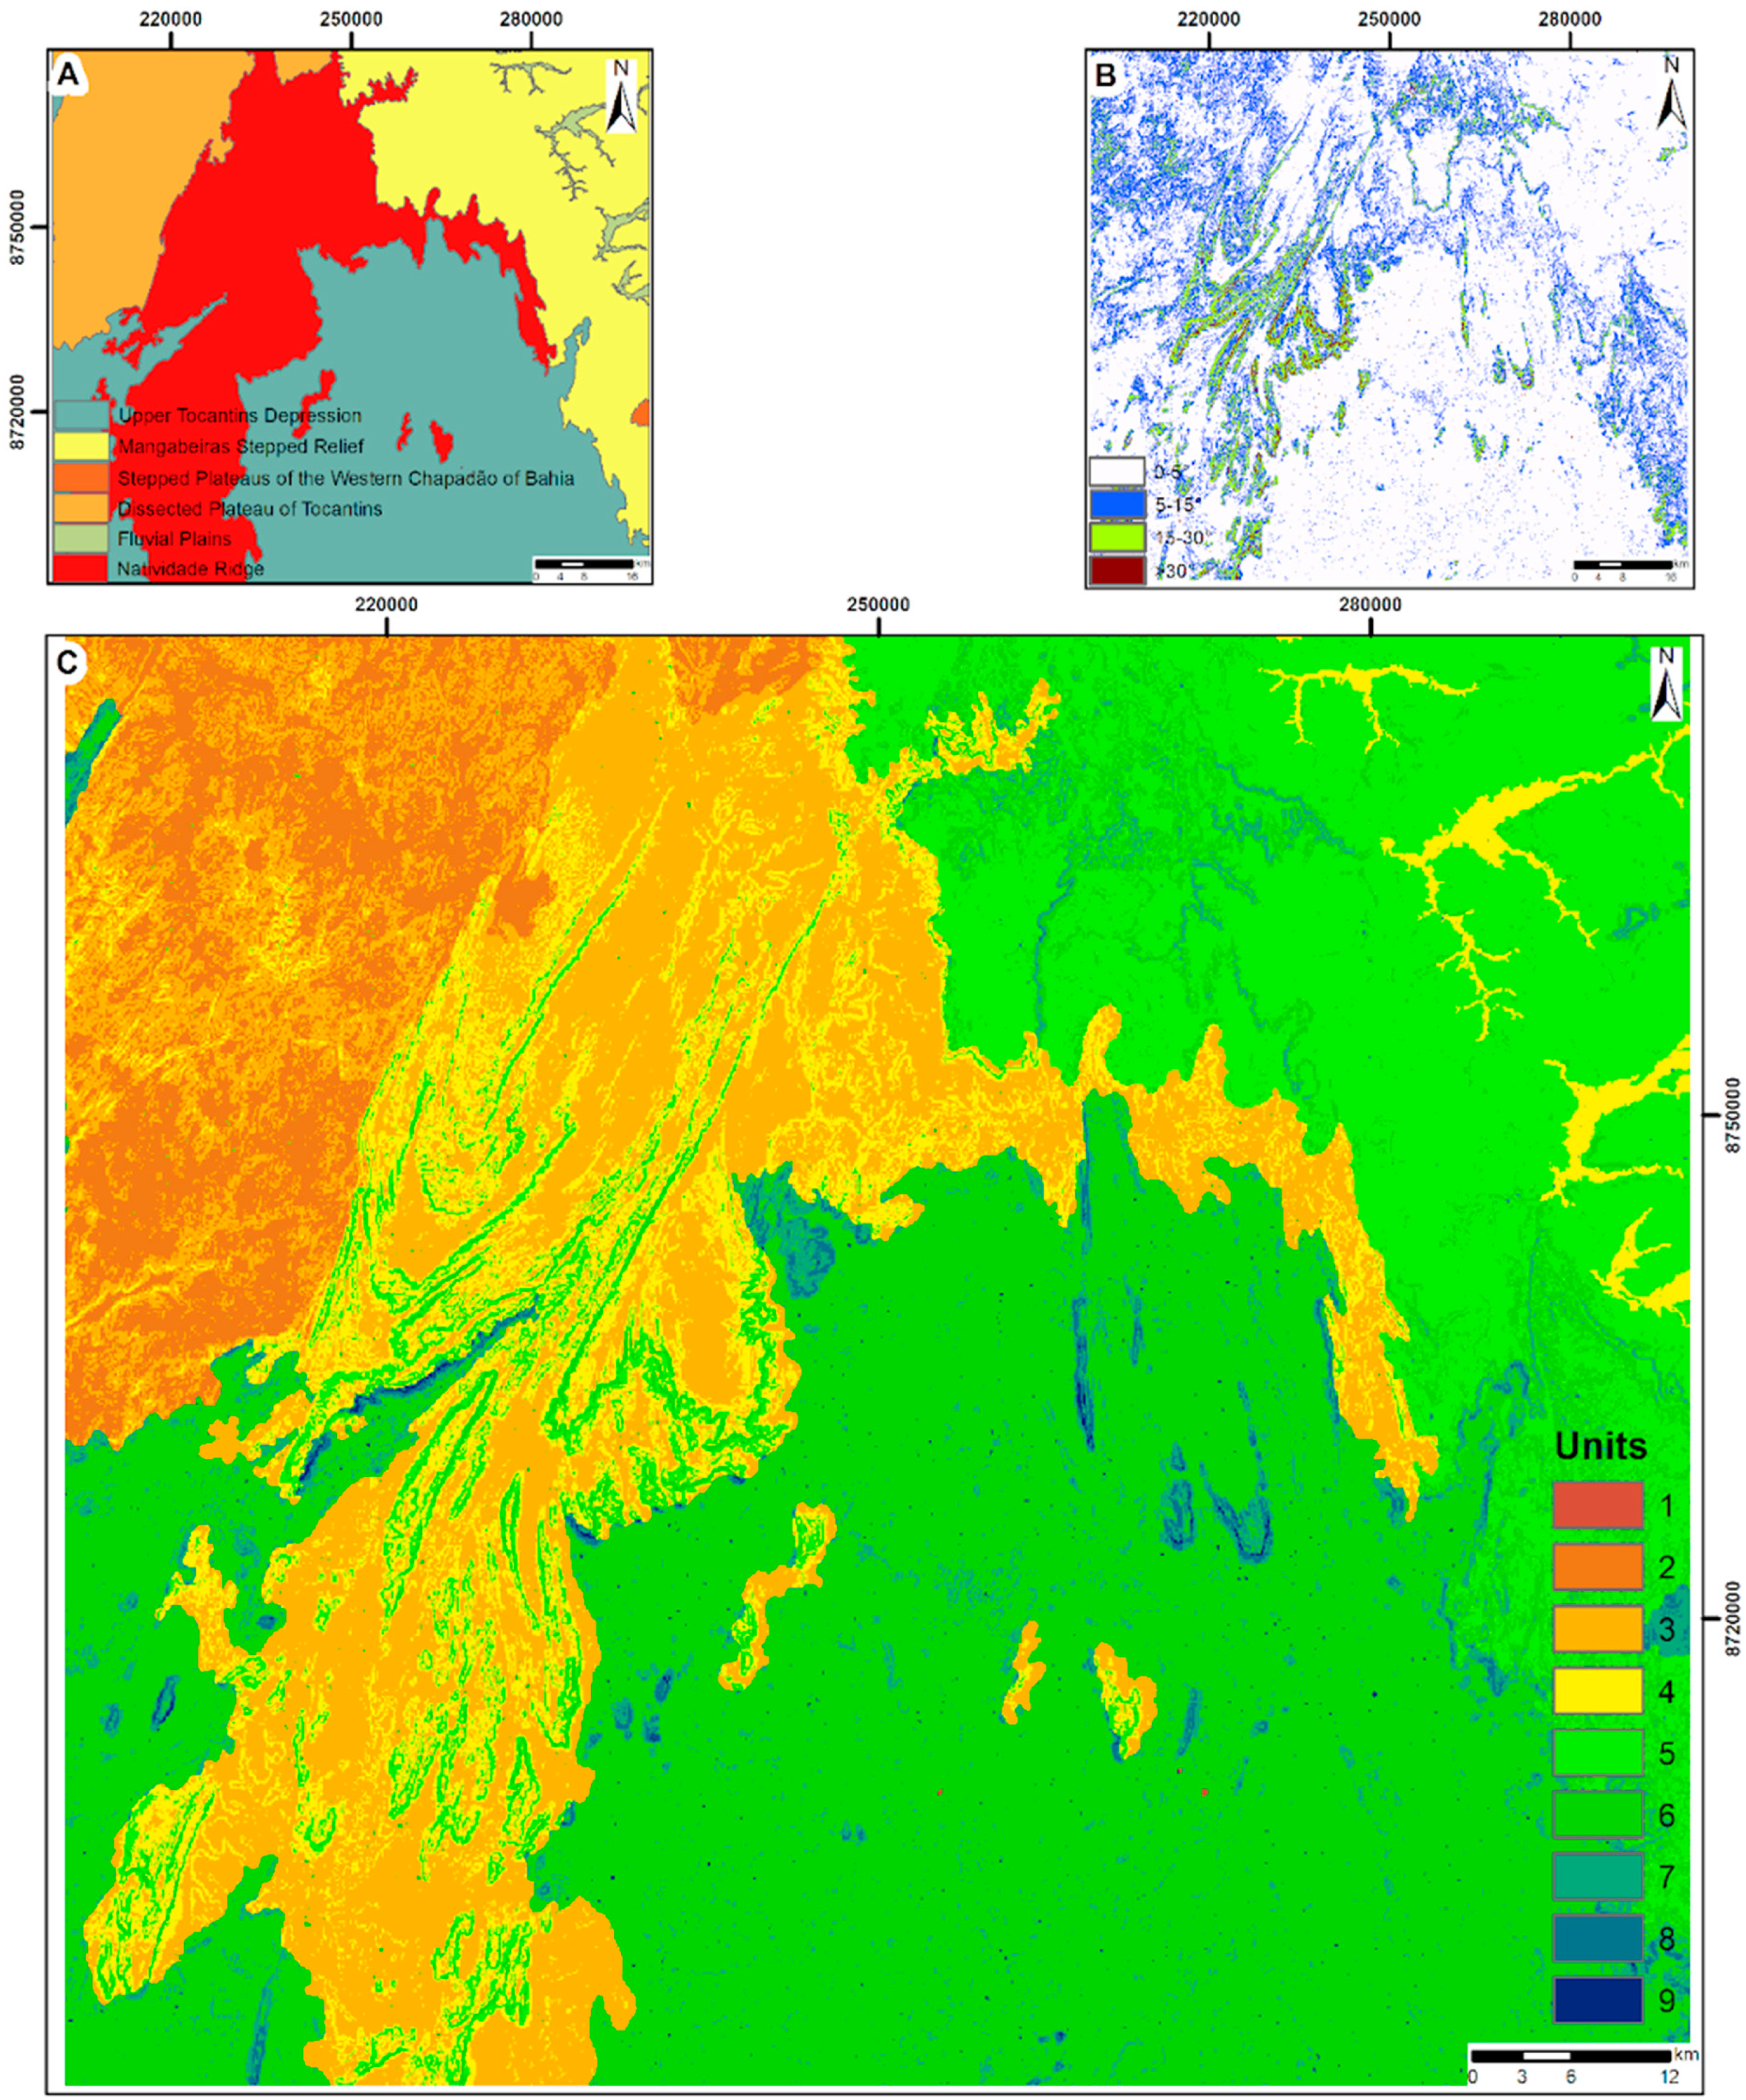
Figure 5.
Maps displaying: (a) Slope; (b) Topographic Wetness Index - TWI; (c) Total Curvature - TC; (d) Erosion; (e) Aspect; (f) NDVI; (g) NDWI; (h) Clay Index; (i) Iron Oxide Index; (j) Sentinel Band B2 (Blue); (k) Sentinel Band B3 (Green); (l) Sentinel Band B4 (Red); (m) Sentinel Band B8A (NIR); (n) Sentinel Band B11 (SWIR1); (o) Sentinel Band B12 (SWIR2).
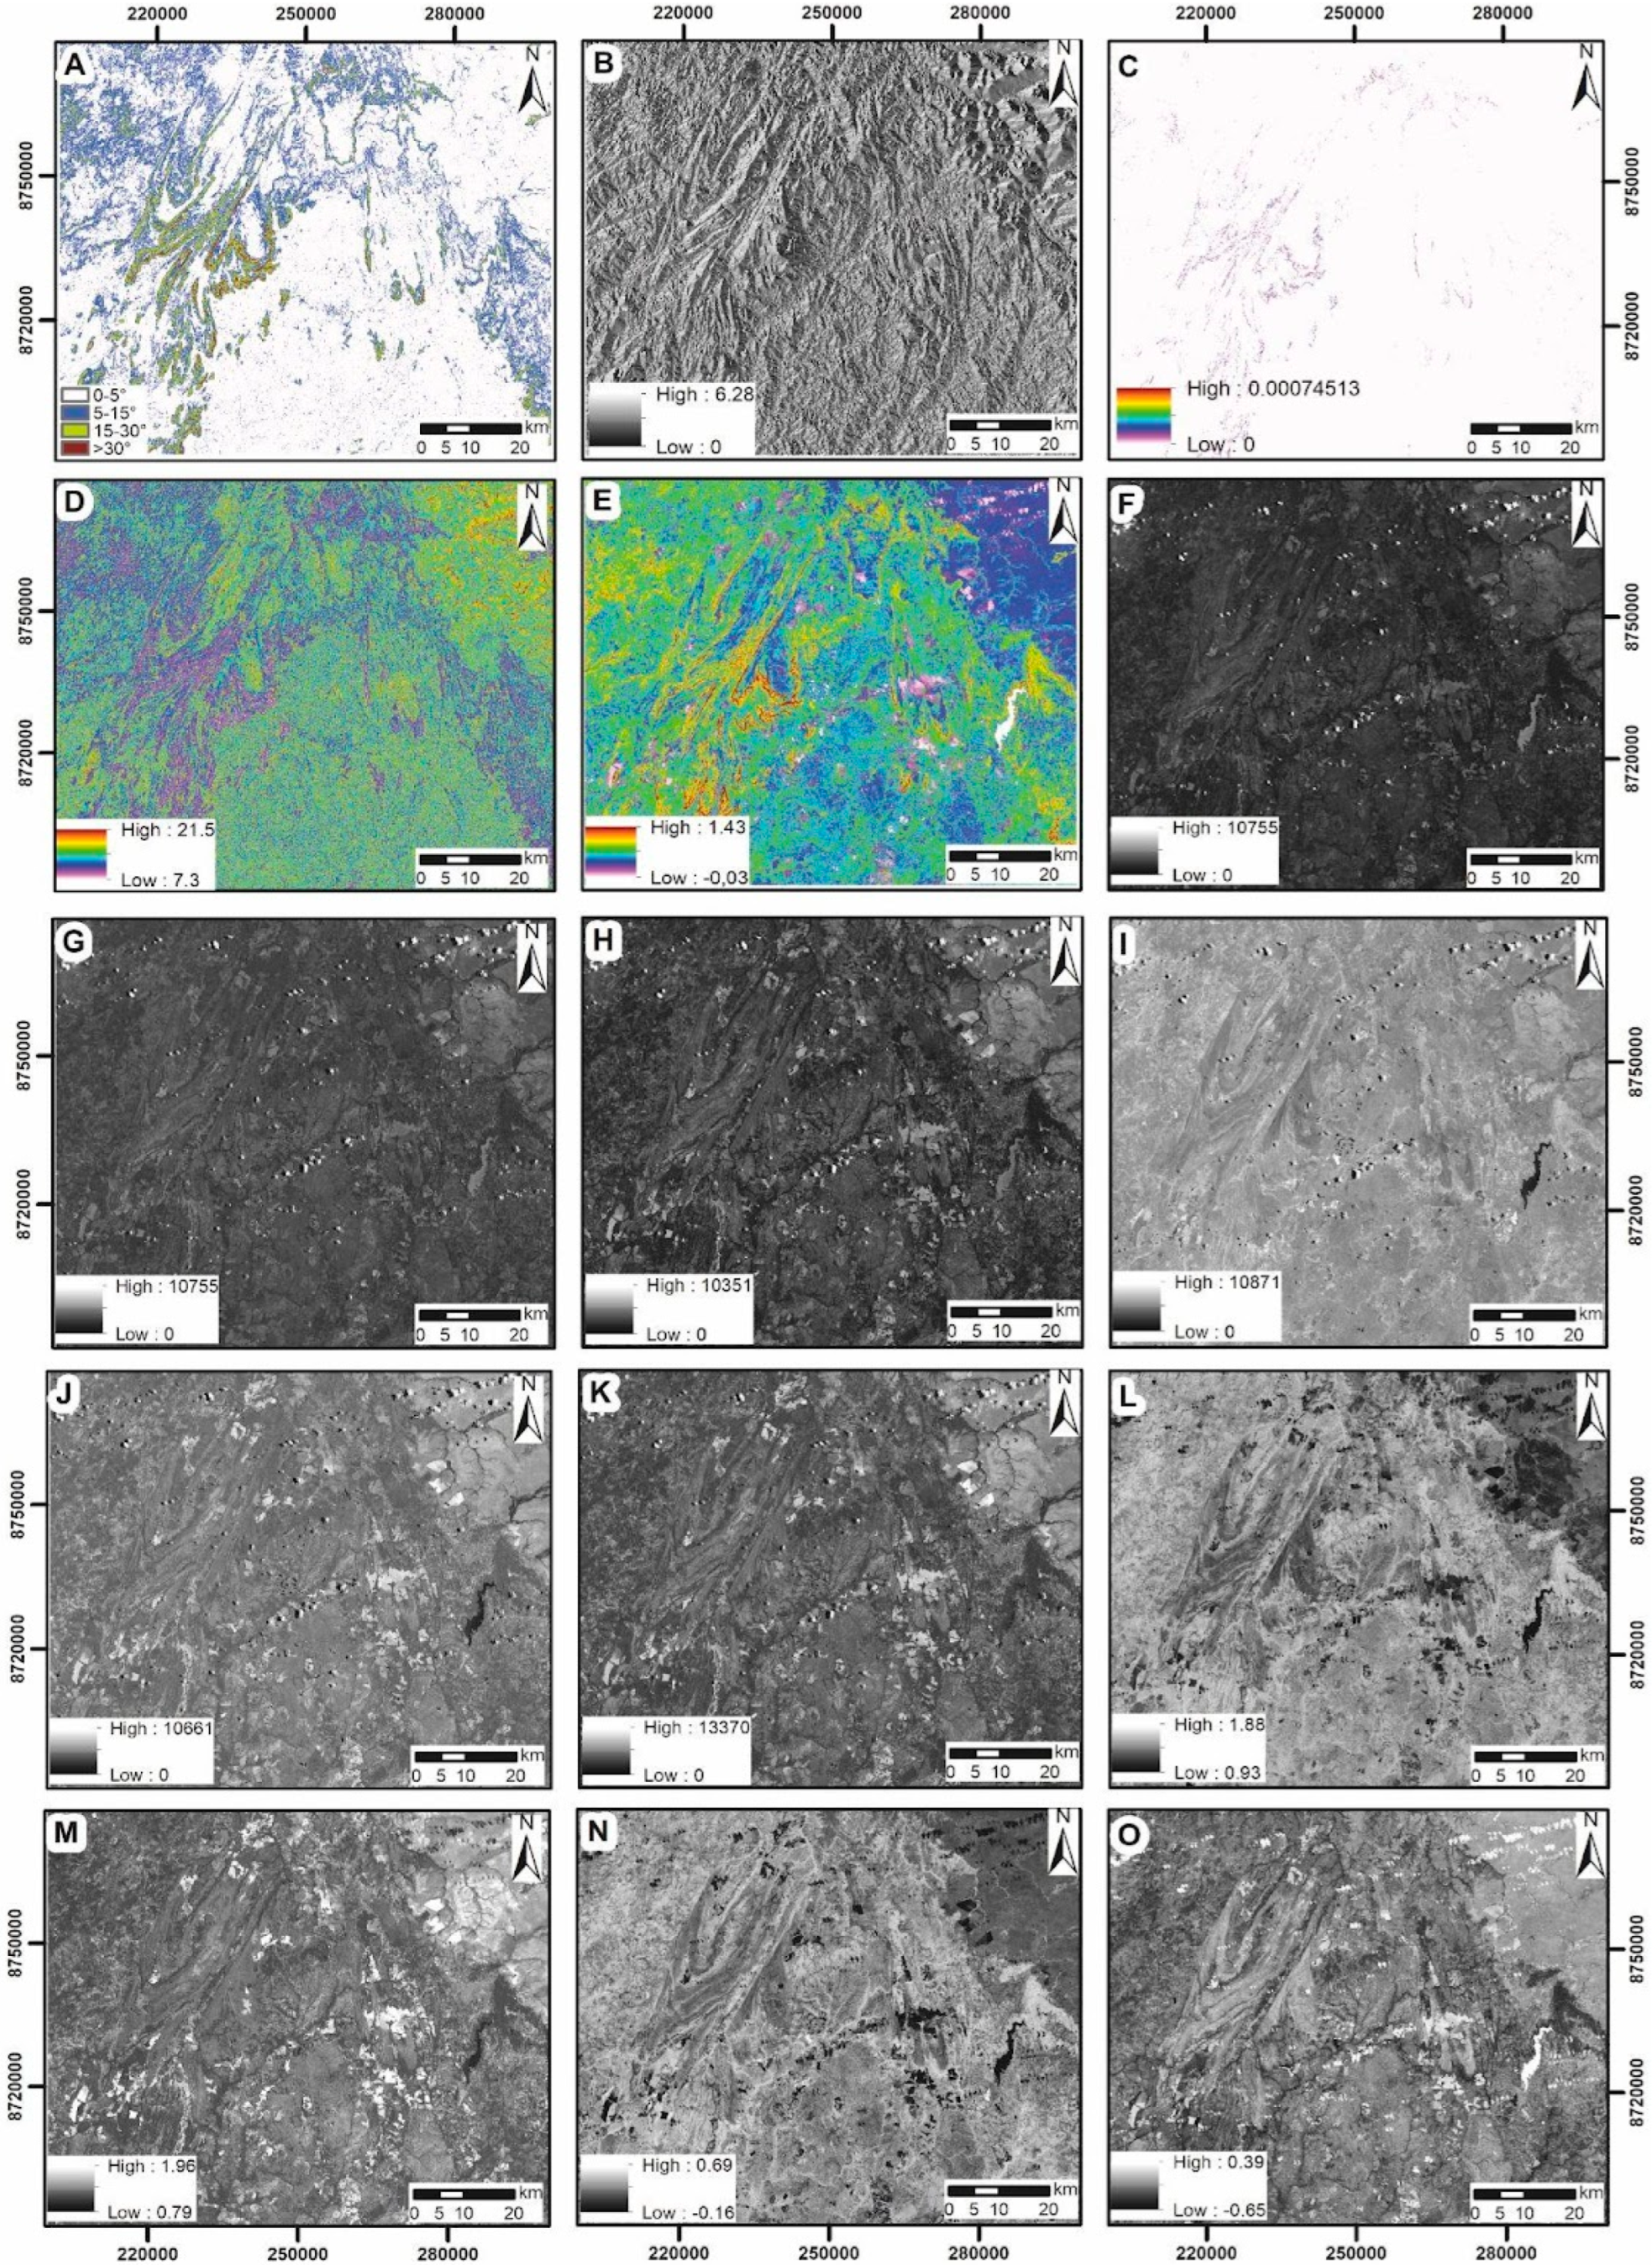
Figure 6.
Regional geological-geomorphological map of the Natividade region, generated through satellite imagery analysis and field validation, depicting the following units: (1) Riachão do Ouro Group (Almas Terrane), characterized by moderate spectral pattern density associated with land use and management. (2) Almas Terrane (eastern portion), marked by folded drainage patterns. (3) Natividade Group, located in areas of high topography and steep slopes, indicating resistance to erosion. (4) Phanerozoic cover, exhibiting high spectral pattern density influenced by depositional processes and anthropogenic activities. (5) Almas and Aurumina Terranes, presenting a spectral pattern indicative of dense vegetation cover.
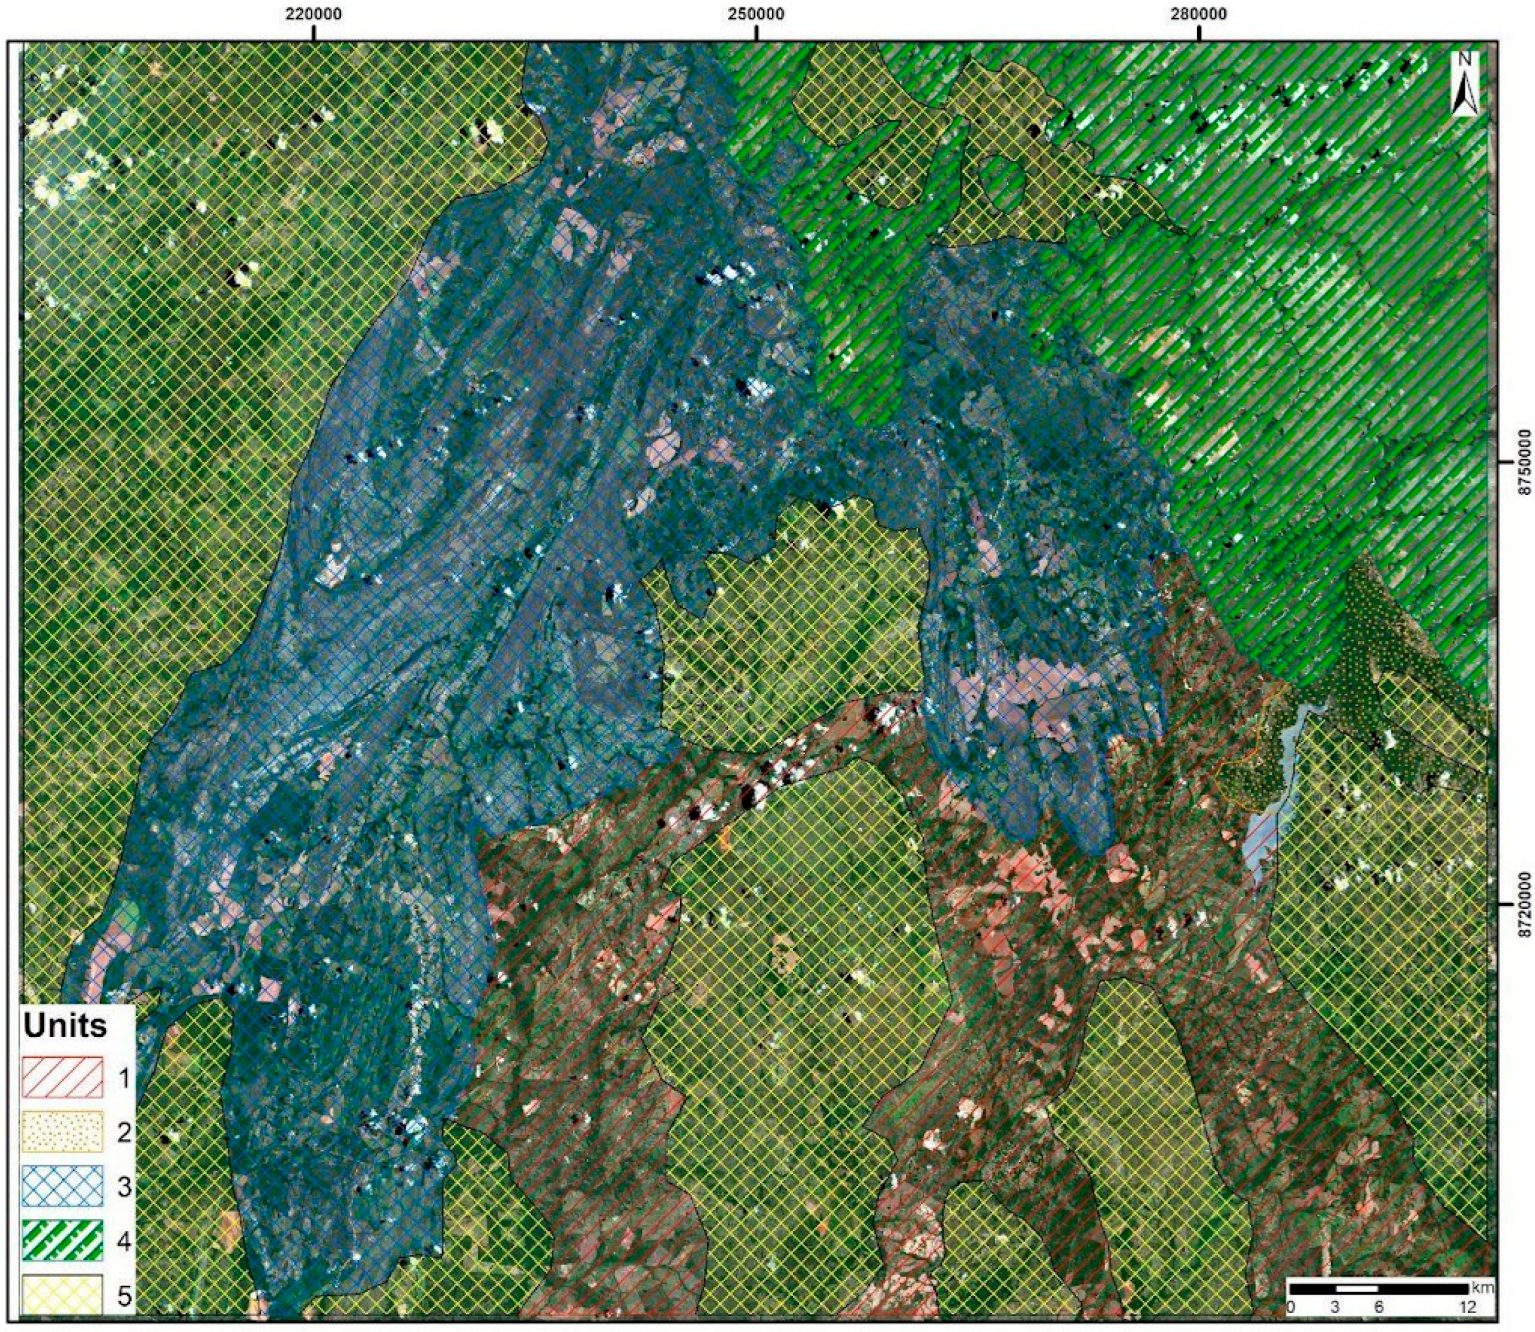
Figure 7.
Predictive geological-geomorphological map of the study area generated using the Random Forest classification method based on 15 predictive variables, including topographic, spectral, and geomorphometric indices.
Figure 7.
Predictive geological-geomorphological map of the study area generated using the Random Forest classification method based on 15 predictive variables, including topographic, spectral, and geomorphometric indices.

Figure 8.
Relationship between geology and landscape evolution, using information from Pedo-Geomorphological Mapping (PGM) and Predictive Geological-Geomorphological Map (PGG).
Figure 8.
Relationship between geology and landscape evolution, using information from Pedo-Geomorphological Mapping (PGM) and Predictive Geological-Geomorphological Map (PGG).
Disclaimer/Publisher’s Note: The statements, opinions and data contained in all publications are solely those of the individual author(s) and contributor(s) and not of MDPI and/or the editor(s). MDPI and/or the editor(s) disclaim responsibility for any injury to people or property resulting from any ideas, methods, instructions or products referred to in the content. |
© 2025 by the authors. Licensee MDPI, Basel, Switzerland. This article is an open access article distributed under the terms and conditions of the Creative Commons Attribution (CC BY) license (http://creativecommons.org/licenses/by/4.0/).
Copyright: This open access article is published under a Creative Commons CC BY 4.0 license, which permit the free download, distribution, and reuse, provided that the author and preprint are cited in any reuse.


