
Submitted:
28 May 2025
Posted:
29 May 2025
You are already at the latest version
Abstract
Part two of this series critically examines the elemental composition of human diets and their implications for body composition, metabolism, and evolutionary adaptation. It explores the roles of carbon, oxygen, and hydrogen in various dietary patterns, comparing carnivorous, Mediterranean, plant-based, and traditional English-American diets. The analysis highlights the significance of elemental ratios in metabolic processes, epigenetic mechanisms, and thermogenesis. It delves into the historical development of diagnostic techniques such as basal metabolic rate (BMR) and respiratory quotient (RQ), questioning their accuracy in diverse populations. Unique metabolic adaptations in Indigenous Australians are discussed, showcasing their exceptional thermoregulatory mechanisms and evolutionary responses to extreme climatic conditions. The paper also investigates the impact of environmental factors on human evolution, including the Ice Age's influence on dietary practices. Ultimately, it challenges conventional perspectives on human migration, evolution, and dietary recommendations.
Keywords:
hydrogen
; carbon
; oxygen
; body composition
; bmr
; elemental storage
; vitamin deficiency
; body mass index
; carbohydrate
; protein
; fat
1. Introduction
In part one of this critical analysis, I highlighted the importance of the nitrogen element, its ratio between other elements for metabolic processes, epigenetic mechanisms and brain development. Moving toward personalised healthcare, historical dietary patterns, need to be considered.
In part two, I will conduct a critical analysis of alternative elements such as carbon, oxygen and hydrogen, comparing the same carnivorous diet, with the modern Mediterranean diet, a plant-based diet, and the traditional English American Diet, emphasising their importance pertaining to body composition, elemental storage sites in the human body. The accuracy of traditional diagnostic techniques, such as metabolic rate and body mass index, are also discussed, and I offer a unique perspective on the geographical migration and evolution of man.
2. Methods
This conceptual and theoretical analysis draws on secondary data sources to explore the elemental composition of various dietary patterns and their implications for metabolism, body composition, and evolutionary adaptation. The research involved a comparative evaluation of published nutritional data, anthropometric references, and elemental molar mass calculations. The macronutrient dietary elements evaluated were extracted from the following sources. Mediterranean [1,2,3], plant-based [4], carnivorous [5,6,7], and English-American diets English, American and Australian cookbooks designed for wealthy housewives to feed the tradesmen [8,9,10]. [Supplementary data A1). Serving sizes were obtained from [11] and elemental composition was extracted from [12] [Supplementary data A2]. The diets were equalised to 3000kcal/day for comparative purposes.
The analysis incorporates historical and anthropological findings in vulnerable subjects, with a whole-hearted intention of promoting and advancing the health and well-being of these populations. The author acknowledges the Traditional Custodians of the Gubbi Gubbi (Kubi Kubi) Country, the land on which this series was written, and the significant mistreatment the population has suffered throughout our recent history. The author pays respects to their Elders past and present and extends to all Aboriginal and Torres Strait Islander peoples.
The author declares an unwavering commitment to upholding transparency and adhering to the highest ethical standards throughout all aspects of research for the benefit of all Australians.
The author is committed to upholding the ethical principles of the Declaration of Helsinki and ensuring the protection of human rights, privacy and dignity. In compliance no human or animal subjects participated in the research presented in this article, and all data were publicly available, donated and derived from previously published studies.
3. Carbon
Metaboloepigenetics is a new field of research that studies energy metabolism by epigenetic mechanisms [13]. Essentially, increased heat production can be correlated to an upregulation of central carbon metabolism for adenosine triphosphate (ATP) production, of which CO2 is a byproduct [14]. A shift in carbon utilisation, is seen in anaerobic metabolism [13]. For example, an up-regulation of one-carbon metabolism (1-CM), results in methylation of the guanidinoacetate methyltransferase which synthesises of creatine, when ATP is plentiful [15], and O2 is depleted [13].
Gas transmitters regulate metabolic switches [13], for example, S-Nitrosylation of Adenosyltransferase (MAT) enzyme, inhibits 1-CM [16],which reduces carbon availability for methylation reactions [13]. Moreover, at the onset of anaerobic metabolism, loss of cellular O2 tension in the cytosol causes spatial redistribution of gases which move down their concentration gradients [17]. Redistribution of NO during the transient hypoxia, activates methylation via the loss of MAT inhibition. NO can then translocate to the nucleus, where it enhances global methylation via inhibition of Jumanji C Containing Demethylases [17]. These complex mechanisms emphasise why a precise ratio of dietary elements is important.
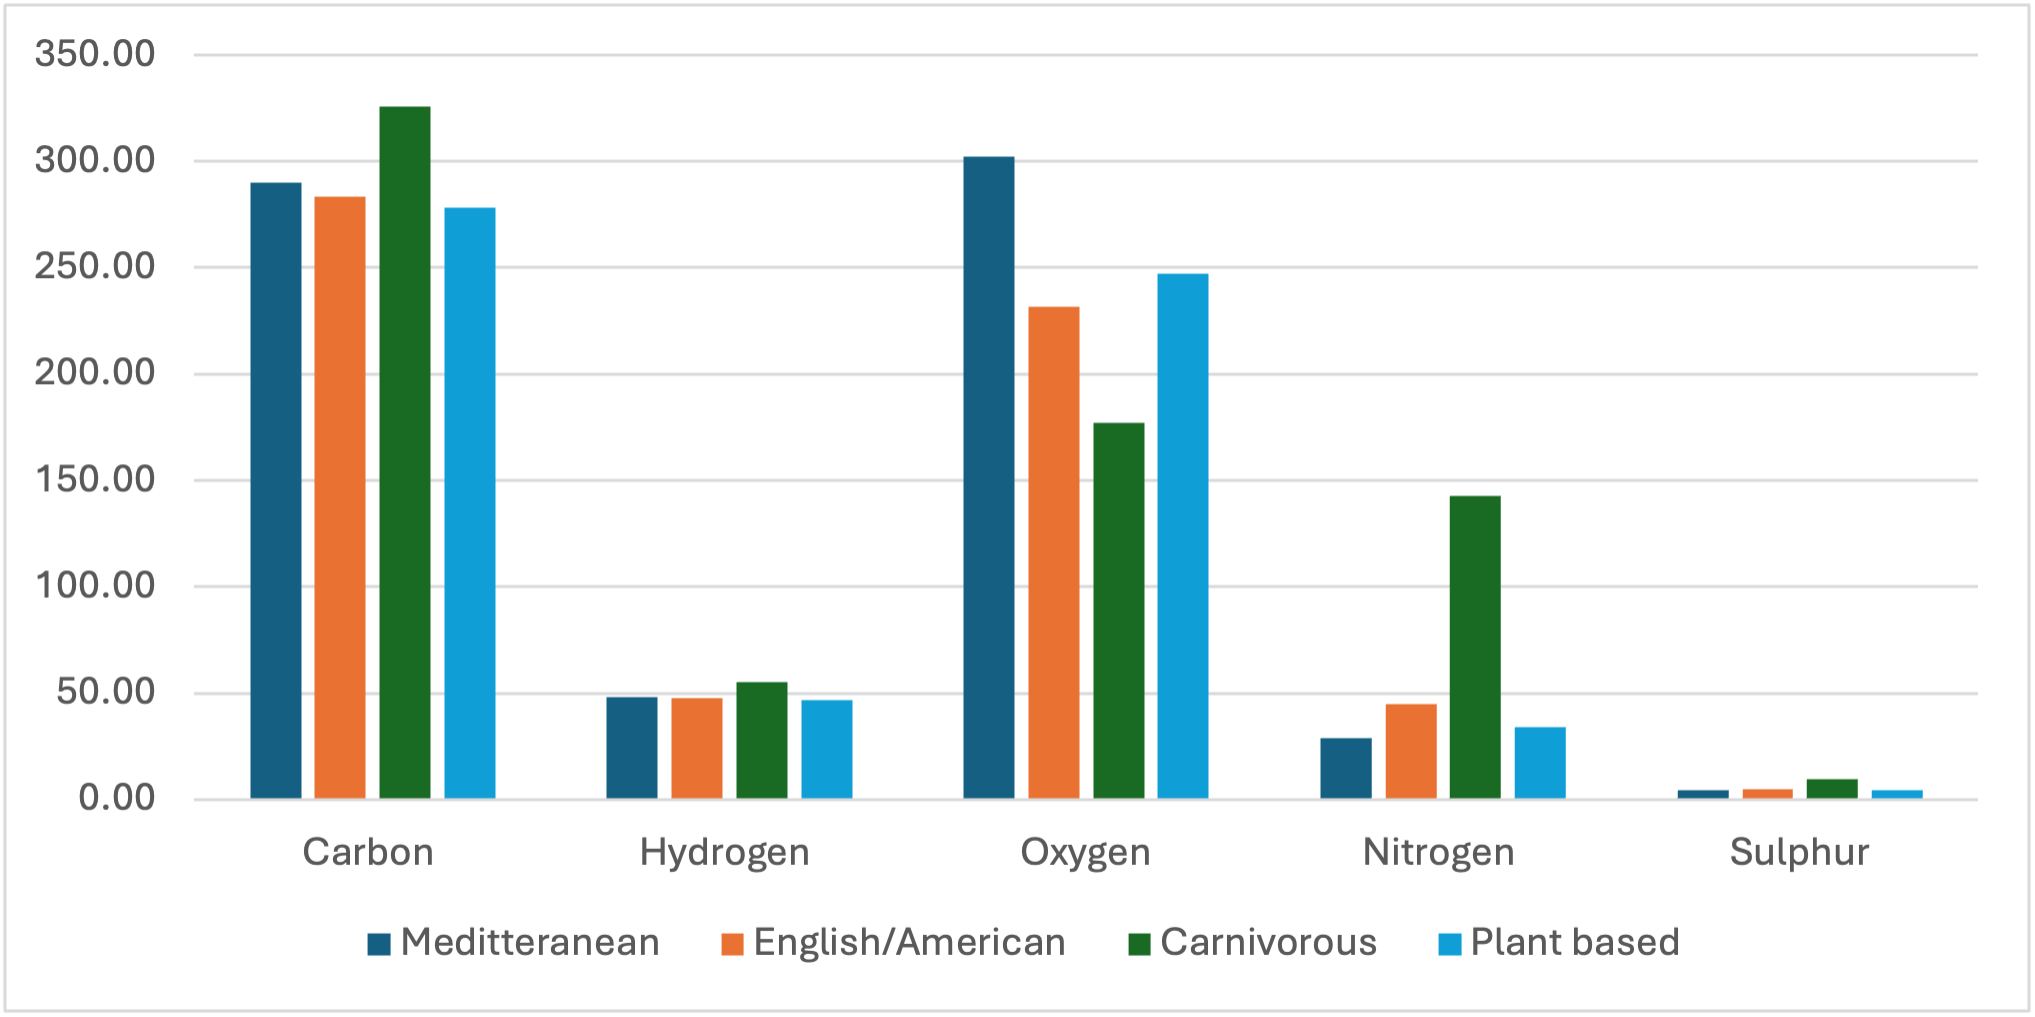
Little is understood about atmospheric CO or CO2 for human epigenetic purposes [13]. The carnivorous diet, contains up to 15% more carbon than the other diet (Figure 1), and it is possible that due to abundant localised CO produced from fires, used for heating, CO played an important role in environmental evolution, which some of us may still be adapting to, following evolutionary housing. Therefore, the seeking of elementary sources when subject to environmental or dietary elemental restriction, may play a role in addiction behaviour. For example, most illicit substances and many pharmaceuticals are based on or produce hydrocarbon elements. E.g. Cigarette smoke produces 200 times more CO2 than the atmosphere [18], and therefore sudden dietary or environmental elemental deficits, may lead to substance abuse. Although considered controversial, CO2 therapy has been used successfully in the treatment of substance abuse and neurological disorders [19,20].
3. Oxygen
The carnivorous diet contains 1-2 times less oxygen than other diets of the same calories (Figure 1).
3.1. Basal Metabolic Rate
John Harvey Kellogg’s book, The New Dietetics, set the foundations the American Dietetic Association, which was cofounded by Leena Cooper, a nurse at his Battle Creek Wellness Sanitarium. As part of Kellogg's sanitary reform, animal produce was considered putrid, generating excess heat, which led to a sin of lustful intemperance [22,23,24]. This may be partly attributed to the role of nitric oxide, a nitrogenous gas transmitter, derived from the protein’s nitrogen, in facilitating penile erection through vascular regulation. As a result, Kellogg promoted the substitution of the standard animal-based breakfast, with cereal [23].
The Sanitarium was also the birthplace for an original apparatus used to measure gaseous exchange via respiration which Kellogg referred to as heat production. The data obtained at the Sanitarium, was used by Harris and Benedict [25], in the development of the formula (height + weight + gender - age) which is used to predict heat production or basal metabolic rate (BMR), and is still used today. Total energy expenditure is calculated by adding additional energy costs, and slightly modified versions of the formula take into consideration malnutrition, and obesity, which modify O2 consumption [26].
CO2 production (VCO2 )/VO2 consumption (VO2), at the lung, is considered the respiratory exchange ratio (RER). The term respiratory quotient (RQ) has been interchangeable with RER, although today, it is used to specifically to describe the energy substrate utilised by non-lung tissues and organisms, such as the production of cell metabolites, fermentation, and animal/human metabolism [27]. An RQ <1 represents protein and fat utilisation whereas an RQ of unity represents glucose combustion, and its utilisation as a substrate. RQ >1.2 correlates to anaerobic metabolism and utilisation of carbon [25]. The temperature of the environment and the subject, also influence the VCO2 /VO2 exchange [28].
3.2. Metabolic Uniquity and Heat Production
Early studies have led to considerable confusion. As discussed, plant-based substitutes were adopted to suppress excessive heat and metabolic processes, ultimately limiting human physical capacity and metabolic potential. In contrast, Liebig [28] stated, that to generate enough heat in cold temperatures, consumption of animal flesh was essential in preventing the ill effects from consuming train oil, or carbon and hydrogen in brandy. Like discussed in part 1, an excess of hydrocarbons causes an imbalanced ratio [21], which limits essential thermogenic up- regulation of metabolism.
Today, hydrocarbon methyl groups are added to pharmaceuticals to promote a steric hinderance, preventing electron transfer, whilst indirectly limiting natural intracellular heat production [13].
Population metabolic uniquity demonstrates that the measure of increased metabolism cannot always be represented by VCO2 /VO2. In fact, one study of oxygen consumption was seen to do the opposite. Indigenous Australians were a high animal consuming population as discussed in Part 1 [21], and whilst sleeping in freezing temperatures, the Indigenous Australian consumed half the O2 than the other non-native study participants; at times the participants could decrease VO2 significantly from basal levels [29]. It was said that the low body temperature, would reduce the gas volume and therefore CO2 emissions [6]. For a more modern example, using the ideal gas law; at 0°C, 1 mole of any gas occupies 22.4L, whereas at room temperature, that volume increases; increasing the amount of space occupied, therefore CO2 production, was considered an indicator of increasing body heat [30].
The indigenous subjects had significantly reduced skin temperature, reduced metabolic rates, and could sleep completely unperturbed on the ground, in the freezing conditions. In contrast, non-native controls woke frequently, and shivered intensely, with a significant increase in metabolic rate [29]. They found the Australians maintained body temperature by remaining in thermal equilibrium with their environment, making them uniquely heterothermic and exceptional. Skin temperatures of the rural Australians could go low as 4°C, without any metabolic increase to generate heat [6], suggesting that Kellogg’s theory pertaining to animal meat consumption and excessive heat were inaccurate. The differences were said to be partially attributed to cutaneous vasoconstriction of the extremities, allowing for heat conservation by shutting down skin circulation. In fact, the application of cold to one arm resulted in rapid vasoconstriction of the other, with blood pressure changes of as much as 30mmHg [6]. It was also noted that extreme heats from the fire, up to 45°C, which caused pain and discomfort in Westerners, was also tolerated by the tribe [29]. The researchers suggested the population had evolved from Westerners, to withstand Australian climatic conditions [6,29]. However, unlike various populations around the world, due to prolonged isolation, evidence of selective evolutionary adaptation to environment, lifestyle and diet is still not visible in some populations of Indigenous Australians [21].
It wasn’t until 1980, that it was recognised that an isolated tribe of Indigenous Australians had reduced thyroid function tests, compared to urban European Australians, and that diagnostic reference values, derived from Europeans, were to be misleading [31], however, metabolic diagnostic reference values remained standardised.
In 1989, restriction enzyme sequencing was used to analyse the populations DNA, which was compared to plasma Thyroid Binding Globulin (TBG) levels. This study concluded, a codon substitution in the maternal, X-linked TBG gene, was responsible for the metabolic difference in the population [32]. In 2013, it was identified, that thyroxine (T4) is released from TBG in a temperature sensitive mechanism. For example, a 2 °C rise in body temperature, causes the release of approximately 23% of thyroxine , which is halved in over 50% of Indigenous Australians [33]. In skeletal and smooth muscle, thyroid hormone stimulates sarcoplasmic/endoplasmic reticulum calcium ATPase (SERCA1 &2) increasing calcium turnover and ATP utilisation for neurotransmission, contributing to the thermogenic response [34]. Thyroid hormones regulate cardiac repolarisation and QT interval related gene expression [35]. Thus, this exceptional mutation provides a thermoregulatory advantage, suppressing metabolism under extreme cold stress which makes me question the early evidence surrounding the migration of the Indigenous Aboriginal people to Australia. It is estimated that Indigenous Australians have lived on the continent for over 75,000 years [36], this means that they were blue zoned like many other environmentally stabilised populations across the world. Meaning they were metabolically and epigenetically in harmony with their environment.
A documentary presented by British journalist Graham Hancock, describes a cataclysm which occurred between 13,000 and 11,000 years ago [37]. Although Graham has been criticised for starting a war with academia, his theories are in certainly support of this research. Geologic records show that the climate can change abruptly [38]. This major apocalyptic event wiped out the majority of human civilisation; and was brought about by an extreme climate event, triggering what reflects universal adaptation to environmental stress; similar the devastating increase in natural events that we are seeing today. Interestingly, the universe has a wonderful way of maintaining balance. For example, an increase in males are born after a war [39].. Similarly, the earth fluctuates in temperature, triggering extreme heat and extremely cold events, as to maintain universal equilibrium. Hancock’s theory coincides with the ice core temperatures and CO2 data over the past 420,000 years [38].
The ancient civilisations explored by Graham, left behind dating evidence and symbolisation of what Graham thinks to be snakes in the sky, or otherwise known as comets. Much like electromagnetic interactions described in quantum biology [13], it is possible that changes in the earths electromagnetic field, can attract comets into the earth’s atmosphere, as to maintain environmental equilibrium. As a result of this event, during the Pleistocene Ice Age, approximately 11,000 years ago, atmospheric CO2 levels dropped to 180ppmv [40]. Phanerozoic global mean surface temperature and CO2 measurements suggest CO2 was the dominant control of Phanerozoic climate [41]. Ice core temperatures suggest surface temperatures remained between -8°C and -15°C. This would mean large ice sheets would cover most continents and because so much water was locked in ice, sea levels would be over 120 meters lower, therefore continental ice bridges would make continents accessible by foot [40]. Moreover, due to plants requiring atmospheric CO2 of over 200ppvm for photosynthesis, many regions would have been cold deserts [42]. This means that any population that survived the apocalypse and the subsequent ice age, lived without plant foods. The biological differences in Indigenous Australians, show astounding evidence of human adaptation to extreme weather conditions, unlike any other population; the high protein diet likely provided sufficient carbon for metabolic processes, (Figure 1), utilising a hibernation-like metabolic capacity to survive the ice age. Therefore, in contrast to popular belief, the migration of humans to warmer climates may have diverged from the Australian population. The lack of evolutionary selection from environmental adaptation is in support of this theory, and the unique metabolism of the population suggests carbon dating may also be inaccurate, as for this period, people had significantly reduced VCO2 /VO2 respiration.
4. Elemental Composition Vs Mass
When we compare pure macros, we can clearly see, how we are what we eat. Body composition can be altered by a change in dietary elemental ratios. To begin, we must consider the body as a vessel that can holds a specific volume of elements. Figure 2 shows the molecular mass of dietary elements.
4.1. Carbohydrate
Hypothetically, if the body vessel was made of pure glucose, with a chemical formula of C6H12O6, despite the same amount of oxygen and carbon, oxygen represents more body mass, than any other element due to its greater atomical mass (Figure 3).
4.2. Protein
Despite a carnivorous diet containing 1-2 times less oxygen, hypothetically if the body was comprised entirely of serine, the mass of the body would be comprised of more oxygen than any other element (Figure 4).
4.3. Fat
Despite pure fat containing mostly hydrogen, the mass of a body comprised of entirely of palmitic acid would be mostly carbon (Figure 5).
5. Elemental Storage and Dietary Substitution
Therefore, the substitution of any element will result in epigenetic adaptation and redistribution of elements to the appropriate storage site. To further simplify body composition and the elemental substitution in terms of mass, changing from a hypothetical diet of pure serine protein to a diet of pure carbohydrates, for each nitrogen molecule lost, results in a gain of 3 carbons, 3 oxygens and 5 hydrogens, and a `total molecular mass gain of 89 u. The substitution of fat, would result in a molecular mass gain of 146.33 u. This equates to a substitution in body composition at the element’s respective storage site. Figure 1 compares the total ratio of dietary elements, whereas Figure 6 compares the total mass of the four different diets.
5.1. Nitrogen Storage
As discussed in part 1 [21], vital nitrogen is preserved in residual muscle for DNA synthesis and cell growth. A gradual reduction of dietary nitrogen will slowly deplete muscle stores, including the brain. The nitrogen will be substituted by other elements within their respective storage compartments [13]
5.2. Carbon Storage
5.3. Oxygen and Hydrogen Storage
Glycogen and water are the largest stores of O2 and Hydrogen (H) [45]. Again, in the case of epigenetic inflexibility [21], excess glucose may not be utilised effectively, contributing to hyperglycaemia and storage of glycogen and concomitant water in adipose tissue. This occurs at a ratio of 1:3, respectively [46]. This fluid retention is also a hallmark feature of obesity [47] and may indicate an incorrect evolutionary dietary preference.
5.4. Hydrogen
Figure 7 shows the protein only comparison of the diets. The hydrogen element is significant considering the largest amount is consumed by the carnivore, and despite hydrogen having the least mass, the carnivore still consumes more hydrogen than any other diet (Figure 1). So, assuming a carnivore lost its food source and was required to consume rations of dry bread, it is likely that this change would have significant implications on the thirst response.
Together this suggests that if epigenetic pathways are not efficient, calories in vs calories out as a weight loss mechanism, may not be as straight forward as previously thought.
6. Body Mass Index
The body mass index (BMI) is calculated the same way as density, that is, mass/volume, in chemistry, or mass/height2 for BMI. BMI is deceiving as it is supposed to be an estimate of fat, but really, it’s an estimate of density, for overestimates are seen in body building subjects, and underestimates are seen in subjects with low lean body mass [48].
We established here that per molecule of serine, palmitic acid weighs more than glucose and glucose weighs more than serine, therefore, a body of equal size, comprised of entirely serine, will have the lowest mass. However, many different amino acids of varying masses, comprise protein.
Muscle is said to weigh more than fat due to increased density, but when we look at the raw skeletal muscle tissue from an animal, let’s say raw pork, and compare it to the fat portion of the animal, in most cases muscle takes up more volume for the same mass, making it technically less dense than fat. This reduced density is likely the driving factor contributing to satiety [49]. The mineral content of the muscle also plays a role and differs between food sources. Yet, standardised densities are calculated as fat (.85 g/cm3), which is less than water (.99 g /cm3), but much lower than glucose (1.56 g/cm3, and protein e.g. serine (1.6 g/cm3) & valine (1.32 g/cm3) [50]. It is likely the many other constituents in muscle contribute to its reduced density since muscle is technically not pure serine or pure protein.
Supplementary data table 2, shows that to consume 3000 calories of animal protein, you are required to consume 16.39% more food than other diet. However, it has been demonstrated here, that our current diets were originally derived from animals, in that the original diet contained all the necessary nutrients to sustain life, therefore, this increased recommended intake is likely to be unnecessary, unless of course there is a concomitant increase in physical activity, like that seen in hunters. Moreover, this increased mass per calorie, is masking the fact that carbohydrates and fat, weigh more than muscle.
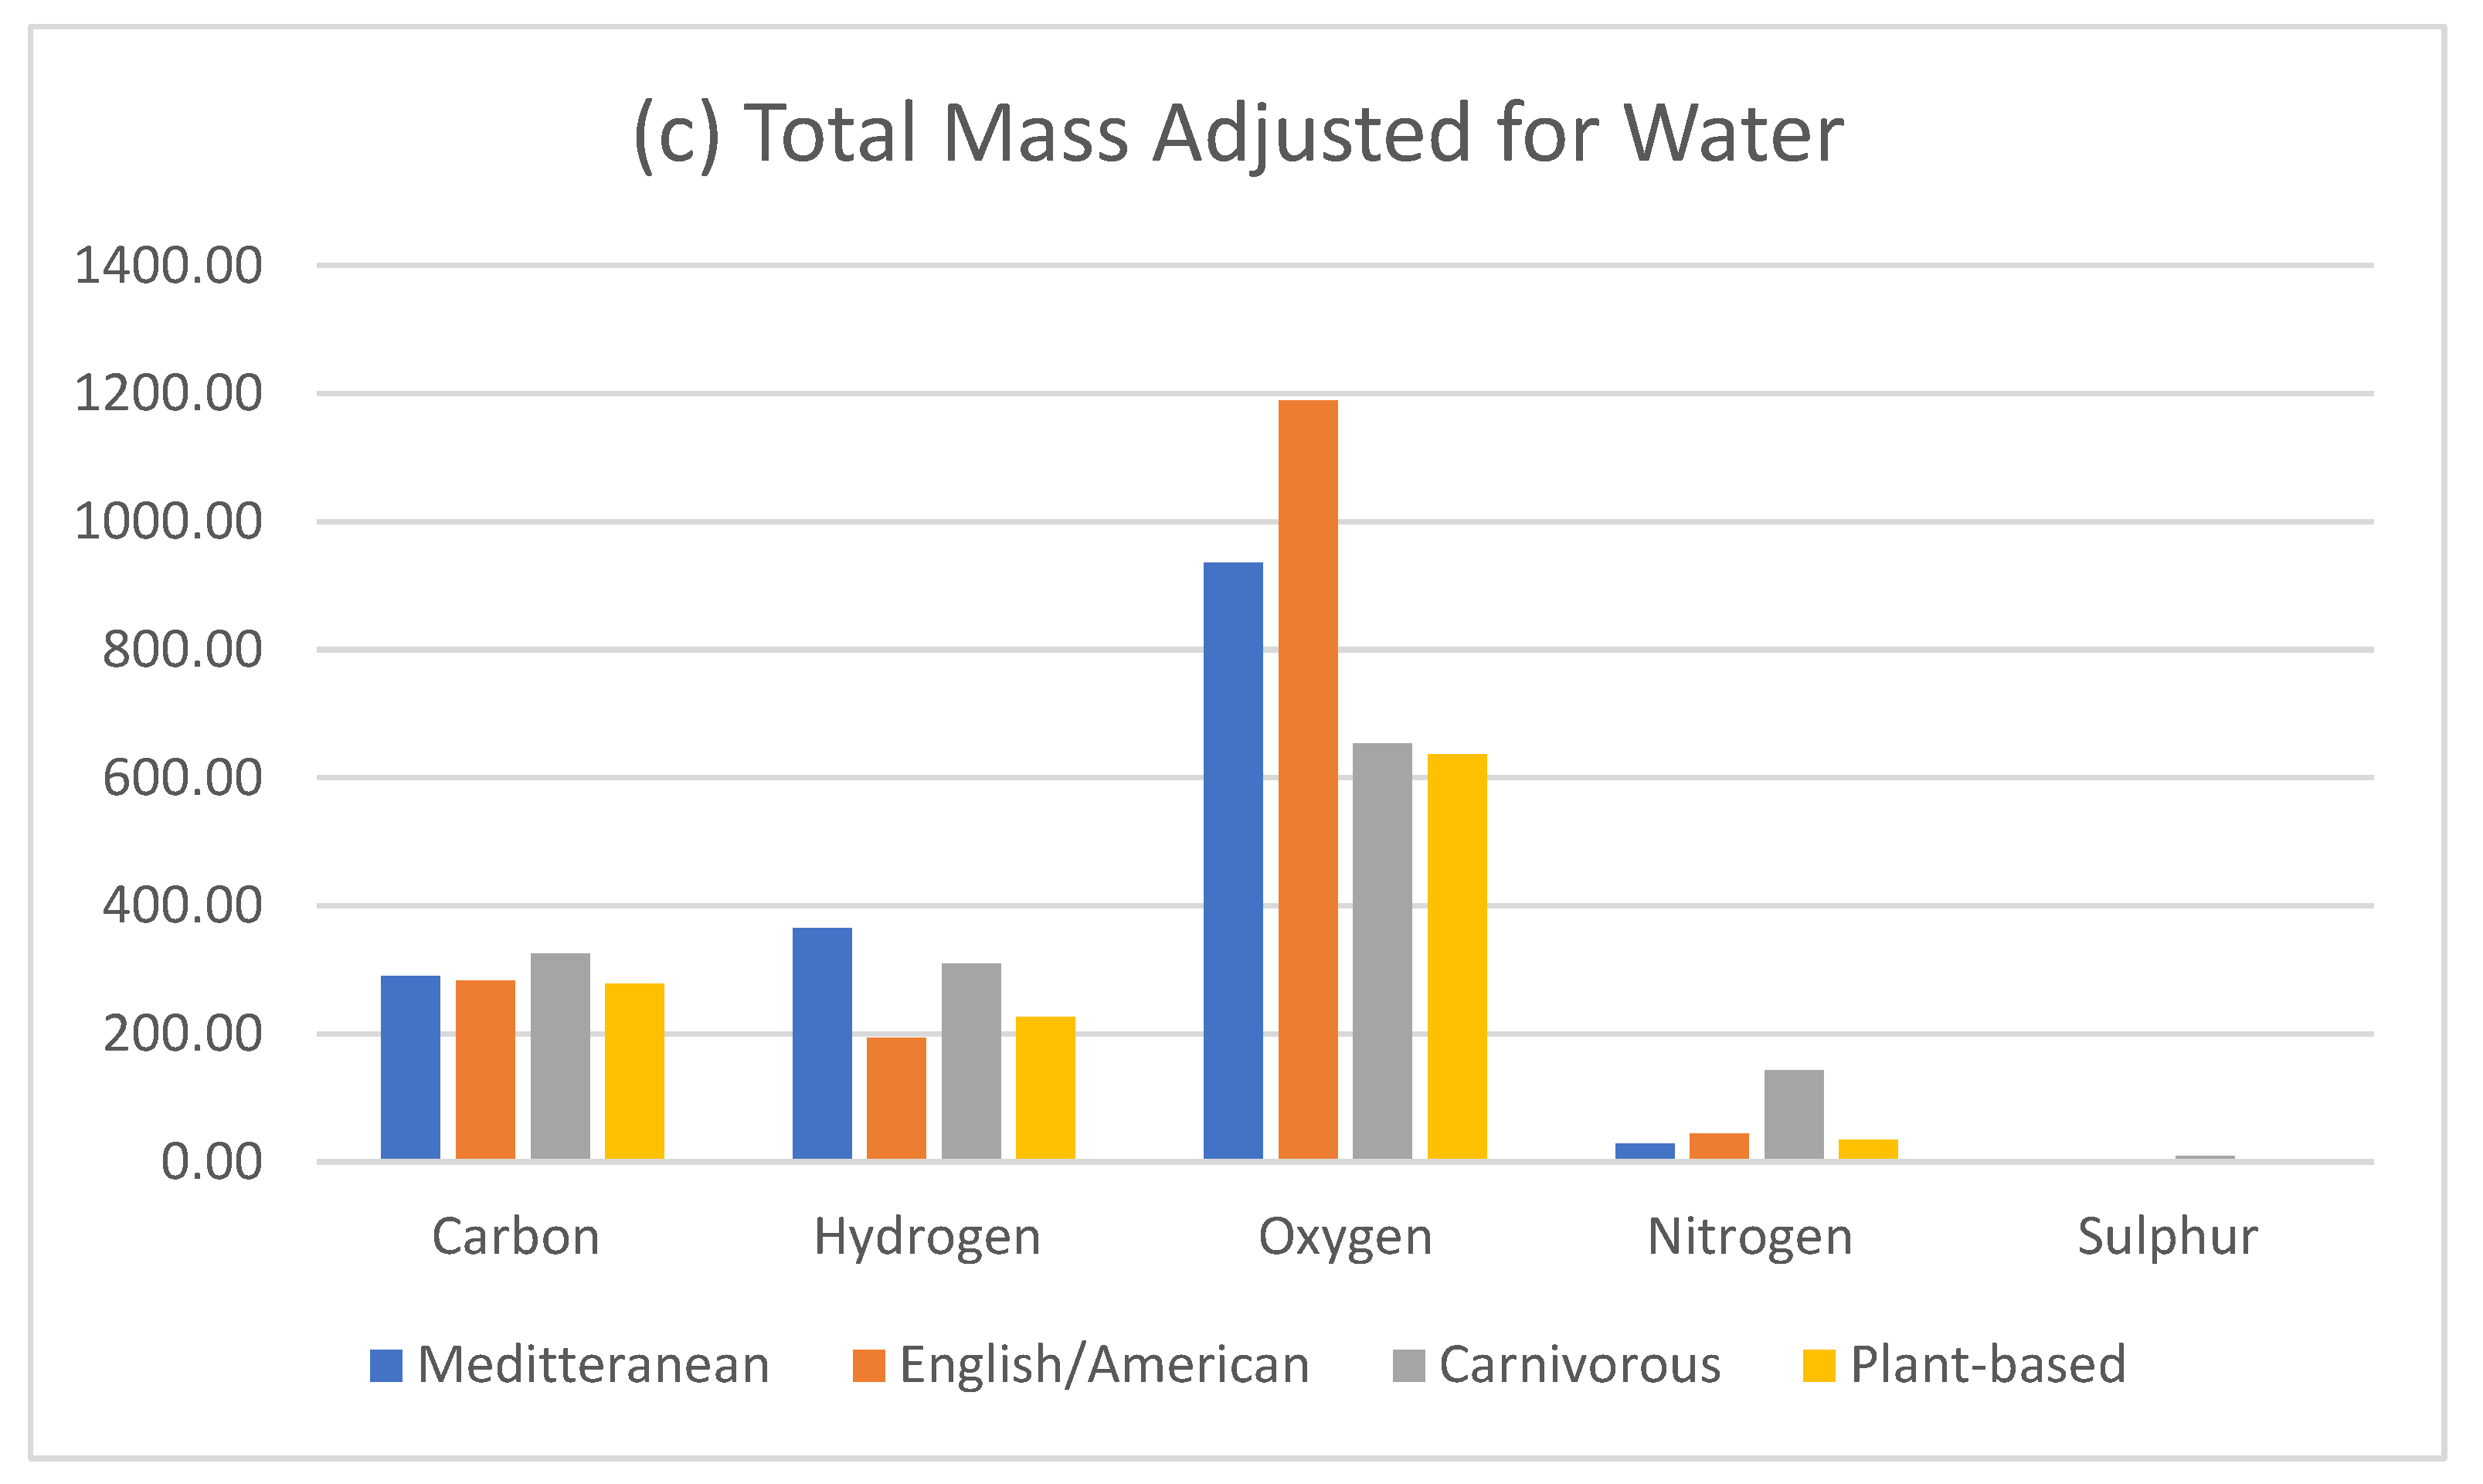
Food composition nutritional databases are limited by only having reference values for macronutrients, vitamins and minerals. We know that that all foods, contain many other dietary constitutes, such as hormones, and phytochemicals. Therefore, when calculating foods or total diets, there is a significant gap in the mass of food from available data sets, which estimate the calorie quantitation. Given that the body is comprised mostly of water, for the purpose of this exercise, this gap, has been adjusted for water in the dietary comparison (Figure 8). Given that we have a known value for the water content in muscle protein when we subtract protein (75%), glucose (1%) and fat (10%), [51], we can estimate that the residual unknown elements in the 3000-calorie carnivorous diet (2313.10g – 2.3g – 23.1g – 1603g), comes to a total mass of 552.8g.
To add relevance to this theory, a body builder who has the same volume, and BMI as person who is obese, likely has a greater mass due to the glycolytic muscle fibre type. Although there is limited data pertaining to the mass of muscle fibre types, we know that due to glycogen and water, the anaerobic fast twitch fibre types are larger in size, compared to the oxidative slow-twitch type [52]. This is why some populations and animals who consume high carbohydrate diets appear to have increased muscle mass, compared to those who are carnivores, who have lean muscle mass.
7. Dietary Comparison of Mass
Allow me put mass into perspective by comparing two popular breakfast options. The difference between a beef and cheese McMuffin from McDonald's and a bowl of cereal, is shown to have implications for our nutritional well-being, especially when it comes to body mass. The cereal option of Wheat-Bix possesses a 5-star health star rating, and whilst adhering to the recommended serving size of 30g, consisting of two biscuits, 125ml of full-cream milk, and a teaspoon of sugar, comes to a total 164g, with consideration for milk having a slightly increased density than water. The total caloric intake comes to 205 calories [53].
The beef and cheese muffin at McDonald's, weighs in at 115g, packing a total of 313 calories. The McMuffin is comprised of approximately 1g of essential electrolytes, like including calcium, sodium, and potassium and its macronutrient profile is made up of 24.3g of carbohydrates, 17.5g of protein, and 15.7g of fat, leaving 57.5g of miscellaneous ingredients, whose elemental ratios remain undetermined [54].
Although the muffin offers less food by volume and mass, it but may lead to greater satiety due to increased protein [49].
Despite the muffin containing 313 calories, when we consider the caloric expenditure through daily activities, the impact on weight storage becomes apparent. With only a modest exercise burn of 150 calories, choosing the beef and cheese muffin leads to a 55.28g store of mass, which contrasts with the cereal which results in a 113.2g store, this is due to the mass of the cereal being 1.4 times greater than the muffin. Moreover, the added folic acid in the cereal has the potential for interference with epigenetic flexibility [13], resulting in increased carbon storage, as discussed.
Due to recommendations that plant foods are healthier and industries are required to improve sustainability practices, fast food chains and supermarkets are modifying their recipes, offering healthier choices by reducing their meat to grain ratios (Hungry Jack's 2025). This should theoretically be making their prices cheaper, and the population healthier, but instead, for some populations, the contrary is true [55].
A crumbed chicken breast from Aldi contains only 57% chicken [56]. These factors are ultimately making many of us larger and unhealthier, via transition towards a plant-based diet, without us realising it. The same is true for beverages, although promoted to contain no sugar, mass is still mass, and without efficient carbon utilisation, these products will result in increased weight, despite a calorie deficit.
8. Epigenetic Programming
Epigenetic programming sets the stage for all metabolic processes. Individuals of different nationalities, environments and rates of evolution will have unique epigenetic programming. That is, genes are expressed uniquely and dependant on the individuals diet, lifestyle and environment.
8.1. Epigenetic Programming Energy Metabolism and Human Intervention
The accuracy of macro utilisation, using the respiratory exchange ratio or RQ is questionable. For example; populations who consumed an animal-based diet prior to human epigenetic intervention could sustain an RQ1, which is associated with carbohydrate metabolism, for 5 hours, without any carbohydrate consumption [6]. These studies use generalised population groups, and don’t consider different degrees of human evolution or gene expression. In addition, today, the results are muddied due to human influence, such as folate supplementation of experimental animals and humans [21].
It is said, that most individuals with western ancestry are well adapted to modern carbohydrate metabolism, and the rapid adaption of a low carbohydrate/high fat diet in athletes, results in the modification of RQ at the expense of oxygen and athletic performance [57]. This is likely to do with human intervening with epigenetic programming, which limits carbon utilisation during anaerobic metabolism [13]. Or put simply, the high carbon content of fat, drives metabolism through utilisation of one-carbon metabolism and therefore requires activation of methylation, which may be inhibited by folate and its derivatives.
The inability to switch on methylation, not only puts a restriction on adaptation in response to physical activity but also stresses cognition and essential hypoxic adaptation [13]. Without appropriate epigenetic, metabolic, and anatomical adaptation at the respiratory level, a sudden change in dietary elements like reverting to a carnivorous diet, from the Mediterranean, may result in dietary oxygen deficiency. Similarly, increasing anti-oxidant intake, through supplementation, may have an accumulative effect on oxygen availability in some individuals pre-evolved or post-evolved to these dietary conditions.
9. Deficiency
It is evident, that a sudden change in diet, can result in an elemental and/or nutrient deficiency. However, excessive use of nutrients, resulting from epigenetic adaptation is often overlooked. For example, an increase in dietary tyrosine is an example of how thyroid essential nutrients such as iodine and zinc may be depleted following an increase in thyroid hormone synthesis. What proves challenging for clinicians is recognising an up-regulated pathway and excessive utilisation. In this specific case, repletion may exacerbate the condition due to greater nutrient availability for synthesis. This is in contrast to a reduced efficiency, due to a suppressed pathway as a direct response to deficiency. Therefore, future personalised medicine is required to assess the efficiency of the pathway prior to deficiency repletion.
10. Conclusion
Part two of this analysis has described how a rapid change in dietary elemental ratios can lead to addictive behaviour, or increased thirst. Less oxygen in the diet and less environmental oxygen consumption, suggests some populations have a greater oxygen efficiency, which will be explored further, later in this series.
The analysis highlights the metabolic uniqueness of individuals and calls for the destandardisation of metabolic analysis and diagnostics, as we move toward personalised healthcare. The concept of calories in, vs calorie out, for weight management, may not be as straight forward as previously thought, and relies heavily on personalised metabolic capacity.
Advanced technology will assist in determining deficiency vs sufficiency of biological pathways, for better personalised healthcare.
Supplementary Materials
The following supporting information can be downloaded at the website of this paper posted on Preprints.org.
Funding
The author of this series declares that this research received no external funding. The Institute of Environment and Nutritional Epigenetics is intended for Australian public benefit and currently funded in its entirety by the author. It is important to emphasise that the authors contribution in no way undermines the objectivity, integrity or validity of the research findings and conclusions presented herein.
Acknowledgments
The author has reviewed and edited the output and take full responsibility for the content of this publication.
Conflicts of Interest
The author declares no conflicts of interest.
Abbreviations
The following abbreviations are used in this manuscript:
| ATP | Adenosine Triphosphate |
| CO | Carbon Monoxide |
| CO₂ (CO2) | Carbon Dioxide |
| O₂ (O2) | Oxygen |
| NO | Nitric Oxide |
| 1-CM | One-Carbon Metabolism |
| MAT | Methionine Adenosyltransferase |
| BMR | Basal Metabolic Rate |
| RQ | Respiratory Quotient |
| RER | Respiratory Exchange Ratio |
| VO₂ (VO2) | Volume of Oxygen Consumption |
| VCO₂ (VCO2) | Volume of Carbon Dioxide Production |
| TBG | Thyroxine Binding Globulin |
| T4 | Thyroxine |
| SERCA1 & 2 | Sarcoplasmic/Endoplasmic Reticulum Calcium ATPase 1 & 2 |
| BMI | Body Mass Index |
| FSANZ | Food Standards Australia New Zealand |
| CID | Compound Identifier (used by PubChem) |
References
- Mantzioris E, Villani A (2019) Translation of a Mediterranean-style diet into the Australian Dietary Guidelines: a nutritional ecological and environmental perspective. Nutrients, 2507. [CrossRef]
- Dietitian/Nutritionists from the Nutrition Education Materials Online “NEMO” team (Queensland Government) & (2021) Mediterranean-style diet, https://www.health.qld.gov. 23 May.
- The Royal Australian College of General Practitioners (2014) Mediterranean diet: reducing cardiovascular disease risk.
- Hess JM (2022) Modeling dairy-free vegetarian and vegan USDA food patterns for non-pregnant nonlactating adults. The Journal of Nutrition, 2097. [CrossRef]
- Morgan J (1979) The life and adventures of William Buckley.
- Hicks, C.S. (1963) ‘Climatic adaptation and drug habituation of the Central Australian Aborigine’, Perspectives in Biology and Medicine, 42, pp. 39–57.
- 1915.
- Simmons A (1796) American cookery or the art of dressing viands fish poultry and vegetables.
- Irwin D (1830) The housewife’s guide or an economical and domestic art of cookery.
- Glasse H (1747) The art of cookery made plain and easy.
- Editors at Nutrition Australia (2013) Nutrition Australia.
- /: at Food Standards Australia New Zealand (FSANZ) Australian Food Composition Database, https, 23 May.
- Sedley, L. (2023) Epigenetics. In: Dinan, T.G. (ed.) Nutritional Psychiatry: A Primer for Clinicians. Cambridge University Press, pp. 172–211.
- Fan, J. , Kamphorst, J.J. et al. (2014) ‘Glutamine-driven oxidative phosphorylation is a major ATP source in transformed mammalian cells in both normoxia and hypoxia’, Molecular Systems Biology, 9(1), p. 712.
- Alberti, K.G. (1977) ‘The biochemical consequences of hypoxia’, Journal of Clinical Pathology, s3-11(1), pp. 14–20.
- Pé Rez-Mato, I. , Castro, C. et al. (1999) ‘Methionine adenosyltransferase S-nitrosylation is regulated by the basic and acidic amino acids surrounding the target thiol’, Journal of Biological Chemistry, 274(24).
- Thomas, D.D. (2015) ‘Breathing new life into nitric oxide signaling; A brief overview of the interplay between oxygen and nitric oxide.’, Redox Biology, 5, pp. 225–233.
- Schwart L, Guais, A et al (2010) Carbon dioxide is largely responsible for the acute inflammatory effects of tobacco smoke. /: Inhal Toxicol 22(7): 543–551 https. [CrossRef]
- Kent, L.R. (1961) ‘Carbon dioxide therapy as a medical treatment for stuttering’, Journal of Speech Hearing Disorders, 26, pp. 268–271.
- LaVerne, A.A. (1973) ‘Carbon dioxide therapy (CDT) of addictions’, Behavioral Neuropsychiatry, 11–12(1–6), p. 13.
- E: L (2025) A Critical Analysis of Dietetics – Part 1, 2025.
- Kellogg, J.H. (1927) The New Dietetics; A guide to scientific feeding in Health and Disease, The Modern Medical Publishing Company.
- Wilson, B.C. (2014) Dr. John Harvey Kellogg and the Religion of Biologic Living. Indiana University Press.
- Kellogg, J.H. (1899) ‘Are we to be a toothless race?’, Dental Register, 53(3), pp. 135–144.
- Harris, J.A. , Benedict, F.G. (1919) A biometric study of basal metabolism in man. Alpha Editions.
- Roza, A.M. , Shizgal, H.M. (1984) ‘The Harris Benedict equation reevaluated; resting energy requirements and the body cell mass.’, American Journal of Clinical Nutrition, 40.
- Patel, H.K. (2023) ‘Physiology respiratory quotient’, StatPearls, StatPearls Publishing.
- Liebig, M. (1842) ‘The source of animal heat’, Provincial Medical and Surgical Journal, 4(103), pp. 488–489.
- Scholander, P.F. , Hammel, H.T. et al. (1958) ‘Cold adaptation in Australian Aborigines’, The Journal of Physiology, 12, pp. 212–216.
- Flowers, P. , Theopold, K. et al. (2019) Gas laws for ideal gases. Chemistry 2e, /: at: https.
- White, G.H. , Morice, R. (1980) ‘Diagnostic biochemical tests in Aboriginals’, Medical Journal of Australia, 1(SP1), pp. 6–8.
- Takeda, K. , Mori, Y. et al. (1989) ‘Sequence of the variant thyroxine-binding globulin of Australian Aborigines.’, Journal of Clinical Investigation, 83(4), pp. 1344–1348.
- Qi, X. , Chan, W.L. et al. (2014) ‘Temperature-responsive release of thyroxine and its environmental adaptation in Australians.’, Proceedings of the Royal Society B, 281(1779).
- Simonides, W.S. , Thelen, M.H.M. (2001) ‘Mechanism of thyroid-hormone regulated expression of the SERCA Genes in skeletal muscle: implications for thermogenesis.’, American Journal of Physiology, cited in text.
- Ulivieri, A. , Lavra, L. et al. (2022) ‘Thyroid hormones regulate cardiac repolarization and QT-interval related gene expression in hiPSC cardiomyocytes.’, Scientific Reports, 12(1).
- Rasmussen, M.; et al. (2011) ‘An Aboriginal Australian genome reveals separate human dispersals into Asia.’, Science, 334, pp. 94–98.
- Hancock, G. (2022) Ancient Apocalypse. Netflix.
- Alley, R.B. (2004) ‘The Roger Revelle Commemorative Lecture Series—Abrupt climate changes: Oceans, ice, and us, Oceanography, 17(4), pp. 194–206.
- a: Kanazawa (2007) Big and tall soldiers are more likely to survive battle, 2007; 22. [CrossRef]
- Bouttes, N.; et al. (2011) ‘Last Glacial Maximum CO₂ and δ¹³C successfully reconciled.’, Geophysical Research Letters, 38(L02705).
- Judd, E.J.; et al. (2024) ‘A 485-million-year history of Earth's temperature’, Science, 385(6650), pp. 1316–1320.
- Gerhart, L.M. , Ward, J.K. (2010) ‘Plant responses to low [CO₂] of the past. ’, New Phytologist, 188(3), pp. 674–695.
- Akiel, R. (2025) ’Molar Mass of Dietary Elements’, In Chem 201: General Chemistry I OER. College of the Canyons. LibreTexts. https://chem.libretexts.
- Pant, R. , Firmal, P. et al. (2021) ‘Epigenetic regulation of adipogenesis in development of metabolic syndrome.’, Frontiers in Cell and Developmental Biology, 8.
- Jéquier, E. (1994) ‘Carbohydrates as a source of energy’, American Journal of Clinical Nutrition, 59(3), pp. 682S–685S.
- Fernández-Elías, V.E. , Ortega, J.F. et al. (2015) ‘Relationship between muscle water and glycogen recovery after prolonged exercise in the heat in humans’, European Journal of Applied Physiology, 115, pp. 1919–1926.
- Ceperuelo-Mallafré, V. , Ejarque, M. et al. (2016) ‘Adipose tissue glycogen accumulation is associated with obesity-linked inflammation in humans’, Molecular Metabolism, 5(1), pp. 5–18.
- Tafeit, E.; et al. (2019) ‘Using body mass index ignores the intensive training of elite special force personnel.’, Experimental Biology and Medicine, 244(11), pp. 873–879.
- Moon, J. , Koh, G. (2020) ‘Clinical Evidence and Mechanisms of High-Protein Diet-Induced Weight Loss, Journal of Obesity & Metabolic Syndrome, 29, pp. 166–173.
- National Center for Biotechnology Information (2025) PubChem Compound Summary for CID 985, Palmitic Acid. Available at: https://pubchem.ncbi.nlm.nih.
- Listrat, A. , Lebret, B. et al. (2016) ‘How muscle structure and composition influence meat and flesh quality’, Scientific World Journal. [CrossRef]
- Meznaric, M. , Cvetko, E. (2016) ‘Size and proportions of slow-twitch and fast-twitch muscle fibers in human costal diaphragm, BioMed Research International, 2016, Article ID 5946520.
- Sanitarium Health Food Company (2023) Weet-Bix Original. Available at: https://www.sanitarium.
- McDonald's Australia (2023) Main food menu – Allergen, ingredients and nutrition info. Available at: https://mcdonalds.com.
- Hungry Jack's (2025) Chicken. Available at: https://www.hungryjacks.com.
- Aldi (2025) Chicken Schnitzel. Available at: https://www.aldi.com.
- Burke LM, Whitfield J, Heikura IA, Ross MLR, Tee N, Forbes SF, Hall R, McKay AKA, Wallett AM, Sharma AP (2020) ‘Adaptation to a low carbohydrate high fat diet is rapid but impairs endurance exercise metabolism and performance despite enhanced glycogen availability’. The Journal of Physiology.
Figure 1.
Comparative estimation of elemental ratios of the Mediterranean, English-American, Carnivorous, and plant-based 3000 calorie diet. Calculated by elemental mass as per supplementary data (Tables S1 and S2) [21].
Figure 1.
Comparative estimation of elemental ratios of the Mediterranean, English-American, Carnivorous, and plant-based 3000 calorie diet. Calculated by elemental mass as per supplementary data (Tables S1 and S2) [21].
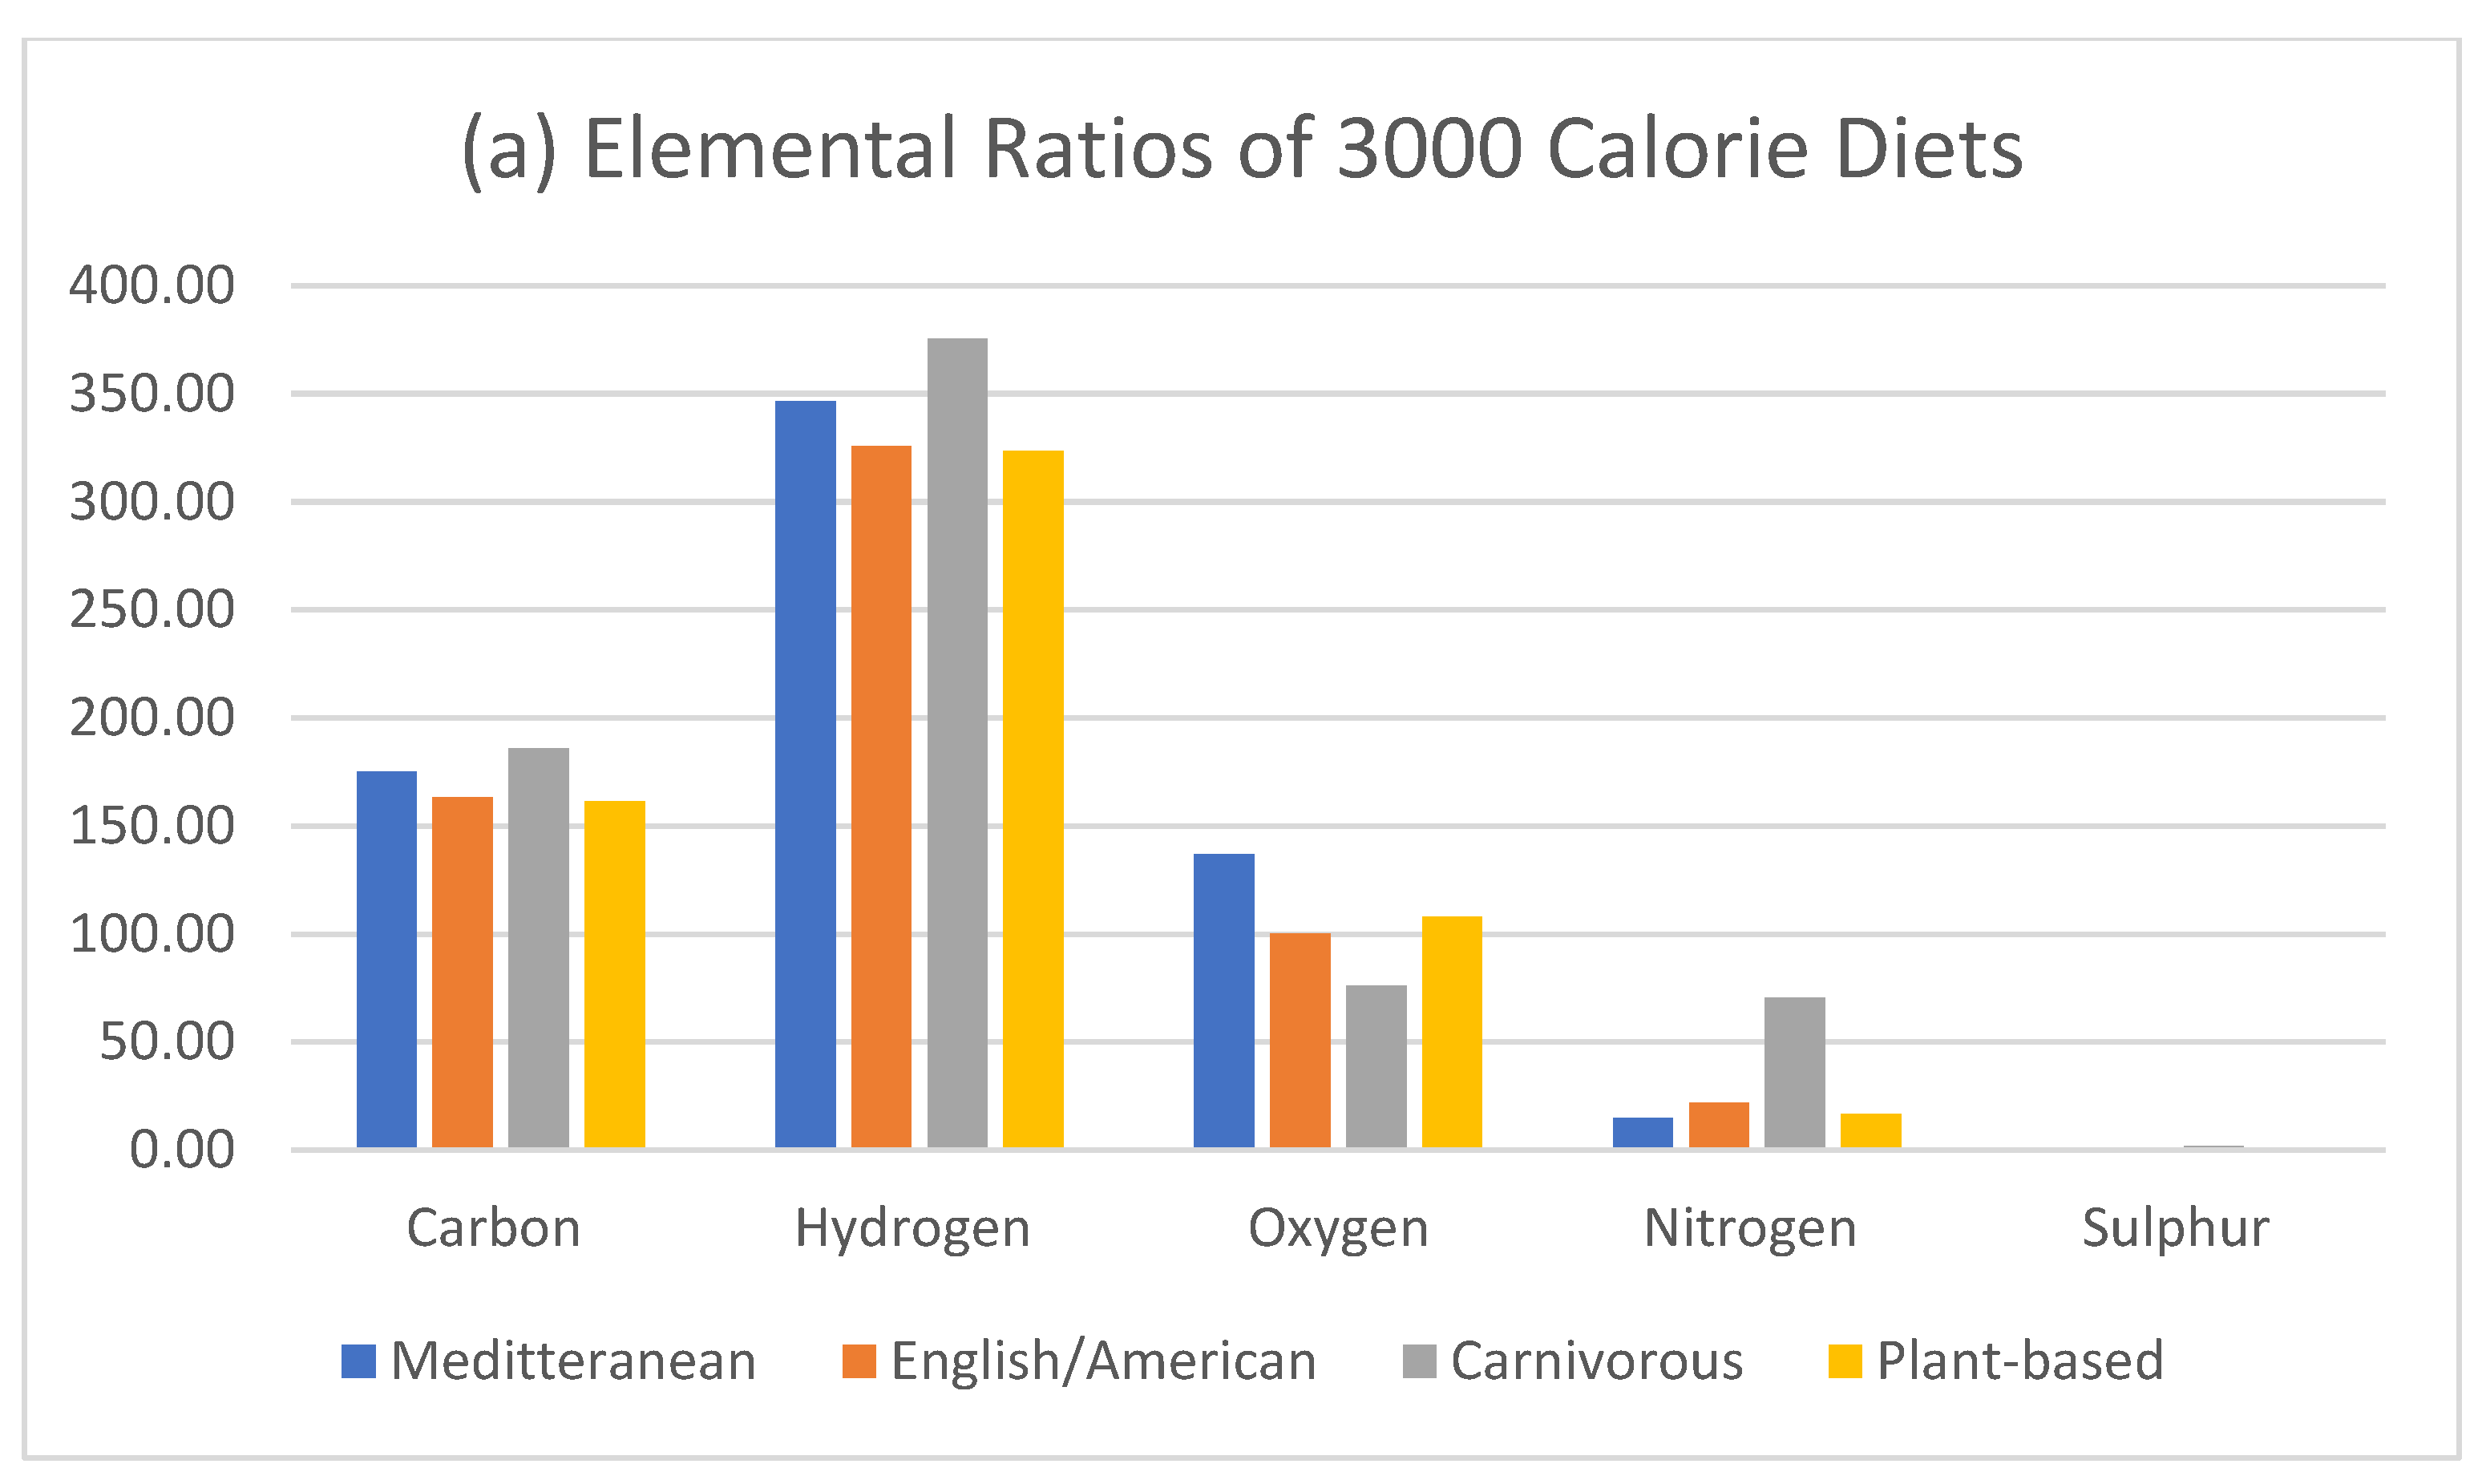
Figure 2.
Molar mass of elements [43].
Figure 2.
Molar mass of elements [43].
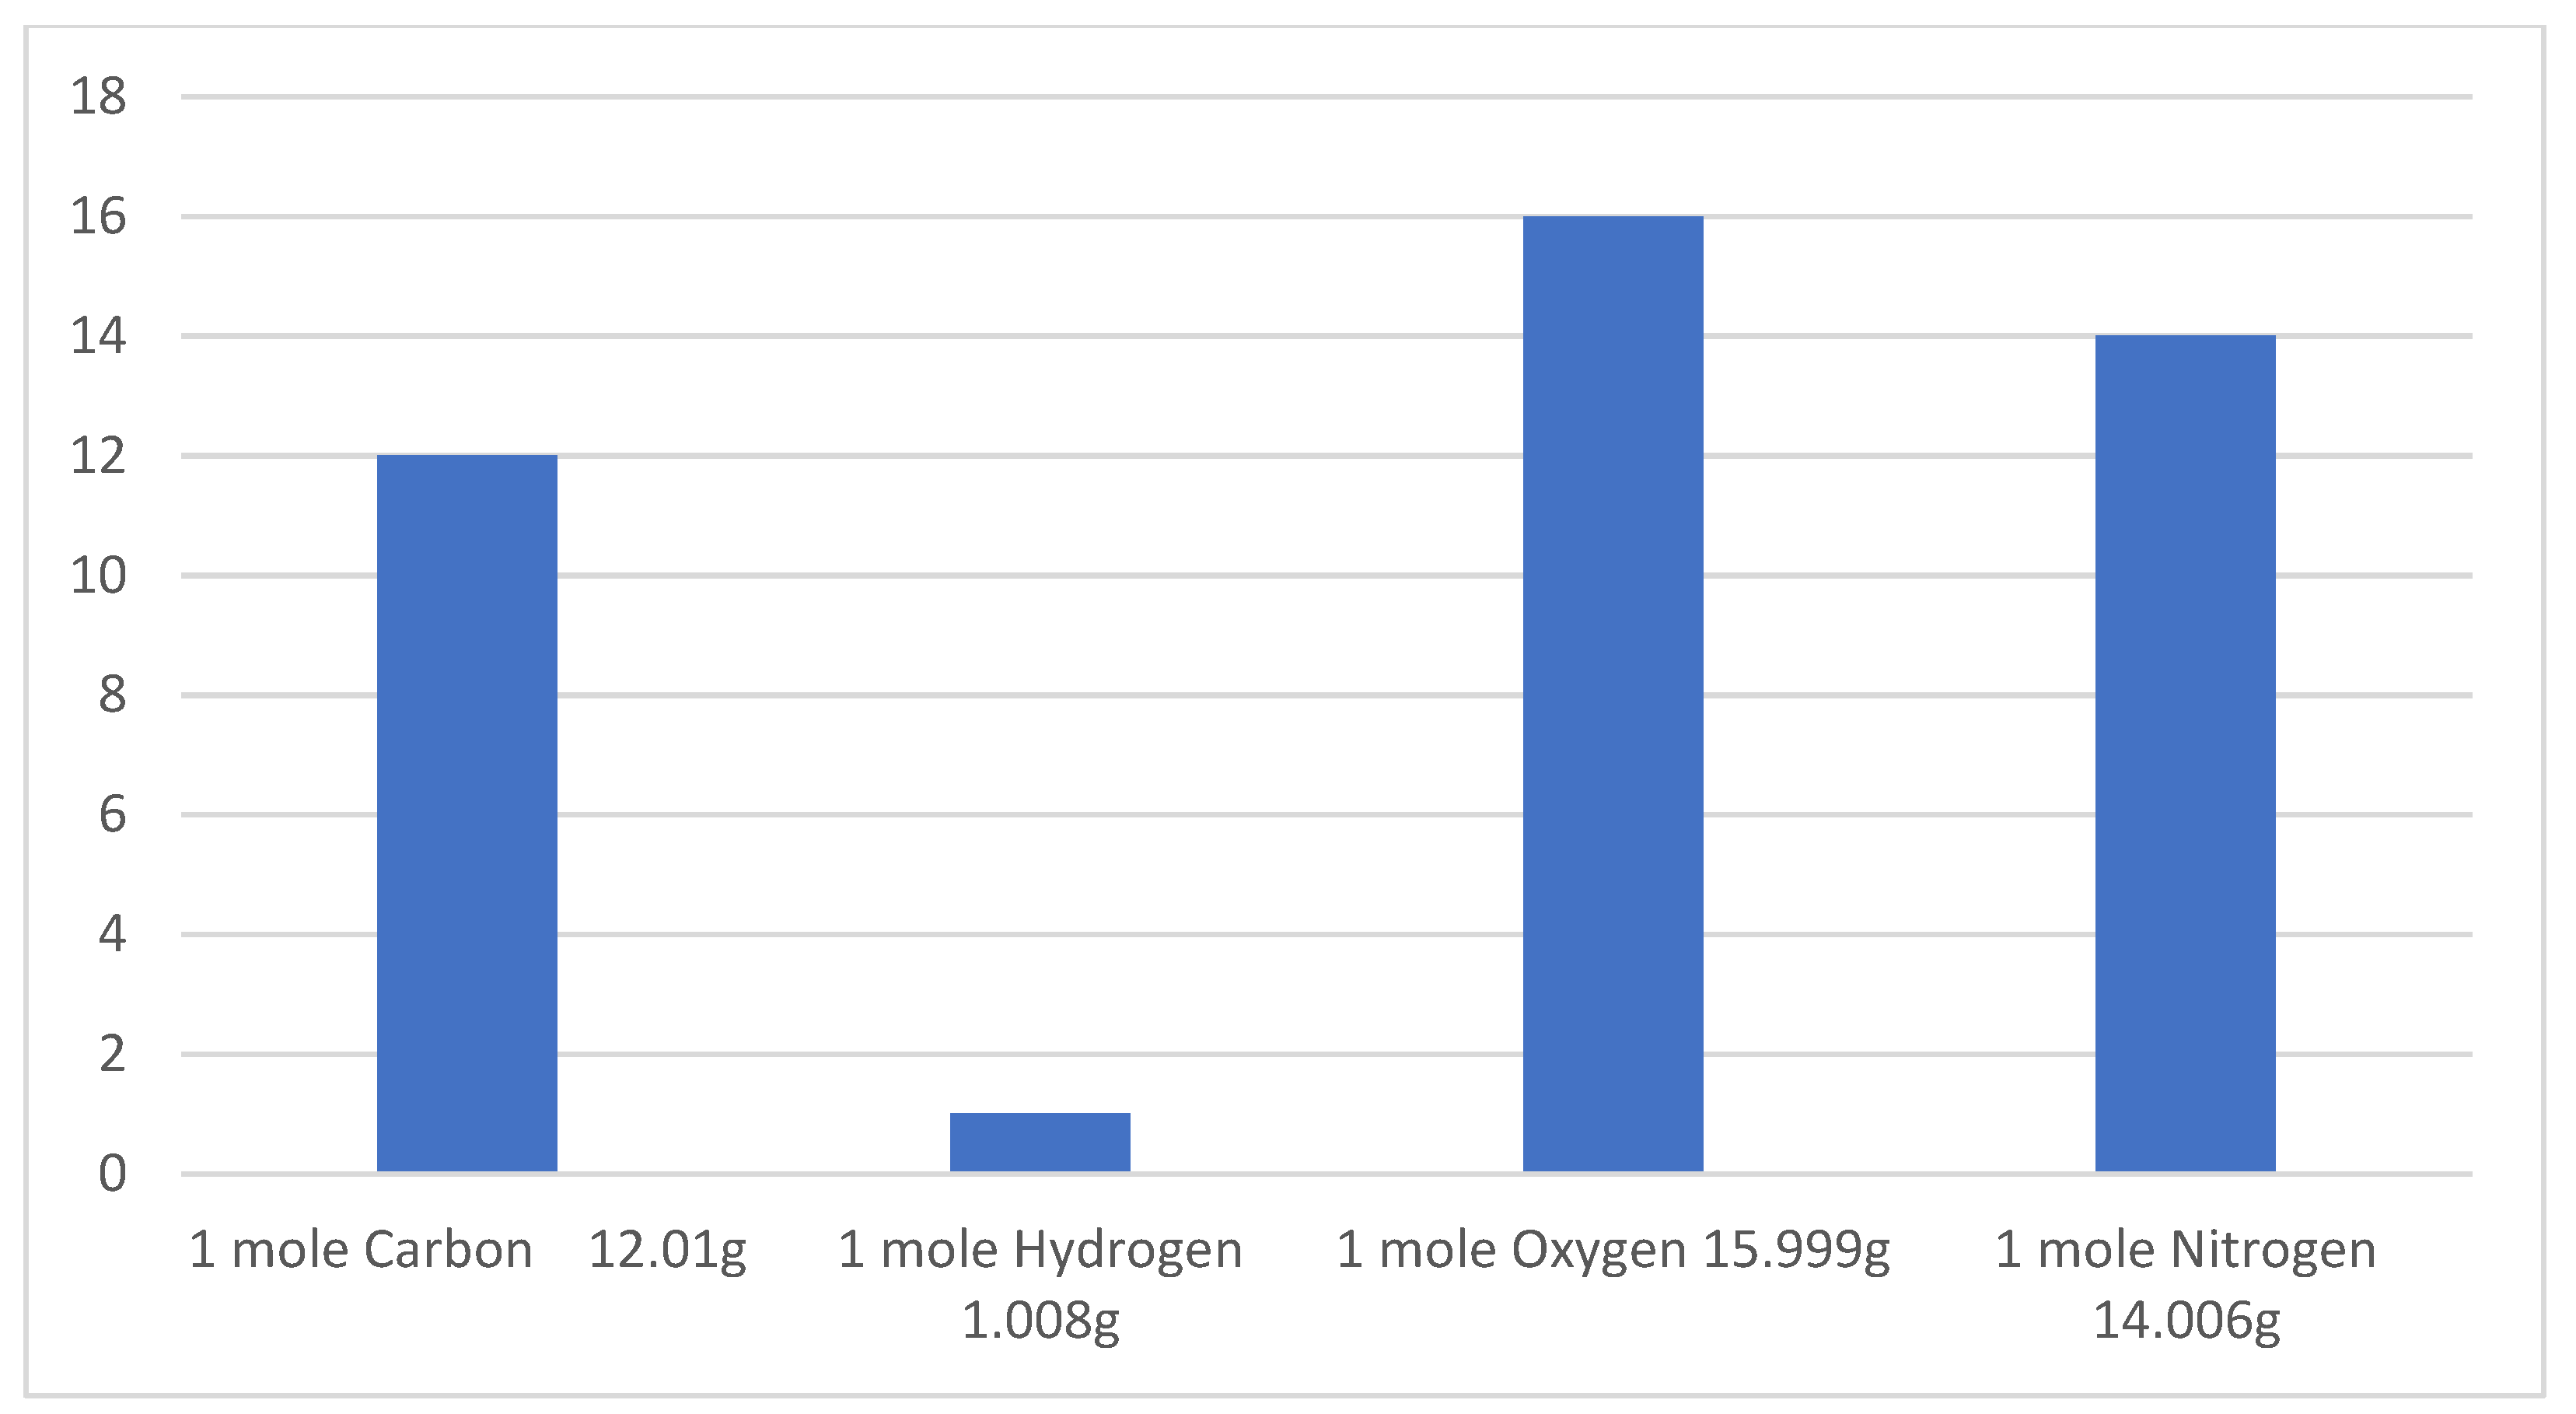
Figure 3.
Glucose elemental ratio vs mass.
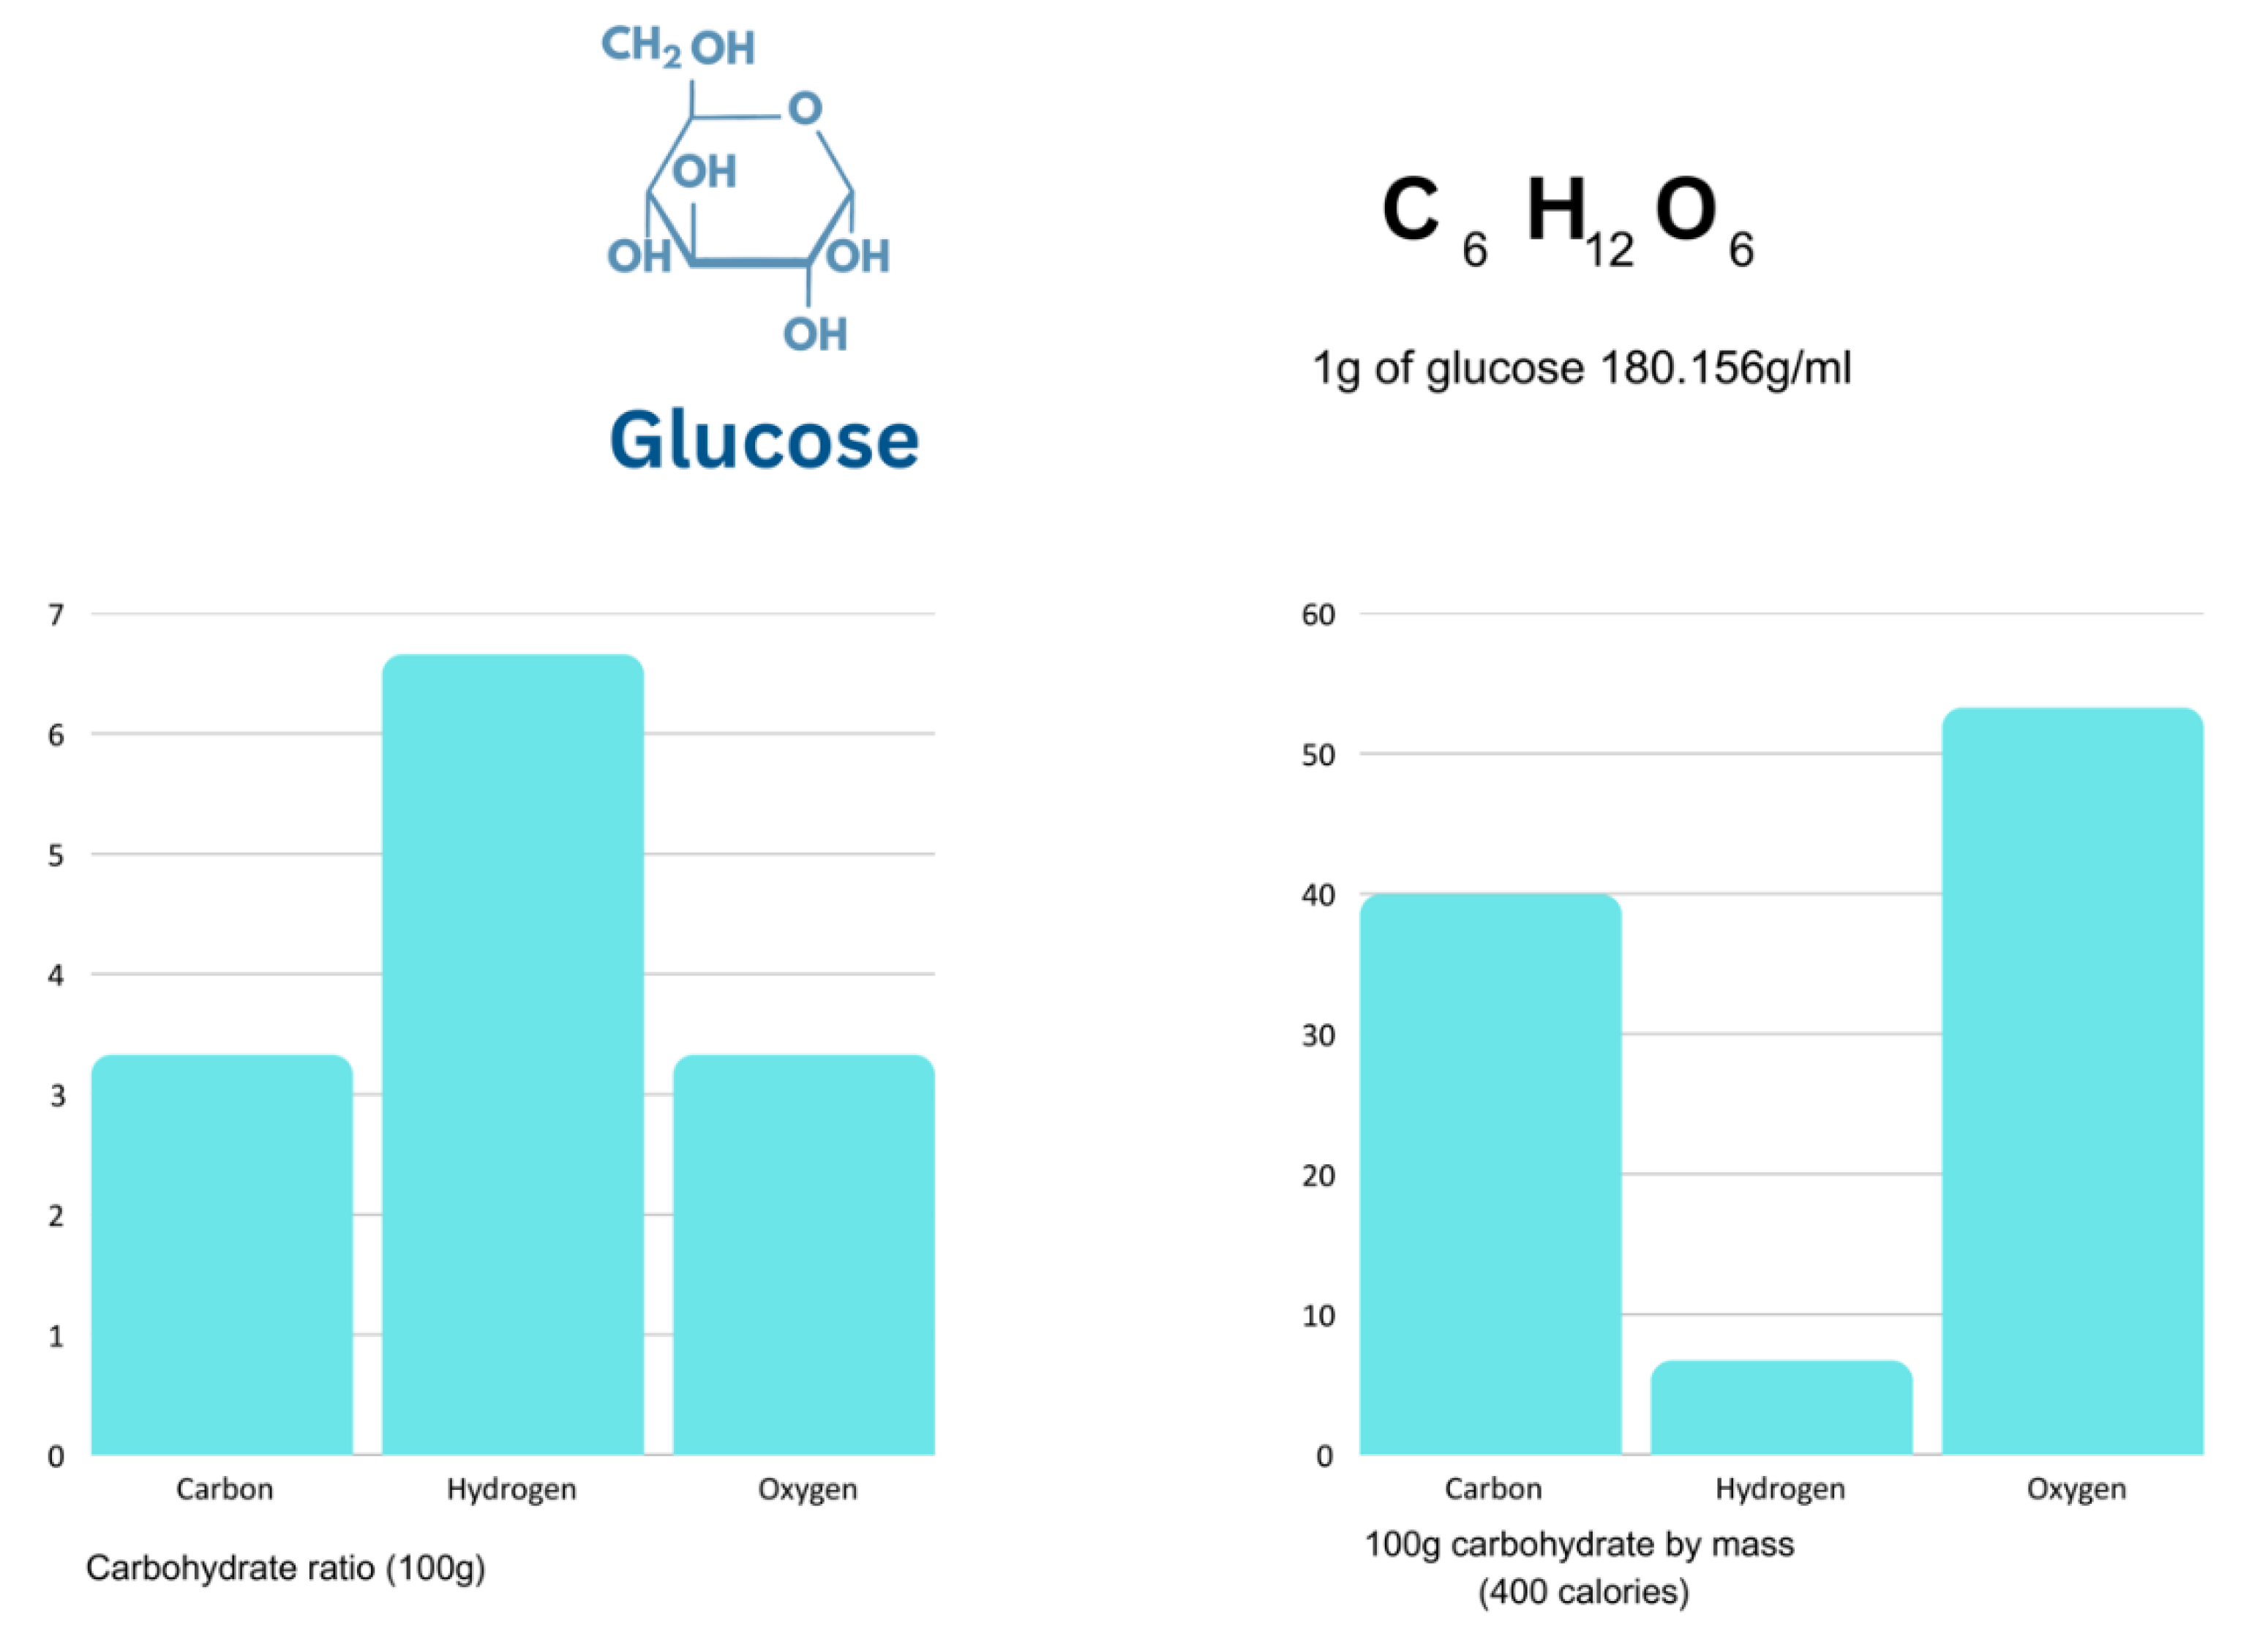
Figure 4.
Serine elemental ratio vs mass.
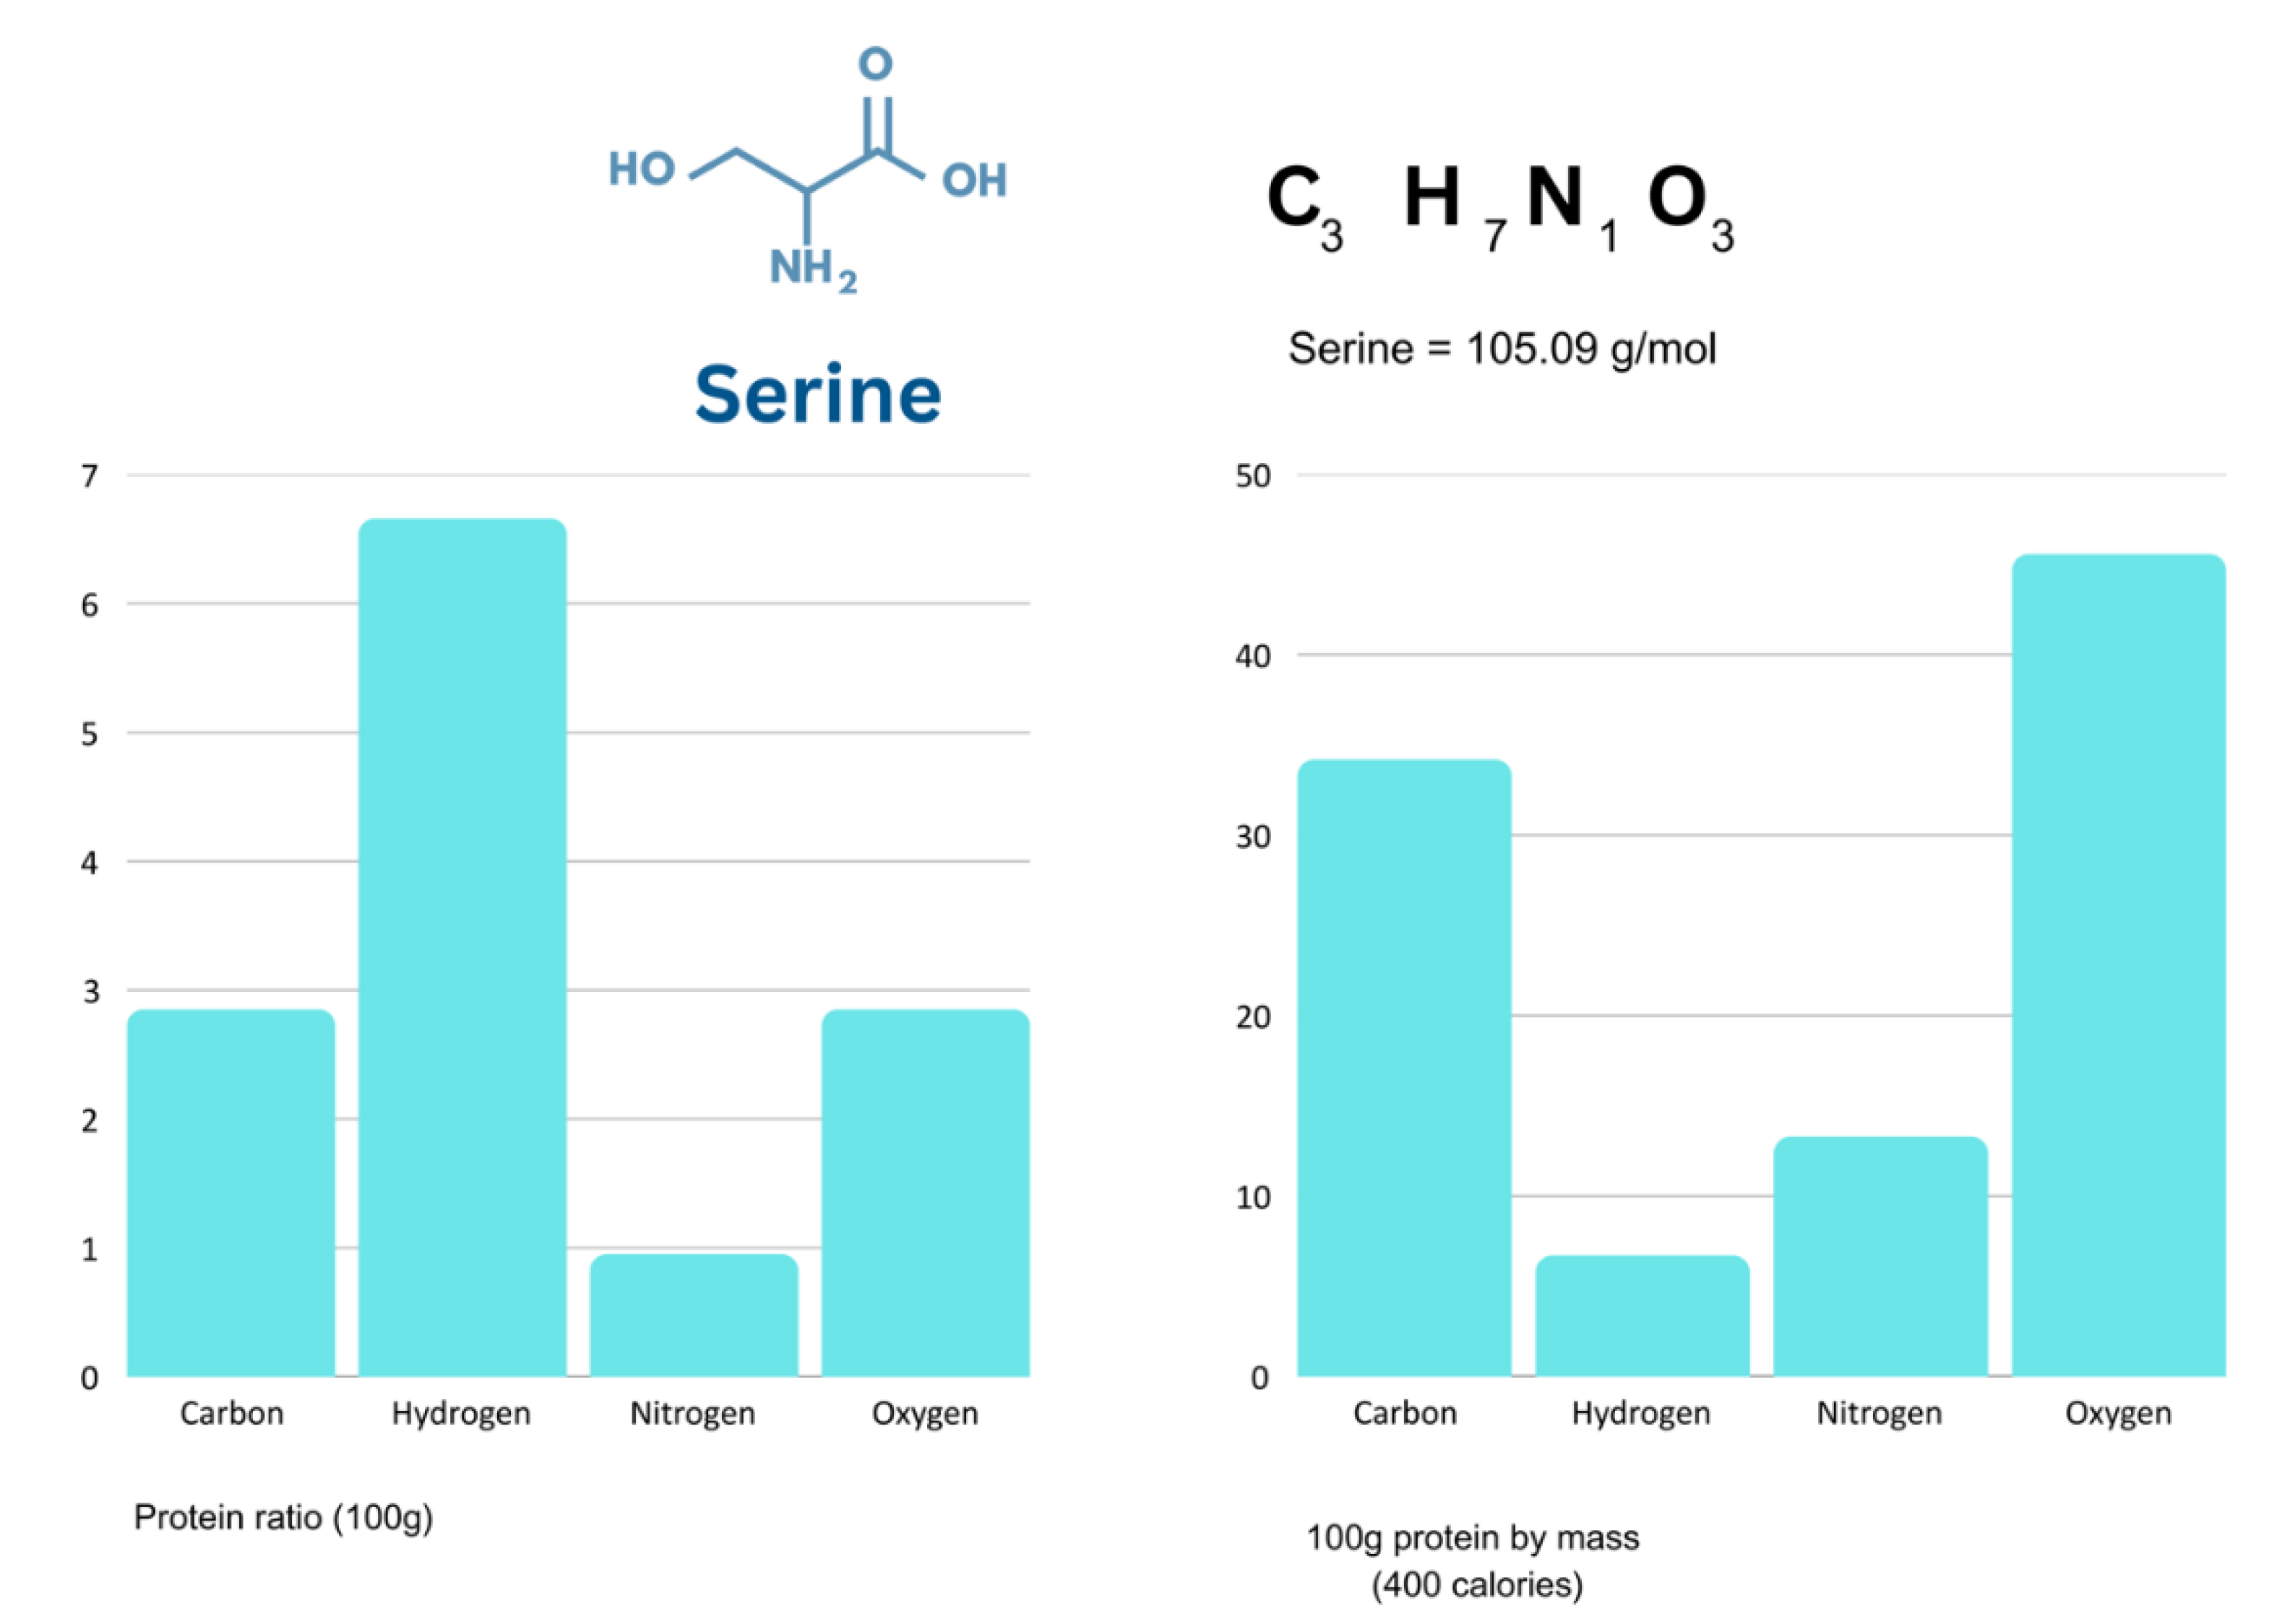
Figure 5.
Palmitic Acid elemental ratio vs mass.
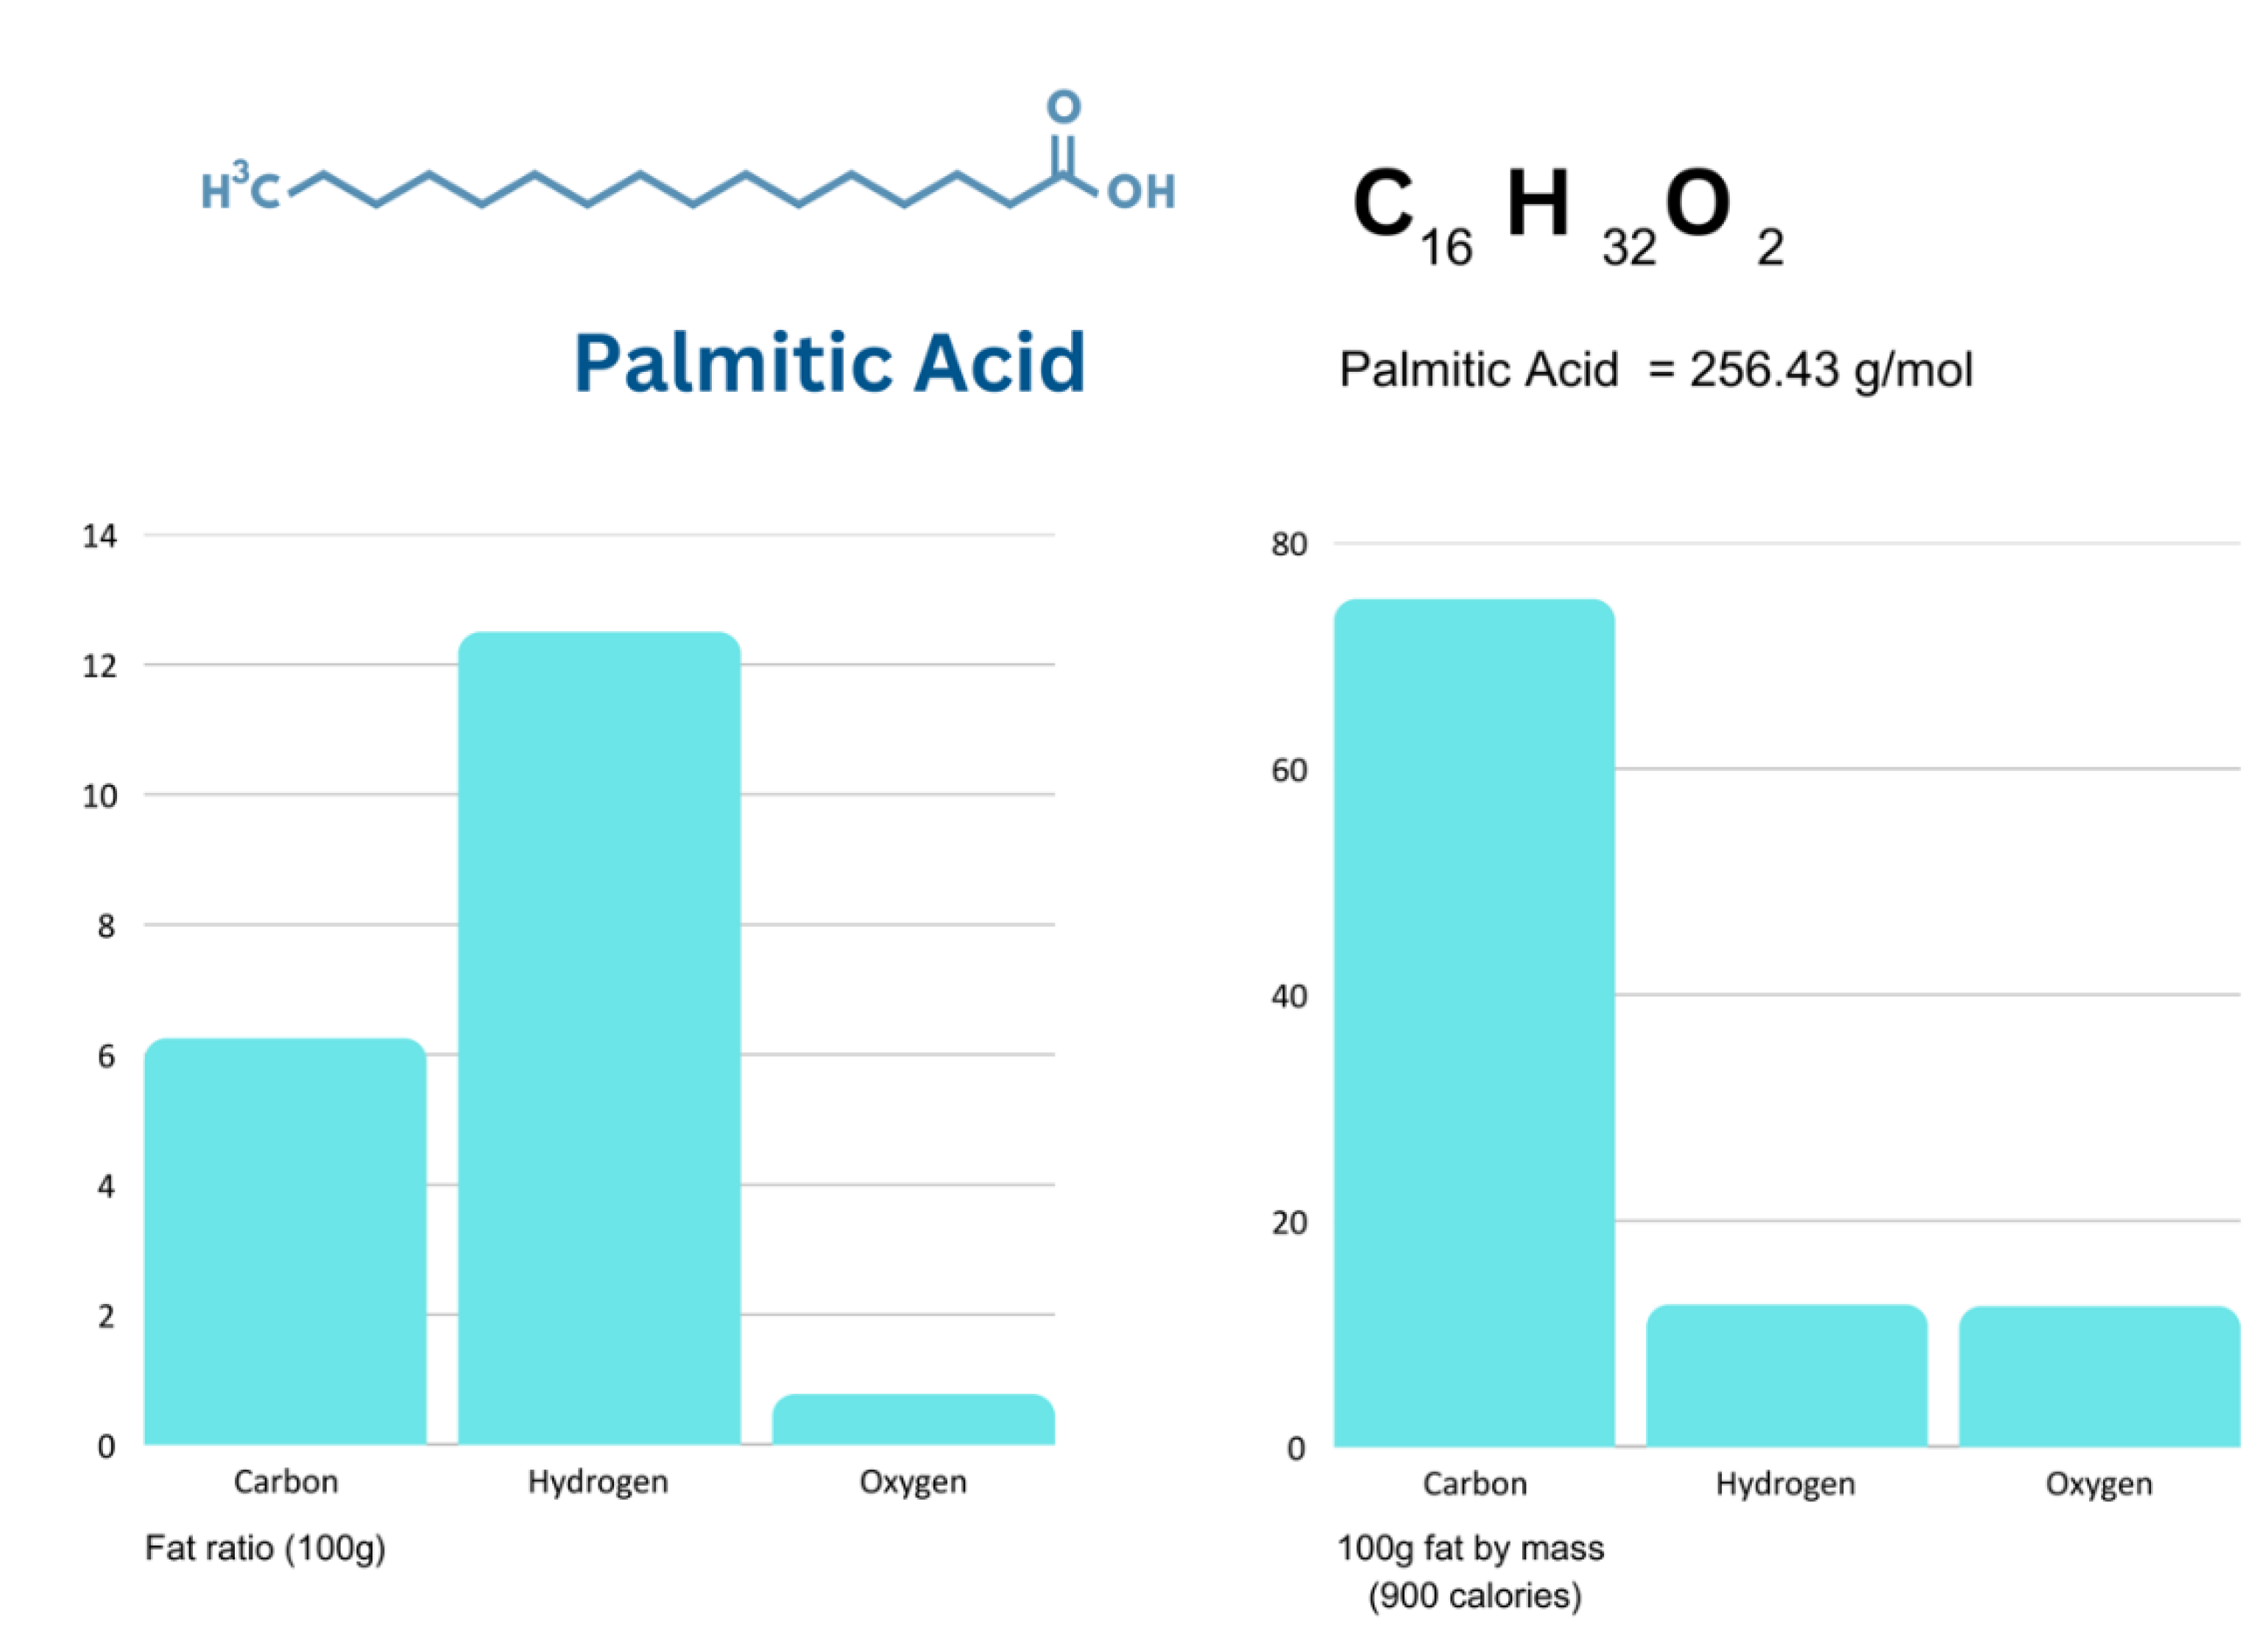
Figure 6.
Total mass of 3000 calorie diets extracted from supplementary data.
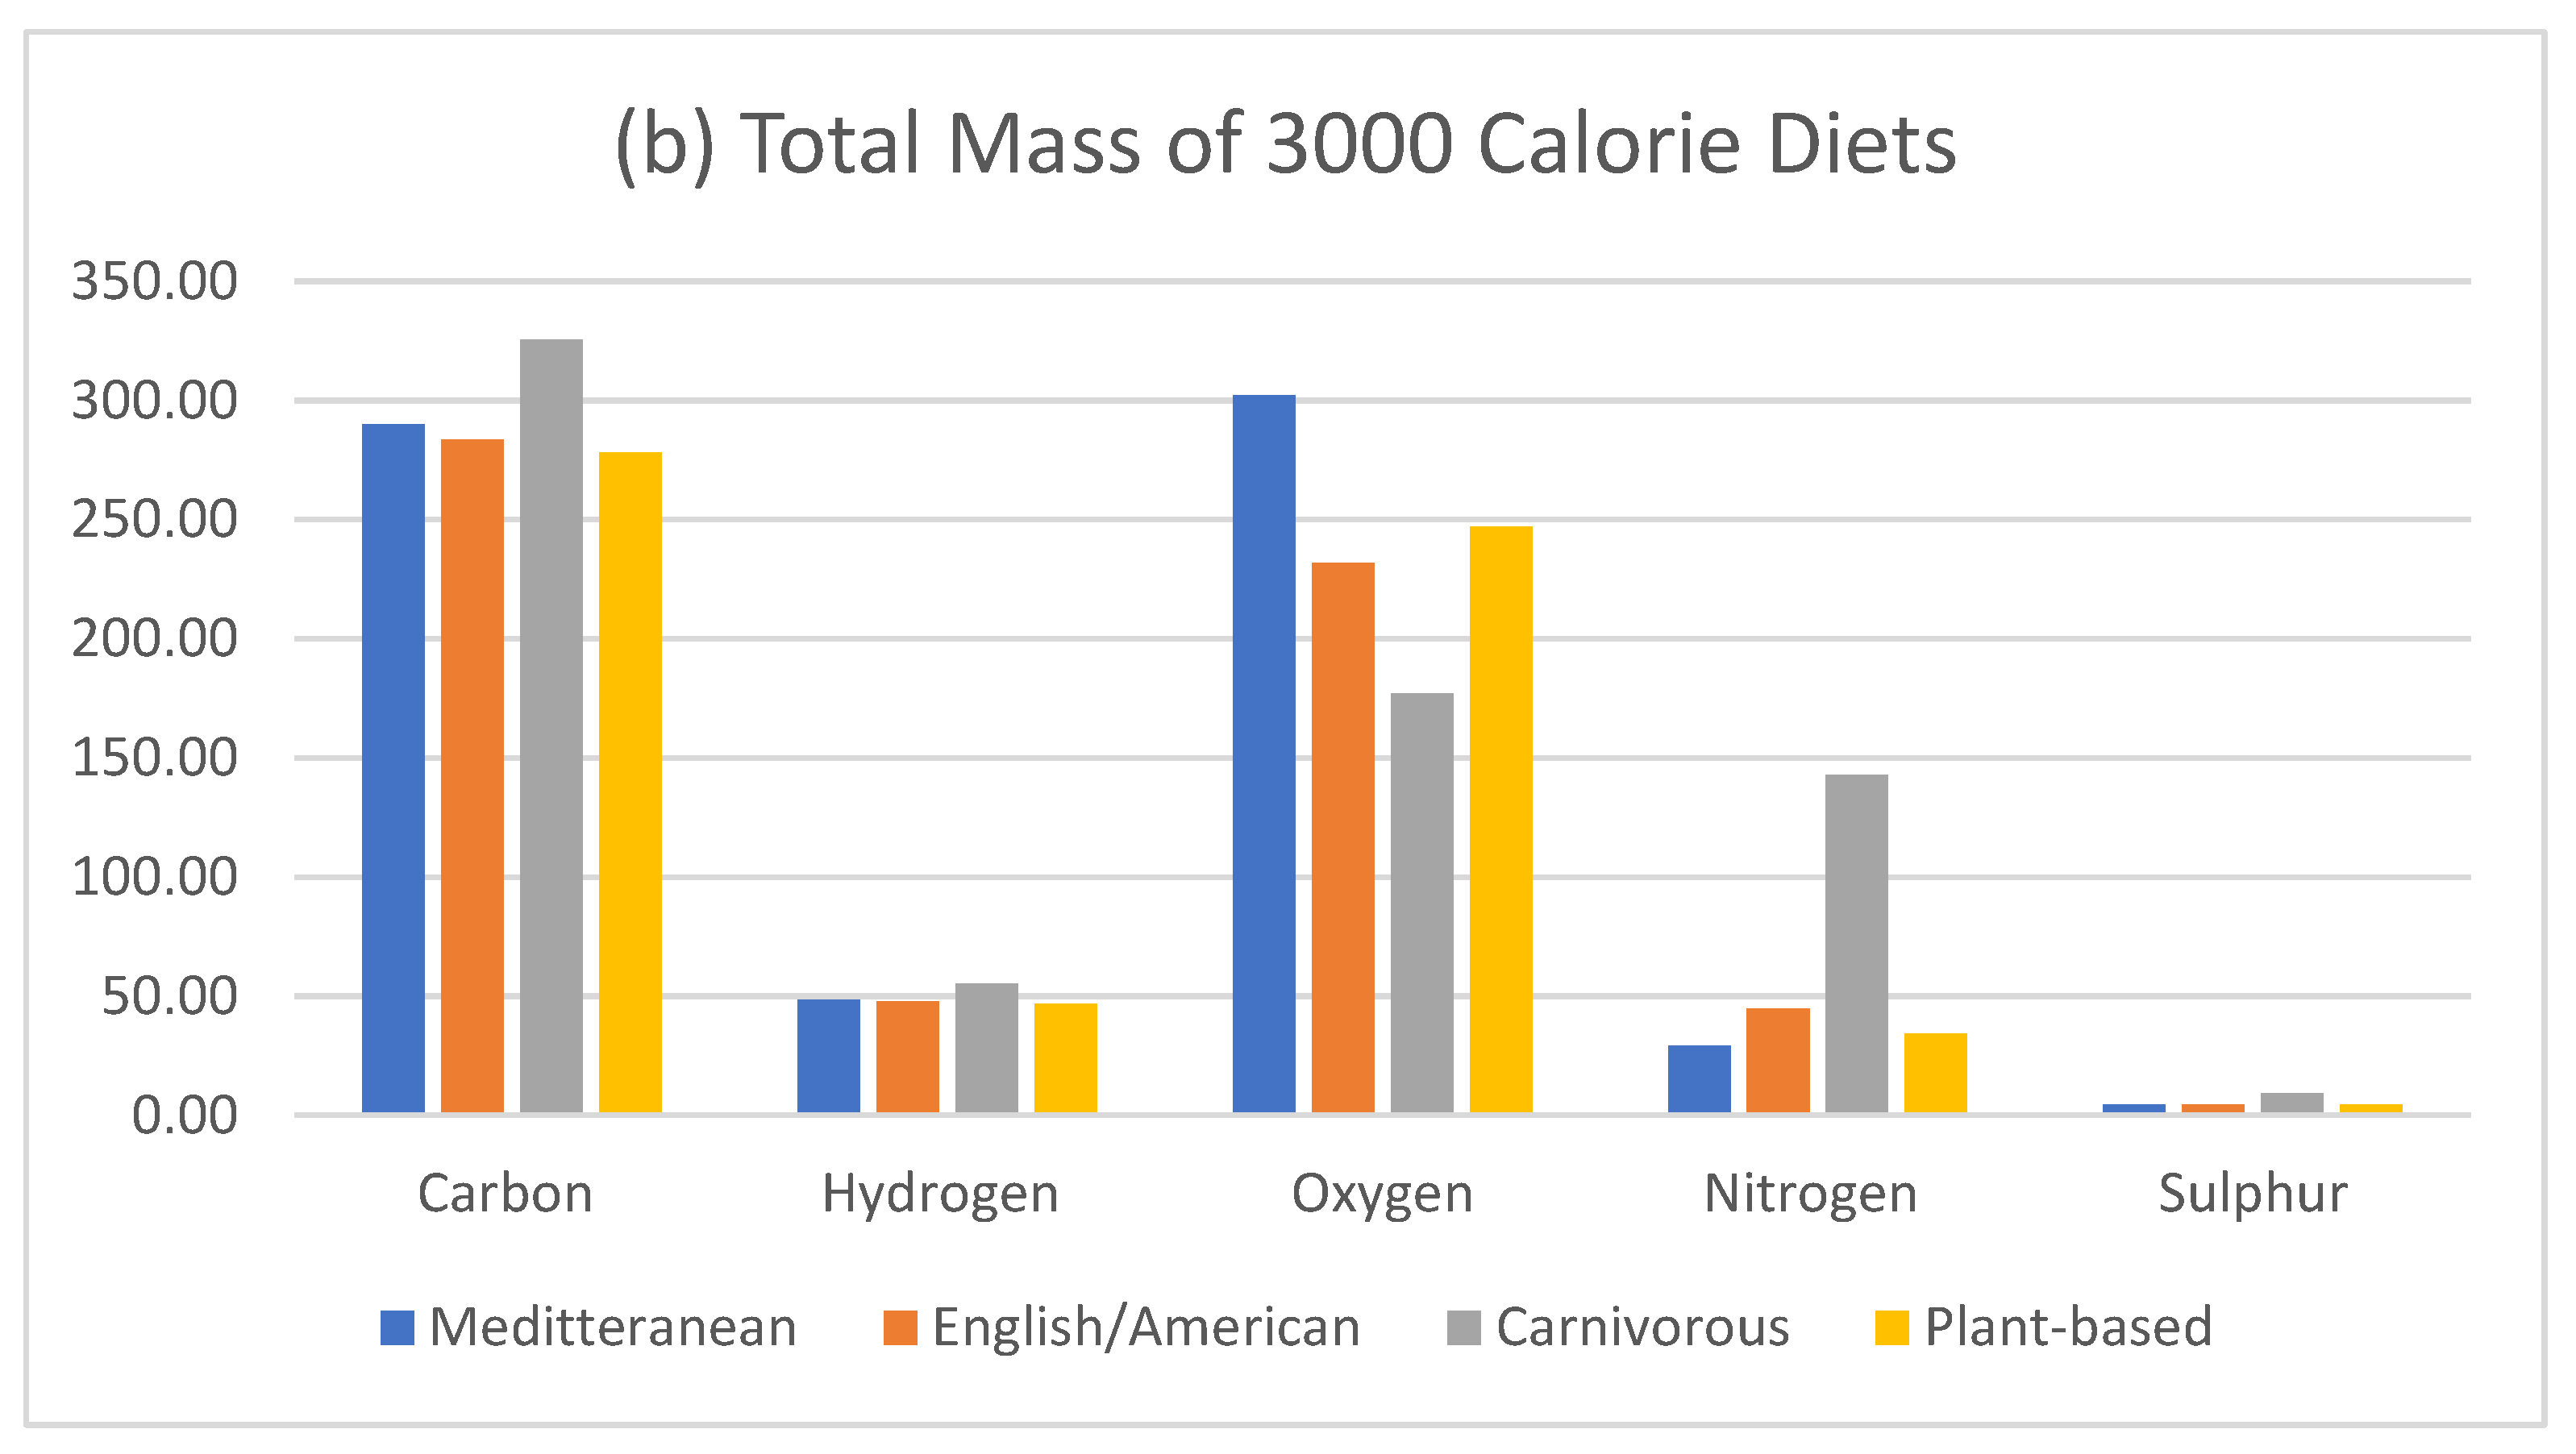
Figure 7.
Elemental mass of only the protein component in 3000 calorie diets.
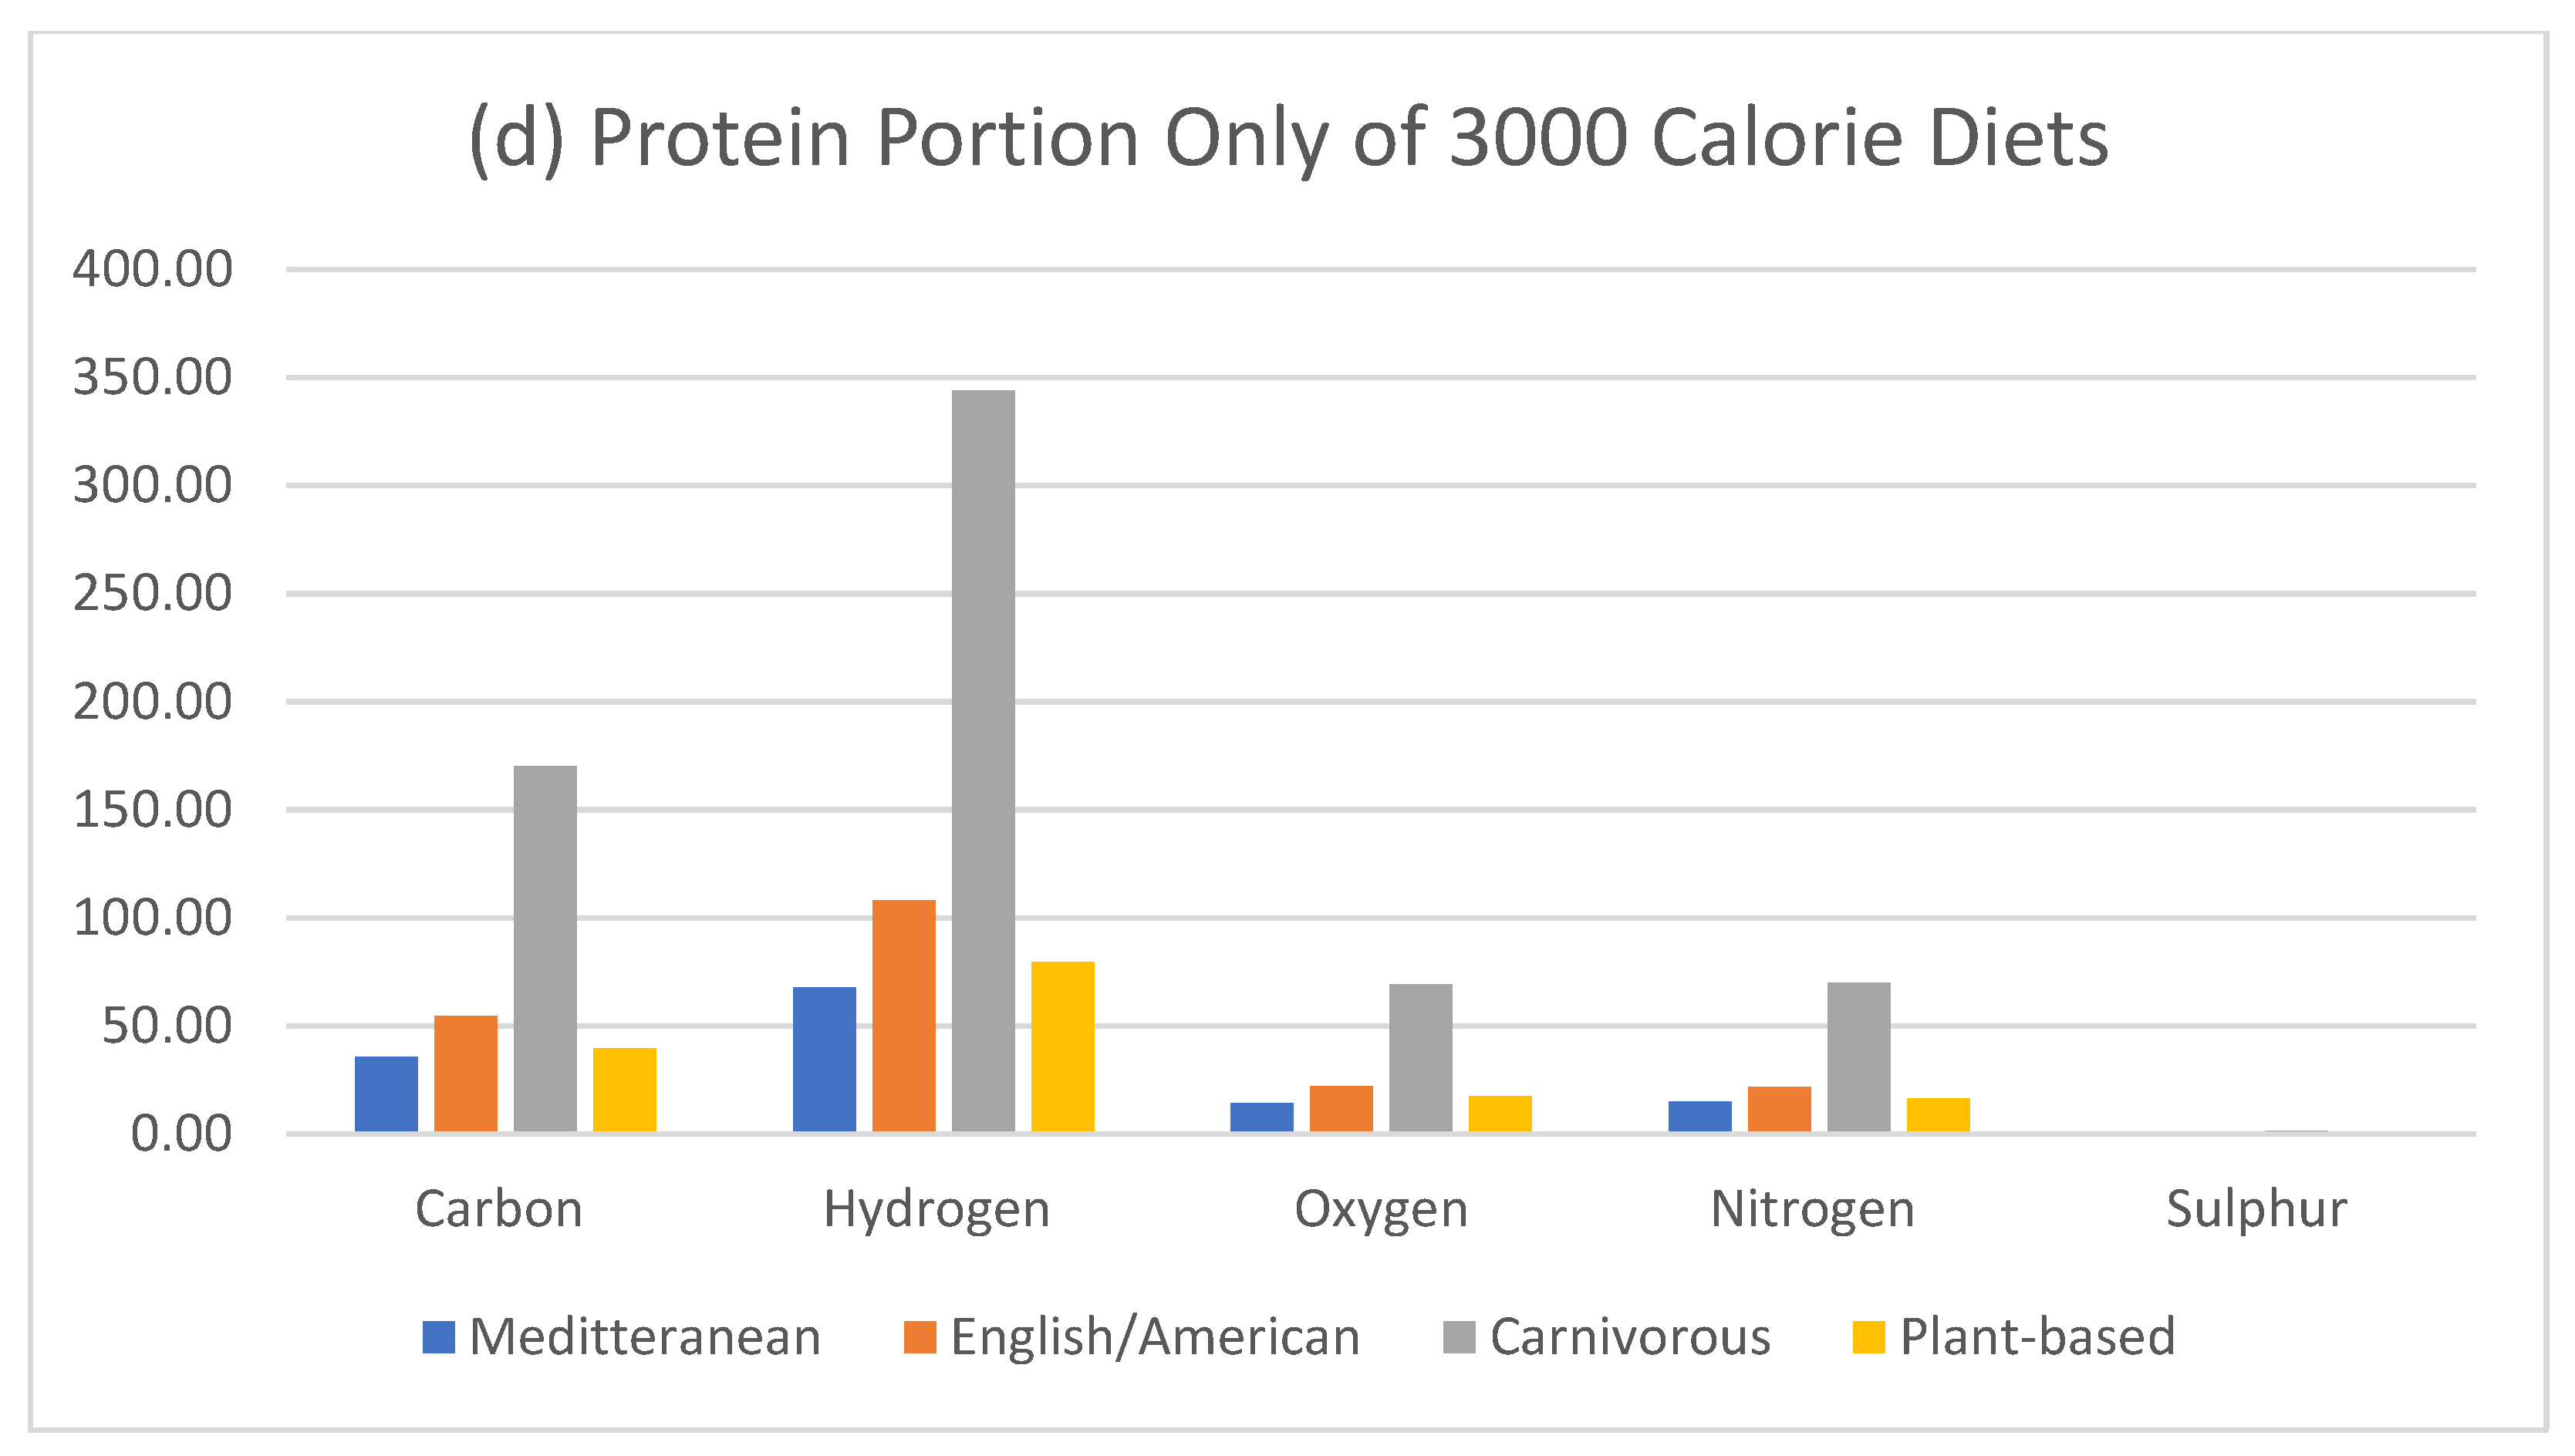
Figure 8.
Mass adjusted for unidentified mass aligned with dietary composition data, calculated as H2O.
Figure 8.
Mass adjusted for unidentified mass aligned with dietary composition data, calculated as H2O.
Disclaimer/Publisher’s Note: The statements, opinions and data contained in all publications are solely those of the individual author(s) and contributor(s) and not of MDPI and/or the editor(s). MDPI and/or the editor(s) disclaim responsibility for any injury to people or property resulting from any ideas, methods, instructions or products referred to in the content. |
© 2025 by the authors. Licensee MDPI, Basel, Switzerland. This article is an open access article distributed under the terms and conditions of the Creative Commons Attribution (CC BY) license (http://creativecommons.org/licenses/by/4.0/).
Copyright: This open access article is published under a Creative Commons CC BY 4.0 license, which permit the free download, distribution, and reuse, provided that the author and preprint are cited in any reuse.


