Submitted:
04 April 2025
Posted:
08 April 2025
You are already at the latest version
Abstract
To elucidate the biochemical mechanisms underlying Rlm1-mediated blackleg resistance, we performed a metabolomic analysis comparing a susceptible DH line of Topas and its isogenic Rlm1-carrying resistant counterpart. Our results revealed significant differences in metabolite profiles post-inoculation. Rlm1-mediated resistance was characterized by early and sustained upregulation of lysine degradation metabolites, particularly pipecolic acid (PA), which increased up to 326-fold, highlighting its role in resistance. Salicylic acid (SA) and its derivative gentisic acid (GA) were also elevated, suggesting a coordinated hormonal defense response. Increased accumulation of glucosinolates (GLS) and γ-aminobutyric acid (GABA) likely contributed to antimicrobial defense and cell wall reinforcement. Additionally, activation of tryptophan metabolism and melatonin biosynthesis, indicated by elevated N-acetylserotonin and 5-methoxytryptamine, suggests their involvement in the defense responses. Conversely, resistant plants exhibited reduced accumulation of flavonoid and phenylpropanoid metabolites, potentially reflecting a strategic reallocation of metabolic resources. Exogenous application of PA, SA, GA and ferulic acid significantly reduced lesion sizes in susceptible canola lines, confirming their roles in defense. Moreover, treatment with piperonylic acid, a phenylpropanoid pathway inhibitor, also reduced infection, supporting the notion of metabolic shift in resistant plants. These findings provide new insights into Rlm1-mediated resistance mechanisms, complementing our prior transcriptome study of Rlm1 resistance and highlighting the role of lysine degradation, PA and SA signaling. Understanding these metabolic shifts may improve breeding strategies to enhance durable blackleg resistance in canola.
Keywords:
Canola
; Topas
; blackleg
; resistance
; Rlm1
; metabolomics
Introduction
Blackleg, caused by Leptosphaeria maculans (Lm) Ces. and de Not., continues to be a concern for canola/rapeseed (Brassica napus L.) production in Canada and many other regions in the world [1]. Genetic resistance, in combination with extended crop rotation, is the key strategy for blackleg management in Canada where many canola cultivars carry the specific resistance (R) genes Rlm1/LepR3 and Rlm3 [2] while almost all cultivars also possess a level of quantitative resistance [3,4]. As more R genes are being deployed in new cultivars that target prevalent avirulence (Avr) genes in the pathogen population [5-7], resistance resilience ought to be monitored because of frequent sexual recombination of L. maculans and high evolutionary potential of the pathogen [8,9]. The R gene Rlm1, for example, was broken only a few years after its release in France, with a significant decline in the corresponding AvrLm1 from 83% to <13% in the pathogen population [8]. In western Canada, it was unclear when Rlm1 or LepR3 was introduced but AvrLm1 has been generally low (<15%) over the past decade [5, 6]. To date, a total of 22 specific R genes have been reported for blackleg resistance and five of them have been cloned (reviewed by Borhan, Van de Wouw [10]). The effective deployment of R genes depends mostly on the Avr profile of L. maculans population, but a better understanding of the resistance mode of action associated with specific R genes can improve our knowledge of host-pathogen interactions in relation to resistance deployment and resilience.
Advances in next-generation sequencing (NGS) and other “omics” technologies have enabled the identification of several putative genes involved in disease resistance in canola, along with insights into their potential modes of action [11,12]. For example, transcriptomic analyses have revealed that jasmonate/ethylene signaling or metabolism, as well as callose deposition, are the primary modes of action associated with clubroot resistance mediated by Rcr1 [11]. Further proteomic work highlighted that the perception of infection and subsequent activation of defense responses are triggered by a unique signaling pathway involving a cascade of mitogen-activated protein kinases influenced by proteasome ubiquitin-26S [12]. These omics tools helped better understand the molecular mechanisms of clubroot resistance associated with Rcr1. However, such information has not been reported for blackleg resistance associated with any specific R genes, especially for important pathways and metabolites induced during ‘gene-for-gene’ interactions between L. maculans and B. napus. In an earlier report, Fudal, Ross [13] described that L. maculans appeared to delete AvrLm1 to regain the virulence towards the R gene Rlm1 worldwide. Based on genome-wide transcriptome study, Zhai et al. (2021) showed that Rlm1-based blackleg resistance is non-systemic and involves the activation of salicylic acid (SA) and jasmonic acid (JA) pathways [14]. These results provide insights into Rlm1 resistance, as well as its breakdown in response to pathogen population changes. Further metabolomic analysis may reveal critical metabolites and associated pathways induced by Rlm1 that carry direct impact on blackleg infection and disease development.
During co-evolution, many plants have developed resistance to diseases, which often can be triggered by pathogen-associated molecular patterns (PAMPs) and effectors [15]. These mechanisms rely on pattern recognition receptors (PRRs)/nucleotide-binding leucine-rich repeat (NB-LRR) receptors (NLRs), activating PAMP- or effector-triggered immunity (PTI, ETI) [16,17]. As part of their defense responses, plants can produce a range of low molecular-weight compounds [18], many of which are secondary metabolites [19]. These secondary metabolites can be broadly classified into three main groups: flavonoids (Flav) and phenolics, alkaloids and sulfur-containing compounds, and terpenoids [20]. Although not essential for plant growth [19,21], some secondary metabolites play key roles in plant resistance against pathogens [22,23], which can be explored with metabolomics. Understanding their roles in blackleg resistance can advance the knowledge of canola-pathogen interactions, uncover novel plant-defense compounds, and support disease resistance breeding by targeting key metabolites or their associated genes via genome editing.
Metabolomics commonly employs high-performance liquid chromatography (HPLC), ultra-performance liquid chromatography (UPLC), gas chromatography (GC) and nuclear magnetic resonance (NMR), often coupled with mass spectrometry (MS) [24]. Although LC-MS provides sensitive detection of metabolites, the coverage can be limited and sometimes the results may be insufficiently quantitative [25]. Chemical isotope labeling (CIL), based on differential 12C-/13C-isotope dansylation, modifies the chemical and physical properties of metabolites, which helps improve the quantification, as well as the sensitivity of metabolomic analysis [26]. When coupled with MS, CIL can provide wider coverage of metabolites in a variety of species/tissues [25, 27-29]. Here, we report a metabolomic study, using the CIL LC-MS platform, to identify primary plant metabolites, defense-related pathways, and key post-transcriptional mechanisms associated with blackleg resistance mediated by Rlm1 in canola.
2. Materials and Methods
2.1. Plant Materials and Pathogen Isolates
A near isogenic line (NIL) of B. napus carrying the R gene Rlm1 was developed at the Saskatoon Research and Development Center, AAFC [30]. The process used the ‘Quinta’ doubled-haploid (DH) line DH24288, which carries Rlm1 and Rlm3 [31], as the R parent in backcrossing with the susceptible Topas DH16516 [30]. The NIL and Topas DH16516 were used as resistant and control lines, respectively, throughout the study. Each line was planted in 128-well flats filled with Sunshine #3 soilless mix (Sun Gro Hort. Canada Ltd., Vancouver, BC) amended with 12.5 g L-1 Osmocote Plus 16-9-12 (N-P-K, Scotts Miracle-Gro Canada Ltd, Mississauga, ON). Seeded flats were placed in an incubator set with a day/night temperature regime of 22/18°C, about 65% relative humidity and a daily photoperiod of 16 h. In later experiments to validate the effect of putative metabolites identified on blackleg resistance, a DH line of ‘Westar’ [32,33] was planted similarly as an additional susceptible control.
The L. maculans isolate Sc006 carrying the avirulence gene AvrLm1 was used to inoculate all plants. The isolate was cultured on V8-juice agar amended with streptomycin sulfate (100 ppm) at 20°C under cool-white fluorescent light for 7-10 d for inoculum production [34]. Pycnidiospores were harvested by flooding the culture plates with sterilized water and filtering resulting spore suspension through a Falcon™ Cell Strainer (70 μm, Corning/Sigma-Aldrich, Markham, ON). The concentration of obtained spore suspension was estimated using a hemocytometer, and adjusted to 2 ×10⁷ spores/mL with sterilized water for plant inoculation.
2.2. Plant Inoculation, Infection Assessment and Leaf-Tissue Sampling
About a week after seedling emergence, each lobe of cotyledon was pricked with a pair of bent-tipped tweezers and each wound was inoculated with a 10-μl droplet of prepared spore suspension. Wounds receiving sterilized water were used as non-inoculated controls (mock). Inoculated seedlings were let air dried at room temperature for 30 min before being placed back in the incubator. Following the inoculation, emerging true leaves were removed every 3-5 days to delay the senescence of inoculated cotyledons. At 12-14 days post inoculation (dpi), the severity of infection on inoculated and control cotyledons was assessed using a 0-9 scale introduced by Koch, Badawy [35], with cotyledon tissues immediately around the inoculation site or expanding lesion being sampled using a paper puncher at 3, 7 and 11 dpi, respectively. Samples from 20 random seedlings of the same treatment were bulked and grounded in liquid nitrogen into a fine powder using mortar and pestle to form a biological replicate, with three replicates prepared for each treatment or control at each of the time points of sampling. All bulked samples were stored at -80°C until use.
2.3. Sample Preparation for Metabolomic Analysis Using CIL LC-MS
Bulked cotyledon samples were extracted for metabolites following the protocol described by Tunsagool, Wang [29] at the Metabolomics Innovation Centre (TMIC), University of Alberta, with only slight modifications. Briefly, 300 mg of each sample was transferred into a 2-mL Eppendorf tube containing 1.5 mL of extraction buffer (methanol/water, 4:1, v/v) and 2.8-mm ceramic beads. After vortexing for 15 s, the sample was homogenized using the Bioprep-24 homogenizer (Allsheng, China) for another 15 s. The tube was then placed in a -20°C freezer for 10 min before being centrifuged at 15,000 g at 4°C for 10 minutes. The resulting supernatant was transferred to a fresh vial for subsequent metabolomic analysis.
Dansylation labeling, qualification and LC-MS analysis of samples generally followed the protocol described previously by Luo et al. [27]; 25 µL of each extraction were dried under nitrogen blowdown and reconstituted in the equal volume of LC-MS grade water. The samples were then processed following the SOPs provided in the kit by the manufacturer of Dansyl-labeling Kit for Amine & Phenol Metabolomics (NMT-4101-KT, Nova Medical Testing Inc., Edmonton, AB). Each sample was labeled using 12C-labeling reagent. To establish a reference standard, a pooled sample was produced by mixing an equal amount of extraction from each individual sample, and labeled with a 13C-labeling agent as a baseline for metabolomic analysis [27].
2.4. Metabolome Quantification
An LC-UV-based standard operating protocol (SOP) established at TMIC was used to quantify labeled metabolites for sample amount normalization [36]. All dansylation-labeled samples were centrifuged at 15,000 g for 10 min, with 25 µL of each supernatant being used for UV quantification in an HPLC vial. Each 12C-labeled sample was mixed with an equal molar amount of the 13C-labeled pooled sample based on the SOP. This mixture was measured using LC-MS analysis for the peak intensity ratio of metabolites between individual samples and the pooled sample [27]. Quality control (QC) over the LC-MS analysis was performed by combining equal amounts of 12C-labeled and 13C-labeled pools.
2.5. LC−MS Analysis
LC-MS analysis of labeled metabolite samples was conducted following the previously reported method [42] at TIMC, utilizing a Thermo Vanquish UHPLC system coupled to a Q Exactive Orbitrap mass spectrometer (Thermo Scientific, Edmonton, AB). To ensure consistent instrument performance, quality control (QC) samples were injected after every 20 sample runs. Mixed 12C- and 13C-labeled samples were separated using an Agilent Eclipse Plus C18 reversed-phase column (2.1 mm × 15 cm, 1.8 μm particle size), with mobile phases and gradient conditions adapted from [27]. Solvent A consisted of 0.1% (v/v) formic acid in water, and solvent B was 0.1% (v/v) formic acid in acetonitrile. The gradient program was: 25% B at 0 min, ramped to 99% B by 10 min, held at 99% B until 13 min, returned to 25% B at 13.1 min, and maintained until 16 min. MS conditions were: flow rate of 400 μL/min, column temperature at 40 °C, mass range m/z 220–1000, and acquisition rate of 1 Hz.
2.6. LC-MS Raw Data Extraction and Processing
The open-source ProteoWizard MSConvert software (https://proteowizard.sourceforge.io/) was used to convert all LC-MS raw data from profile mode into .txt files [37], and a suite of programs developed at TIMC was employed to process the converted data in batch mode [38]. The IsoMS Pro 1.2.5 software [38] was used to pick and align peak pairs and calculate the intensity ratio of metabolites. Peak pairs that were not presented in at least 80.0% of samples in any group were filtered out. Data was then normalized by Ratio of Total Useful Signal, calculated as sum of all useful 12C-peaks over sum of all useful 13C-peaks, served as post-acquisition normalization [138].
For metabolite identification, three-tiered database developed at TMIC were utilized, including the labeled standard database (CIL Library) as tier 1, the linked identity library (LI Library) as tier 2, and MyCompoundID library as tier 3 [42]. The tier 1 provided positive identification results by matching to experiential information of compound standard. high confidence identification. Tier 2 delivered high confidence putative identification results based on both experimental and predicted information. While tier 3 generated putative results in which peaks with multiple matches would not be considered. For compounds with multiple-matching peaks, only the peak with the lowest absolute error in mass and retention time was retained for analysis.
2.7. Validating the Potential Involvement of Selected Metabolites in Resistance
Table 1 lists the most differentially accumulated metabolites (DAMs) and related pathway DAMs identified during metabolomic analysis, including pipecolic acid (PA), salicylic acid (SA), gentisic acid (GA), glutathione (GSH), lysine (Lys) and diaminopimelic acid (2,6-diaminopimelic acid; DAP). Several moderately-accumulated DAMs, including ferulic acid (FA/ferulate), caffeic acid (CFA/caffeate) and benzoic acid (BA), were also tested for their reported disease-suppressing properties in other disease-resistance cases. (e)-6'-hydroxyferulate (E-6'-HF), along with FA and CFA, are involved in scopoletin (SCF)/isoscopoletin (IsoScp) biosynthesis [44, 45]. However, E-6'-HF is unavailable commercially, therefore only CFA and trans-FA (trans-ferulic acid, a ferulate isomer in plant) were tested for their roles in blackleg resistance. Additionally, piperonylic acid (PipA), an inhibitor of the phenylpropanoid pathway in plants, was tested because this pathway is crucial for the biosynthesis of cinnamic acid (CA), FA and other phenolics that play important roles in plant defense, structural integrity and stress responses [145].
Most of these metabolites could be dissolved in water, while FA and PipA had to be dissolved first in methyl sulfoxide (DMSO, Sigma-Aldrich Canada, Oakville, ON) before being diluted to desired concentrations using deionized water. The final solution of FA and PipA contained 0.17% and 1.7% of DMSO, both at low enough concentrations with minimum effects on canola seedlings. CFA and BA were dissolved initially in 95% ethanol, then diluted with water to achieve desired concentrations in which the ethanol content was 9.5% and 6.8%, respectively. All final metabolite preparations were amended with Triton X-100 (surfactant) at 0.01% for improved spreadability and adherence during spray applications. Water, 0.17% /1.7% of DMSO or 9.5%/6.8% of ethanol amended with the surfactant was used as a control depending on the treatment.
Two canola varieties, Topas (susceptible) and Westar (highly susceptible), were used to validate the effects of the metabolites. These DAM preparations were applied to canola seedlings using a misting bottle (Uline, Milton, ON) twice daily, with approximately 0.3 mL per seedling per application, starting two days after emergence and continuing for five consecutive days until the day of inoculation. About one hour after the final DAM treatment, each cotyledon lobe was inoculated with the highly virulent L. maculans isolate (Sc006) and the infection development was assessed using the 0-9 scale at 14 dpi as described above. In addition to the pre-inoculation effect, PA was also studied for its post-inoculation effect due to its highest efficacy of suppression, with twice-daily spray applications at 1, 3 and 9 dpi. Inoculated cotyledons sprayed with water at the corresponding time points served as controls. The experiments followed a completely randomized design (CRD), with a minimum of four replicates (plants) and maximum 24 plants per treatment or time point. Each experiment was repeated 2-3 times at different intervals.
2.8. Data Analysis
Most data analyses were performed using R [46]. Metabolomics data were processed initially with a 104 integer transformation prior to normalization. Multivariate and univariate analyses were performed on normalized data using the “DESeq2” package [47]. Fold changes (FC) were calculated for sample pairs at 3, 7 and 11 dpi. Metabolites were classified as differentially accumulated if log2FC ≥|1| and false discovery rate (FDR)-adjusted P ≤0.05. Principal component analysis (PCA) was performed using the “prcomp” function [46], and visualized with the “ggplot2” package [48-50]. Venn diagrams were created using the “ggvenn” package [51] to illustrate the overlap or uniqueness of metabolites among different treatment groups or time points, and heatmap analysis was performed with the “pheatmap” package [52] to provide a detailed visualization of the abundance levels of metabolites across samples or conditions.
Additionally, the relative intensity of BA, GSH and oxidized glutathione (GSSG) in the LC-MS chromatogram, as well as the ratio of GSH/GSSG readings, were analyzed initially with ANOVA using “rstatix” [53]; a reduced ratio is a key indicator of cellular redox balance, which is critically relevant to plant disease resistance [54]. The post-hoc examination of treatment means used LSD in the “agricolae” [55] , and visualized with “ggplot2” [48-50]. Pathway analysis of highly-regulated DAMs was performed using the Arabidopsis-metabolite database in MetaboAnalyst6.0 [56].
All data on infection severity of inoculated cotyledons from repeated trials were pooled due to general homogeneity of variance. Pooled data were analyzed for normality prior to ANOVA, followed with LSD post-hoc analysis for mean separation when ANOVA showed significance (P ≤ 0.05). For data that lacked a normal distribution, aligned-ranks transformation ANOVA (ART ANOVA) was performed using the “ARTool” package [57-60], followed with a post-hoc test using “emmeans” [61]. Significance groupings were labeled using the “rcompanion” package based on P-values [58, 62].
3. Results
3.1. Multivariate Analysis of Metabolomic Data
More than 3,000 metabolites were identified in susceptible (Topas) and resistant (Topas-Rlm1) canola varieties with or without L. maculans (AvrLm1) inoculation. For clarity, these treatments were labelled as TC (Topas-control), TI (Topas-inoculated), RC (Rlm1-control) and RI (Rlm1-inoculated), corresponding to 3, 7 or 11 dpi. The first two principal components of PCA (PC1: 28.2%, PC2: 13.9%) explained the variance (Figure S1). Samples from each treatment and time point formed distinct clusters, demonstrating the data reproducibility. Additionally, QC samples clustered together, indicating high experimental consistency.
At 11 dpi, the TI and RI groups were distinct from other groups and were also separated from each other along PC1 (Figure S1). Additionally, the RC-3dpi, RI-3dpi and RI-7dpi groups were also distinct from the rest. Notably, all RI samples were separated from those of TI at each sampling point. Relatively, PC1 accounted for most of the variance across time points, while PC2 captured the majority of the variance among treatments.
3.2. Univariate Analysis of Metabolomic Data
Between the control groups TC and RC, a total of 591, 586 and 452 metabolites exhibited increases while 436, 365 and 385 showed decreases at 3, 7 and 11 dpi (Figure S2). However, between inoculated RI and its water control RC, 259, 457 and 687 metabolites increased, while 469, 392 and 692 decreased at the respective time points. For TI and TC, the corresponding numbers were 169, 317 and 934 (increase) and 181, 198 and 644 (decrease).
Compared to TI, the resistant RI responded more rapidly to infection, with 259 and 457 up-regulated DAMs at 3 and 7 dpi (Figure S2). In contrast, TI displayed only 169 and 317 up-regulated DAMs relative to its control TC at these two time points. In the meantime, RI showed 469 and 392 down-regulated DAMs, while TI had only 181 and 198, relative to their respective controls at 3 and 7 dpi. At 11 dpi, however, TI exhibited the highest number of up-regulated DAMs (934) among all treatments.
3.3. DAMs in Relation to Inoculation and Resistance
A significant number of up- and down-regulated DAMs were shared between RI and its control RC across the time points when visualized with Venn plots, indicating the involvement of many of the same metabolites in the Topas-Rlm1, with or without infect across 3-11 dpi (Figure 1A-D). This pattern, however, was much less pronounced between TI and TC.
Further comparisons among samples collected at the same dpi showed that only a limited number of DAMs were shared between RI and TI at 3 and 7 dpi (Figure 2A-D). However, at 11 dpi, the number of overlapping up- and down-regulated DAMs increased sharply between the two treatments, reaching 450 and 277, respectively (Figure 2E, 2F), indicating that many DAMs present in RI were also found in TI at the later stage of infection.
3.4. Prominent DAMs and Their Related Pathways
Following the initial analyses above, the most significantly-regulated DAMs in association with the resistance were identified and further analyzed for potential pathways involved. Out of 1,145 up- and 1,466 down-accumulated relevant peaks, only 299 and 237 matched at least one known compound in the CIL standard (Tier-1), LIL (Tier-2) and MCIDL (Tier-3). The remaining peaks showed no match to any of the compounds in these libraries.
Many of the DAMs exhibited earlier responses in RI samples compared to TI, as shown by the heatmaps of Hierarchical Cluster Analysis (Figure 3). Several DAMs displayed significant regulation only between RI and TI. Out of the significant peaks from 3-dpi samples, only 109 matched known metabolites, with 24 being identified by the CIL standard, 47 by LIL and 38 by MCIDL. To ensure reliability, only DAMs identified using Tier-1 and Tier-2 libraries were analyzed for pathways in the Arabidopsis database [56].
At 3 dpi, several DAMs were significantly regulated in the Rlm1-mediated resistance (RI) compared to RC (mock). These metabolites are associated with the biosynthesis of Lys (meso-2,6-diaminoheptanedioic acid) and anthocyanin-ACN (pelargonidin 3-O-β-D-sambubioside), degradation of Lys (PA) and metabolism of purine (adenosine), pyrimidine (cytidine), arginine and proline [N-carbamoylputrescine (NCP)] (Table 2). In contrast, several DAMs were significantly down-regulated in the RI, including those involved in the biosynthesis of flavones and flavonols [kaempferol 3-O-glucoside, quercitrin, kaempferol, quercetin 3-O-rhamnoside 7-O-glucoside (QRG)], Flav [kaempferol, (-)-epicatechin (EC)], ubiquinone and other terpenoid-quinones [tyrosine (Tyr)], isoquinoline alkaloids (Tyr) and indole alkaloids [tryptophan (Trp)] (Table 2). However, several DAMs identified in RI at 3 dpi were not enriched during pathway analysis, including salicylate β-D-glucose ester (bound SA), (-)-medicarpin, pyrazolidine (PZD), E-6'-HF, γ-glutamyl-β-amino-propiononitrile (γ-Glu-β-APN), m-coumaric acid and trans-2,3-dihydroxy-cinnamate (t-2,3-DHC).
At 7 dpi, 178 of the 849 distinguished peaks matched known metabolites, and the most significantly-regulated DAMs in RI are involved in the metabolism of GSH (GSH, GSSG, γ-glutamylcysteine), Trp [5-hydroxykynurenamine (5-HKA), serotonin], arginine and proline [γ-aminobutyric acid (GABA), 4-hydroxyproline], pyrimidine (cytidine), cysteine and methionine-Met [cystathionine (Cth), Met], as well as the biosynthesis of tropane (Trop), piperidine (Pid) and pyridine alkaloid (5-aminopentanal). Some are also involved in the biosynthesis of Lys (DAP), Tyr, glucosinolates (GSLs) and ACN, as well as the degradation of Lys [aminoadipic acid (AAA), PA, saccharopine (SAP)] (Table 3). Other DAMs showed decreases in RI, especially those involved in the biosynthesis of flavones and flavonols (quercitrin, luteolin), phenylpropanoids-PPs (ferulate) and arginine (Arg), as well as in the metabolism of glycine (Gly), serine (Ser) and threonine (Thr). Additionally, E-6'-HF, salicylic acid (SA), bound SA, GA, Nε,Nε-dimethyllysine, 5-aminopentanoic acid (5-APA), 3-hydroxymandelic acid (3-HMA), phloroglucinol (PG), dityrosine (DiY), 2,5-dihydroxypyridine (2,5-DHP), emodin (EMD), malonylgenistin (MG), 3,6,7,4'-tetramethylquercetagetin (TMQ), aminoacetaldehyde (AALD), and γ-L-glutamylputrescine (GGP) also increased, while 5-aminolevulinic acid, prolyl-Gly, 3,4-dihydroxybenzaldehyde (3,4-DHBA), and sodium dehydroacetic acid, decreased in the RI-7dpi.
At 11 dpi, 287 out of 1,379 distinguished peaks from the RI matched known metabolites, and the most upregulated DAMs involved in the biosynthesis of Trop, Pid and 5-aminopentanal; Lys (DAP), GSLs [homomethionine (homo-Met), p-hydroxyphenylacetothiohydroximate (p-HPAH), phenylalanine (Phe)], ACN (cyanidin 3-O-β-D-sambubioside), Phe, Tyr and Trp [Phe, 3-(4-Hydroxyphenyl)pyruvate (3-HPP), 2-aminobenzoic acid (2-AA)] also showed significant accumulation (Table 4). Also, DAMs associated with the metabolism of Trp [N-acetylserotonin (NAS), 5-HKA, serotonin], Tyr [3,4-dihydroxymandelaldehyde, homogentisate (HGA), 3-HPP], Phe (Phe) and purines (adenosine monophosphate, hypoxanthine), Arg and proline (GABA, NCP), as well as Lys degradation (AAA, PA, SAP), were up-regulated relative to the RC control (Table 4). In contrast, DAMs related to biosynthesis of PPs [5-O-caffeoylshikimic acid (5-O-CFSA), ferulate, caffeate], flavones/flavonols (luteolin, QRG) and Flav (p-coumaroyl quinic acid (p-CQA), EC) were down-regulated in RI.
Several DAMs not enriched in the Arabidopsis database but significantly upregulated in RI included GA, bound SA, SA, PG, methylcysteine, 2-(methylamino)BA, DiY, PZD, AALD, 3-formylsalicylic acid, 3-dechloroethylifosfamide, mangiferin, GGP, MG, E-6'-HF, 2,5-DHP, S-ribosyl-L-homocysteine, TMQ and dimethylamine. Conversely, kaempferol 3-O-(6"-O-p-coumaroyl)-glucoside, trans-2,3-dihydroxycinnamate (trans-2,3-DHC), bisdemethoxycurcumin (BDMC) and chlorogenic acid (CGA) were the most significantly down-regulated.
3.5. Metabolites/Pathways Potentially Related to Rlm1-Mediated Resistance
These pathways were enriched based on the above analysis using the Arabidopsis database [56] or previously reported data [42, 43], covering all time points. In RI, biosynthesis pathways for Lys, GSL, GABA, bound SA, SA, GA, melatonin (Mel), ACN, scopoletin (SCF)/isoscopoletin (IsoScp), and metabolism pathway of NaN, Trp, Tau/HTau, Phe, amino acid were most activated between 3 and 11 dpi, compared to non-inoculated resistant (RC) or inoculated susceptible (TI) (Figure 4).
Between 3 and 11 dpi, a significant increase was observed in 12 metabolites involved in the degradation or biosynthesis of Lys (Figure 4 A & B). These upregulation including PA, SAP, AAA, Nε,Nε-dimethyllysine, N6-Acetyl-Lys, 5-APA, 5-hydroxylysine, DAP, and meso-2,6-DAP (Figure 4 A & B). Notably, PA exhibited 164- to 326-fold increases in RI relative to RC or TI between 3 and 11 dpi (Figure 4 A). Additionally, peak 1861, identified as D-1-piperideine-2-carboxylic acid and (S)-2,3,4,5-tetrahydro-Pid-2-carboxylate in the Tier-3 library, increased substantially by 11 dpi (Figure 4A). Both compounds may be involved in Lys degradation. [63, 64].
Remarkably, GA, GABA, bound SA and SA were most highly accumulated throughout infection (3-11 dpi), with GA showing the prominence, particularly at 11 dpi (Figure 4H & 4J). The accumulation of BA was similar in RI and TI, but down-regulated relative to RC which had higher levels of BA than TC without inoculation (Figure 4J & Supplementary Figure S3G).
DAMs with reported antimicrobial activities included PG, E-6'-HF, MG, 2-aminophenol (2-AP), 2-AA, EMD, PZD, 5-HKA, NCP and γ-Glu-β-APN (Figure 4K), with E-6'-HF showing a 27- to 580-fold accumulation in RI over RC controls during 3-11 dpi (Figure 4E & K). Notably, PG, 2-AA, 2-AP, γ-Glu-β-APN, mangiferin and (-)-medicarpin increased significantly in RI but not in TI, relative to respective controls (Figure 4K).
DAMs involved in Trp (Figure 4N), nicotinate-nicotinamide (NaN) (Figure 4G), taurine (Tau) and hypotaurine (HTau) (Figure 4O) and Phe (Figure 4Q) metabolism were also increased in RI during infection. Many DAMs involved in Trp metabolism, including NAS, 5-HKA and 5-hydroxyindoleacetylglycine also showed substantial increases in RI (Figure 4N). Additionally, peak 3324, identified as indoleacetic acid (IAA) and 5-hydroxyindoleacetaldehyde (5-HIAL) with identical mass errors, represents key metabolites in Trp metabolism and IAA biosynthesis [65, 66]. Furthermore, nicotinic acid mononucleotide and 2,5-DHP (NaN metabolism), Tau, HTau and AALD (Tau/HTau metabolism), as well as Phe and SA (Phe metabolism), exhibited increased accumulation in RI (Figure 4G, O & Q).
Several DAMs involved in ACN (Figure 4C), GSL (Figure 4D), Mel (Figure 4F), Trop, Pid & pyridine alkaloid (Figure 4L), and Phe, Tyr & Trp (Figure 4M) biosynthesis, were increased highly in RI at different time point. Five DAMs, including pelargonidin 3-O-β-D-sambubioside in CAN, were also accumulated in RI at different time points (Figure 4C). Several DAMs related to GSL biosynthesis, including homo-Met, p-HPAH, Phe, Met and Leucine (Leu), also were increased in RI (Figure 4D). NAS and 5-methoxytryptamine (5-MT), the key intermediates in Mel biosynthesis, showed high levels in RI only at 11 dpi (Figure 4 F). Additionally, peak 3618, with the best match to Mel in the tier 3 library, increased by 130- and 389-fold in RI relative to RT sampled at the same time points (Figure 4F). 5-aminopentanal (Trop, Pid & pyridine alkaloid biosynthesis), D-Erythrose 4-phosphate and 3-HPP (Phe, Tyr & Trp biosynthesis) were greatly increased in RI from 3 to 11 dpi (Figure 4 L & M).
The previously mentioned dramatically increased E-6'-HF, along with FA and CFA, is involved in scopoletin biosynthesis and may also be linked to the isoscopoletin biosynthesis pathway [44, 45]. In canola, both FA and CFA accumulate at higher levels in RC compared to all other treatments (Figure 4E & Supplementary Figure S3F), whereas E-6'-HF exhibits a marked increase in RI across all time points (Figure 4E).
Although GSH and GSSG generally increased in response to inoculation, GSH levels were higher in RI than in TI at only 7 dpi and the opposite was observed for GSSG at 11 dpi (Figure 5 A & B). However, the ratio of GSH/GSSG was generally higher in RI than TI throughout 3-11 dpi (Figure 5C).
Several DAMs related to the biosynthesis of flavone/flavonol (Supplementary Figure S3A), Flav (Supplementary Figure S3B) and PPs (Supplementary Figure S3C), and metabolism of Gly, Ser & Thr (Supplementary Figure S3D) were suppressed in RI. These included quercitrin, kaempferol, quercetin, luteolin, EC and 5-aminolevulinic acid (Supplementary Figure S3A-D). In contrast, the isoflavonoid MG increased dramatically in RI, accumulating 5- to 24-fold higher than in RC at 7 and 11 dpi (Figure 4I).
3.6. Validating DAM Candidates for Their Potential Roles in Rlm1-Mediated Resistance
When applied to the susceptible cultivars Topas and Westar before inoculation, all metabolites, along with the phenylpropanoid-pathway inhibitor PipA (Table 1), significantly reduced infection development (measured by lesion size) on cotyledons (Figure 6), compared to respective controls (P < 0.05, LSD). Although some metabolites showed slightly greater efficacy in one or both cultivars, PA consistently exhibited the strongest suppression (Figure 6). Furthermore, PA reduced lesion expansion when applied post-inoculation at 1 and 3 dpi, but showed no significant effect at 9 dpi on either Topas or Westar (Figure 7).
4. Discussion
PCA analysis revealed distinct metabolomic patterns associated with Rlm1-mediated resistance, with RI (7 and 11 dpi) and TI (11 dpi) samples clustering separately from others (Figure S1). These patterns suggest unique metabolic responses linked to Rlm1 and/or the interval between inoculation and sampling. Heatmaps from hierarchical clustering analysis further highlighted these differences (Figure 3). Notably, several DAMs increased significantly in inoculated Topas-Rlm1 at 7 and 11 dpi compared to 3 dpi. In contrast, these DAMs did not show a substantial increase or decrease in inoculated Topas until 11 dpi. The more rapid accumulation in Topas-Rlm1 suggests a potential role for these metabolites in Rlm1-mediated resistance.
During resistance against infection (RI), several pathways were activated across different time points, particularly those involved in the biosynthesis of Lys, SA, GA, Met, GABA, GSH, and Mel, as well as the degradation of Lys. These pathways involved numerous DAMs (Figure 4). Previous studies have highlighted the relevance of these metabolites to plant disease resistance. In the following sections, we briefly discuss their specific roles and supporting experimental evidence in plant defense responses.
Lysine: Lys biosynthesis involves multiple enzymatic steps, with DAP and meso-DAP serving as key intermediates [68, 69]. In contrast, Lys degradation leads to the production of various intermediates, including cadaverine, glutamic acid, AAA, D-1-P2C and SAP, ultimately resulting in the formation of PA, a non-protein amino acid [64]. In this study, meso-DAP and DAP accumulated significantly in RI (Figure 4B), while PA levels increased 164-fold and 326-fold at 7 and 11 dpi, respectively, compared to RC controls (Figure 4A). Additionally, key Lys degradation intermediates, particularly SAP, AAA, Nε,Nε-dimethyllysine, N6-Acetyl-Lys, 5-hydroxylysine, and 5-APA, were significantly elevated in RI (Figure 4 A). PA is a well-established Lys catabolite that plays a crucial role in induced plant immunity, including systemic acquired resistance (SAR) [70-72]. Beyond its role in PA biosynthesis, Lys may also directly contribute to disease resistance [73] as a precursor for alkaloid biosynthesis [74]. It can regulate the activity of defense-related proteins, including β-1,3-glucanase and chitinase, as well as enzymes involved in ROS regulation [73]. Lys is also involved in SAR by producing PA [75], which functions as a SAR signal [76] alongside SA [77] and redox mechanisms [78]. Therefore, our findings support Lys's role in blackleg resistance.
Beyond PA and AAA, the significant accumulation of several other DAMs and activation of associated pathways during the incompatible interaction of Topas-Rlm1 (RI), including GABA (Figure 4H), Tyr and Met—but not Trp (Figure 4P), suggests a role for these amino acids in resistance. PA may also link SAR to the homeostasis of aspartate-derived amino acids such as Ile, Met, Thr and Lys [75]. Previous reports showed similar increases in PA, AAA, GABA, Tyr, Trp, Leu, Ile and Lys in resistant Arabidopsis and tobacco plants infected with Pseudomonas syringae [71, 79]. The conversion of Lys into α-aminoadipate via the SAP pathway contributed to early wheat resistance against Puccinia striiformis f. sp. tritici, as evidenced by increased 2-AAA and SAP levels [80, 81].
Lys transporter genes, including CAT1, LHT1 and LHT7, were also upregulated in resistance of Arabidopsis to P. syringae infection or Flg22 elicitor treatment [75, 82]. Notably, treatments of susceptible canola seedlings with PA, Lys and DAP in the current study effectively restricted infection development on cotyledons (Figure 6 and Figure 7), reinforcing their role in blackleg resistance by preventing the pathogen from reaching the stem [4]. Interestingly, applying PA shortly after inoculation (1 or 3 dai) effectively suppressed infection, whereas treatment at 9 dai showed no such effect (Figure 7). This suggests that PA must be induced early, likely during the biotrophic phase of infection, to confer effective defense against this hemibiotrophic pathogen. Once the fungus transitions to the necrotrophic phase, as seen at 9 dai, PA’s effectiveness diminishes. This is further supported by the observation that many of the same DAMs accumulated at similar or higher levels in inoculated susceptible Topas compared to resistant Topas-Rlm1 at 11 dai (Figure 3). These findings highlight the importance of the timing for PA induction in modulating defense responses of Rlm1-carrying canola against blackleg infection.
Both SA and bound SA were highly accumulated during the incompatible interaction in RI (Figure 4J). SA is well known for its role in SAR, a long-lasting immune response that protects plants against a broad range of pathogens [83-86]. A transcriptome study by Zhai et al. [14] identified strong activation of the SA pathway associated with Rlm1-mediated resistance. Upon pathogen recognition, plants activate a complex signaling cascade that leads to the production of SA and the TGA2-NPR1 complex, collectively inducing SAR [87-89]. A key function of SA is its regulation of pathogenesis-related (PR) genes, which encode proteins that can directly inhibit pathogen growth or act as signaling molecules to amplify defense responses [89-92]. Additionally, SA contributes to plant defense by stimulating callose deposition [93], promoting the production of ROS [94-96], and triggering programmed cell death (PCD) [3, 97-99].
Gentisic acid (GA) is a derivative of SA [100], a secondary metabolite that can be involved in plant defense responses [101, 102]. In incompatible interaction in RI, both SA and GA showed significant accumulation at 7 and 11 dai (Figure 4J). GA can act as a signaling molecule, inducing PR proteins with antimicrobial properties, such as P23, P32 and P34 in treated tomato plants [101]. GA has also been shown to activate peroxidase activity in cucumber and purple velvet (Gynura aurantiaca) plants following pathogen infection or SA treatment [103]. However, GA’s role in plant defense may also vary with the host and pathogen involved [101, 104]. GA accumulates in compatible and non-necrotic (ToMV or CEVd), but not in incompatible and HR-associated necrotic infections [101, 104]. In cucumber, a low-dose inoculation with P. syringae pv. tomato induced a compatible response with GA accumulation, while a high-dose inoculum caused an incompatible HR-like necrosis without GA accumulation [103]. In this study, GA accumulation was observed during the incompatible interaction (Figure 4J). The application of SA or GA prior to inoculation also significantly reduced infection in susceptible plants (Figure 6A), indicating their roles in Rlm1-mediated blackleg resistance. Since SA peaked earlier than GA (7 vs 11 dpi), it likely plays a more prominent role in defense responses during the biotrophic phase of L. maculans infection in Topas-Rlm1 plants.
Several compounds involved in glucosinolate (GSL) biosynthesis were significantly induced in inoculated Topas-Rlm1, including p-HPAH, Met and homo-Met (Figure 4D). Upon pathogen attack, GSLs can be hydrolyzed by myrosinase, producing biologically active compounds such as isothiocyanates, thiocyanates and nitriles, which possess antimicrobial properties [105-109]. Both Met and homo-Met are key intermediates in GSL biosynthesis [110-112], while Met also plays a crucial role in ethylene (ET) biosynthesis and DNA methylation in plants [113-115]. Additionally, Met-cycle enzymes, along with ET and polyamines, are involved in plant-virus resistance [116]. Application of Met or over-expression of Methionine synthase 1 (METS1) gene in rice plants also enhanced resistance to rice blast caused by Magnaporthe oryzae [113, 114]. Although significant accumulation of Met and homo-Met was observed during the incompatible interaction of Topas-Rlm1 against L. maculans, their role in blackleg resistance was not validated in this study due to metabolite unavailability.
NAS, Mel and 5-MT: In Arabidopsis, rice and cassava (Manihot esculenta), NAS plays a key role in Mel biosynthesis, where it is converted into Mel by ASMT (acetylserotonin O-methyltransferase) [117-119]. The activity of ASMT has been shown to enhance resistance to Xanthomonas axonopodis pv. manihotis in benth (Nicotiana benthamiana) and cassava [119]. Overexpression of genes involved in NAS production, such as serotonin N-acetyltransferase (SNA) in rice [120], as well as ASMT and SNA in Arabidopsis [121-124] and ASMT in apple [125], has been found to activate defense-related genes (e.g., PR genes, antioxidant enzymes, and JA pathway genes) [124, 125]. This activation enhances plant resistance against various pathogens and abiotic stresses [124, 125]. Similar resistance-enhancing effects have been observed with the exogenous application of Mel on Arabidopsis leaves [126], NAS on Arabidopsis and tobacco leaves [126], Mel, 5-MT and 5-methoxyindole in benth [127]. In our study, Peak 3618, identified through the tier-3 library match, is highly likely Mel (Figure 4F), as well as NAS and 5-MT, were all elevated in RI (Figure 4F), indicating that multiple compounds involved in Mel biosynthesis are upregulated during Rlm1-mediated resistance.
GABA plays a key role in plant disease resistance by acting as a signaling molecule in stress responses and immunity [128]. Its accumulation at infection sites contributes to defense mechanisms [128], including direct pathogen inhibition [129] and regulation of ROS to reduce oxidative damage [130]. In cucumber, exogenous GABA enhances antioxidant enzyme activity, decreasing hydrogen peroxide and superoxide levels in plants and improving tolerance to oxidative stress [130]. GABA is involved also in hormone crosstalk, triggering induced systemic resistance (ISR) by activating specific receptors and defense pathways [128]. In citrus, GABA application increased endogenous levels of the metabolite, stimulating production of several defense-related phytohormones, including SA, CA and abscisic acid [131]. Its accumulation has also been linked to disease resistance in rice, Arabidopsis and other plants [132-134]. The elevated GABA accumulation in canola's resistance response aligns with its role observed in other plant-pathogen systems, as reported in several studies.
GSH and antioxidant enzymes are key redox components in plant defense against oxidative stress [54]. Exogenous SA enhances GSH levels in tomato leaves and roots [135], and stimulates GSH and chlorogenic acid accumulation in chickpea [136]. GSH metabolism also plays a crucial role in hydrogen-mediated responses to abiotic stress in alfalfa [137]. Enzymes involved in GSH metabolism, such as GSH S-transferases (GSTs), are considered important in plant-pathogen interactions [138]. During a plant hypersensitive response (HR), GSH and Trp-derived metabolites help restrict the invasive growth of hemibiotrophic pathogens in Arabidopsis [139]. In wheat, the cycle imbalance of GSH oxidation/reduction suggests that GSSG is transported to the apoplast to function as an oxidant for class III peroxidases (PODs), generating ROS that aid in defense against Hessian fly larvae [140]. Additionally, a high GSH/GSSG ratio is required for resistance to powdery mildew in wheat [141]. In the current study, both GSH and GSSG were induced in Topas and Topas-Rlm1 during infection, but the latter showed significantly higher GSH/GSSG ratios across the infection time points (Figure 5), supporting its relevance to canola defense against blackleg infection.
E-6'-HF is a phenolic compound belonging to the group of hydroxy-CA [44] which is known for its antimicrobial and antioxidant properties [142]. In plants, hydroxy-CA can be synthesized when the plant senses the attack by a pathogen [143]. The accumulation of E-6'-HF, FA and CFA in Topas-Rlm1 plants (Figure 4E & Supplementary Figure S3E) suggests their potential roles in plant defense. Phe serves as a precursor for FA and CFA via the phenylpropanoid pathway, and both FA and CFA contribute to the biosynthesis of E-6'-HF [44, 45]. FA is derived from CA and plays a key role in plant defense responses by activating the phenylpropanoid pathway and stimulating ROS production [144]. This phenylpropanoid pathway leads to the synthesis of SA, phytoalexins and lignin, all of which contribute to enhanced plant immunity [145]. Additionally, FA derivatives have demonstrated direct antimicrobial, antioxidant [146-150] and antiviral properties [146, 147, 151].
CFA derivatives have been implicated in reinforcing plant cell walls, thereby enhancing plant defense [152, 153]. In addition to their structural role, they have also exhibited direct antimicrobial properties. For example, a nanoparticle formulation containing methyl-CFA and CFA-phenethyl-ester has been used against the plant pathogenic bacterium Ralstonia solanacearum [154]. Surprisingly, inoculated Topas-Rlm1 did not show a significant increase in Phe levels compared to inoculated Topas (Figures 4E, Supplementary Figure S3C), despite Phe being a known precursor for FA and CFA in the phenylpropanoid pathway [155, 156]. Given that Phe is frequently linked to plant disease resistance [157], this unexpected result suggests that FA and CFA biosynthesis in Topas-Rlm1 may be regulated independently of Phe availability, possibly through pathway modulation during infection.
In this study, peak 3324 matched both IAA and 5-HIAL in the Tier 3 library, suggesting their involvement in Trp metabolism (Figure 4N) and IAA biosynthesis [65, 66]. Trp metabolism plays a crucial role in plant defense, as demonstrated in WAT1-mediated resistance to bacterial vascular pathogens in Arabidopsis, where it is associated with SA activation [158]. Although Trp serves as a precursor for multiple defense-related secondary metabolites, including IAA, camalexin, indole glutathione and 5-HIAL [65, 66], its levels did not increase in inoculated Topas-Rlm1 plants (Figures 4N). Instead, peak 3324, 2-AA, 2-AP, and 5-HKA accumulated at 7 and/or 11 dpi (Figures 4N). 2-AA is a key intermediate in IAA biosynthesis [159-161] and has been shown to activate PR-gene expression and SA-dependent ISR [162]. Additionally, both 2-AA and 2-AP have shown antimicrobial and cytotoxic activity against pathogenic bacteria, with 2-AP displaying stronger inhibitory effects [163]. 5-HKA has been shown to accumulate in resistant soybean roots in response to Phytophthora sojae infection, compared to the roots of susceptible cultivar [164].
Several compounds associated with ACN biosynthesis and antimicrobial/plant defense were significantly accumulated in inoculated Topas-Rlm1 plants (Figures 4C, I & K). However, their specific roles in resistance remain poorly understood. Using benzothiadiazole, which mimics SA and activates PR gene expression, leading to enhanced flavonoid biosynthesis, including ACN, in some plant species has been shown to improve disease resistance (reviewed by Iriti and Faoro [165]). Several metabolites in the ACN biosynthesis pathway appear to promote SAR in grapevine against Botrytis cinerea [166]. Another notable compound, NCP, accumulated early (3 dai) in inoculated Topas-Rlm1 plants but then increased more slowly relative to Topas controls (Figure 4K). NCP is an intermediate in polyamine biosynthesis, contributing to the production of spermine [167, 168], which is known to enhance plant resistance, particularly by inducing hypersensitive reactions and SA-independent PR proteins [169, 170]. Additionally, the isoflavonoid malonylgenistin (MG) was also significantly increased in Topas-Rlm1 upon infection (Figure 4I). In soybean, isoflavonoids are linked to resistance to the insect pest Euschistus heros, acting as potential defense compounds [171].
Exogenous application of key defense-associated DAMs—including PA, FA, CFA, SA, GA, DAP, PipA, GSH, and Lys—significantly reduced infection in susceptible Westar and Topas, confirming their roles in resistance (Figure 6&7). Repeated applications before inoculation likely maximized treatment effects, while early post-inoculation application of PA also proved effective, emphasizing the importance of early activation of these metabolites (Figure 7). Several additional defense-related DAMs could not be tested due to the lack of commercially available products. However, their potential roles in Rlm1-mediated resistance are discussed below, highlighting their possible contributions to defense signaling and pathogen suppression.
Additional DAMs associated with antimicrobial properties in inoculated Topas-Rlm1 plants include medicarpin, PZD, mangiferin, 3-HMA, PG and EMD (Figure 4K). Their accumulation, however, varied depending on the post-inoculation timing, with medicarpin, PZD and mangiferin being increased early at 3 dai while 3-HMA and PG later (Figure 4K). Medicarpin is a phytoalexin capable of inhibiting pathogens in plants by activating defense-related signaling pathways [172, 173], enhancing the expression of SA-related genes as observed in barrelclover (Medicago truncatula) against powdery mildew [173]. Mangiferin, PZD and PG derivatives have also been reported with antimicrobial/antioxidant properties [174, 175]. In vitro, mangiferin inhibited the growth of Fusarium oxysporum, and its application to safflower (Carthamus tinctorius) reduced infection by the pathogen [176]. Additionally, 3-HMA from parsley root extracts showed the inhibitive effect on spore germination and hyphal growth of F. oxysporum [177]. EMD showed moderate increases only at 7 dai but not 3 or 11 dai (Figure 4K); it has been shown to enhance plant resistance via inducing phytoalexins and HR [178]. Overall, while these DAMs may play a role in plant defense, there is limited information on them and further research is needed to clarify their specific contributions to Rlm1-mediated resistance.
Several plant defense-related metabolites showed significantly reduced accumulation in the Rlm1 resistance, particularly those involved in phenylpropanoid metabolism, flavonoid, flavone and flavonol biosynthesis, as well as Gly, Ser and Thr metabolism (Figures 4Q & Supplementary Figure S3). These metabolites, or their isoforms, have been implicated in disease resistance or abiotic stress tolerance in other plant species [179-182]. However, their reduced accumulation in resistant plants suggests that they may not be essential for effective defense against L. maculans. While many phenolic compounds contribute to plant immunity, some may also facilitate pathogen colonization, potentially increasing plant susceptibility [183]. This indicates that resistance mechanisms may selectively downregulate certain metabolites to prevent pathogen exploitation. Additionally, metabolic flux within the phenylpropanoid pathway can be redirected toward alternative defense responses [184, 185]. For instance, inhibition of specific branches of this pathway may enhance SA biosynthesis [184, 185], a key regulator of SAR [77]. Consistent with this, our study found that applying PipA, a phenylpropanoid pathway inhibitor [67], significantly reduced lesion size on inoculated cotyledons of susceptible Topas (Figure 7B). This suggests that blocking certain metabolic pathways may shift biosynthesis toward SA and other defense-related compounds, ultimately enhancing resistance to L. maculans [67, 184, 185].
5. Conclusion
Our metabolomic analysis of DH Topas and Topas-Rlm1 revealed distinct metabolite profiles during compatible and incompatible interactions, with significant changes depending on post-inoculation time points. In Topas-Rlm1, there was generally an early and sustained upregulation of key defense-related metabolites, particularly PA, which increased up to 326-fold, highlighting their role in resistance. Elevated SA and its derivative GA further suggest a complex hormonal defense network. Additionally, enhanced GLS biosynthesis and GABA accumulation likely contributed to antimicrobial properties and cell wall reinforcement. Increased Try metabolism and Mel biosynthesis also indicated pathway activation during infection. Conversely, resistant plants showed reduced accumulation of metabolites involved in flavonoid, flavone, flavonol and amino acid metabolism, suggesting these pathways may not be essential for Rlm1-mediated defense despite prior reports on their plant-defense mechanisms. Exogenous application of several defense-associated DAMs, including PA, FA, CFA, SA, GA, DAP, PipA, GSH and Lys, significantly reduced infection in susceptible Westar and/or Topas, validating their roles in resistance. Notably, PipA, a phenylpropanoid pathway inhibitor [67], enhanced resistance, indicating potential metabolic flux favoring SA biosynthesis [184]. These findings provide valuable insights into Rlm1-mediated blackleg resistance and highlight the potential for metabolic engineering in blackleg resistance. Future research should explore metabolic mechanisms underlying resistance conferred by other Rlm genes to develop sustainable blackleg-resistance strategies.
Author Contributions
The study was conceived by G.P. and X.Z, and directed by G.P and L.L. (metabolomics). X.Z carried out biological assays, while S.Z and X.L. performed metabolomic assays, including sample preparation, LC-MS and initial data analysis. P.G. and X.Z. performed bioinformatics. X.Z. wrote the original draft, and G.P. edited the manuscript. All authors have read and agreed to the submited version of the manuscript.
Funding
This research was supported by the ‘Canola AgriScience Cluster: Sustainable, Reliable Supply for a Changing World’ (Project Number: Activity 27; ASC-02, 2018-2023).
Institutional Review Board Statement
Not applicable.
Informed Consent Statement
Not applicable.
Data Availability Statement
The raw metabolomics data will be deposited in a public repository in the near future.
Conflicts of Interest
The authors declare that they have no competing financial interests or personal relationships that could have compromised the work reported in this manuscript.
References
- Chen, G., C. Wu, B. Li, H. Su, S. Zhen, and Y. An, Detection of Leptosphaeria maculans from imported Canola seeds/Nachweis von Leptosphaeria maculons in importiertem Rapssaatgut. Journal of Plant Diseases and Protection, 2010. 117(4): p. 173-176.
- Zhang, X., G. Peng, H.R. Kutcher, M.-H. Balesdent, R. Delourme, and W.D. Fernando, Breakdown of Rlm3 resistance in the Brassica napus–Leptosphaeria maculans pathosystem in western Canada. European Journal of Plant Pathology, 2016. 145: p. 659-674. [CrossRef]
- Hubbard, M., C. Zhai, and G. Peng, Exploring mechanisms of quantitative resistance to Leptosphaeria maculans (Blackleg) in the cotyledons of canola (Brassica napus) based on transcriptomic and microscopic analyses. Plants, 2020. 9(7): p. 864. [CrossRef]
- Hubbard, M. and G. Peng, Quantitative resistance against an isolate of Leptosphaeria maculans (blackleg) in selected Canadian canola cultivars remains effective under increased temperatures. Plant pathology, 2018. 67(6): p. 1329-1338. [CrossRef]
- Liban, S., D. Cross, H. Kutcher, G. Peng, and W. Fernando, Race structure and frequency of avirulence genes in the western Canadian Leptosphaeria maculans pathogen population, the causal agent of blackleg in brassica species. Plant Pathology, 2016. 65(7): p. 1161-1169.
- Soomro, W., R. Kutcher, F. Yu, S.-F. Hwang, D. Fernando, S.E. Strelkov, and G. Peng, The race structure of Leptosphaeria maculans in western Canada between 2012 and 2014 and its influence on blackleg of canola. Canadian Journal of Plant Pathology, 2021. 43(3): p. 480-493. [CrossRef]
- Liu, F., Z. Zou, G. Peng, and W. Dilantha Fernando, Leptosphaeria maculans isolates reveal their allele frequency in Western Canada. Plant Disease, 2021. 105(05): p. 1440-1447. [CrossRef]
- Rouxel, T., E. Willner, L. Coudard, and M.-H. Balesdent, Screening and identification of resistance to Leptosphaeria maculans (stem canker) in Brassica napus accessions. Euphytica, 2003. 133(2): p. 219-231. [CrossRef]
- Rouxel, T. and M. Balesdent, The stem canker (blackleg) fungus, Leptosphaeria maculans, enters the genomic era. Molecular plant pathology, 2005. 6(3): p. 225-241. [CrossRef]
- Borhan, M.H., A.P. Van de Wouw, and N.J. Larkan, Molecular interactions between Leptosphaeria maculans and Brassica species. Annual Review of Phytopathology, 2022. 60: p. 237-257.
- Chu, M., T. Song, K.C. Falk, X. Zhang, X. Liu, A. Chang, R. Lahlali, L. McGregor, B.D. Gossen, and F. Yu, Fine mapping of Rcr1 and analyses of its effect on transcriptome patterns during infection by Plasmodiophora brassicae. BMC genomics, 2014. 15: p. 1-20. [CrossRef]
- Song, T., M. Chu, R. Lahlali, F. Yu, and G. Peng, Shotgun label-free proteomic analysis of clubroot (Plasmodiophora brassicae) resistance conferred by the gene Rcr1 in Brassica rapa. Frontiers in plant science, 2016. 7: p. 1013. [CrossRef]
- Fudal, I., S. Ross, L. Gout, F. Blaise, M. Kuhn, M. Eckert, L. Cattolico, S. Bernard-Samain, M. Balesdent, and T. Rouxel, Heterochromatin-like regions as ecological niches for avirulence genes in the Leptosphaeria maculans genome: map-based cloning of AvrLm6. Molecular Plant-Microbe Interactions, 2007. 20(4): p. 459-470.
- Zhai, C., X. Liu, T. Song, F. Yu, and G. Peng, Genome-wide transcriptome reveals mechanisms underlying Rlm1-mediated blackleg resistance on canola. Scientific Reports, 2021. 11(1): p. 4407. [CrossRef]
- Jones, J.D. and J.L. Dangl, The plant immune system. nature, 2006. 444(7117): p. 323-329. [CrossRef]
- AbuQamar, S., K. Moustafa, and L.S. Tran, Mechanisms and strategies of plant defense against Botrytis cinerea. Critical reviews in biotechnology, 2017. 37(2): p. 262-274. [CrossRef]
- Bezerra-Neto, J.P., F.C. Araújo, J.R. Ferreira-Neto, R.L. Silva, A.N. Borges, M.K. Matos, J.B. Silva, M.D. Silva, E.A. Kido, and A.M. Benko-Iseppon, NBS-LRR genes—Plant health sentinels: Structure, roles, evolution and biotechnological applications, Applied Plant Biotechnology for Improving Resistance to Biotic Stress. 2020, Elsevier. p. 63-120.
- Wang, J.W. and J.Y. Wu, Effective elicitors and process strategies for enhancement of secondary metabolite production in hairy root cultures, Biotechnology of Hairy Root Systems. 2013, Springer. p. 55-89.
- Kumar, A., R. Irchhaiya, A. Yadav, N. Gupta, S. Kumar, N. Gupta, S. Kumar, V. Yadav, A. Prakash, and H. Gurjar, Metabolites in plants and its classification. World J Pharm Pharm Sci, 2015. 4(1): p. 287-305.
- Lobo, M., N. Hounsome, and B. Hounsome, Biochemistry of vegetables: secondary metabolites in vegetables—terpenoids, phenolics, alkaloids, and sulfur-containing compounds. Handbook of vegetables and vegetable processing, 2018: p. 47-82.
- Singh, R., Medicinal plants: A review. Journal of Plant Sciences, 2015. 3(1): p. 50.
- Pusztahelyi, T., I.J. Holb, and I. Pócsi, Secondary metabolites in fungus-plant interactions. Frontiers in plant science, 2015. 6: p. 573. [CrossRef]
- Wink, M., Plant breeding: importance of plant secondary metabolites for protection against pathogens and herbivores. Theoretical and applied genetics, 1988. 75(2): p. 225-233. [CrossRef]
- Cevallos-Cevallos, J.M. and J.I. Reyes-De-Corcuera, Metabolomics in food science, Advances in food and nutrition research. 2012, Elsevier. p. 1-24.
- Luo, X., X. Gu, and L. Li, Development of a simple and efficient method of harvesting and lysing adherent mammalian cells for chemical isotope labeling LC-MS-based cellular metabolomics. Analytica chimica acta, 2018. 1037: p. 97-106. [CrossRef]
- Guo, K. and L. Li, Differential 12C-/13C-isotope dansylation labeling and fast liquid chromatography/mass spectrometry for absolute and relative quantification of the metabolome. Analytical chemistry, 2009. 81(10): p. 3919-3932. [CrossRef]
- Luo, X., S. Zhao, T. Huan, D. Sun, R.M.N. Friis, M.C. Schultz, and L. Li, High-performance chemical isotope labeling liquid chromatography–mass spectrometry for profiling the metabolomic reprogramming elicited by ammonium limitation in yeast. Journal of proteome research, 2016. 15(5): p. 1602-1612. [CrossRef]
- Shen, W., W. Han, Y. Li, Z. Meng, L. Cai, and L. Li, Development of chemical isotope labeling liquid chromatography mass spectrometry for silkworm hemolymph metabolomics. Analytica chimica acta, 2016. 942: p. 1-11. [CrossRef]
- Tunsagool, P., X. Wang, W. Leelasuphakul, W. Jutidamrongphan, N. Phaonakrop, J. Jaresitthikunchai, S. Roytrakul, G. Chen, and L. Li, Metabolomic study of stress responses leading to plant resistance in mandarin fruit mediated by preventive applications of Bacillus subtilis cyclic lipopeptides. Postharvest Biology and Technology, 2019. 156: p. 110946. [CrossRef]
- Larkan, N.J., F. Yu, D.J. Lydiate, S.R. Rimmer, and M.H. Borhan, Single R gene introgression lines for accurate dissection of the Brassica-Leptosphaeria pathosystem. Frontiers in Plant Science, 2016. 7: p. 1771. [CrossRef]
- Fu, F., X. Liu, R. Wang, C. Zhai, G. Peng, F. Yu, and W.D. Fernando, Fine mapping of Brassica napus blackleg resistance gene Rlm1 through bulked segregant RNA sequencing. Scientific Reports, 2019. 9(1): p. 14600. [CrossRef]
- Sharpe, A., I. Parkin, D. Keith, and D. Lydiate, Frequent nonreciprocal translocations in the amphidiploid genome of oilseed rape (Brassica napus). Genome, 1995. 38(6): p. 1112-1121. [CrossRef]
- Yu, F., D.J. Lydiate, R. Gugel, A. Sharpe, and S. Rimmer, Introgression of Brassica rapa subsp. sylvestris blackleg resistance into B. napus. Molecular breeding, 2012. 30: p. 1495-1506. [CrossRef]
- Chen, Y. and W. Fernando, Prevalence of pathogenicity groups of Leptosphaeria maculans in western Canada and North Dakota, USA. Canadian Journal of Plant Pathology, 2006. 28(4): p. 533-539. [CrossRef]
- Koch, E., H. Badawy, and H. Hoppe, Differences between aggressive and non-aggressive single spore lines of Leptosphaeria maculans in cultural characteristics and phytotoxin production. Journal of phytopathology, 1989. 124(1): p. 52-62. [CrossRef]
- Zhao, S., X. Luo, and L. Li, Chemical isotope labeling LC-MS for high coverage and quantitative profiling of the hydroxyl submetabolome in metabolomics. Analytical chemistry, 2016. 88(21): p. 10617-10623. [CrossRef]
- Chambers, M.C., B. Maclean, R. Burke, D. Amodei, D.L. Ruderman, S. Neumann, L. Gatto, B. Fischer, B. Pratt, and J. Egertson, A cross-platform toolkit for mass spectrometry and proteomics. Nature biotechnology, 2012. 30(10): p. 918-920. [CrossRef]
- Zhou, R., C.-L. Tseng, T. Huan, and L. Li, IsoMS: automated processing of LC-MS data generated by a chemical isotope labeling metabolomics platform. Analytical chemistry, 2014. 86(10): p. 4675-4679. [CrossRef]
- Warrack, B.M., S. Hnatyshyn, K.-H. Ott, M.D. Reily, M. Sanders, H. Zhang, and D.M. Drexler, Normalization strategies for metabonomic analysis of urine samples. Journal of Chromatography B, 2009. 877(5-6): p. 547-552. [CrossRef]
- Cheng, Z. and L. Li, Development of Chemical Isotope Labeling Liquid Chromatography Orbitrap Mass Spectrometry for Comprehensive Analysis of Dipeptides. Analytical Chemistry, 2023. 95(16): p. 6629-6636. [CrossRef]
- Dahabiyeh, L.A., A.K. Malkawi, X. Wang, D. Colak, A.H. Mujamammi, E.M. Sabi, L. Li, M. Dasouki, and A.M. Abdel Rahman, Dexamethasone-induced perturbations in tissue metabolomics revealed by chemical isotope labeling LC-MS analysis. Metabolites, 2020. 10(2): p. 42. [CrossRef]
- Zhao, S., H. Li, W. Han, W. Chan, and L. Li, Metabolomic coverage of chemical-group-submetabolome analysis: group classification and four-channel chemical isotope labeling LC-MS. Analytical Chemistry, 2019. 91(18): p. 12108-12115. [CrossRef]
- Li, L., R. Li, J. Zhou, A. Zuniga, A.E. Stanislaus, Y. Wu, T. Huan, J. Zheng, Y. Shi, and D.S. Wishart, MyCompoundID: using an evidence-based metabolome library for metabolite identification. Analytical chemistry, 2013. 85(6): p. 3401-3408. [CrossRef]
- Bayoumi, S.A., M.G. Rowan, J.R. Beeching, and I.S. Blagbrough, Investigation of biosynthetic pathways to hydroxycoumarins during post-harvest physiological deterioration in cassava roots by using stable isotope labelling. ChemBioChem, 2008. 9(18): p. 3013-3022. [CrossRef]
- Zhao, Y., N. Wang, Z. Sui, C. Huang, Z. Zeng, and L. Kong, The molecular and structural basis of O-methylation reaction in coumarin biosynthesis in Peucedanum praeruptorum Dunn. International Journal of Molecular Sciences, 2019. 20(7): p. 1533. [CrossRef]
- R Core Team, R: A language and environment for statistical computing. Foundation for Statistical Computing, Vienna, Austria, 2024.
- Love, M.I., W. Huber, and S. Anders, Moderated estimation of fold change and dispersion for RNA-seq data with DESeq2. Genome biology, 2014. 15: p. 1-21.
- Wickham, H., ggplot2. Wiley interdisciplinary reviews: computational statistics, 2011. 3(2): p. 180-185.
- Wickham, H., ggplot2: Elegant Graphics for Data Analysis. Springer-Verlag New York, 2016.
- Wickham, H., W. Chang, L. Henry, T.L. Pedersen, K. Takahashi, C. Wilke, K. Woo, H. Yutani, D. Dunnington, and T. van den Brand, Create elegant data visualisations using the grammar of graphics. Version 3.5.1. https://ggplot2.tidyverse.org. 2024, CRAN.
- Yan, L., ggvenn: Draw Venn Diagram by 'ggplot2'. R package version 0.1.10. https://CRAN.R-project.org/package=ggvenn. 2023, CRAN.
- Kolde, R., Pretty Heatmaps. R package version 1.0.12. https://CRAN.R-project.org/package=pheatmap. 2019, CRAN.
- Kassambara, A., rstatix: Pipe-friendly framework for basic statistical tests. R package version 0.7.2. https://CRAN.R-project.org/package=rstatix. 2023, CRAN.
- Youssef, S.A. and K.A. Tartoura, Compost enhances plant resistance against the bacterial wilt pathogen Ralstonia solanacearum via up-regulation of ascorbate-glutathione redox cycle. European Journal of Plant Pathology, 2013. 137: p. 821-834. [CrossRef]
- de Mendiburu, F., Agricolae: Statistical Procedures for Agricultural Research. R package version 1.3-7. https://CRAN.R-project.org/package=agricolae. 2023, CRAN.
- Pang, Z., Y. Lu, G. Zhou, F. Hui, L. Xu, C. Viau, A.F. Spigelman, P.E. MacDonald, D.S. Wishart, and S. Li, MetaboAnalyst 6.0: towards a unified platform for metabolomics data processing, analysis and interpretation. Nucleic Acids Research, 2024: p. gkae253.
- Wobbrock, J.O., L. Findlater, D. Gergle, and J.J. Higgins. The aligned rank transform for nonparametric factorial analyses using only anova procedures. Proceedings of the ACM Conference on Human Factors in Computing Systems (CHI 2011). 2011. Vancouver, British Columbia (May 7-12, 2011) New York: ACM Press, pp. 143-146. [CrossRef]
- Mangiafico, S.S., Aligned Ranks Transformation ANOVA. Summary and Analysis of Extension Program Evaluation in R. New Brunswick (NJ): Rutgers Cooperative Extension, 2016: p. 315-327.
- Kay, M., L.A. Elkin, J.J. Higgins, and J.O. Wobbrock, An aligned rank transform procedure for multifactor contrast tests. R package version 0.11.1. https://github.com/mjskay/ARTool. 2021, CRAN.
- Kay, M. and J.O. Wobbrock, Aligned Rank Transform. Version 0.10.7. https://github.com/mjskay/ARTool. 2020, CRAN.
- Lenth, R.V., emmeans: Estimated marginal means, aka least-squares means. R package version 1.10.4. https://CRAN.R-project.org/package=emmeans. 2024, CRAN.
- Mangiafico, S., rcompanion: Functions to Support Extension Education Program Evaluation. version 2.4. 36. Rutgers Cooperative Extension. New Brunswick, New Jersey. https://CRAN.R-project.org/package=rcompanion. 2024, CRAN.
- Chamoun, R., K.A. Aliferis, and S. Jabaji, Identification of signatory secondary metabolites during mycoparasitism of Rhizoctonia solani by Stachybotrys elegans. Frontiers in microbiology, 2015. 6: p. 138210.
- Moulin, M., C. Deleu, F. Larher, and A. Bouchereau, The lysine-ketoglutarate reductase–saccharopine dehydrogenase is involved in the osmo-induced synthesis of pipecolic acid in rapeseed leaf tissues. Plant Physiology and Biochemistry, 2006. 44(7-9): p. 474-482. [CrossRef]
- Mano, Y. and K. Nemoto, The pathway of auxin biosynthesis in plants. Journal of experimental Botany, 2012. 63(8): p. 2853-2872. [CrossRef]
- Jiang, Z., H. Zhang, P. Jiao, X. Wei, S. Liu, S. Guan, and Y. Ma, The Integration of Metabolomics and Transcriptomics Provides New Insights for the Identification of Genes Key to Auxin Synthesis at Different Growth Stages of Maize. International Journal of Molecular Sciences, 2022. 23(21): p. 13195. [CrossRef]
- Schalk, M., F. Cabello-Hurtado, M.-A.s. Pierrel, R. Atanassova, P. Saindrenan, and D.l. Werck-Reichhart, Piperonylic acid, a selective, mechanism-based inactivator of the trans-cinnamate 4-hydroxylase: a new tool to control the flux of metabolites in the phenylpropanoid pathway. Plant Physiology, 1998. 118(1): p. 209-218.
- da Costa, T.P.S., C.J. Hall, S. Panjikar, J.A. Wyllie, R.M. Christoff, S. Bayat, M.D. Hulett, B.M. Abbott, A.R. Gendall, and M.A. Perugini, Towards novel herbicide modes of action by inhibiting lysine biosynthesis in plants. Elife, 2021. 10: p. e69444.
- Dzierzbicka, K., Synthesis of 2, 6-diaminopimelic acid (DAP) and its analogues. Polish Journal of Chemistry, 2007. 81(4): p. 455-473.
- Dempsey, D.M.A. and D.F. Klessig, SOS–too many signals for systemic acquired resistance? Trends in plant science, 2012. 17(9): p. 538-545.
- Návarová, H., F. Bernsdorff, A.-C. Döring, and J. Zeier, Pipecolic acid, an endogenous mediator of defense amplification and priming, is a critical regulator of inducible plant immunity. The Plant Cell, 2012. 24(12): p. 5123-5141. [CrossRef]
- Vranova, V., L. Lojkova, K. Rejsek, and P. Formanek, Significance of the natural occurrence of L-versus D-pipecolic acid: a review. Chirality, 2013. 25(12): p. 823-831.
- Liu, Y., Y. Li, Y. Bi, Q. Jiang, R. Mao, Z. Liu, Y. Huang, M. Zhang, and D.B. Prusky, Induction of defense response against Alternaria rot in Zaosu pear fruit by exogenous L-lysine through regulating ROS metabolism and activating defense-related proteins. Postharvest Biology and Technology, 2021. 179: p. 111567. [CrossRef]
- Prabhu, B.R. and N.B. Mulchandani, Biosynthesis of piperlongumine. Phytochemistry, 1985. 24(11): p. 2589-2591. [CrossRef]
- Yang, H. and U. Ludewig, Lysine catabolism, amino acid transport, and systemic acquired resistance: what is the link? Plant signaling & behavior, 2014. 9(7): p. e28933.
- Shan, L. and P. He, Pipped at the post: pipecolic acid derivative identified as SAR regulator. Cell, 2018. 173(2): p. 286-287. [CrossRef]
- Nawrath, C. and J.-P. Métraux, Salicylic acid induction–deficient mutants of Arabidopsis express PR-2 and PR-5 and accumulate high levels of camalexin after pathogen inoculation. The Plant Cell, 1999. 11(8): p. 1393-1404.
- El-Shetehy, M., C. Wang, M. Shine, K. Yu, A. Kachroo, and P. Kachroo, Nitric oxide and reactive oxygen species are required for systemic acquired resistance in plants. Plant Signaling & Behavior, 2015. 10(9): p. e998544. [CrossRef]
- Vogel-Adghough, D., E. Stahl, H. Návarová, and J. Zeier, Pipecolic acid enhances resistance to bacterial infection and primes salicylic acid and nicotine accumulation in tobacco. Plant signaling & behavior, 2013. 8(11): p. e26366. [CrossRef]
- Liu, S., L. Xie, J. Su, B. Tian, A. Fang, Y. Yu, C. Bi, and Y. Yang, Integrated metabolo-transcriptomics reveals the defense response of homogentisic acid in wheat against Puccinia striiformis f. sp. tritici. Journal of Agricultural and Food Chemistry, 2022. 70(12): p. 3719-3729. [CrossRef]
- Arruda, P. and P. Barreto, Lysine catabolism through the saccharopine pathway: enzymes and intermediates involved in plant responses to abiotic and biotic stress. Frontiers in plant science, 2020. 11: p. 535796.
- Yang, H., S. Postel, B. Kemmerling, and U. Ludewig, Altered growth and improved resistance of Arabidopsis against Pseudomonas syringae by overexpression of the basic amino acid transporter AtCAT1. Plant, cell & environment, 2014. 37(6): p. 1404-1414.
- Delaney, T.P., S. Uknes, B. Vernooij, L. Friedrich, K. Weymann, D. Negrotto, T. Gaffney, M. Gut-Rella, H. Kessmann, and E. Ward, A central role of salicylic acid in plant disease resistance. Science, 1994. 266(5188): p. 1247-1250. [CrossRef]
- Alazem, M. and N.S. Lin, Roles of plant hormones in the regulation of host–virus interactions. Molecular plant pathology, 2015. 16(5): p. 529-540. [CrossRef]
- Grant, J.J., A. Chini, D. Basu, and G.J. Loake, Targeted activation tagging of the Arabidopsis NBS-LRR gene, ADR1, conveys resistance to virulent pathogens. Molecular Plant-Microbe Interactions, 2003. 16(8): p. 669-680.
- Zhu, X., A. Soliman, M.R. Islam, L.R. Adam, and F. Daayf, Verticillium dahliae’s isochorismatase hydrolase is a virulence factor that contributes to interference with potato’s salicylate and jasmonate defense signaling. Frontiers in Plant Science, 2017. 8: p. 399. [CrossRef]
- Ryals, J.A., U.H. Neuenschwander, M.G. Willits, A. Molina, H.-Y. Steiner, and M.D. Hunt, Systemic acquired resistance. The plant cell, 1996. 8(10): p. 1809.
- Pontier, D., Z.H. Miao, and E. Lam, Trans-dominant suppression of plant TGA factors reveals their negative and positive roles in plant defense responses. The Plant Journal, 2001. 27(6): p. 529-538. [CrossRef]
- Rochon, A., P. Boyle, T. Wignes, P.R. Fobert, and C. Després, The coactivator function of Arabidopsis NPR1 requires the core of its BTB/POZ domain and the oxidation of C-terminal cysteines. The Plant Cell, 2006. 18(12): p. 3670-3685. [CrossRef]
- Cameron, R.K., N.L. Paiva, C.J. Lamb, and R.A. Dixon, Accumulation of salicylic acid and PR-1 gene transcripts in relation to the systemic acquired resistance (SAR) response induced by Pseudomonas syringae pv. tomato in Arabidopsis. Physiological and Molecular Plant Pathology, 1999. 55(2): p. 121-130. [CrossRef]
- Lincoln, J.E., J.P. Sanchez, K. Zumstein, and D.G. Gilchrist, Plant and animal PR1 family members inhibit programmed cell death and suppress bacterial pathogens in plant tissues. Molecular Plant Pathology, 2018. 19(9): p. 2111-2123. [CrossRef]
- Jain, D. and J.P. Khurana, Role of pathogenesis-related (PR) proteins in plant defense mechanism. Molecular aspects of plant-pathogen interaction, 2018: p. 265-281.
- Yi, S.Y., K. Shirasu, J.S. Moon, S.-G. Lee, and S.-Y. Kwon, The activated SA and JA signaling pathways have an influence on flg22-triggered oxidative burst and callose deposition. PloS one, 2014. 9(2): p. e88951. [CrossRef]
- War, A.R., M.G. Paulraj, M.Y. War, and S. Ignacimuthu, Role of salicylic acid in induction of plant defense system in chickpea (Cicer arietinum L.). Plant signaling & behavior, 2011. 6(11): p. 1787-1792. [CrossRef]
- Neuenschwander, U., B. Vernooij, L. Friedrich, S. Uknes, H. Kessmann, and J. Ryals, Is hydrogen peroxide a second messenger of salicylic acid in systemic acquired resistance? The Plant Journal, 1995. 8(2): p. 227-233. [CrossRef]
- Herrera-Vásquez, A., P. Salinas, and L. Holuigue, Salicylic acid and reactive oxygen species interplay in the transcriptional control of defense genes expression. Frontiers in plant science, 2015. 6: p. 171. [CrossRef]
- Kovács, J., P. Poór, Á. Szepesi, and I. Tari, Salicylic acid induced cysteine protease activity during programmed cell death in tomato plants. Acta Biologica Hungarica, 2016. 67(2): p. 148-158. [CrossRef]
- Greenberg, J.T., A. Guo, D.F. Klessig, and F.M. Ausubel, Programmed cell death in plants: a pathogen-triggered response activated coordinately with multiple defense functions. Cell, 1994. 77(4): p. 551-563. [CrossRef]
- Mittler, R., O. Del Pozo, L. Meisel, and E. Lam, Pathogen-induced programmed cell death in plants, a possible defense mechanism. Developmental genetics, 1997. 21(4): p. 279-289.
- Garattini, E., R. Mendel, M.J. Romão, R. Wright, and M. Terao, Mammalian molybdo-flavoenzymes, an expanding family of proteins: structure, genetics, regulation, function and pathophysiology. Biochemical Journal, 2003. 372(1): p. 15-32. [CrossRef]
- Bellés, J.M., R. Garro, J. Fayos, P. Navarro, J. Primo, and V. Conejero, Gentisic acid as a pathogen-inducible signal, additional to salicylic acid for activation of plant defenses in tomato. Molecular Plant-Microbe Interactions, 1999. 12(3): p. 227-235. [CrossRef]
- Campos, L., P. Granell, S. Tárraga, P. López-Gresa, V. Conejero, J.M. Bellés, I. Rodrigo, and P. Lisón, Salicylic acid and gentisic acid induce RNA silencing-related genes and plant resistance to RNA pathogens. Plant physiology and biochemistry, 2014. 77: p. 35-43. [CrossRef]
- Bellés, J.M., R. Garro, V. Pallás, J. Fayos, I. Rodrigo, and V. Conejero, Accumulation of gentisic acid as associated with systemic infections but not with the hypersensitive response in plant-pathogen interactions. Planta, 2006. 223: p. 500-511. [CrossRef]
- Yalpani, N., J. León, M.A. Lawton, and I. Raskin, Pathway of salicylic acid biosynthesis in healthy and virus-inoculated tobacco. Plant physiology, 1993. 103(2): p. 315-321. [CrossRef]
- Agerbirk, N. and C.E. Olsen, Glucosinolate hydrolysis products in the crucifer Barbarea vulgaris include a thiazolidine-2-one from a specific phenolic isomer as well as oxazolidine-2-thiones. Phytochemistry, 2015. 115: p. 143-151. [CrossRef]
- Brader, G., M.D. Mikkelsen, B.A. Halkier, and E. Tapio Palva, Altering glucosinolate profiles modulates disease resistance in plants. The Plant Journal, 2006. 46(5): p. 758-767. [CrossRef]
- Rodrigues, A.S. and E.A.S. Rosa, Effect of post-harvest treatments on the level of glucosinolates in broccoli. Journal of the Science of Food and Agriculture, 1999. 79(7): p. 1028-1032. [CrossRef]
- Sanchez-Vallet, A., B. Ramos, P. Bednarek, G. López, M. Piślewska-Bednarek, P. Schulze-Lefert, and A. Molina, Tryptophan-derived secondary metabolites in Arabidopsis thaliana confer non-host resistance to necrotrophic Plectosphaerella cucumerina fungi. The Plant Journal, 2010. 63(1): p. 115-127. [CrossRef]
- Smolinska, U., G. Knudsen, M. Morra, and V. Borek, Inhibition of Aphanomyces euteiches f. sp. pisi by volatiles produced by hydrolysis of Brassica napus seed meal. Plant disease, 1997. 81(3): p. 288-292.
- Van Eylen, D., N. Bellostas, B.W. Strobel, I. Oey, M. Hendrickx, A. Van Loey, H. Sørensen, and J.C. Sørensen, Influence of pressure/temperature treatments on glucosinolate conversion in broccoli (Brassica oleraceae L. cv Italica) heads. Food Chemistry, 2009. 112(3): p. 646-653. [CrossRef]
- Fahey, J.W., A.T. Zalcmann, and P. Talalay, The chemical diversity and distribution of glucosinolates and isothiocyanates among plants. Phytochemistry, 2001. 56(1): p. 5-51. [CrossRef]
- Singh, A., D. Guest, and L. Copeland, Associations Between Glucosinolates, White Rust, and Plant Defense Activators inBrassicaPlants: A Review. International Journal of Vegetable Science, 2014. 21(3): p. 297-313.
- Zhai, K., D. Liang, H. Li, F. Jiao, B. Yan, J. Liu, Z. Lei, L. Huang, X. Gong, and X. Wang, NLRs guard metabolism to coordinate pattern-and effector-triggered immunity. Nature, 2022. 601(7892): p. 245-251. [CrossRef]
- Escaray, F., A. Felipo-Benavent, and P. Vera, Linking plant metabolism and immunity through methionine biosynthesis. Molecular Plant, 2022. 15(1): p. 6-8. [CrossRef]
- Yan, X., L. Ma, H. Pang, P. Wang, L. Liu, Y. Cheng, J. Cheng, Y. Guo, and Q. Li, METHIONINE SYNTHASE1 is involved in chromatin silencing by maintaining DNA and histone methylation. Plant physiology, 2019. 181(1): p. 249-261. [CrossRef]
- Mäkinen, K. and S. De, The significance of methionine cycle enzymes in plant virus infections. Current opinion in plant biology, 2019. 50: p. 67-75. [CrossRef]
- Byeon, Y., H.J. Lee, H.Y. Lee, and K. Back, Cloning and functional characterization of the Arabidopsis N-acetylserotonin O-methyltransferase responsible for melatonin synthesis. J Pineal Res, 2016. 60(1): p. 65-73.
- Byeon, Y., G.H. Choi, H.Y. Lee, and K. Back, Melatonin biosynthesis requires N-acetylserotonin methyltransferase activity of caffeic acid O-methyltransferase in rice. J Exp Bot, 2015. 66(21): p. 6917-25. [CrossRef]
- Wei, Y., G. Liu, Y. Bai, F. Xia, C. He, H. Shi, and C. Foyer, Two transcriptional activators of N-acetylserotonin O-methyltransferase 2 and melatonin biosynthesis in cassava. J Exp Bot, 2017. 68(17): p. 4997-5006. [CrossRef]
- Kang, K., K. Lee, S. Park, Y.S. Kim, and K. Back, Enhanced production of melatonin by ectopic overexpression of human serotonin N-acetyltransferase plays a role in cold resistance in transgenic rice seedlings. J Pineal Res, 2010. 49(2): p. 176-82. [CrossRef]
- Zhou, W., Y. Wang, B. Li, L. Petijova, S. Hu, Q. Zhang, J. Niu, D. Wang, S. Wang, Y. Dong, E. Cellarova, and Z. Wang, Whole-genome sequence data of Hypericum perforatum and functional characterization of melatonin biosynthesis by N-acetylserotonin O-methyltransferase. J Pineal Res, 2021. 70(2): p. e12709. [CrossRef]
- Wang, L., C. Feng, X. Zheng, Y. Guo, F. Zhou, D. Shan, X. Liu, and J. Kong, Plant mitochondria synthesize melatonin and enhance the tolerance of plants to drought stress. J Pineal Res, 2017. 63(3). [CrossRef]
- Zheng, X., D.X. Tan, A.C. Allan, B. Zuo, Y. Zhao, R.J. Reiter, L. Wang, Z. Wang, Y. Guo, J. Zhou, D. Shan, Q. Li, Z. Han, and J. Kong, Chloroplastic biosynthesis of melatonin and its involvement in protection of plants from salt stress. Sci Rep, 2017. 7: p. 41236. [CrossRef]
- Zhu, Y., M.J. Guo, J.B. Song, S.Y. Zhang, R. Guo, D.R. Hou, C.Y. Hao, H.L. An, and X. Huang, Roles of Endogenous Melatonin in Resistance to Botrytis cinerea Infection in an Arabidopsis Model. Front Plant Sci, 2021. 12: p. 683228. [CrossRef]
- Zhou, K., Y. Li, L. Hu, J. Zhang, H. Yue, S. Yang, Y. Liu, X. Gong, and F. Ma, Overexpression of MdASMT9, an N-acetylserotonin methyltransferase gene, increases melatonin biosynthesis and improves water-use efficiency in transgenic apple. Tree Physiol, 2022. 42(5): p. 1114-1126. [CrossRef]
- Lee, H.Y., Y. Byeon, and K. Back, Melatonin as a signal molecule triggering defense responses against pathogen attack in Arabidopsis and tobacco. J Pineal Res, 2014. 57(3): p. 262-8. [CrossRef]
- Kong, M., T. Sheng, J. Liang, Q. Ali, Q. Gu, H. Wu, J. Chen, J. Liu, and X. Gao, Melatonin and Its Homologs Induce Immune Responses via Receptors trP47363-trP13076 in Nicotiana benthamiana. Front Plant Sci, 2021. 12: p. 691835. [CrossRef]
- Li, M., X. Zhang, J. Li, M. Ali, Y. Wang, X. Liu, F. Li, and X. Li, GABA primes defense responses against Botrytis cinerea in tomato fruit by modulating ethylene and JA signaling pathways. Postharvest Biology and Technology, 2024. 208: p. 112665. [CrossRef]
- Xuan Phong, H., Q. Le Viet, L. Minh Chau, D. Long, H. Bui, N.N. Thanh, D. Tan Phat, and L.D. Truong, Isolation and selection of lactic acid bacteria with the capacity of producing γ-aminobutyric acid (GABA) and antimicrobial activity: Its application in fermented meat product. Current Nutrition & Food Science, 2023. 19(8): p. 831-837. [CrossRef]
- Guo, Z., J. Lv, X. Dong, N. Du, and F. Piao, Gamma-aminobutyric acid improves phenanthrene phytotoxicity tolerance in cucumber through the glutathione-dependent system of antioxidant defense. Ecotoxicology and environmental safety, 2021. 217: p. 112254. [CrossRef]
- Hijaz, F., Y. Nehela, and N. Killiny, Application of gamma-aminobutyric acid increased the level of phytohormones in Citrus sinensis. Planta, 2018. 248: p. 909-918. [CrossRef]
- Ghosh, S., P. Kanwar, and G. Jha, Alterations in rice chloroplast integrity, photosynthesis and metabolome associated with pathogenesis of Rhizoctonia solani. Scientific reports, 2017. 7(1): p. 1-12. [CrossRef]
- Deng, X., X. Xu, Y. Liu, Y. Zhang, L. Yang, S. Zhang, and J. Xu, Induction of γ-aminobutyric acid plays a positive role to Arabidopsis resistance against Pseudomonas syringae. Journal of integrative plant biology, 2020. 62(11): p. 1797-1812.
- Rani, M. and G. Jha, Host gamma-aminobutyric acid metabolic pathway is involved in resistance against Rhizoctonia solani. Phytopathology®, 2021. 111(7): p. 1207-1218. [CrossRef]
- Meher, H.C., V.T. Gajbhiye, and G. Singh, Salicylic acid-induced glutathione status in tomato crop and resistance to root-knot nematode, Meloidogyne incognita (Kofoid & White) Chitwood. Journal of xenobiotics, 2011. 1(1): p. e5. [CrossRef]
- Meher, H.C., V.T. Gajbhiye, G. Singh, and G. Chawla, Altered metabolomic profile of selected metabolites and improved resistance of Cicer arietinum (L.) against Meloidogyne incognita (Kofoid & White) Chitwood following seed soaking with salicylic acid, benzothiadiazole or nicotinic acid. Acta Physiologiae Plantarum, 2015. 37: p. 1-12. [CrossRef]
- Cui, W., P. Yao, J. Pan, C. Dai, H. Cao, Z. Chen, S. Zhang, S. Xu, and W. Shen, Transcriptome analysis reveals insight into molecular hydrogen-induced cadmium tolerance in alfalfa: The prominent role of sulfur and (homo) glutathione metabolism. BMC plant Biology, 2020. 20(1): p. 1-19. [CrossRef]
- Gullner, G., T. Komives, L. Király, and P. Schröder, Glutathione S-transferase enzymes in plant-pathogen interactions. Frontiers in plant science, 2018. 9: p. 1836. [CrossRef]
- Hiruma, K., S. Fukunaga, P. Bednarek, M. Piślewska-Bednarek, S. Watanabe, Y. Narusaka, K. Shirasu, and Y. Takano, Glutathione and tryptophan metabolism are required for Arabidopsis immunity during the hypersensitive response to hemibiotrophs. Proceedings of the National Academy of Sciences, 2013. 110(23): p. 9589-9594. [CrossRef]
- Liu, X., S. Zhang, R.J. Whitworth, J.J. Stuart, and M.-S. Chen, Unbalanced activation of glutathione metabolic pathways suggests potential involvement in plant defense against the gall midge Mayetiola destructor in wheat. Scientific Reports, 2015. 5(1): p. 8092. [CrossRef]
- Chen, Y.-P., L.-P. Xing, G.-J. Wu, H.-Z. Wang, X.-E. Wang, A.-Z. Cao, and P.-D. Chen, Plastidial glutathione reductase from Haynaldia villosa is an enhancer of powdery mildew resistance in wheat (Triticum aestivum). Plant and cell physiology, 2007. 48(12): p. 1702-1712. [CrossRef]
- Sova, M., Antioxidant and antimicrobial activities of cinnamic acid derivatives. Mini reviews in medicinal chemistry, 2012. 12(8): p. 749-767. [CrossRef]
- Muroi, A., A. Ishihara, C. Tanaka, A. Ishizuka, J. Takabayashi, H. Miyoshi, and T. Nishioka, Accumulation of hydroxycinnamic acid amides induced by pathogen infection and identification of agmatine coumaroyltransferase in Arabidopsis thaliana. Planta, 2009. 230: p. 517-527. [CrossRef]
- Guo, M., C. Li, R. Huang, L. Qu, J. Liu, C. Zhang, and Y. Ge, Ferulic acid enhanced resistance against blue mold of Malus domestica by regulating reactive oxygen species and phenylpropanoid metabolism. Postharvest Biology and Technology, 2023. 202: p. 112378. [CrossRef]
- Gozzo, F., Systemic acquired resistance in crop protection: from nature to a chemical approach. Journal of Agricultural and Food Chemistry, 2003. 51(16): p. 4487-4503. [CrossRef]
- Huang, G.-Y., C. Cui, Z.-P. Wang, Y.-Q. Li, L.-X. Xiong, L.-Z. Wang, S.-J. Yu, Z.-M. Li, and W.-G. Zhao, Synthesis and characteristics of (Hydrogenated) ferulic acid derivatives as potential antiviral agents with insecticidal activity. Chemistry Central Journal, 2013. 7(1): p. 1-12. [CrossRef]
- Wu, Z., J. Zhang, J. Chen, J. Pan, L. Zhao, D. Liu, A. Zhang, J. Chen, D. Hu, and B. Song, Design, synthesis, antiviral bioactivity and three-dimensional quantitative structure–activity relationship study of novel ferulic acid ester derivatives containing quinazoline moiety. Pest management science, 2017. 73(10): p. 2079-2089.
- Kwon, Y.-S., A. Kobayashi, S.-I. Kajiyama, K. Kawazu, H. Kanzaki, and C.-M. Kim, Antimicrobial constituents of Angelica dahurica roots. Phytochemistry, 1997. 44(5): p. 887-889. [CrossRef]
- Fang, L., B. Kraus, J. Lehmann, J. Heilmann, Y. Zhang, and M. Decker, Design and synthesis of tacrine–ferulic acid hybrids as multi-potent anti-Alzheimer drug candidates. Bioorganic & medicinal chemistry letters, 2008. 18(9): p. 2905-2909. [CrossRef]
- He, F., P. Wei, G. Yu, S. Guo, Z. Zheng, S. Chen, A. Dai, R. Zhang, Z. Wu, and J. Wu, Synthesis of trans-methyl ferulate bearing an oxadiazole ether as potential activators for controlling plant virus. Bioorganic Chemistry, 2021. 115: p. 105248. [CrossRef]
- Gan, X., D. Hu, Y. Wang, L. Yu, and B. Song, Novel trans-ferulic acid derivatives containing a chalcone moiety as potential activator for plant resistance induction. Journal of Agricultural and Food Chemistry, 2017. 65(22): p. 4367-4377. [CrossRef]
- Zhao, X., P. Li, X. Liu, T. Xu, Y. Zhang, H. Meng, and T. Xia, High temperature increased lignin contents of poplar (Populus spp) stem via inducing the synthesis caffeate and coniferaldehyde. 2021.
- Tang, Y., Z. Zhang, Y. Lei, G. Hu, J. Liu, M. Hao, A. Chen, Q. Peng, and J. Wu, Cotton WATs modulate SA biosynthesis and local lignin deposition participating in plant resistance against Verticillium dahliae. Frontiers in Plant Science, 2019. 10: p. 526. [CrossRef]
- Wang, J.-Z., C.-H. Yan, X.-R. Zhang, Q.-B. Tu, Y. Xu, S. Sheng, F.-A. Wu, and J. Wang, A novel nanoparticle loaded with methyl caffeate and caffeic acid phenethyl ester against Ralstonia solanacearum—a plant pathogenic bacteria. RSC advances, 2020. 10(7): p. 3978-3990. [CrossRef]
- Vogt, T., Phenylpropanoid biosynthesis. Molecular plant, 2010. 3(1): p. 2-20.
- McCalla, D. and A. Neish, Metabolism of phenylpropanoid compounds in Salvia: II. Biosynthesis of phenolic cinnamic acids. Canadian Journal of Biochemistry and Physiology, 1959. 37(4): p. 537-547.
- Dixon, R.A., L. Achnine, P. Kota, C.J. Liu, M.S. Reddy, and L. Wang, The phenylpropanoid pathway and plant defence—a genomics perspective. Molecular plant pathology, 2002. 3(5): p. 371-390. [CrossRef]
- Denancé, N., P. Ranocha, N. Oria, X. Barlet, M.P. Rivière, K.A. Yadeta, L. Hoffmann, F. Perreau, G. Clément, and A. Maia-Grondard, Arabidopsis wat1 (walls are thin1)-mediated resistance to the bacterial vascular pathogen, Ralstonia solanacearum, is accompanied by cross-regulation of salicylic acid and tryptophan metabolism. The Plant Journal, 2013. 73(2): p. 225-239.
- Wiklund, P. and J. Bergman, The chemistry of anthranilic acid. Current Organic Synthesis, 2006. 3(3): p. 379-402.
- Winter, A., A hypothetical route for the biogenisis of IAA. Planta, 1966. 71: p. 229-239. [CrossRef]
- Doyle, S.M., A. Rigal, P. Grones, M. Karady, D.K. Barange, M. Majda, B. Parizkova, M. Karampelias, M. Zwiewka, A. Pencik, F. Almqvist, K. Ljung, O. Novak, and S. Robert, A role for the auxin precursor anthranilic acid in root gravitropism via regulation of PIN-FORMED protein polarity and relocalisation in Arabidopsis. New Phytol, 2019. 223(3): p. 1420-1432. [CrossRef]
- Yang, S.Y., M.R. Park, I.S. Kim, Y.C. Kim, J.W. Yang, and C.-M. Ryu, 2-Aminobenzoic acid of Bacillus sp. BS107 as an ISR determinant against Pectobacterium carotovorum subsp. carotovotrum SCC1 in tobacco. European Journal of Plant Pathology, 2011. 129: p. 371-378. [CrossRef]
- Hossain, M., M. Hossain, R. Islam, A. Alam, K. Zahan, S. Sarkar, and M. Farooque, Antimicrobial and cytotoxic activities of 2-aminobenzoic acid and 2-aminophenol and their coordination complexes with Magnesium (Mg-II). Pak J Biol Sci, 2004. 7(1): p. 25-27. [CrossRef]
- Zhang, Z., X. Bi, X. Du, H. Liu, T. An, Y. Zhao, H. Yu, Y. Chen, and J. Wen, Comparative metabolomics reveal the participation of soybean unique rhizosphere metabolites in susceptibility and resistance of host soybean to Phytophthora sojae. Plant and Soil, 2022: p. 1-15.
- Iriti, M. and F. Faoro, Benzothiadiazole (BTH) induces cell-death independent resistance in Phaseolus vulgaris against Uromyces appendiculatus. Journal of Phytopathology, 2003. 151(3): p. 171-180. [CrossRef]
- Iriti, M., M. Rossoni, M. Borgo, and F. Faoro, Benzothiadiazole enhances resveratrol and anthocyanin biosynthesis in grapevine, meanwhile improving resistance to Botrytis cinerea. Journal of agricultural and food chemistry, 2004. 52(14): p. 4406-4413. [CrossRef]
- Takahashi, Y., The role of polyamines in plant disease resistance. Environmental Control in Biology, 2016. 54(1): p. 17-21. [CrossRef]
- Kusano, T., K. Yamaguchi, T. Berberich, and Y. Takahashi, Advances in polyamine research in 2007. Journal of plant research, 2007. 120: p. 345-350.
- Takahashi, Y., T. Berberich, K. Yamashita, Y. Uehara, A. Miyazaki, and T. Kusano, Identification of tobacco HIN1 and two closely related genes as spermine-responsive genes and their differential expression during the Tobacco mosaic virus-induced hypersensitive response and during leaf-and flower-senescence. Plant molecular biology, 2004. 54: p. 613-622. [CrossRef]
- Yamakawa, H., H. Kamada, M. Satoh, and Y. Ohashi, Spermine is a salicylate-independent endogenous inducer for both tobacco acidic pathogenesis-related proteins and resistance against tobacco mosaic virus infection. Plant Physiology, 1998. 118(4): p. 1213-1222. [CrossRef]
- da Graça, J.P., T.E. Ueda, T. Janegitz, S.S. Vieira, M.C. Salvador, M.C. de Oliveira, S.M. Zingaretti, S.J. Powers, J.A. Pickett, and M.A. Birkett, The natural plant stress elicitor cis-jasmone causes cultivar-dependent reduction in growth of the stink bug, Euschistus heros and associated changes in flavonoid concentrations in soybean, Glycine max. Phytochemistry, 2016. 131: p. 84-91. [CrossRef]
- Stevenson, P., H. Turner, and M. Haware, Phytoalexin accumulation in the roots of chickpea (Cicer arietinumL.) seedlings associated with resistance to fusarium wilt (Fusarium oxysporumf. sp. ciceri). Physiological and Molecular Plant Pathology, 1997. 50(3): p. 167-178. [CrossRef]
- Gupta, A., P. Awasthi, N. Sharma, S. Parveen, R.P. Vats, N. Singh, Y. Kumar, A. Goel, and D. Chandran, Medicarpin confers powdery mildew resistance in Medicago truncatula and activates the salicylic acid signalling pathway. Molecular Plant Pathology, 2022. 23(7): p. 966-983. [CrossRef]
- Kumar, R.S., M. Moydeen, S.S. Al-Deyab, A. Manilal, and A. Idhayadhulla, Synthesis of new morpholine-connected pyrazolidine derivatives and their antimicrobial, antioxidant, and cytotoxic activities. Bioorganic & Medicinal Chemistry Letters, 2017. 27(1): p. 66-71.
- Jyotshna, P. Khare, and K. Shanker, Mangiferin: A review of sources and interventions for biological activities. Biofactors, 2016. 42(5): p. 504-514. [CrossRef]
- Ghosal, S., K. Biswas, D.K. Chakrabarti, and K. Basu Chaudhary, Control of Fusarium wilt of safflower by mangiferin. Phytopathology, 1977. 67(4): p. 548-550.
- Gao, X., K. Li, Z. Ma, H. Zou, H. Jin, and J. Wang, Cucumber Fusarium wilt resistance induced by intercropping with celery differs from that induced by the cucumber genotype and is related to sulfur-containing allelochemicals. Scientia Horticulturae, 2020. 271: p. 109475. [CrossRef]
- Godard, S., I. Slacanin, O. Viret, and K. Gindro, Induction of defence mechanisms in grapevine leaves by emodin-and anthraquinone-rich plant extracts and their conferred resistance to downy mildew. Plant Physiology and Biochemistry, 2009. 47(9): p. 827-837. [CrossRef]
- Zhao, Y., G. Han, Y. Li, and H. Lv, Changes in quality characteristics and metabolites composition of wheat under different storage temperatures. Journal of Stored Products Research, 2024. 105: p. 102229. [CrossRef]
- Li, X., J. Zhang, S. Lin, Y. Xing, X. Zhang, M. Ye, Y. Chang, H. Guo, and X. Sun, (+)-Catechin, epicatechin and epigallocatechin gallate are important inducible defensive compounds against Ectropis grisescens in tea plants. Plant, Cell & Environment, 2022. 45(2): p. 496-511. [CrossRef]
- Piispanen, J., U. Bergmann, J. Karhu, T. Kauppila, and J. Kaitera, Variation of compounds in leaves of susceptible and resistant alternate hosts of Cronartium pini and C. ribicola. European Journal of Plant Pathology, 2023: p. 1-16.
- Jo, J., J. Lee, Y. Ahn, Y.S. Hwang, J. Park, J. Lee, and J. Choi, Metabolome and transcriptome analyses of plants grown in naturally attenuated soil after hydrogen fluoride exposure. Journal of Hazardous Materials, 2022. 437: p. 129323. [CrossRef]
- Wu, H., L. Wu, J. Wang, Q. Zhu, S. Lin, J. Xu, C. Zheng, J. Chen, X. Qin, and C. Fang, Mixed phenolic acids mediated proliferation of pathogens Talaromyces helicus and Kosakonia sacchari in continuously monocultured Radix pseudostellariae rhizosphere soil. Frontiers in Microbiology, 2016. 7: p. 335. [CrossRef]
- Schoch, G.A., G.N. Nikov, W.L. Alworth, and D. Werck-Reichhart, Chemical inactivation of the cinnamate 4-hydroxylase allows for the accumulation of salicylic acid in elicited cells. Plant physiology, 2002. 130(2): p. 1022-1031. [CrossRef]
- Desmedt, W., W. Jonckheere, V.H. Nguyen, M. Ameye, N. De Zutter, K. De Kock, J. Debode, T. Van Leeuwen, K. Audenaert, and B. Vanholme, The phenylpropanoid pathway inhibitor piperonylic acid induces broad-spectrum pest and disease resistance in plants. Plant, Cell & Environment, 2021. 44(9): p. 3122-3139. [CrossRef]
Figure 1.
The number of differentially up- (A & C) and down- (B & D) accumulated metabolites (DAMs) in inoculated (I) and control (C) samples of Topas (T) and Topas-Rlm1 (R) collected at 3, 7 and 11 days after inoculation (dai). RIvsRC_3D represents the number of DAMs between inoculated and control Topas-Rlm1 samples collected at 3 dpi. Similarly, TIvsTC_11D shows inoculated and control Topas collected at 11 dai, and so on.
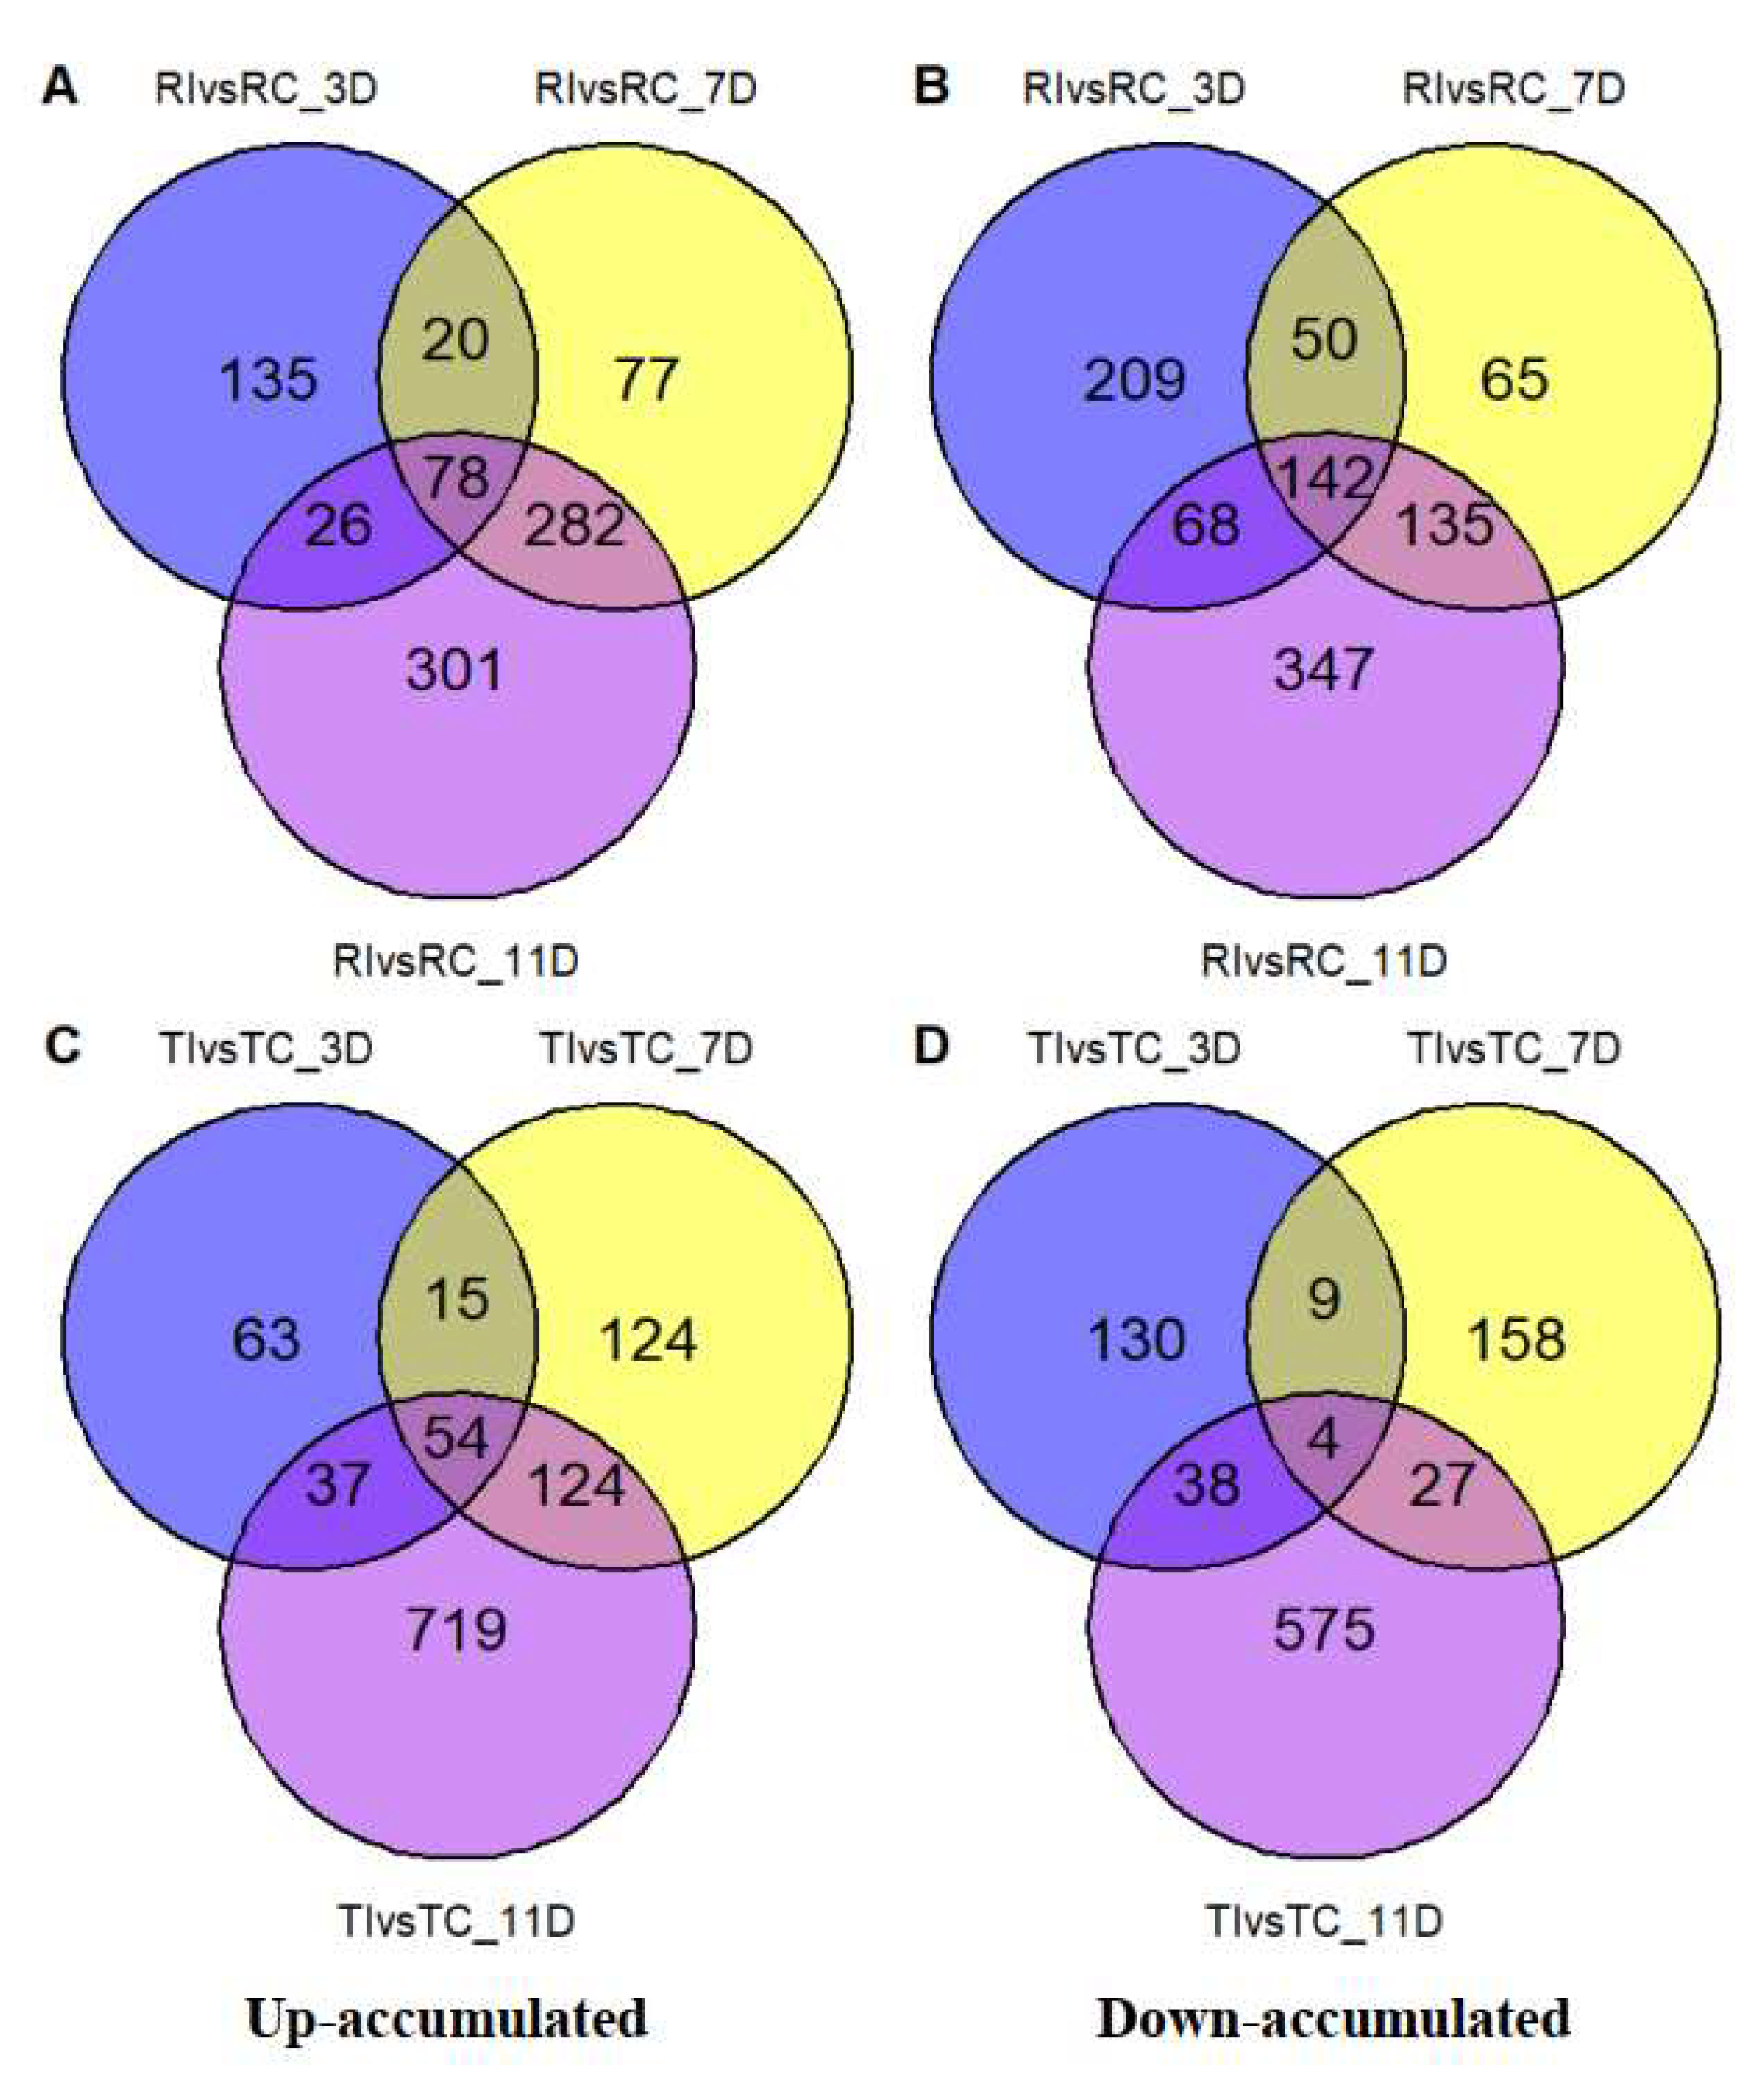
Figure 2.
The number of significantly up- (A, C & E) and down-regulated (B, D & F) DAMs among samples of treatments collected at at 3, 7 and 11 dai.
Figure 2.
The number of significantly up- (A, C & E) and down-regulated (B, D & F) DAMs among samples of treatments collected at at 3, 7 and 11 dai.
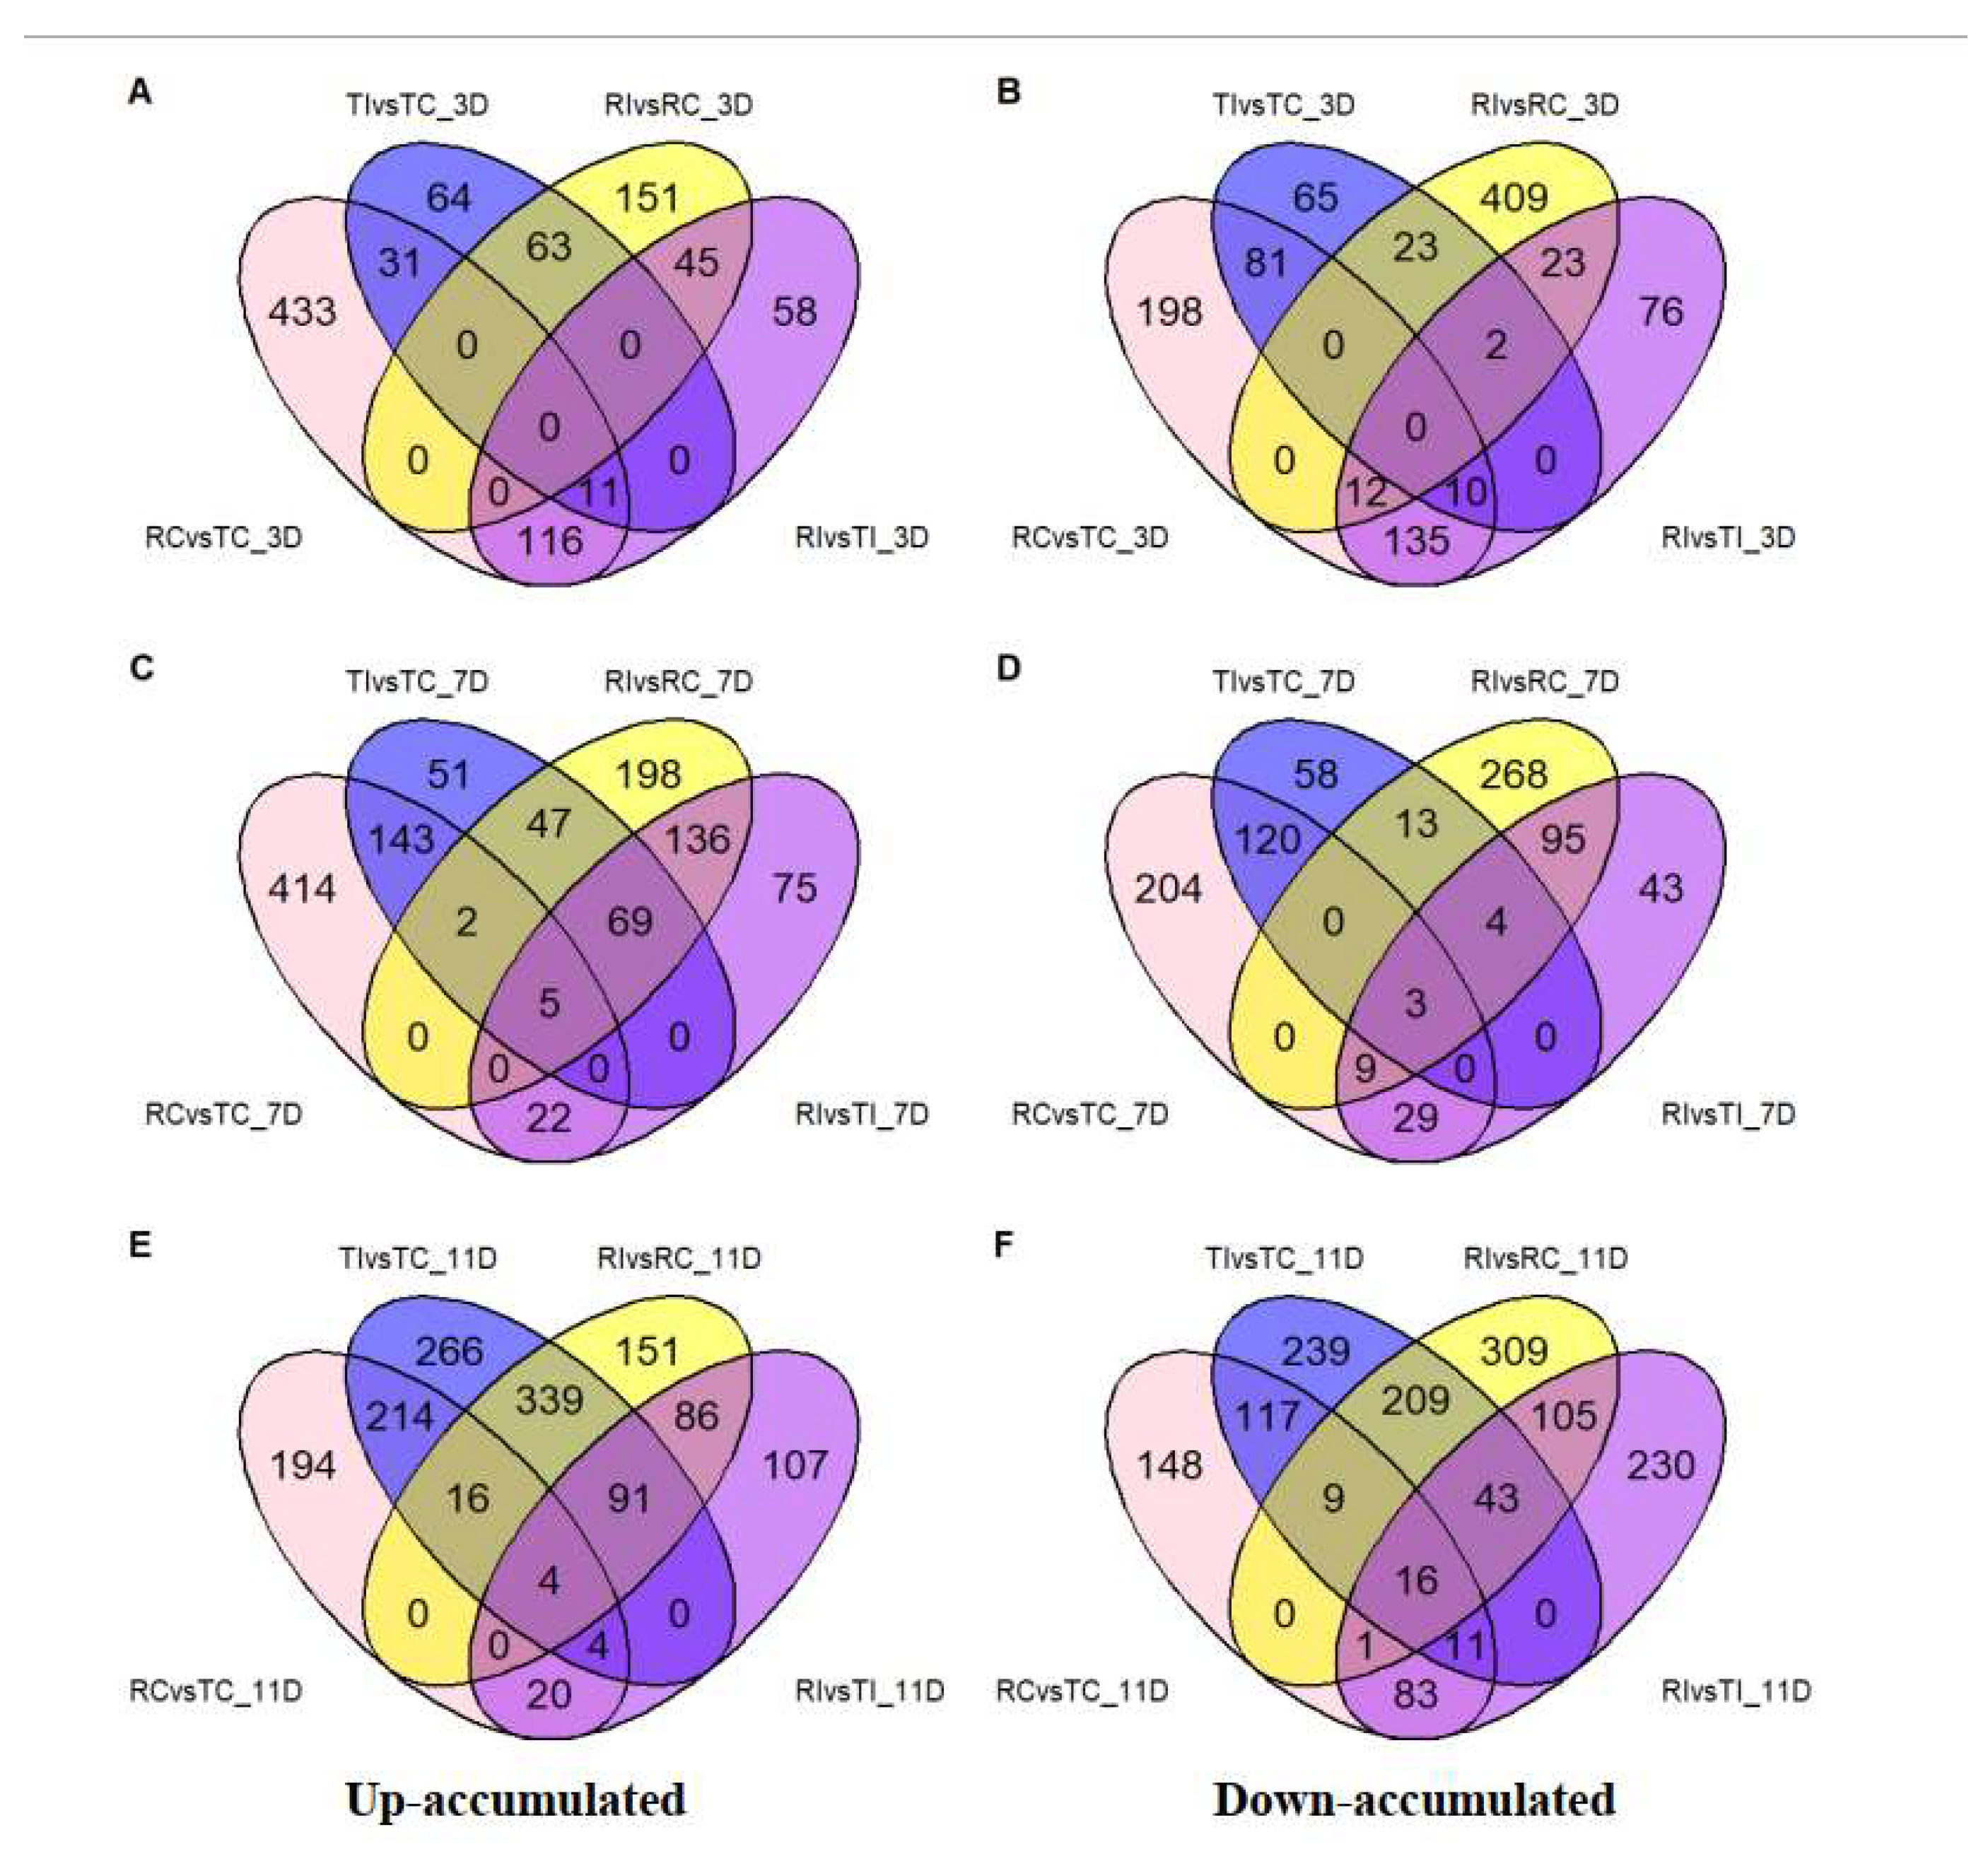
Figure 3.
Heatmap clustering analysis of Topas-Rlm1 and Topas at different stages of infection over A) all metabolites and B) differentially accumulated metabolites (DAMs). Red and blue colors in scale bars represent up- and down-regulated metabolomes, respectively. Red arrows point to the clusters with significantly higher or suppressed accumulation in later stages of infection (7 and/or 11 dai). Treatment names are consistent with those in Figure 1.
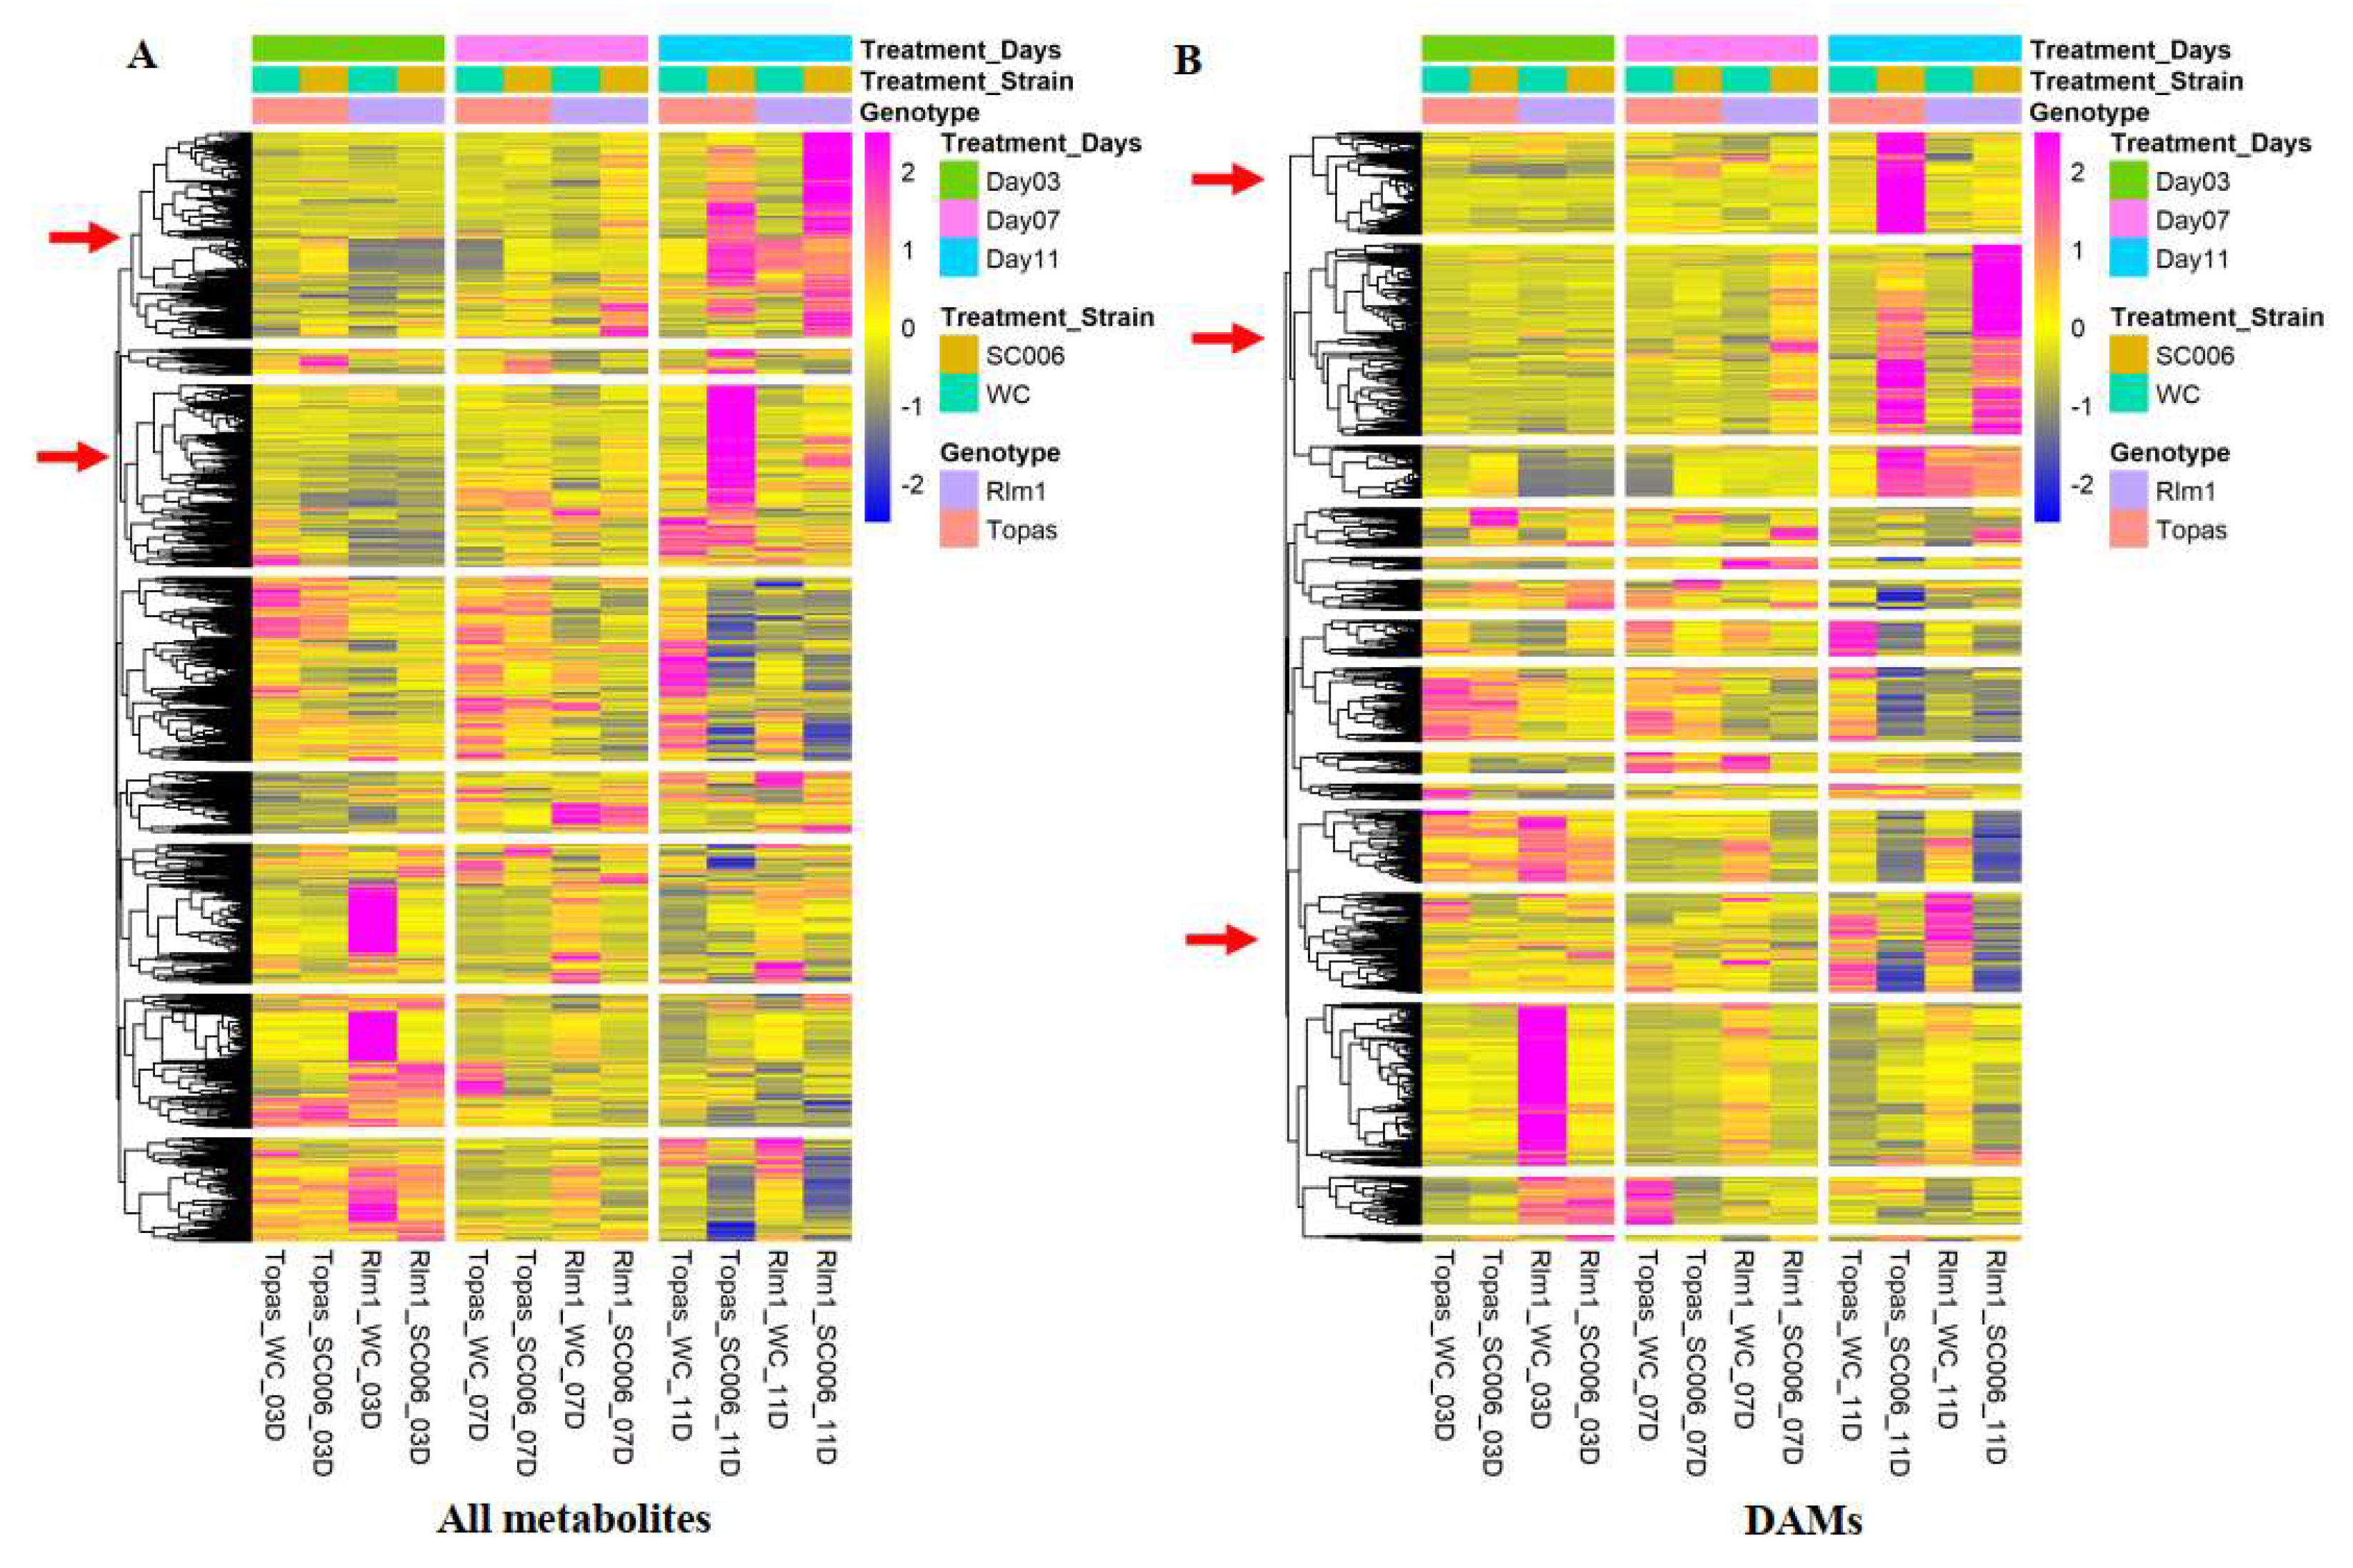
Figure 4.
Differentially accumulated metabolites associated with Rlm1-mediated resistance that are involved in: A) Degradation of lysine (Lys). B-F) biosynthesis of Lys, anthocyanin (ACN), glucosinolate (GSLs), scopoletin/isoscp (Scop/IsoScop) and melatonin (Mel). G, H) metabolism of nicotinate-nicotinamide (NaN) and γ-aminobutyric acid (GABA). I, J) defense-related isoflavonoids (Isoflav) and hormones. K) and antimicrobial/plant-defense responses. L) Biosynthesis of tropane (Trop), piperidine (Pid) and pyridine alkaloid. M) Biosynthesis of phenylalanine (Phe), tyrosine (Tyr) and tryptophan (Trp). N, O) Metabolism of Trp, taurine (Tau)/hypotaurine (HTau). P) other amino acids and their derivatives. Q) Metabolism of Phe. R) the glutamate family. S) response to abiotic stress. Red and blue colors represent up- and down-regulated DAMs, respectively, while grey color indicates no changes from controls. Treatment names are consistent with those designated in Figure 1.
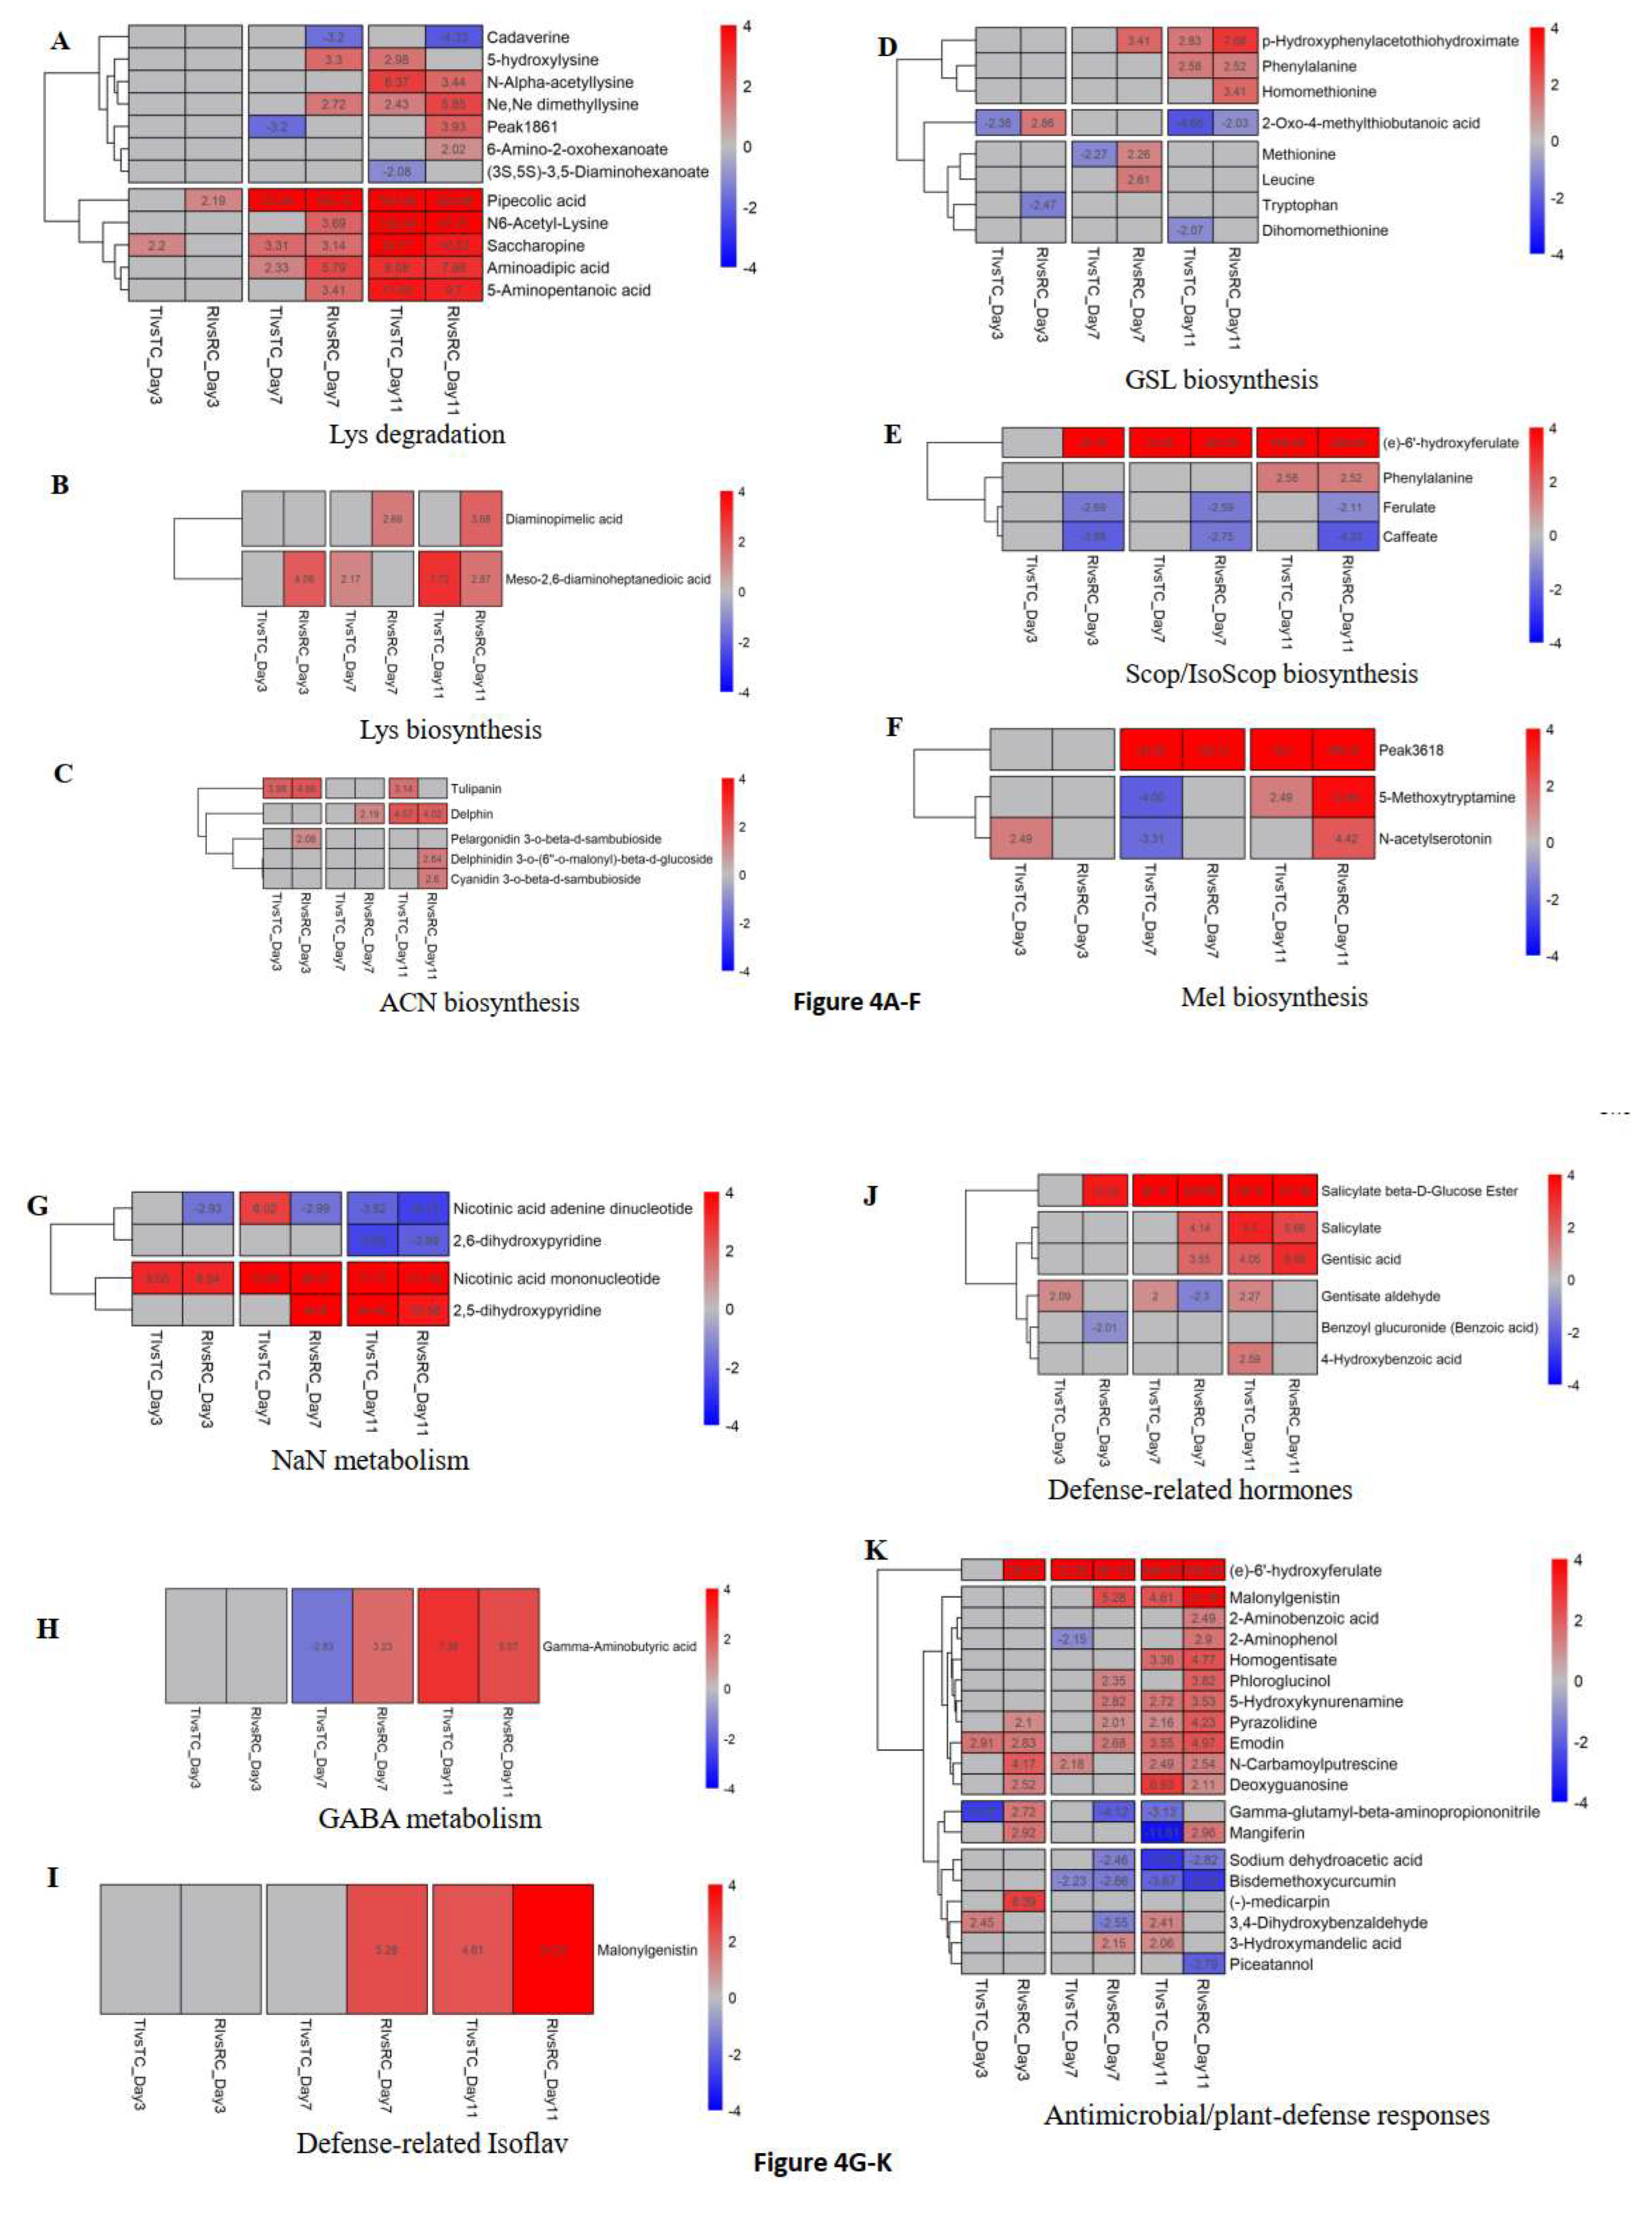
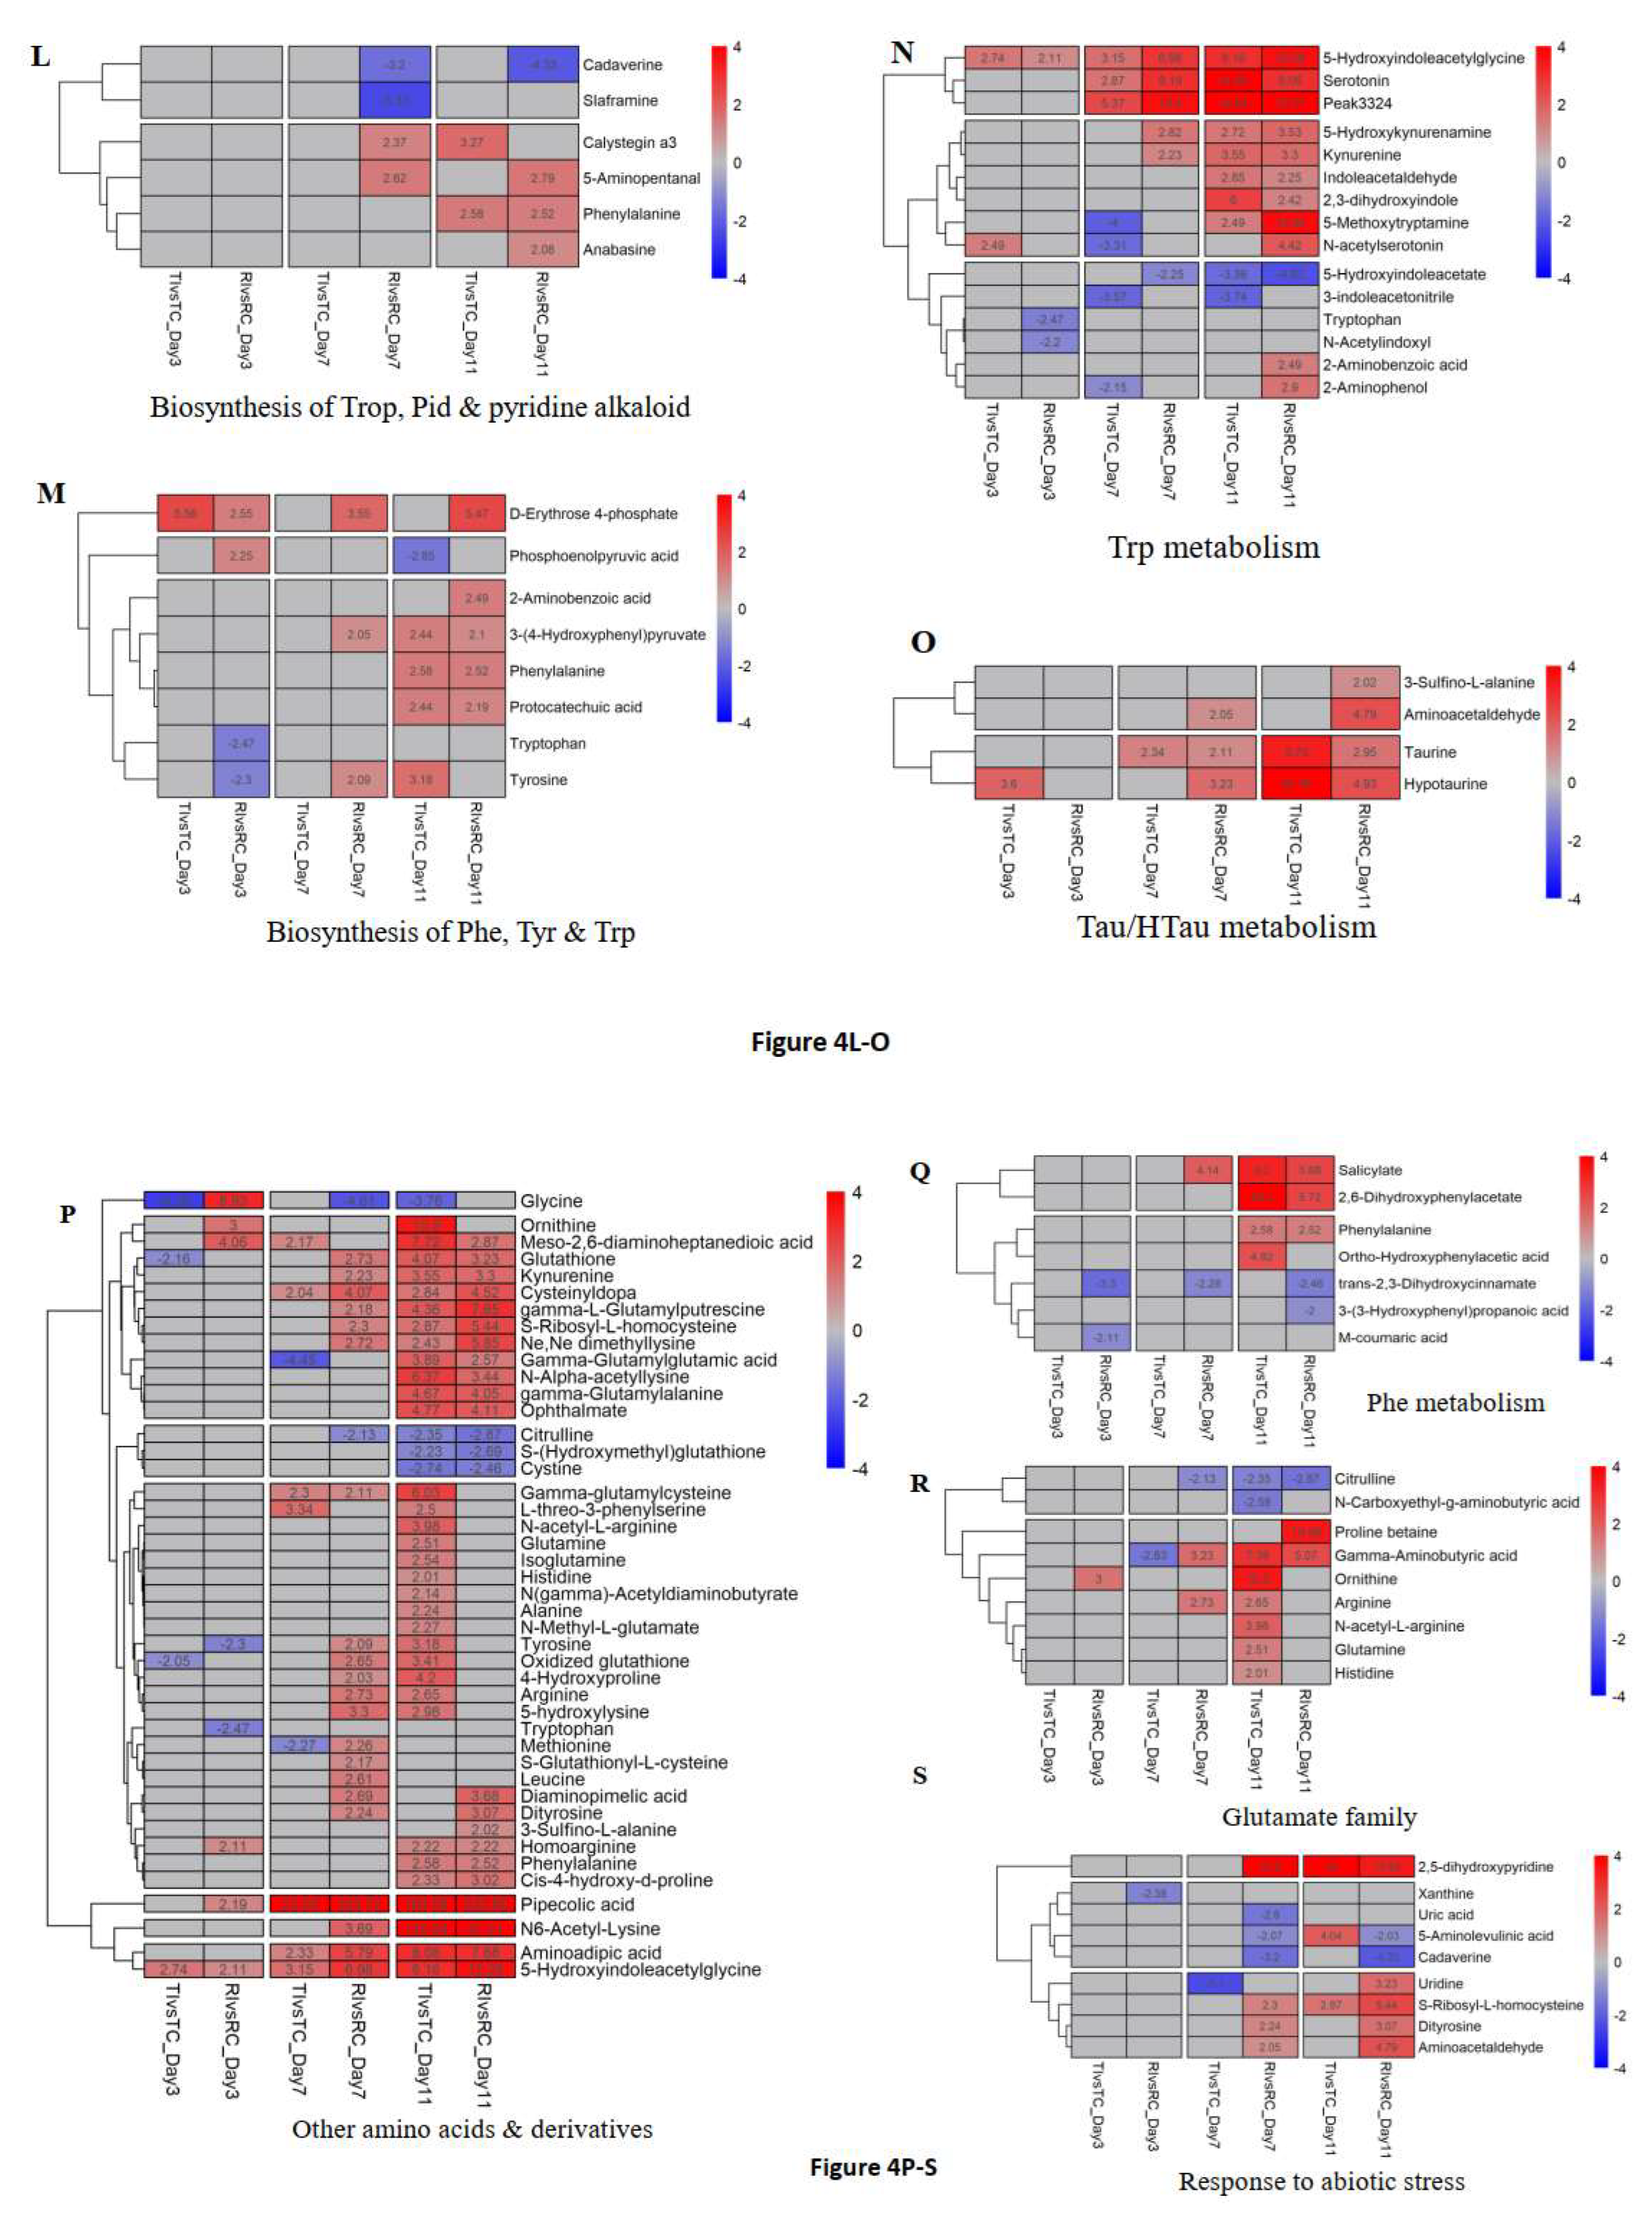
Figure 5.
Relative intensity of glutathione (GSH) and oxidized glutathione (GSSG) in LC-MS analysis, as well as their ratios, in Topas (T) and Topas-Rlm1 (R) canola receiving L. maculans (I) or water (C). A & B) LC-MS intensity for GSH and GSSG. C) The ratio of GSH/GSSG for each treatment. Data points with the same letter(s) across DAI (day after inoculation) did not differ significantly (P > 0.05, LSD).
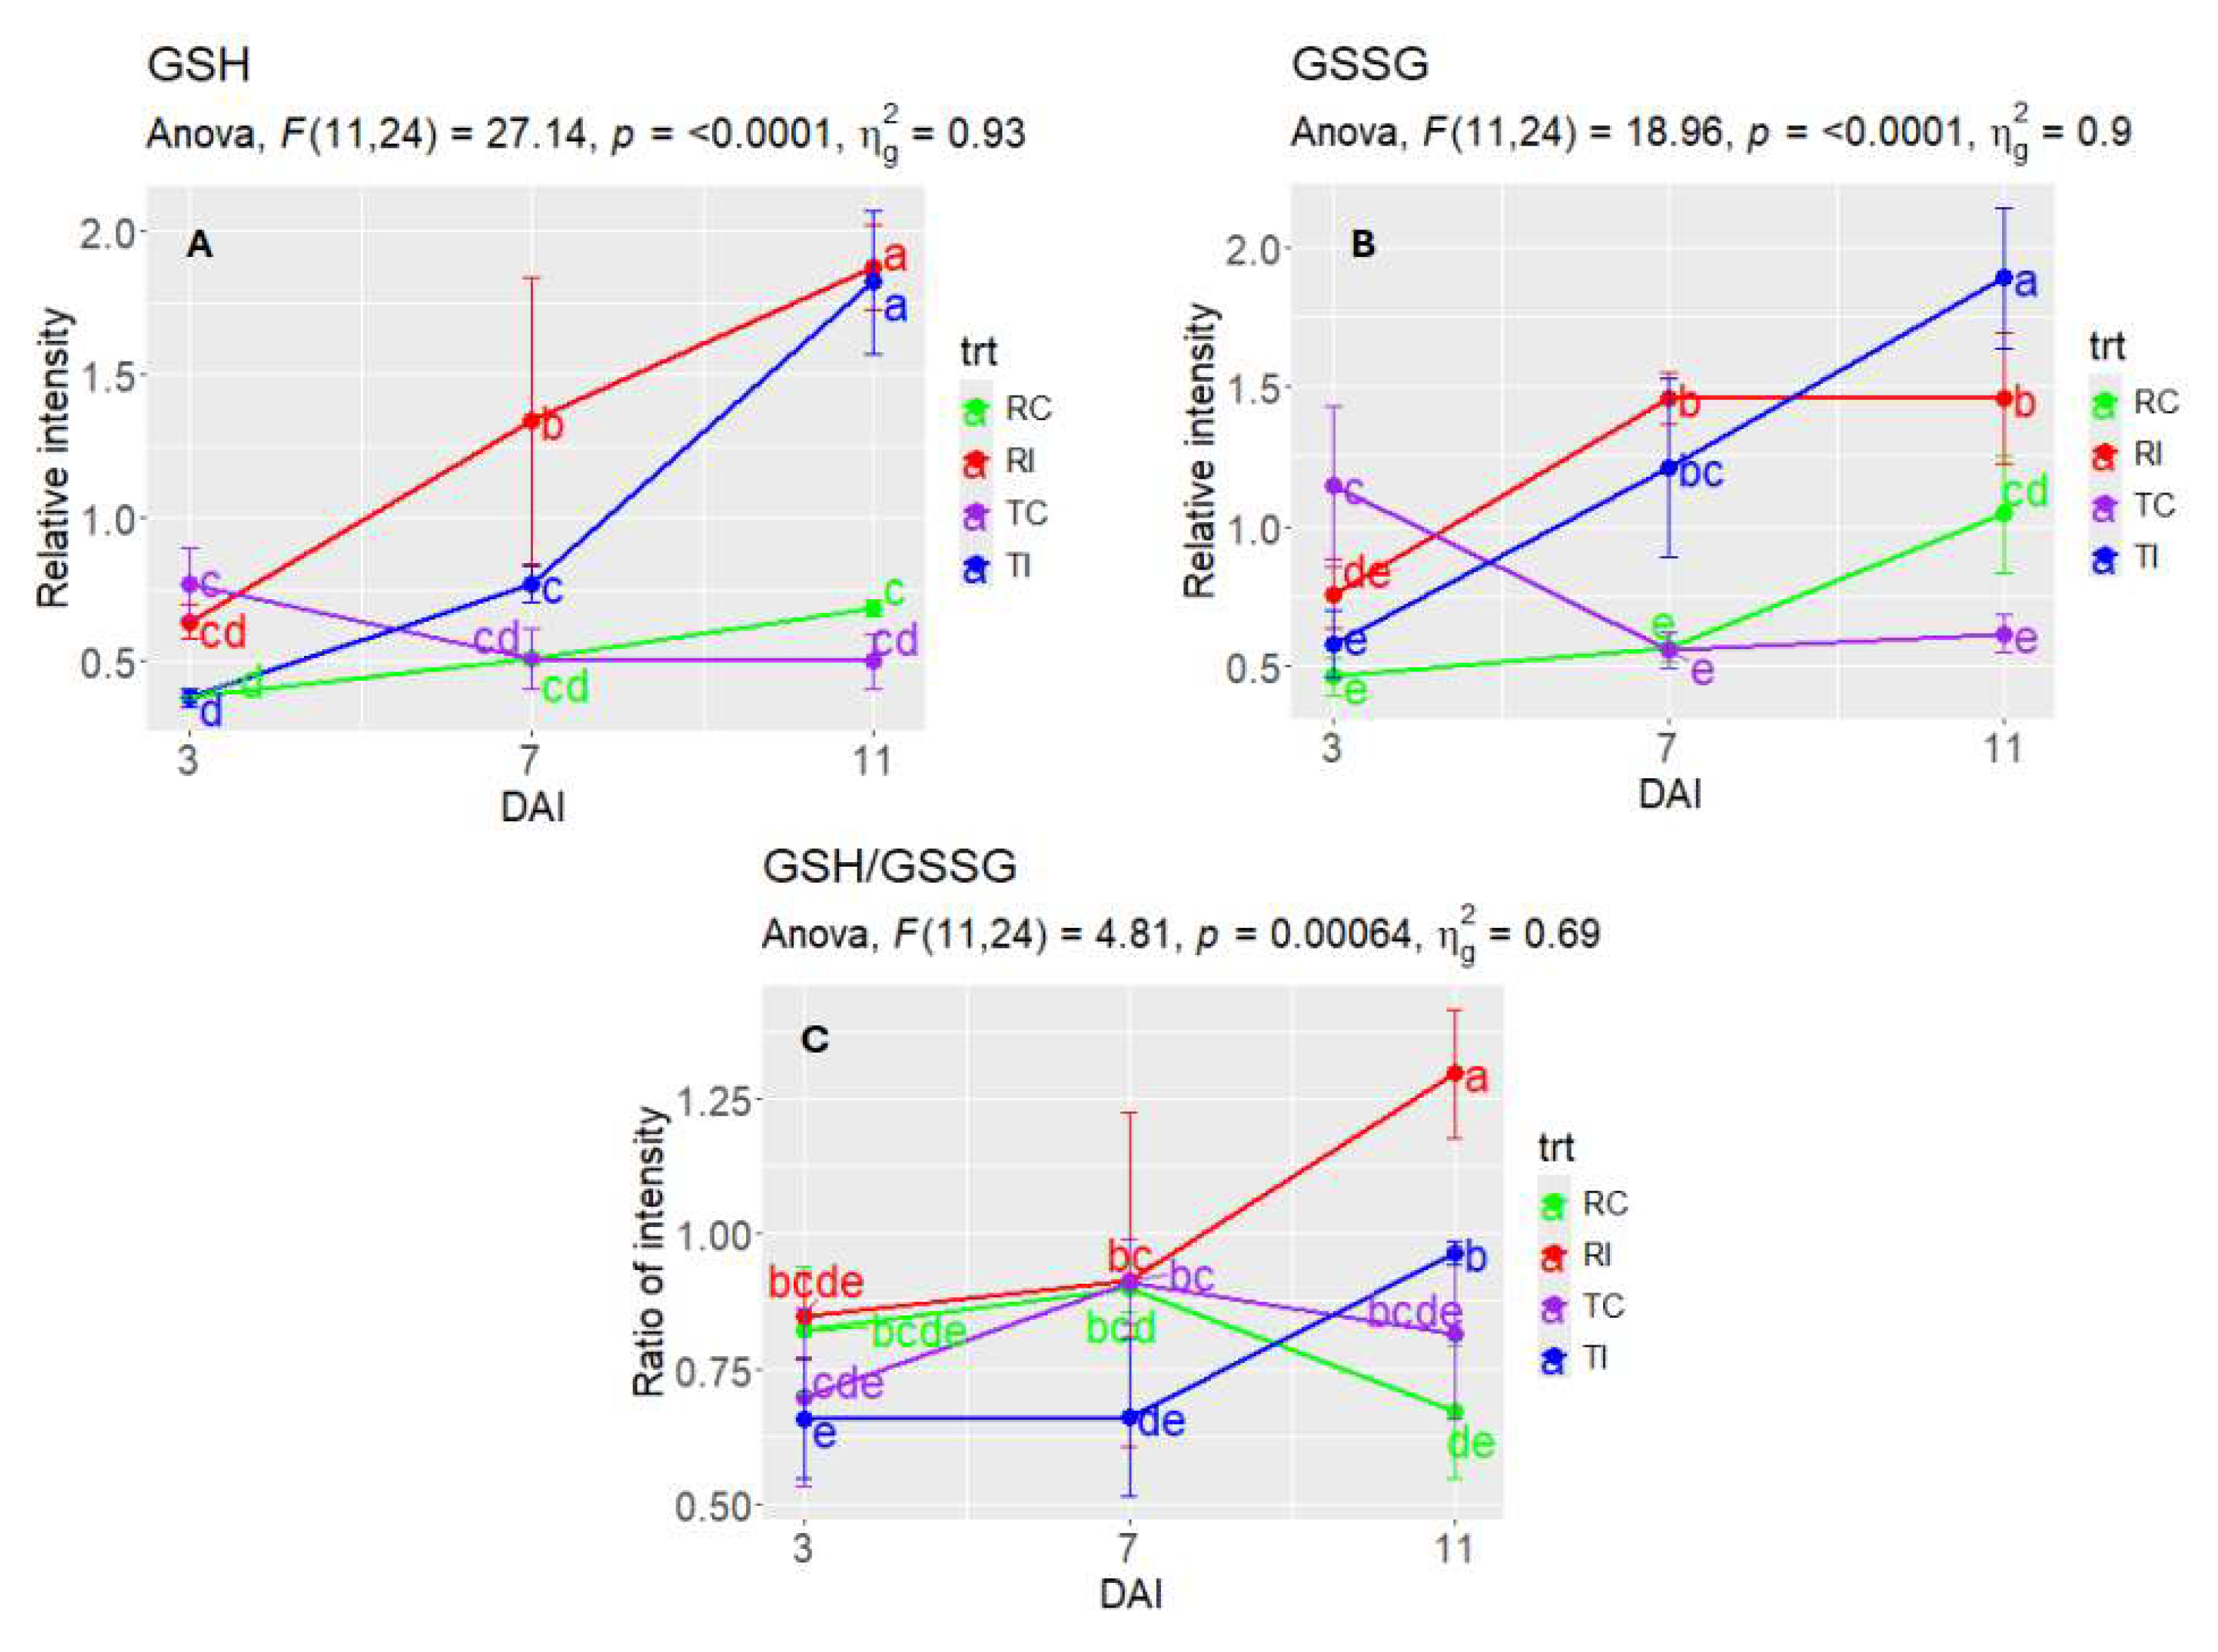
Figure 6.
Suppression of infection development caused by L. maculans on cotyledons of Topas (moderately susceptible) and Westar (susceptible) by applications of pipecolic acid (PA), ferulic acid (FA), caffeic acid (CFA), benzoic acid (BA), salicylic acid (SA), gentisic acid (GA), 2,6-diaminopimelic acid (DAP) and piperonylic acid (PipA) 14 days after inoculation. Glutathione (GSH) and lysine (Lys) were effective on only Topas. All these treatments reduced the infection significantly when compared to a control (P <0.05, LSD test).
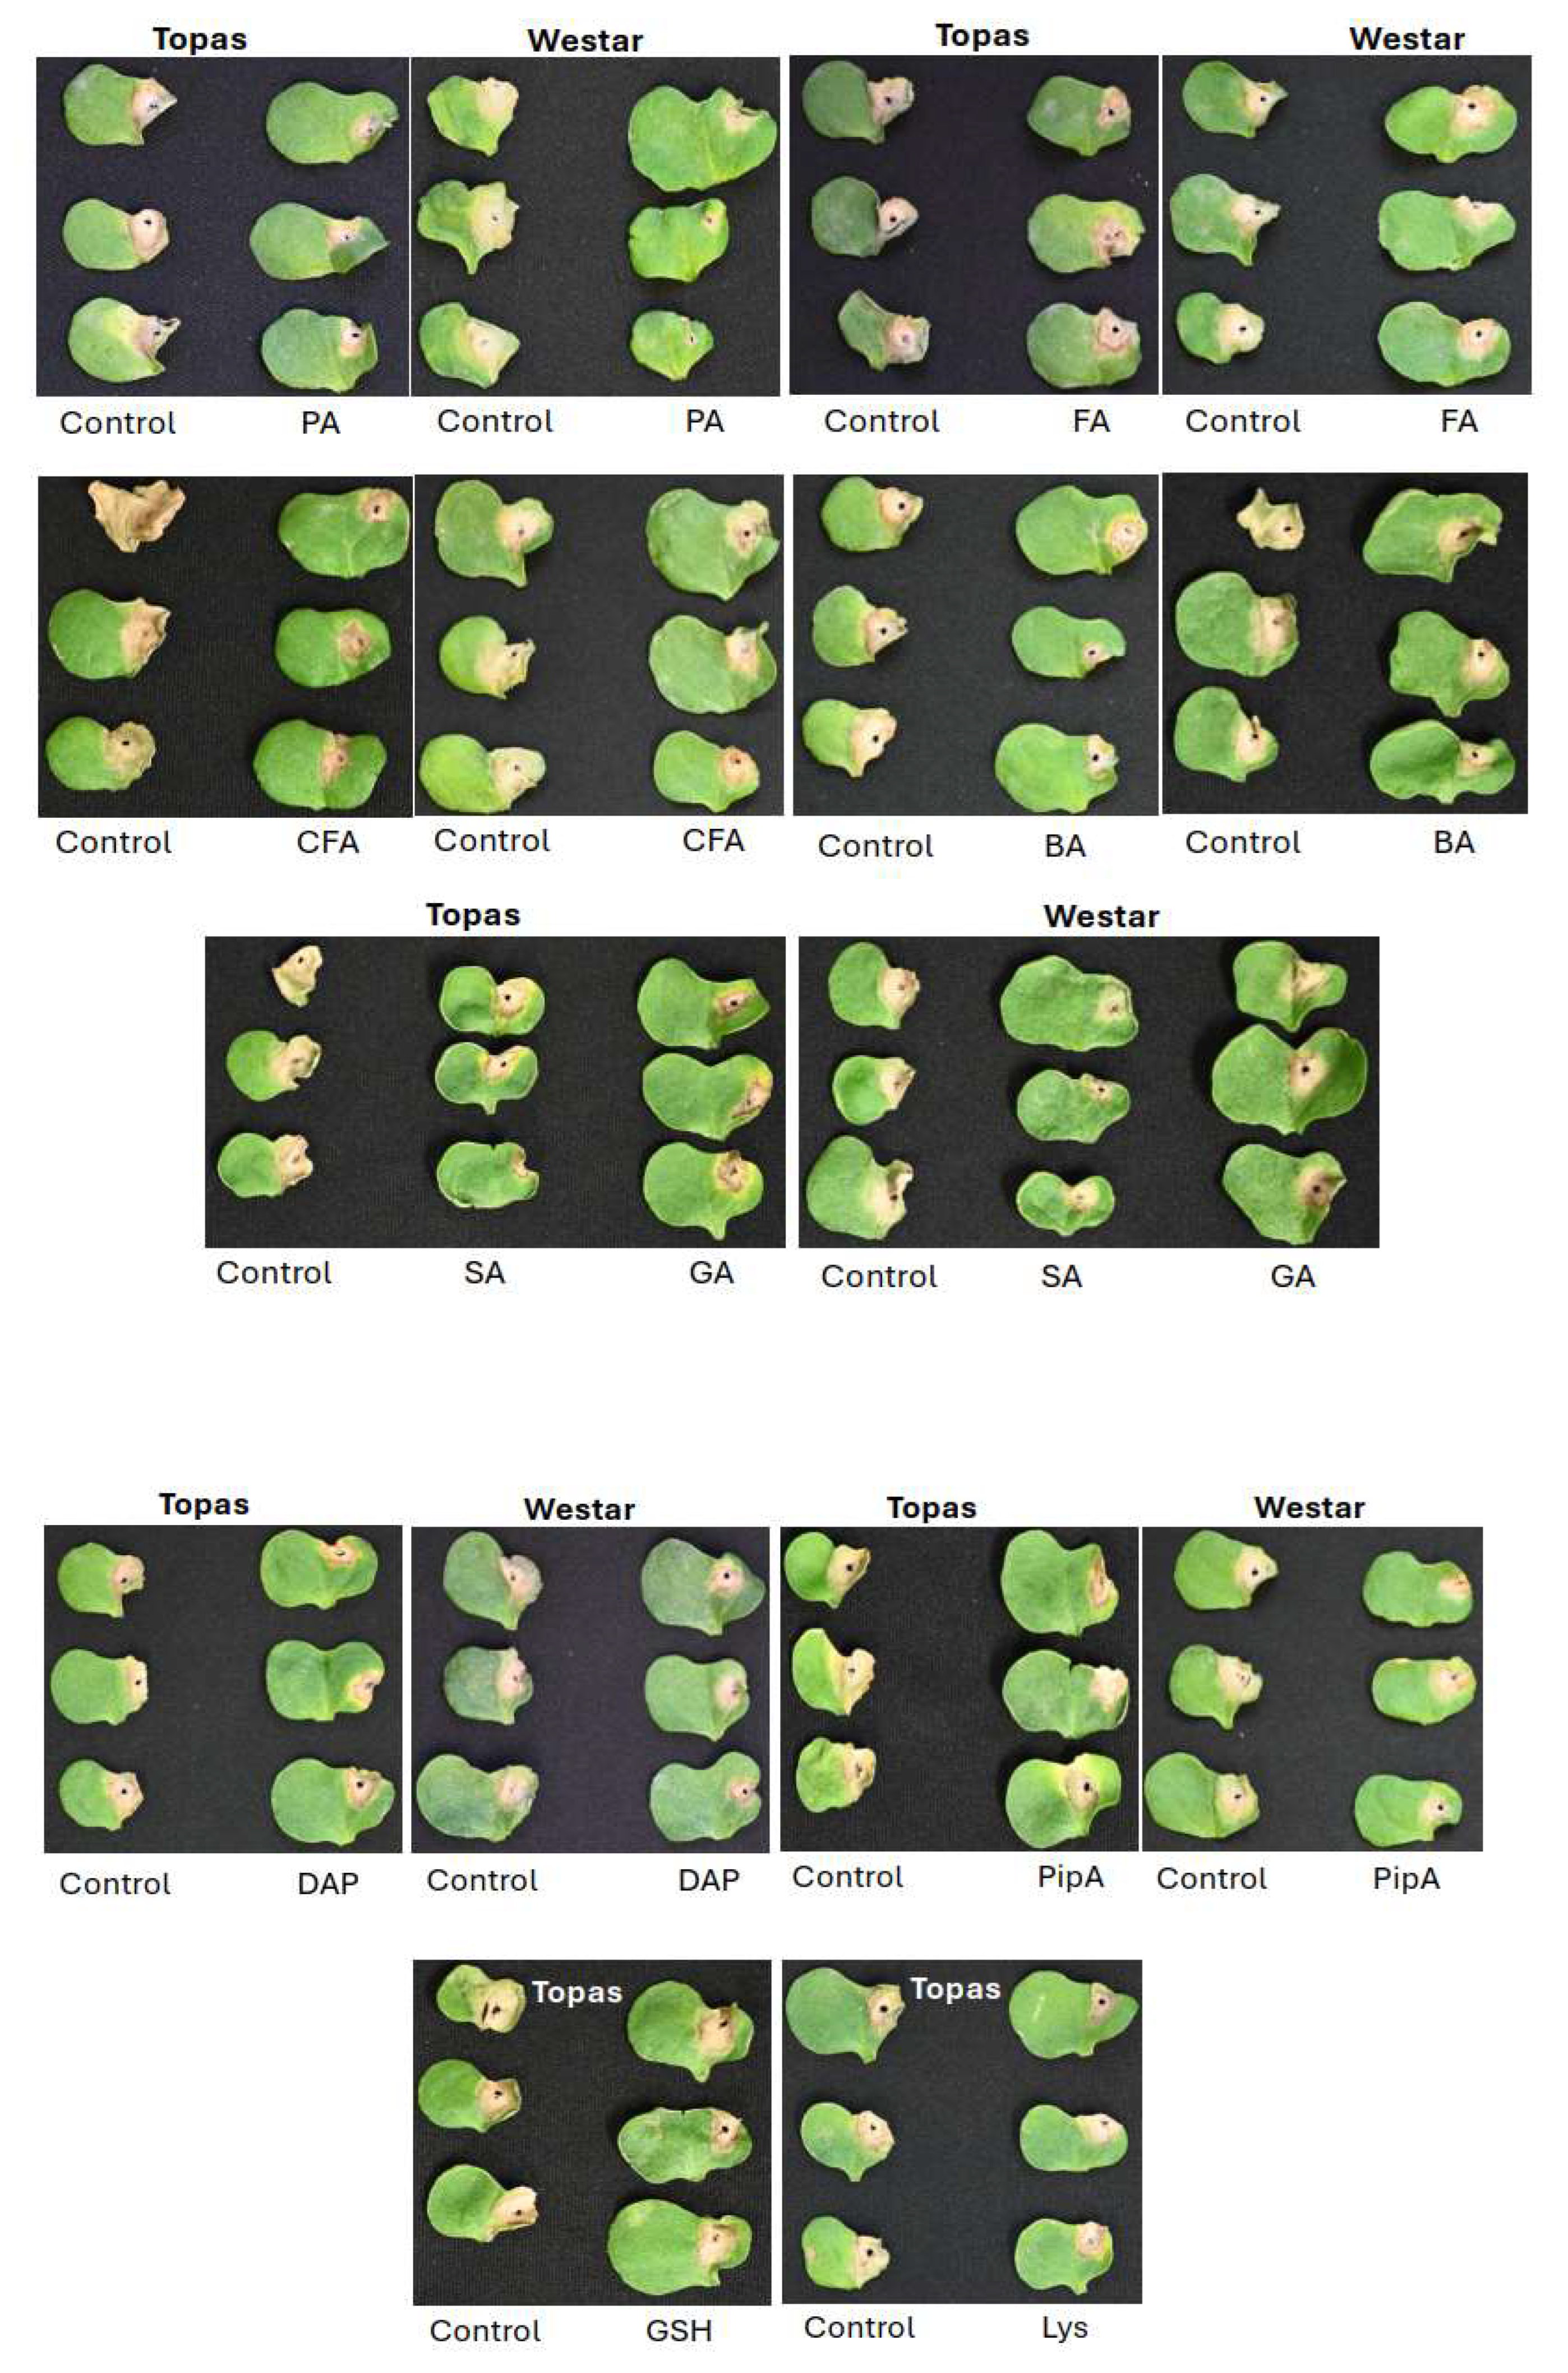
Figure 7.
Effect of post-inoculation treatments with pipecolic acid (PA) on infection of Topas and Westar cotyledons inoculated with L. maculans. A) symptoms at 14 days after inoculation, and B) the mean infection severity where treatments with different letters are significantly different (P <0.05, LSD).
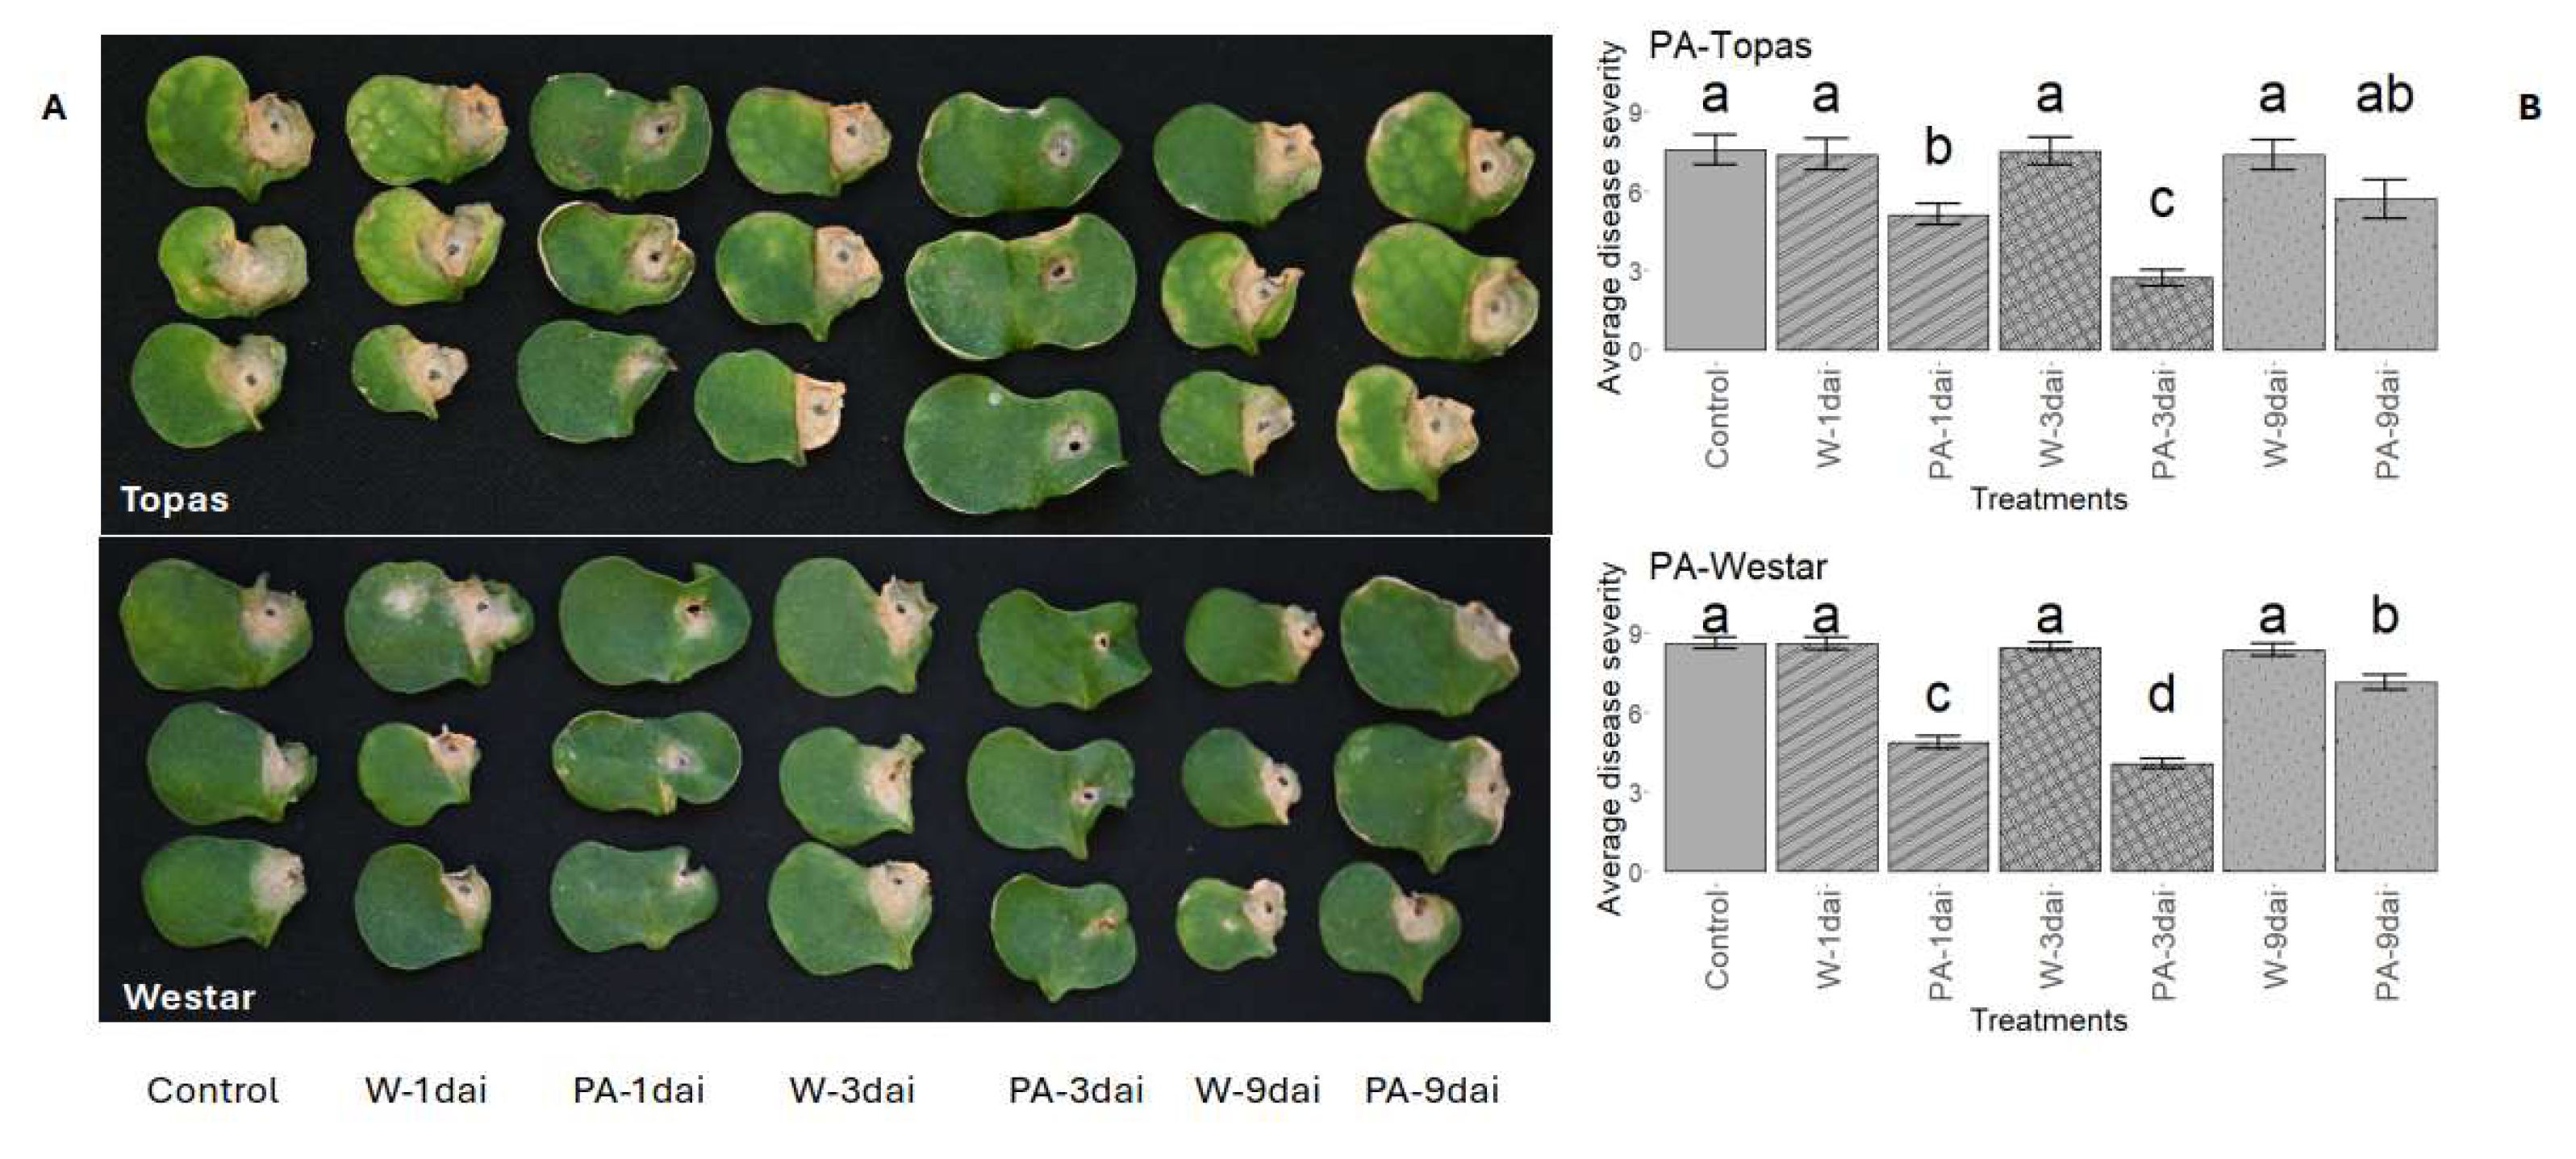

Table 1.
Metabolites/hormones used to validate their involvement in Rlm1-mediated resistance to L. maculans in canola.
Table 1.
Metabolites/hormones used to validate their involvement in Rlm1-mediated resistance to L. maculans in canola.
| Common name | Abbreviation | Chemical name | Mol. Formula | Concentration1 | Supplier |
| Pipecolic acid | PA | Piperidine-2-carboxylic acid | C6H11NO2 | 40 mM | Tokyo Chemical Industry (TCI) |
| Salicylic acid (sodium salt) | SA | Sodium 2-hydroxybenzoate | C7H5NaO3 | 1 mM | Thermo Fisher |
| Gentisic acid (sodium salt hydrate) | GA | 2,5-Dihydroxybenzoic acid sodium salt | C7H5O4Na | 10 mM | Sigma Aldrich |
| Glutathione | GSH | γ-L-glutamyl-L-cysteinylglycine | C6H11NO2 | 20 mM | Thermo Fisher |
| Lysine | Lys | (S)-2,6-Diaminocaproic acid | C6H14N2O2 | 10 mM | Sigma Aldrich |
| Diaminopimelic acid | DAP | 2,6-Diaminopimelic acid | C7H14N2O4 | 30 mM | Sigma Aldrich |
| Ferulic acid | FA | Trans-ferulic acid | C10H10O4 | 1 mM2 | Sigma Aldrich |
| Caffeic acid | CFA | (E)-3-(3,4-dihydroxyphenyl) prop-2-enoic acid | C9H8O4 | 10 mM3 | Sigma Aldrich |
| Benzoic acid | BA | Benzoic acid | C7H6O2 | 10 mM4 | Thermo Fisher |
| Piperonylic acid | PipA | 1,3-benzodioxole-5-carboxylic acid | C8H6O4 | 3 mM5 | Sigma Aldrich |
1The maximum concentration without causing visible impact on canola seedlings during a series of pretests (data not shown). These metabolites were dissolved in deionized water to achieve the designated concentrations unless stated otherwise. 2,5 Dissolved initially in DMSO, then diluted with water to achieve 1 mM and 3mM final concentrations with 0.17% and 1.7% DMSO, respectively. 3,4 Dissolved initially in 95% ethanol, then diluted with water to achieve the 10-mM final concentration with 9.5% and 6.8% ethanol, respectively.
Table 2.
Pathways involved in Rlm1-mediated resistance at 3 dpi.1.
| Pathways | Total Compounds | Hits | Raw p | Impact |
| Flavone and flavonol biosynthesis | 10 | 4 | 5.2649e-05 | 0.5 |
| Isoquinoline alkaloid biosynthesis | 6 | 1 | 0.013614 | 0.5 |
| Arginine and proline metabolism | 32 | 3 | 0.11938 | 0.32738 |
| Biosynthesis of various plant secondary metabolites | 29 | 1 | 0.24485 | 0.24 |
| Glycine, serine and threonine metabolism | 33 | 2 | 0.018356 | 0.22375 |
| Lysine biosynthesis | 9 | 1 | 0.000103 | 0.16216 |
| Arginine biosynthesis | 18 | 1 | 0.17605 | 0.13981 |
| Tryptophan metabolism | 29 | 1 | 0.010177 | 0.10687 |
| Glyoxylate and dicarboxylate metabolism | 29 | 1 | 0.11936 | 0.10147 |
| Tyrosine metabolism | 17 | 1 | 0.013614 | 0.10056 |
| Phenylpropanoid biosynthesis | 43 | 2 | 0.00128 | 0.09634 |
| Glutathione metabolism | 26 | 1 | 0.11936 | 0.07114 |
| Pyrimidine metabolism | 41 | 1 | 0.021007 | 0.02929 |
| Purine metabolism | 73 | 3 | 0.000316 | 0.02344 |
| Phenylalanine, tyrosine and tryptophan biosynthesis | 22 | 2 | 0.011081 | 0.02002 |
| Flavonoid biosynthesis | 47 | 2 | 4.2424e-05 | 0.00338 |
| Cysteine and methionine metabolism | 47 | 1 | 0.000562 | 0.00265 |
| Lipoic acid metabolism | 24 | 1 | 0.11936 | 0.0016 |
| D-Amino acid metabolism | 7 | 1 | 0.000103 | 0 |
| Indole alkaloid biosynthesis | 4 | 1 | 0.010177 | 0 |
| Glucosinolate biosynthesis | 65 | 1 | 0.010177 | 0 |
| Ubiquinone and other terpenoid-quinone biosynthesis | 47 | 1 | 0.013614 | 0 |
| Anthocyanin biosynthesis | 11 | 1 | 0.014562 | 0 |
| Lysine degradation | 20 | 1 | 0.038832 | 0 |
| Thiamine metabolism | 22 | 1 | 0.11936 | 0 |
| Cyanoamino acid metabolism | 29 | 2 | 0.16748 | 0 |
1 Pathway enrichment analysis was conducted using the MetaboAnalyst6.0 (https://www.metaboanalyst.ca) on DAMs identified in RI at 3 dpi. The ‘Total compounds’ refers to all potential metabolites associated with the pathway based on the MetaboAnalyst6.0 database. ‘Hits’ indicates the number of DAMs detected in the sample for the pathway. ‘Raw p’ represents unadjusted P-values from the pathway enrichment analysis. ‘Impact’ denotes the influence of DAMs on the pathway based on the enrichment analysis.
Table 3.
Pathways involved in Rlm1-mediated resistance at 7 dpi. 1.
| Pathways | Total Compounds | Hits | Raw p | Impact |
| Taurine and hypotaurine metabolism | 5 | 2 | 0.004092 | 1 |
| Glutathione metabolism | 26 | 5 | 0.000843 | 0.51637 |
| Isoquinoline alkaloid biosynthesis | 6 | 3 | 0.000207 | 0.5 |
| Tyrosine metabolism | 17 | 4 | 0.001364 | 0.32961 |
| Glycine, serine and threonine metabolism | 33 | 1 | 7.41E-05 | 0.22375 |
| Arginine biosynthesis | 18 | 2 | 0.020249 | 0.17088 |
| Lysine degradation | 20 | 3 | 5.38E-05 | 0.16667 |
| Lysine biosynthesis | 9 | 1 | 0.000818 | 0.16216 |
| Flavone and flavonol biosynthesis | 10 | 2 | 0.00029 | 0.15 |
| Arginine and proline metabolism | 32 | 3 | 0.040159 | 0.14584 |
| Butanoate metabolism | 17 | 1 | 0.13621 | 0.13636 |
| Cysteine and methionine metabolism | 47 | 2 | 0.000311 | 0.13181 |
| Alanine, aspartate and glutamate metabolism | 22 | 1 | 0.13621 | 0.1295 |
| Purine metabolism | 73 | 3 | 0.001022 | 0.10374 |
| Glyoxylate and dicarboxylate metabolism | 29 | 1 | 7.41E-05 | 0.10147 |
| Phenylpropanoid biosynthesis | 43 | 1 | 0.017894 | 0.05935 |
| Pyrimidine metabolism | 41 | 1 | 0.000913 | 0.02929 |
| Folate biosynthesis | 31 | 1 | 0.39026 | 0.02624 |
| Porphyrin metabolism | 48 | 1 | 0.001198 | 0.02261 |
| Ubiquinone and other terpenoid-quinone biosynthesis | 47 | 2 | 4.84E-05 | 0.02209 |
| Phenylalanine, tyrosine and tryptophan biosynthesis | 22 | 2 | 4.84E-05 | 0.02002 |
| Tryptophan metabolism | 29 | 3 | 0.000722 | 0.01527 |
| Lipoic acid metabolism | 24 | 1 | 7.41E-05 | 0.0016 |
| Thiamine metabolism | 22 | 1 | 7.41E-05 | 0 |
| Cyanoamino acid metabolism | 29 | 2 | 8.89E-05 | 0 |
| Glucosinolate biosynthesis | 65 | 3 | 0.000128 | 0 |
| Flavonoid biosynthesis | 47 | 1 | 0.000193 | 0 |
| Biosynthesis of various plant secondary metabolites | 29 | 1 | 0.000248 | 0 |
| Valine, leucine and isoleucine degradation | 37 | 1 | 0.000662 | 0 |
| Valine, leucine and isoleucine biosynthesis | 22 | 1 | 0.000662 | 0 |
| D-Amino acid metabolism | 7 | 1 | 0.000818 | 0 |
| Tropane, piperidine and pyridine alkaloid biosynthesis | 9 | 2 | 0.003453 | 0 |
| Anthocyanin biosynthesis | 11 | 1 | 0.012109 | 0 |
| Zeatin biosynthesis | 21 | 1 | 0.044967 | 0 |
1 Pathway enrichment analysis was conducted using the MetaboAnalyst6.0 (https://www.metaboanalyst.ca) on DAMs identified in RI at 7 dpi. The ‘Total compounds’ refers to all potential metabolites associated with the pathway based on the MetaboAnalyst6.0 database. ‘Hits’ indicates the number of DAMs detected in the sample for the pathway. ‘Raw p’ represents unadjusted P-values from the pathway enrichment analysis. ‘Impact’ denotes the influence of DAMs on the pathway based on the enrichment analysis.
Table 4.
Pathways involved in Rlm1-mediated resistance at 11 dpi.1.
| Pathways | Total Compounds | Hits | Raw p | Impact |
| Taurine and hypotaurine metabolism | 5 | 3 | 0.003645 | 1 |
| Phenylalanine metabolism | 12 | 1 | 0.000113 | 0.42308 |
| Glutathione metabolism | 26 | 3 | 9.13E-05 | 0.40276 |
| Tyrosine metabolism | 17 | 5 | 0.000141 | 0.39665 |
| Phenylpropanoid biosynthesis | 43 | 8 | 9.23E-05 | 0.28583 |
| Ubiquinone and other terpenoid-quinone biosynthesis | 47 | 2 | 0.000443 | 0.1998 |
| beta-Alanine metabolism | 18 | 2 | 0.022568 | 0.19444 |
| Lysine degradation | 20 | 3 | 0.000743 | 0.16667 |
| Lysine biosynthesis | 9 | 1 | 0.000192 | 0.16216 |
| Arginine and proline metabolism | 32 | 3 | 3.65E-06 | 0.15774 |
| Butanoate metabolism | 17 | 1 | 0.000299 | 0.13636 |
| Alanine, aspartate and glutamate metabolism | 22 | 1 | 0.000299 | 0.1295 |
| Purine metabolism | 73 | 3 | 0.003473 | 0.09255 |
| Phenylalanine, tyrosine and tryptophan biosynthesis | 22 | 3 | 1.11E-05 | 0.09159 |
| Arginine biosynthesis | 18 | 1 | 0.004743 | 0.08641 |
| Pyrimidine metabolism | 41 | 2 | 0.002791 | 0.07198 |
| Flavonoid biosynthesis | 47 | 5 | 0.00363 | 0.06956 |
| Cysteine and methionine metabolism | 47 | 5 | 0.000575 | 0.05644 |
| Glucosinolate biosynthesis | 65 | 3 | 1.36E-06 | 0.04236 |
| Tryptophan metabolism | 29 | 4 | 4.93E-05 | 0.03054 |
| Pantothenate and CoA biosynthesis | 25 | 1 | 0.16968 | 0.02796 |
| Porphyrin metabolism | 48 | 1 | 0.013372 | 0.02261 |
| Flavone and flavonol biosynthesis | 10 | 2 | 6.24E-05 | 0 |
| Cyanoamino acid metabolism | 29 | 1 | 0.000113 | 0 |
| Tropane, piperidine and pyridine alkaloid biosynthesis | 9 | 3 | 0.000161 | 0 |
| D-Amino acid metabolism | 7 | 1 | 0.000192 | 0 |
| Anthocyanin biosynthesis | 11 | 2 | 0.00027 | 0 |
| Glycine, serine and threonine metabolism | 33 | 1 | 0.002717 | 0 |
| Zeatin biosynthesis | 21 | 1 | 0.005646 | 0 |
| Isoquinoline alkaloid biosynthesis | 6 | 2 | 0.006486 | 0 |
1 Pathway enrichment analysis was conducted using the MetaboAnalyst6.0 (https://www.metaboanalyst.ca) on DAMs identified in RI at 11 dpi. The ‘Total compounds’ refers to all potential metabolites associated with the pathway based on the MetaboAnalyst6.0 database. ‘Hits’ indicates the number of DAMs detected in the sample for the pathway. ‘Raw p’ represents unadjusted P-values from the pathway enrichment analysis. ‘Impact’ denotes the influence of DAMs on the pathway based on the enrichment analysis.
Disclaimer/Publisher’s Note: The statements, opinions and data contained in all publications are solely those of the individual author(s) and contributor(s) and not of MDPI and/or the editor(s). MDPI and/or the editor(s) disclaim responsibility for any injury to people or property resulting from any ideas, methods, instructions or products referred to in the content. |
© 2025 by the authors. Licensee MDPI, Basel, Switzerland. This article is an open access article distributed under the terms and conditions of the Creative Commons Attribution (CC BY) license (http://creativecommons.org/licenses/by/4.0/).
Copyright: This open access article is published under a Creative Commons CC BY 4.0 license, which permit the free download, distribution, and reuse, provided that the author and preprint are cited in any reuse.


