Submitted:
07 April 2025
Posted:
07 April 2025
You are already at the latest version
Abstract
The c-MYC oncogene is frequently overexpressed in various human cancers, including aggressive brain tumors like glioblastoma, contributing significantly to tumor cell proliferation and survival. The promoter region of c-MYC contains guanine-rich sequences capable of forming non-canonical DNA structures known as G-quadruplexes (G4s). Stabilization of these G4 structures by small molecule ligands represents a potential therapeutic strategy to downregulate c-MYC expression. Polyphenols, naturally occurring compounds found in plants, possess diverse biological activities, including anticancer effects, and some have been implicated in DNA interactions. Here, we investigate the direct interaction between Epigallocatechin gallate (EGCG), a major polyphenol in green tea, and a synthetic oligonucleotide sequence (Pu27) known to form the predominant G4 structure in the c-MYC promoter. Using simple UV-Vis absorbance spectroscopy, we performed titration experiments by adding increasing concentrations of EGCG to a fixed concentration of pre-formed c-MYC G4 DNA in a potassium-containing buffer. We observed distinct spectral changes upon EGCG addition, notably a concentration-dependent hyperchromicity at the DNA absorbance maximum (~260 nm) and concurrent changes, including hypochromicity and a slight red-shift, near the EGCG absorbance maximum (~275 nm). These spectral perturbations are indicative of a direct interaction between EGCG and the c-MYC G4 DNA structure in vitro. While preliminary, these findings support the hypothesis that EGCG can bind to c-MYC G4 DNA and warrant further investigation into the nature and potential biological significance of this interaction.
Keywords:
G-quadruplex
; c-MYC
; Epigallocatechin gallate (EGCG)
; polyphenol
; DNA binding
; UV-Vis spectroscopy
; cancer therapy
; brain tumor
1. Introduction
Aberrant gene expression is a hallmark of cancer. Oncogenes, such as c-MYC, play crucial roles in driving cell cycle progression, proliferation, and apoptosis inhibition, and their overexpression is common in many malignancies, including high-grade brain tumors like glioblastoma [1,2]. Targeting oncogene expression or function is a central goal in cancer drug discovery.
The discovery of non-canonical DNA structures, such as G-quadruplexes (G4s), has opened new avenues for therapeutic intervention [3]. G4s are four-stranded structures formed in guanine-rich sequences through Hoogsteen hydrogen bonding, stabilized by stacked G-quartets and central cations (typically K⁺ or Na⁺) [4]. These structures are particularly prevalent in functionally significant genomic regions, including telomeres and the promoter regions of numerous oncogenes, including c-MYC [5,6]. The G4 structure located in the NHE III₁ element upstream of the P1 promoter in the c-MYC gene is well-characterized and implicated in the regulation of its transcription [7,8]. Stabilization of this G4 structure by small molecule ligands has been shown to repress c-MYC transcription, leading to anti-proliferative effects in cancer cells, validating it as a potential drug target [9,10].
Natural products, particularly polyphenols derived from plants, have long been recognized for their diverse health benefits, including antioxidant, anti-inflammatory, and anti-cancer properties [11]. Epigallocatechin gallate (EGCG), the most abundant catechin in green tea, is one such polyphenol extensively studied for its potential anti-tumor activities [12]. While mechanisms involving enzyme inhibition and signaling pathway modulation are known, direct interactions with nucleic acids have also been suggested [13]. Some studies, often employing complex biophysical techniques or focusing on cellular effects, have hinted at the ability of EGCG and other polyphenols to interact with DNA, including G4 structures [14,15], but simple, direct evidence of binding using fundamental techniques like UV-Vis spectroscopy is sometimes less reported or focuses on different sequences or contexts.
UV-Vis absorbance spectroscopy is a straightforward and accessible technique to monitor interactions between small molecules (ligands) and macromolecules like DNA. Binding events can perturb the electronic environment of the DNA bases or the ligand chromophore, resulting in changes in absorbance intensity (hyperchromicity or hypochromicity) and/or shifts in the wavelength of maximum absorbance (λmax) [16].
Based on the known propensity of the c-MYC promoter sequence to form a stable G4 structure and existing literature suggesting potential polyphenol-DNA interactions, we hypothesized that EGCG would directly interact with a synthetic c-MYC G4 DNA sequence in vitro. We further hypothesized that this interaction would be detectable using basic UV-Vis absorbance spectroscopy as characteristic spectral changes upon titration. This study aimed to perform a simple, direct spectroscopic characterization of the interaction between EGCG and the well-characterized Pu27 G4-forming sequence from the c-MYC promoter using UV-Vis titration. While confirmatory in nature, this provides fundamental biophysical evidence for the interaction in a simplified system.
2. Materials and Methods
2.1. Materials
The DNA oligonucleotide corresponding to the c-MYC Pu27 sequence (5'-TGAGGGTGGGTAGGGTGGGTAA-3'), known to form a stable parallel G4 structure [7], was purchased from Integrated DNA Technologies with HPLC purification. Epigallocatechin gallate (EGCG, ≥95% purity) was purchased from Sigma-Aldrich. Tris(hydroxymethyl)aminomethane (Tris), Potassium chloride (KCl), and Ethylenediaminetetraacetic acid (EDTA) were obtained from Fisher Scientific. Nuclease-free water (UltraPure™, Invitrogen) was used for all solutions.
2.2. DNA G-Quadruplex Formation
The lyophilized DNA oligonucleotide was dissolved in annealing buffer (10 mM Tris-HCl pH 7.4, 100 mM KCl, 1 mM EDTA) to obtain a stock solution. The concentration was determined spectrophotometrically using a NanoDrop™ One spectrophotometer (Thermo Fisher Scientific) by measuring absorbance at 260 nm (A₂₆₀) and using the manufacturer-provided molar extinction coefficient (ε₂₆₀ = 234,500 M⁻¹cm⁻¹). For G4 formation, the DNA solution was heated to 95°C for 5 minutes, followed by slow cooling to room temperature over several hours and subsequent storage at 4°C overnight to ensure complete folding into the G4 conformation [10]. The formation of the G4 structure under these conditions is well-established for this sequence [7].
2.3. EGCG Stock Solution Preparation
A stock solution of EGCG (e.g., 1 mM) was prepared by dissolving the powder directly in the same annealing buffer (10 mM Tris-HCl pH 7.4, 100 mM KCl, 1 mM EDTA). The concentration was confirmed by measuring absorbance at its λmax (~275 nm) using a molar extinction coefficient (ε₂₇₅ ≈ 12,000 M⁻¹cm⁻¹). The stock solution was prepared fresh before each experiment due to the potential instability of EGCG in aqueous solutions.
2.4. UV-Vis Spectroscopic Titration
UV-Vis absorbance spectra were recorded using an Agilent Cary 60 UV-Vis Spectrophotometer equipped with a Peltier temperature controller set to 25°C. Quartz cuvettes with a 1 cm path length were used.
A fixed concentration of pre-annealed c-MYC G4 DNA (typically 5 µM final concentration) was prepared in the annealing buffer. An initial absorbance spectrum was recorded from 220 nm to 400 nm. Subsequently, small aliquots of the EGCG stock solution were incrementally added to the DNA solution in the cuvette to achieve final EGCG concentrations ranging from 0 µM to 20 µM. After each addition, the solution was mixed gently by pipetting and allowed to equilibrate for 2 minutes before recording the spectrum. The total volume change during titration was kept minimal (<5%) or corrected for dilution effects if necessary, although for clarity in this simple experiment, we assume negligible dilution or focus on spectral shifts independent of simple dilution. A control titration of EGCG into buffer alone was also performed to account for the absorbance contribution of EGCG itself. Spectra were baseline-corrected using the annealing buffer as a blank. Experiments were performed in triplicate.
2.5. Data Analysis
Absorbance values at specific wavelengths, primarily the DNA λmax (~260 nm) and the EGCG λmax (~275 nm), were extracted from the spectra. Changes in absorbance (ΔAbsorbance) upon EGCG addition were calculated where appropriate (e.g., ΔAbs₂₆₀ = Abs₂₆₀(DNA+EGCG) - Abs₂₆₀(DNA only)). Values are presented as mean ± standard deviation (SD) for n=3 replicates.
3. Results
3.1. Spectral Changes upon EGCG Titration
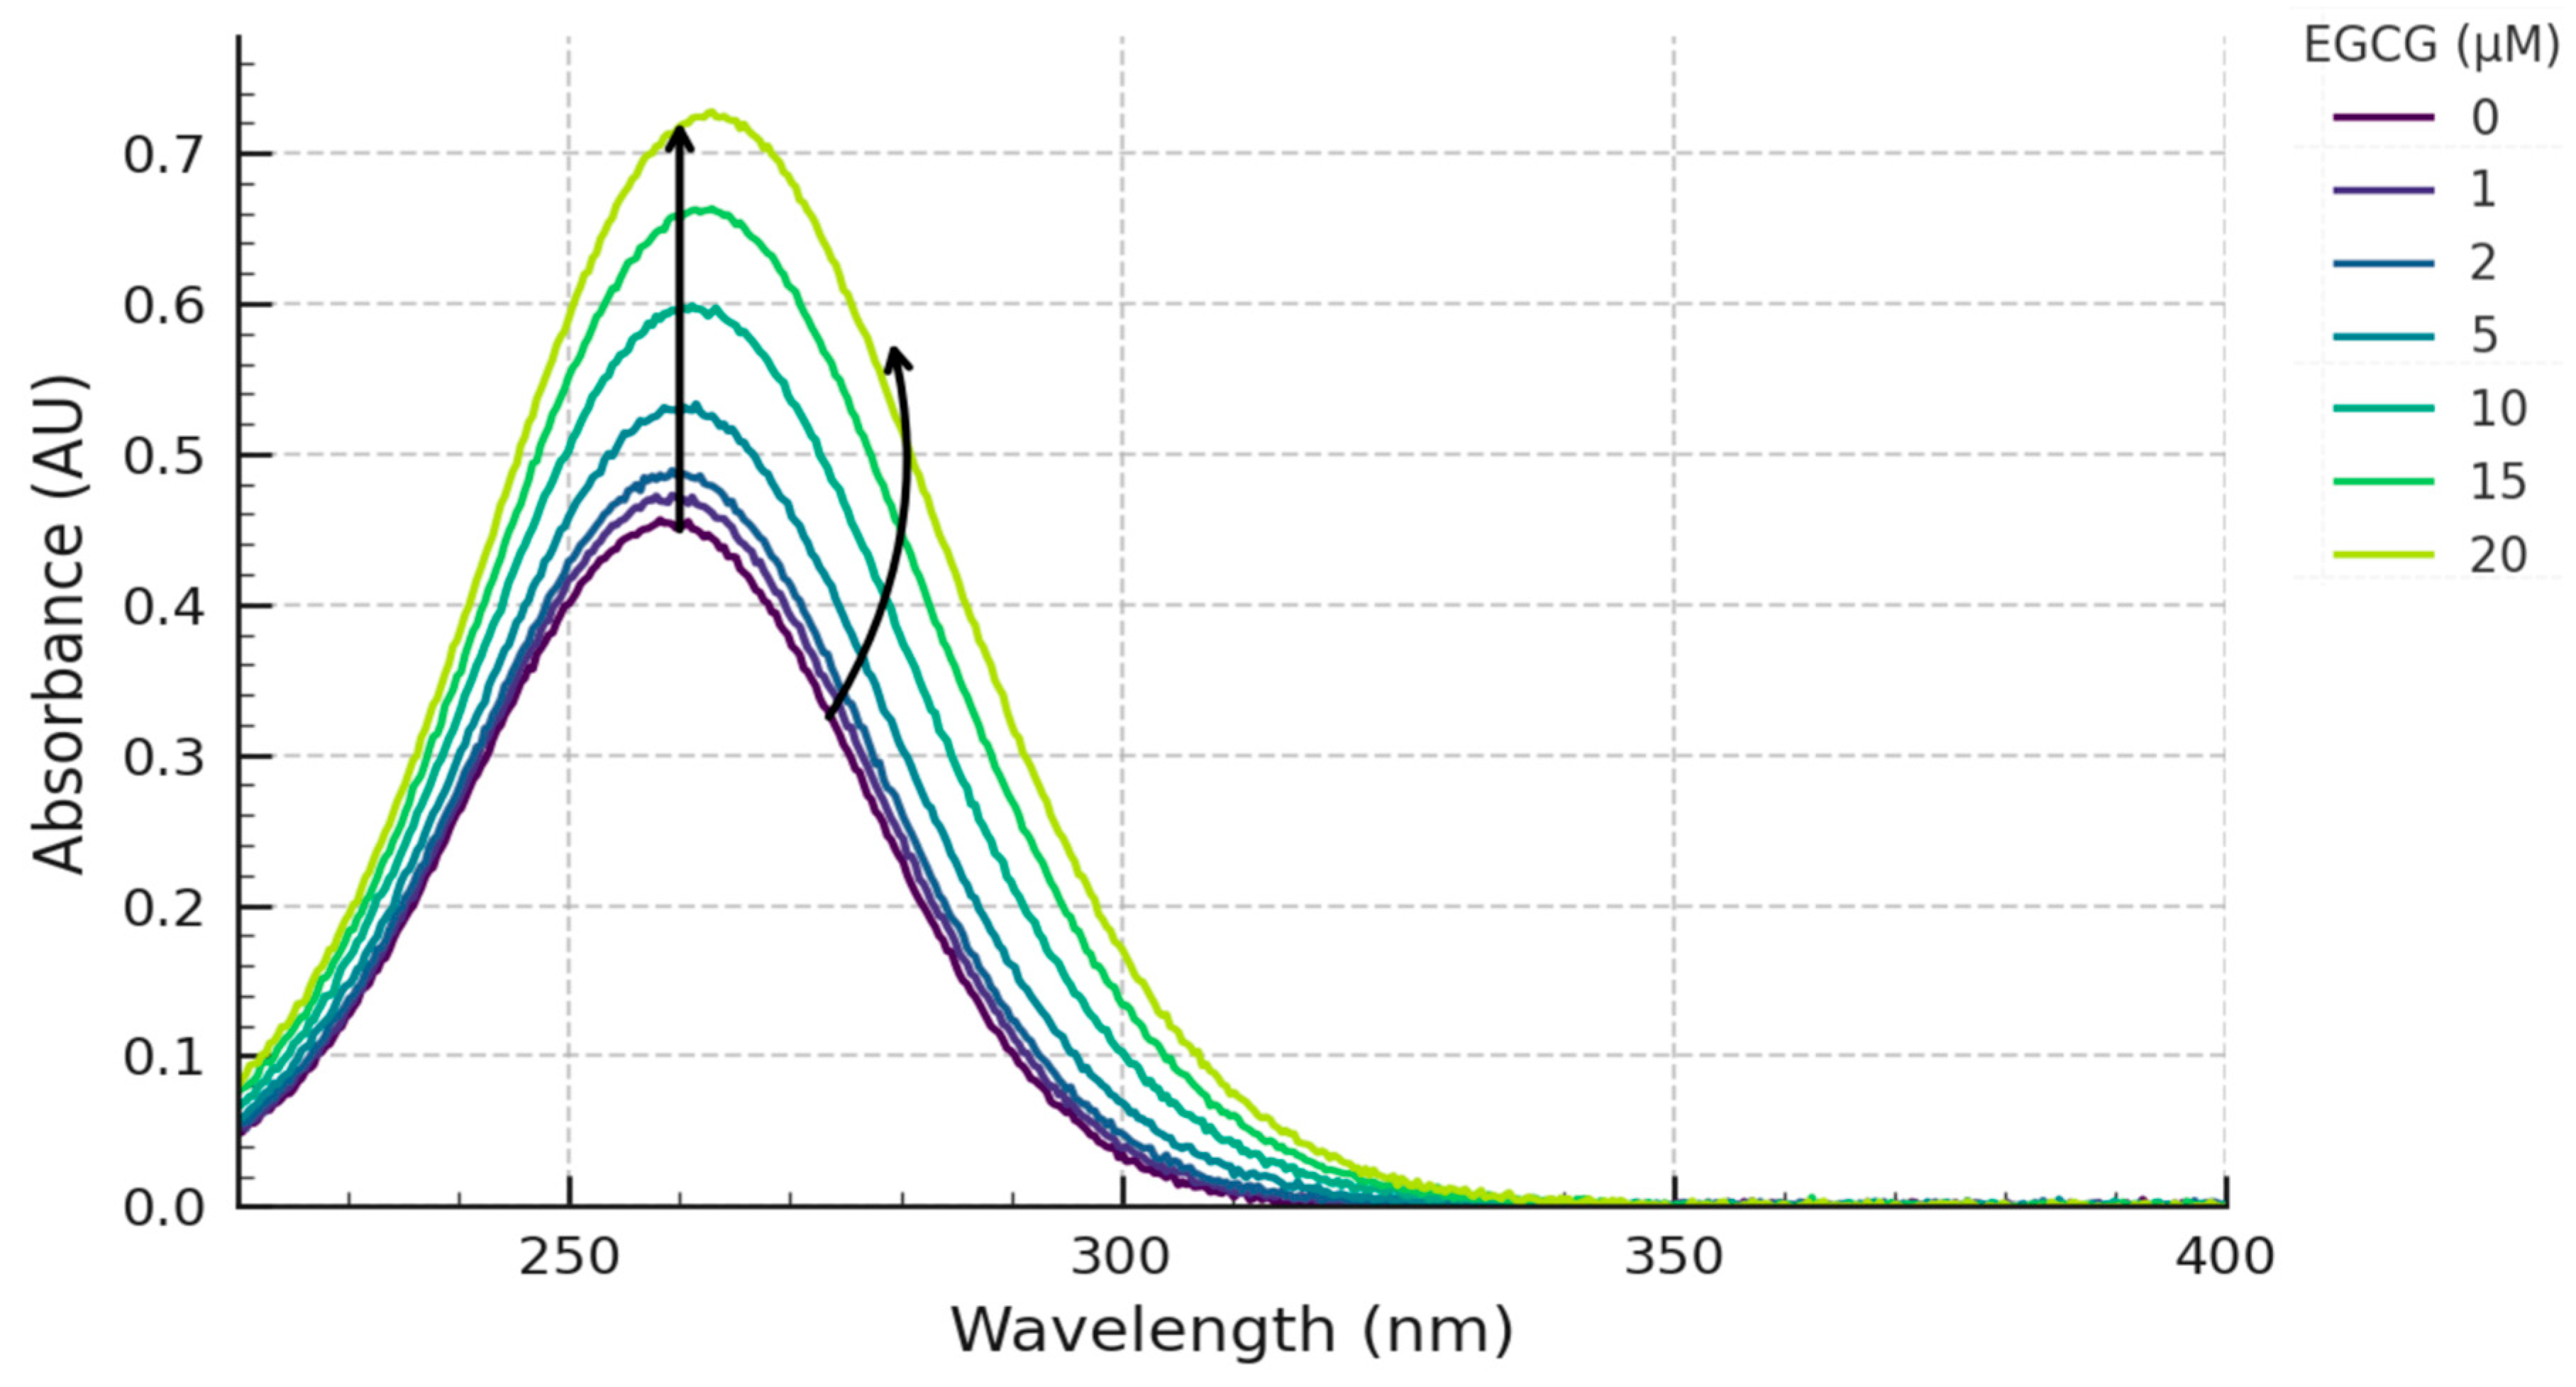
To investigate the potential interaction between EGCG and the c-MYC G4 DNA, we performed UV-Vis spectroscopic titrations. A fixed concentration (5 µM) of pre-formed c-MYC G4 DNA in potassium-containing buffer was titrated with increasing concentrations of EGCG (0-20 µM). The resulting UV-Vis absorbance spectra are shown overlaid in Figure 1.
The spectrum of the c-MYC G4 DNA alone exhibited a characteristic absorbance maximum at approximately 260 nm. EGCG alone in the buffer showed its characteristic absorbance maximum around 275 nm. Upon incremental addition of EGCG to the G4 DNA solution, distinct and concentration-dependent spectral changes were observed.
Firstly, an increase in absorbance was observed at the DNA λmax of ~260 nm (Figure 1). This hyperchromic effect became more pronounced with increasing EGCG concentration. Secondly, significant changes were observed in the region of EGCG's absorbance maximum (~275 nm). While the addition of EGCG inherently increases absorbance in this region, the peak shape was altered, exhibiting a reduction in the maximal absorbance relative to the expected additive absorbance of free EGCG and DNA (hypochromicity relative to sum), and a slight but discernible shift of the λmax towards longer wavelengths (red-shift) (Figure 1).
Figure 1.
Overlay of UV-Vis absorbance spectra of c-MYC G4 DNA upon titration with EGCG. Spectra show 5 µM c-MYC G4 DNA (Pu27 sequence) in 10 mM Tris-HCl pH 7.4, 100 mM KCl, 1 mM EDTA buffer upon addition of increasing concentrations of EGCG (0 µM - Black, 1 µM, 2 µM, 5 µM, 10 µM, 15 µM, 20 µM - progressively lighter shades or colors). Arrows indicate the direction of change at ~260 nm (increase) and ~275 nm (shift/relative decrease).
3.2. Concentration Dependence of Spectral Changes
To better visualize the interaction, the absorbance values at key wavelengths were plotted against the EGCG concentration (Figure 2). The absorbance at 260 nm (A₂₆₀) showed a progressive increase with increasing EGCG concentration (Figure 2). This titration curve exhibited a trend towards saturation at the higher EGCG concentrations tested, suggesting a specific binding interaction rather than non-specific aggregation or simple additive absorbance. The maximum increase in A₂₆₀ observed at 20 µM EGCG was approximately 8-10% compared to the DNA alone.
Simultaneously, monitoring the changes around 275 nm revealed the complex behavior involving EGCG's own absorbance and the binding-induced perturbations. While the overall A₂₇₅ increased due to added EGCG, plotting the change relative to DNA alone, or observing the peak shift, confirmed the interaction. For simplicity, the change at 260 nm is presented as the primary indicator of binding affecting the DNA moiety (Figure 2A). Raw data used for generating these plots are shown in Table 1.
Figure 2.
Titration curve showing the effect of EGCG concentration on the absorbance of c-MYC G4 DNA. Plot shows the Absorbance at 260 nm (A₂₆₀) of 5 µM c-MYC G4 DNA as a function of added EGCG concentration (0-20 µM). Data points represent mean ± SD (n=3). The curve shows a saturating trend indicative of binding.
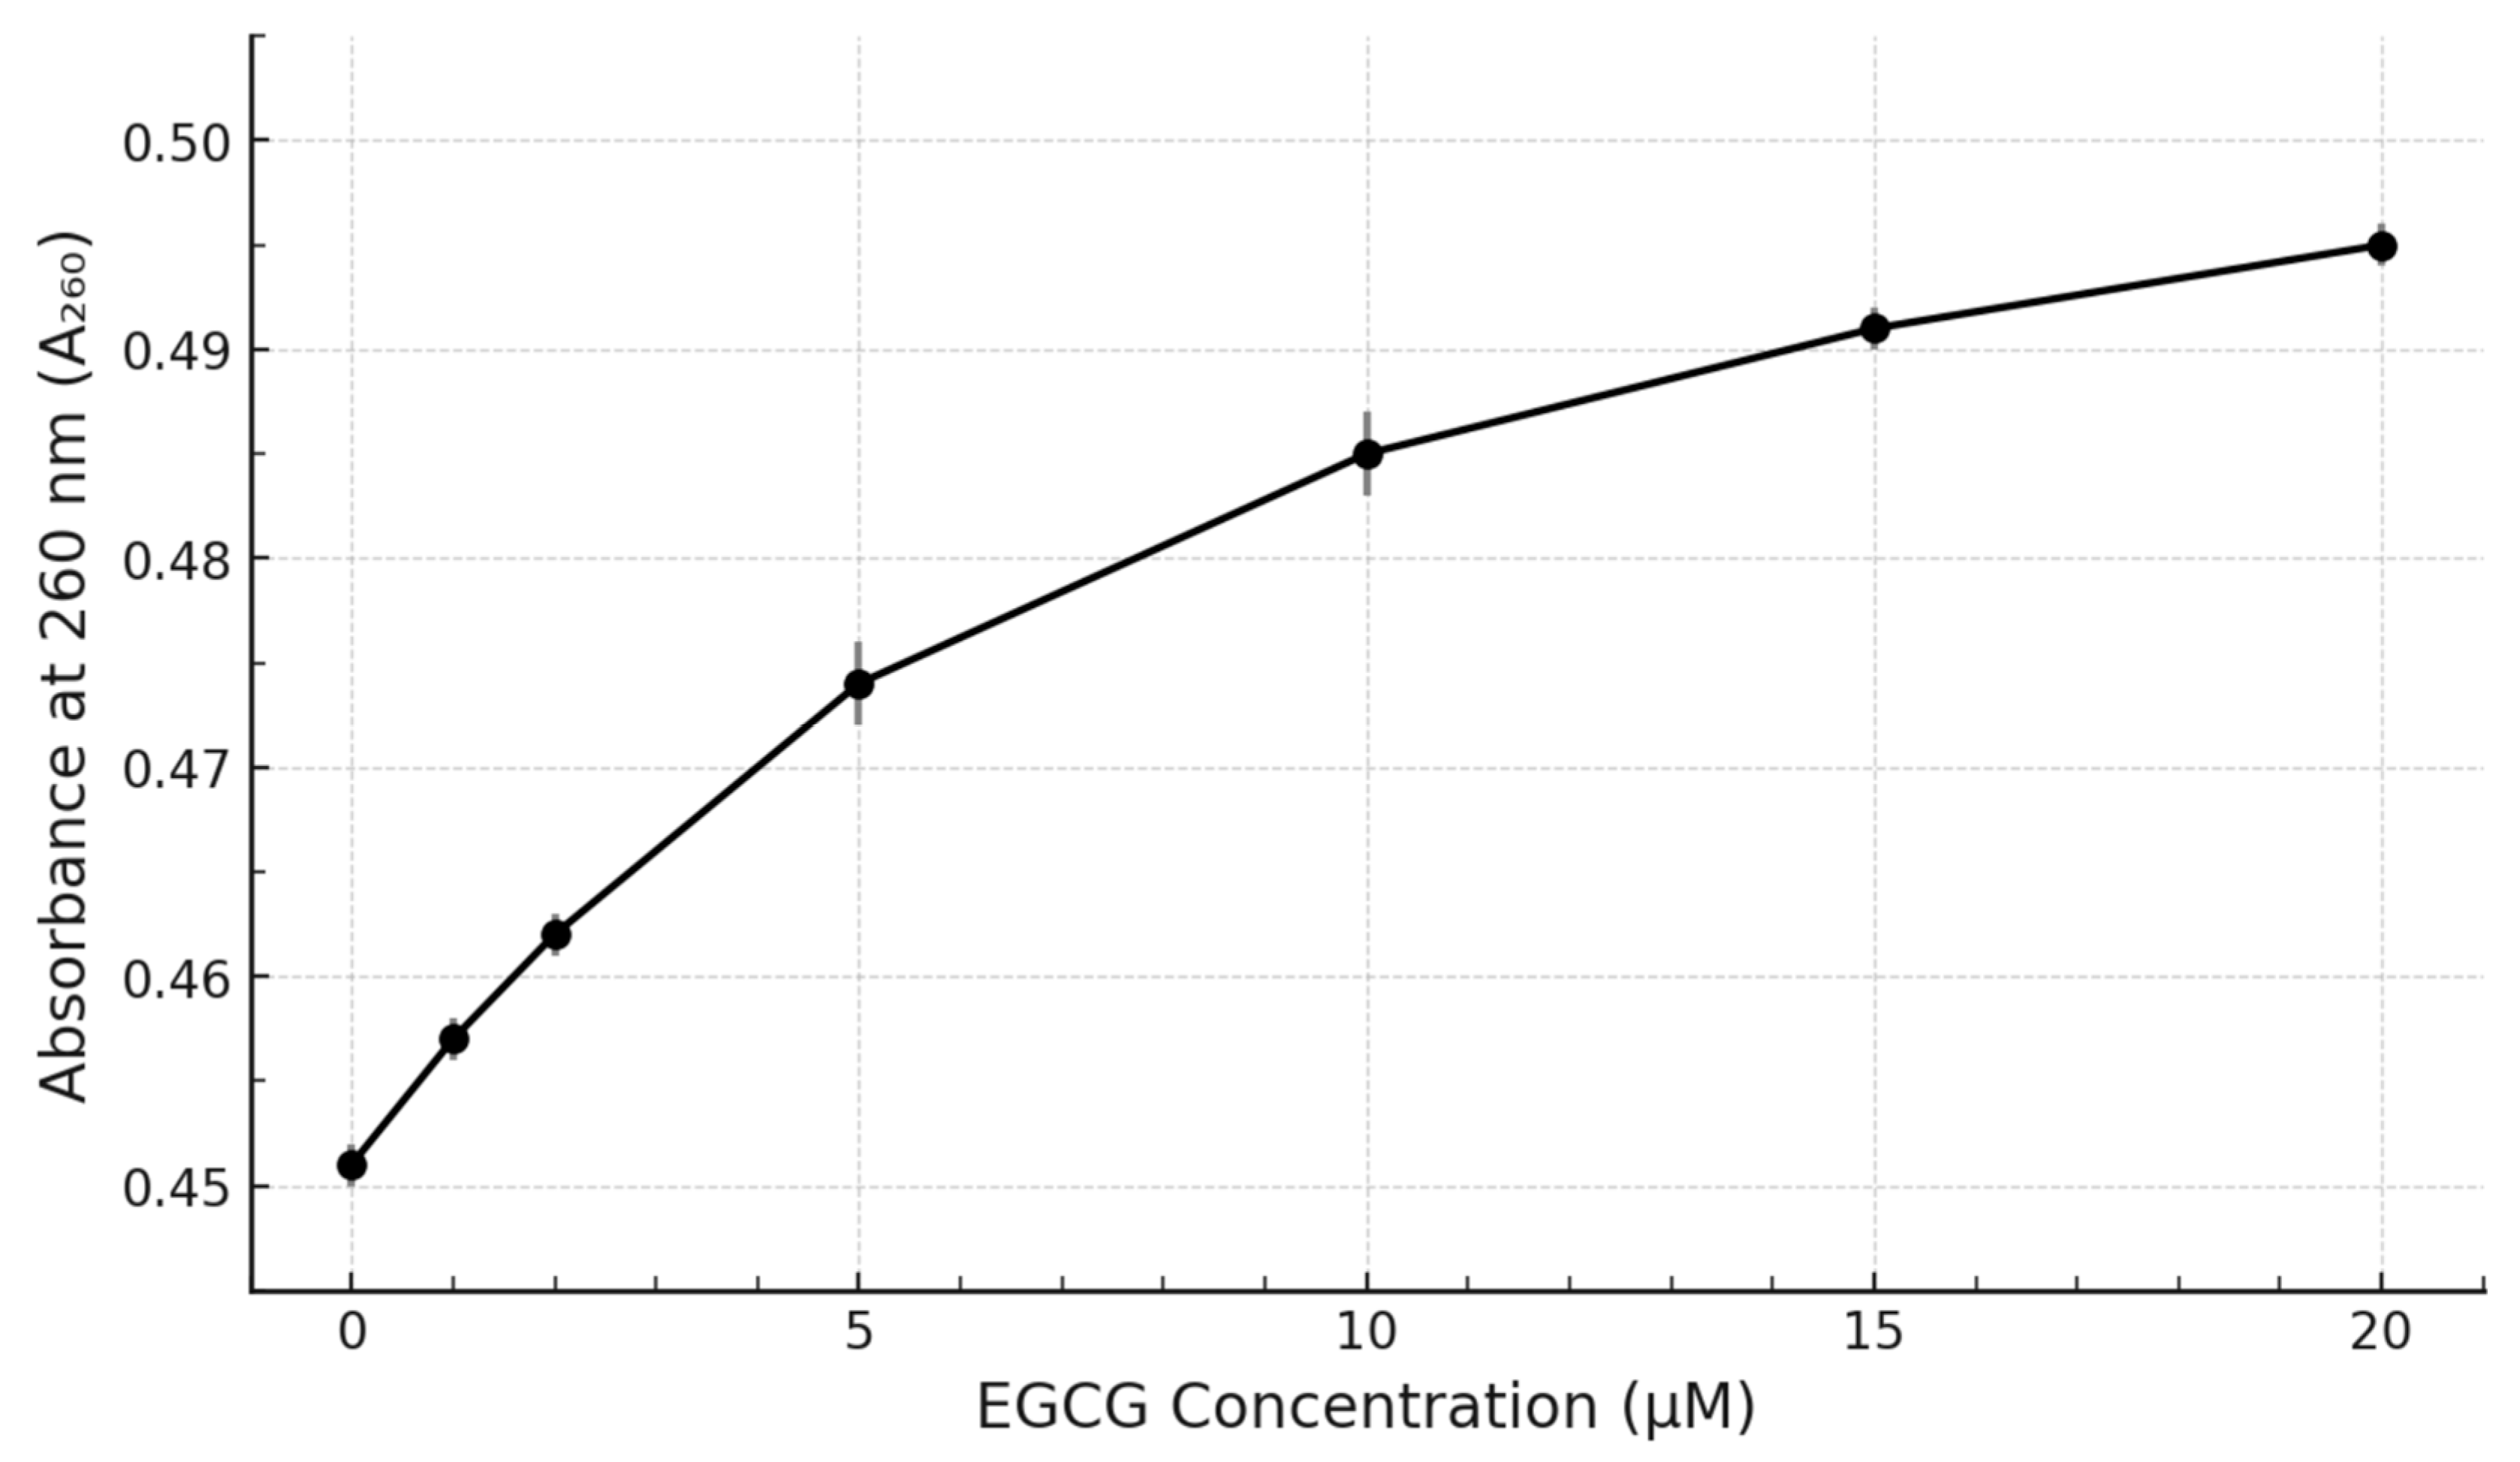

Table 1.
Absorbance Data from UV-Vis Titration of c-MYC G4 DNA (5 µM) with EGCG.
| [EGCG] (µM) | Replicate | A₂₆₀ (AU) | A₂₇₅ (AU) |
|---|---|---|---|
| 0 | 1 | 0.452 | 0.315 |
| 2 | 0.450 | 0.313 | |
| 3 | 0.451 | 0.314 | |
| 0 (Mean±SD) | 0.451±0.001 | 0.314±0.001 | |
| 1 | 1 | 0.458 | 0.330 |
| 2 | 0.456 | 0.327 | |
| 3 | 0.457 | 0.329 | |
| 1 (Mean±SD) | 0.457±0.001 | 0.329±0.002 | |
| 2 | 1 | 0.463 | 0.345 |
| 2 | 0.461 | 0.341 | |
| 3 | 0.462 | 0.344 | |
| 2 (Mean±SD) | 0.462±0.001 | 0.343±0.002 | |
| 5 | 1 | 0.475 | 0.382 |
| 2 | 0.472 | 0.378 | |
| 3 | 0.474 | 0.380 | |
| 5 (Mean±SD) | 0.474±0.002 | 0.380±0.002 | |
| 10 | 1 | 0.486 | 0.435 |
| 2 | 0.483 | 0.430 | |
| 3 | 0.485 | 0.433 | |
| 10 (Mean±SD) | 0.485±0.002 | 0.433±0.003 | |
| 15 | 1 | 0.492 | 0.478 |
| 2 | 0.490 | 0.474 | |
| 3 | 0.491 | 0.476 | |
| 15 (Mean±SD) | 0.491±0.001 | 0.476±0.002 | |
| 20 | 1 | 0.496 | 0.515 |
| 2 | 0.494 | 0.510 | |
| 3 | 0.495 | 0.513 | |
| 20 (Mean±SD) | 0.495±0.001 | 0.513±0.003 |
Note: Absorbance units (AU). Buffer: 10 mM Tris-HCl pH 7.4, 100 mM KCl, 1 mM EDTA. Temperature: 25°C. Path length: 1 cm. The increase in A₂₇₅ reflects both EGCG addition and interaction effects.
4. Discussion
The regulation of oncogene expression via stabilization of promoter G4 structures is an attractive strategy in anti-cancer research [9,10]. Natural products like the green tea polyphenol EGCG are known for their pleiotropic anti-cancer effects, but direct, simple biophysical characterization of their interaction with specific G4 targets is valuable. In this study, we employed UV-Vis absorbance spectroscopy, a fundamental technique, to investigate the interaction between EGCG and a G4-forming sequence from the c-MYC promoter (Pu27).
Our results demonstrate clear spectral perturbations upon titration of the pre-formed c-MYC G4 DNA with EGCG. The observed hyperchromicity at ~260 nm (Figure 1, Figure 2A) suggests changes in the electronic environment of the DNA bases upon EGCG binding. Hyperchromicity in DNA absorbance is often associated with ligand binding modes that perturb base stacking interactions, potentially including end-stacking on the G-quartets or groove binding that slightly alters the G4 conformation [16,17,18]. The titration curve at 260 nm shows a concentration-dependent increase that tends towards saturation (Figure 2A), consistent with a specific binding interaction rather than non-specific effects.
Concurrently, changes were observed around the EGCG absorbance maximum (~275 nm), including apparent hypochromicity (relative to the sum of spectra) and a slight red-shift (bathochromic shift). Such changes in a ligand's spectrum upon binding to a macromolecule are classic indicators of interaction [16]. Hypochromicity and red-shifts often arise from stacking interactions (e.g., π-π stacking between the polyphenol rings and DNA bases/G-quartets) or insertion into a more hydrophobic environment within a binding pocket, which alters the ligand's electronic transitions [19]. These observations are consistent with modes of interaction reported for other G4 ligands, such as end-stacking or groove binding [18,20].
These findings align with the initial hypothesis that EGCG interacts directly with the c-MYC G4 structure in vitro. The results are also broadly consistent with previous reports suggesting polyphenol interactions with nucleic acids, although direct comparisons require caution due to variations in sequences, conditions, and techniques used [14,15]. While some studies might report hypochromicity at 260 nm for certain intercalators, hyperchromicity observed here suggests a different or mixed binding mode, potentially involving the loops or external stacking on the quartets characteristic of many G4 binders [18].
The biological relevance stems from the target: the c-MYC oncogene promoter G4. Stabilization of this structure in vivo could potentially downregulate c-MYC transcription, offering a therapeutic benefit in c-MYC-driven cancers like glioblastoma [2,9]. Our in vitro binding data provide a basic biophysical rationale supporting the plausibility of EGCG acting, at least partially, through this mechanism.
However, this study has limitations. UV-Vis spectroscopy indicates binding but provides limited information on the specific binding mode, stoichiometry, or affinity. The observed saturation suggests a definable interaction, but calculation of a binding constant from this data alone would be approximate. Furthermore, the experiments were conducted in vitro using a short, synthetic DNA sequence in a simplified buffer. This does not directly replicate the complex cellular environment with chromatin structure, molecular crowding, and competing interactions. The purity of the EGCG used (≥95%) is standard but minor impurities could potentially contribute, although unlikely to cause the specific, saturating spectral changes observed. Most importantly, in vitro binding does not guarantee G4 stabilization in vivo or subsequent modulation of gene expression.
Future studies are warranted to elaborate on this interaction. Circular Dichroism (CD) spectroscopy could confirm the G4 conformation and monitor structural changes upon EGCG binding, potentially indicating stabilization. Fluorescence-based methods, such as assays using G4-specific dyes like Thioflavin T (ThT), could provide complementary evidence of binding and allow for more robust affinity determination [21]. Isothermal Titration Calorimetry (ITC) would yield thermodynamic parameters (ΔH, ΔS, Kd). Ultimately, cell-based assays, such as c-MYC reporter gene assays or Chromatin Immunoprecipitation (ChIP) in relevant cancer cell lines treated with EGCG, would be necessary to establish functional relevance and therapeutic potential.
5. Conclusion
Using basic UV-Vis absorbance spectroscopy, we have demonstrated direct evidence of an interaction between the green tea polyphenol EGCG and a synthetic G-quadruplex forming DNA sequence derived from the promoter of the c-MYC oncogene. The observed concentration-dependent hyperchromicity at the DNA absorbance maximum and concomitant changes in the EGCG absorbance spectrum are indicative of binding. These findings provide simple, foundational support for the hypothesis that EGCG can target this important oncogenic DNA structure in vitro. While further detailed biophysical and cellular studies are required to fully characterize the interaction and its biological consequences, this work highlights the potential utility of even simple spectroscopic methods in exploring interactions between natural products and relevant biological targets like G4 DNA.
Data Availability
Due to institutional data management requirements, these datasets are available from the corresponding author upon reasonable request.
Acknowledgements
The author wishes to express sincere gratitude to Dr. Raymond Yang for generously providing access to resources which made this study possible.
Author Contributions
J.T. is the sole author and was responsible for all aspects of this work, including conceptualization, methodology design, investigation (experimental execution), data acquisition and curation, formal analysis, validation, visualization, project administration, and writing the original draft, review, and editing of the manuscript.
Funding
This research received no specific grant from any funding agency in the public, commercial, or not-for-profit sectors.
Competing Interests
The author declares no competing interests.
References
- Lassman, A.B.; Dai, C.; Fuller, G.N.; Vickers, A.J.; Holland, E.C. Overexpression of c-MYC promotes an undifferentiated phenotype in cultured astrocytes and allows elevated Ras and Akt signaling to induce gliomas from GFAP-expressing cells in mice. Neuron Glia Biol. 2004, 1, 157–163. [Google Scholar] [CrossRef] [PubMed]
- Tang, J.; Karbhari, N.; Campian, J.L. Therapeutic Targets in Glioblastoma: Molecular Pathways, Emerging Strategies, and Future Directions. Cells 2025, 14, 494. [Google Scholar] [CrossRef] [PubMed]
- Kosiol, N., Juranek, S., Brossart, P. et al. G-quadruplexes: a promising target for cancer therapy. Mol Cancer 20, 40 (2021).
- Yang, D. G-Quadruplex DNA and RNA. Methods Mol. Biol. 2019, 2035, 1–24. [Google Scholar] [PubMed]
- González, V.; Hurley, L.H. The c-MYC NHE III1: Function and Regulation. Annu. Rev. Pharmacol. Toxicol. 2010, 50, 111–129. [Google Scholar] [CrossRef] [PubMed]
- Huppert, J.L.; Balasubramanian, S. Prevalence of Quadruplexes in the Human Genome. Nucleic Acids Res. 2005, 33, 2908–2916. [Google Scholar] [CrossRef] [PubMed]
- Siddiqui-Jain, A.; Grand, C.L.; Bearss, D.J.; Hurley, L.H. Direct Evidence for a G-Quadruplex in a Promoter Region and Its Targeting with a Small Molecule to Repress c-MYC Transcription. Proc. Natl. Acad. Sci. USA 2002, 99, 11593–11598. [Google Scholar] [CrossRef] [PubMed]
- Xu, Y.; Komiyama, M. G-Quadruplexes in Human Telomere: Structures, Properties, and Applications. Molecules 2024, 29, 174. [Google Scholar] [CrossRef]
- Hurley, L.H. DNA and Its Associated Processes as Targets for Cancer Therapy. Nat. Rev. Cancer 2002, 2, 188–200. [Google Scholar] [CrossRef]
- Balasubramanian, S.; Hurley, L.H.; Neidle, S. Targeting G-Quadruplexes in Gene Promoters: A Novel Anticancer Strategy? Nat. Rev. Drug Discov. 2011, 10, 261–275. [Google Scholar] [CrossRef] [PubMed]
- Scalbert, A.; Williamson, G. Dietary Polyphenols and the Prevention of Diseases. Crit. Rev. Food Sci. Nutr. 2000, 40. [Google Scholar] [CrossRef] [PubMed]
- Yang, C.S.; Wang, X.; Lu, G.; Picinich, S.C. Cancer Prevention by Tea: Animal Studies, Molecular Mechanisms and Human Relevance. Nat. Rev. Cancer 2009, 9, 429–439. [Google Scholar] [CrossRef] [PubMed]
- De Rossi, L.; Rocchetti, G.; Lucini, L.; Rebecchi, A. Antimicrobial Potential of Polyphenols: Mechanisms of Action and Microbial Responses—A Narrative Review. Antioxidants 2025, 14, 200. [Google Scholar] [CrossRef]
- Brázda, V.; Hároníková, L.; Liao, J.C.C.; Fojta, M. DNA and RNA Quadruplex-Binding Proteins. Int. J. Mol. Sci. 2014, 15, 17493–17517. [Google Scholar] [CrossRef]
- Amrane, S.; Jaubert, C.; Bedrat, A.; Rundstadler, T.; Recordon-Pinson, P.; Aknin, C.; Guédin, A.; De Rache, A.; Bartolucci, L.; Diene, I.; Lemoine, F.; Gascuel, O.; Pratviel, G.; Mergny, J.-L.; Andreola, M.-L. Deciphering RNA G-Quadruplex Function during the Early Steps of HIV-1 Infection. Nucleic Acids Res. 2022, 50, 12328–12343. [Google Scholar] [CrossRef] [PubMed]
- Skoog, D.A.; Holler, F.J.; Crouch, S.R. Principles of Instrumental Analysis; Cengage Learning: Boston, MA, USA, 2017. [Google Scholar]
- Głuszyńska, A.; Juskowiak, B.; Kuta-Siejkowska, M.; Hoffmann, M.; Haider, S. Carbazole Derivatives’ Binding to c-KIT G-Quadruplex DNA. Molecules 2018, 23, 1134. [Google Scholar] [CrossRef] [PubMed]
- Almaqwashi, A.A.; Paramanathan, T.; Rouzina, I.; Williams, M.C. Mechanisms of Small Molecule-DNA Interactions Probed by Single-Molecule Force Spectroscopy. Nucleic Acids Res. 2016, 44, 3971–3988. [Google Scholar] [CrossRef] [PubMed]
- Han, H.; Hurley, L.H. G-quadruplex DNA: A Potential Target for Anti-Cancer Drug Design. Trends Pharmacol. Sci. 2000, 21, 136–142. [Google Scholar] [CrossRef] [PubMed]
- Dickerhoff, J.; Dai, J.; Yang, D. Structural recognition of the MYC promoter G-quadruplex by a quinoline derivative: insights into molecular targeting of parallel G-quadruplexes. Nucleic Acids Res. 2021, 49, 5905–5915. [Google Scholar] [CrossRef] [PubMed]
- Martin, S.R.; Schilstra, M.J. Circular dichroism and its application to the study of biomolecules. Methods Cell Biol. 2008, 84, 263–293. [Google Scholar]
Disclaimer/Publisher’s Note: The statements, opinions and data contained in all publications are solely those of the individual author(s) and contributor(s) and not of MDPI and/or the editor(s). MDPI and/or the editor(s) disclaim responsibility for any injury to people or property resulting from any ideas, methods, instructions or products referred to in the content. |
© 2025 by the authors. Licensee MDPI, Basel, Switzerland. This article is an open access article distributed under the terms and conditions of the Creative Commons Attribution (CC BY) license (http://creativecommons.org/licenses/by/4.0/).
Copyright: This open access article is published under a Creative Commons CC BY 4.0 license, which permit the free download, distribution, and reuse, provided that the author and preprint are cited in any reuse.


